00010043152022FYFalse12.4312900010043152021-04-012022-03-310001004315dei:BusinessContactMember2021-04-012022-03-310001004315ifrs-full:OrdinarySharesMember2021-04-012022-03-310001004315nggtf:AmericanDepositarySharesMember2021-04-012022-03-310001004315nggtf:A390SeriesPreferredStockMember2021-04-012022-03-310001004315nggtf:A360SeriesPreferredStockMember2021-04-012022-03-3100010043152022-03-31xbrli:sharesiso4217:GBPiso4217:GBPxbrli:shares00010043152020-04-012021-03-3100010043152019-04-012020-03-310001004315ifrs-full:DiscontinuedOperationsMember2021-04-012022-03-310001004315ifrs-full:DiscontinuedOperationsMember2020-04-012021-03-310001004315ifrs-full:DiscontinuedOperationsMember2019-04-012020-03-310001004315ifrs-full:AggregateContinuingAndDiscontinuedOperationsMember2021-04-012022-03-310001004315ifrs-full:AggregateContinuingAndDiscontinuedOperationsMember2020-04-012021-03-310001004315ifrs-full:AggregateContinuingAndDiscontinuedOperationsMember2019-04-012020-03-310001004315ifrs-full:IssuedCapitalMember2019-03-310001004315ifrs-full:SharePremiumMember2019-03-310001004315ifrs-full:RetainedEarningsMember2019-03-310001004315nggtf:OtherEquityReservesMember2019-03-310001004315ifrs-full:EquityAttributableToOwnersOfParentMember2019-03-310001004315ifrs-full:NoncontrollingInterestsMember2019-03-3100010043152019-03-310001004315ifrs-full:RetainedEarningsMember2019-04-012020-03-310001004315ifrs-full:EquityAttributableToOwnersOfParentMember2019-04-012020-03-310001004315ifrs-full:NoncontrollingInterestsMember2019-04-012020-03-310001004315nggtf:OtherEquityReservesMember2019-04-012020-03-310001004315ifrs-full:AggregateContinuingAndDiscontinuedOperationsMemberifrs-full:RetainedEarningsMember2019-04-012020-03-310001004315ifrs-full:AggregateContinuingAndDiscontinuedOperationsMembernggtf:OtherEquityReservesMember2019-04-012020-03-310001004315ifrs-full:AggregateContinuingAndDiscontinuedOperationsMemberifrs-full:EquityAttributableToOwnersOfParentMember2019-04-012020-03-310001004315ifrs-full:AggregateContinuingAndDiscontinuedOperationsMemberifrs-full:NoncontrollingInterestsMember2019-04-012020-03-310001004315ifrs-full:IssuedCapitalMember2019-04-012020-03-310001004315ifrs-full:SharePremiumMember2019-04-012020-03-310001004315ifrs-full:IssuedCapitalMember2020-03-310001004315ifrs-full:SharePremiumMember2020-03-310001004315ifrs-full:RetainedEarningsMember2020-03-310001004315nggtf:OtherEquityReservesMember2020-03-310001004315ifrs-full:EquityAttributableToOwnersOfParentMember2020-03-310001004315ifrs-full:NoncontrollingInterestsMember2020-03-3100010043152020-03-310001004315ifrs-full:RetainedEarningsMember2020-04-012021-03-310001004315ifrs-full:EquityAttributableToOwnersOfParentMember2020-04-012021-03-310001004315ifrs-full:NoncontrollingInterestsMember2020-04-012021-03-310001004315nggtf:OtherEquityReservesMember2020-04-012021-03-310001004315ifrs-full:AggregateContinuingAndDiscontinuedOperationsMemberifrs-full:RetainedEarningsMember2020-04-012021-03-310001004315ifrs-full:AggregateContinuingAndDiscontinuedOperationsMembernggtf:OtherEquityReservesMember2020-04-012021-03-310001004315ifrs-full:AggregateContinuingAndDiscontinuedOperationsMemberifrs-full:EquityAttributableToOwnersOfParentMember2020-04-012021-03-310001004315ifrs-full:AggregateContinuingAndDiscontinuedOperationsMemberifrs-full:NoncontrollingInterestsMember2020-04-012021-03-310001004315ifrs-full:IssuedCapitalMember2020-04-012021-03-310001004315ifrs-full:SharePremiumMember2020-04-012021-03-310001004315ifrs-full:IssuedCapitalMember2021-03-310001004315ifrs-full:SharePremiumMember2021-03-310001004315ifrs-full:RetainedEarningsMember2021-03-310001004315nggtf:OtherEquityReservesMember2021-03-310001004315ifrs-full:EquityAttributableToOwnersOfParentMember2021-03-310001004315ifrs-full:NoncontrollingInterestsMember2021-03-3100010043152021-03-310001004315ifrs-full:RetainedEarningsMember2021-04-012022-03-310001004315ifrs-full:EquityAttributableToOwnersOfParentMember2021-04-012022-03-310001004315ifrs-full:NoncontrollingInterestsMember2021-04-012022-03-310001004315nggtf:OtherEquityReservesMember2021-04-012022-03-310001004315ifrs-full:AggregateContinuingAndDiscontinuedOperationsMemberifrs-full:RetainedEarningsMember2021-04-012022-03-310001004315ifrs-full:AggregateContinuingAndDiscontinuedOperationsMembernggtf:OtherEquityReservesMember2021-04-012022-03-310001004315ifrs-full:AggregateContinuingAndDiscontinuedOperationsMemberifrs-full:EquityAttributableToOwnersOfParentMember2021-04-012022-03-310001004315ifrs-full:AggregateContinuingAndDiscontinuedOperationsMemberifrs-full:NoncontrollingInterestsMember2021-04-012022-03-310001004315ifrs-full:IssuedCapitalMember2021-04-012022-03-310001004315ifrs-full:SharePremiumMember2021-04-012022-03-310001004315ifrs-full:IssuedCapitalMember2022-03-310001004315ifrs-full:SharePremiumMember2022-03-310001004315ifrs-full:RetainedEarningsMember2022-03-310001004315nggtf:OtherEquityReservesMember2022-03-310001004315ifrs-full:EquityAttributableToOwnersOfParentMember2022-03-310001004315ifrs-full:NoncontrollingInterestsMember2022-03-310001004315nggtf:NationalGridRenewablesAndEmeraldEnergyVentureLLCSectionPageBreakMember2021-04-012022-03-310001004315nggtf:NationalGridRenewablesAndEmeraldEnergyVentureLLCSectionPageBreakMember2020-04-012021-03-310001004315nggtf:NationalGridRenewablesAndEmeraldEnergyVentureLLCSectionPageBreakMember2019-04-012020-03-310001004315nggtf:WesternPowerDistributionPLCMember2021-04-012022-03-310001004315nggtf:WesternPowerDistributionPLCMember2020-04-012021-03-310001004315nggtf:WesternPowerDistributionPLCMember2019-04-012020-03-310001004315nggtf:FixedInterestRateBondsMember2022-03-310001004315nggtf:NarragansettElectricCompanyMember2021-03-172021-03-17xbrli:pure0001004315srt:ScenarioForecastMembernggtf:UKGasTransmissionMember2022-03-272022-03-270001004315srt:ScenarioForecastMembernggtf:UKGasTransmissionMember2022-03-270001004315nggtf:UKGasTransmissionMember2022-03-27nggtf:directornggtf:site0001004315ifrs-full:FinancialEffectOfCorrectionsOfAccountingErrorsMember2022-03-31nggtf:business_unitnggtf:segment0001004315ifrs-full:OperatingSegmentsMembernggtf:UKElectricityTransmissionMembernggtf:BeforeExceptionalItemsAndRemeasurementsMember2021-04-012022-03-310001004315nggtf:UKElectricityTransmissionMemberifrs-full:EliminationOfIntersegmentAmountsMembernggtf:BeforeExceptionalItemsAndRemeasurementsMember2021-04-012022-03-310001004315nggtf:UKElectricityTransmissionMembernggtf:BeforeExceptionalItemsAndRemeasurementsMember2021-04-012022-03-310001004315ifrs-full:OperatingSegmentsMembernggtf:UKElectricityTransmissionMembernggtf:BeforeExceptionalItemsAndRemeasurementsMember2020-04-012021-03-310001004315nggtf:UKElectricityTransmissionMemberifrs-full:EliminationOfIntersegmentAmountsMembernggtf:BeforeExceptionalItemsAndRemeasurementsMember2020-04-012021-03-310001004315nggtf:UKElectricityTransmissionMembernggtf:BeforeExceptionalItemsAndRemeasurementsMember2020-04-012021-03-310001004315ifrs-full:OperatingSegmentsMembernggtf:UKElectricityTransmissionMembernggtf:BeforeExceptionalItemsAndRemeasurementsMember2019-04-012020-03-310001004315nggtf:UKElectricityTransmissionMemberifrs-full:EliminationOfIntersegmentAmountsMembernggtf:BeforeExceptionalItemsAndRemeasurementsMember2019-04-012020-03-310001004315nggtf:UKElectricityTransmissionMembernggtf:BeforeExceptionalItemsAndRemeasurementsMember2019-04-012020-03-310001004315ifrs-full:OperatingSegmentsMembernggtf:UKElectricityDistributionMembernggtf:BeforeExceptionalItemsAndRemeasurementsMember2021-04-012022-03-310001004315nggtf:UKElectricityDistributionMemberifrs-full:EliminationOfIntersegmentAmountsMembernggtf:BeforeExceptionalItemsAndRemeasurementsMember2021-04-012022-03-310001004315nggtf:UKElectricityDistributionMembernggtf:BeforeExceptionalItemsAndRemeasurementsMember2021-04-012022-03-310001004315ifrs-full:OperatingSegmentsMembernggtf:UKElectricityDistributionMembernggtf:BeforeExceptionalItemsAndRemeasurementsMember2020-04-012021-03-310001004315nggtf:UKElectricityDistributionMemberifrs-full:EliminationOfIntersegmentAmountsMembernggtf:BeforeExceptionalItemsAndRemeasurementsMember2020-04-012021-03-310001004315nggtf:UKElectricityDistributionMembernggtf:BeforeExceptionalItemsAndRemeasurementsMember2020-04-012021-03-310001004315ifrs-full:OperatingSegmentsMembernggtf:UKElectricityDistributionMembernggtf:BeforeExceptionalItemsAndRemeasurementsMember2019-04-012020-03-310001004315nggtf:UKElectricityDistributionMemberifrs-full:EliminationOfIntersegmentAmountsMembernggtf:BeforeExceptionalItemsAndRemeasurementsMember2019-04-012020-03-310001004315nggtf:UKElectricityDistributionMembernggtf:BeforeExceptionalItemsAndRemeasurementsMember2019-04-012020-03-310001004315ifrs-full:OperatingSegmentsMembernggtf:BeforeExceptionalItemsAndRemeasurementsMembernggtf:UKElectricitySystemOperatorMember2021-04-012022-03-310001004315ifrs-full:EliminationOfIntersegmentAmountsMembernggtf:BeforeExceptionalItemsAndRemeasurementsMembernggtf:UKElectricitySystemOperatorMember2021-04-012022-03-310001004315nggtf:UKElectricitySystemOperatorMembernggtf:BeforeExceptionalItemsAndRemeasurementsMember2021-04-012022-03-310001004315ifrs-full:OperatingSegmentsMembernggtf:BeforeExceptionalItemsAndRemeasurementsMembernggtf:UKElectricitySystemOperatorMember2020-04-012021-03-310001004315ifrs-full:EliminationOfIntersegmentAmountsMembernggtf:BeforeExceptionalItemsAndRemeasurementsMembernggtf:UKElectricitySystemOperatorMember2020-04-012021-03-310001004315nggtf:UKElectricitySystemOperatorMembernggtf:BeforeExceptionalItemsAndRemeasurementsMember2020-04-012021-03-310001004315ifrs-full:OperatingSegmentsMembernggtf:BeforeExceptionalItemsAndRemeasurementsMembernggtf:UKElectricitySystemOperatorMember2019-04-012020-03-310001004315ifrs-full:EliminationOfIntersegmentAmountsMembernggtf:BeforeExceptionalItemsAndRemeasurementsMembernggtf:UKElectricitySystemOperatorMember2019-04-012020-03-310001004315nggtf:UKElectricitySystemOperatorMembernggtf:BeforeExceptionalItemsAndRemeasurementsMember2019-04-012020-03-310001004315ifrs-full:OperatingSegmentsMembernggtf:NewEnglandMembernggtf:BeforeExceptionalItemsAndRemeasurementsMember2021-04-012022-03-310001004315nggtf:NewEnglandMemberifrs-full:EliminationOfIntersegmentAmountsMembernggtf:BeforeExceptionalItemsAndRemeasurementsMember2021-04-012022-03-310001004315nggtf:NewEnglandMembernggtf:BeforeExceptionalItemsAndRemeasurementsMember2021-04-012022-03-310001004315ifrs-full:OperatingSegmentsMembernggtf:NewEnglandMembernggtf:BeforeExceptionalItemsAndRemeasurementsMember2020-04-012021-03-310001004315nggtf:NewEnglandMemberifrs-full:EliminationOfIntersegmentAmountsMembernggtf:BeforeExceptionalItemsAndRemeasurementsMember2020-04-012021-03-310001004315nggtf:NewEnglandMembernggtf:BeforeExceptionalItemsAndRemeasurementsMember2020-04-012021-03-310001004315ifrs-full:OperatingSegmentsMembernggtf:NewEnglandMembernggtf:BeforeExceptionalItemsAndRemeasurementsMember2019-04-012020-03-310001004315nggtf:NewEnglandMemberifrs-full:EliminationOfIntersegmentAmountsMembernggtf:BeforeExceptionalItemsAndRemeasurementsMember2019-04-012020-03-310001004315nggtf:NewEnglandMembernggtf:BeforeExceptionalItemsAndRemeasurementsMember2019-04-012020-03-310001004315ifrs-full:OperatingSegmentsMembernggtf:NewYorkSegmentMembernggtf:BeforeExceptionalItemsAndRemeasurementsMember2021-04-012022-03-310001004315nggtf:NewYorkSegmentMemberifrs-full:EliminationOfIntersegmentAmountsMembernggtf:BeforeExceptionalItemsAndRemeasurementsMember2021-04-012022-03-310001004315nggtf:NewYorkSegmentMembernggtf:BeforeExceptionalItemsAndRemeasurementsMember2021-04-012022-03-310001004315ifrs-full:OperatingSegmentsMembernggtf:NewYorkSegmentMembernggtf:BeforeExceptionalItemsAndRemeasurementsMember2020-04-012021-03-310001004315nggtf:NewYorkSegmentMemberifrs-full:EliminationOfIntersegmentAmountsMembernggtf:BeforeExceptionalItemsAndRemeasurementsMember2020-04-012021-03-310001004315nggtf:NewYorkSegmentMembernggtf:BeforeExceptionalItemsAndRemeasurementsMember2020-04-012021-03-310001004315ifrs-full:OperatingSegmentsMembernggtf:NewYorkSegmentMembernggtf:BeforeExceptionalItemsAndRemeasurementsMember2019-04-012020-03-310001004315nggtf:NewYorkSegmentMemberifrs-full:EliminationOfIntersegmentAmountsMembernggtf:BeforeExceptionalItemsAndRemeasurementsMember2019-04-012020-03-310001004315nggtf:NewYorkSegmentMembernggtf:BeforeExceptionalItemsAndRemeasurementsMember2019-04-012020-03-310001004315ifrs-full:OperatingSegmentsMembernggtf:NGVenturesAndOtherMembernggtf:BeforeExceptionalItemsAndRemeasurementsMember2021-04-012022-03-310001004315nggtf:NGVenturesAndOtherMemberifrs-full:EliminationOfIntersegmentAmountsMembernggtf:BeforeExceptionalItemsAndRemeasurementsMember2021-04-012022-03-310001004315nggtf:NGVenturesAndOtherMembernggtf:BeforeExceptionalItemsAndRemeasurementsMember2021-04-012022-03-310001004315ifrs-full:OperatingSegmentsMembernggtf:NGVenturesAndOtherMembernggtf:BeforeExceptionalItemsAndRemeasurementsMember2020-04-012021-03-310001004315nggtf:NGVenturesAndOtherMemberifrs-full:EliminationOfIntersegmentAmountsMembernggtf:BeforeExceptionalItemsAndRemeasurementsMember2020-04-012021-03-310001004315nggtf:NGVenturesAndOtherMembernggtf:BeforeExceptionalItemsAndRemeasurementsMember2020-04-012021-03-310001004315ifrs-full:OperatingSegmentsMembernggtf:NGVenturesAndOtherMembernggtf:BeforeExceptionalItemsAndRemeasurementsMember2019-04-012020-03-310001004315nggtf:NGVenturesAndOtherMemberifrs-full:EliminationOfIntersegmentAmountsMembernggtf:BeforeExceptionalItemsAndRemeasurementsMember2019-04-012020-03-310001004315nggtf:NGVenturesAndOtherMembernggtf:BeforeExceptionalItemsAndRemeasurementsMember2019-04-012020-03-310001004315ifrs-full:OperatingSegmentsMembernggtf:BeforeExceptionalItemsAndRemeasurementsMember2021-04-012022-03-310001004315ifrs-full:EliminationOfIntersegmentAmountsMembernggtf:BeforeExceptionalItemsAndRemeasurementsMember2021-04-012022-03-310001004315ifrs-full:OperatingSegmentsMembernggtf:BeforeExceptionalItemsAndRemeasurementsMember2020-04-012021-03-310001004315ifrs-full:EliminationOfIntersegmentAmountsMembernggtf:BeforeExceptionalItemsAndRemeasurementsMember2020-04-012021-03-310001004315nggtf:BeforeExceptionalItemsAndRemeasurementsMember2020-04-012021-03-310001004315ifrs-full:OperatingSegmentsMembernggtf:BeforeExceptionalItemsAndRemeasurementsMember2019-04-012020-03-310001004315ifrs-full:EliminationOfIntersegmentAmountsMembernggtf:BeforeExceptionalItemsAndRemeasurementsMember2019-04-012020-03-310001004315nggtf:BeforeExceptionalItemsAndRemeasurementsMember2019-04-012020-03-310001004315ifrs-full:CountryOfDomicileMember2021-04-012022-03-310001004315ifrs-full:CountryOfDomicileMember2020-04-012021-03-310001004315ifrs-full:CountryOfDomicileMember2019-04-012020-03-310001004315country:US2021-04-012022-03-310001004315country:US2020-04-012021-03-310001004315country:US2019-04-012020-03-310001004315nggtf:ExceptionalItemsMembernggtf:StWilliamHomesLLPMember2021-04-012022-03-310001004315ifrs-full:OperatingSegmentsMembernggtf:ExceptionalItemsAndRemeasurementsMembernggtf:UKElectricityTransmissionMember2021-04-012022-03-310001004315ifrs-full:OperatingSegmentsMembernggtf:ExceptionalItemsAndRemeasurementsMembernggtf:UKElectricityTransmissionMember2020-04-012021-03-310001004315ifrs-full:OperatingSegmentsMembernggtf:ExceptionalItemsAndRemeasurementsMembernggtf:UKElectricityTransmissionMember2019-04-012020-03-310001004315ifrs-full:OperatingSegmentsMembernggtf:UKElectricityTransmissionMember2021-04-012022-03-310001004315ifrs-full:OperatingSegmentsMembernggtf:UKElectricityTransmissionMember2020-04-012021-03-310001004315ifrs-full:OperatingSegmentsMembernggtf:UKElectricityTransmissionMember2019-04-012020-03-310001004315ifrs-full:OperatingSegmentsMembernggtf:UKElectricityDistributionMembernggtf:ExceptionalItemsAndRemeasurementsMember2021-04-012022-03-310001004315ifrs-full:OperatingSegmentsMembernggtf:UKElectricityDistributionMembernggtf:ExceptionalItemsAndRemeasurementsMember2020-04-012021-03-310001004315ifrs-full:OperatingSegmentsMembernggtf:UKElectricityDistributionMembernggtf:ExceptionalItemsAndRemeasurementsMember2019-04-012020-03-310001004315ifrs-full:OperatingSegmentsMembernggtf:UKElectricityDistributionMember2021-04-012022-03-310001004315ifrs-full:OperatingSegmentsMembernggtf:UKElectricityDistributionMember2020-04-012021-03-310001004315ifrs-full:OperatingSegmentsMembernggtf:UKElectricityDistributionMember2019-04-012020-03-310001004315ifrs-full:OperatingSegmentsMembernggtf:ExceptionalItemsAndRemeasurementsMembernggtf:UKElectricitySystemOperatorMember2021-04-012022-03-310001004315ifrs-full:OperatingSegmentsMembernggtf:ExceptionalItemsAndRemeasurementsMembernggtf:UKElectricitySystemOperatorMember2020-04-012021-03-310001004315ifrs-full:OperatingSegmentsMembernggtf:ExceptionalItemsAndRemeasurementsMembernggtf:UKElectricitySystemOperatorMember2019-04-012020-03-310001004315ifrs-full:OperatingSegmentsMembernggtf:UKElectricitySystemOperatorMember2021-04-012022-03-310001004315ifrs-full:OperatingSegmentsMembernggtf:UKElectricitySystemOperatorMember2020-04-012021-03-310001004315ifrs-full:OperatingSegmentsMembernggtf:UKElectricitySystemOperatorMember2019-04-012020-03-310001004315ifrs-full:OperatingSegmentsMembernggtf:NewEnglandMembernggtf:ExceptionalItemsAndRemeasurementsMember2021-04-012022-03-310001004315ifrs-full:OperatingSegmentsMembernggtf:NewEnglandMembernggtf:ExceptionalItemsAndRemeasurementsMember2020-04-012021-03-310001004315ifrs-full:OperatingSegmentsMembernggtf:NewEnglandMembernggtf:ExceptionalItemsAndRemeasurementsMember2019-04-012020-03-310001004315ifrs-full:OperatingSegmentsMembernggtf:NewEnglandMember2021-04-012022-03-310001004315ifrs-full:OperatingSegmentsMembernggtf:NewEnglandMember2020-04-012021-03-310001004315ifrs-full:OperatingSegmentsMembernggtf:NewEnglandMember2019-04-012020-03-310001004315ifrs-full:OperatingSegmentsMembernggtf:ExceptionalItemsAndRemeasurementsMembernggtf:NewYorkSegmentMember2021-04-012022-03-310001004315ifrs-full:OperatingSegmentsMembernggtf:ExceptionalItemsAndRemeasurementsMembernggtf:NewYorkSegmentMember2020-04-012021-03-310001004315ifrs-full:OperatingSegmentsMembernggtf:ExceptionalItemsAndRemeasurementsMembernggtf:NewYorkSegmentMember2019-04-012020-03-310001004315ifrs-full:OperatingSegmentsMembernggtf:NewYorkSegmentMember2021-04-012022-03-310001004315ifrs-full:OperatingSegmentsMembernggtf:NewYorkSegmentMember2020-04-012021-03-310001004315ifrs-full:OperatingSegmentsMembernggtf:NewYorkSegmentMember2019-04-012020-03-310001004315ifrs-full:OperatingSegmentsMembernggtf:NGVenturesAndOtherMembernggtf:ExceptionalItemsAndRemeasurementsMember2021-04-012022-03-310001004315ifrs-full:OperatingSegmentsMembernggtf:NGVenturesAndOtherMembernggtf:ExceptionalItemsAndRemeasurementsMember2020-04-012021-03-310001004315ifrs-full:OperatingSegmentsMembernggtf:NGVenturesAndOtherMembernggtf:ExceptionalItemsAndRemeasurementsMember2019-04-012020-03-310001004315ifrs-full:OperatingSegmentsMembernggtf:NGVenturesAndOtherMember2021-04-012022-03-310001004315ifrs-full:OperatingSegmentsMembernggtf:NGVenturesAndOtherMember2020-04-012021-03-310001004315ifrs-full:OperatingSegmentsMembernggtf:NGVenturesAndOtherMember2019-04-012020-03-310001004315nggtf:BeforeExceptionalItemsAndRemeasurementsMember2021-04-012022-03-310001004315nggtf:ExceptionalItemsAndRemeasurementsMember2021-04-012022-03-310001004315nggtf:ExceptionalItemsAndRemeasurementsMember2020-04-012021-03-310001004315nggtf:ExceptionalItemsAndRemeasurementsMember2019-04-012020-03-310001004315ifrs-full:CountryOfDomicileMembernggtf:BeforeExceptionalItemsAndRemeasurementsMember2021-04-012022-03-310001004315ifrs-full:CountryOfDomicileMembernggtf:BeforeExceptionalItemsAndRemeasurementsMember2020-04-012021-03-310001004315ifrs-full:CountryOfDomicileMembernggtf:BeforeExceptionalItemsAndRemeasurementsMember2019-04-012020-03-310001004315ifrs-full:CountryOfDomicileMembernggtf:ExceptionalItemsAndRemeasurementsMember2021-04-012022-03-310001004315ifrs-full:CountryOfDomicileMembernggtf:ExceptionalItemsAndRemeasurementsMember2020-04-012021-03-310001004315ifrs-full:CountryOfDomicileMembernggtf:ExceptionalItemsAndRemeasurementsMember2019-04-012020-03-310001004315country:USnggtf:BeforeExceptionalItemsAndRemeasurementsMember2021-04-012022-03-310001004315country:USnggtf:BeforeExceptionalItemsAndRemeasurementsMember2020-04-012021-03-310001004315country:USnggtf:BeforeExceptionalItemsAndRemeasurementsMember2019-04-012020-03-310001004315country:USnggtf:ExceptionalItemsAndRemeasurementsMember2021-04-012022-03-310001004315country:USnggtf:ExceptionalItemsAndRemeasurementsMember2020-04-012021-03-310001004315country:USnggtf:ExceptionalItemsAndRemeasurementsMember2019-04-012020-03-310001004315ifrs-full:OperatingSegmentsMembernggtf:UKElectricityTransmissionMember2022-03-310001004315ifrs-full:OperatingSegmentsMembernggtf:UKElectricityTransmissionMember2021-03-310001004315ifrs-full:OperatingSegmentsMembernggtf:UKElectricityTransmissionMember2020-03-310001004315ifrs-full:OperatingSegmentsMembernggtf:UKElectricityDistributionMember2022-03-310001004315ifrs-full:OperatingSegmentsMembernggtf:UKElectricityDistributionMember2021-03-310001004315ifrs-full:OperatingSegmentsMembernggtf:UKElectricityDistributionMember2020-03-310001004315ifrs-full:OperatingSegmentsMembernggtf:UKElectricitySystemOperatorMember2022-03-310001004315ifrs-full:OperatingSegmentsMembernggtf:UKElectricitySystemOperatorMember2021-03-310001004315ifrs-full:OperatingSegmentsMembernggtf:UKElectricitySystemOperatorMember2020-03-310001004315ifrs-full:OperatingSegmentsMembernggtf:NewEnglandMember2022-03-310001004315ifrs-full:OperatingSegmentsMembernggtf:NewEnglandMember2021-03-310001004315ifrs-full:OperatingSegmentsMembernggtf:NewEnglandMember2020-03-310001004315ifrs-full:OperatingSegmentsMembernggtf:NewYorkSegmentMember2022-03-310001004315ifrs-full:OperatingSegmentsMembernggtf:NewYorkSegmentMember2021-03-310001004315ifrs-full:OperatingSegmentsMembernggtf:NewYorkSegmentMember2020-03-310001004315ifrs-full:OperatingSegmentsMembernggtf:NGVenturesAndOtherMember2022-03-310001004315ifrs-full:OperatingSegmentsMembernggtf:NGVenturesAndOtherMember2021-03-310001004315ifrs-full:OperatingSegmentsMembernggtf:NGVenturesAndOtherMember2020-03-310001004315ifrs-full:CountryOfDomicileMember2022-03-310001004315ifrs-full:CountryOfDomicileMember2021-03-310001004315ifrs-full:CountryOfDomicileMember2020-03-310001004315country:US2022-03-310001004315country:US2021-03-310001004315country:US2020-03-310001004315nggtf:PropertyPlantAndEquipment1Member2022-03-310001004315nggtf:PropertyPlantAndEquipment1Member2021-03-310001004315nggtf:PropertyPlantAndEquipment1Member2020-03-310001004315nggtf:PropertyPlantAndEquipment1Member2021-04-012022-03-310001004315nggtf:PropertyPlantAndEquipment1Member2020-04-012021-03-310001004315nggtf:PropertyPlantAndEquipment1Member2019-04-012020-03-310001004315nggtf:IntangibleAssetsMember2022-03-310001004315nggtf:IntangibleAssetsMember2021-03-310001004315nggtf:IntangibleAssetsMember2020-03-310001004315nggtf:IntangibleAssetsMember2021-04-012022-03-310001004315nggtf:IntangibleAssetsMember2020-04-012021-03-310001004315nggtf:IntangibleAssetsMember2019-04-012020-03-310001004315nggtf:StWilliamHomesLLPMember2022-03-152022-03-150001004315nggtf:TransmissionMembernggtf:UKElectricityTransmissionMembernggtf:BeforeExceptionalItemsAndRemeasurementsMember2021-04-012022-03-310001004315nggtf:TransmissionMembernggtf:UKElectricityDistributionMembernggtf:BeforeExceptionalItemsAndRemeasurementsMember2021-04-012022-03-310001004315nggtf:TransmissionMembernggtf:BeforeExceptionalItemsAndRemeasurementsMembernggtf:UKElectricitySystemOperatorMember2021-04-012022-03-310001004315nggtf:TransmissionMembernggtf:NewEnglandMembernggtf:BeforeExceptionalItemsAndRemeasurementsMember2021-04-012022-03-310001004315nggtf:TransmissionMembernggtf:NewYorkSegmentMembernggtf:BeforeExceptionalItemsAndRemeasurementsMember2021-04-012022-03-310001004315nggtf:TransmissionMembernggtf:NGVenturesAndOtherMembernggtf:BeforeExceptionalItemsAndRemeasurementsMember2021-04-012022-03-310001004315nggtf:TransmissionMembernggtf:BeforeExceptionalItemsAndRemeasurementsMember2021-04-012022-03-310001004315nggtf:DistributionMembernggtf:UKElectricityTransmissionMembernggtf:BeforeExceptionalItemsAndRemeasurementsMember2021-04-012022-03-310001004315nggtf:UKElectricityDistributionMembernggtf:DistributionMembernggtf:BeforeExceptionalItemsAndRemeasurementsMember2021-04-012022-03-310001004315nggtf:DistributionMembernggtf:BeforeExceptionalItemsAndRemeasurementsMembernggtf:UKElectricitySystemOperatorMember2021-04-012022-03-310001004315nggtf:NewEnglandMembernggtf:DistributionMembernggtf:BeforeExceptionalItemsAndRemeasurementsMember2021-04-012022-03-310001004315nggtf:DistributionMembernggtf:NewYorkSegmentMembernggtf:BeforeExceptionalItemsAndRemeasurementsMember2021-04-012022-03-310001004315nggtf:NGVenturesAndOtherMembernggtf:DistributionMembernggtf:BeforeExceptionalItemsAndRemeasurementsMember2021-04-012022-03-310001004315nggtf:DistributionMembernggtf:BeforeExceptionalItemsAndRemeasurementsMember2021-04-012022-03-310001004315nggtf:SystemOperatorMembernggtf:UKElectricityTransmissionMembernggtf:BeforeExceptionalItemsAndRemeasurementsMember2021-04-012022-03-310001004315nggtf:UKElectricityDistributionMembernggtf:SystemOperatorMembernggtf:BeforeExceptionalItemsAndRemeasurementsMember2021-04-012022-03-310001004315nggtf:SystemOperatorMembernggtf:BeforeExceptionalItemsAndRemeasurementsMembernggtf:UKElectricitySystemOperatorMember2021-04-012022-03-310001004315nggtf:NewEnglandMembernggtf:SystemOperatorMembernggtf:BeforeExceptionalItemsAndRemeasurementsMember2021-04-012022-03-310001004315nggtf:SystemOperatorMembernggtf:NewYorkSegmentMembernggtf:BeforeExceptionalItemsAndRemeasurementsMember2021-04-012022-03-310001004315nggtf:NGVenturesAndOtherMembernggtf:SystemOperatorMembernggtf:BeforeExceptionalItemsAndRemeasurementsMember2021-04-012022-03-310001004315nggtf:SystemOperatorMembernggtf:BeforeExceptionalItemsAndRemeasurementsMember2021-04-012022-03-310001004315nggtf:UKElectricityTransmissionMembernggtf:BeforeExceptionalItemsAndRemeasurementsMembernggtf:OtherMember2021-04-012022-03-310001004315nggtf:UKElectricityDistributionMembernggtf:BeforeExceptionalItemsAndRemeasurementsMembernggtf:OtherMember2021-04-012022-03-310001004315nggtf:BeforeExceptionalItemsAndRemeasurementsMembernggtf:UKElectricitySystemOperatorMembernggtf:OtherMember2021-04-012022-03-310001004315nggtf:NewEnglandMembernggtf:BeforeExceptionalItemsAndRemeasurementsMembernggtf:OtherMember2021-04-012022-03-310001004315nggtf:NewYorkSegmentMembernggtf:BeforeExceptionalItemsAndRemeasurementsMembernggtf:OtherMember2021-04-012022-03-310001004315nggtf:NGVenturesAndOtherMembernggtf:BeforeExceptionalItemsAndRemeasurementsMembernggtf:OtherMember2021-04-012022-03-310001004315nggtf:BeforeExceptionalItemsAndRemeasurementsMembernggtf:OtherMember2021-04-012022-03-310001004315nggtf:UKElectricityTransmissionMembernggtf:BeforeExceptionalItemsAndRemeasurementsMembernggtf:GenerationMember2021-04-012022-03-310001004315nggtf:UKElectricityDistributionMembernggtf:BeforeExceptionalItemsAndRemeasurementsMembernggtf:GenerationMember2021-04-012022-03-310001004315nggtf:BeforeExceptionalItemsAndRemeasurementsMembernggtf:UKElectricitySystemOperatorMembernggtf:GenerationMember2021-04-012022-03-310001004315nggtf:NewEnglandMembernggtf:BeforeExceptionalItemsAndRemeasurementsMembernggtf:GenerationMember2021-04-012022-03-310001004315nggtf:NewYorkSegmentMembernggtf:BeforeExceptionalItemsAndRemeasurementsMembernggtf:GenerationMember2021-04-012022-03-310001004315nggtf:NGVenturesAndOtherMembernggtf:BeforeExceptionalItemsAndRemeasurementsMembernggtf:GenerationMember2021-04-012022-03-310001004315nggtf:BeforeExceptionalItemsAndRemeasurementsMembernggtf:GenerationMember2021-04-012022-03-310001004315nggtf:UKElectricityTransmissionMember2021-04-012022-03-310001004315nggtf:UKElectricityDistributionMember2021-04-012022-03-310001004315nggtf:UKElectricitySystemOperatorMember2021-04-012022-03-310001004315nggtf:NewEnglandMember2021-04-012022-03-310001004315nggtf:NewYorkSegmentMember2021-04-012022-03-310001004315nggtf:NGVenturesAndOtherMember2021-04-012022-03-310001004315ifrs-full:CountryOfDomicileMembernggtf:UKElectricityTransmissionMembernggtf:BeforeExceptionalItemsAndRemeasurementsMember2021-04-012022-03-310001004315nggtf:UKElectricityDistributionMemberifrs-full:CountryOfDomicileMembernggtf:BeforeExceptionalItemsAndRemeasurementsMember2021-04-012022-03-310001004315ifrs-full:CountryOfDomicileMembernggtf:BeforeExceptionalItemsAndRemeasurementsMembernggtf:UKElectricitySystemOperatorMember2021-04-012022-03-310001004315ifrs-full:CountryOfDomicileMembernggtf:NewEnglandMembernggtf:BeforeExceptionalItemsAndRemeasurementsMember2021-04-012022-03-310001004315ifrs-full:CountryOfDomicileMembernggtf:NewYorkSegmentMembernggtf:BeforeExceptionalItemsAndRemeasurementsMember2021-04-012022-03-310001004315nggtf:NGVenturesAndOtherMemberifrs-full:CountryOfDomicileMembernggtf:BeforeExceptionalItemsAndRemeasurementsMember2021-04-012022-03-310001004315country:USnggtf:UKElectricityTransmissionMembernggtf:BeforeExceptionalItemsAndRemeasurementsMember2021-04-012022-03-310001004315nggtf:UKElectricityDistributionMembercountry:USnggtf:BeforeExceptionalItemsAndRemeasurementsMember2021-04-012022-03-310001004315country:USnggtf:BeforeExceptionalItemsAndRemeasurementsMembernggtf:UKElectricitySystemOperatorMember2021-04-012022-03-310001004315nggtf:NewEnglandMembercountry:USnggtf:BeforeExceptionalItemsAndRemeasurementsMember2021-04-012022-03-310001004315country:USnggtf:NewYorkSegmentMembernggtf:BeforeExceptionalItemsAndRemeasurementsMember2021-04-012022-03-310001004315nggtf:NGVenturesAndOtherMembercountry:USnggtf:BeforeExceptionalItemsAndRemeasurementsMember2021-04-012022-03-310001004315nggtf:TransmissionMembernggtf:UKElectricityTransmissionMember2020-04-012021-03-310001004315nggtf:TransmissionMembernggtf:UKElectricityDistributionMember2020-04-012021-03-310001004315nggtf:TransmissionMembernggtf:UKElectricitySystemOperatorMember2020-04-012021-03-310001004315nggtf:TransmissionMembernggtf:NewEnglandMember2020-04-012021-03-310001004315nggtf:TransmissionMembernggtf:NewYorkSegmentMember2020-04-012021-03-310001004315nggtf:TransmissionMembernggtf:NGVenturesAndOtherMember2020-04-012021-03-310001004315nggtf:TransmissionMember2020-04-012021-03-310001004315nggtf:DistributionMembernggtf:UKElectricityTransmissionMember2020-04-012021-03-310001004315nggtf:UKElectricityDistributionMembernggtf:DistributionMember2020-04-012021-03-310001004315nggtf:DistributionMembernggtf:UKElectricitySystemOperatorMember2020-04-012021-03-310001004315nggtf:NewEnglandMembernggtf:DistributionMember2020-04-012021-03-310001004315nggtf:DistributionMembernggtf:NewYorkSegmentMember2020-04-012021-03-310001004315nggtf:NGVenturesAndOtherMembernggtf:DistributionMember2020-04-012021-03-310001004315nggtf:DistributionMember2020-04-012021-03-310001004315nggtf:SystemOperatorMembernggtf:UKElectricityTransmissionMember2020-04-012021-03-310001004315nggtf:UKElectricityDistributionMembernggtf:SystemOperatorMember2020-04-012021-03-310001004315nggtf:SystemOperatorMembernggtf:UKElectricitySystemOperatorMember2020-04-012021-03-310001004315nggtf:NewEnglandMembernggtf:SystemOperatorMember2020-04-012021-03-310001004315nggtf:SystemOperatorMembernggtf:NewYorkSegmentMember2020-04-012021-03-310001004315nggtf:NGVenturesAndOtherMembernggtf:SystemOperatorMember2020-04-012021-03-310001004315nggtf:SystemOperatorMember2020-04-012021-03-310001004315nggtf:UKElectricityTransmissionMembernggtf:OtherMember2020-04-012021-03-310001004315nggtf:UKElectricityDistributionMembernggtf:OtherMember2020-04-012021-03-310001004315nggtf:UKElectricitySystemOperatorMembernggtf:OtherMember2020-04-012021-03-310001004315nggtf:NewEnglandMembernggtf:OtherMember2020-04-012021-03-310001004315nggtf:NewYorkSegmentMembernggtf:OtherMember2020-04-012021-03-310001004315nggtf:NGVenturesAndOtherMembernggtf:OtherMember2020-04-012021-03-310001004315nggtf:OtherMember2020-04-012021-03-310001004315nggtf:UKElectricityTransmissionMember2020-04-012021-03-310001004315nggtf:UKElectricityDistributionMember2020-04-012021-03-310001004315nggtf:UKElectricitySystemOperatorMember2020-04-012021-03-310001004315nggtf:NewEnglandMember2020-04-012021-03-310001004315nggtf:NewYorkSegmentMember2020-04-012021-03-310001004315nggtf:NGVenturesAndOtherMember2020-04-012021-03-310001004315nggtf:UKElectricityTransmissionMembernggtf:GenerationMember2020-04-012021-03-310001004315nggtf:UKElectricityDistributionMembernggtf:GenerationMember2020-04-012021-03-310001004315nggtf:UKElectricitySystemOperatorMembernggtf:GenerationMember2020-04-012021-03-310001004315nggtf:NewEnglandMembernggtf:GenerationMember2020-04-012021-03-310001004315nggtf:NewYorkSegmentMembernggtf:GenerationMember2020-04-012021-03-310001004315nggtf:NGVenturesAndOtherMembernggtf:GenerationMember2020-04-012021-03-310001004315nggtf:GenerationMember2020-04-012021-03-310001004315ifrs-full:CountryOfDomicileMembernggtf:UKElectricityTransmissionMember2020-04-012021-03-310001004315nggtf:UKElectricityDistributionMemberifrs-full:CountryOfDomicileMember2020-04-012021-03-310001004315ifrs-full:CountryOfDomicileMembernggtf:UKElectricitySystemOperatorMember2020-04-012021-03-310001004315ifrs-full:CountryOfDomicileMembernggtf:NewEnglandMember2020-04-012021-03-310001004315ifrs-full:CountryOfDomicileMembernggtf:NewYorkSegmentMember2020-04-012021-03-310001004315nggtf:NGVenturesAndOtherMemberifrs-full:CountryOfDomicileMember2020-04-012021-03-310001004315country:USnggtf:UKElectricityTransmissionMember2020-04-012021-03-310001004315nggtf:UKElectricityDistributionMembercountry:US2020-04-012021-03-310001004315country:USnggtf:UKElectricitySystemOperatorMember2020-04-012021-03-310001004315nggtf:NewEnglandMembercountry:US2020-04-012021-03-310001004315country:USnggtf:NewYorkSegmentMember2020-04-012021-03-310001004315nggtf:NGVenturesAndOtherMembercountry:US2020-04-012021-03-310001004315nggtf:TransmissionMembernggtf:UKElectricityTransmissionMember2019-04-012020-03-310001004315nggtf:TransmissionMembernggtf:UKElectricityDistributionMember2019-04-012020-03-310001004315nggtf:TransmissionMembernggtf:UKElectricitySystemOperatorMember2019-04-012020-03-310001004315nggtf:TransmissionMembernggtf:NewEnglandMember2019-04-012020-03-310001004315nggtf:TransmissionMembernggtf:NewYorkSegmentMember2019-04-012020-03-310001004315nggtf:TransmissionMembernggtf:NGVenturesAndOtherMember2019-04-012020-03-310001004315nggtf:TransmissionMember2019-04-012020-03-310001004315nggtf:DistributionMembernggtf:UKElectricityTransmissionMember2019-04-012020-03-310001004315nggtf:UKElectricityDistributionMembernggtf:DistributionMember2019-04-012020-03-310001004315nggtf:DistributionMembernggtf:UKElectricitySystemOperatorMember2019-04-012020-03-310001004315nggtf:NewEnglandMembernggtf:DistributionMember2019-04-012020-03-310001004315nggtf:DistributionMembernggtf:NewYorkSegmentMember2019-04-012020-03-310001004315nggtf:NGVenturesAndOtherMembernggtf:DistributionMember2019-04-012020-03-310001004315nggtf:DistributionMember2019-04-012020-03-310001004315nggtf:SystemOperatorMembernggtf:UKElectricityTransmissionMember2019-04-012020-03-310001004315nggtf:UKElectricityDistributionMembernggtf:SystemOperatorMember2019-04-012020-03-310001004315nggtf:SystemOperatorMembernggtf:UKElectricitySystemOperatorMember2019-04-012020-03-310001004315nggtf:NewEnglandMembernggtf:SystemOperatorMember2019-04-012020-03-310001004315nggtf:SystemOperatorMembernggtf:NewYorkSegmentMember2019-04-012020-03-310001004315nggtf:NGVenturesAndOtherMembernggtf:SystemOperatorMember2019-04-012020-03-310001004315nggtf:SystemOperatorMember2019-04-012020-03-310001004315nggtf:UKElectricityTransmissionMembernggtf:OtherMember2019-04-012020-03-310001004315nggtf:UKElectricityDistributionMembernggtf:OtherMember2019-04-012020-03-310001004315nggtf:UKElectricitySystemOperatorMembernggtf:OtherMember2019-04-012020-03-310001004315nggtf:NewEnglandMembernggtf:OtherMember2019-04-012020-03-310001004315nggtf:NewYorkSegmentMembernggtf:OtherMember2019-04-012020-03-310001004315nggtf:NGVenturesAndOtherMembernggtf:OtherMember2019-04-012020-03-310001004315nggtf:OtherMember2019-04-012020-03-310001004315nggtf:UKElectricityTransmissionMember2019-04-012020-03-310001004315nggtf:UKElectricityDistributionMember2019-04-012020-03-310001004315nggtf:UKElectricitySystemOperatorMember2019-04-012020-03-310001004315nggtf:NewEnglandMember2019-04-012020-03-310001004315nggtf:NewYorkSegmentMember2019-04-012020-03-310001004315nggtf:NGVenturesAndOtherMember2019-04-012020-03-310001004315nggtf:UKElectricityTransmissionMembernggtf:GenerationMember2019-04-012020-03-310001004315nggtf:UKElectricityDistributionMembernggtf:GenerationMember2019-04-012020-03-310001004315nggtf:UKElectricitySystemOperatorMembernggtf:GenerationMember2019-04-012020-03-310001004315nggtf:NewEnglandMembernggtf:GenerationMember2019-04-012020-03-310001004315nggtf:NewYorkSegmentMembernggtf:GenerationMember2019-04-012020-03-310001004315nggtf:NGVenturesAndOtherMembernggtf:GenerationMember2019-04-012020-03-310001004315nggtf:GenerationMember2019-04-012020-03-310001004315ifrs-full:CountryOfDomicileMembernggtf:UKElectricityTransmissionMember2019-04-012020-03-310001004315nggtf:UKElectricityDistributionMemberifrs-full:CountryOfDomicileMember2019-04-012020-03-310001004315ifrs-full:CountryOfDomicileMembernggtf:UKElectricitySystemOperatorMember2019-04-012020-03-310001004315ifrs-full:CountryOfDomicileMembernggtf:NewEnglandMember2019-04-012020-03-310001004315ifrs-full:CountryOfDomicileMembernggtf:NewYorkSegmentMember2019-04-012020-03-310001004315nggtf:NGVenturesAndOtherMemberifrs-full:CountryOfDomicileMember2019-04-012020-03-310001004315country:USnggtf:UKElectricityTransmissionMember2019-04-012020-03-310001004315nggtf:UKElectricityDistributionMembercountry:US2019-04-012020-03-310001004315country:USnggtf:UKElectricitySystemOperatorMember2019-04-012020-03-310001004315nggtf:NewEnglandMembercountry:US2019-04-012020-03-310001004315country:USnggtf:NewYorkSegmentMember2019-04-012020-03-310001004315nggtf:NGVenturesAndOtherMembercountry:US2019-04-012020-03-310001004315nggtf:UKGasTransmissionMember2021-03-310001004315nggtf:UKGasTransmissionMember2020-03-310001004315nggtf:ConnectionsMembernggtf:UKElectricityTransmissionMember2021-04-012022-03-310001004315nggtf:UKElectricityDistributionMembernggtf:ConnectionsMember2021-04-012022-03-310001004315nggtf:NewEnglandMembernggtf:ConnectionsMember2021-04-012022-03-310001004315nggtf:ConnectionsMembernggtf:NewYorkSegmentMember2021-04-012022-03-310001004315ifrs-full:WeightedAverageMembernggtf:ConnectionsMember2021-04-012022-03-310001004315nggtf:UKElectricityTransmissionMember2022-03-310001004315nggtf:UKElectricityTransmissionMember2021-03-310001004315nggtf:UKElectricityTransmissionMember2020-03-310001004315nggtf:NationalGridGrainLNGLimitedMember2022-03-310001004315nggtf:NationalGridGrainLNGLimitedMember2021-03-310001004315nggtf:NationalGridGrainLNGLimitedMember2020-03-310001004315nggtf:StWilliamHomesLLPMember2021-04-012022-03-310001004315nggtf:StWilliamHomesLLPMember2020-04-012021-03-310001004315nggtf:StWilliamHomesLLPMember2019-04-012020-03-31nggtf:employee0001004315nggtf:ExceptionalItemsMembernggtf:StWilliamHomesLLPMember2020-04-012021-03-310001004315nggtf:ExceptionalItemsMembernggtf:StWilliamHomesLLPMember2019-04-012020-03-310001004315nggtf:ExceptionalItemsMember2021-04-012022-03-310001004315nggtf:ExceptionalItemsMember2020-04-012021-03-310001004315nggtf:ExceptionalItemsMember2019-04-012020-03-310001004315nggtf:RemeasurementsMembernggtf:CommodityDerivativesMember2021-04-012022-03-310001004315nggtf:RemeasurementsMembernggtf:CommodityDerivativesMember2020-04-012021-03-310001004315nggtf:RemeasurementsMembernggtf:CommodityDerivativesMember2019-04-012020-03-310001004315nggtf:RemeasurementsMember2021-04-012022-03-310001004315nggtf:RemeasurementsMember2020-04-012021-03-310001004315nggtf:RemeasurementsMember2019-04-012020-03-310001004315nggtf:ExceptionalItemsMembercountry:GB2021-04-012022-03-310001004315nggtf:ExceptionalItemsMembercountry:GB2020-04-012021-03-310001004315nggtf:ExceptionalItemsMembercountry:GB2019-04-012020-03-310001004315ifrs-full:OtherEnvironmentRelatedProvisionMember2022-03-310001004315ifrs-full:OtherEnvironmentRelatedProvisionMembernggtf:ExceptionalItemsChangeInEstimateOfTotalCostAndCostSharingMember2019-04-012020-03-310001004315ifrs-full:OtherEnvironmentRelatedProvisionMembernggtf:ExceptionalItemsImpactOfChangeInTheDiscountRateMember2019-04-012020-03-310001004315ifrs-full:OtherEnvironmentRelatedProvisionMembernggtf:ExceptionalItemsImpactOfChangeInTheDiscountRateMembercountry:US2019-04-012020-03-310001004315ifrs-full:OtherEnvironmentRelatedProvisionMembernggtf:ExceptionalItemsImpactOfChangeInTheDiscountRateMembercountry:GB2019-04-012020-03-310001004315ifrs-full:OtherEnvironmentRelatedProvisionMember2019-04-012020-03-310001004315nggtf:ExceptionalItemsMembercountry:GB2021-04-012022-03-310001004315nggtf:ExceptionalItemsMembercountry:GB2019-04-012020-03-310001004315nggtf:ExceptionalItemsMember2016-04-012017-03-310001004315nggtf:DomesticTaxAuthority1Member2021-04-012022-03-310001004315nggtf:DomesticTaxAuthority1Member2020-04-012021-03-310001004315nggtf:DomesticTaxAuthority1Member2019-04-012020-03-310001004315nggtf:ForeignTaxAuthority1Member2021-04-012022-03-310001004315nggtf:ForeignTaxAuthority1Member2020-04-012021-03-310001004315nggtf:ForeignTaxAuthority1Member2019-04-012020-03-310001004315nggtf:RegulatoryLicensesMember2020-03-310001004315nggtf:AcceleratedTaxDepreciationRelatedTemporaryDifferencesMember2020-03-310001004315nggtf:SharebasedPaymentsRelatedTemporaryDifferencesMember2020-03-310001004315nggtf:PensionsAndOtherPostretirementBenefitsRelatedTemporaryDifferencesMember2020-03-310001004315nggtf:FinancialInstrumentsRelatedTemporaryDifferencesMember2020-03-310001004315ifrs-full:OtherTemporaryDifferencesMember2020-03-310001004315nggtf:RegulatoryLicensesMember2020-04-012021-03-310001004315nggtf:AcceleratedTaxDepreciationRelatedTemporaryDifferencesMember2020-04-012021-03-310001004315nggtf:SharebasedPaymentsRelatedTemporaryDifferencesMember2020-04-012021-03-310001004315nggtf:PensionsAndOtherPostretirementBenefitsRelatedTemporaryDifferencesMember2020-04-012021-03-310001004315nggtf:FinancialInstrumentsRelatedTemporaryDifferencesMember2020-04-012021-03-310001004315ifrs-full:OtherTemporaryDifferencesMember2020-04-012021-03-310001004315nggtf:RegulatoryLicensesMember2021-03-310001004315nggtf:AcceleratedTaxDepreciationRelatedTemporaryDifferencesMember2021-03-310001004315nggtf:SharebasedPaymentsRelatedTemporaryDifferencesMember2021-03-310001004315nggtf:PensionsAndOtherPostretirementBenefitsRelatedTemporaryDifferencesMember2021-03-310001004315nggtf:FinancialInstrumentsRelatedTemporaryDifferencesMember2021-03-310001004315ifrs-full:OtherTemporaryDifferencesMember2021-03-310001004315nggtf:RegulatoryLicensesMember2021-04-012022-03-310001004315nggtf:AcceleratedTaxDepreciationRelatedTemporaryDifferencesMember2021-04-012022-03-310001004315nggtf:SharebasedPaymentsRelatedTemporaryDifferencesMember2021-04-012022-03-310001004315nggtf:PensionsAndOtherPostretirementBenefitsRelatedTemporaryDifferencesMember2021-04-012022-03-310001004315nggtf:FinancialInstrumentsRelatedTemporaryDifferencesMember2021-04-012022-03-310001004315ifrs-full:OtherTemporaryDifferencesMember2021-04-012022-03-310001004315nggtf:RegulatoryLicensesMember2022-03-310001004315nggtf:AcceleratedTaxDepreciationRelatedTemporaryDifferencesMember2022-03-310001004315nggtf:SharebasedPaymentsRelatedTemporaryDifferencesMember2022-03-310001004315nggtf:PensionsAndOtherPostretirementBenefitsRelatedTemporaryDifferencesMember2022-03-310001004315nggtf:FinancialInstrumentsRelatedTemporaryDifferencesMember2022-03-310001004315ifrs-full:OtherTemporaryDifferencesMember2022-03-310001004315ifrs-full:UnusedTaxLossesMember2022-03-310001004315ifrs-full:UnusedTaxLossesMember2021-03-310001004315nggtf:TemporaryDifferencesEnvironmentalProvisionsMember2022-03-310001004315nggtf:TemporaryDifferencesEnvironmentalProvisionsMember2021-03-310001004315ifrs-full:AllowanceForCreditLossesMember2022-03-310001004315ifrs-full:AllowanceForCreditLossesMember2021-03-310001004315nggtf:CapitalLossesMember2022-03-310001004315nggtf:CapitalLossesMember2021-03-310001004315nggtf:NonTradeDeficitsMember2022-03-310001004315nggtf:NonTradeDeficitsMember2021-03-310001004315nggtf:TradingLossesMember2022-03-310001004315nggtf:TradingLossesMember2021-03-310001004315nggtf:InterimDividendinRespectofCurrentYearMember2021-04-012022-03-310001004315nggtf:InterimDividendinRespectofCurrentYearMember2020-04-012021-03-310001004315nggtf:InterimDividendinRespectofCurrentYearMember2019-04-012020-03-310001004315nggtf:FinalDividendinRespectofPriorYearMember2021-04-012022-03-310001004315nggtf:FinalDividendinRespectofPriorYearMember2020-04-012021-03-310001004315nggtf:FinalDividendinRespectofPriorYearMember2019-04-012020-03-310001004315nggtf:TheNarragansettElectricCompanyMemberifrs-full:AssetsAndLiabilitiesClassifiedAsHeldForSaleMember2022-03-310001004315ifrs-full:AssetsAndLiabilitiesClassifiedAsHeldForSaleMembernggtf:UKGasTransmissionMember2022-03-310001004315ifrs-full:AssetsAndLiabilitiesClassifiedAsHeldForSaleMember2022-03-310001004315nggtf:TheNarragansettElectricCompanyMember2021-03-172021-03-170001004315nggtf:TheNarragansettElectricCompanyMemberifrs-full:AssetsAndLiabilitiesClassifiedAsHeldForSaleMemberifrs-full:GoodwillMember2022-03-310001004315nggtf:TheNarragansettElectricCompanyMemberifrs-full:AssetsAndLiabilitiesClassifiedAsHeldForSaleMemberifrs-full:IntangibleAssetsOtherThanGoodwillMember2022-03-310001004315nggtf:TheNarragansettElectricCompanyMemberifrs-full:AssetsAndLiabilitiesClassifiedAsHeldForSaleMemberifrs-full:PropertyPlantAndEquipmentMember2022-03-310001004315nggtf:TheNarragansettElectricCompanyMemberifrs-full:AssetsAndLiabilitiesClassifiedAsHeldForSaleMemberifrs-full:TradeReceivablesMember2022-03-310001004315nggtf:TheNarragansettElectricCompanyMemberifrs-full:AssetsAndLiabilitiesClassifiedAsHeldForSaleMembernggtf:CashandCashEquivalentsMember2022-03-310001004315nggtf:TheNarragansettElectricCompanyMemberifrs-full:AssetsAndLiabilitiesClassifiedAsHeldForSaleMemberifrs-full:OtherAssetsMember2022-03-310001004315nggtf:TheNarragansettElectricCompanyMemberifrs-full:AssetsAndLiabilitiesClassifiedAsHeldForSaleMembernggtf:BorrowingsMember2022-03-310001004315nggtf:TheNarragansettElectricCompanyMemberifrs-full:AssetsAndLiabilitiesClassifiedAsHeldForSaleMembernggtf:PensionLiabilitiesMember2022-03-310001004315nggtf:TheNarragansettElectricCompanyMemberifrs-full:AssetsAndLiabilitiesClassifiedAsHeldForSaleMembernggtf:OtherLiabilitiesMember2022-03-310001004315nggtf:TheNarragansettElectricCompanyMember2021-04-012022-03-310001004315nggtf:TheNarragansettElectricCompanyMember2020-04-012021-03-310001004315nggtf:TheNarragansettElectricCompanyMember2019-04-012020-03-310001004315srt:ScenarioForecastMembernggtf:MacquarieInfrastructureAndRealAssetsMIRAAndBritishColumbiaInvestmentManagementCorporationBCIMembernggtf:AcquiringEntityMember2022-03-272022-03-270001004315srt:ScenarioForecastMembernggtf:AcquiringEntityMembernggtf:UKGasTransmissionMember2022-03-272022-03-270001004315ifrs-full:AssetsAndLiabilitiesClassifiedAsHeldForSaleMemberifrs-full:IntangibleAssetsOtherThanGoodwillMembernggtf:UKGasTransmissionMember2022-03-310001004315ifrs-full:AssetsAndLiabilitiesClassifiedAsHeldForSaleMemberifrs-full:PropertyPlantAndEquipmentMembernggtf:UKGasTransmissionMember2022-03-310001004315ifrs-full:AssetsAndLiabilitiesClassifiedAsHeldForSaleMemberifrs-full:TradeReceivablesMembernggtf:UKGasTransmissionMember2022-03-310001004315ifrs-full:AssetsAndLiabilitiesClassifiedAsHeldForSaleMembernggtf:PensionAssetsMembernggtf:UKGasTransmissionMember2022-03-310001004315ifrs-full:AssetsAndLiabilitiesClassifiedAsHeldForSaleMembernggtf:CashandCashEquivalentsMembernggtf:UKGasTransmissionMember2022-03-310001004315ifrs-full:AssetsAndLiabilitiesClassifiedAsHeldForSaleMembernggtf:FinancingDerivativesMembernggtf:UKGasTransmissionMember2022-03-310001004315ifrs-full:AssetsAndLiabilitiesClassifiedAsHeldForSaleMemberifrs-full:OtherAssetsMembernggtf:UKGasTransmissionMember2022-03-310001004315ifrs-full:AssetsAndLiabilitiesClassifiedAsHeldForSaleMembernggtf:BorrowingsMembernggtf:UKGasTransmissionMember2022-03-310001004315ifrs-full:AssetsAndLiabilitiesClassifiedAsHeldForSaleMembernggtf:UKGasTransmissionMembernggtf:DeferredTaxLiabilityMember2022-03-310001004315ifrs-full:AssetsAndLiabilitiesClassifiedAsHeldForSaleMembernggtf:OtherLiabilitiesMembernggtf:UKGasTransmissionMember2022-03-310001004315nggtf:QuadgasHoldCoLimitedMember2019-06-012019-06-300001004315ifrs-full:DiscontinuedOperationsMembernggtf:QuadgasHoldCoLimitedMember2019-06-012019-06-300001004315ifrs-full:DiscontinuedOperationsMembernggtf:ExceptionalItemsAndRemeasurementsMembercountry:GB2021-04-012022-03-310001004315ifrs-full:GoodwillMember2020-03-310001004315ifrs-full:GoodwillMember2020-04-012021-03-310001004315ifrs-full:GoodwillMember2021-03-310001004315ifrs-full:GoodwillMember2021-04-012022-03-310001004315ifrs-full:GoodwillMember2022-03-310001004315ifrs-full:GoodwillMemberifrs-full:AccumulatedImpairmentMember2021-03-310001004315ifrs-full:GoodwillMemberifrs-full:AccumulatedImpairmentMember2022-03-310001004315nggtf:FederalCGUMemberifrs-full:GoodwillMemberifrs-full:GrossCarryingAmountMember2022-03-310001004315ifrs-full:GoodwillMemberifrs-full:GrossCarryingAmountMembernggtf:MassachusettsCGUMember2022-03-310001004315nggtf:NationalGridVenturesRenewablesMemberifrs-full:GoodwillMember2022-03-310001004315ifrs-full:GoodwillMembernggtf:NewEnglandMember2022-03-310001004315ifrs-full:GoodwillMembernggtf:NewYorkCGUMember2022-03-310001004315ifrs-full:GoodwillMembernggtf:WesternPowerDistributionPLCMember2022-03-310001004315nggtf:IntangibleAssetsMembernggtf:WestMidlandsMember2022-03-310001004315nggtf:IntangibleAssetsMembernggtf:EastMidlandsMember2022-03-310001004315nggtf:SouthWalesMembernggtf:IntangibleAssetsMember2022-03-310001004315nggtf:SouthWestMembernggtf:IntangibleAssetsMember2022-03-310001004315nggtf:IntangibleAssetsMember2022-03-310001004315nggtf:PPLWPDInvestmentsLimitedWPDMember2022-03-310001004315nggtf:USRegulatedMember2022-03-310001004315nggtf:WesternPowerDistributionGroupMember2022-03-310001004315nggtf:WesternPowerDistributionDNOMember2022-03-310001004315nggtf:NewYorkCGUMember2022-03-310001004315nggtf:NewEnglandMember2022-03-310001004315nggtf:USRegulatedMember2021-03-310001004315nggtf:PPLWPDInvestmentsLimitedWPDMembernggtf:ActuarialAssumptionOfTerminalGrowthRateMember2022-03-310001004315nggtf:PPLWPDInvestmentsLimitedWPDMemberifrs-full:ActuarialAssumptionOfDiscountRatesMember2022-03-310001004315ifrs-full:ComputerSoftwareMemberifrs-full:BottomOfRangeMember2021-04-012022-03-310001004315ifrs-full:TopOfRangeMemberifrs-full:ComputerSoftwareMember2021-04-012022-03-310001004315ifrs-full:GrossCarryingAmountMemberifrs-full:LicencesMember2020-03-310001004315ifrs-full:ComputerSoftwareMemberifrs-full:GrossCarryingAmountMember2020-03-310001004315ifrs-full:GrossCarryingAmountMemberifrs-full:ConstructionInProgressMember2020-03-310001004315ifrs-full:GrossCarryingAmountMember2020-03-310001004315ifrs-full:GrossCarryingAmountMemberifrs-full:LicencesMember2020-04-012021-03-310001004315ifrs-full:ComputerSoftwareMemberifrs-full:GrossCarryingAmountMember2020-04-012021-03-310001004315ifrs-full:GrossCarryingAmountMemberifrs-full:ConstructionInProgressMember2020-04-012021-03-310001004315ifrs-full:GrossCarryingAmountMember2020-04-012021-03-310001004315ifrs-full:GrossCarryingAmountMemberifrs-full:LicencesMember2021-03-310001004315ifrs-full:ComputerSoftwareMemberifrs-full:GrossCarryingAmountMember2021-03-310001004315ifrs-full:GrossCarryingAmountMemberifrs-full:ConstructionInProgressMember2021-03-310001004315ifrs-full:GrossCarryingAmountMember2021-03-310001004315ifrs-full:GrossCarryingAmountMemberifrs-full:LicencesMember2021-04-012022-03-310001004315ifrs-full:ComputerSoftwareMemberifrs-full:GrossCarryingAmountMember2021-04-012022-03-310001004315ifrs-full:GrossCarryingAmountMemberifrs-full:ConstructionInProgressMember2021-04-012022-03-310001004315ifrs-full:GrossCarryingAmountMember2021-04-012022-03-310001004315ifrs-full:GrossCarryingAmountMemberifrs-full:LicencesMember2022-03-310001004315ifrs-full:ComputerSoftwareMemberifrs-full:GrossCarryingAmountMember2022-03-310001004315ifrs-full:GrossCarryingAmountMemberifrs-full:ConstructionInProgressMember2022-03-310001004315ifrs-full:GrossCarryingAmountMember2022-03-310001004315ifrs-full:LicencesMemberifrs-full:AccumulatedDepreciationAndAmortisationMember2020-03-310001004315ifrs-full:ComputerSoftwareMemberifrs-full:AccumulatedDepreciationAndAmortisationMember2020-03-310001004315ifrs-full:ConstructionInProgressMemberifrs-full:AccumulatedDepreciationAndAmortisationMember2020-03-310001004315ifrs-full:AccumulatedDepreciationAndAmortisationMember2020-03-310001004315ifrs-full:LicencesMemberifrs-full:AccumulatedDepreciationAndAmortisationMember2020-04-012021-03-310001004315ifrs-full:ComputerSoftwareMemberifrs-full:AccumulatedDepreciationAndAmortisationMember2020-04-012021-03-310001004315ifrs-full:ConstructionInProgressMemberifrs-full:AccumulatedDepreciationAndAmortisationMember2020-04-012021-03-310001004315ifrs-full:AccumulatedDepreciationAndAmortisationMember2020-04-012021-03-310001004315ifrs-full:LicencesMemberifrs-full:AccumulatedDepreciationAndAmortisationMember2021-03-310001004315ifrs-full:ComputerSoftwareMemberifrs-full:AccumulatedDepreciationAndAmortisationMember2021-03-310001004315ifrs-full:ConstructionInProgressMemberifrs-full:AccumulatedDepreciationAndAmortisationMember2021-03-310001004315ifrs-full:AccumulatedDepreciationAndAmortisationMember2021-03-310001004315ifrs-full:LicencesMemberifrs-full:AccumulatedDepreciationAndAmortisationMember2021-04-012022-03-310001004315ifrs-full:ComputerSoftwareMemberifrs-full:AccumulatedDepreciationAndAmortisationMember2021-04-012022-03-310001004315ifrs-full:ConstructionInProgressMemberifrs-full:AccumulatedDepreciationAndAmortisationMember2021-04-012022-03-310001004315ifrs-full:AccumulatedDepreciationAndAmortisationMember2021-04-012022-03-310001004315ifrs-full:LicencesMemberifrs-full:AccumulatedDepreciationAndAmortisationMember2022-03-310001004315ifrs-full:ComputerSoftwareMemberifrs-full:AccumulatedDepreciationAndAmortisationMember2022-03-310001004315ifrs-full:ConstructionInProgressMemberifrs-full:AccumulatedDepreciationAndAmortisationMember2022-03-310001004315ifrs-full:AccumulatedDepreciationAndAmortisationMember2022-03-310001004315ifrs-full:LicencesMember2022-03-310001004315ifrs-full:ComputerSoftwareMember2022-03-310001004315ifrs-full:ConstructionInProgressMember2022-03-310001004315ifrs-full:LicencesMember2021-03-310001004315ifrs-full:ComputerSoftwareMember2021-03-310001004315ifrs-full:ConstructionInProgressMember2021-03-310001004315nggtf:GasBusinessEnablementSystemMember2022-03-310001004315nggtf:GasBusinessEnablementSystemMember2021-03-310001004315nggtf:GasBusinessEnablementSystemMember2021-04-012022-03-310001004315nggtf:UKGeneralLedgerSystemMember2022-03-310001004315nggtf:UKGeneralLedgerSystemMember2021-03-310001004315nggtf:UKGeneralLedgerSystemMember2021-04-012022-03-310001004315ifrs-full:LandAndBuildingsMemberifrs-full:GrossCarryingAmountMember2020-03-310001004315ifrs-full:GrossCarryingAmountMembernggtf:PlantAndMachineryMember2020-03-310001004315ifrs-full:GrossCarryingAmountMemberifrs-full:ConstructionInProgressMember2020-03-310001004315nggtf:MotorVehiclesAndOfficeEquipmentMemberifrs-full:GrossCarryingAmountMember2020-03-310001004315ifrs-full:LandAndBuildingsMemberifrs-full:GrossCarryingAmountMember2020-04-012021-03-310001004315ifrs-full:GrossCarryingAmountMembernggtf:PlantAndMachineryMember2020-04-012021-03-310001004315ifrs-full:GrossCarryingAmountMemberifrs-full:ConstructionInProgressMember2020-04-012021-03-310001004315nggtf:MotorVehiclesAndOfficeEquipmentMemberifrs-full:GrossCarryingAmountMember2020-04-012021-03-310001004315ifrs-full:LandAndBuildingsMemberifrs-full:GrossCarryingAmountMember2021-03-310001004315ifrs-full:GrossCarryingAmountMembernggtf:PlantAndMachineryMember2021-03-310001004315ifrs-full:GrossCarryingAmountMemberifrs-full:ConstructionInProgressMember2021-03-310001004315nggtf:MotorVehiclesAndOfficeEquipmentMemberifrs-full:GrossCarryingAmountMember2021-03-310001004315ifrs-full:LandAndBuildingsMemberifrs-full:GrossCarryingAmountMember2021-04-012022-03-310001004315ifrs-full:GrossCarryingAmountMembernggtf:PlantAndMachineryMember2021-04-012022-03-310001004315ifrs-full:GrossCarryingAmountMemberifrs-full:ConstructionInProgressMember2021-04-012022-03-310001004315nggtf:MotorVehiclesAndOfficeEquipmentMemberifrs-full:GrossCarryingAmountMember2021-04-012022-03-310001004315ifrs-full:LandAndBuildingsMemberifrs-full:GrossCarryingAmountMember2022-03-310001004315ifrs-full:GrossCarryingAmountMembernggtf:PlantAndMachineryMember2022-03-310001004315ifrs-full:GrossCarryingAmountMemberifrs-full:ConstructionInProgressMember2022-03-310001004315nggtf:MotorVehiclesAndOfficeEquipmentMemberifrs-full:GrossCarryingAmountMember2022-03-310001004315ifrs-full:LandAndBuildingsMemberifrs-full:AccumulatedDepreciationAndAmortisationMember2020-03-310001004315ifrs-full:AccumulatedDepreciationAndAmortisationMembernggtf:PlantAndMachineryMember2020-03-310001004315ifrs-full:ConstructionInProgressMemberifrs-full:AccumulatedDepreciationAndAmortisationMember2020-03-310001004315nggtf:MotorVehiclesAndOfficeEquipmentMemberifrs-full:AccumulatedDepreciationAndAmortisationMember2020-03-310001004315ifrs-full:LandAndBuildingsMemberifrs-full:AccumulatedDepreciationAndAmortisationMember2020-04-012021-03-310001004315ifrs-full:AccumulatedDepreciationAndAmortisationMembernggtf:PlantAndMachineryMember2020-04-012021-03-310001004315ifrs-full:ConstructionInProgressMemberifrs-full:AccumulatedDepreciationAndAmortisationMember2020-04-012021-03-310001004315nggtf:MotorVehiclesAndOfficeEquipmentMemberifrs-full:AccumulatedDepreciationAndAmortisationMember2020-04-012021-03-310001004315ifrs-full:LandAndBuildingsMemberifrs-full:AccumulatedDepreciationAndAmortisationMember2021-03-310001004315ifrs-full:AccumulatedDepreciationAndAmortisationMembernggtf:PlantAndMachineryMember2021-03-310001004315ifrs-full:ConstructionInProgressMemberifrs-full:AccumulatedDepreciationAndAmortisationMember2021-03-310001004315nggtf:MotorVehiclesAndOfficeEquipmentMemberifrs-full:AccumulatedDepreciationAndAmortisationMember2021-03-310001004315ifrs-full:LandAndBuildingsMemberifrs-full:AccumulatedDepreciationAndAmortisationMember2021-04-012022-03-310001004315ifrs-full:AccumulatedDepreciationAndAmortisationMembernggtf:PlantAndMachineryMember2021-04-012022-03-310001004315ifrs-full:ConstructionInProgressMemberifrs-full:AccumulatedDepreciationAndAmortisationMember2021-04-012022-03-310001004315nggtf:MotorVehiclesAndOfficeEquipmentMemberifrs-full:AccumulatedDepreciationAndAmortisationMember2021-04-012022-03-310001004315ifrs-full:LandAndBuildingsMemberifrs-full:AccumulatedDepreciationAndAmortisationMember2022-03-310001004315ifrs-full:AccumulatedDepreciationAndAmortisationMembernggtf:PlantAndMachineryMember2022-03-310001004315ifrs-full:ConstructionInProgressMemberifrs-full:AccumulatedDepreciationAndAmortisationMember2022-03-310001004315nggtf:MotorVehiclesAndOfficeEquipmentMemberifrs-full:AccumulatedDepreciationAndAmortisationMember2022-03-310001004315ifrs-full:LandAndBuildingsMember2022-03-310001004315nggtf:PlantAndMachineryMember2022-03-310001004315ifrs-full:ConstructionInProgressMember2022-03-310001004315nggtf:MotorVehiclesAndOfficeEquipmentMember2022-03-310001004315ifrs-full:LandAndBuildingsMember2021-03-310001004315nggtf:PlantAndMachineryMember2021-03-310001004315ifrs-full:ConstructionInProgressMember2021-03-310001004315nggtf:MotorVehiclesAndOfficeEquipmentMember2021-03-310001004315ifrs-full:GrossCarryingAmountMembernggtf:PropertyPlantAndEquipment1Member2021-04-012022-03-310001004315ifrs-full:GrossCarryingAmountMembernggtf:PropertyPlantAndEquipment1Member2020-04-012021-03-310001004315nggtf:TradeAndOtherPayablesMember2022-03-310001004315nggtf:TradeAndOtherPayablesMember2021-03-310001004315nggtf:NonCurrentLiabilitiesMember2022-03-310001004315nggtf:NonCurrentLiabilitiesMember2021-03-310001004315nggtf:ContractLiabilitiesCurrentMember2022-03-310001004315nggtf:ContractLiabilitiesCurrentMember2021-03-310001004315nggtf:ContractLiabilitiesNonCurrentMember2022-03-310001004315nggtf:ContractLiabilitiesNonCurrentMember2021-03-310001004315ifrs-full:TopOfRangeMemberifrs-full:LandAndBuildingsMembercountry:GB2021-04-012022-03-310001004315ifrs-full:TopOfRangeMemberifrs-full:LandAndBuildingsMembercountry:US2021-04-012022-03-310001004315ifrs-full:LandAndBuildingsMemberifrs-full:WeightedAverageMember2021-04-012022-03-310001004315ifrs-full:TopOfRangeMembernggtf:ElectricityTransmissionPlantAndWiresMembercountry:GB2021-04-012022-03-310001004315nggtf:ElectricityTransmissionPlantAndWiresMembercountry:USifrs-full:BottomOfRangeMember2021-04-012022-03-310001004315ifrs-full:TopOfRangeMembernggtf:ElectricityTransmissionPlantAndWiresMembercountry:US2021-04-012022-03-310001004315nggtf:ElectricityTransmissionPlantAndWiresMemberifrs-full:WeightedAverageMember2021-04-012022-03-310001004315nggtf:ElectricityDistributionPlantMemberifrs-full:BottomOfRangeMembercountry:GB2021-04-012022-03-310001004315ifrs-full:TopOfRangeMembernggtf:ElectricityDistributionPlantMembercountry:GB2021-04-012022-03-310001004315nggtf:ElectricityDistributionPlantMembercountry:USifrs-full:BottomOfRangeMember2021-04-012022-03-310001004315ifrs-full:TopOfRangeMembernggtf:ElectricityDistributionPlantMembercountry:US2021-04-012022-03-310001004315ifrs-full:WeightedAverageMembernggtf:ElectricityDistributionPlantMember2021-04-012022-03-310001004315country:USifrs-full:BottomOfRangeMembernggtf:ElectricityGenerationPlantMember2021-04-012022-03-310001004315ifrs-full:TopOfRangeMembercountry:USnggtf:ElectricityGenerationPlantMember2021-04-012022-03-310001004315ifrs-full:WeightedAverageMembernggtf:ElectricityGenerationPlantMember2021-04-012022-03-310001004315nggtf:InterconnectorPlantAndOtherMemberifrs-full:BottomOfRangeMembercountry:GB2021-04-012022-03-310001004315ifrs-full:TopOfRangeMembernggtf:InterconnectorPlantAndOtherMembercountry:GB2021-04-012022-03-310001004315nggtf:InterconnectorPlantAndOtherMembercountry:USifrs-full:BottomOfRangeMember2021-04-012022-03-310001004315ifrs-full:TopOfRangeMembernggtf:InterconnectorPlantAndOtherMembercountry:US2021-04-012022-03-310001004315nggtf:InterconnectorPlantAndOtherMemberifrs-full:WeightedAverageMember2021-04-012022-03-310001004315country:USnggtf:GasPlantMainsServicesAndRegulatingEquipmentMemberifrs-full:BottomOfRangeMember2021-04-012022-03-310001004315ifrs-full:TopOfRangeMembercountry:USnggtf:GasPlantMainsServicesAndRegulatingEquipmentMember2021-04-012022-03-310001004315ifrs-full:WeightedAverageMembernggtf:GasPlantMainsServicesAndRegulatingEquipmentMember2021-04-012022-03-310001004315nggtf:GasPlantStorageMemberifrs-full:BottomOfRangeMembercountry:GB2021-04-012022-03-310001004315ifrs-full:TopOfRangeMembernggtf:GasPlantStorageMembercountry:GB2021-04-012022-03-310001004315nggtf:GasPlantStorageMembercountry:USifrs-full:BottomOfRangeMember2021-04-012022-03-310001004315ifrs-full:TopOfRangeMembernggtf:GasPlantStorageMembercountry:US2021-04-012022-03-310001004315nggtf:GasPlantStorageMemberifrs-full:WeightedAverageMember2021-04-012022-03-310001004315nggtf:GasPlantMetersMemberifrs-full:BottomOfRangeMembercountry:GB2021-04-012022-03-310001004315ifrs-full:TopOfRangeMembernggtf:GasPlantMetersMembercountry:GB2021-04-012022-03-310001004315country:USnggtf:GasPlantMetersMemberifrs-full:BottomOfRangeMember2021-04-012022-03-310001004315ifrs-full:TopOfRangeMembercountry:USnggtf:GasPlantMetersMember2021-04-012022-03-310001004315ifrs-full:WeightedAverageMembernggtf:GasPlantMetersMember2021-04-012022-03-310001004315ifrs-full:TopOfRangeMembernggtf:MotorVehiclesAndOfficeEquipmentMembercountry:GB2021-04-012022-03-310001004315ifrs-full:TopOfRangeMembernggtf:MotorVehiclesAndOfficeEquipmentMembercountry:US2021-04-012022-03-310001004315nggtf:MotorVehiclesAndOfficeEquipmentMemberifrs-full:WeightedAverageMember2021-04-012022-03-310001004315ifrs-full:WeightedAverageMembercountry:USnggtf:GasDistributionAssetsMember2021-04-012022-03-310001004315ifrs-full:LandAndBuildingsMember2020-03-310001004315nggtf:PlantAndMachineryMember2020-03-310001004315ifrs-full:ConstructionInProgressMember2020-03-310001004315nggtf:MotorVehiclesAndOfficeEquipmentMember2020-03-310001004315ifrs-full:LandAndBuildingsMember2020-04-012021-03-310001004315nggtf:PlantAndMachineryMember2020-04-012021-03-310001004315ifrs-full:ConstructionInProgressMember2020-04-012021-03-310001004315nggtf:MotorVehiclesAndOfficeEquipmentMember2020-04-012021-03-310001004315ifrs-full:LandAndBuildingsMember2021-03-310001004315nggtf:PlantAndMachineryMember2021-03-310001004315ifrs-full:ConstructionInProgressMember2021-03-310001004315nggtf:MotorVehiclesAndOfficeEquipmentMember2021-03-310001004315ifrs-full:LandAndBuildingsMember2021-04-012022-03-310001004315nggtf:PlantAndMachineryMember2021-04-012022-03-310001004315ifrs-full:ConstructionInProgressMember2021-04-012022-03-310001004315nggtf:MotorVehiclesAndOfficeEquipmentMember2021-04-012022-03-310001004315ifrs-full:LandAndBuildingsMember2022-03-310001004315nggtf:PlantAndMachineryMember2022-03-310001004315ifrs-full:ConstructionInProgressMember2022-03-310001004315nggtf:MotorVehiclesAndOfficeEquipmentMember2022-03-31nggtf:category0001004315nggtf:ReserveOfGainsandLossesOnFinancialLiabilitiesMeasuredAtFairValueThroughOtherComprehensiveIncomeMember2021-03-310001004315nggtf:InvestmentsShortTermMoneyMarketFundsMember2022-03-310001004315nggtf:InvestmentsShortTermMoneyMarketFundsMember2021-03-310001004315nggtf:InvestmentsCorporateCapitalVenturesAndOtherMember2022-03-310001004315nggtf:InvestmentsCorporateCapitalVenturesAndOtherMember2021-03-310001004315nggtf:UnquotedEquityInvestmentsMember2022-03-310001004315nggtf:UnquotedEquityInvestmentsMember2021-03-310001004315nggtf:RestrictedBalancesCollateralMember2022-03-310001004315nggtf:RestrictedBalancesCollateralMember2021-03-310001004315nggtf:RestrictedBalancesInsuranceCompanyAndNonQualifiedPlanInvestmentsMember2022-03-310001004315nggtf:RestrictedBalancesInsuranceCompanyAndNonQualifiedPlanInvestmentsMember2021-03-310001004315nggtf:RestrictedBalancesCashSurrenderValueOfLifeInsurancePoliciesMember2022-03-310001004315nggtf:RestrictedBalancesCashSurrenderValueOfLifeInsurancePoliciesMember2021-03-310001004315nggtf:RestrictedBalancesOtherInvestmentsMember2022-03-310001004315nggtf:RestrictedBalancesOtherInvestmentsMember2021-03-310001004315nggtf:InvestmentsInsuranceCompanyFundMember2022-03-310001004315nggtf:InvestmentsInsuranceCompanyFundMember2021-03-310001004315ifrs-full:AssociatesMember2021-03-310001004315ifrs-full:JointVenturesMember2021-03-310001004315ifrs-full:AssociatesMember2020-03-310001004315ifrs-full:JointVenturesMember2020-03-310001004315ifrs-full:AssociatesMember2021-04-012022-03-310001004315ifrs-full:JointVenturesMember2021-04-012022-03-310001004315ifrs-full:AssociatesMember2020-04-012021-03-310001004315ifrs-full:JointVenturesMember2020-04-012021-03-310001004315ifrs-full:AssociatesMember2022-03-310001004315ifrs-full:JointVenturesMember2022-03-310001004315nggtf:BritNedDevelopmentLimitedMember2021-04-012022-03-310001004315nggtf:NemoLinkLimitedMember2021-04-012022-03-310001004315nggtf:EmeraldEnergyVentureLLCMember2021-04-012022-03-310001004315nggtf:BightWindHoldingsLLCMember2021-04-012022-03-310001004315nggtf:BightWindHoldingsLLCMemberifrs-full:JointVenturesWhereEntityIsVenturerMember2022-02-25nggtf:lease0001004315nggtf:BightWindHoldingsLLCMemberifrs-full:JointVenturesWhereEntityIsVenturerMember2022-03-310001004315nggtf:MillenniumPipelineCompanyLLCMember2021-04-012022-03-310001004315nggtf:BritNedDevelopmentLimitedMember2022-03-310001004315nggtf:BritNedDevelopmentLimitedMember2021-03-310001004315nggtf:NemoLinkLimitedMember2022-03-310001004315nggtf:NemoLinkLimitedMember2021-03-310001004315nggtf:EmeraldEnergyVentureLLCMember2022-03-310001004315nggtf:EmeraldEnergyVentureLLCMember2021-03-310001004315nggtf:MillenniumPipelineCompanyLLCMember2022-03-310001004315nggtf:MillenniumPipelineCompanyLLCMember2021-03-310001004315nggtf:BritNedDevelopmentLimitedMember2020-04-012021-03-310001004315nggtf:NemoLinkLimitedMember2020-04-012021-03-310001004315nggtf:EmeraldEnergyVentureLLCMember2020-04-012021-03-310001004315nggtf:MillenniumPipelineCompanyLLCMember2020-04-012021-03-310001004315nggtf:CurrentDerivativeFinancialAssetsMember2022-03-310001004315nggtf:CurrentDerivativeFinancialLiabilitiesMember2022-03-310001004315nggtf:CurrentDerivativeFinancialAssetsMember2021-03-310001004315nggtf:CurrentDerivativeFinancialLiabilitiesMember2021-03-310001004315nggtf:NonCurrentDerivativeFinancialAssetsMember2022-03-310001004315nggtf:NonCurrentDerivativeFinancialLiabilitiesMember2022-03-310001004315nggtf:NonCurrentDerivativeFinancialAssetsMember2021-03-310001004315nggtf:NonCurrentDerivativeFinancialLiabilitiesMember2021-03-310001004315nggtf:FinancingDerivativesMember2022-03-310001004315nggtf:FinancingDerivativesMember2021-03-310001004315nggtf:CommodityDerivativesMember2022-03-310001004315nggtf:CommodityDerivativesMember2021-03-310001004315nggtf:FinancingDerivativesInterestRateSwapsMember2022-03-310001004315nggtf:FinancingDerivativesInterestRateSwapsMember2021-03-310001004315nggtf:FinancingDerivativesCrossCurrencyInterestRateSwapsMember2022-03-310001004315nggtf:FinancingDerivativesCrossCurrencyInterestRateSwapsMember2021-03-310001004315nggtf:FinancingDerivativesForeignExchangeForwardContractsMember2022-03-310001004315nggtf:FinancingDerivativesForeignExchangeForwardContractsMember2021-03-310001004315nggtf:FinancingDerivativesInflationLinkedSwapsMember2022-03-310001004315nggtf:FinancingDerivativesInflationLinkedSwapsMember2021-03-310001004315nggtf:CapitalExpendituresMembernggtf:FinancingDerivativesForeignExchangeForwardContractsMember2022-03-310001004315nggtf:CapitalExpendituresMembernggtf:FinancingDerivativesForeignExchangeForwardContractsMember2021-03-310001004315nggtf:FinancingDerivativesDealContingentForeignExchangeForwardContractsMember2022-03-310001004315nggtf:FinancingDerivativesDealContingentForeignExchangeForwardContractsMember2021-03-310001004315ifrs-full:NotLaterThanOneYearMembernggtf:FinancingDerivativesMember2022-03-310001004315ifrs-full:NotLaterThanOneYearMembernggtf:FinancingDerivativesMember2021-03-310001004315ifrs-full:LaterThanOneYearAndNotLaterThanTwoYearsMembernggtf:FinancingDerivativesMember2022-03-310001004315ifrs-full:LaterThanOneYearAndNotLaterThanTwoYearsMembernggtf:FinancingDerivativesMember2021-03-310001004315ifrs-full:LaterThanTwoYearsAndNotLaterThanThreeYearsMembernggtf:FinancingDerivativesMember2022-03-310001004315ifrs-full:LaterThanTwoYearsAndNotLaterThanThreeYearsMembernggtf:FinancingDerivativesMember2021-03-310001004315ifrs-full:LaterThanThreeYearsAndNotLaterThanFourYearsMembernggtf:FinancingDerivativesMember2022-03-310001004315ifrs-full:LaterThanThreeYearsAndNotLaterThanFourYearsMembernggtf:FinancingDerivativesMember2021-03-310001004315ifrs-full:LaterThanFourYearsAndNotLaterThanFiveYearsMembernggtf:FinancingDerivativesMember2022-03-310001004315ifrs-full:LaterThanFourYearsAndNotLaterThanFiveYearsMembernggtf:FinancingDerivativesMember2021-03-310001004315ifrs-full:LaterThanFiveYearsMembernggtf:FinancingDerivativesMember2022-03-310001004315ifrs-full:LaterThanFiveYearsMembernggtf:FinancingDerivativesMember2021-03-310001004315ifrs-full:LaterThanOneYearMembernggtf:FinancingDerivativesMember2022-03-310001004315ifrs-full:LaterThanOneYearMembernggtf:FinancingDerivativesMember2021-03-310001004315nggtf:LondonInterbankOfferedRateGBPLIBORMembernggtf:FinancingDerivativesMember2021-03-310001004315nggtf:LondonInterbankOfferedRateUSDLIBORMembernggtf:FinancingDerivativesMember2022-03-310001004315nggtf:LondonInterbankOfferedRateUSDLIBORMembernggtf:FinancingDerivativesMember2021-03-310001004315nggtf:CommodityDerivativesForwardPurchasesGasMember2022-03-310001004315nggtf:CommodityDerivativesForwardPurchasesGasMember2021-03-310001004315nggtf:CommodityDerivativesElectricityCapacityMember2022-03-310001004315nggtf:CommodityDerivativesElectricityCapacityMember2021-03-310001004315nggtf:CommodityDerivativesElectricitySwapsMember2022-03-310001004315nggtf:CommodityDerivativesElectricitySwapsMember2021-03-310001004315nggtf:CommodityDerivativesElectricityOptionsMember2022-03-310001004315nggtf:CommodityDerivativesElectricityOptionsMember2021-03-310001004315nggtf:CommodityDerivativesGasSwapsMember2022-03-310001004315nggtf:CommodityDerivativesGasSwapsMember2021-03-310001004315nggtf:CommodityDerivativesGasOptionsMember2022-03-310001004315nggtf:CommodityDerivativesGasOptionsMember2021-03-310001004315ifrs-full:NotLaterThanOneYearMembernggtf:CommodityDerivativesMember2022-03-310001004315ifrs-full:NotLaterThanOneYearMembernggtf:CommodityDerivativesMember2021-03-310001004315ifrs-full:LaterThanOneYearAndNotLaterThanTwoYearsMembernggtf:CommodityDerivativesMember2022-03-310001004315ifrs-full:LaterThanOneYearAndNotLaterThanTwoYearsMembernggtf:CommodityDerivativesMember2021-03-310001004315ifrs-full:LaterThanTwoYearsAndNotLaterThanThreeYearsMembernggtf:CommodityDerivativesMember2022-03-310001004315ifrs-full:LaterThanTwoYearsAndNotLaterThanThreeYearsMembernggtf:CommodityDerivativesMember2021-03-310001004315ifrs-full:LaterThanThreeYearsAndNotLaterThanFourYearsMembernggtf:CommodityDerivativesMember2022-03-310001004315ifrs-full:LaterThanThreeYearsAndNotLaterThanFourYearsMembernggtf:CommodityDerivativesMember2021-03-310001004315ifrs-full:LaterThanFourYearsAndNotLaterThanFiveYearsMembernggtf:CommodityDerivativesMember2022-03-310001004315ifrs-full:LaterThanFourYearsAndNotLaterThanFiveYearsMembernggtf:CommodityDerivativesMember2021-03-310001004315ifrs-full:LaterThanFiveYearsMembernggtf:CommodityDerivativesMember2022-03-310001004315ifrs-full:LaterThanFiveYearsMembernggtf:CommodityDerivativesMember2021-03-310001004315ifrs-full:LaterThanOneYearMembernggtf:CommodityDerivativesMember2022-03-310001004315ifrs-full:LaterThanOneYearMembernggtf:CommodityDerivativesMember2021-03-31utr:MMBTUutr:GWh0001004315nggtf:CommodityDerivativesForwardPurchasesGasMember2021-04-012022-03-310001004315nggtf:CommodityDerivativesForwardPurchasesGasMember2020-04-012021-03-310001004315ifrs-full:TradeReceivablesMember2021-03-310001004315ifrs-full:TradeReceivablesMember2020-03-310001004315ifrs-full:TradeReceivablesMember2021-04-012022-03-310001004315ifrs-full:TradeReceivablesMember2020-04-012021-03-310001004315ifrs-full:TradeReceivablesMember2022-03-310001004315ifrs-full:TradeReceivablesMemberifrs-full:GrossCarryingAmountMembercountry:GB2022-03-310001004315ifrs-full:TradeReceivablesMembercountry:USifrs-full:GrossCarryingAmountMember2022-03-310001004315ifrs-full:TradeReceivablesMemberifrs-full:GrossCarryingAmountMember2022-03-310001004315ifrs-full:TradeReceivablesMemberifrs-full:GrossCarryingAmountMembercountry:GB2021-03-310001004315ifrs-full:TradeReceivablesMembercountry:USifrs-full:GrossCarryingAmountMember2021-03-310001004315ifrs-full:TradeReceivablesMemberifrs-full:GrossCarryingAmountMember2021-03-310001004315ifrs-full:GrossCarryingAmountMembercountry:GB2022-03-310001004315country:USifrs-full:GrossCarryingAmountMember2022-03-310001004315ifrs-full:GrossCarryingAmountMembercountry:GB2021-03-310001004315country:USifrs-full:GrossCarryingAmountMember2021-03-310001004315ifrs-full:TradeReceivablesMemberifrs-full:AccumulatedImpairmentMembercountry:GB2022-03-310001004315ifrs-full:TradeReceivablesMembercountry:USifrs-full:AccumulatedImpairmentMember2022-03-310001004315ifrs-full:TradeReceivablesMemberifrs-full:AccumulatedImpairmentMember2022-03-310001004315ifrs-full:TradeReceivablesMemberifrs-full:AccumulatedImpairmentMembercountry:GB2021-03-310001004315ifrs-full:TradeReceivablesMembercountry:USifrs-full:AccumulatedImpairmentMember2021-03-310001004315ifrs-full:TradeReceivablesMemberifrs-full:AccumulatedImpairmentMember2021-03-310001004315country:GB2022-03-310001004315country:GB2021-03-310001004315nggtf:RetailCustomerReceivablesMember2022-03-310001004315nggtf:RetailCustomerReceivablesMember2021-03-310001004315nggtf:UnbilledRevenueMember2022-03-310001004315nggtf:UnbilledRevenueMember2021-03-310001004315ifrs-full:CurrentMembernggtf:RetailCustomerReceivablesMember2022-03-310001004315ifrs-full:CurrentMembernggtf:RetailCustomerReceivablesMember2021-03-310001004315nggtf:RetailCustomerReceivablesMemberifrs-full:LaterThanOneMonthAndNotLaterThanTwoMonthsMember2022-03-310001004315nggtf:RetailCustomerReceivablesMemberifrs-full:LaterThanOneMonthAndNotLaterThanTwoMonthsMember2021-03-310001004315ifrs-full:LaterThanTwoMonthsAndNotLaterThanThreeMonthsMembernggtf:RetailCustomerReceivablesMember2022-03-310001004315ifrs-full:LaterThanTwoMonthsAndNotLaterThanThreeMonthsMembernggtf:RetailCustomerReceivablesMember2021-03-310001004315nggtf:RetailCustomerReceivablesMemberifrs-full:LaterThanThreeMonthsAndNotLaterThanSixMonthsMember2022-03-310001004315nggtf:RetailCustomerReceivablesMemberifrs-full:LaterThanThreeMonthsAndNotLaterThanSixMonthsMember2021-03-310001004315ifrs-full:LaterThanSixMonthsAndNotLaterThanOneYearMembernggtf:RetailCustomerReceivablesMember2022-03-310001004315ifrs-full:LaterThanSixMonthsAndNotLaterThanOneYearMembernggtf:RetailCustomerReceivablesMember2021-03-310001004315ifrs-full:LaterThanOneYearMembernggtf:RetailCustomerReceivablesMember2022-03-310001004315ifrs-full:LaterThanOneYearMembernggtf:RetailCustomerReceivablesMember2021-03-310001004315nggtf:PPLWPDInvestmentsLimitedWPDMember2022-03-310001004315ifrs-full:NotLaterThanOneYearMember2022-03-310001004315ifrs-full:NotLaterThanOneYearMember2021-03-310001004315ifrs-full:LaterThanOneYearAndNotLaterThanTwoYearsMember2022-03-310001004315ifrs-full:LaterThanOneYearAndNotLaterThanTwoYearsMember2021-03-310001004315ifrs-full:LaterThanTwoYearsAndNotLaterThanThreeYearsMember2022-03-310001004315ifrs-full:LaterThanTwoYearsAndNotLaterThanThreeYearsMember2021-03-310001004315ifrs-full:LaterThanThreeYearsAndNotLaterThanFourYearsMember2022-03-310001004315ifrs-full:LaterThanThreeYearsAndNotLaterThanFourYearsMember2021-03-310001004315ifrs-full:LaterThanFourYearsAndNotLaterThanFiveYearsMember2022-03-310001004315ifrs-full:LaterThanFourYearsAndNotLaterThanFiveYearsMember2021-03-310001004315ifrs-full:LaterThanFiveYearsMembernggtf:BorrowingsPaidByInstalmentsMember2022-03-310001004315ifrs-full:LaterThanFiveYearsMembernggtf:BorrowingsPaidByInstalmentsMember2021-03-310001004315nggtf:BorrowingsPaidByOtherThanInstalmentsMemberifrs-full:LaterThanFiveYearsMember2022-03-310001004315nggtf:BorrowingsPaidByOtherThanInstalmentsMemberifrs-full:LaterThanFiveYearsMember2021-03-310001004315ifrs-full:AtFairValueMember2022-03-310001004315ifrs-full:AtFairValueMember2021-03-310001004315ifrs-full:AtFairValueMemberifrs-full:Level1OfFairValueHierarchyMember2022-03-310001004315ifrs-full:AtFairValueMemberifrs-full:Level1OfFairValueHierarchyMember2021-03-310001004315ifrs-full:AtFairValueMemberifrs-full:Level2OfFairValueHierarchyMember2022-03-310001004315ifrs-full:AtFairValueMemberifrs-full:Level2OfFairValueHierarchyMember2021-03-310001004315nggtf:Borrowings1Member2022-03-310001004315nggtf:Borrowings1Member2021-03-310001004315nggtf:LondonInterbankOfferedRateGBPLIBORMember2022-03-310001004315nggtf:LondonInterbankOfferedRateGBPLIBORMember2021-03-310001004315nggtf:LondonInterbankOfferedRateUSDLIBORMember2022-03-310001004315nggtf:LondonInterbankOfferedRateUSDLIBORMember2021-03-3100010043152021-11-040001004315ifrs-full:FinancialLiabilitiesAtFairValueThroughProfitOrLossCategoryMember2021-11-300001004315ifrs-full:FinancialLiabilitiesAtFairValueThroughProfitOrLossCategoryMember2021-03-310001004315ifrs-full:LaterThanOneYearAndNotLaterThanFiveYearsMember2022-03-310001004315ifrs-full:LaterThanOneYearAndNotLaterThanFiveYearsMember2021-03-310001004315ifrs-full:LaterThanFiveYearsMember2022-03-310001004315ifrs-full:LaterThanFiveYearsMember2021-03-310001004315ifrs-full:TopOfRangeMembernggtf:NationalGridUKRetirementPlanMembercountry:GB2021-04-012022-03-310001004315ifrs-full:PensionDefinedBenefitPlansMembercountry:GB2022-03-310001004315ifrs-full:PensionDefinedBenefitPlansMembercountry:GB2021-04-012022-03-310001004315ifrs-full:PensionDefinedBenefitPlansMembercountry:GB2020-04-012021-03-310001004315ifrs-full:PensionDefinedBenefitPlansMembercountry:GB2019-04-012020-03-310001004315country:USifrs-full:BottomOfRangeMember2021-04-012022-03-310001004315ifrs-full:TopOfRangeMembercountry:US2021-04-012022-03-310001004315country:USifrs-full:PensionDefinedBenefitPlansMember2022-03-31nggtf:plan0001004315ifrs-full:PlanAssetsMembercountry:USifrs-full:PensionDefinedBenefitPlansMember2021-04-012022-03-310001004315ifrs-full:PlanAssetsMembercountry:USifrs-full:PensionDefinedBenefitPlansMember2020-04-012021-03-310001004315ifrs-full:PlanAssetsMembercountry:USifrs-full:PostemploymentMedicalDefinedBenefitPlansMember2021-04-012022-03-310001004315ifrs-full:PlanAssetsMembercountry:USifrs-full:PostemploymentMedicalDefinedBenefitPlansMember2020-04-012021-03-310001004315ifrs-full:PensionDefinedBenefitPlansMembercountry:GB2021-03-310001004315ifrs-full:PensionDefinedBenefitPlansMembercountry:GB2020-03-310001004315country:USifrs-full:PensionDefinedBenefitPlansMember2021-03-310001004315country:USifrs-full:PensionDefinedBenefitPlansMember2020-03-310001004315country:USifrs-full:PostemploymentMedicalDefinedBenefitPlansMember2022-03-310001004315country:USifrs-full:PostemploymentMedicalDefinedBenefitPlansMember2021-03-310001004315country:USifrs-full:PostemploymentMedicalDefinedBenefitPlansMember2020-03-31nggtf:year0001004315country:USifrs-full:PensionDefinedBenefitPlansMember2021-04-012022-03-310001004315country:USifrs-full:PostemploymentMedicalDefinedBenefitPlansMember2021-04-012022-03-310001004315nggtf:ActiveMembersMembercountry:GBifrs-full:PensionDefinedBenefitPlansMember2022-03-310001004315nggtf:ActiveMembersMembercountry:GBifrs-full:PensionDefinedBenefitPlansMember2021-03-310001004315nggtf:ActiveMembersMembercountry:USifrs-full:PensionDefinedBenefitPlansMember2022-03-310001004315nggtf:ActiveMembersMembercountry:USifrs-full:PensionDefinedBenefitPlansMember2021-03-310001004315nggtf:ActiveMembersMembercountry:USifrs-full:PostemploymentMedicalDefinedBenefitPlansMember2022-03-310001004315nggtf:ActiveMembersMembercountry:USifrs-full:PostemploymentMedicalDefinedBenefitPlansMember2021-03-310001004315nggtf:DeferredMembersMembercountry:GBifrs-full:PensionDefinedBenefitPlansMember2022-03-310001004315nggtf:DeferredMembersMembercountry:GBifrs-full:PensionDefinedBenefitPlansMember2021-03-310001004315country:USnggtf:DeferredMembersMemberifrs-full:PensionDefinedBenefitPlansMember2022-03-310001004315country:USnggtf:DeferredMembersMemberifrs-full:PensionDefinedBenefitPlansMember2021-03-310001004315nggtf:PensionerMembersMembercountry:GBifrs-full:PensionDefinedBenefitPlansMember2022-03-310001004315nggtf:PensionerMembersMembercountry:GBifrs-full:PensionDefinedBenefitPlansMember2021-03-310001004315country:USnggtf:PensionerMembersMemberifrs-full:PensionDefinedBenefitPlansMember2022-03-310001004315country:USnggtf:PensionerMembersMemberifrs-full:PensionDefinedBenefitPlansMember2021-03-310001004315country:USnggtf:PensionerMembersMemberifrs-full:PostemploymentMedicalDefinedBenefitPlansMember2022-03-310001004315country:USnggtf:PensionerMembersMemberifrs-full:PostemploymentMedicalDefinedBenefitPlansMember2021-03-310001004315ifrs-full:WhollyOrPartlyFundedDefinedBenefitPlansMember2022-03-310001004315ifrs-full:WhollyOrPartlyFundedDefinedBenefitPlansMember2021-03-310001004315ifrs-full:WhollyUnfundedDefinedBenefitPlansMember2022-03-310001004315ifrs-full:WhollyUnfundedDefinedBenefitPlansMember2021-03-310001004315ifrs-full:WhollyOrPartlyFundedDefinedBenefitPlansMembercountry:GBifrs-full:PensionDefinedBenefitPlansMember2022-03-310001004315ifrs-full:WhollyOrPartlyFundedDefinedBenefitPlansMembercountry:GBifrs-full:PensionDefinedBenefitPlansMember2021-03-310001004315ifrs-full:WhollyOrPartlyFundedDefinedBenefitPlansMembercountry:USifrs-full:PensionDefinedBenefitPlansMember2022-03-310001004315ifrs-full:WhollyOrPartlyFundedDefinedBenefitPlansMembercountry:USifrs-full:PensionDefinedBenefitPlansMember2021-03-310001004315ifrs-full:WhollyOrPartlyFundedDefinedBenefitPlansMembercountry:USifrs-full:PostemploymentMedicalDefinedBenefitPlansMember2022-03-310001004315ifrs-full:WhollyOrPartlyFundedDefinedBenefitPlansMembercountry:USifrs-full:PostemploymentMedicalDefinedBenefitPlansMember2021-03-310001004315ifrs-full:WhollyUnfundedDefinedBenefitPlansMembercountry:GBifrs-full:PensionDefinedBenefitPlansMember2022-03-310001004315ifrs-full:WhollyUnfundedDefinedBenefitPlansMembercountry:GBifrs-full:PensionDefinedBenefitPlansMember2021-03-310001004315country:USifrs-full:WhollyUnfundedDefinedBenefitPlansMemberifrs-full:PensionDefinedBenefitPlansMember2022-03-310001004315country:USifrs-full:WhollyUnfundedDefinedBenefitPlansMemberifrs-full:PensionDefinedBenefitPlansMember2021-03-310001004315country:USifrs-full:WhollyUnfundedDefinedBenefitPlansMemberifrs-full:PostemploymentMedicalDefinedBenefitPlansMember2022-03-310001004315country:USifrs-full:WhollyUnfundedDefinedBenefitPlansMemberifrs-full:PostemploymentMedicalDefinedBenefitPlansMember2021-03-310001004315country:USifrs-full:PensionDefinedBenefitPlansMember2020-04-012021-03-310001004315country:USifrs-full:PensionDefinedBenefitPlansMember2019-04-012020-03-310001004315country:USifrs-full:PostemploymentMedicalDefinedBenefitPlansMember2020-04-012021-03-310001004315country:USifrs-full:PostemploymentMedicalDefinedBenefitPlansMember2019-04-012020-03-310001004315ifrs-full:PresentValueOfDefinedBenefitObligationMembercountry:GBifrs-full:PensionDefinedBenefitPlansMember2021-03-310001004315ifrs-full:PresentValueOfDefinedBenefitObligationMembercountry:GBifrs-full:PensionDefinedBenefitPlansMember2020-03-310001004315ifrs-full:PresentValueOfDefinedBenefitObligationMembercountry:USifrs-full:PensionDefinedBenefitPlansMember2021-03-310001004315ifrs-full:PresentValueOfDefinedBenefitObligationMembercountry:USifrs-full:PensionDefinedBenefitPlansMember2020-03-310001004315ifrs-full:PresentValueOfDefinedBenefitObligationMembercountry:USifrs-full:PostemploymentMedicalDefinedBenefitPlansMember2021-03-310001004315ifrs-full:PresentValueOfDefinedBenefitObligationMembercountry:USifrs-full:PostemploymentMedicalDefinedBenefitPlansMember2020-03-310001004315ifrs-full:PresentValueOfDefinedBenefitObligationMember2021-03-310001004315ifrs-full:PresentValueOfDefinedBenefitObligationMember2020-03-310001004315ifrs-full:PresentValueOfDefinedBenefitObligationMembercountry:GBifrs-full:PensionDefinedBenefitPlansMember2021-04-012022-03-310001004315ifrs-full:PresentValueOfDefinedBenefitObligationMembercountry:GBifrs-full:PensionDefinedBenefitPlansMember2020-04-012021-03-310001004315ifrs-full:PresentValueOfDefinedBenefitObligationMembercountry:USifrs-full:PensionDefinedBenefitPlansMember2021-04-012022-03-310001004315ifrs-full:PresentValueOfDefinedBenefitObligationMembercountry:USifrs-full:PensionDefinedBenefitPlansMember2020-04-012021-03-310001004315ifrs-full:PresentValueOfDefinedBenefitObligationMembercountry:USifrs-full:PostemploymentMedicalDefinedBenefitPlansMember2021-04-012022-03-310001004315ifrs-full:PresentValueOfDefinedBenefitObligationMembercountry:USifrs-full:PostemploymentMedicalDefinedBenefitPlansMember2020-04-012021-03-310001004315ifrs-full:PresentValueOfDefinedBenefitObligationMember2021-04-012022-03-310001004315ifrs-full:PresentValueOfDefinedBenefitObligationMember2020-04-012021-03-310001004315ifrs-full:PresentValueOfDefinedBenefitObligationMembercountry:GBifrs-full:PensionDefinedBenefitPlansMember2022-03-310001004315ifrs-full:PresentValueOfDefinedBenefitObligationMembercountry:USifrs-full:PensionDefinedBenefitPlansMember2022-03-310001004315ifrs-full:PresentValueOfDefinedBenefitObligationMembercountry:USifrs-full:PostemploymentMedicalDefinedBenefitPlansMember2022-03-310001004315ifrs-full:PresentValueOfDefinedBenefitObligationMember2022-03-310001004315ifrs-full:PlanAssetsMembercountry:GBifrs-full:PensionDefinedBenefitPlansMember2021-03-310001004315ifrs-full:PlanAssetsMembercountry:GBifrs-full:PensionDefinedBenefitPlansMember2020-03-310001004315ifrs-full:PlanAssetsMembercountry:USifrs-full:PensionDefinedBenefitPlansMember2021-03-310001004315ifrs-full:PlanAssetsMembercountry:USifrs-full:PensionDefinedBenefitPlansMember2020-03-310001004315ifrs-full:PlanAssetsMembercountry:USifrs-full:PostemploymentMedicalDefinedBenefitPlansMember2021-03-310001004315ifrs-full:PlanAssetsMembercountry:USifrs-full:PostemploymentMedicalDefinedBenefitPlansMember2020-03-310001004315ifrs-full:PlanAssetsMember2021-03-310001004315ifrs-full:PlanAssetsMember2020-03-310001004315ifrs-full:PlanAssetsMembercountry:GBifrs-full:PensionDefinedBenefitPlansMember2021-04-012022-03-310001004315ifrs-full:PlanAssetsMembercountry:GBifrs-full:PensionDefinedBenefitPlansMember2020-04-012021-03-310001004315ifrs-full:PlanAssetsMember2021-04-012022-03-310001004315ifrs-full:PlanAssetsMember2020-04-012021-03-310001004315ifrs-full:PlanAssetsMembercountry:GBifrs-full:PensionDefinedBenefitPlansMember2022-03-310001004315ifrs-full:PlanAssetsMembercountry:USifrs-full:PensionDefinedBenefitPlansMember2022-03-310001004315ifrs-full:PlanAssetsMembercountry:USifrs-full:PostemploymentMedicalDefinedBenefitPlansMember2022-03-310001004315ifrs-full:PlanAssetsMember2022-03-310001004315country:GBifrs-full:Level1OfFairValueHierarchyMemberifrs-full:PensionDefinedBenefitPlansMember2022-03-310001004315country:GBifrs-full:PensionDefinedBenefitPlansMemberifrs-full:Level2And3OfFairValueHierarchyMember2022-03-310001004315country:GBifrs-full:Level1OfFairValueHierarchyMemberifrs-full:PensionDefinedBenefitPlansMember2021-03-310001004315country:GBifrs-full:PensionDefinedBenefitPlansMemberifrs-full:Level2And3OfFairValueHierarchyMember2021-03-310001004315country:GBifrs-full:Level1OfFairValueHierarchyMemberifrs-full:PensionDefinedBenefitPlansMember2020-03-310001004315country:GBifrs-full:PensionDefinedBenefitPlansMemberifrs-full:Level2And3OfFairValueHierarchyMember2020-03-310001004315country:GBifrs-full:Level1OfFairValueHierarchyMemberifrs-full:PensionDefinedBenefitPlansMembernggtf:CorporateBondsMember2022-03-310001004315country:GBifrs-full:PensionDefinedBenefitPlansMembernggtf:CorporateBondsMemberifrs-full:Level2And3OfFairValueHierarchyMember2022-03-310001004315country:GBifrs-full:PensionDefinedBenefitPlansMembernggtf:CorporateBondsMember2022-03-310001004315country:GBifrs-full:Level1OfFairValueHierarchyMemberifrs-full:PensionDefinedBenefitPlansMembernggtf:CorporateBondsMember2021-03-310001004315country:GBifrs-full:PensionDefinedBenefitPlansMembernggtf:CorporateBondsMemberifrs-full:Level2And3OfFairValueHierarchyMember2021-03-310001004315country:GBifrs-full:PensionDefinedBenefitPlansMembernggtf:CorporateBondsMember2021-03-310001004315country:GBifrs-full:Level1OfFairValueHierarchyMemberifrs-full:PensionDefinedBenefitPlansMembernggtf:CorporateBondsMember2020-03-310001004315country:GBifrs-full:PensionDefinedBenefitPlansMembernggtf:CorporateBondsMemberifrs-full:Level2And3OfFairValueHierarchyMember2020-03-310001004315country:GBifrs-full:PensionDefinedBenefitPlansMembernggtf:CorporateBondsMember2020-03-310001004315country:GBifrs-full:Level1OfFairValueHierarchyMemberifrs-full:PensionDefinedBenefitPlansMembernggtf:GovernmentSecuritiesMember2022-03-310001004315country:GBifrs-full:PensionDefinedBenefitPlansMemberifrs-full:Level2And3OfFairValueHierarchyMembernggtf:GovernmentSecuritiesMember2022-03-310001004315country:GBifrs-full:PensionDefinedBenefitPlansMembernggtf:GovernmentSecuritiesMember2022-03-310001004315country:GBifrs-full:Level1OfFairValueHierarchyMemberifrs-full:PensionDefinedBenefitPlansMembernggtf:GovernmentSecuritiesMember2021-03-310001004315country:GBifrs-full:PensionDefinedBenefitPlansMemberifrs-full:Level2And3OfFairValueHierarchyMembernggtf:GovernmentSecuritiesMember2021-03-310001004315country:GBifrs-full:PensionDefinedBenefitPlansMembernggtf:GovernmentSecuritiesMember2021-03-310001004315country:GBifrs-full:Level1OfFairValueHierarchyMemberifrs-full:PensionDefinedBenefitPlansMembernggtf:GovernmentSecuritiesMember2020-03-310001004315country:GBifrs-full:PensionDefinedBenefitPlansMemberifrs-full:Level2And3OfFairValueHierarchyMembernggtf:GovernmentSecuritiesMember2020-03-310001004315country:GBifrs-full:PensionDefinedBenefitPlansMembernggtf:GovernmentSecuritiesMember2020-03-310001004315nggtf:NationalGridUKPensionSchemeMembercountry:GBifrs-full:PensionDefinedBenefitPlansMemberifrs-full:Level2And3OfFairValueHierarchyMember2022-03-310001004315nggtf:NationalGridUKPensionSchemeMembercountry:GBifrs-full:PensionDefinedBenefitPlansMemberifrs-full:Level2And3OfFairValueHierarchyMember2021-03-310001004315nggtf:NationalGridUKPensionSchemeMembercountry:GBifrs-full:PensionDefinedBenefitPlansMemberifrs-full:Level2And3OfFairValueHierarchyMember2020-03-310001004315nggtf:NationalGridUKPensionSchemeSectionAMembernggtf:PPLWPDInvestmentsLimitedWPDMembercountry:GBifrs-full:PensionDefinedBenefitPlansMember2022-03-310001004315nggtf:NationalGridUKPensionSchemeSectionAMembernggtf:PPLWPDInvestmentsLimitedWPDMembercountry:GBifrs-full:PensionDefinedBenefitPlansMember2021-03-310001004315nggtf:NationalGridUKPensionSchemeSectionAMembernggtf:PPLWPDInvestmentsLimitedWPDMembercountry:GBifrs-full:PensionDefinedBenefitPlansMember2020-03-310001004315country:USifrs-full:Level1OfFairValueHierarchyMemberifrs-full:PensionDefinedBenefitPlansMember2022-03-310001004315country:USifrs-full:PensionDefinedBenefitPlansMemberifrs-full:Level2And3OfFairValueHierarchyMember2022-03-310001004315country:USifrs-full:Level1OfFairValueHierarchyMemberifrs-full:PensionDefinedBenefitPlansMember2021-03-310001004315country:USifrs-full:PensionDefinedBenefitPlansMemberifrs-full:Level2And3OfFairValueHierarchyMember2021-03-310001004315country:USifrs-full:Level1OfFairValueHierarchyMemberifrs-full:PensionDefinedBenefitPlansMember2020-03-310001004315country:USifrs-full:PensionDefinedBenefitPlansMemberifrs-full:Level2And3OfFairValueHierarchyMember2020-03-310001004315country:USifrs-full:Level1OfFairValueHierarchyMemberifrs-full:PensionDefinedBenefitPlansMembernggtf:CorporateBondsMember2022-03-310001004315country:USifrs-full:PensionDefinedBenefitPlansMembernggtf:CorporateBondsMemberifrs-full:Level2And3OfFairValueHierarchyMember2022-03-310001004315country:USifrs-full:PensionDefinedBenefitPlansMembernggtf:CorporateBondsMember2022-03-310001004315country:USifrs-full:Level1OfFairValueHierarchyMemberifrs-full:PensionDefinedBenefitPlansMembernggtf:CorporateBondsMember2021-03-310001004315country:USifrs-full:PensionDefinedBenefitPlansMembernggtf:CorporateBondsMemberifrs-full:Level2And3OfFairValueHierarchyMember2021-03-310001004315country:USifrs-full:PensionDefinedBenefitPlansMembernggtf:CorporateBondsMember2021-03-310001004315country:USifrs-full:Level1OfFairValueHierarchyMemberifrs-full:PensionDefinedBenefitPlansMembernggtf:CorporateBondsMember2020-03-310001004315country:USifrs-full:PensionDefinedBenefitPlansMembernggtf:CorporateBondsMemberifrs-full:Level2And3OfFairValueHierarchyMember2020-03-310001004315country:USifrs-full:PensionDefinedBenefitPlansMembernggtf:CorporateBondsMember2020-03-310001004315country:USifrs-full:Level1OfFairValueHierarchyMemberifrs-full:PensionDefinedBenefitPlansMembernggtf:GovernmentSecuritiesMember2022-03-310001004315country:USifrs-full:PensionDefinedBenefitPlansMemberifrs-full:Level2And3OfFairValueHierarchyMembernggtf:GovernmentSecuritiesMember2022-03-310001004315country:USifrs-full:PensionDefinedBenefitPlansMembernggtf:GovernmentSecuritiesMember2022-03-310001004315country:USifrs-full:Level1OfFairValueHierarchyMemberifrs-full:PensionDefinedBenefitPlansMembernggtf:GovernmentSecuritiesMember2021-03-310001004315country:USifrs-full:PensionDefinedBenefitPlansMemberifrs-full:Level2And3OfFairValueHierarchyMembernggtf:GovernmentSecuritiesMember2021-03-310001004315country:USifrs-full:PensionDefinedBenefitPlansMembernggtf:GovernmentSecuritiesMember2021-03-310001004315country:USifrs-full:Level1OfFairValueHierarchyMemberifrs-full:PensionDefinedBenefitPlansMembernggtf:GovernmentSecuritiesMember2020-03-310001004315country:USifrs-full:PensionDefinedBenefitPlansMemberifrs-full:Level2And3OfFairValueHierarchyMembernggtf:GovernmentSecuritiesMember2020-03-310001004315country:USifrs-full:PensionDefinedBenefitPlansMembernggtf:GovernmentSecuritiesMember2020-03-310001004315country:USifrs-full:PostemploymentMedicalDefinedBenefitPlansMemberifrs-full:Level1OfFairValueHierarchyMember2022-03-310001004315country:USifrs-full:PostemploymentMedicalDefinedBenefitPlansMemberifrs-full:Level2And3OfFairValueHierarchyMember2022-03-310001004315country:USifrs-full:PostemploymentMedicalDefinedBenefitPlansMemberifrs-full:Level1OfFairValueHierarchyMember2021-03-310001004315country:USifrs-full:PostemploymentMedicalDefinedBenefitPlansMemberifrs-full:Level2And3OfFairValueHierarchyMember2021-03-310001004315country:USifrs-full:PostemploymentMedicalDefinedBenefitPlansMemberifrs-full:Level1OfFairValueHierarchyMember2020-03-310001004315country:USifrs-full:PostemploymentMedicalDefinedBenefitPlansMemberifrs-full:Level2And3OfFairValueHierarchyMember2020-03-310001004315country:USifrs-full:PostemploymentMedicalDefinedBenefitPlansMemberifrs-full:Level1OfFairValueHierarchyMembernggtf:CorporateBondsMember2022-03-310001004315country:USifrs-full:PostemploymentMedicalDefinedBenefitPlansMembernggtf:CorporateBondsMemberifrs-full:Level2And3OfFairValueHierarchyMember2022-03-310001004315country:USifrs-full:PostemploymentMedicalDefinedBenefitPlansMembernggtf:CorporateBondsMember2022-03-310001004315country:USifrs-full:PostemploymentMedicalDefinedBenefitPlansMemberifrs-full:Level1OfFairValueHierarchyMembernggtf:CorporateBondsMember2021-03-310001004315country:USifrs-full:PostemploymentMedicalDefinedBenefitPlansMembernggtf:CorporateBondsMemberifrs-full:Level2And3OfFairValueHierarchyMember2021-03-310001004315country:USifrs-full:PostemploymentMedicalDefinedBenefitPlansMembernggtf:CorporateBondsMember2021-03-310001004315country:USifrs-full:PostemploymentMedicalDefinedBenefitPlansMemberifrs-full:Level1OfFairValueHierarchyMembernggtf:CorporateBondsMember2020-03-310001004315country:USifrs-full:PostemploymentMedicalDefinedBenefitPlansMembernggtf:CorporateBondsMemberifrs-full:Level2And3OfFairValueHierarchyMember2020-03-310001004315country:USifrs-full:PostemploymentMedicalDefinedBenefitPlansMembernggtf:CorporateBondsMember2020-03-310001004315country:USifrs-full:PostemploymentMedicalDefinedBenefitPlansMemberifrs-full:Level1OfFairValueHierarchyMembernggtf:GovernmentSecuritiesMember2022-03-310001004315country:USifrs-full:PostemploymentMedicalDefinedBenefitPlansMemberifrs-full:Level2And3OfFairValueHierarchyMembernggtf:GovernmentSecuritiesMember2022-03-310001004315country:USifrs-full:PostemploymentMedicalDefinedBenefitPlansMembernggtf:GovernmentSecuritiesMember2022-03-310001004315country:USifrs-full:PostemploymentMedicalDefinedBenefitPlansMemberifrs-full:Level1OfFairValueHierarchyMembernggtf:GovernmentSecuritiesMember2021-03-310001004315country:USifrs-full:PostemploymentMedicalDefinedBenefitPlansMemberifrs-full:Level2And3OfFairValueHierarchyMembernggtf:GovernmentSecuritiesMember2021-03-310001004315country:USifrs-full:PostemploymentMedicalDefinedBenefitPlansMembernggtf:GovernmentSecuritiesMember2021-03-310001004315country:USifrs-full:PostemploymentMedicalDefinedBenefitPlansMemberifrs-full:Level1OfFairValueHierarchyMembernggtf:GovernmentSecuritiesMember2020-03-310001004315country:USifrs-full:PostemploymentMedicalDefinedBenefitPlansMemberifrs-full:Level2And3OfFairValueHierarchyMembernggtf:GovernmentSecuritiesMember2020-03-310001004315country:USifrs-full:PostemploymentMedicalDefinedBenefitPlansMembernggtf:GovernmentSecuritiesMember2020-03-310001004315ifrs-full:OtherEnvironmentRelatedProvisionMember2020-03-310001004315ifrs-full:ProvisionForDecommissioningRestorationAndRehabilitationCostsMember2020-03-310001004315ifrs-full:RestructuringProvisionMember2020-03-310001004315ifrs-full:MiscellaneousOtherProvisionsMember2020-03-310001004315ifrs-full:OtherEnvironmentRelatedProvisionMember2020-04-012021-03-310001004315ifrs-full:ProvisionForDecommissioningRestorationAndRehabilitationCostsMember2020-04-012021-03-310001004315ifrs-full:RestructuringProvisionMember2020-04-012021-03-310001004315ifrs-full:MiscellaneousOtherProvisionsMember2020-04-012021-03-310001004315ifrs-full:OtherEnvironmentRelatedProvisionMember2021-03-310001004315ifrs-full:ProvisionForDecommissioningRestorationAndRehabilitationCostsMember2021-03-310001004315ifrs-full:RestructuringProvisionMember2021-03-310001004315ifrs-full:MiscellaneousOtherProvisionsMember2021-03-310001004315ifrs-full:OtherEnvironmentRelatedProvisionMember2021-04-012022-03-310001004315ifrs-full:ProvisionForDecommissioningRestorationAndRehabilitationCostsMember2021-04-012022-03-310001004315ifrs-full:RestructuringProvisionMember2021-04-012022-03-310001004315ifrs-full:MiscellaneousOtherProvisionsMember2021-04-012022-03-310001004315ifrs-full:ProvisionForDecommissioningRestorationAndRehabilitationCostsMember2022-03-310001004315ifrs-full:RestructuringProvisionMember2022-03-310001004315ifrs-full:MiscellaneousOtherProvisionsMember2022-03-310001004315ifrs-full:OtherEnvironmentRelatedProvisionMembercountry:GB2022-03-310001004315ifrs-full:OtherEnvironmentRelatedProvisionMembercountry:GB2021-04-012022-03-310001004315ifrs-full:OtherEnvironmentRelatedProvisionMembercountry:GB2021-03-310001004315ifrs-full:OtherEnvironmentRelatedProvisionMembercountry:GB2020-04-012021-03-310001004315ifrs-full:OtherEnvironmentRelatedProvisionMembercountry:US2022-03-310001004315ifrs-full:OtherEnvironmentRelatedProvisionMembercountry:US2021-04-012022-03-310001004315ifrs-full:OtherEnvironmentRelatedProvisionMembercountry:US2021-03-310001004315ifrs-full:OtherEnvironmentRelatedProvisionMembercountry:US2020-04-012021-03-310001004315nggtf:ProvisionfordecommissioningAROMember2022-03-310001004315nggtf:ProvisionfordecommissioningAROMember2021-03-310001004315nggtf:LiabilityforClaimsandClaimsAdjustmentMember2022-03-310001004315nggtf:LiabilityforClaimsandClaimsAdjustmentMember2021-03-310001004315nggtf:LiabilityForInterconnectorExcessRevenuesMember2022-03-310001004315nggtf:LiabilityForInterconnectorExcessRevenuesMember2021-03-310001004315nggtf:OnerousLeaseCommitmentsAndRatesPayableOnSurplusPropertiesMember2022-03-310001004315nggtf:OnerousLeaseCommitmentsAndRatesPayableOnSurplusPropertiesMember2021-03-310001004315nggtf:EmissionsProvisionMember2022-03-310001004315nggtf:EmissionsProvisionMember2021-03-310001004315ifrs-full:ReserveOfExchangeDifferencesOnTranslationMember2019-03-310001004315ifrs-full:ReserveOfCashFlowHedgesMember2019-03-310001004315nggtf:ReserveOfCostOfHedgingMember2019-03-310001004315ifrs-full:ReserveOfGainsAndLossesFromInvestmentsInEquityInstrumentsMember2019-03-310001004315nggtf:ReserveOfGainsandLossesOnFinancialLiabilitiesMeasuredAtFairValueThroughOtherComprehensiveIncomeMember2019-03-310001004315ifrs-full:ReserveOfChangeInFairValueOfFinancialLiabilityAttributableToChangeInCreditRiskOfLiabilityMember2019-03-310001004315ifrs-full:CapitalRedemptionReserveMember2019-03-310001004315ifrs-full:MergerReserveMember2019-03-310001004315ifrs-full:ReserveOfExchangeDifferencesOnTranslationMember2019-04-012020-03-310001004315ifrs-full:ReserveOfCashFlowHedgesMember2019-04-012020-03-310001004315nggtf:ReserveOfCostOfHedgingMember2019-04-012020-03-310001004315ifrs-full:ReserveOfGainsAndLossesFromInvestmentsInEquityInstrumentsMember2019-04-012020-03-310001004315nggtf:ReserveOfGainsandLossesOnFinancialLiabilitiesMeasuredAtFairValueThroughOtherComprehensiveIncomeMember2019-04-012020-03-310001004315ifrs-full:ReserveOfChangeInFairValueOfFinancialLiabilityAttributableToChangeInCreditRiskOfLiabilityMember2019-04-012020-03-310001004315ifrs-full:ReserveOfExchangeDifferencesOnTranslationMember2020-03-310001004315ifrs-full:ReserveOfCashFlowHedgesMember2020-03-310001004315nggtf:ReserveOfCostOfHedgingMember2020-03-310001004315ifrs-full:ReserveOfGainsAndLossesFromInvestmentsInEquityInstrumentsMember2020-03-310001004315nggtf:ReserveOfGainsandLossesOnFinancialLiabilitiesMeasuredAtFairValueThroughOtherComprehensiveIncomeMember2020-03-310001004315ifrs-full:ReserveOfChangeInFairValueOfFinancialLiabilityAttributableToChangeInCreditRiskOfLiabilityMember2020-03-310001004315ifrs-full:CapitalRedemptionReserveMember2020-03-310001004315ifrs-full:MergerReserveMember2020-03-310001004315ifrs-full:ReserveOfExchangeDifferencesOnTranslationMember2020-04-012021-03-310001004315ifrs-full:ReserveOfCashFlowHedgesMember2020-04-012021-03-310001004315nggtf:ReserveOfCostOfHedgingMember2020-04-012021-03-310001004315ifrs-full:ReserveOfGainsAndLossesFromInvestmentsInEquityInstrumentsMember2020-04-012021-03-310001004315nggtf:ReserveOfGainsandLossesOnFinancialLiabilitiesMeasuredAtFairValueThroughOtherComprehensiveIncomeMember2020-04-012021-03-310001004315ifrs-full:ReserveOfChangeInFairValueOfFinancialLiabilityAttributableToChangeInCreditRiskOfLiabilityMember2020-04-012021-03-310001004315ifrs-full:ReserveOfExchangeDifferencesOnTranslationMember2021-03-310001004315ifrs-full:ReserveOfCashFlowHedgesMember2021-03-310001004315nggtf:ReserveOfCostOfHedgingMember2021-03-310001004315ifrs-full:ReserveOfGainsAndLossesFromInvestmentsInEquityInstrumentsMember2021-03-310001004315ifrs-full:ReserveOfChangeInFairValueOfFinancialLiabilityAttributableToChangeInCreditRiskOfLiabilityMember2021-03-310001004315ifrs-full:CapitalRedemptionReserveMember2021-03-310001004315ifrs-full:MergerReserveMember2021-03-310001004315ifrs-full:ReserveOfExchangeDifferencesOnTranslationMember2021-04-012022-03-310001004315ifrs-full:ReserveOfCashFlowHedgesMember2021-04-012022-03-310001004315nggtf:ReserveOfCostOfHedgingMember2021-04-012022-03-310001004315ifrs-full:ReserveOfGainsAndLossesFromInvestmentsInEquityInstrumentsMember2021-04-012022-03-310001004315nggtf:ReserveOfGainsandLossesOnFinancialLiabilitiesMeasuredAtFairValueThroughOtherComprehensiveIncomeMember2021-04-012022-03-310001004315ifrs-full:ReserveOfChangeInFairValueOfFinancialLiabilityAttributableToChangeInCreditRiskOfLiabilityMember2021-04-012022-03-310001004315ifrs-full:ReserveOfExchangeDifferencesOnTranslationMember2022-03-310001004315ifrs-full:ReserveOfCashFlowHedgesMember2022-03-310001004315nggtf:ReserveOfCostOfHedgingMember2022-03-310001004315ifrs-full:ReserveOfGainsAndLossesFromInvestmentsInEquityInstrumentsMember2022-03-310001004315nggtf:ReserveOfGainsandLossesOnFinancialLiabilitiesMeasuredAtFairValueThroughOtherComprehensiveIncomeMember2022-03-310001004315ifrs-full:ReserveOfChangeInFairValueOfFinancialLiabilityAttributableToChangeInCreditRiskOfLiabilityMember2022-03-310001004315ifrs-full:CapitalRedemptionReserveMember2022-03-310001004315ifrs-full:MergerReserveMember2022-03-310001004315nggtf:PPLWPDInvestmentsLimitedWPDMember2021-04-012022-03-310001004315nggtf:NoncurrentAssetsMember2022-03-310001004315nggtf:CurrentAssetsMember2022-03-310001004315nggtf:CurrentLiabilitiesMember2022-03-310001004315nggtf:BorrowingsMember2021-04-012022-03-310001004315nggtf:BorrowingsMember2020-04-012021-03-310001004315nggtf:BorrowingsMember2019-04-012020-03-310001004315nggtf:FinancingDerivativesMember2021-04-012022-03-310001004315nggtf:FinancingDerivativesMember2020-04-012021-03-310001004315nggtf:FinancingDerivativesMember2019-04-012020-03-310001004315nggtf:BorrowingsMember2019-03-310001004315nggtf:FinancingDerivativesMember2019-03-310001004315nggtf:BorrowingsMember2020-03-310001004315nggtf:FinancingDerivativesMember2020-03-310001004315nggtf:BorrowingsMember2021-03-310001004315nggtf:FinancingDerivativesMember2021-03-310001004315nggtf:PPLWPDInvestmentsLimitedWPDMembernggtf:BorrowingsMember2021-04-012022-03-310001004315nggtf:FinancingDerivativesMembernggtf:PPLWPDInvestmentsLimitedWPDMember2021-04-012022-03-310001004315nggtf:BorrowingsMember2022-03-310001004315nggtf:FinancingDerivativesMember2022-03-310001004315nggtf:GuaranteeOfSubleaseForUSPropertyExpires2040Member2022-03-310001004315nggtf:GuaranteeOfSubleaseForUSPropertyExpires2040Member2021-03-310001004315nggtf:GuaranteesOfCertainObligationsOfGrainLNGImportTerminalExpireUpTo2025Member2022-03-310001004315nggtf:GuaranteesOfCertainObligationsOfGrainLNGImportTerminalExpireUpTo2025Member2021-03-310001004315nggtf:GuaranteesOfCertainObligationsForConstructionOfHVDCWestCoastLinkExpectedExpiry2059Member2022-03-310001004315nggtf:GuaranteesOfCertainObligationsForConstructionOfHVDCWestCoastLinkExpectedExpiry2059Member2021-03-310001004315nggtf:GuaranteesOfCertainObligationsOfNationalGridNorthSeaLinkLimitedVariousExpiryDatesMember2022-03-310001004315nggtf:GuaranteesOfCertainObligationsOfNationalGridNorthSeaLinkLimitedVariousExpiryDatesMember2021-03-310001004315nggtf:GuaranteesOfCertainObligationsOfStWilliamHomesLLPVariousExpiryDatesMember2022-03-310001004315nggtf:GuaranteesOfCertainObligationsOfStWilliamHomesLLPVariousExpiryDatesMember2021-03-310001004315nggtf:GuaranteesOfCertainObligationsOfNationalGridIFA2ExpectedExpiry2022Member2022-03-310001004315nggtf:GuaranteesOfCertainObligationsOfNationalGridIFA2ExpectedExpiry2022Member2021-03-310001004315nggtf:GuaranteesOfCertainObligationsofNationalGridVikingLinkLimitedexpectedexpiry2024Member2022-03-310001004315nggtf:GuaranteesOfCertainObligationsofNationalGridVikingLinkLimitedexpectedexpiry2024Member2021-03-310001004315nggtf:OtherGuaranteesAndLettersOfCreditVariousExpiryDatesMember2022-03-310001004315nggtf:OtherGuaranteesAndLettersOfCreditVariousExpiryDatesMember2021-03-310001004315nggtf:UKGasTransmissionMember2022-03-310001004315nggtf:PensionPlanMember2021-04-012022-03-310001004315nggtf:PensionPlanMember2020-04-012021-03-310001004315nggtf:PensionPlanMember2019-04-012020-03-310001004315ifrs-full:JointVenturesWhereEntityIsVenturerMember2021-04-012022-03-310001004315ifrs-full:JointVenturesWhereEntityIsVenturerMember2020-04-012021-03-310001004315ifrs-full:JointVenturesWhereEntityIsVenturerMember2019-04-012020-03-310001004315ifrs-full:AssociatesMember2021-04-012022-03-310001004315ifrs-full:AssociatesMember2020-04-012021-03-310001004315ifrs-full:AssociatesMember2019-04-012020-03-310001004315ifrs-full:JointVenturesWhereEntityIsVenturerMember2022-03-310001004315ifrs-full:JointVenturesWhereEntityIsVenturerMember2021-03-310001004315ifrs-full:JointVenturesWhereEntityIsVenturerMember2020-03-310001004315ifrs-full:AssociatesMember2022-03-310001004315ifrs-full:AssociatesMember2021-03-310001004315ifrs-full:AssociatesMember2020-03-310001004315nggtf:EmeraldEnergyVentureLLCMemberifrs-full:JointVenturesWhereEntityIsVenturerMember2021-04-012022-03-310001004315nggtf:EmeraldEnergyVentureLLCMemberifrs-full:JointVenturesWhereEntityIsVenturerMember2020-04-012021-03-310001004315nggtf:EmeraldEnergyVentureLLCMemberifrs-full:JointVenturesWhereEntityIsVenturerMember2019-04-012020-03-310001004315nggtf:NGETSPTUpgradesLimitedMemberifrs-full:JointVenturesWhereEntityIsVenturerMember2021-04-012022-03-310001004315nggtf:NGETSPTUpgradesLimitedMemberifrs-full:JointVenturesWhereEntityIsVenturerMember2020-04-012021-03-310001004315nggtf:NGETSPTUpgradesLimitedMemberifrs-full:JointVenturesWhereEntityIsVenturerMember2019-04-012020-03-310001004315nggtf:StWilliamHomesLLPMemberifrs-full:JointVenturesWhereEntityIsVenturerMember2021-04-012022-03-310001004315nggtf:StWilliamHomesLLPMemberifrs-full:JointVenturesWhereEntityIsVenturerMember2020-04-012021-03-310001004315nggtf:StWilliamHomesLLPMemberifrs-full:JointVenturesWhereEntityIsVenturerMember2019-04-012020-03-310001004315ifrs-full:AssociatesMembernggtf:QuadgasHoldCoLimitedMember2019-06-012019-06-300001004315ifrs-full:AssociatesMembernggtf:QuadgasHoldCoLimitedMember2019-04-012020-03-310001004315nggtf:MillenniumPipelineCompanyLLCMemberifrs-full:AssociatesMember2021-04-012022-03-310001004315nggtf:MillenniumPipelineCompanyLLCMemberifrs-full:AssociatesMember2020-04-012021-03-310001004315nggtf:MillenniumPipelineCompanyLLCMemberifrs-full:AssociatesMember2019-04-012020-03-310001004315nggtf:BritNedDevelopmentLimitedMemberifrs-full:JointVenturesWhereEntityIsVenturerMember2021-04-012022-03-310001004315nggtf:BritNedDevelopmentLimitedMemberifrs-full:JointVenturesWhereEntityIsVenturerMember2020-04-012021-03-310001004315nggtf:BritNedDevelopmentLimitedMemberifrs-full:JointVenturesWhereEntityIsVenturerMember2019-04-012020-03-310001004315nggtf:EmeraldEnergyVentureLLCMemberifrs-full:JointVenturesWhereEntityIsVenturerMember2022-03-310001004315nggtf:EmeraldEnergyVentureLLCMemberifrs-full:JointVenturesWhereEntityIsVenturerMember2021-03-310001004315nggtf:EmeraldEnergyVentureLLCMemberifrs-full:JointVenturesWhereEntityIsVenturerMember2020-03-310001004315nggtf:StWilliamHomesLLPMemberifrs-full:JointVenturesWhereEntityIsVenturerMember2021-03-310001004315nggtf:StWilliamHomesLLPMemberifrs-full:JointVenturesWhereEntityIsVenturerMember2020-03-310001004315stpr:NY2022-03-310001004315nggtf:NemoLinkLimitedMemberifrs-full:JointVenturesWhereEntityIsVenturerMember2021-04-012022-03-310001004315nggtf:NemoLinkLimitedMemberifrs-full:JointVenturesWhereEntityIsVenturerMember2020-04-012021-03-310001004315nggtf:NemoLinkLimitedMemberifrs-full:JointVenturesWhereEntityIsVenturerMember2019-04-012020-03-310001004315nggtf:AAAG7SovereignEntitiesMember2022-03-310001004315ifrs-full:LaterThanOneYearMembernggtf:AAAG7SovereignEntitiesMember2022-03-310001004315nggtf:AAAInvestmentVehiclesMember2022-03-310001004315ifrs-full:LaterThanOneYearMembernggtf:AAAInvestmentVehiclesMember2022-03-310001004315nggtf:AAAInstitutionsandNonG7SovereignEntitiesMember2022-03-310001004315ifrs-full:LaterThanOneYearMembernggtf:AAAInstitutionsandNonG7SovereignEntitiesMember2022-03-310001004315nggtf:AAPlusG7SovereignEntitiesMember2022-03-310001004315ifrs-full:LaterThanOneYearMembernggtf:AAPlusG7SovereignEntitiesMember2022-03-310001004315nggtf:AAInstitutionsMemberifrs-full:BottomOfRangeMember2022-03-310001004315ifrs-full:TopOfRangeMembernggtf:AAInstitutionsMember2022-03-310001004315ifrs-full:LaterThanOneYearMembernggtf:AAInstitutionsMemberifrs-full:BottomOfRangeMember2022-03-310001004315ifrs-full:TopOfRangeMemberifrs-full:LaterThanOneYearMembernggtf:AAInstitutionsMember2022-03-310001004315ifrs-full:BottomOfRangeMembernggtf:AInstitutionsMember2022-03-310001004315ifrs-full:TopOfRangeMembernggtf:AInstitutionsMember2022-03-310001004315ifrs-full:LaterThanOneYearMemberifrs-full:BottomOfRangeMembernggtf:AInstitutionsMember2022-03-310001004315ifrs-full:TopOfRangeMemberifrs-full:LaterThanOneYearMembernggtf:AInstitutionsMember2022-03-310001004315ifrs-full:CreditRiskMembernggtf:BankAccountandBankOverdraftMember2022-03-310001004315ifrs-full:CreditRiskMembernggtf:BankAccountandBankOverdraftMember2021-03-310001004315ifrs-full:CreditRiskMembernggtf:FinancingDerivativesMember2022-03-310001004315ifrs-full:CreditRiskMembernggtf:CommodityDerivativesMember2022-03-310001004315ifrs-full:CreditRiskMember2022-03-310001004315ifrs-full:CreditRiskMembernggtf:FinancingDerivativesMember2022-03-310001004315ifrs-full:CreditRiskMembernggtf:CommodityDerivativesMember2022-03-310001004315ifrs-full:CreditRiskMembernggtf:FinancingDerivativesMember2021-03-310001004315ifrs-full:CreditRiskMembernggtf:CommodityDerivativesMember2021-03-310001004315ifrs-full:CreditRiskMember2021-03-310001004315ifrs-full:CreditRiskMembernggtf:FinancingDerivativesMember2021-03-310001004315ifrs-full:CreditRiskMembernggtf:CommodityDerivativesMember2021-03-310001004315ifrs-full:LiquidityRiskMemberifrs-full:NotLaterThanOneYearMember2022-03-310001004315ifrs-full:LiquidityRiskMemberifrs-full:LaterThanOneYearAndNotLaterThanTwoYearsMember2022-03-310001004315ifrs-full:LaterThanTwoYearsAndNotLaterThanThreeYearsMemberifrs-full:LiquidityRiskMember2022-03-310001004315ifrs-full:LaterThanThreeYearsMemberifrs-full:LiquidityRiskMember2022-03-310001004315ifrs-full:LiquidityRiskMember2022-03-310001004315ifrs-full:LiquidityRiskMemberifrs-full:NotLaterThanOneYearMembernggtf:FinancingDerivativesReceiptsMember2022-03-310001004315ifrs-full:LiquidityRiskMemberifrs-full:LaterThanOneYearAndNotLaterThanTwoYearsMembernggtf:FinancingDerivativesReceiptsMember2022-03-310001004315ifrs-full:LiquidityRiskMemberifrs-full:LaterThanTwoYearsAndNotLaterThanThreeYearsMembernggtf:FinancingDerivativesReceiptsMember2022-03-310001004315ifrs-full:LaterThanThreeYearsMemberifrs-full:LiquidityRiskMembernggtf:FinancingDerivativesReceiptsMember2022-03-310001004315ifrs-full:LiquidityRiskMembernggtf:FinancingDerivativesReceiptsMember2022-03-310001004315ifrs-full:LiquidityRiskMembernggtf:FinancingDerivativesPaymentsMemberifrs-full:NotLaterThanOneYearMember2022-03-310001004315ifrs-full:LiquidityRiskMembernggtf:FinancingDerivativesPaymentsMemberifrs-full:LaterThanOneYearAndNotLaterThanTwoYearsMember2022-03-310001004315ifrs-full:LiquidityRiskMemberifrs-full:LaterThanTwoYearsAndNotLaterThanThreeYearsMembernggtf:FinancingDerivativesPaymentsMember2022-03-310001004315ifrs-full:LaterThanThreeYearsMemberifrs-full:LiquidityRiskMembernggtf:FinancingDerivativesPaymentsMember2022-03-310001004315ifrs-full:LiquidityRiskMembernggtf:FinancingDerivativesPaymentsMember2022-03-310001004315ifrs-full:LiquidityRiskMemberifrs-full:NotLaterThanOneYearMembernggtf:CommodityDerivativesReceiptsMember2022-03-310001004315ifrs-full:LiquidityRiskMembernggtf:CommodityDerivativesReceiptsMemberifrs-full:LaterThanOneYearAndNotLaterThanTwoYearsMember2022-03-310001004315ifrs-full:LiquidityRiskMemberifrs-full:LaterThanTwoYearsAndNotLaterThanThreeYearsMembernggtf:CommodityDerivativesReceiptsMember2022-03-310001004315ifrs-full:LaterThanThreeYearsMemberifrs-full:LiquidityRiskMembernggtf:CommodityDerivativesReceiptsMember2022-03-310001004315ifrs-full:LiquidityRiskMembernggtf:CommodityDerivativesReceiptsMember2022-03-310001004315ifrs-full:LiquidityRiskMemberifrs-full:NotLaterThanOneYearMembernggtf:CommodityDerivativesPaymentsMember2022-03-310001004315ifrs-full:LiquidityRiskMembernggtf:CommodityDerivativesPaymentsMemberifrs-full:LaterThanOneYearAndNotLaterThanTwoYearsMember2022-03-310001004315ifrs-full:LiquidityRiskMemberifrs-full:LaterThanTwoYearsAndNotLaterThanThreeYearsMembernggtf:CommodityDerivativesPaymentsMember2022-03-310001004315ifrs-full:LaterThanThreeYearsMemberifrs-full:LiquidityRiskMembernggtf:CommodityDerivativesPaymentsMember2022-03-310001004315ifrs-full:LiquidityRiskMembernggtf:CommodityDerivativesPaymentsMember2022-03-310001004315ifrs-full:LiquidityRiskMemberifrs-full:NotLaterThanOneYearMembernggtf:FinancingDerivativesReceiptsMember2022-03-310001004315ifrs-full:LiquidityRiskMembernggtf:FinancingDerivativesReceiptsMemberifrs-full:LaterThanOneYearAndNotLaterThanTwoYearsMember2022-03-310001004315ifrs-full:LiquidityRiskMemberifrs-full:LaterThanTwoYearsAndNotLaterThanThreeYearsMembernggtf:FinancingDerivativesReceiptsMember2022-03-310001004315ifrs-full:LaterThanThreeYearsMemberifrs-full:LiquidityRiskMembernggtf:FinancingDerivativesReceiptsMember2022-03-310001004315ifrs-full:LiquidityRiskMembernggtf:FinancingDerivativesReceiptsMember2022-03-310001004315nggtf:FinancingDerivativesPaymentsMemberifrs-full:LiquidityRiskMemberifrs-full:NotLaterThanOneYearMember2022-03-310001004315nggtf:FinancingDerivativesPaymentsMemberifrs-full:LiquidityRiskMemberifrs-full:LaterThanOneYearAndNotLaterThanTwoYearsMember2022-03-310001004315nggtf:FinancingDerivativesPaymentsMemberifrs-full:LiquidityRiskMemberifrs-full:LaterThanTwoYearsAndNotLaterThanThreeYearsMember2022-03-310001004315nggtf:FinancingDerivativesPaymentsMemberifrs-full:LaterThanThreeYearsMemberifrs-full:LiquidityRiskMember2022-03-310001004315nggtf:FinancingDerivativesPaymentsMemberifrs-full:LiquidityRiskMember2022-03-310001004315ifrs-full:LiquidityRiskMemberifrs-full:NotLaterThanOneYearMembernggtf:CommodityDerivativesReceiptsMember2022-03-310001004315ifrs-full:LiquidityRiskMembernggtf:CommodityDerivativesReceiptsMemberifrs-full:LaterThanOneYearAndNotLaterThanTwoYearsMember2022-03-310001004315ifrs-full:LiquidityRiskMemberifrs-full:LaterThanTwoYearsAndNotLaterThanThreeYearsMembernggtf:CommodityDerivativesReceiptsMember2022-03-310001004315ifrs-full:LaterThanThreeYearsMemberifrs-full:LiquidityRiskMembernggtf:CommodityDerivativesReceiptsMember2022-03-310001004315ifrs-full:LiquidityRiskMembernggtf:CommodityDerivativesReceiptsMember2022-03-310001004315ifrs-full:LiquidityRiskMembernggtf:CommodityDerivativesPaymentsMemberifrs-full:NotLaterThanOneYearMember2022-03-310001004315ifrs-full:LiquidityRiskMembernggtf:CommodityDerivativesPaymentsMemberifrs-full:LaterThanOneYearAndNotLaterThanTwoYearsMember2022-03-310001004315ifrs-full:LiquidityRiskMemberifrs-full:LaterThanTwoYearsAndNotLaterThanThreeYearsMembernggtf:CommodityDerivativesPaymentsMember2022-03-310001004315ifrs-full:LaterThanThreeYearsMemberifrs-full:LiquidityRiskMembernggtf:CommodityDerivativesPaymentsMember2022-03-310001004315ifrs-full:LiquidityRiskMembernggtf:CommodityDerivativesPaymentsMember2022-03-310001004315ifrs-full:LiquidityRiskMemberifrs-full:NotLaterThanOneYearMember2021-03-310001004315ifrs-full:LiquidityRiskMemberifrs-full:LaterThanOneYearAndNotLaterThanTwoYearsMember2021-03-310001004315ifrs-full:LaterThanTwoYearsAndNotLaterThanThreeYearsMemberifrs-full:LiquidityRiskMember2021-03-310001004315ifrs-full:LaterThanThreeYearsMemberifrs-full:LiquidityRiskMember2021-03-310001004315ifrs-full:LiquidityRiskMember2021-03-310001004315ifrs-full:LiquidityRiskMemberifrs-full:NotLaterThanOneYearMembernggtf:FinancingDerivativesReceiptsMember2021-03-310001004315ifrs-full:LiquidityRiskMemberifrs-full:LaterThanOneYearAndNotLaterThanTwoYearsMembernggtf:FinancingDerivativesReceiptsMember2021-03-310001004315ifrs-full:LiquidityRiskMemberifrs-full:LaterThanTwoYearsAndNotLaterThanThreeYearsMembernggtf:FinancingDerivativesReceiptsMember2021-03-310001004315ifrs-full:LaterThanThreeYearsMemberifrs-full:LiquidityRiskMembernggtf:FinancingDerivativesReceiptsMember2021-03-310001004315ifrs-full:LiquidityRiskMembernggtf:FinancingDerivativesReceiptsMember2021-03-310001004315ifrs-full:LiquidityRiskMembernggtf:FinancingDerivativesPaymentsMemberifrs-full:NotLaterThanOneYearMember2021-03-310001004315ifrs-full:LiquidityRiskMembernggtf:FinancingDerivativesPaymentsMemberifrs-full:LaterThanOneYearAndNotLaterThanTwoYearsMember2021-03-310001004315ifrs-full:LiquidityRiskMemberifrs-full:LaterThanTwoYearsAndNotLaterThanThreeYearsMembernggtf:FinancingDerivativesPaymentsMember2021-03-310001004315ifrs-full:LaterThanThreeYearsMemberifrs-full:LiquidityRiskMembernggtf:FinancingDerivativesPaymentsMember2021-03-310001004315ifrs-full:LiquidityRiskMembernggtf:FinancingDerivativesPaymentsMember2021-03-310001004315ifrs-full:LiquidityRiskMemberifrs-full:NotLaterThanOneYearMembernggtf:CommodityDerivativesReceiptsMember2021-03-310001004315ifrs-full:LiquidityRiskMembernggtf:CommodityDerivativesReceiptsMemberifrs-full:LaterThanOneYearAndNotLaterThanTwoYearsMember2021-03-310001004315ifrs-full:LiquidityRiskMemberifrs-full:LaterThanTwoYearsAndNotLaterThanThreeYearsMembernggtf:CommodityDerivativesReceiptsMember2021-03-310001004315ifrs-full:LaterThanThreeYearsMemberifrs-full:LiquidityRiskMembernggtf:CommodityDerivativesReceiptsMember2021-03-310001004315ifrs-full:LiquidityRiskMembernggtf:CommodityDerivativesReceiptsMember2021-03-310001004315ifrs-full:LiquidityRiskMemberifrs-full:NotLaterThanOneYearMembernggtf:CommodityDerivativesPaymentsMember2021-03-310001004315ifrs-full:LiquidityRiskMembernggtf:CommodityDerivativesPaymentsMemberifrs-full:LaterThanOneYearAndNotLaterThanTwoYearsMember2021-03-310001004315ifrs-full:LiquidityRiskMemberifrs-full:LaterThanTwoYearsAndNotLaterThanThreeYearsMembernggtf:CommodityDerivativesPaymentsMember2021-03-310001004315ifrs-full:LaterThanThreeYearsMemberifrs-full:LiquidityRiskMembernggtf:CommodityDerivativesPaymentsMember2021-03-310001004315ifrs-full:LiquidityRiskMembernggtf:CommodityDerivativesPaymentsMember2021-03-310001004315ifrs-full:LiquidityRiskMemberifrs-full:NotLaterThanOneYearMembernggtf:FinancingDerivativesReceiptsMember2021-03-310001004315ifrs-full:LiquidityRiskMembernggtf:FinancingDerivativesReceiptsMemberifrs-full:LaterThanOneYearAndNotLaterThanTwoYearsMember2021-03-310001004315ifrs-full:LiquidityRiskMemberifrs-full:LaterThanTwoYearsAndNotLaterThanThreeYearsMembernggtf:FinancingDerivativesReceiptsMember2021-03-310001004315ifrs-full:LaterThanThreeYearsMemberifrs-full:LiquidityRiskMembernggtf:FinancingDerivativesReceiptsMember2021-03-310001004315ifrs-full:LiquidityRiskMembernggtf:FinancingDerivativesReceiptsMember2021-03-310001004315nggtf:FinancingDerivativesPaymentsMemberifrs-full:LiquidityRiskMemberifrs-full:NotLaterThanOneYearMember2021-03-310001004315nggtf:FinancingDerivativesPaymentsMemberifrs-full:LiquidityRiskMemberifrs-full:LaterThanOneYearAndNotLaterThanTwoYearsMember2021-03-310001004315nggtf:FinancingDerivativesPaymentsMemberifrs-full:LiquidityRiskMemberifrs-full:LaterThanTwoYearsAndNotLaterThanThreeYearsMember2021-03-310001004315nggtf:FinancingDerivativesPaymentsMemberifrs-full:LaterThanThreeYearsMemberifrs-full:LiquidityRiskMember2021-03-310001004315nggtf:FinancingDerivativesPaymentsMemberifrs-full:LiquidityRiskMember2021-03-310001004315ifrs-full:LiquidityRiskMemberifrs-full:NotLaterThanOneYearMembernggtf:CommodityDerivativesReceiptsMember2021-03-310001004315ifrs-full:LiquidityRiskMembernggtf:CommodityDerivativesReceiptsMemberifrs-full:LaterThanOneYearAndNotLaterThanTwoYearsMember2021-03-310001004315ifrs-full:LiquidityRiskMemberifrs-full:LaterThanTwoYearsAndNotLaterThanThreeYearsMembernggtf:CommodityDerivativesReceiptsMember2021-03-310001004315ifrs-full:LaterThanThreeYearsMemberifrs-full:LiquidityRiskMembernggtf:CommodityDerivativesReceiptsMember2021-03-310001004315ifrs-full:LiquidityRiskMembernggtf:CommodityDerivativesReceiptsMember2021-03-310001004315ifrs-full:LiquidityRiskMembernggtf:CommodityDerivativesPaymentsMemberifrs-full:NotLaterThanOneYearMember2021-03-310001004315ifrs-full:LiquidityRiskMembernggtf:CommodityDerivativesPaymentsMemberifrs-full:LaterThanOneYearAndNotLaterThanTwoYearsMember2021-03-310001004315ifrs-full:LiquidityRiskMemberifrs-full:LaterThanTwoYearsAndNotLaterThanThreeYearsMembernggtf:CommodityDerivativesPaymentsMember2021-03-310001004315ifrs-full:LaterThanThreeYearsMemberifrs-full:LiquidityRiskMembernggtf:CommodityDerivativesPaymentsMember2021-03-310001004315ifrs-full:LiquidityRiskMembernggtf:CommodityDerivativesPaymentsMember2021-03-310001004315nggtf:CashandCashEquivalentsMemberifrs-full:CurrencyRiskMembercurrency:GBP2022-03-310001004315currency:EURnggtf:CashandCashEquivalentsMemberifrs-full:CurrencyRiskMember2022-03-310001004315nggtf:CashandCashEquivalentsMembercurrency:USDifrs-full:CurrencyRiskMember2022-03-310001004315nggtf:CashandCashEquivalentsMembernggtf:OtherCurrencyMemberifrs-full:CurrencyRiskMember2022-03-310001004315nggtf:CashandCashEquivalentsMemberifrs-full:CurrencyRiskMember2022-03-310001004315nggtf:CashandCashEquivalentsMemberifrs-full:CurrencyRiskMembercurrency:GBP2021-03-310001004315currency:EURnggtf:CashandCashEquivalentsMemberifrs-full:CurrencyRiskMember2021-03-310001004315nggtf:CashandCashEquivalentsMembercurrency:USDifrs-full:CurrencyRiskMember2021-03-310001004315nggtf:CashandCashEquivalentsMembernggtf:OtherCurrencyMemberifrs-full:CurrencyRiskMember2021-03-310001004315nggtf:CashandCashEquivalentsMemberifrs-full:CurrencyRiskMember2021-03-310001004315nggtf:FinancialInvestmentsMemberifrs-full:CurrencyRiskMembercurrency:GBP2022-03-310001004315nggtf:FinancialInvestmentsMembercurrency:EURifrs-full:CurrencyRiskMember2022-03-310001004315nggtf:FinancialInvestmentsMembercurrency:USDifrs-full:CurrencyRiskMember2022-03-310001004315nggtf:FinancialInvestmentsMembernggtf:OtherCurrencyMemberifrs-full:CurrencyRiskMember2022-03-310001004315nggtf:FinancialInvestmentsMemberifrs-full:CurrencyRiskMember2022-03-310001004315nggtf:FinancialInvestmentsMemberifrs-full:CurrencyRiskMembercurrency:GBP2021-03-310001004315nggtf:FinancialInvestmentsMembercurrency:EURifrs-full:CurrencyRiskMember2021-03-310001004315nggtf:FinancialInvestmentsMembercurrency:USDifrs-full:CurrencyRiskMember2021-03-310001004315nggtf:FinancialInvestmentsMembernggtf:OtherCurrencyMemberifrs-full:CurrencyRiskMember2021-03-310001004315nggtf:FinancialInvestmentsMemberifrs-full:CurrencyRiskMember2021-03-310001004315ifrs-full:CurrencyRiskMembercurrency:GBPnggtf:Borrowings1Member2022-03-310001004315currency:EURifrs-full:CurrencyRiskMembernggtf:Borrowings1Member2022-03-310001004315currency:USDifrs-full:CurrencyRiskMembernggtf:Borrowings1Member2022-03-310001004315nggtf:OtherCurrencyMemberifrs-full:CurrencyRiskMembernggtf:Borrowings1Member2022-03-310001004315nggtf:Borrowings1Memberifrs-full:CurrencyRiskMember2022-03-310001004315ifrs-full:CurrencyRiskMembercurrency:GBPnggtf:Borrowings1Member2021-03-310001004315currency:EURifrs-full:CurrencyRiskMembernggtf:Borrowings1Member2021-03-310001004315currency:USDifrs-full:CurrencyRiskMembernggtf:Borrowings1Member2021-03-310001004315nggtf:OtherCurrencyMemberifrs-full:CurrencyRiskMembernggtf:Borrowings1Member2021-03-310001004315nggtf:Borrowings1Memberifrs-full:CurrencyRiskMember2021-03-310001004315nggtf:PrederivativePositionMemberifrs-full:CurrencyRiskMembercurrency:GBP2022-03-310001004315nggtf:PrederivativePositionMembercurrency:EURifrs-full:CurrencyRiskMember2022-03-310001004315nggtf:PrederivativePositionMembercurrency:USDifrs-full:CurrencyRiskMember2022-03-310001004315nggtf:PrederivativePositionMembernggtf:OtherCurrencyMemberifrs-full:CurrencyRiskMember2022-03-310001004315nggtf:PrederivativePositionMemberifrs-full:CurrencyRiskMember2022-03-310001004315nggtf:PrederivativePositionMemberifrs-full:CurrencyRiskMembercurrency:GBP2021-03-310001004315nggtf:PrederivativePositionMembercurrency:EURifrs-full:CurrencyRiskMember2021-03-310001004315nggtf:PrederivativePositionMembercurrency:USDifrs-full:CurrencyRiskMember2021-03-310001004315nggtf:PrederivativePositionMembernggtf:OtherCurrencyMemberifrs-full:CurrencyRiskMember2021-03-310001004315nggtf:PrederivativePositionMemberifrs-full:CurrencyRiskMember2021-03-310001004315ifrs-full:CurrencyRiskMembercurrency:GBPnggtf:FinancingDerivativesMember2022-03-310001004315currency:EURifrs-full:CurrencyRiskMembernggtf:FinancingDerivativesMember2022-03-310001004315currency:USDifrs-full:CurrencyRiskMembernggtf:FinancingDerivativesMember2022-03-310001004315nggtf:OtherCurrencyMemberifrs-full:CurrencyRiskMembernggtf:FinancingDerivativesMember2022-03-310001004315ifrs-full:CurrencyRiskMembernggtf:FinancingDerivativesMember2022-03-310001004315ifrs-full:CurrencyRiskMembercurrency:GBPnggtf:FinancingDerivativesMember2021-03-310001004315currency:EURifrs-full:CurrencyRiskMembernggtf:FinancingDerivativesMember2021-03-310001004315currency:USDifrs-full:CurrencyRiskMembernggtf:FinancingDerivativesMember2021-03-310001004315nggtf:OtherCurrencyMemberifrs-full:CurrencyRiskMembernggtf:FinancingDerivativesMember2021-03-310001004315ifrs-full:CurrencyRiskMembernggtf:FinancingDerivativesMember2021-03-310001004315ifrs-full:CurrencyRiskMembercurrency:GBP2022-03-310001004315currency:EURifrs-full:CurrencyRiskMember2022-03-310001004315currency:USDifrs-full:CurrencyRiskMember2022-03-310001004315nggtf:OtherCurrencyMemberifrs-full:CurrencyRiskMember2022-03-310001004315ifrs-full:CurrencyRiskMember2022-03-310001004315ifrs-full:CurrencyRiskMembercurrency:GBP2021-03-310001004315currency:EURifrs-full:CurrencyRiskMember2021-03-310001004315currency:USDifrs-full:CurrencyRiskMember2021-03-310001004315nggtf:OtherCurrencyMemberifrs-full:CurrencyRiskMember2021-03-310001004315ifrs-full:CurrencyRiskMember2021-03-310001004315ifrs-full:CurrencyRiskMembercurrency:GBPnggtf:TradeandOtherReceivablesMember2022-03-310001004315currency:EURifrs-full:CurrencyRiskMembernggtf:TradeandOtherReceivablesMember2022-03-310001004315currency:USDifrs-full:CurrencyRiskMembernggtf:TradeandOtherReceivablesMember2022-03-310001004315nggtf:OtherCurrencyMemberifrs-full:CurrencyRiskMembernggtf:TradeandOtherReceivablesMember2022-03-310001004315ifrs-full:CurrencyRiskMembernggtf:TradeandOtherReceivablesMember2022-03-310001004315ifrs-full:CurrencyRiskMembercurrency:GBPnggtf:TradeandOtherReceivablesMember2021-03-310001004315currency:EURifrs-full:CurrencyRiskMembernggtf:TradeandOtherReceivablesMember2021-03-310001004315currency:USDifrs-full:CurrencyRiskMembernggtf:TradeandOtherReceivablesMember2021-03-310001004315nggtf:OtherCurrencyMemberifrs-full:CurrencyRiskMembernggtf:TradeandOtherReceivablesMember2021-03-310001004315ifrs-full:CurrencyRiskMembernggtf:TradeandOtherReceivablesMember2021-03-310001004315nggtf:TradeAndOtherPayablesMemberifrs-full:CurrencyRiskMembercurrency:GBP2022-03-310001004315nggtf:TradeAndOtherPayablesMembercurrency:EURifrs-full:CurrencyRiskMember2022-03-310001004315nggtf:TradeAndOtherPayablesMembercurrency:USDifrs-full:CurrencyRiskMember2022-03-310001004315nggtf:TradeAndOtherPayablesMembernggtf:OtherCurrencyMemberifrs-full:CurrencyRiskMember2022-03-310001004315nggtf:TradeAndOtherPayablesMemberifrs-full:CurrencyRiskMember2022-03-310001004315nggtf:TradeAndOtherPayablesMemberifrs-full:CurrencyRiskMembercurrency:GBP2021-03-310001004315nggtf:TradeAndOtherPayablesMembercurrency:EURifrs-full:CurrencyRiskMember2021-03-310001004315nggtf:TradeAndOtherPayablesMembercurrency:USDifrs-full:CurrencyRiskMember2021-03-310001004315nggtf:TradeAndOtherPayablesMembernggtf:OtherCurrencyMemberifrs-full:CurrencyRiskMember2021-03-310001004315nggtf:TradeAndOtherPayablesMemberifrs-full:CurrencyRiskMember2021-03-310001004315ifrs-full:CurrencyRiskMembercurrency:GBPnggtf:NonCurrentLiabilitiesMember2022-03-310001004315currency:EURifrs-full:CurrencyRiskMembernggtf:NonCurrentLiabilitiesMember2022-03-310001004315currency:USDifrs-full:CurrencyRiskMembernggtf:NonCurrentLiabilitiesMember2022-03-310001004315nggtf:OtherCurrencyMemberifrs-full:CurrencyRiskMembernggtf:NonCurrentLiabilitiesMember2022-03-310001004315ifrs-full:CurrencyRiskMembernggtf:NonCurrentLiabilitiesMember2022-03-310001004315ifrs-full:CurrencyRiskMembercurrency:GBPnggtf:NonCurrentLiabilitiesMember2021-03-310001004315currency:EURifrs-full:CurrencyRiskMembernggtf:NonCurrentLiabilitiesMember2021-03-310001004315currency:USDifrs-full:CurrencyRiskMembernggtf:NonCurrentLiabilitiesMember2021-03-310001004315nggtf:OtherCurrencyMemberifrs-full:CurrencyRiskMembernggtf:NonCurrentLiabilitiesMember2021-03-310001004315ifrs-full:CurrencyRiskMembernggtf:NonCurrentLiabilitiesMember2021-03-310001004315ifrs-full:InterestRateRiskMemberifrs-full:FixedInterestRateMembernggtf:CashandCashEquivalentsMember2022-03-310001004315ifrs-full:InterestRateRiskMembernggtf:CashandCashEquivalentsMemberifrs-full:FloatingInterestRateMember2022-03-310001004315ifrs-full:InterestRateRiskMembernggtf:CashandCashEquivalentsMembernggtf:InflationLinkedInterestRateMember2022-03-310001004315ifrs-full:InterestRateRiskMembernggtf:CashandCashEquivalentsMembernggtf:OtherInterestRateMember2022-03-310001004315ifrs-full:InterestRateRiskMembernggtf:CashandCashEquivalentsMember2022-03-310001004315ifrs-full:InterestRateRiskMemberifrs-full:FixedInterestRateMembernggtf:CashandCashEquivalentsMember2021-03-310001004315ifrs-full:InterestRateRiskMembernggtf:CashandCashEquivalentsMemberifrs-full:FloatingInterestRateMember2021-03-310001004315ifrs-full:InterestRateRiskMembernggtf:CashandCashEquivalentsMembernggtf:InflationLinkedInterestRateMember2021-03-310001004315ifrs-full:InterestRateRiskMembernggtf:CashandCashEquivalentsMembernggtf:OtherInterestRateMember2021-03-310001004315ifrs-full:InterestRateRiskMembernggtf:CashandCashEquivalentsMember2021-03-310001004315ifrs-full:InterestRateRiskMembernggtf:FinancialInvestmentsMemberifrs-full:FixedInterestRateMember2022-03-310001004315ifrs-full:InterestRateRiskMembernggtf:FinancialInvestmentsMemberifrs-full:FloatingInterestRateMember2022-03-310001004315ifrs-full:InterestRateRiskMembernggtf:FinancialInvestmentsMembernggtf:InflationLinkedInterestRateMember2022-03-310001004315ifrs-full:InterestRateRiskMembernggtf:FinancialInvestmentsMembernggtf:OtherInterestRateMember2022-03-310001004315ifrs-full:InterestRateRiskMembernggtf:FinancialInvestmentsMember2022-03-310001004315ifrs-full:InterestRateRiskMembernggtf:FinancialInvestmentsMemberifrs-full:FixedInterestRateMember2021-03-310001004315ifrs-full:InterestRateRiskMembernggtf:FinancialInvestmentsMemberifrs-full:FloatingInterestRateMember2021-03-310001004315ifrs-full:InterestRateRiskMembernggtf:FinancialInvestmentsMembernggtf:InflationLinkedInterestRateMember2021-03-310001004315ifrs-full:InterestRateRiskMembernggtf:FinancialInvestmentsMembernggtf:OtherInterestRateMember2021-03-310001004315ifrs-full:InterestRateRiskMembernggtf:FinancialInvestmentsMember2021-03-310001004315ifrs-full:InterestRateRiskMemberifrs-full:FixedInterestRateMembernggtf:Borrowings1Member2022-03-310001004315ifrs-full:InterestRateRiskMemberifrs-full:FloatingInterestRateMembernggtf:Borrowings1Member2022-03-310001004315ifrs-full:InterestRateRiskMembernggtf:Borrowings1Membernggtf:InflationLinkedInterestRateMember2022-03-310001004315ifrs-full:InterestRateRiskMembernggtf:Borrowings1Membernggtf:OtherInterestRateMember2022-03-310001004315ifrs-full:InterestRateRiskMembernggtf:Borrowings1Member2022-03-310001004315ifrs-full:InterestRateRiskMemberifrs-full:FixedInterestRateMembernggtf:Borrowings1Member2021-03-310001004315ifrs-full:InterestRateRiskMemberifrs-full:FloatingInterestRateMembernggtf:Borrowings1Member2021-03-310001004315ifrs-full:InterestRateRiskMembernggtf:Borrowings1Membernggtf:InflationLinkedInterestRateMember2021-03-310001004315ifrs-full:InterestRateRiskMembernggtf:Borrowings1Membernggtf:OtherInterestRateMember2021-03-310001004315ifrs-full:InterestRateRiskMembernggtf:Borrowings1Member2021-03-310001004315ifrs-full:InterestRateRiskMembernggtf:PrederivativePositionMemberifrs-full:FixedInterestRateMember2022-03-310001004315ifrs-full:InterestRateRiskMembernggtf:PrederivativePositionMemberifrs-full:FloatingInterestRateMember2022-03-310001004315ifrs-full:InterestRateRiskMembernggtf:PrederivativePositionMembernggtf:InflationLinkedInterestRateMember2022-03-310001004315ifrs-full:InterestRateRiskMembernggtf:PrederivativePositionMembernggtf:OtherInterestRateMember2022-03-310001004315ifrs-full:InterestRateRiskMembernggtf:PrederivativePositionMember2022-03-310001004315ifrs-full:InterestRateRiskMembernggtf:PrederivativePositionMemberifrs-full:FixedInterestRateMember2021-03-310001004315ifrs-full:InterestRateRiskMembernggtf:PrederivativePositionMemberifrs-full:FloatingInterestRateMember2021-03-310001004315ifrs-full:InterestRateRiskMembernggtf:PrederivativePositionMembernggtf:InflationLinkedInterestRateMember2021-03-310001004315ifrs-full:InterestRateRiskMembernggtf:PrederivativePositionMembernggtf:OtherInterestRateMember2021-03-310001004315ifrs-full:InterestRateRiskMembernggtf:PrederivativePositionMember2021-03-310001004315ifrs-full:InterestRateRiskMemberifrs-full:FixedInterestRateMembernggtf:FinancingDerivativesMember2022-03-310001004315ifrs-full:InterestRateRiskMemberifrs-full:FloatingInterestRateMembernggtf:FinancingDerivativesMember2022-03-310001004315ifrs-full:InterestRateRiskMembernggtf:InflationLinkedInterestRateMembernggtf:FinancingDerivativesMember2022-03-310001004315ifrs-full:InterestRateRiskMembernggtf:OtherInterestRateMembernggtf:FinancingDerivativesMember2022-03-310001004315ifrs-full:InterestRateRiskMembernggtf:FinancingDerivativesMember2022-03-310001004315ifrs-full:InterestRateRiskMemberifrs-full:FixedInterestRateMembernggtf:FinancingDerivativesMember2021-03-310001004315ifrs-full:InterestRateRiskMemberifrs-full:FloatingInterestRateMembernggtf:FinancingDerivativesMember2021-03-310001004315ifrs-full:InterestRateRiskMembernggtf:InflationLinkedInterestRateMembernggtf:FinancingDerivativesMember2021-03-310001004315ifrs-full:InterestRateRiskMembernggtf:OtherInterestRateMembernggtf:FinancingDerivativesMember2021-03-310001004315ifrs-full:InterestRateRiskMembernggtf:FinancingDerivativesMember2021-03-310001004315ifrs-full:InterestRateRiskMemberifrs-full:FixedInterestRateMember2022-03-310001004315ifrs-full:InterestRateRiskMemberifrs-full:FloatingInterestRateMember2022-03-310001004315ifrs-full:InterestRateRiskMembernggtf:InflationLinkedInterestRateMember2022-03-310001004315ifrs-full:InterestRateRiskMembernggtf:OtherInterestRateMember2022-03-310001004315ifrs-full:InterestRateRiskMember2022-03-310001004315ifrs-full:InterestRateRiskMemberifrs-full:FixedInterestRateMember2021-03-310001004315ifrs-full:InterestRateRiskMemberifrs-full:FloatingInterestRateMember2021-03-310001004315ifrs-full:InterestRateRiskMembernggtf:InflationLinkedInterestRateMember2021-03-310001004315ifrs-full:InterestRateRiskMembernggtf:OtherInterestRateMember2021-03-310001004315ifrs-full:InterestRateRiskMember2021-03-310001004315ifrs-full:MarketRiskMemberifrs-full:CashFlowHedgesMember2021-04-012022-03-310001004315ifrs-full:CurrencyRiskMemberifrs-full:CashFlowHedgesMember2021-04-012022-03-310001004315ifrs-full:MarketRiskMemberifrs-full:FairValueHedgesMember2021-04-012022-03-310001004315ifrs-full:HedgesOfNetInvestmentInForeignOperationsMember2021-04-012022-03-310001004315ifrs-full:MarketRiskMembernggtf:ReserveOfCostOfHedgingMemberifrs-full:FairValueHedgesMember2022-03-310001004315ifrs-full:MarketRiskMembernggtf:ReserveOfCostOfHedgingMemberifrs-full:CashFlowHedgesMember2022-03-310001004315nggtf:ReserveOfCostOfHedgingMemberifrs-full:CurrencyRiskMemberifrs-full:CashFlowHedgesMember2022-03-310001004315ifrs-full:HedgesOfNetInvestmentInForeignOperationsMembernggtf:ReserveOfCostOfHedgingMember2022-03-310001004315ifrs-full:MarketRiskMembernggtf:CurrentDerivativeFinancialAssetsMemberifrs-full:FairValueHedgesMember2022-03-310001004315ifrs-full:MarketRiskMembernggtf:CurrentDerivativeFinancialAssetsMemberifrs-full:CashFlowHedgesMember2022-03-310001004315nggtf:CurrentDerivativeFinancialAssetsMemberifrs-full:CurrencyRiskMemberifrs-full:CashFlowHedgesMember2022-03-310001004315ifrs-full:HedgesOfNetInvestmentInForeignOperationsMembernggtf:CurrentDerivativeFinancialAssetsMember2022-03-310001004315ifrs-full:MarketRiskMembernggtf:NonCurrentDerivativeFinancialAssetsMemberifrs-full:FairValueHedgesMember2022-03-310001004315ifrs-full:MarketRiskMembernggtf:NonCurrentDerivativeFinancialAssetsMemberifrs-full:CashFlowHedgesMember2022-03-310001004315nggtf:NonCurrentDerivativeFinancialAssetsMemberifrs-full:CurrencyRiskMemberifrs-full:CashFlowHedgesMember2022-03-310001004315ifrs-full:HedgesOfNetInvestmentInForeignOperationsMembernggtf:NonCurrentDerivativeFinancialAssetsMember2022-03-310001004315ifrs-full:MarketRiskMembernggtf:CurrentDerivativeFinancialLiabilitiesMemberifrs-full:FairValueHedgesMember2022-03-310001004315ifrs-full:MarketRiskMembernggtf:CurrentDerivativeFinancialLiabilitiesMemberifrs-full:CashFlowHedgesMember2022-03-310001004315nggtf:CurrentDerivativeFinancialLiabilitiesMemberifrs-full:CurrencyRiskMemberifrs-full:CashFlowHedgesMember2022-03-310001004315ifrs-full:HedgesOfNetInvestmentInForeignOperationsMembernggtf:CurrentDerivativeFinancialLiabilitiesMember2022-03-310001004315ifrs-full:MarketRiskMemberifrs-full:FairValueHedgesMembernggtf:NonCurrentDerivativeFinancialLiabilitiesMember2022-03-310001004315ifrs-full:MarketRiskMembernggtf:NonCurrentDerivativeFinancialLiabilitiesMemberifrs-full:CashFlowHedgesMember2022-03-310001004315nggtf:NonCurrentDerivativeFinancialLiabilitiesMemberifrs-full:CurrencyRiskMemberifrs-full:CashFlowHedgesMember2022-03-310001004315ifrs-full:HedgesOfNetInvestmentInForeignOperationsMembernggtf:NonCurrentDerivativeFinancialLiabilitiesMember2022-03-310001004315ifrs-full:MarketRiskMemberifrs-full:BottomOfRangeMemberifrs-full:CashFlowHedgesMember2022-03-31iso4217:USDiso4217:GBP0001004315ifrs-full:TopOfRangeMemberifrs-full:MarketRiskMemberifrs-full:CashFlowHedgesMember2022-03-310001004315ifrs-full:BottomOfRangeMemberifrs-full:CurrencyRiskMemberifrs-full:CashFlowHedgesMember2022-03-310001004315ifrs-full:TopOfRangeMemberifrs-full:CurrencyRiskMemberifrs-full:CashFlowHedgesMember2022-03-310001004315ifrs-full:HedgesOfNetInvestmentInForeignOperationsMemberifrs-full:BottomOfRangeMember2022-03-310001004315ifrs-full:TopOfRangeMemberifrs-full:HedgesOfNetInvestmentInForeignOperationsMember2022-03-310001004315ifrs-full:MarketRiskMemberifrs-full:BottomOfRangeMemberifrs-full:FairValueHedgesMember2022-03-31iso4217:EURiso4217:GBP0001004315ifrs-full:TopOfRangeMemberifrs-full:MarketRiskMemberifrs-full:FairValueHedgesMember2022-03-310001004315ifrs-full:HedgesOfNetInvestmentInForeignOperationsMember2022-03-31iso4217:USDiso4217:EUR0001004315ifrs-full:MarketRiskMembernggtf:LondonInterbankOfferedRateLIBOR1Memberifrs-full:BottomOfRangeMemberifrs-full:FairValueHedgesMembercurrency:GBP2022-03-310001004315ifrs-full:TopOfRangeMemberifrs-full:MarketRiskMembernggtf:LondonInterbankOfferedRateLIBOR1Memberifrs-full:FairValueHedgesMembercurrency:GBP2022-03-310001004315ifrs-full:MarketRiskMemberifrs-full:BottomOfRangeMembercurrency:GBPifrs-full:CashFlowHedgesMember2022-03-310001004315ifrs-full:TopOfRangeMemberifrs-full:MarketRiskMembercurrency:GBPifrs-full:CashFlowHedgesMember2022-03-310001004315ifrs-full:MarketRiskMembernggtf:LondonInterbankOfferedRateLIBOR1Memberifrs-full:BottomOfRangeMemberifrs-full:FairValueHedgesMembercurrency:USD2022-03-310001004315ifrs-full:TopOfRangeMemberifrs-full:MarketRiskMembernggtf:LondonInterbankOfferedRateLIBOR1Memberifrs-full:FairValueHedgesMembercurrency:USD2022-03-310001004315ifrs-full:MarketRiskMembercurrency:USDifrs-full:BottomOfRangeMemberifrs-full:CashFlowHedgesMember2022-03-310001004315ifrs-full:TopOfRangeMemberifrs-full:MarketRiskMembercurrency:USDifrs-full:CashFlowHedgesMember2022-03-310001004315ifrs-full:MarketRiskMemberifrs-full:CashFlowHedgesMember2020-04-012021-03-310001004315ifrs-full:CurrencyRiskMemberifrs-full:CashFlowHedgesMember2020-04-012021-03-310001004315ifrs-full:MarketRiskMemberifrs-full:FairValueHedgesMember2020-04-012021-03-310001004315ifrs-full:HedgesOfNetInvestmentInForeignOperationsMember2020-04-012021-03-310001004315ifrs-full:MarketRiskMembernggtf:ReserveOfCostOfHedgingMemberifrs-full:FairValueHedgesMember2021-03-310001004315ifrs-full:MarketRiskMembernggtf:ReserveOfCostOfHedgingMemberifrs-full:CashFlowHedgesMember2021-03-310001004315nggtf:ReserveOfCostOfHedgingMemberifrs-full:CurrencyRiskMemberifrs-full:CashFlowHedgesMember2021-03-310001004315ifrs-full:HedgesOfNetInvestmentInForeignOperationsMembernggtf:ReserveOfCostOfHedgingMember2021-03-310001004315ifrs-full:MarketRiskMembernggtf:CurrentDerivativeFinancialAssetsMemberifrs-full:FairValueHedgesMember2021-03-310001004315ifrs-full:MarketRiskMembernggtf:CurrentDerivativeFinancialAssetsMemberifrs-full:CashFlowHedgesMember2021-03-310001004315nggtf:CurrentDerivativeFinancialAssetsMemberifrs-full:CurrencyRiskMemberifrs-full:CashFlowHedgesMember2021-03-310001004315ifrs-full:HedgesOfNetInvestmentInForeignOperationsMembernggtf:CurrentDerivativeFinancialAssetsMember2021-03-310001004315ifrs-full:MarketRiskMembernggtf:NonCurrentDerivativeFinancialAssetsMemberifrs-full:FairValueHedgesMember2021-03-310001004315ifrs-full:MarketRiskMembernggtf:NonCurrentDerivativeFinancialAssetsMemberifrs-full:CashFlowHedgesMember2021-03-310001004315nggtf:NonCurrentDerivativeFinancialAssetsMemberifrs-full:CurrencyRiskMemberifrs-full:CashFlowHedgesMember2021-03-310001004315ifrs-full:HedgesOfNetInvestmentInForeignOperationsMembernggtf:NonCurrentDerivativeFinancialAssetsMember2021-03-310001004315ifrs-full:MarketRiskMembernggtf:CurrentDerivativeFinancialLiabilitiesMemberifrs-full:FairValueHedgesMember2021-03-310001004315ifrs-full:MarketRiskMembernggtf:CurrentDerivativeFinancialLiabilitiesMemberifrs-full:CashFlowHedgesMember2021-03-310001004315nggtf:CurrentDerivativeFinancialLiabilitiesMemberifrs-full:CurrencyRiskMemberifrs-full:CashFlowHedgesMember2021-03-310001004315ifrs-full:HedgesOfNetInvestmentInForeignOperationsMembernggtf:CurrentDerivativeFinancialLiabilitiesMember2021-03-310001004315ifrs-full:MarketRiskMemberifrs-full:FairValueHedgesMembernggtf:NonCurrentDerivativeFinancialLiabilitiesMember2021-03-310001004315ifrs-full:MarketRiskMembernggtf:NonCurrentDerivativeFinancialLiabilitiesMemberifrs-full:CashFlowHedgesMember2021-03-310001004315nggtf:NonCurrentDerivativeFinancialLiabilitiesMemberifrs-full:CurrencyRiskMemberifrs-full:CashFlowHedgesMember2021-03-310001004315ifrs-full:HedgesOfNetInvestmentInForeignOperationsMembernggtf:NonCurrentDerivativeFinancialLiabilitiesMember2021-03-310001004315ifrs-full:MarketRiskMemberifrs-full:FairValueHedgesMember2021-03-310001004315ifrs-full:MarketRiskMemberifrs-full:BottomOfRangeMemberifrs-full:CashFlowHedgesMember2021-03-310001004315ifrs-full:TopOfRangeMemberifrs-full:MarketRiskMemberifrs-full:CashFlowHedgesMember2021-03-310001004315ifrs-full:BottomOfRangeMemberifrs-full:CurrencyRiskMemberifrs-full:CashFlowHedgesMember2021-03-310001004315ifrs-full:TopOfRangeMemberifrs-full:CurrencyRiskMemberifrs-full:CashFlowHedgesMember2021-03-310001004315ifrs-full:HedgesOfNetInvestmentInForeignOperationsMemberifrs-full:BottomOfRangeMember2021-03-310001004315ifrs-full:TopOfRangeMemberifrs-full:HedgesOfNetInvestmentInForeignOperationsMember2021-03-310001004315ifrs-full:MarketRiskMemberifrs-full:BottomOfRangeMemberifrs-full:FairValueHedgesMember2021-03-310001004315ifrs-full:TopOfRangeMemberifrs-full:MarketRiskMemberifrs-full:FairValueHedgesMember2021-03-310001004315ifrs-full:MarketRiskMembernggtf:LondonInterbankOfferedRateLIBOR1Memberifrs-full:BottomOfRangeMemberifrs-full:FairValueHedgesMembercurrency:GBP2021-03-310001004315ifrs-full:TopOfRangeMemberifrs-full:MarketRiskMembernggtf:LondonInterbankOfferedRateLIBOR1Memberifrs-full:FairValueHedgesMembercurrency:GBP2021-03-310001004315ifrs-full:MarketRiskMemberifrs-full:BottomOfRangeMembercurrency:GBPifrs-full:CashFlowHedgesMember2021-03-310001004315ifrs-full:TopOfRangeMemberifrs-full:MarketRiskMembercurrency:GBPifrs-full:CashFlowHedgesMember2021-03-310001004315ifrs-full:MarketRiskMembernggtf:LondonInterbankOfferedRateLIBOR1Memberifrs-full:BottomOfRangeMemberifrs-full:FairValueHedgesMembercurrency:USD2021-03-310001004315ifrs-full:TopOfRangeMemberifrs-full:MarketRiskMembernggtf:LondonInterbankOfferedRateLIBOR1Memberifrs-full:FairValueHedgesMembercurrency:USD2021-03-310001004315ifrs-full:MarketRiskMembercurrency:USDifrs-full:BottomOfRangeMemberifrs-full:CashFlowHedgesMember2021-03-310001004315ifrs-full:TopOfRangeMemberifrs-full:MarketRiskMembercurrency:USDifrs-full:CashFlowHedgesMember2021-03-310001004315ifrs-full:MarketRiskMemberifrs-full:FairValueHedgesMember2022-03-310001004315ifrs-full:MarketRiskMembernggtf:Borrowings1Memberifrs-full:FairValueHedgesMember2022-03-310001004315ifrs-full:MarketRiskMembernggtf:Borrowings1Membernggtf:CurrentLiabilitiesMemberifrs-full:FairValueHedgesMember2022-03-310001004315ifrs-full:MarketRiskMembernggtf:Borrowings1Memberifrs-full:FairValueHedgesMembernggtf:NonCurrentLiabilitiesMember2022-03-310001004315ifrs-full:MarketRiskMembernggtf:ImpactedByIFRS9InterestRateBenchmarkReformAmendmentsMemberifrs-full:FairValueHedgesMember2022-03-310001004315ifrs-full:MarketRiskMembernggtf:Borrowings1Memberifrs-full:FairValueHedgesMember2021-03-310001004315ifrs-full:MarketRiskMembernggtf:Borrowings1Membernggtf:CurrentLiabilitiesMemberifrs-full:FairValueHedgesMember2021-03-310001004315ifrs-full:MarketRiskMembernggtf:Borrowings1Memberifrs-full:FairValueHedgesMembernggtf:NonCurrentLiabilitiesMember2021-03-310001004315ifrs-full:MarketRiskMembernggtf:ImpactedByIFRS9InterestRateBenchmarkReformAmendmentsMemberifrs-full:FairValueHedgesMember2021-03-310001004315ifrs-full:MarketRiskMemberifrs-full:CashFlowHedgesMember2022-03-310001004315ifrs-full:CurrencyRiskMemberifrs-full:CashFlowHedgesMember2022-03-310001004315ifrs-full:MarketRiskMembernggtf:ImpactedByIFRS9InterestRateBenchmarkReformAmendmentsMemberifrs-full:CashFlowHedgesMember2022-03-310001004315ifrs-full:MarketRiskMemberifrs-full:CashFlowHedgesMember2021-03-310001004315ifrs-full:CurrencyRiskMemberifrs-full:CashFlowHedgesMember2021-03-310001004315ifrs-full:MarketRiskMembernggtf:ImpactedByIFRS9InterestRateBenchmarkReformAmendmentsMemberifrs-full:CashFlowHedgesMember2021-03-310001004315ifrs-full:HedgesOfNetInvestmentInForeignOperationsMemberifrs-full:CurrencyRiskMember2022-03-310001004315ifrs-full:HedgesOfNetInvestmentInForeignOperationsMemberifrs-full:CurrencyRiskMember2021-04-012022-03-310001004315ifrs-full:HedgesOfNetInvestmentInForeignOperationsMembernggtf:ImpactedByIFRS9InterestRateBenchmarkReformAmendmentsMemberifrs-full:CurrencyRiskMember2022-03-310001004315ifrs-full:HedgesOfNetInvestmentInForeignOperationsMemberifrs-full:CurrencyRiskMember2021-03-310001004315ifrs-full:HedgesOfNetInvestmentInForeignOperationsMemberifrs-full:CurrencyRiskMember2020-04-012021-03-310001004315ifrs-full:HedgesOfNetInvestmentInForeignOperationsMembernggtf:ImpactedByIFRS9InterestRateBenchmarkReformAmendmentsMemberifrs-full:CurrencyRiskMember2021-03-310001004315nggtf:InvestmentsheldatFVTPLMemberifrs-full:Level1OfFairValueHierarchyMember2022-03-310001004315ifrs-full:Level2OfFairValueHierarchyMembernggtf:InvestmentsheldatFVTPLMember2022-03-310001004315ifrs-full:Level3OfFairValueHierarchyMembernggtf:InvestmentsheldatFVTPLMember2022-03-310001004315nggtf:InvestmentsheldatFVTPLMember2022-03-310001004315nggtf:InvestmentsheldatFVTPLMemberifrs-full:Level1OfFairValueHierarchyMember2021-03-310001004315ifrs-full:Level2OfFairValueHierarchyMembernggtf:InvestmentsheldatFVTPLMember2021-03-310001004315ifrs-full:Level3OfFairValueHierarchyMembernggtf:InvestmentsheldatFVTPLMember2021-03-310001004315nggtf:InvestmentsheldatFVTPLMember2021-03-310001004315nggtf:InvestmentsheldatFVTOCIMemberifrs-full:Level1OfFairValueHierarchyMember2022-03-310001004315nggtf:InvestmentsheldatFVTOCIMemberifrs-full:Level2OfFairValueHierarchyMember2022-03-310001004315nggtf:InvestmentsheldatFVTOCIMemberifrs-full:Level3OfFairValueHierarchyMember2022-03-310001004315nggtf:InvestmentsheldatFVTOCIMember2022-03-310001004315nggtf:InvestmentsheldatFVTOCIMemberifrs-full:Level1OfFairValueHierarchyMember2021-03-310001004315nggtf:InvestmentsheldatFVTOCIMemberifrs-full:Level2OfFairValueHierarchyMember2021-03-310001004315nggtf:InvestmentsheldatFVTOCIMemberifrs-full:Level3OfFairValueHierarchyMember2021-03-310001004315nggtf:InvestmentsheldatFVTOCIMember2021-03-310001004315nggtf:FinancingDerivativesMemberifrs-full:Level1OfFairValueHierarchyMember2022-03-310001004315nggtf:FinancingDerivativesMemberifrs-full:Level2OfFairValueHierarchyMember2022-03-310001004315nggtf:FinancingDerivativesMemberifrs-full:Level3OfFairValueHierarchyMember2022-03-310001004315nggtf:FinancingDerivativesMember2022-03-310001004315nggtf:FinancingDerivativesMemberifrs-full:Level1OfFairValueHierarchyMember2021-03-310001004315nggtf:FinancingDerivativesMemberifrs-full:Level2OfFairValueHierarchyMember2021-03-310001004315nggtf:FinancingDerivativesMemberifrs-full:Level3OfFairValueHierarchyMember2021-03-310001004315nggtf:FinancingDerivativesMember2021-03-310001004315nggtf:CommodityDerivativesMemberifrs-full:Level1OfFairValueHierarchyMember2022-03-310001004315nggtf:CommodityDerivativesMemberifrs-full:Level2OfFairValueHierarchyMember2022-03-310001004315nggtf:CommodityDerivativesMemberifrs-full:Level3OfFairValueHierarchyMember2022-03-310001004315nggtf:CommodityDerivativesMember2022-03-310001004315nggtf:CommodityDerivativesMemberifrs-full:Level1OfFairValueHierarchyMember2021-03-310001004315nggtf:CommodityDerivativesMemberifrs-full:Level2OfFairValueHierarchyMember2021-03-310001004315nggtf:CommodityDerivativesMemberifrs-full:Level3OfFairValueHierarchyMember2021-03-310001004315nggtf:CommodityDerivativesMember2021-03-310001004315ifrs-full:Level1OfFairValueHierarchyMember2022-03-310001004315ifrs-full:Level2OfFairValueHierarchyMember2022-03-310001004315ifrs-full:Level3OfFairValueHierarchyMember2022-03-310001004315ifrs-full:Level1OfFairValueHierarchyMember2021-03-310001004315ifrs-full:Level2OfFairValueHierarchyMember2021-03-310001004315ifrs-full:Level3OfFairValueHierarchyMember2021-03-310001004315nggtf:FinancingDerivativesMemberifrs-full:Level1OfFairValueHierarchyMember2022-03-310001004315nggtf:FinancingDerivativesMemberifrs-full:Level2OfFairValueHierarchyMember2022-03-310001004315nggtf:FinancingDerivativesMemberifrs-full:Level3OfFairValueHierarchyMember2022-03-310001004315nggtf:FinancingDerivativesMember2022-03-310001004315nggtf:FinancingDerivativesMemberifrs-full:Level1OfFairValueHierarchyMember2021-03-310001004315nggtf:FinancingDerivativesMemberifrs-full:Level2OfFairValueHierarchyMember2021-03-310001004315nggtf:FinancingDerivativesMemberifrs-full:Level3OfFairValueHierarchyMember2021-03-310001004315nggtf:FinancingDerivativesMember2021-03-310001004315nggtf:CommodityDerivativesMemberifrs-full:Level1OfFairValueHierarchyMember2022-03-310001004315nggtf:CommodityDerivativesMemberifrs-full:Level2OfFairValueHierarchyMember2022-03-310001004315nggtf:CommodityDerivativesMemberifrs-full:Level3OfFairValueHierarchyMember2022-03-310001004315nggtf:CommodityDerivativesMember2022-03-310001004315nggtf:CommodityDerivativesMemberifrs-full:Level1OfFairValueHierarchyMember2021-03-310001004315nggtf:CommodityDerivativesMemberifrs-full:Level2OfFairValueHierarchyMember2021-03-310001004315nggtf:CommodityDerivativesMemberifrs-full:Level3OfFairValueHierarchyMember2021-03-310001004315nggtf:CommodityDerivativesMember2021-03-310001004315nggtf:LiabilitiesHeldatFairValueMemberifrs-full:Level1OfFairValueHierarchyMember2022-03-310001004315nggtf:LiabilitiesHeldatFairValueMemberifrs-full:Level2OfFairValueHierarchyMember2022-03-310001004315nggtf:LiabilitiesHeldatFairValueMemberifrs-full:Level3OfFairValueHierarchyMember2022-03-310001004315nggtf:LiabilitiesHeldatFairValueMember2022-03-310001004315nggtf:LiabilitiesHeldatFairValueMemberifrs-full:Level1OfFairValueHierarchyMember2021-03-310001004315nggtf:LiabilitiesHeldatFairValueMemberifrs-full:Level2OfFairValueHierarchyMember2021-03-310001004315nggtf:LiabilitiesHeldatFairValueMemberifrs-full:Level3OfFairValueHierarchyMember2021-03-310001004315nggtf:LiabilitiesHeldatFairValueMember2021-03-310001004315ifrs-full:ContingentConsiderationMemberifrs-full:Level1OfFairValueHierarchyMember2022-03-310001004315ifrs-full:ContingentConsiderationMemberifrs-full:Level2OfFairValueHierarchyMember2022-03-310001004315ifrs-full:ContingentConsiderationMemberifrs-full:Level3OfFairValueHierarchyMember2022-03-310001004315ifrs-full:ContingentConsiderationMember2022-03-310001004315ifrs-full:ContingentConsiderationMemberifrs-full:Level1OfFairValueHierarchyMember2021-03-310001004315ifrs-full:ContingentConsiderationMemberifrs-full:Level2OfFairValueHierarchyMember2021-03-310001004315ifrs-full:ContingentConsiderationMemberifrs-full:Level3OfFairValueHierarchyMember2021-03-310001004315ifrs-full:ContingentConsiderationMember2021-03-310001004315ifrs-full:Level3OfFairValueHierarchyMembernggtf:FinancingDerivativesMember2021-03-310001004315ifrs-full:Level3OfFairValueHierarchyMembernggtf:FinancingDerivativesMember2020-03-310001004315ifrs-full:Level3OfFairValueHierarchyMembernggtf:CommodityDerivativesMember2021-03-310001004315ifrs-full:Level3OfFairValueHierarchyMembernggtf:CommodityDerivativesMember2020-03-310001004315ifrs-full:Level3OfFairValueHierarchyMembernggtf:InvestmentsheldatFVTPLMember2021-03-310001004315ifrs-full:Level3OfFairValueHierarchyMembernggtf:InvestmentsheldatFVTPLMember2020-03-310001004315ifrs-full:Level3OfFairValueHierarchyMember2020-03-310001004315ifrs-full:Level3OfFairValueHierarchyMembernggtf:FinancingDerivativesMember2021-04-012022-03-310001004315ifrs-full:Level3OfFairValueHierarchyMembernggtf:FinancingDerivativesMember2020-04-012021-03-310001004315ifrs-full:Level3OfFairValueHierarchyMembernggtf:CommodityDerivativesMember2021-04-012022-03-310001004315ifrs-full:Level3OfFairValueHierarchyMembernggtf:CommodityDerivativesMember2020-04-012021-03-310001004315ifrs-full:Level3OfFairValueHierarchyMembernggtf:InvestmentsheldatFVTPLMember2021-04-012022-03-310001004315ifrs-full:Level3OfFairValueHierarchyMembernggtf:InvestmentsheldatFVTPLMember2020-04-012021-03-310001004315ifrs-full:Level3OfFairValueHierarchyMember2021-04-012022-03-310001004315ifrs-full:Level3OfFairValueHierarchyMember2020-04-012021-03-310001004315ifrs-full:Level3OfFairValueHierarchyMembernggtf:FinancingDerivativesMember2022-03-310001004315ifrs-full:Level3OfFairValueHierarchyMembernggtf:CommodityDerivativesMember2022-03-310001004315ifrs-full:Level3OfFairValueHierarchyMembernggtf:InvestmentsheldatFVTPLMember2022-03-310001004315nggtf:CommodityPriceRiskTenPercentIncreaseMembernggtf:CommodityDerivativesMember2022-03-310001004315nggtf:CommodityPriceRiskTenPercentIncreaseMembernggtf:CommodityDerivativesMember2021-03-310001004315nggtf:CommodityDerivativesMembernggtf:CommodityPriceRiskTenPercentDecreaseMember2022-03-310001004315nggtf:CommodityDerivativesMembernggtf:CommodityPriceRiskTenPercentDecreaseMember2021-03-310001004315nggtf:MarketRiskMarketAreaPriceTenPercentIncreaseMembernggtf:CommodityDerivativesMember2021-03-310001004315nggtf:MarketRiskMarketAreaPriceTenPercentDecreaseMembernggtf:CommodityDerivativesMember2021-03-310001004315nggtf:MarketRiskLimitedPriceInflationMarketCurveTwentyBasisPointsIncreaseMembernggtf:FinancingDerivativesMember2022-03-310001004315nggtf:MarketRiskLimitedPriceInflationMarketCurveTwentyBasisPointsIncreaseMembernggtf:FinancingDerivativesMember2021-03-310001004315nggtf:MarketRiskLimitedPriceInflationMarketCurveTwentyBasisPointsDecreaseMembernggtf:FinancingDerivativesMember2022-03-310001004315nggtf:MarketRiskLimitedPriceInflationMarketCurveTwentyBasisPointsDecreaseMembernggtf:FinancingDerivativesMember2021-03-310001004315nggtf:OtherFinancialInstrumentsMembernggtf:DiscountRateRisk50BasisPointsIncreaseMember2022-03-310001004315nggtf:OtherFinancialInstrumentsMembernggtf:DiscountRateRisk50BasisPointsIncreaseMember2021-03-310001004315nggtf:OtherFinancialInstrumentsMembernggtf:DiscountRateRisk50BasisPointsDecreaseMember2022-03-310001004315nggtf:OtherFinancialInstrumentsMembernggtf:DiscountRateRisk50BasisPointsDecreaseMember2021-03-310001004315nggtf:NonUSSubsidiariesMember2022-03-310001004315nggtf:USSubsidiariesMember2022-03-310001004315nggtf:USAndNonUSSubsidiariesMember2022-03-310001004315nggtf:PPLWPDInvestmentsLimitedWPDMember2022-03-310001004315srt:MinimumMembernggtf:PPLWPDInvestmentsLimitedWPDMember2021-04-012022-03-310001004315nggtf:PPLWPDInvestmentsLimitedWPDMembersrt:MaximumMember2021-04-012022-03-310001004315nggtf:BilateralCommittedCreditFacilitiesMember2022-03-310001004315nggtf:BilateralCommittedCreditFacilitiesMember2021-03-310001004315nggtf:CreditFacilitiesFromSyndicatesOfBanksMember2022-03-310001004315nggtf:CreditFacilitiesFromSyndicatesOfBanksMember2021-03-310001004315nggtf:FacilitiesHeldAsBackupToCommercialPaperAndSimilarBorrowingsMember2022-03-310001004315nggtf:FacilitiesHeldAsBackupToCommercialPaperAndSimilarBorrowingsMember2021-03-310001004315nggtf:FacilitiesAvailableAsBackupToSpecificUSBorrowingsMember2022-03-310001004315nggtf:FacilitiesAvailableAsBackupToSpecificUSBorrowingsMember2021-03-310001004315nggtf:NationalGridGasPlcMemberifrs-full:LaterThanThreeYearsAndNotLaterThanFourYearsMember2022-03-310001004315nggtf:A2019ExportCreditAgreementsMember2022-03-310001004315nggtf:A2019ExportCreditAgreementsMember2021-03-310001004315nggtf:ExportCreditAgencyMember2022-03-310001004315nggtf:ExportCreditAgencyMember2021-03-310001004315nggtf:FacilitiesToFinanceTheAcquisitionMember2022-03-310001004315nggtf:FacilitiesToFinanceTheAcquisitionMember2021-03-310001004315nggtf:SheetRoadManagementCompanyLimitedMember2021-04-012022-03-310001004315nggtf:WarwickTechnologyParkManagementCompanyNo2LimitedMember2021-04-012022-03-310001004315nggtf:NewEnglandHydroFinanceCompanyInc.Member2021-04-012022-03-310001004315nggtf:NewEnglandHydroTransmissionCorporationMember2021-04-012022-03-310001004315nggtf:NewEnglandHydroTransmissionElectricCompanyInc.Member2021-04-012022-03-310001004315nggtf:VermontGreenLineDevcoLLCMember2021-04-012022-03-310001004315nggtf:JointRadioCompanyLimitedMember2021-04-012022-03-310001004315nggtf:NationalPlacesLLPMember2021-04-012022-03-310001004315nggtf:NGETSPTUpgradesLimitedMember2021-04-012022-03-310001004315nggtf:CleanEnergyStorageSystemsLLCMember2021-04-012022-03-310001004315nggtf:IslandParkEnergyCenterLLCMember2021-04-012022-03-310001004315nggtf:IslanderEastPipelineCompanyLLCMember2021-04-012022-03-310001004315nggtf:LIEnergyStorageSystemLLCMember2021-04-012022-03-310001004315nggtf:LISolarGenerationLLCMember2021-04-012022-03-310001004315nggtf:IFA2SASMember2021-04-012022-03-310001004315nggtf:CleanLineEnergyPartnersLLCMember2021-04-012022-03-310001004315nggtf:ConnecticutYankeeAtomicPowerCompanyMember2021-04-012022-03-310001004315nggtf:DirectGlobalPowerInc.Member2021-04-012022-03-310001004315nggtf:EnergyImpactFundLPMember2021-04-012022-03-310001004315nggtf:KHBVentureLLCMember2021-04-012022-03-310001004315nggtf:MaineYankeeAtomicPowerCompanyMember2021-04-012022-03-310001004315nggtf:NewYorkTranscoLLCMember2021-04-012022-03-310001004315nggtf:NysearchRMLDLLCMember2021-04-012022-03-310001004315nggtf:TheHiveIVLLCMember2021-04-012022-03-310001004315nggtf:YankeeAtomicElectricCompanyMember2021-04-012022-03-310001004315nggtf:CoresoSAMember2021-04-012022-03-310001004315nggtf:EnergisplcMember2021-04-012022-03-310001004315nggtf:ElectralinkLimitedMember2021-04-012022-03-310001004315nggtf:BritNedDevelopmentLimitedMembernggtf:NationalGridInterconnectorHoldingsLimitedMembernggtf:COrdinarySharesMember2022-03-310001004315nggtf:COrdinarySharesMember2022-03-31iso4217:EURxbrli:shares0001004315nggtf:BritNedDevelopmentLimitedMembernggtf:AOrdinarySharesMembernggtf:NationalGridInterconnectorHoldingsLimitedMember2022-03-310001004315nggtf:AOrdinarySharesMember2022-03-310001004315nggtf:NGETSPTUpgradesLimitedMembernggtf:AOrdinarySharesMembernggtf:NationalGridElectricityTransmissionplcMember2022-03-310001004315country:GBifrs-full:PensionDefinedBenefitPlansMemberifrs-full:ActuarialAssumptionOfDiscountRatesMember2021-04-012022-03-310001004315country:GBifrs-full:ActuarialAssumptionOfDiscountRatesMember2021-04-012022-03-310001004315country:GBifrs-full:ActuarialAssumptionOfDiscountRatesMember2022-03-310001004315country:GBifrs-full:ActuarialAssumptionOfDiscountRatesMember2020-04-012021-03-310001004315country:GBifrs-full:ActuarialAssumptionOfDiscountRatesMember2021-03-310001004315country:USifrs-full:PensionDefinedBenefitPlansMemberifrs-full:ActuarialAssumptionOfDiscountRatesMember2021-04-012022-03-310001004315country:USifrs-full:ActuarialAssumptionOfDiscountRatesMember2021-04-012022-03-310001004315country:USifrs-full:ActuarialAssumptionOfDiscountRatesMember2022-03-310001004315country:USifrs-full:ActuarialAssumptionOfDiscountRatesMember2020-04-012021-03-310001004315country:USifrs-full:ActuarialAssumptionOfDiscountRatesMember2021-03-310001004315country:GBifrs-full:PensionDefinedBenefitPlansMemberifrs-full:ActuarialAssumptionOfExpectedRatesOfInflationMember2021-04-012022-03-310001004315country:GBifrs-full:ActuarialAssumptionOfExpectedRatesOfInflationMember2021-04-012022-03-310001004315country:GBifrs-full:ActuarialAssumptionOfExpectedRatesOfInflationMember2022-03-310001004315country:GBifrs-full:ActuarialAssumptionOfExpectedRatesOfInflationMember2020-04-012021-03-310001004315country:GBifrs-full:ActuarialAssumptionOfExpectedRatesOfInflationMember2021-03-310001004315ifrs-full:ActuarialAssumptionOfExpectedRatesOfSalaryIncreasesMembercountry:GBifrs-full:PensionDefinedBenefitPlansMember2021-04-012022-03-310001004315ifrs-full:ActuarialAssumptionOfExpectedRatesOfSalaryIncreasesMembercountry:GB2021-04-012022-03-310001004315ifrs-full:ActuarialAssumptionOfExpectedRatesOfSalaryIncreasesMembercountry:GB2022-03-310001004315ifrs-full:ActuarialAssumptionOfExpectedRatesOfSalaryIncreasesMembercountry:GB2020-04-012021-03-310001004315ifrs-full:ActuarialAssumptionOfExpectedRatesOfSalaryIncreasesMembercountry:GB2021-03-310001004315ifrs-full:ActuarialAssumptionOfExpectedRatesOfSalaryIncreasesMembercountry:USifrs-full:PensionDefinedBenefitPlansMember2021-04-012022-03-310001004315ifrs-full:ActuarialAssumptionOfExpectedRatesOfSalaryIncreasesMembercountry:US2021-04-012022-03-310001004315ifrs-full:ActuarialAssumptionOfExpectedRatesOfSalaryIncreasesMembercountry:US2022-03-310001004315ifrs-full:ActuarialAssumptionOfExpectedRatesOfSalaryIncreasesMembercountry:US2020-04-012021-03-310001004315ifrs-full:ActuarialAssumptionOfExpectedRatesOfSalaryIncreasesMembercountry:US2021-03-310001004315ifrs-full:ActuarialAssumptionOfLifeExpectancyAfterRetirementMembercountry:GBifrs-full:PensionDefinedBenefitPlansMember2021-04-012022-03-310001004315ifrs-full:ActuarialAssumptionOfLifeExpectancyAfterRetirementMembercountry:GB2021-04-012022-03-310001004315ifrs-full:ActuarialAssumptionOfLifeExpectancyAfterRetirementMembercountry:GB2022-03-310001004315ifrs-full:ActuarialAssumptionOfLifeExpectancyAfterRetirementMembercountry:GB2020-04-012021-03-310001004315ifrs-full:ActuarialAssumptionOfLifeExpectancyAfterRetirementMembercountry:GB2021-03-310001004315country:USifrs-full:ActuarialAssumptionOfLifeExpectancyAfterRetirementMemberifrs-full:PensionDefinedBenefitPlansMember2021-04-012022-03-310001004315country:USifrs-full:ActuarialAssumptionOfLifeExpectancyAfterRetirementMember2021-04-012022-03-310001004315country:USifrs-full:ActuarialAssumptionOfLifeExpectancyAfterRetirementMember2022-03-310001004315country:USifrs-full:ActuarialAssumptionOfLifeExpectancyAfterRetirementMember2020-04-012021-03-310001004315country:USifrs-full:ActuarialAssumptionOfLifeExpectancyAfterRetirementMember2021-03-310001004315nggtf:AssumptionOfUSHealthcareCostMembercountry:USifrs-full:PensionDefinedBenefitPlansMember2021-04-012022-03-310001004315nggtf:AssumptionOfUSHealthcareCostMembercountry:US2021-04-012022-03-310001004315nggtf:AssumptionOfUSHealthcareCostMembercountry:US2022-03-310001004315nggtf:AssumptionOfUSHealthcareCostMembercountry:US2020-04-012021-03-310001004315nggtf:AssumptionOfUSHealthcareCostMembercountry:US2021-03-310001004315ifrs-full:OtherEnvironmentRelatedProvisionMembernggtf:EstimatedFutureCashFlowsChangeMember2021-04-012022-03-310001004315ifrs-full:OtherEnvironmentRelatedProvisionMembernggtf:EstimatedFutureCashFlowsChangeMember2022-03-310001004315ifrs-full:OtherEnvironmentRelatedProvisionMembernggtf:EstimatedFutureCashFlowsChangeMember2020-04-012021-03-310001004315ifrs-full:OtherEnvironmentRelatedProvisionMembernggtf:EstimatedFutureCashFlowsChangeMember2021-03-310001004315country:GBifrs-full:PensionDefinedBenefitPlansMembernggtf:ValueOfBuyinPoliciesOffsetToActuarialAssumptionOfDiscountRateMember2022-03-310001004315country:GBifrs-full:PensionDefinedBenefitPlansMembernggtf:ValueOfBuyinPoliciesOffsetToActuarialAssumptionOfDiscountRateMember2021-03-310001004315nggtf:ValueOfBuyinPoliciesOffsetToActuarialAssumptionOfExpectedRatesOfInflationMembercountry:GBifrs-full:PensionDefinedBenefitPlansMember2022-03-310001004315nggtf:ValueOfBuyinPoliciesOffsetToActuarialAssumptionOfExpectedRatesOfInflationMembercountry:GBifrs-full:PensionDefinedBenefitPlansMember2021-03-310001004315nggtf:ValueOfBuyinPoliciesAndLongevitySwapOffsetToActuarialAssumptionOfLifeExpectancyAfterRetirementMembercountry:GBifrs-full:PensionDefinedBenefitPlansMember2022-03-310001004315nggtf:ValueOfBuyinPoliciesAndLongevitySwapOffsetToActuarialAssumptionOfLifeExpectancyAfterRetirementMembercountry:GBifrs-full:PensionDefinedBenefitPlansMember2021-03-310001004315nggtf:PPLWPDInvestmentsLimitedWPDMembernggtf:DecreaseThatWouldLeadToAnImpairmentMemberifrs-full:ActuarialAssumptionOfDiscountRatesMember2022-03-310001004315country:GBifrs-full:OtherPriceRiskMember2021-04-012022-03-310001004315country:GBifrs-full:OtherPriceRiskMember2022-03-310001004315country:GBifrs-full:OtherPriceRiskMember2020-04-012021-03-310001004315country:GBifrs-full:OtherPriceRiskMember2021-03-310001004315ifrs-full:InterestRateRiskMembercountry:GB2021-04-012022-03-310001004315ifrs-full:InterestRateRiskMembercountry:GB2022-03-310001004315ifrs-full:InterestRateRiskMembercountry:GB2020-04-012021-03-310001004315ifrs-full:InterestRateRiskMembercountry:GB2021-03-310001004315ifrs-full:InterestRateRiskMembercountry:US2021-04-012022-03-310001004315ifrs-full:InterestRateRiskMembercountry:US2022-03-310001004315ifrs-full:InterestRateRiskMembercountry:US2020-04-012021-03-310001004315ifrs-full:InterestRateRiskMembercountry:US2021-03-310001004315ifrs-full:CurrencyRiskMember2021-04-012022-03-310001004315ifrs-full:CurrencyRiskMember2020-04-012021-03-310001004315ifrs-full:CommodityPriceRiskMember2021-04-012022-03-310001004315ifrs-full:CommodityPriceRiskMember2022-03-310001004315ifrs-full:CommodityPriceRiskMember2020-04-012021-03-310001004315ifrs-full:CommodityPriceRiskMember2021-03-310001004315nggtf:FairValueChangeMembernggtf:DerivativeFinancialInstrumentsMember2021-04-012022-03-310001004315nggtf:FairValueChangeMembernggtf:DerivativeFinancialInstrumentsMember2022-03-310001004315nggtf:FairValueChangeMembernggtf:DerivativeFinancialInstrumentsMember2020-04-012021-03-310001004315nggtf:FairValueChangeMembernggtf:DerivativeFinancialInstrumentsMember2021-03-310001004315nggtf:FairValueChangeMembernggtf:CommodityContractDerivativeLiabilitiesMember2021-04-012022-03-310001004315nggtf:FairValueChangeMembernggtf:CommodityContractDerivativeLiabilitiesMember2022-03-310001004315nggtf:FairValueChangeMembernggtf:CommodityContractDerivativeLiabilitiesMember2020-04-012021-03-310001004315nggtf:FairValueChangeMembernggtf:CommodityContractDerivativeLiabilitiesMember2021-03-310001004315nggtf:SubsidiaryGuarantorNationalGridGasplcMember2007-10-292007-10-290001004315nggtf:IssuerOfNotesBritishTranscoFinanceInc.Member2007-10-292007-10-290001004315nggtf:ParentGuarantorAndNiagaraMohawkPowerCorporationMember2021-04-012022-03-310001004315nggtf:OthersubsidiariesMember2022-03-310001004315nggtf:ParentGuarantorAndNiagaraMohawkPowerCorporationMember2022-03-310001004315nggtf:OthersubsidiariesMember2021-04-012022-03-310001004315nggtf:PPLWPDInvestmentsLimitedWPDMember2021-06-140001004315nggtf:PPLWPDInvestmentsLimitedWPDMembernggtf:PPLWPDInvestmentsLimitedWPDMember2021-06-140001004315nggtf:PPLWPDInvestmentsLimitedWPDMember2021-06-142021-06-140001004315nggtf:PPLWPDInvestmentsLimitedWPDMembernggtf:PPLWPDInvestmentsLimitedWPDMember2021-06-142021-06-140001004315ifrs-full:TradeReceivablesMembernggtf:PPLWPDInvestmentsLimitedWPDMember2021-06-140001004315nggtf:PPLWPDInvestmentsLimitedWPDMember2020-04-012022-03-310001004315nggtf:PPLWPDInvestmentsLimitedWPDMember2020-04-012021-03-310001004315ifrs-full:EnteringIntoSignificantCommitmentsOrContingentLiabilitiesMembernggtf:InterconnectorRevenueMember2022-05-11
SECURITIES AND EXCHANGE COMMISSION
Washington, D.C. 20549
FORM 20-F
(Mark One)
| | | | | |
| £ | REGISTRATION STATEMENT PURSUANT TO SECTION 12(b) OR (g) OF THE SECURITIES EXCHANGE ACT OF 1934 |
| |
| OR |
|
| R | ANNUAL REPORT PURSUANT TO SECTION 13 OR 15(d) OF THE SECURITIES EXCHANGE ACT OF 1934 |
| |
| For the fiscal year ended 31 March 2022 |
| |
| OR |
|
`£ | TRANSITION REPORT PURSUANT TO SECTION 13 OR 15(d) OF THE SECURITIES EXCHANGE ACT OF 1934 |
| |
| OR |
|
| £ | SHELL COMPANY REPORT PURSUANT TO SECTION 13 OR 15(d) OF THE SECURITIES EXCHANGE ACT OF 1934 |
| |
| Date of event requiring this shell company report |
| |
| For the transition period from to |
Commission file number: 001-14958
NATIONAL GRID PLC
(Exact name of Registrant as specified in its charter)
England and Wales
(Jurisdiction of incorporation or organization)
1-3 Strand, London WC2N 5EH, England
(Address of principal executive offices)
Justine Campbell
011 44 20 7004 3000
Facsimile No. 011 44 20 7004 3004
Group General Counsel and Company Secretary
National Grid plc
1-3 Strand London WC2N 5EH, England
(Name, Telephone, E-mail and/or Facsimile number and Address of Company Contact Person)
Securities registered or to be registered pursuant to Section 12(b) of the Securities Exchange Act of 1934:
| | | | | | | | |
| Title of each class | Trading Symbol(s) | Name of each exchange on which registered |
| Ordinary Shares of 12 204/473 pence each | NG | The New York Stock Exchange* |
| American Depositary Shares, each representing five | NGG | The New York Stock Exchange |
| | |
| Preferred Stock ($100 par value-cumulative): | | |
| 3.90% Series | NMK PR C | The New York Stock Exchange |
| 3.60% Series | NMK PR B | The New York Stock Exchange |
____________
* Not for trading, but only in connection with the registration of American Depositary Shares representing Ordinary Shares pursuant to the requirements of the Securities and Exchange Commission.
Securities registered or to be registered pursuant to Section 12(g) of the Securities Exchange Act of 1934: None.
Securities for which there is a reporting obligation pursuant to Section15(d) of the Securities Exchange Act of 1934: None.
The number of outstanding shares of each of the issuer’s classes of capital or common stock as of 31 March 2022 was
Ordinary Shares of 12 204/473 pence each 3,904,074,348
Indicate by check mark if the registrant is a well-known seasoned issuer, as defined in Rule 405 of the Securities Act: Yes R No £
If this report is an annual or transition report, indicate by check mark if the registrant is not required to file reports pursuant to Section 13 or 15(d) of the Securities Exchange Act of 1934. Yes £ No R
Note — Checking the box above will not relieve any registrant required to file reports pursuant to Section 13 or 15(d) of the Securities Exchange Act of 1934 from their obligations under those Sections.
Indicate by check mark whether the registrant (1) has filed all reports required to be filed by Section 13 or 15(d) of the Securities Exchange Act of 1934 during the preceding 12 months (or for such shorter period that the registrant was required to file such reports), and (2) has been subject to such filing requirements for the past 90 days: Yes R No £
Indicate by check mark whether the registrant has submitted electronically and posted on its corporate website, if any, every Interactive Data File required to be submitted and posted pursuant to Rule 405 of Regulation S-T (§ 232.405 of this chapter) during the preceding 12 months (or for such shorter period that the registrant was required to submit and post such files): Yes R No £
Indicate by check mark whether the registrant has submitted electronically every Interactive Data File required to be submitted pursuant to Rule 405 of Regulation S-T (§ 232.405 of this chapter) during the preceding 12 months (or for such shorter period that the registrant was required to submit such files).: Yes R No £
Indicate by check mark whether the registrant is a large accelerated filer, an accelerated filer, a non-accelerated filer or an emerging growth company. See definition of “large accelerated filer” “accelerated filer” and “emerging growth company” in Rule 12b-2 of the Exchange Act.
| | | | | | | | |
Large accelerated filer R Non-accelerated filer £ | | Accelerated filer £ Emerging growth company £ |
If an emerging growth company that prepares its financial statements in accordance with U.S. GAAP, indicate by check mark if the registrant has elected not to use the extended transition period for complying with any new or revised financial accounting standards† provided pursuant to Section 13(a) of the Exchange Act. ☐
†The term “new or revised financial accounting standard” refers to any update issued by the Financial Accounting Standards Board to its Accounting Standards Codification after April 5, 2012.
Indicate by check mark whether the registrant has filed a report on and attestation to its management’s assessment of the effectiveness of its internal control over financial reporting under Section 404(b) of the Sarbanes-Oxley Act (15 U.S.C. 7262(b)) by the registered public accounting firm that prepared or issued its audit report. R
Indicate by check mark which basis of accounting the registrant has used to prepare the financial statements included in this filing:
U.S. GAAP £
International Financial Reporting Standards as issued by the International Accounting Standards Board R
Other £
If “Other” has been checked in response to the previous question, indicate by check mark which financial statement item the registrant has elected to follow. Item 17 £ Item 18 £
If this is an annual report, indicate by check mark whether the registrant is a shell company (as defined in Rule 12b-2 of the Exchange Act). Yes £ No R
This constitutes the annual report on Form 20-F of National Grid plc (the “Company”) in accordance with the requirements of the US Securities and Exchange Commission (the “SEC”) for the year ended 31 March 2022 and is dated 7 June 2022. Details of events occurring subsequent to the approval of the annual report on 18 May 2022 are summarised in section “Further Information” which forms a part of this Form 20-F. The content of the Group’s website (www.nationalgrid.com/uk) should not be considered to form part of this annual report on Form 20-F.
Form 20-F Cross Reference Table
| | | | | | | | | | | |
| Item | Form 20-F caption | Location in the document | Page(s) |
| 1 | Identity of directors, senior management and advisors | Not applicable | – |
| 2 | Offer statistics and expected timetable | Not applicable | – |
| 3 | Key Information | | |
| 3A [Reserved] | | |
| 3B Capitalization and indebtedness | Not applicable | – |
| 3C Reasons for the offer and use of proceeds | Not applicable | – |
| 3D Risk Factors | “Additional Information—Internal control and risk factors—Risk factors” | 253-256 |
| 4 | Information on the company | | |
| 4A History and development of the company | “Additional Information—Want more information or help?” | 287 |
| | “Strategic Report—Business Model: “What We do” | 4-5 |
| | “Strategic Report—Business Model: “How we operate” | 6-7 |
| | “Strategic Report—Chair’s Statement” | 10-11 |
| | “Strategic Report—Chief Executive’s Statement” | 12-14 |
| | “Strategic Report—Our business environment” | 15-19 |
| | “Strategic Report—Succeeding with our Strategy” | 20-21 |
| | “Strategic Report—Innovation” | 22-23 |
| | “Strategic Report—Our Business unit UK Electricity Transmission”; | 50 |
| | “Strategic Report—Our business units—UK Electricity Distribution” | 51 |
| | “Strategic Report—Our business units—UK Gas Transmission | 52 |
| | “Strategic Report—Our business units—UK Electricity System Operator (ESO)” | 52 |
| | “Strategic Report—Our business units—New England” | 53 |
| | “Strategic Report—Our business units—New York” | 54 |
| | “Strategic Report—Our business—National Grid Ventures and other activities” | 55 |
| | “Additional Information—Other unaudited financial information—Alternative performance measures/non-IFRS reconciliations—Capital investment | 273 |
| | “Additional Information—Shareholder information—Articles of Association—General” | 257-258 |
| | “Strategic Report—Financial Review—Summary of Group financial performance for the year ended 31 March 2022” | 37-49 |
| | “Financial Statements—Notes to the consolidated financial statements—2. Segmental analysis—(c) Capital expenditure” | 157 |
| | “Financial Statements—Notes to the consolidated financial statements—10. Assets held for sale and discontinued operations | 173-175 |
| | “Financial Statements—Notes to the consolidated financial statements—37. Acquisitions—Acquisition of WPD” | 233-234 |
| | “Additional Information—The business in detail—UK Regulation”; “—US Regulation” and “—Summary of US price controls and rate plans” | 245-252 |
| | “Additional Information—The business in detail: Where we operate” | 244 |
| | | | | | | | | | | |
| | “Additional Information—Shareholder Information— Documents on display” | 258 |
| 4B Business overview | “Strategic Report—Business Model” | 4-9 |
| | “Strategic Report—Our Business environment” | 15-19 |
| | “Additional Information—The business in detail” | 245-252 |
| | “Strategic Report—Business Model: What we do”; — and “How we operate” | 4-7 |
| | “Strategic Report—Business Model: “—Chair’s Statement” | 10-11 |
| | “Strategic Report—Succeeding with our strategy” | 20-21 |
| | “Strategic Report—Innovation” | 22-23 |
| | “Strategic Report—Financial Review—Segmental operating profit” | 39-42 |
| | “Strategic Report—Our Business unit UK Electricity Transmission”; | 50 |
| | “Strategic Report—Our business units—UK Electricity Distribution” | 51 |
| | “Strategic Report—Our business units—UK Gas Transmission | 52 |
| | “Strategic Report—Our business units—UK Electricity System Operator (ESO)” | 52 |
| | “Strategic Report—Our business units—New England” | 53 |
| | “Strategic Report—Our business units—New York” | 54 |
| | “Strategic Report—Our business—National Grid Ventures and other activities” | 55 |
| | “Financial Statements—Notes to the consolidated financial statements—2. Segmental analysis” | 156-157 |
| | “Financial Statements—Notes to the consolidated financial statements—17. Derivative financial instruments—(b) Commodity contract derivatives” | 188-189 |
| | “Additional Information—The business in detail: Where we operate” | 244 |
| | “Additional Information—The business in detail—UK Regulation” | 245-247 |
| | “Additional Information —The business in detail—US Regulation” | 248-252 |
| 4C Organizational structure | “Financial Statements—Notes to the consolidated financial statements—34. Subsidiary undertakings, joint ventures and associates” | 225-229 |
| 4D Property, plants and equipment | “Additional Information—The business in detail: Where we operate” | 244 |
| | “Additional Information—The business in detail—Other disclosures—Property, plant and equipment” | 263 |
| | “Strategic Report—Financial Review—Financial Position”; | 46 |
| | “Financial Statements- Notes to the consolidated financial statements-5. Exceptional items and remeasurements—Exceptional items—2021—Changes in environmental provisions and "— 2020—Changes in environmental provision” | 165-166 |
| | “Financial Statements—Notes to the consolidated financial statements—10. Assets held for sale and discontinued operations” | 173-175 |
| | Financial Statements—Notes to the consolidated financial statements—13. Property, plant and equipment” | 180-182 |
| | “Financial Statements—Notes to the consolidated financial statements—21. Borrowings” | 192-194- |
| | Strategic report—Financial Review—Discontinued operations” | 42 |
| | “Financial Statements—Consolidated statement of financial position” | 151 |
| | | | | | | | | | | |
| | “Financial Statements—Notes to the consolidated financial statements—37. Acquisitions—Acquisition of WPD” | 233-234 |
| | “Additional Information—Other unaudited financial information—Alternative performance measures/non-IFRS reconciliations—Capital investment” | 273 |
| | “Strategic Report-Task force on climate-related financial disclosures (TCFD)” | 70-83 |
| | “Strategic Report—Our business environment – Net Zero” | 16-17 |
| | “Strategic Report—Our commitment to being a responsible business—The Environment” | 67-68 |
| 4A | Unresolved staff comments | “Additional Information—Other disclosures—Unresolved SEC staff comments” | 263 |
| 5 | Operating and financial review and prospects | | |
| 5A Operating results | “Strategic Report—Business Model: “How we operate” | 6-7 |
| | “Strategic Report—Our business environment” | 15-19 |
| | “Strategic Report—Financial review” | 36-49 |
| | “Strategic Report—Our Business unit UK Electricity Transmission”; | 50 |
| | “Strategic Report—Our business units—UK Electricity Distribution” | 51 |
| | “Strategic Report—Our business units—UK Gas Transmission | 52 |
| | “Strategic Report—Our business units—UK Electricity System Operator (ESO)” | 52 |
| | “Strategic Report—Our business units—New England” | 53 |
| | “Strategic Report—Our business units—New York” | 54 |
| | “Strategic Report—Our business—National Grid Ventures and other activities” | 55 |
| | “Additional Information—The business in detail—UK Regulation” | 245-247 |
| | “Additional Information —The business in detail—US Regulation” | 248-252 |
| | “Additional Information “—Summary of US price controls and rate plans” | 252 |
| | “Financial Statements—Notes to the consolidated financial statements—2. Segmental analysis” | 156-157 |
| | “Additional Information—Commentary on consolidated financial statements” | 280-281 |
| | “Financial Statements—Notes to the consolidated financial statements—32. Financial risk management—(c) Currency risk” | 215 |
| | “Additional Information—Internal control and risk factors—Risk factors—Law, regulation and political and economic uncertainty” | 253 |
| 5B Liquidity and capital resources | “Strategic Report—Financial review” | 36-49 |
| | “Additional Information—Internal control and risk factors—Risk factors—Financing and liquidity” | 255 |
| | “Financial Statements—Consolidated cash flow statement” | 152 |
| | “Financial Statements—Notes to the consolidated financial statements—1.A Going concern” | 153 |
| | “Financial Statements—Notes to the consolidated financial statements—17. Derivative financial instruments” | 187-189 |
| | “Financial Statements—Notes to the consolidated financial statements—20. Cash and cash equivalents” | 191 |
| | “Financial Statements—Notes to the consolidated financial statements—21. Borrowings” | 192-194 |
| | | | | | | | | | | |
| | “Financial Statements—Notes to the consolidated financial statements—29. Net debt” | 208-209 |
| | “Financial Statements—Notes to the consolidated financial statements—30. Commitments and contingencies” | 210 |
| | “Financial Statements—Notes to the consolidated financial statements—32. Financial risk management” | 211-223 |
| | “Financial Statements—Notes to the consolidated financial statements—33. Borrowing facilities” | 224 |
| 5C Research and development, patents and licenses, etc. | “Strategic Report—Innovation” | 22-23 |
| | “Additional Information—Other disclosures—Research, development and innovation activity” | 264-267 |
| 5D Trend information | “Strategic Report—Financial review” | 36-49 |
| 5E Critical Accounting Estimates | Not applicable | |
| 6 | Directors, senior management and employees | | |
| 6A Directors and senior management | “Corporate Governance—Our Board” | 88-89 |
| 6B Compensation | “Corporate Governance-Directors’ Remuneration Report–Annual statement from the Remuneration Committee Chair” | 108-110 |
| | “Corporate Governance—Directors’ Remuneration Report at a Glance” | 111-113 |
| | “Corporate Governance – Directors’ Remuneration Report-Statement of implementation of remuneration policy in 2020/21” | 114-123 |
| | “Corporate Governance-Directors’ Remuneration Report–Statement of implementation of remuneration policy in 2020/21–Single total figure of remuneration–Executive Directors” | 114 |
| | “Corporate Governance–Directors’ Remuneration Report-Statement of implementation of remuneration policy in 2020/21 – Single total figure of remuneration – Non-executive Directors” | 121-122 |
| | “Financial Statements—Notes to the consolidated financial statements—4. Other operating income and costs—(c) Key management compensation” | 163 |
| 6C Board practices | “Corporate Governance—Our Board” | 88-89 |
| | “Additional Information—Shareholder Information—Articles of Association—Directors” | 257 |
| | “Corporate Governance—Corporate Governance Overview” | 90-98 |
| | “Corporate Governance—Audit & Risk Committee Report” | 101-105 |
| | “Corporate Governance—Directors’ Remuneration Report” | 124-130 |
| 6D Employees | “Strategic Report—Business Model | 4-7 |
| | “Strategic Report – Gender Demographics as at 31 March 2021” | 66 |
| | “Financial Statements—Notes to the consolidated financial statements—4. Operating costs—(b) Number of employees” | 162 |
| 6E Share ownership | “Corporate Governance—Directors’ Remuneration Report—Statement of implementation of remuneration policy in 2020/21” | 114-123 |
| | “Additional Information—Other disclosures—All-employee share plans” | 262 |
| | “Share ownership” | “Further Information” |
| 7 | Major shareholders and related party transactions | | |
| 7A Major shareholders | “Additional Information—Shareholder information—Material interests in shares” | 259 |
| | | | | | | | | | | |
| | “Material interests in shares” and “Material interest in American Depositary Shares” | “Further Information” |
| 7B Related party transactions | “Financial Statements—Notes to the consolidated financial statements—30. Commitment and contingencies” | 210 |
| | “Financial Statements—Notes to the consolidated financial statements—31. Related Party transactions” | 211 |
| | “Material interests in shares” | “Further Information” |
| 7C Interests of experts and counsel | Not applicable | – |
| 8 | Financial information | | |
| 8A Consolidated statements and other financial information | Financial Statements— “Financial Statements” | 147-234 |
| | “Reports of Independent Registered Public Accounting Firm—Audit opinions for Form 20-F” | “Further Information” |
| | “Corporate Governance-Audit and Risk Committee-Significant issues/judgements relating to the financial statements-Application of the Group’s exceptional items framework to certain events in the period” | 102 |
| | “Financial Statements- Notes to the consolidated financial statements-Note 5. Exceptional items and remeasurements” | 164-166 |
| | “Strategic Report—Chair’s Statement” | 10-11 |
| | “Strategic Report – Corporate governance overview – Board focus during the year” | 92-94 |
| | “Strategic Report—Financial review” | 36-49 |
| | “Financial Statements—Notes to the consolidated financial statements—9. Dividends” | 173 |
| 8B Significant changes | “Strategic Report—Financial Review—Post balance sheet events” | 49 |
| | “Financial Statements—Notes to the consolidated financial statements—38. Post balance sheet events” | 234 |
| | “Additional Information—Shareholder Information—Events after the reporting period” | 258 |
| | “Subsequent events” | “Further Information” |
| 9 | The offer and listing | | |
| 9A Offer and listing details | “Additional Information—Shareholder Information—Share information” | 258 |
| 9B Plan of distribution | Not applicable | |
| 9C Markets | “Additional Information—Shareholder information—Share Information” | 258 |
| 9D Selling shareholders | Not applicable | – |
| 9E Dilution | Not applicable | – |
| 9F Expenses of the issue | Not applicable | – |
| 10 | Additional information | | |
| 10A Share capital | Not applicable | – |
| 10B Memorandum and articles of association | “Additional Information—Shareholder Information—Articles of Association” | 257-258 |
| | “Additional Information—Shareholder Information—Other disclosures—Change of control provisions” | 262 |
| | “Additional Information—Other disclosures—Corporate governance practices: differences from New York Stock Exchange (NYSE) listing standards” | 262 |
| | “Additional Information—Shareholder information—Share capital” | 259 |
| 10C Material contracts | “Additional Information—Other disclosures—Material contracts” | 264 |
| 10D Exchange controls | “Additional Information—Shareholder information—Exchange controls” | 258 |
| | | | | | | | | | | |
| 10E Taxation | “Additional Information——Shareholder information—Taxation” | 260-261 |
| 10F Dividends and paying agents | Not applicable | – |
| 10G Statement by experts | Not applicable | – |
| 10H Documents on display | “Additional Information—Shareholder information—Documents on display” | 258 |
| 10I Subsidiary information | Not applicable | – |
| 11 | Quantitative and qualitative disclosures about market risk | | |
| 11(a) Quantitative information about market risk | “Additional Information—Internal Control and Risk factors—Risk Factors” | 253-256 |
| | “Financial Statements—Notes to the consolidated financial statements—17. Derivative financial instruments” | 187-189 |
| | “Financial Statements—Notes to the consolidated financial statements—32. Financial risk management” | 211-223 |
| 11(b) Qualitative information about market risk | “Financial Statements—Notes to the consolidated financial statements—35. Sensitivities” | 230-231 |
| 11(c) Interim Periods | Not Applicable | |
| 11(d) Forward looking statement safe harbor | “Additional Information—Cautionary statement” | 288 |
| 12 | Description of securities other than equity securities | | |
| 12A Debt securities | Not applicable | – |
| 12B Warrants and rights | Not applicable | – |
| 12C Other securities | Not applicable | – |
| 12D American depositary shares | “Additional Information—Shareholder information—Depositary payments to the Company” | 258 |
| | “Additional Information—Definitions and glossary of terms” | 283-286 |
| | “Material interest in American Depositary Shares” | “Further Information” |
| 13 | Defaults, dividend arrearages and delinquencies | Not applicable | – |
| 14 | Material modifications to the rights of security holders and use of proceeds | Not applicable | – |
| 15 | Controls and procedures | | |
| 15(a) Disclosure controls and procedures | “Additional information —Internal control and risk factors—Disclosure controls | 253 |
| 15(b) Management’s annual report on internal control over financial reporting | “Additional Information—Internal control and risk factors——Internal control over financial reporting” | 253 |
| | “Corporate Governance—Audit & Risk Committee Report” | 101-105 |
| 15(c) Attestation report of the registered public accounting firm | “Report of Independent Registered Public Accounting Firm—Audit opinions for Form 20-F” | “Further Information” |
| 16 | 16A Audit committee financial expert | “Corporate Governance—Our Board” | 88-89 |
| 16B Code of ethics | “Additional Information—Other disclosures—Code of Ethics” | 262 |
| 16C Principal accountant fees and services | “Corporate Governance—Audit & Risk Committee—External audit—External Auditor fees” | 105 |
| | “Corporate Governance—Audit & Risk Committee—External auditor fees”, “—Non-audit Services” | 105 |
| | “Financial Statements—Notes to the consolidated financial statements—Note 4. Other operating income and costs—(d) Auditors’ remuneration” | 163 |
| 16D Exemptions from the listing standards for audit committees | Not applicable | – |
| 16E Purchases of equity securities by the issuer and affiliated purchasers | “Additional Information—Shareholder information—Share capital—Authority to purchase shares” | 259 |
| 16F Change in registrant’s certifying accountant | Not applicable | – |
| | | | | | | | | | | |
| 16G Corporate governance | “Additional Information—Other disclosures—Corporate governance practices: differences from New York Stock Exchange (NYSE) listing standards” | 262 |
| 16H Mine safety disclosure | Not applicable | – |
| 16I Disclosure Regarding Foreign Jurisdictions that Prevent Inspections | Not Applicable | |
| 17 | Financial statements | Not applicable | – |
| 18 | Financial statements | Financial Statements— “Financial Statements” | 147-234 |
| | “Financial Statements— Reports of Independent Registered Public Accounting Firm—Audit opinions for Form 20-F” | “Further Information” |
| 19 | Exhibits | Filed with the SEC | – |
Bring energy to life Annual Report and Accounts 2021/22
We see the future. It’s filled with infinite possibilities. That’s why we are... Our vision is to be at the heart of a clean, fair and affordable energy future. Every day we do the right thing, find a better way, and make it happen. We are working right now to deliver net zero and keep the network safe and reliable. Read more about what we are ‘Doing Right Now’ to enable a clean energy transition in the case studies that feature throughout this report. You can identify these by looking for this icon. Doing Right Now

Strategic Report 4 Business model 8 Our unique investment proposition 10 Chair’s statement 12 Chief Executive’s review 15 Our business environment 20 Succeeding with our strategy 22 Innovation 24 Key performance indicators 28 Internal control and risk management 33 Viability statement 36 Financial review 50 Our business units 56 Our stakeholders – Section 172(1) statement 60 Our commitment to being a responsible business 70 Task Force on Climate-related Financial Disclosures Corporate Governance 86 Governance at a glance 86 UK Corporate Governance Code – 2021/22 Compliance Statement 87 Chair’s statement 88 Our Board 90 Corporate Governance overview 99 Committee reports Financial Statements 134 Statement of Directors’ responsibilities 135 Independent auditor’s report 147 Consolidated financial statements 235 Company financial statements Additional Information 245 The business in detail 253 Internal control and risk factors 257 Shareholder information 262 Other disclosures 268 Other unaudited financial information 280 Commentary on consolidated financial statements 282 Five-year summary financial information 283 Definitions and glossary of terms 287 Want more information or help? 288 Cautionary statement Group financial highlights Group operational highlights Further reading Statutory earnings per share EPS (p)* 60.6p 37.0 29.7 20/21 19/20 Group safety performance (lost time injuries per 100,000 hours worked in 12-month period) 0.13 0.10 0.13 20/21 19/20 Underlying EPS (p)* 65.3p 42.4 47.9 20/21 19/20 Scope 1 and 2 greenhouse gas emissions (CO2 equivalent, m tonnes) 7.5 6.9 6.5 20/21 19/20 Group Return on Equity (RoE) % 11.4% 10.6 12.0 20/21 19/20 Employee engagement (%) 81% 81 77 20/21 19/20 * From continuing operations. Prior year comparatives restated for treatment of UK Gas Transmission as a discontinued operation. Front cover The North Sea offers an incredible opportunity for the UK and our European neighbours to migrate to a cleaner energy system, as we increase connections to renewable energy sources from the North Sea. We were excited to be a principal partner for COP26. COP stands for Conference of the Parties. You can read more about our involvement on pages 16 − 17. For more information, visit nationalgrid.com/responsibility/ environment/cop26. QR codes Throughout the report there are QR codes you can scan to view content online. Simply open the camera app on your smartphone to scan the code. Online report The PDF of our Annual Report and Accounts 2021/22 includes a full search facility. You can find the document by visiting the ‘About us’ section at nationalgrid.com/ investors/resources. Responsible business National Grid has published its annual Responsible Business Report (RBR). The RBR reports progress on the responsible business agenda, including towards the commitments made in our Responsible Business Charter (RBC). You can find both documents by visiting nationalgrid.com/responsibility. Reporting currency Our financial results are reported in sterling. We convert our US business results at the weighted average exchange rate during the year, which for 2021/22 was $1.35 to £1 (2020/21: $1.34 to £1). Alternative performance measures In addition to IFRS figures, management also uses a number of ‘alternative measures’ to assess performance. Definitions and reconciliations to statutory financial information can be found on pages 268 – 279. These measures are highlighted with the symbol above. Further reading Throughout this report you can find links to further detail within this document. PwC Assured Data Denotes information subject to limited assurance by PricewaterhouseCoopers LLP; see page 61 for full definition. 1National Grid plc Annual Report and Accounts 2021/22 S trateg ic R ep o rt C o rp o rate G o vernance Financial S tatem ents A d d itio nal Info rm atio n Highlights 02_Highlights_Contents_p01_v54.indd 1 27/05/2022 16:34

Business model 4 – 7 Our unique investment proposition 8 – 9 Chair’s statement 10 – 11 Chief Executive’s review 12 – 14 Our business environment 15 – 19 Succeeding with our strategy 20 – 21 Innovation 22 – 23 Key performance indicators 24 – 27 Internal control and risk management 28 – 32 Viability statement 33 – 35 Financial review 36 – 49 Our business units 50 – 55 UK Electricity Transmission 50 UK Electricity Distribution 51 UK Gas Transmission 52 UK Electricity System Operator 52 New England 53 New York 54 National Grid Ventures and Other activities 55 Our stakeholders – Section 172(1) statement 56 – 59 Our commitment to being a responsible business 60 – 69 Task Force on Climate-related Financial Disclosures (TCFD) 70 – 83 Doing Right Now Fossil-free future We aim to fully eliminate fossil fuels from our US gas and electric systems, enabling the customers and communities we serve to meet their heating needs without using fossil fuels by 2050, if not sooner. To achieve our ambition, we are proposing a hybrid approach, with a combination of electric heat pumps, fossil-free gas and hybrid gas-electric systems. National Grid plc Annual Report and Accounts 2021/222 03_Business_model_p02_07_v84.indd 2 27/05/2022 16:35

Strategic Report S trateg ic R ep o rt National Grid plc Annual Report and Accounts 2021/22 3 03_Business_model_p02_07_v84.indd 3 27/05/2022 16:36
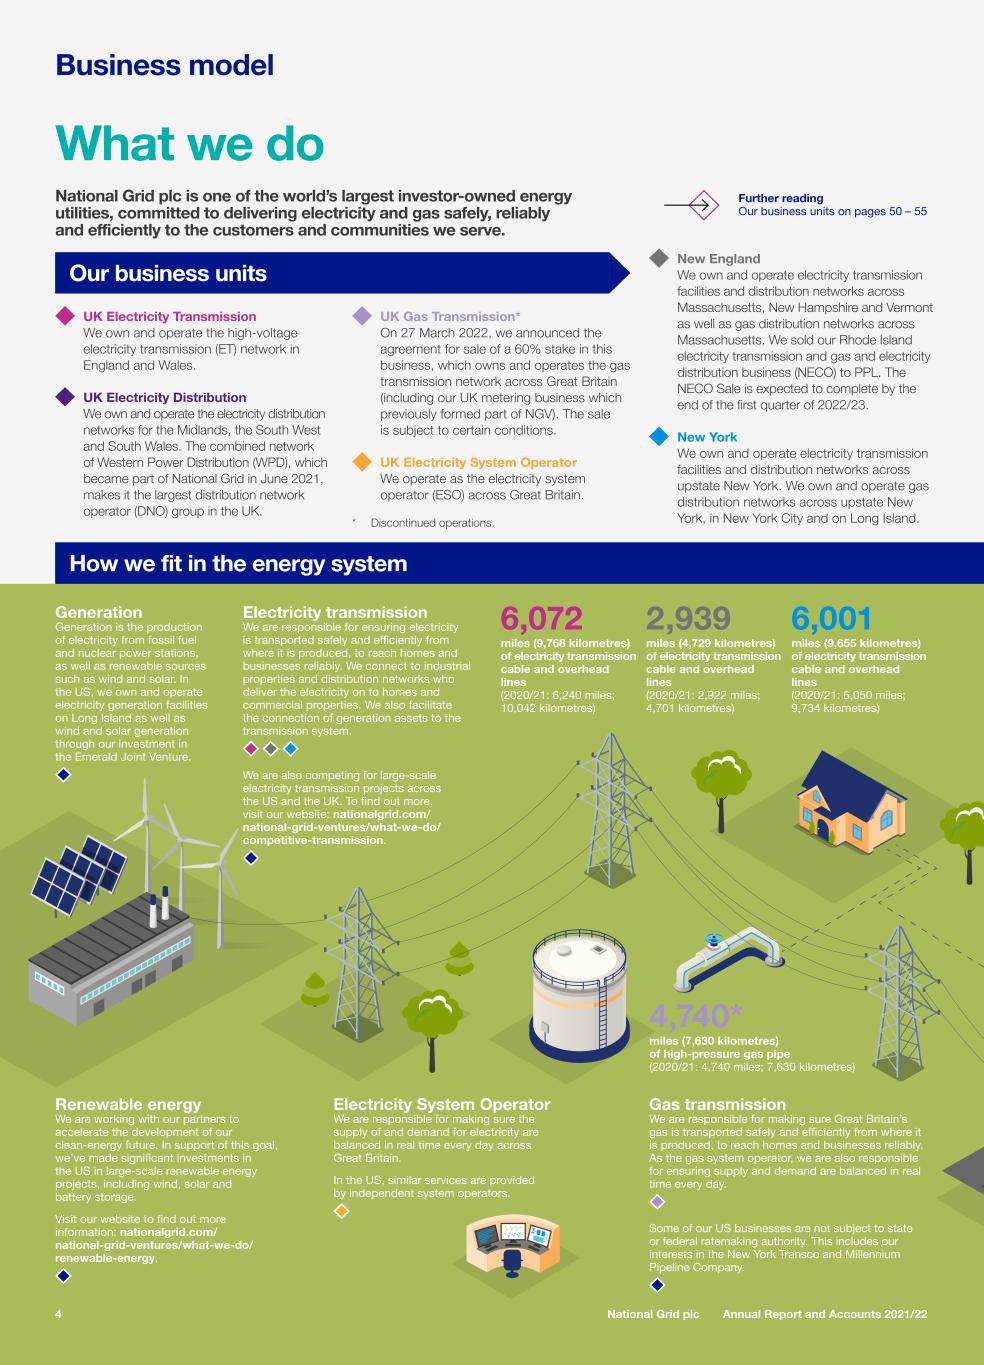
UK Electricity Transmission We own and operate the high-voltage electricity transmission (ET) network in England and Wales. UK Electricity Distribution We own and operate the electricity distribution networks for the Midlands, the South West and South Wales. The combined network of Western Power Distribution (WPD), which became part of National Grid in June 2021, makes it the largest distribution network operator (DNO) group in the UK. UK Gas Transmission* On 27 March 2022, we announced the agreement for sale of a 60% stake in this business, which owns and operates the gas transmission network across Great Britain (including our UK metering business which previously formed part of NGV). The sale is subject to certain conditions. UK Electricity System Operator We operate as the electricity system operator (ESO) across Great Britain. New England We own and operate electricity transmission facilities and distribution networks across Massachusetts, New Hampshire and Vermont as well as gas distribution networks across Massachusetts. We sold our Rhode Island electricity transmission and gas and electricity distribution business (NECO) to PPL. The NECO Sale is expected to complete by the end of the first quarter of 2022/23. New York We own and operate electricity transmission facilities and distribution networks across upstate New York. We own and operate gas distribution networks across upstate New York, in New York City and on Long Island. Further reading Our business units on pages 50 – 55 Electricity transmission We are responsible for ensuring electricity is transported safely and efficiently from where it is produced, to reach homes and businesses reliably. We connect to industrial properties and distribution networks who deliver the electricity on to homes and commercial properties. We also facilitate the connection of generation assets to the transmission system. We are also competing for large-scale electricity transmission projects across the US and the UK. To find out more, visit our website: nationalgrid.com/ national-grid-ventures/what-we-do/ competitive-transmission. Electricity System Operator We are responsible for making sure the supply of and demand for electricity are balanced in real time every day across Great Britain. In the US, similar services are provided by independent system operators. Gas transmission We are responsible for making sure Great Britain’s gas is transported safely and efficiently from where it is produced, to reach homes and businesses reliably. As the gas system operator, we are also responsible for ensuring supply and demand are balanced in real time every day. Some of our US businesses are not subject to state or federal ratemaking authority. This includes our interests in the New York Transco and Millennium Pipeline Company. Generation Generation is the production of electricity from fossil fuel and nuclear power stations, as well as renewable sources such as wind and solar. In the US, we own and operate electricity generation facilities on Long Island as well as wind and solar generation through our investment in the Emerald Joint Venture. Renewable energy We are working with our partners to accelerate the development of our clean-energy future. In support of this goal, we’ve made significant investments in the US in large-scale renewable energy projects, including wind, solar and battery storage. Visit our website to find out more information: nationalgrid.com/ national-grid-ventures/what-we-do/ renewable-energy. 4,740* miles (7,630 kilometres) of high-pressure gas pipe (2020/21: 4,740 miles; 7,630 kilometres) 6,072 miles (9,768 kilometres) of electricity transmission cable and overhead lines (2020/21: 6,240 miles; 10,042 kilometres) 2,939 miles (4,729 kilometres) of electricity transmission cable and overhead lines (2020/21: 2,922 miles; 4,701 kilometres) 6,001 miles (9,655 kilometres) of electricity transmission cable and overhead lines (2020/21: 6,050 miles; 9,734 kilometres) Our business units How we fit in the energy system National Grid plc is one of the world’s largest investor-owned energy utilities, committed to delivering electricity and gas safely, reliably and efficiently to the customers and communities we serve. * Discontinued operations. National Grid plc Annual Report and Accounts 2021/224 What we do Business model 03_Business_model_p02_07_v84.indd 4 27/05/2022 16:36

Regulatory asset value (RAV), rate base and other assets (%) 26% 16% 11% 1% 16% 22% 8% Statutory operating profit (%)* 24% 21% 0% 17% 25% 13% Underlying operating profit (%)* 29% 22% 1% 22% 18% 8% National Grid Ventures and Other activities National Grid Ventures (NGV), which operates separately from our core regulated units, is focused on competitive markets across the UK and US. Its portfolio includes electricity interconnectors, liquefied natural gas (LNG) storage and regasification, large-scale renewable generation, conventional generation and competitive transmission. Other activities primarily relate to National Grid Partners (NGP), the venture investment and innovation arm of National Grid, as well as UK property, insurance and corporate activities. Gas distribution In the US, we deliver gas safely and reliably to millions of consumers connected to our distribution systems. Some of our customers pay us for distribution and gas supply costs. Where they choose to buy gas from third parties, they pay us for distribution only. Electricity distribution We own and operate the power lines and infrastructure that connect the transmission network to the properties of individual consumers. Distribution networks convert high-voltage electricity generated by large power stations, and delivered through the transmission network, to lower voltages. This is then delivered safely and reliably into homes and businesses via our networks. Electricity interconnection Interconnectors are high-voltage cables used to connect the electricity systems of neighbouring countries. They allow us to trade excess power, such as renewable energy created by the sun, wind and water, between different countries. We already have interconnectors linking us to France, Belgium, Norway and the Netherlands, and each year they power five million homes. We’re currently working on another interconnector to link us with Denmark. Storage Grain LNG is one of three import terminals in the UK. Our world-class facility delivers the highest standards of performance for our customers. We import LNG from a number of countries and also own storage facilities in the US. Innovation We created NGP which is involved in incubating and investing in startups at the intersection of energy and emerging tech, launching new businesses from scratch, business development, and infusing an entrepreneurial culture into National Grid. NGP aims to create a smarter, renewable future. 141,261 miles (227,337 kilometres) of electricity distribution circuits (2020/21: 141,081 miles; 227,000 kilometres) 14,397 miles (23,165 kilometres) of gas pipelines (2020/21: 14,372 miles; 23,125 kilometres) 22,359 miles (35,975 kilometres) of gas pipelines (2020/21: 21,388 miles; 34,413 kilometres) 63 ships unloaded at the Grain LNG terminal (2020/21: 49 ships) 24,755 miles (39,831 kilometres) of electricity distribution circuits (2020/21: 24,706 miles; 39,752 kilometres) 44,536 miles (71,658 kilometres) of electricity distribution circuits (2020/21: 44,063 miles; 70,897 kilometres) 6.4 GW capacity of interconnectors in operation (2020/21: 5 GW) How we fit in the energy system * From continuing operations. S trateg ic R ep o rt National Grid plc Annual Report and Accounts 2021/22 5 03_Business_model_p02_07_v84.indd 5 27/05/2022 16:36

Our strategyOur resources and relationships Internal resources Physical assets We own electricity and gas networks that transmit energy over long distances from where it is produced, together with low voltage local networks that distribute energy to the consumers who rely on it. These networks are built to last for many decades and account for the vast majority of our asset base. We also own five subsea electricity interconnectors, with a further subsea cable to Denmark under construction, as well as LNG importation facilities and large-scale renewables in the US. Funding We fund our business through a combination of shareholder equity and long- and short-term debt. We maintain an appropriate mix of the two and manage financial risks prudently. Colleagues Our highly skilled, dedicated colleagues have a strong public-service ethos. They manage and maintain the physical energy infrastructure, and assist and develop the many stakeholder relationships crucial to the Company’s success. Strong stakeholder relationships Our business relies on strong relationships with all our stakeholders. These include: • Our customers, who depend on us to connect them to the energy they use and who (through a small portion of their energy bills) pay to use our networks. This also includes (in the case of our transmission businesses) the electricity generators and gas suppliers who own the electricity that flows through our cables and gas pipes. • Our suppliers, who have complementary experience, skills and resources and with whom we agree mutually beneficial contractual arrangements and, wherever possible, take advantage of economies of scale and use sustainable and global sourcing opportunities. • National and regional governments, local communities, and business and domestic consumers of the energy we transport. • The economic regulators who set the prices we can charge for providing an economic, efficient and non-discriminatory service as well as the government agencies responsible for health, safety and environmental standards. Enable the energy transition for all Deliver for customers efficiently Grow our organisational capability Empower colleagues for great performance Why does this matter? Benefits to National Grid Financial strength By managing our operations efficiently, safely and for the long term, we generate substantial cash flows. This, coupled with long-term debt financing, enables us to invest in growing our asset base and fund our dividends. Investment Efficient investment in our networks will deliver strong and sustainable growth in our regulated asset base over the long term. Lower capital costs Using innovation and flexibility initiatives, we look to reduce the amount of network reinforcement costs that would otherwise be needed to deliver the additional capacity required for net zero. Shareholder returns Our dividend policy, approved by the Board in March 2021, is to deliver annual dividend per share growth in line with the rate of CPIH inflation. Our dividend has grown consistently for more than 20 years. Further reading Our stakeholders on pages 56 – 59. 6 National Grid plc Annual Report and Accounts 2021/22 How we operate Business model 03_Business_model_p02_07_v84.indd 6 27/05/2022 16:37

How we create value The value we create We rely on our internal resources and our strong relationships which we use to do business, drawing on our technical expertise and culture in order to deliver value for our stakeholders and for wider society. Why does this matter? Benefits to society Customers We aim to deliver safe, reliable, resilient and affordable energy to customers in the communities we serve, driving operational excellence and financial discipline to keep bills affordable for our customers. Investors We aim to be a low-risk, dependable investment proposition, focused on generating shareholder value through dividends, supported by asset growth from investing in essential assets under primarily regulated market conditions, and servicing long-term sustainable consumer-led demands. Our colleagues We aim to create an environment where our colleagues can make a positive contribution, develop their careers and reach their full potential. Contractors and suppliers We maintain responsible and efficient supply chains where we align our interests, and those of our suppliers, with the interests of customers. Communities and governments We help national and regional governments formulate and deliver their energy policies and commitments. The taxes we pay help fund essential public services. We have an important role to play in sustainability, enabling the transition to a low-carbon future. Economic, health, safety and environmental regulators Through constructive, transparent engagement and consistent, reliable fulfilment of our commitments, we build trust with our regulators. Our technical expertise We combine our extensive skills, knowledge and capabilities with innovation to ensure we continuously create value for shareholders and wider stakeholders alike. Our expertise includes: Asset management We invest in and maintain our assets across their life as cost effectively and efficiently as possible. Engineering The skills of our engineers are vital in performing safely, efficiently, reliably and sustainably for all our businesses. Our colleagues strive to: • find practical and innovative solutions to complex problems; • employ risk-based decision making; and • adopt common approaches and make continuous improvements. Our engineering expertise supports the provision of a reliable network. Capital delivery We add value for our stakeholders by ensuring safe and effective delivery of large and complex infrastructure projects, ranging from large portfolios of smaller works to more substantial standalone projects. Our culture National Grid’s culture is the values, beliefs and behaviours that characterise our Company and guide what we do, so we can respond as the energy transition accelerates. We maintain high standards of ethical business. We also promote behaviours that are aligned with our values and culture by recognising our employees through a Company-wide reward system. This supports both what they achieve and how they have achieved it. Strategy and risk management As the energy industry continues its transition to a cleaner future, our strategy articulates our priorities clearly, while positioning our business to continue to bring long-term economic benefits into the regions where we operate. We have well-established governance structures that include comprehensive risk management, strong controls and financial discipline. Achieving net zero In addition to our own commitment to reduce our Greenhouse Gas (GHG) emissions to net zero by 2050, we are working with governments and regulators to help them meet their carbon reduction targets. Communities The transition to clean energy must be affordable to all, and we will play our role in ensuring no one is left behind, helping the places where we operate reach their emissions targets. Job creation We are providing employment opportunities and supporting our colleagues in building the skills necessary to build a net zero energy system. Tax contribution We recognise that our tax contribution supports public services and the wider economy and we endeavour to pay the right amount of tax, at the right time, in accordance with relevant tax laws. Further reading Our strategy on pages 20 – 21. Innovation on pages 22 – 23. Internal control and risk management on pages 28 – 32. Our commitment to being a responsible business on pages 60 – 69. Our values on page 65. 7 S trateg ic R ep o rt National Grid plc Annual Report and Accounts 2021/22 03_Business_model_p02_07_v84.indd 7 27/05/2022 16:37

Reshaped portfolio Delivering growth Strong operational and financial performance We’ve reshaped the portfolio and organisation for the opportunities ahead of us. These moves will increase our exposure to electricity, enhancing the long-term growth profile of the Group and better aligning to the energy transition. We have a strong track record of delivering efficiently, and our new operating model will deliver a step change in productivity improvements. Alongside our asset growth, we forecast to grow our underlying EPS by 5 − 7% compound annual growth rate (CAGR). Our forecast of £30 − 35 billion of capital investment between 2021/22 and 2025/26 will drive asset growth of 6 − 8% on average per annum (CAGR). Over two thirds of this is already committed and visible through rate settlements and in our National Grid Ventures business. Geographic and regulatory diversity History of strong financial performance History of strong operational and financial performance 1. Calculated as an approximate proportion of actual 2021/22 asset base as at year end, including WPD, excluding NECO sale and 60% interest in UK Gas Transmission and Metering. 2. Includes NGP, UK property, insurance and corporate activities. UK US NGV & Other2c.53c.40 c.7 Gas Electricity c.70 c.30 Employee Engagement Score (%) 81 77 81 21/22 19/20 20/21 National Grid asset base post transactions1 RoE (%) 11.4 12.0 10.6 21/22 19/20 20/21 Group asset growth 8.7% 9.0% 5.6% 21/22 19/20 20/21 FULL YEAR From continuing operations 02 0 6 7 5 4 3 2 1 0403 05 06 07 08 09 10 11 12 13 14 15 16 17 19 20 21 2218 Including discontinued operations Capital investment £bn Underlying (continuing) EPS (p) 65.3 47.9 42.4 21/22 19/20 20/21 8 National Grid plc Annual Report and Accounts 2021/22 Our long-term value creation is underpinned by significant growth opportunity across the business, driven by our vital role as The Energy Transition Company Our unique investment proposition 04_Investment_case_p08_09_v86.indd 8 27/05/2022 16:38

Resilient balance sheet Progressive dividend Our responsible business We have visibility to maintain a resilient balance sheet and stable leverage (once all three transactions are complete), to fund asset growth of 6 – 8% on average per annum (CAGR) over the next five years. Over the next five years we expect senior debt capacity to increase by £2 – 3 billion annually. We continue to be vocal advocates for a fair and equitable energy transition across wider public policy. We are a COP26 principal partner and are advocates of transforming commitments into action. We have consistently grown our dividend for more than 20 years. Full-year dividend 50.97 pence p/share in line with policy, 49.16 pence p/share in the prior period. As our UK regulatory models move from Retail Price Index (RPI) to the Consumer Prices Index including Owner Occupiers’ Housing Costs (CPIH), we aim from 2021/22 to grow the annual dividend per share in line with UK CPIH. Balance sheet metrics Dividend per share (DPS) (p) Note: 2000 – 2010 DPS adjusted for 2010 Rights Issue, excludes special dividends. We monitor RCF/adjusted net debt in order to ensure the Group is generating sufficient cash to service its debts, consistent with maintaining a strong investment-grade credit rating. We calculate RCF/ adjusted net debt applying the methodology used by the credit rating agency, Moody’s Investors Services. Our Responsible Business pillars Communities Deliver energy in a fair and affordable way to the communities we serve. The economy Work across our supply chains to ensure that, together, we reflect the diversity of the communities we serve and respond to the economic needs of those communities. Governance Achieve 50% diversity1 in our Group Executive Committee Our colleagues Achieve 50% diversity1 in all our new talent programmes by 2025. The environment Accelerate our net zero targets wherever possible. 2000 0.00 0.60 0.50 0.40 0.30 0.20 0.10 2007 2014 2022 1. A diverse employee is defined as a colleague who identifies as female, as a person with a disability, as gay, bi-sexual or lesbian or from an under-represented ethnic/racially diverse background. 1. Capital expenditure invested in decarbonisation of the energy systems and considered to be aligned with the principles of the EU Taxonomy legislation at the date of reporting. 8.9% RCF/Adjusted debt >7.0% Moody’s rating threshold 4.7x FFO Interest cover >3.5x Moody’s rating threshold (2020/21: 4.5x) 9 S trateg ic R ep o rt National Grid plc Annual Report and Accounts 2021/22 Our vision for our future energy networks aligns with the global push towards net zero, and demonstrates the vital role we play. And with that vision, as we look to the decades ahead, we believe the scale of opportunity across the business is significant. 1. Our pivot to electricity brings visibility and certainty of growth, right now and out to 2050. 2. Our scale magnifies our vital role at the heart of the energy transition. 3. We have a strong track record of delivering growth. 4. Green capex1 in decarbonisation of energy systems, will make up around £24bn of our investment between 2021/22 and 2025/26. Five-year outlook 2021/22 – 2025/26 Capital investment £30 – 35bn c.£8bn UK Electricity Transmission c.£17bn New York & New England regulated businesses c.£5bn UK Electricity Distribution c.£2 – 3bn NGV Group asset growth 6 – 8% CAGR Gearing Peaks in 2021/22, settles slightly above 70%. Credit metrics within current rating band Earnings Per Share (EPS) Dividend Per Share (DPS) 5 – 7% CAGR Growth in line with CPIH 04_Investment_case_p08_09_v86.indd 9 27/05/2022 16:38

Paula Rosput Reynolds Chair “ National Grid finished the fiscal year in a position of strength. As nations now focus on energy security and affordability, as well as decarbonisation, we embrace our role in delivering the energy system of the future.” It is a privilege to be the first American to serve as the Chair of National Grid, an iconic industrial company. National Grid has a proud and longstanding heritage, but it is also a business that has long been focused firmly on the future. We didn’t start the process of being a state-of- the-art energy system yesterday. For more than two decades we have been working to decarbonise energy. We have been iterating and experimenting with our fulfilment capabilities – with the digital grid, with hydrogen, with multipurpose interconnectors. And we will keep iterating and collaborating until we achieve the necessary levels of performance to assure you that clean energy delivery will be utterly reliable and affordable as well. At National Grid, we are witnessing the increasing intensity of impatience in society in its pursuit to see changes in the contours of our energy system. We are working on multiple fronts to deliver infrastructure and service more quickly and more cleanly than ever before, including: digitalisation of business systems and operations to ensure service reliability and rapid response time; increased cyber security barriers to protect our critical national infrastructure; and use of advanced technologies, such as artificial intelligence (AI), to optimise our operations. And we are focused on the best possible delivery on the front lines. Perhaps you have noticed that storms are more frequent and severe. Meanwhile, society is dependent on rapid restoration of service. We live in a connected world and none of us easily tolerates a power outage. My National Grid colleagues are thus working in increasingly harsh weather conditions to reconnect customers in ever shorter response times. This is complicated by the fact that we are managing the increased complexity of the grid itself, as renewables become a larger part of the generation mix in both countries. These are among the issues of today and tomorrow. As Chair, my role is to ensure our governance both challenges and supports decision making that will ultimately lead to a decarbonised and digital future. Our business reorganisation, the refresh of the Board and the thoughtful adjustment of our investment mix are intended to meet these challenges. The events of the past year – indeed, the past months – have tested the resolve, culture and resilience of all businesses. As I write this first letter to you in my role as Chair, Ukraine is engulfed in a brutal confrontation with Russia. At National Grid, we supported and adjusted quickly to the Russian sanctions put in place by the UK government. We have also been engaging with the UK government on assuring long-term security of energy supply, including through accelerating the roll-out of renewables. In the US, we continue to work on an agenda of decarbonisation, ranging from new high-voltage electric transmission infrastructure for delivery of low- or zero-carbon resources to operating one of that nation’s first hydrogen blending projects. In both countries, we undertake our efforts against the backdrop of elevated energy prices for our customers and heightened concerns about balancing the costs of system enhancements with the affordability of these improvements. 10 National Grid plc Annual Report and Accounts 2021/22 Chair’s statement 05_Chairs_statement_p10_11_v52.indd 10 27/05/2022 16:40

The 2022 Annual General Meeting (AGM) of National Grid plc will be held as a hybrid event at 10.00am on Monday 11 July 2022. More details on the arrangements for this year’s AGM and how to view the live webcast of the AGM vote and attend virtually can be found on our website in the Investors section at: nationalgrid.com/investors. Final dividend of 33.76p per share proposed to be paid on 17 August 2022 A Board for the future As you will note, several distinguished Board members have reached the ends of their terms. Sir Peter Gershon, Dr Paul Golby, Mark Williamson, and Jonathan Dawson have all served nine-year terms. In addition, Amanda Mesler, who has been a member of our Board for the last four years, has decided not to stand for re-election as her career in technology takes her in some different directions. On behalf of my Board colleagues, I express my appreciation to all of them. Nevertheless, from this loss comes opportunity. We are fortunate to have recruited five new Directors who bring fresh perspectives and experience to the Board Ian Livingston, Tony Wood, Martha Wyrsch, Anne Robinson and Iain MacKay, bring strategic thoughtfulness, engagement, constructive challenge, independence and gravitas to tackling the issues we face. Operating with purpose Moments of societal reckoning over recent times have further cemented my belief that National Grid must respond as a responsible business. It is clear: we are here to serve. Our sense of the larger purpose we play in society helps us keep doing the right thing at the heart of our decision making. As I have travelled around the National Grid system in both countries, I am heartened by the ethos of our people. I have also seen this ethos of community engagement first-hand in the work that is done by Grid for Good, Project C and our Grid Employability programmes, to name but a few examples. Our RBR, which you can find at nationalgrid. com/responsibility, provides an update on our excellent progress to date on key commitments. Along with purpose comes partnership. Working with regulators, customers, communities, stakeholders and business partners is key to our long-term health as a company. I have appreciated the candour of those of you with whom I have met in the past year. This input – unvarnished and honest exchanges – helps guide the Board deliberations. Solutions to the challenges of our time must be rooted in an overarching sense that we are in this together, working for the collective good. Geopolitical upheaval only deepens the sense within society that we must embrace change urgently. Across the UK and US, we are working with governments and communities to determine the best way forward for the delivery of net zero. In recognising that National Grid must change, 50.97 48.57 49.16 45.93 47.34 21/22 19/20 18/19 17/18 20/21 Full-year dividend (pence per share) I see that governments, regulators and stakeholders are grappling with how to drive progress as well. I would offer the observation that we all need to break old habits and get on with the business of change. Looking forward In the previous fiscal year, we set a strategic course to pivot to a greater focus on electricity as the energy mix of the future. With the acquisition of WPD and the announced sale of a majority stake of our UK natural gas transmission business, our portfolio is changing. The Board will continue to assess the businesses we will participate and grow in as the energy landscape evolves. For example, we welcome the UK government moving forward with the development of a Future System Operator (FSO). This initiative is expected to see us divest our ESO in the future. Similarly, our investments in the various interconnectors which link the UK to continental Europe and our partnership with RWE in the New York Bight auction for offshore wind, are examples of investments where we are leaning into the future energy system. As you will note in the Notice of Meeting which accompanies this Annual Report, our climate transition plan is being put to a vote by shareholders at our 2022 AGM. I hope you will find that this plan provides tangible evidence of National Grid’s resolve to move to net zero, including metrics that facilitate tracking of our progress. We ask for your support of our Climate Transition Plan, your Board of Directors, and various other business matters on which you are asked to vote. In closing, I would like to recognise our National Grid colleagues with this oft-repeated phrase: if it were easy, everyone would be doing it. The Board recognises your singular efforts, your dedication and your tenacity. Your enthusiasm for delivering net zero and a fair energy transition is, I believe, unparalleled. Thank you for living our values and for Doing Right Now. Paula Rosput Reynolds Chair 11 S trateg ic R ep o rt National Grid plc Annual Report and Accounts 2021/22 05_Chairs_statement_p10_11_v52.indd 11 27/05/2022 16:40

“ We will enhance our role in the energy transition and drive long‑term shareholder value.” governments and regulators to deliver an energy transition that leaves nobody behind. Whilst we do not have control over energy prices, we are playing our part by innovating at speed on projects and making significant capital investment to bring cheaper, greener energy to our customers. I was particularly pleased to see clean energy sitting at the heart of the British Energy Security strategy – net zero is a clear route to a reduction in consumer bills over the long term, increased energy independence and lower carbon emissions. As a sector, we must now work at pace to deliver the ambitious targets set and remain conscious, too, of other opportunities to reach our collective goals, such as increased energy efficiency. In the UK, we have been working closely with government, industry and the regulator to create the FSO that enables long-term holistic thinking, drives progress towards net zero, and lays the foundations for the regulatory reform necessary to deliver the energy system of the future. As announced in April 2022, the ESO is expected to transfer out of National Grid to become part of the newly created FSO by 2024. We will continue to work closely with all relevant parties to ensure a smooth transition, subject to parliamentary approval and conclusion of the transaction process. In a fast-moving world, we must remember that the challenge of reaching net zero cannot be underestimated, and significant policy and regulatory change will be needed to get there. We are committed to working together with all our stakeholders to create the right policy and regulatory frameworks to deliver the investment needed at the lowest long-term cost to consumers in all our markets. Business highlights Delivering for our customers remains my key focus and I am very clear that this must underpin all that we do. A clear example is our vision for a fossil- free future in the US, launched in April 2022, which places consumer choice and affordability at the heart of fighting climate change. This vision to fully eliminate fossil fuels from our US gas networks, replacing it with renewable natural gas and green hydrogen, will enable the customers and communities we serve to meet their heating needs without using fossil fuels by 2050, if not sooner. Combined with targeted electrification and enhanced energy efficiency, a 100% fossil-free gas network can deliver a clean energy future that is more affordable and more reliable to more than 20 million people across New York and Massachusetts. Context in which we are operating Over the last 12 months, as the world took tentative steps out of the depths of the COVID-19 pandemic, it also witnessed unprecedented climate events, an increasingly divided geopolitical landscape, and – in the UK and US – rising costs of living. As I write, we continue to witness terrible events in Ukraine. The combined turmoil and change of the past year means that all three points of the energy trilemma (security, affordability and sustainability) are now in sharp focus as one. In a rapidly changing world, it is more important than ever that our vision is clear and our journey to achieve it is well executed. National Grid will be at the heart of a clean, fair and affordable energy future. There is no doubt that rising gas prices and a higher cost of energy in the UK and US have highlighted the challenge of affordability. Our political stakeholders in all jurisdictions are also grappling with this challenge, and we continue to take a partnership approach with both John Pettigrew Chief Executive 12 National Grid plc Annual Report and Accounts 2021/22 Chief Executive’s review 06_CEO_review_p12_14_v46.indd 12 27/05/2022 16:41

Key highlights in 2021/22 11.4% RoE £6.7bn investment in critical infrastructure for the Group (continuing operations) We have made significant progress throughout the year towards a clean energy future in the US. In December, we launched a joint project with the town of Hempstead to build one of the first and largest clean hydrogen projects in the US. The HyGrid project, on Long Island, will blend green hydrogen into the existing distribution system to heat approximately 800 homes and fuel 10 municipal vehicles. A key highlight of the year for me was National Grid’s role as a Principal Partner of COP26. This enabled us to drive action on the fight against climate change more directly than ever before. From meeting with world leaders, to hosting the launch of the global Green Grids Initiative, and sharing our work to enable clean transport, it was a unique opportunity to discuss our learnings with delegations from across the globe and collaborate on how best we can work together to accelerate action. It is important we match talking with doing. Since COP26, we have had new Science Based Targets approved; with both our UK ET and ED businesses and the ESO limiting their greenhouse gas emissions to a 1.5ºC warming scenario. And against a 1990 baseline, I can now report our carbon emissions are down by 65% across the Group. The year also saw us deliver on the strategic transactions we announced 12 months ago. The transactions represented a strategic pivot for National Grid and underlined our belief that the journey to net zero will see increased electrification across the UK and US. The Group expects the NECO Sale to complete by the end of Q1 2022/23. The year saw us make good progress on regulatory matters. In the first half, the Competition Markets Authority (CMA) upheld part of our appeal on RIIO-T2, which saw the removal of the outperformance wedge. In the US, new rate agreements for KEDNY-KEDLI, Massachusetts Gas and Niagara Mohawk were agreed during the year, giving us long- term visibility. Our National Grid Ventures business continues to deliver clean, green energy through its interconnectors. We completed our fifth interconnector, North Sea Link (NSL), which connects the UK with Norway and is the world’s longest subsea interconnector. NSL, which is a joint venture with Norwegian system operator Statnett, can provide enough clean electricity to power 1.4 million homes. The fire at our IFA interconnector saw a 50% reduction in its capacity. However, I am pleased that our team’s fast response and focus on recovery means we now expect the IFA interconnector to return to full service in December 2022, significantly earlier than planned. WPD, our electricity distribution business, which will shortly be rebranding under the National Grid name, has submitted a highly ambitious business plan for 2023 − 2028 outlining £6.7 billion of investment to drive the pathway to net zero for our customers in the Midlands, South Wales and the South West. This will act as an additional £1.4 billion of investment from present-day levels, whilst maintaining affordability for our customers. We have reported good operational performance in a year of significant strategic change. We have reported a strong set of results. In May, Ofgem agreed to our request to pay £200 million of interconnector profits back ahead of the planned timeframe, as we took action to lower bills for consumers. We are investing around £24 billion over the next five years directly into decarbonising energy networks, starting now. This is measured in accordance with the EU taxonomy, and excludes ‘clean’ spend in areas such as connecting nuclear power and lowering methane emissions through gas pipeline replacement. In every sense, this investment cements our position as The Energy Transition Company. Doing Right Now National Grid is a responsible business, because it is the right thing to do. Our RBR, which is published alongside the Annual Report, details our progress to date on the commitments we set out in our RBC. Communities sit at the heart of our RBC, and I am delighted that our Grid for Good initiative has positively impacted the lives of thousands of young people to date, with participation from hundreds of National Grid volunteers. Grid for Good was created to drive lasting and positive change for disadvantaged young people and we are well on the way to achieving our goal of 125,000 volunteering hours by 2030. Diversity is critical to business success and I am pleased to report this year that we have no material gender pay gap in the UK business. Of course, this is just one measure, and we recognise that there is more work to do to bring greater diversity to all levels at National Grid. 13 S trateg ic R ep o rt National Grid plc Annual Report and Accounts 2021/22 06_CEO_review_p12_14_v46.indd 13 27/05/2022 16:41

In the US, our pay gap sits at 12.6% and we continue to address this as a matter of high priority. I am very clear that we can achieve more with a diverse organisation, and it is vital that we represent the communities we serve. Over the last year, I am pleased to say we have continued to deliver energy reliably, safely and efficiently for our customers in all jurisdictions, and continue to focus on our safety performance. Of course, it would not be possible to deliver these results without the hard work of the teams across the business. I would like to take this opportunity to say a sincere and heartfelt thank you to all National Grid colleagues, who, despite living through the most extraordinary and challenging of times, continue to serve the Company with hard work, dedication and outstanding skill. Looking ahead As we look ahead, we do so with optimism. National Grid is uniquely positioned as The Energy Transition Company, at a time when climate goals, customer demands and geopolitics align on the imperative need to fully decarbonise our economies. In the UK, we will support the government in delivering its British Energy Security Strategy and the ambitious target of delivering 50 GW of offshore wind by 2030, including up to 5 GW floating wind, by developing and delivering transmission project proposals in alignment with the national blueprint. We will work with government and regulators to reform the consenting and regulatory frameworks to deliver the unprecedented levels of new transmission capacity required to deliver the strategy much faster than under the current arrangements. We will complete the integration of WPD into our new Electricity Distribution business and seek a successful outcome in our RIIO-ED2 regulatory process that gives us the flexibility to invest in our distribution networks to support the Strategy and the expected growth in heat pumps, electric vehicles and solar generation. In the US, we will continue the work started to make fossil-free gas a reality on our networks by supporting legislative and regulatory policies to grow fossil-free gas, developing voluntary tariffs for customer participation in fossil-free gas offerings and running neighbourhood pilots for green H2 network blending, networked geothermal, and targeted electrification of heating. National Grid has a key strategic role to play in delivering the legacy of COP26 and we will become even more vocal on this over the next 12 months. We are working side by side with the UK, India and US governments on the Green Grids Initiative to accelerate the decarbonisation of electricity grids globally; we are engaged in the Glasgow Breakthroughs to share learning and drive progress in different sectors; and we will share our views on progress and policy needed globally. We must now move fast to seize the opportunity this decade to keep 1.5°C in sight. We are leading a clean, fair and affordable energy transition across the jurisdictions we serve, and we do so with pride. No one will be left behind. Our pace will accelerate, our efforts will increase, and our action will be bold. The business is positioned for long-term success. John Pettigrew Chief Executive Q&A How can we solve the huge challenge of achieving net zero? Partnership and collaboration hold the key to unlocking some of the biggest global challenges we face. Communities, government, regulators and industry all have a critical role to play in reaching net zero and it is only by working together and challenging each other to be bolder, more innovative, and to deliver at pace that we will achieve this. For the industry, delivering the energy system of the future, while operating and safeguarding the energy system of today, will require a huge shift in mindset. We must rise to this challenge and embrace the opportunity we have to create a fair and affordable future for all. Why did National Grid feel it was important to be a principal partner of COP26? Climate change is the biggest challenge we will face as a society – and there is a ticking clock. National Grid is uniquely positioned to lead the energy transition across the UK and Northeast US, but COP26 gave us the opportunity to go further and to collaborate and learn from partners on a global scale. Why should I invest in National Grid? The fundamentals of our business are strong; they underpin long-term value creation. We are at the forefront of the green revolution. There is huge business opportunity and we are fully aligned with government and societal demands to deliver greener, cleaner energy. We are Doing Right Now. Can you share an update on the transactions? The transactions that we announced in March 2021 and have implemented over the past 12 months represented a strategic pivot for the Company. The acquisition of WPD in the UK, the sale of Rhode Island in the US and an agreement to sell a majority stake in Gas Transmission in the UK, will leave our business split equally between the UK and the US, and with a focus that is 70% on electricity and 30% on gas. This is aligned with our view of the energy transition – gas will continue to have a key role to play, representing around 30% of the energy system by 2050 as we see increased electrification in the journey to net zero. As CEO, what are you most proud of? My colleagues. Living and working through a global pandemic has been challenging for everyone in different ways. I am very proud of the way everyone working at National Grid has carried out their duties with skill and professionalism in the most difficult and extraordinary circumstances to keep the lights on and the gas flowing for our customers. Scan here to view our video 14 National Grid plc Annual Report and Accounts 2021/22 Chief Executive’s review continued 06_CEO_review_p12_14_v46.indd 14 27/05/2022 16:41

Fairness and affordability We are committed to delivering energy safely, reliably and affordably to the communities we serve. As well as affordability, we will play our role in ensuring no one is left behind in the short term due to increased energy prices, or in the longer-term transition to clean energy. £30 – 35bn 2020/21 – 2025/26 investment across our UK and US businesses 2021/22 developments Our response UK Supply and demand mismatches due to factors such as COVID-19 and the conflict in Ukraine have driven surges in energy prices that have challenged many customers; 2021 saw a 330% rise in European gas prices. In February 2022, Ofgem announced a 54% increase in the energy price cap, caused by the record rise in wholesale energy prices. National Energy Action has anticipated that the number of households in fuel poverty will rise from 4.5 million to around 6 million because of the increased cap. As a result, the Treasury announced that households will receive up to £350 of government support to help protect them from the rising energy costs. This includes a £200 discount on electricity bills for all consumers from October 2022, and a £150 council tax rebate from April for 80% of council taxpayers in England based on their tax bands. US Economy-wide inflation has been amplified in the energy sector. The energy price index rose 26% from February 2021 to February 2022, with all major energy component indexes increasing; natural gas and electricity rose 24% and 9%, respectively. COVID-19 also brought serious economic hardship to many of our customers, elevating affordability concerns even further, and many moratoria on disconnection for non-payment have expired. In response, Congress’s American Rescue Plan included an additional $4.5 billion in Low Income Home Energy Assistance Program funding, including $535 million for New York and $187 million for Massachusetts. • We donated £1 million to support the relief effort in Ukraine, split equally between the British Red Cross, the United Nations refugee agency, and UNICEF. • We published our first Responsible Business Report in June 2021, providing an update on commitments in our Responsible Business Charter across five key areas: the environment, our communities, our people, the economy and our governance. • In the UK, our Grid for Good Programme is in its second year of having a positive impact on socio-economically disadvantaged young people during this economic downturn. To date we have helped over 2,750 young people and have over 1,000 National Grid employees registered as volunteers. • Our Electric Transmission business in the UK leveraged new technologies such as deploying soil stabilisation technology that decreased road-building costs by 30% for the Hinkley Connection Project or using drones to inspect overhead power line networks at lower cost and hazard. • WPD announced a £500,000 fund to help those in fuel poverty through the 2021/22 winter period, as part of a wider annual £1 million Community Matters Fund. The Fund supported more than 79 grassroots organisations and local authorities, saving an estimated £2 million for 29,000 people in our communities. • We launched Project C, our community engagement and neighbourhood development programme, across our New York service area. Company employees volunteered at food banks, Habitat for Humanity and Meals on Wheels, and stocked student backpacks and food warehouses, supplied PPE, cleaned up neighbourhoods and parks, offered energy affordability solutions, and much more. • We gained approval from the New York Public Service Commission in January 2022 for our Expanded Solar for All programme through which we will share approximately $800,000 in community solar savings per month with 160,000 low-income to moderate-Income customers, the largest such programme in the country. 15 S trateg ic R ep o rt National Grid plc Annual Report and Accounts 2021/22 Our business environment As well as managing the business through the COVID-19 pandemic, rising living costs, and the conflict in Ukraine, our societal ambition remains to achieve net zero. We will work with governments and regulators in the UK and US to help them meet their own carbon-reduction targets in a fair and affordable way. 07_Our_business_environment_p15_19_v84.indd 15 27/05/2022 16:42

Net zero We are focused on delivering the energy transition while balancing key societal issues for the regions in which we operate. We are continuing to progress towards our own net zero commitment to reduce our greenhouse gas emissions to net zero by 2050. In this ‘critical decade’ (2020 – 2030) for climate action, we are committed to working with governments and regulators in the UK and US to help them meet their carbon reduction targets. Net zero emissions commitment by 2050 2.5 GW new renewable energy connected to our transmission and distribution grids in 2021/22 2021/22 developments UK Along with hosting COP26, the UK has made a binding commitment to net zero emissions by 2050. Additionally, it committed to phasing out inefficient fossil-fuel subsidies in hopes of limiting global temperature rise to 1.5°C. In April 2022, in response to the war in Ukraine, the UK increased its ambition further by publishing the British Energy Security Strategy with the vision to produce 95% of electricity from low carbon sources by 2030. It included targets for 50 GW of wind by 2030, 70 GW of solar by 2035, and an additional 24 GW of nuclear by 2050. The strategy highlighted the critical role of network infrastructure in delivering on its ambitions, including recognising the need for a national planning regime and expedited approvals processes. The UK’s carbon intensity dropped to a record-low 39 gCO2 on 5 April 2021. On that day, over three quarters of the UK’s power came from zero-carbon sources: 39% wind, 21% solar, and 16% nuclear. US The Biden Administration continued to make climate change a top priority for the federal government. The $1 trillion Infrastructure Investment and Jobs Act was passed, providing roughly $550 billion of new federal funding for roads, bridges, transit and other physical infrastructure programmes, and contained several National Grid priorities. The Biden Administration committed the US to the Global Methane Pledge at COP26 to cut emissions 30% by 2030. Offshore wind is a major growth focus for the Biden Administration, with a 30 GW goal by 2030 and 110 GW by 2050. By 2030, New York is targeting 10 GW of solar, 9 GW of offshore wind, and 8 GW of onshore wind, and recently doubled its storage goal to 6 GW. Massachusetts’ goal is to have 8 GW of solar, 4 GW of offshore wind, and 2.8 GW of storage by 2030. National Grid booth at COP26 in Glasgow, Scotland, UK 16 National Grid plc Annual Report and Accounts 2021/22 Our business environment continued 07_Our_business_environment_p15_19_v84.indd 16 27/05/2022 16:42

Our response • We sponsored COP26 as a principal partner, leading the conversation and working closely with the UK government and other sponsors to create a successful and ambitious climate change conference in November 2021. • In April 2021, our commitments to reduce our emissions in line with climate science were approved by the United Nations’ Science Based Targets initiative (SBTi). The targets we have set are consistent with the reductions required to keep warming to well below 2°C. We have also identified where we can accelerate our targets further. • We worked with the Electric Power Research Institute, the Gas Technology Institute and other utilities to sponsor the Low-Carbon Resources Initiative to accelerate the development and demonstration of low-carbon and zero-carbon energy technologies. • With 60% of all offshore wind developments in the UK planning to bring their energy onshore through the East Coast, we progressed projects such as the one in Yorkshire Green to increase capacity and relieve constraints on the network. • We worked with industry players to support decarbonisation projects in heavy industry in Humber and Teeside. The East Coast Cluster won a bid to be one of the UK’s first two industrial carbon capture clusters, and it has the potential to transport and store 50% of all UK industry carbon emissions securely, up to 27 million tonnes of CO2 emissions a year by 2030. • We worked with Hitachi Energy in a pilot project at Richborough Substation in Kent to replace sulphur hexafluoride (SF6) gas with a greener alternative. This change forms part of our ambition to reduce SF6 emissions by 50% by 2030 and remove SF6 gas from our electricity assets by 2050. • WPD published an environment strategy in April 2021 that details commitments to ensure environmental responsibility underpins all its activities in RIIO-ED2 and beyond. It provides an overarching pathway to achieving net zero by 2028 (excluding network losses), ahead of the government’s target date of 2050. • We announced our vision for a fossil-free future, fully eliminating fossil fuels from our US gas and electric systems, enabling the customers and communities we serve to meet their heating needs without using fossil fuels by 2050. Our plan is based on energy-efficient buildings, a 100% fossil-free gas network, hybrid electric-gas heating systems, and targeted electrification and networked geothermal. • We joined seven major US utilities in the Electric Highway Coalition, which will enable more electric-vehicle charging stations along highways across the US. • In June 2021, we commenced operations of two solar projects totalling 40 MW in Michigan. These employed over 150 workers from communities within 100 miles of each site during construction. Onsite gas cart used to retro fill existing gas-insulated, high-voltage switchgear, with an alternative low global warming g3 gas, designed for high-voltage transmission equipment, Richborough Substation, Kent, UK 17 S trateg ic R ep o rt National Grid plc Annual Report and Accounts 2021/22 07_Our_business_environment_p15_19_v84.indd 17 27/05/2022 16:42

Decentralisation The energy system continues its transition from high to net zero carbon. This change coincides with a shift to more decentralised resources, including renewables and battery storage. As the volume of this intermittent and distributed generation increases, a more resilient and flexible system will be required; one that makes best use of available energy resources to meet consumers’ needs in a balanced, efficient and economical way. 30% of generation in the UK is connected at the distribution level 11% of generation in Massachusetts and New York is connected at the distribution level 2021/22 developments Our response UK Europe is projected to decentralise faster and further than any other region between now and 2050. The median power plant in Europe could reduce in size by up to 95% due to the scale of distributed generation. Decentralised electricity systems are increasingly made possible by developments in smart systems and flexibility solutions, and supported by local initiatives to develop decarbonisation pathways. This increasingly decentralised network presents a paradigm shift for the ESO as we work to enable the transition away from a system developed for a small number of large generation plants. The ESO will continue to innovate to enable Great Britain’s electricity system as it transitions to becoming a separate, independent public corporation known as the Future System Operator. The six UK DNO groups submitted their RIIO-ED2 business plans in 2021, describing the role of decentralised electricity systems in achieving net zero, including the role of the distribution system operator in the future. US The US is seeing one of the highest levels of grid investment in the world to meet demand for more decentralised assets such as distributed generation and electric vehicle charging. In Massachusetts, the Department of Energy Resources officially approved the doubling of the current solar programme to 3.2 GW. The Department of Public Utilities passed a provisional programme regarding cost allocation to support distributed generation. The state also allocated $13.1 million in grants to install 306 direct current fast charging electric vehicle charging ports at 150 locations. New York’s Governor called for a doubling of the energy-storage target to 6 GW by 2030 and intends to establish a world-class battery research and manufacturing centre. Proposals also included a $1 billion investment to support electric vehicle (EV) adoption and charging; $500 million to develop offshore wind supply chains and port infrastructure; and the creation of a green hydrogen hub to compete for $10 billion federal funding. • In the UK, we are running three Network Option Assessment Pathfinder projects to pilot innovative ways to ensure grid reliability as we prepare to operate a zero-carbon grid by 2025. • We connected 406 smaller, distributed generation customers to the network in the UK, double the number we connected two years ago. • The Equitable Novel Flexibility Exchange (Equinox) project allows WPD customers with heat pumps in their homes to participate in a flexible energy future. This project will assist in the deferral or avoidance of network reinforcement due to the predicted high uptake of heat pumps in the upcoming RIIO-ED2 and beyond. • WPD published reports for each local authority as part of the Distribution Future Energy Scenarios process, outlining the expected uptake of different demand and generation technologies at a decentralised level. The reports are used to assist local stakeholders with local area energy planning and for WPD to identify areas of strategic investment in the distribution network. • We connected 207 MW of distributed energy resources in New York in 2021. This is the most distributed generation we have ever connected and earned us the maximum incentive payment. • Funding was approved for our Active Resource Integration pilot by New York’s Public Service Commission. This aims to reduce interconnection costs for up to 15 MW of distributed solar projects. • We began construction on the New York Energy Solution project to address bottlenecks between demand and distributed renewable generation in New York, enabling further decentralisation. • We secured $150 million of funding in a joint venture with Emerald Energy Venture to support growth in our distributed renewable energy portfolio. • We have entered a partnership with Massachusetts-based Form Energy to work on breakthrough long-term energy storage and invested in Viridi Parente’s innovative high-density storage technology. 18 National Grid plc Annual Report and Accounts 2021/22 Our business environment continued 07_Our_business_environment_p15_19_v84.indd 18 27/05/2022 16:42

Digitalisation Our digital aspiration is to be an intelligent connected enterprise bringing customers, employees and assets together to create the most resilient and secure utility. Our vision is to create insights from a single source of consumable and consistent data. $345m National Grid Partners’ investment in companies whose transformational technologies are making grids greener and more resilient 2021/22 developments Our response Frontier technologies such as connected sensors, appliances and devices have exceeded the number of people on the planet in 2021. Additionally, the declining cost of computer storage is enabling the management of large volumes of data. Customers desire a seamless experience, though only 21% felt their utility provider made life easy for them in 2021. Effective digital transformations of utilities across the globe are enabling them to decarbonise, decentralise and democratise energy resources. Driven by increased regulator demands, these trends are accelerating in utilities, driving 20% annual growth in global investment in digital electricity infrastructure and software for the past few years. • We developed WhenToPlugIn, a new online application in the UK that suggests how to reduce consumers’ carbon footprints by identifying periods of the day to use appliances when the energy mix is dominated by renewable and low- carbon sources. • The launch of the Connected Data Portal enabled WPD to become the first UK DNO to provide all customers and stakeholders with open access to its data, further digitalising customer interactions in areas such as applications for new connections and flexibility service provision. • We launched the new My Account page to streamline US users’ digital experience across any device, enabling electric and gas customers to view energy use, manage account information and enrol in programmes. • We began using satellite imagery and AI in the US to optimise vegetation management. North Sea Link goes live The North Sea Link is our latest interconnector to go into operation. It is a joint venture with the Norwegian system operator, Statnett, and cost €1.6 billion over six years to build. The 1,400 MW link stretches 447 miles (720 kilometres) between the UK and Norway under the North Sea, and can power approximately 1.4 million homes. Enabling the trade of renewable energy will help reduce the UK’s carbon emissions by 23 million tonnes of carbon by 2030, save customers money, and bolster energy security. WPD and ET response to Storm Arwen Winds of over 92 miles per hour (148 kilometres per hour) and heavy snow hit the UK in November 2021, impacting electricity distribution and transmission. All four of WPD’s distribution networks were affected, requiring power restoration to over 243,000 properties, answering 98,745 customer calls, and resolving over 1,600 incidents. Our transmission network was also affected, with 45 network faults reported. Fortunately, our automatic protection mechanisms worked well to deal with the faults reported. Overall, well-versed preparation, action and communication resulted in a successful response in our service areas to the worst storm to affect power supplies in 15 years. Offshore wind lease awarded in the New York Bight In February 2022, the Bureau of Ocean Energy Management hosted the country’s largest offshore wind lease auction to date for seabed development rights between New York and New Jersey. In partnership with RWE, we won the largest of the six sites. The awarded area has the potential to host 3 GW of capacity, enough to power over a million homes. The joint venture, Community Offshore Wind, combines RWE’s world-leading offshore wind capabilities with our local expertise in the Northeast and experience with High-Voltage Direct-Current interconnectors. This award supports both companies’ efforts to advance a clean energy future and achieve our states’ offshore wind and climate targets in the coming decades. North Sea Link – specialist barge laying undersea cable in Norway Case studies 19 S trateg ic R ep o rt National Grid plc Annual Report and Accounts 2021/22 07_Our_business_environment_p15_19_v84.indd 19 27/05/2022 16:42

Strategic priority Enable the energy transition for all Deliver for customers efficiently What this means We will increase the positive impact we have on society, environmentally and socially, primarily through enabling a transition to a clean energy future. By innovating how our networks deliver energy, investing for a changing climate and influencing policy and regulation, we will enable clean electricity, heat and transport, and promote better outcomes for all where we develop skills and where no one is left behind. Business environment link: Delivering safe, reliable, resilient and affordable energy for customers in our communities has always been at the heart of what we do. As we invest to decarbonise the energy system, using our operational excellence and financial discipline to keep bills affordable for customers is more important than ever. Business environment link: 2021/22 achievements • We received the prestigious climate change ‘A’ score from CDP Climate Change for the sixth consecutive year for our corporate sustainability work in cutting emissions and moving towards a low-carbon economy. • We have 22 GW of renewables connected to our UK and US electricity transmission and distribution networks. • Ofgem’s strategic innovation fund awarded us £400,000 for three projects that will help develop a net zero electric transmission network, including replacing SF6 with a low-carbon alternative and utilising satellite data analytics to future-proof against the impacts of climate change. • WPD is the only DNO to fit three-phase services as standard to all new connections, boosting capacity for EVs and heat pumps. • In the US, our onshore renewables team has secured over 2 GW of power offtake agreements with partners such as Walmart and Home Depot. • We started operations of the 200 MW Prairie Wolf Solar Project in Illinois, which is projected to offset 285,000 tonnes of CO2 annually. • The New York Power Authority partnered with us in May 2021 on the Smart Path Connect project to rebuild 110 miles of transmission lines. This will support existing renewable resources and result in production cost savings, emissions reductions and decreases in transmission congestion. • The Edison Electric Institute (EEI) announced us as a recipient of its Emergency Response Award and the Emergency Recovery Award, recognising recovery and assistance efforts following service disruptions caused by extreme weather or other natural events. • We launched the Digitalising Work Management app across 50 Electricity Transmission operations sites in the UK to schedule, dispatch and complete work more efficiently. • WPD achieved the British Institution Standard for Inclusive Service Provision for the ninth year running and was re- accredited with the Customer Service Excellence Standard. • We successfully reached new agreements in regulatory rate cases across our US service areas to continue to serve our customers. • In the US, we were honoured with the ReliabilityOne award for Outstanding Reliability Performance from PA Consulting, recognising reliable electric service, technology and innovation, and customer engagement. • We launched a revamped bill assistance campaign in the US to remind customers about the services and programmes we offer during prolonged cold weather or increasing energy prices. Key highlights 19.5 GW of wind power on Britain’s electricity system on 29 January 2022, setting a new wind power record 99% of our UK customers affected by the worst storm to affect power supplies in 15 years had power returned within 48 hours Looking ahead • We are developing a Cap and Floor regulatory regime with the UK Department for Business, Energy & Industrial Strategy and Ofgem to apply to future multi-purpose interconnectors. This will reduce the number of radial connections limiting distribution to coastal communities, providing significant cost reductions for consumers, and enable wind developers to access multiple markets. • The Hinkley Point connection transmission project we are developing will enable six million homes to access low- carbon electricity. • WPD will work to ensure the network is ready to enable stakeholders to achieve their net zero ambitions. It will prepare the network for at least 1.5 million additional EVs, 600,000 heat pumps and a significant increase in renewable energy over the next six years. • In the US, we will be working with stakeholders to build towards an integrated clean gas and electric system that would eliminate fossil fuel gas from both the gas delivery and electric systems, as the most practical and affordable path for our customers. • In our US jurisdictions, we have committed to 20,000 EV charging points by 2025 and have applied for funding for an additional 32,000 in Massachusetts. • Customer focus is something we will continue to improve, building on best practice through our US Customer team and learning from WPD’s excellence in customer service. • We have committed to 5,000 volunteer hours in the US and $5 million annually to community organisations for the next decade. • For RIIO-ED2, WPD intends to ensure that power cuts will be at their lowest ever levels and customer satisfaction will be at its highest at over 93%. Crucially, it will achieve all of this whilst maintaining affordability for its customers. Further reading: Internal control and risk management on pages 28 – 32 20 National Grid plc Annual Report and Accounts 2021/22 Our vision is to be at the heart of a clean, fair and affordable energy future. To deliver our vision in a focused way, we have a strategy which sets the bounds of our business, guided by four strategic priorities. Succeeding with our strategy 08_OurStrategy_Innovation_KPI_p20_27_v112.indd 20 27/05/2022 16:44

Strategic priority Grow our organisational capability Empower colleagues for great performance What this means In the context of a rapidly changing energy sector, we will need to build on and evolve our organisational capabilities. We will digitally transform our processes, strengthen our customer focus and sharpen our commercial edge. To successfully make this transformation and achieve results, our ability to implement change effectively will be paramount. Business environment link: All our people shape the culture and ways of working needed to perform and achieve outcomes that will exceed all our stakeholders’ expectations, including those of customers, communities, regulators and investors. Our leaders will encourage people to be at their best when it matters. From attracting diverse talents, developing our people and recognising great achievements, we will ensure our colleagues are engaged and able to work towards a clean energy future. Business environment link: 2021/22 achievements • At COP26 we launched the AiDash satellite tech partnership to improve the green value of our sites. • We began creating a digital copy of Great Britain’s energy system, a central tool that brings together every element of our system to create a collective and dynamic view. The virtual environment allows for testing and modelling to make accurate forecasts which enables commercial decision making and understanding of the impact for customers. • WPD has conducted significant roll-out of innovative flexibility initiatives, including procurement of flexibility services via the Flexible Power brand, which has procured 270 MW of flexibility services during 2021/22, affecting 2.4 million customers and achieving £49 million of deferred or avoided reinforcement. • In the US, we launched Pathfinder, a custom end-to-end solution that digitises and streamlines field force work, enabling work assignment, scheduling, dispatch, field work, data capture, tracking and reporting. • We signed an offshore partnership agreement with RWE Renewables to successfully bid jointly in the New York Bight seabed lease auction. Fifty people worked collaboratively across companies. • We were named in the Top 10 Outstanding Employers list by the Ethnicity Awards, which recognise companies working to ensure all people are afforded equal opportunity, regardless of race or ethnicity. • We launched MyHub Mentoring, our new mentoring programme that connects our experienced and skilled leaders with colleagues looking to develop professionally in specific areas. • We launched the ‘Grid Guide to Our People: Inclusion and Diversity’ podcast. • We were ranked 1st in the UK and 3rd globally for gender equality in a report published by Equileap. • As a diversity and inclusivity measure, WPD signed up to participate in the 10,000 Black Interns programme, which aims to help transform the prospects of young black people in the UK by offering internships to black students. • In the US, we received a score of 100 on the Human Rights Campaign Foundation’s 2022 Corporate Equality Index, and were named the Best Place to Work for LGBTQ Equality. • We signed up to the Valuable 500 initiative, in line with a core focus of our Responsible Business Charter: strengthening diversity and representation of the workforce. This initiative puts disability on the business leadership agenda with the aim of catalysing inclusive action. Key highlights 6 GW of network boundary capacity in the UK 46% of our Board seats are held by women Looking ahead • We will be a leader in pioneering smarter, low-carbon energy networks which at their core are made of resilient transmission and distribution grids. Our focus now is on building the diverse pipeline of employees that will get us to net zero. • The UK energy industry needs 400,000 additional people in new and existing jobs by 2050. • WPD is forecast to avoid £94 million of network reinforcement costs by using flexibility services. • We will continue to establish our purpose, vision and values, and reinforce our third value to ‘make it happen’. • We strive to achieve 50% diversity in all new talent programmes by 2025. • We will look to be included in the 2022 Bloomberg Gender- Equality Index, which tracks transparency in gender reporting. • WPD plans to demonstrate exceptional and embedded employment practices by achieving Gold accreditation with Investors in People by the end of RIIO-ED2. 21 S trateg ic R ep o rt National Grid plc Annual Report and Accounts 2021/22 08_OurStrategy_Innovation_KPI_p20_27_v112.indd 21 27/05/2022 16:44

The ESO manages the supply and demand to meet the needs of Great Britain, but it also has a clear mission: to decarbonise the energy system and bridge the gap to net zero. Continuing to innovate and adapt the energy system will require a range of new tools and a reimagining of how the entire industry can come together to have a lasting impact. To achieve this, in 2021, the ESO launched an ambitious, industry-wide mission to digitalise our energy system by constructing real-time digital twin replicas of our entire energy landscape, working in parallel to our physical system, thereby creating a virtual environment through which we can share data and model and test scenarios to make our decision making more robust. This will create valuable insight to help guide and govern how we generate, manage, store and consume energy, helping us make better decisions for Great Britain’s aim of achieving net zero targets more quickly and efficiently. On 1 December 2021, along with panellists from across Ofgem, BEIS, the Energy Digitalisation Taskforce, Energy Systems Catapult and more, the ESO hosted a one-day conference for the energy industry and wider stakeholders to find out more about the programme, and how to get involved. A series of advisory groups and engagement opportunities are taking place throughout 2022. Virtual Energy System in ESO WPD has started its largest vulnerability Network Innovation Allowance (NIA) funded project, focusing on developing ways to predict consumer vulnerability and ensure we can target our support and investment in our communities, or even households, that need it most. Working with our partners, the community energy group WREN, Frazer-Nash Consultancy and Frontier Economics, we are looking at how WPD can support vulnerable customers. We are assessing which commercial models would work best to: enable fuel poor consumers to participate in the decarbonisation of the energy system so as to benefit the community and achieve net zero; explore whether we can use smart meter data to identify vulnerable customers, and thus enable us to target support to those in our communities where it would be most effective and who need it most; and the effect of changes in electricity use as a result of the pandemic and whether, for instance, the shift to home working will have an impact on customers in vulnerable situations. WPD Innovation Engineer, Stuart Fowler said: “VENICE is no ordinary innovation project – it will shine a real light on energy use and help us to reach out to the people who need it most.” Vulnerability and Energy Networks, Identification and Consumption Evaluation (VENICE) in UK Electricity Distribution National Grid’s Deeside Centre for Innovation in North Wales has facilities set up ready for industry participants to trial and assess new technological developments before they go into service on the network. This unique environment allows designs to be validated under more realistic conditions than have been available ever before, with equipment being tested at 4,000 A and up to 600 kV outside of laboratory conditions, in an outdoor environment for extended periods of time – days, months or even years. UK ET is currently trialling two new innovative projects to cut harmful environmental emissions. Working with UK-based Rawwater, we have started work on delivering a novel method of sealing harmful environmental SF6 leaks by reducing emissions from small-bore pipework. Another key innovation project currently underway is the testing of a new patented concrete mixture called Cemfree (owned by DB Group), which potentially has a carbon footprint of 80% less than conventional types. Typical barriers to adoption of innovative concrete products include how they will behave on site and long-term durability. To address this, UK ET is currently testing two large-scale slabs (c.50 cubic metres) to identify the differences in performance between Cemfree and a conventional concrete. Deeside Centre for Innovation – UK ET Deeside Centre for Innovation, North Wales, UK 22 National Grid plc Annual Report and Accounts 2021/22 Our commitment to net zero continues to shape our innovation strategy, with our key aim being to deliver cleaner and cheaper energy. Our innovation and Research and Development (R&D) portfolio enables us to identify and target carbon savings for our own operations and we are also developing innovation projects to ensure we are prepared for, and play a pivotal role in, the decarbonisation of energy for power, heat, transport and industry. We place a high value on collaboration to inform, generate ideas and solve the challenges we see ahead of us, and we work with technical organisations, academia and suppliers in the energy sector that align with our goals and objectives. We set out here some of the key innovation projects our business units have been working on over the financial year. In addition, NGP, our corporate investment and innovation arm, continued to progress investments in emerging technologies and embedded these innovations across our US and UK core operations. You can find more detail about our R&D portfolio for our business units on pages 264 to 267. Innovation 08_OurStrategy_Innovation_KPI_p20_27_v112.indd 22 27/05/2022 16:44

NGP, our corporate investment and innovation arm, continued achieving impact for the Group by investing in emerging technologies such as AI, data security and cyber security, and embedding these innovations across our US and UK core operations. NGP’s portfolio as at 31 March 2022 comprised 38 companies and four fund investments at a fair value of $491 million. During the past fiscal year, NGP invested in 13 new startups – AptEdge, Baffle, Cogniac, Compute North, Cyolo, Finite State, Incorta, Pathr, Risilience, Sensat, Sync Computing, TS Conductor and Viridi Parente – whose technology can make power grids greener, more secure and more customer friendly. Existing portfolio company Dragos announced a $200 million funding round in which NGP participated as a returning investor. The Series D round is believed to be the largest ever for an operational technology (OT) cyber security company. NGP first invested in Dragos in 2018, when National Grid began using the company’s industrial threat intelligence service to monitor global threats to industrial control systems. NGP continues to build use cases of its portfolio innovations across our core businesses. Working with NGP portfolio company Cogniac, for example, National Grid Metering is using AI to train an AI model to identify different makes and models of gas-meter regulators (which may benefit from early replacement), using a variety of photographs taken from multiple angles and in various lighting conditions. This is increasingly critical for keeping customers safe and warm. More than 70% of NGP’s portfolio companies have strategic engagements with National Grid to help transform our operations – such as AiDash, which combines satellite data and AI to protect critical infrastructure. After a successful deployment in our US service territories to spot overgrown vegetation that can spark outages or fires, at COP26 AiDash unveiled an environmental stewardship product developed with National Grid and NGP’s Innovation team. In November, at COP26 in Glasgow, NGP hosted the Innovating our Way to Net Zero panel discussion with National Grid CEO John Pettigrew and the chief executives of Edison International and the Electric Power Research Institute on how corporate investments in startups can supercharge new clean energy technologies. Additionally, NGP’s NextGrid Alliance (NGA) continues to grow from 60+ member utilities at its launch in 2020 to 80+ global utility companies today. Nearly half the world’s regulated energy utilities have participated in NGA workshops in the past year to help advance innovation and accelerate the decarbonisation transition. NGP launched a new online community for Alliance members, at ngalliance.energy, in November. Since its launch in November 2018, NGP has led more than 50% of its startup investment rounds and achieved four portfolio exits – including October’s initial public offering of Vancouver-based Copperleaf Technologies, which helps National Grid and other critical infrastructure companies ensure their capital spending generates the highest strategic value, including planning for net zero. Framing the pathway to the energy transition is a combination of looking at the mega trends known as the three Ds: digitalisation, decentralisation and decarbonisation. Getting there will require enabling technologies like iOT, data analytics, storage cloud, cyber security, and, in turn, investment in areas such as asset modernisation, increased customer focused solutions and smart enterprise. More details can be found at ngpartners.com, including details of each of our portfolio investments. National Grid Partners We are excited to have launched the HyGrid project, the largest green hydrogen-blending project for direct use by utility customers in the northeastern US and one of the first in the country. In the town of Hempstead on Long Island, HyGrid is expected to heat approximately 800 homes and fuel 10 municipal vehicles at no additional cost to customers. Much of the equipment required to create zero-carbon hydrogen is already in place at the site; this includes existing wind and solar equipment for generating hydrogen fuel for vehicles, and an adjacent National Grid facility that provides energy for the local neighbourhood. Rudy Wynter, President of National Grid New York, said: “We believe that hydrogen can transform the energy industry, and we are at the forefront.” HyGrid – hydrogen blending project in New York FLISR is a scheme-based system that monitors and responds to electrical faults along our networks. It identifies and isolates the location of a fault to minimise impact to the grid and the number of customers affected, while enabling a speedier return to service for uninvolved customers when this is safely possible. Creating FLISR capabilities involves installing reclosers and feeder monitors at substations, with preprogrammed logic, to enable near real-time responses to faults. The technology was installed as part of the Advanced Data Analytics programme. In the midst of the 2021 nor’easter, the FLISR scheme was active on feeders from West Salem and Saugus in the North Shore District in New England. A tree limb created a mainline fault condition between the West Salem substation circuit breaker and the first downstream pole-top recloser on the line. FLISR logic was activated and quickly restored service to 1,531 customers in 16 seconds. The remaining 2,356 customers experiencing the outage had their service restored in 141 minutes after the repairs to the feeder were completed. Had this FLISR scheme not been implemented, all 3,887 customers would have experienced the full outage. Fault Location, Isolation and Service Restoration (FLISR) in New England FLISR: installation of recloser. New England, US 23 S trateg ic R ep o rt National Grid plc Annual Report and Accounts 2021/22 08_OurStrategy_Innovation_KPI_p20_27_v112.indd 23 27/05/2022 16:44

Enable the energy transition for all Grow our organisational capability Deliver for customers efficiently Empower colleagues for great performance Indicates an alternative performance measure Link to strategy Financial measures Link to remuneration Remuneration of our Executive Directors, and our employees, is aligned to successful delivery of our strategy. We use a number of our KPIs/ alternative performance measures as specific measures in determining the Annual Performance Plan (APP) and Long-Term Performance Plan (LTPP) outcomes for Executive Directors. While not explicitly linked to APP and LTPP performance outcomes, the remaining KPIs1 and wider business performance are considered. For further detail, please see our Directors’ Remuneration Report, on pages 108 – 131. Strategy link KPI and performance Progress in 2021/22 Group RoE (%) In calculating Group RoE, we measure our performance in generating value for shareholders by dividing our regulated and non-regulated financial performance, after interest and tax, by our measure of equity investment in all our businesses, including the regulated businesses, NGV and Other activities and joint ventures. Target: 9.75 – 11% each year 11.4 10.6 12.0 2021/22 2020/21 2019/20 Group ROE of 11.4% was higher than 2020/21 (10.6%) with higher regulated financial performance mainly due to the acquisition of WPD and an improved contributions from our non-regulated businesses mainly due to higher interconnector revenues. Total regulated asset growth (%) Maintaining efficient growth in our regulated assets ensures we are well positioned to provide consistently high levels of service to our customers and increases our future revenue allowances. This includes investment for a changing climate, enabling clean electricity, heat and transport. Target: 6 – 8% growth each year 8.7 5.6 9.0 2021/22 2020/21 2019/20 Asset growth during the year was 8.7% (2020/21: 5.6%). Capital investment of £7.0 billion (including UK GT), driven by the growth in WPD, along with higher RAV indexation (due to higher inflation) resulted in this increase. Asset growth in 2020/21 was adversely impacted by lower RAV indexation and the impact of COVID-19. Cumulative investment in delivering new low-carbon energy sources (£m) We invest in new low-carbon energy sources primarily through our interconnector businesses (North Sea Link, IFA, IFA2 BritNed and Viking Link), investments in, and partnerships with, companies delivering low-carbon energy sources (for example, our partnership with Sunrun) and investments into large-scale renewables (for example, our new investment in NGR). 2,610 1,874 1,440 2021/22 2020/21 2019/20 Investment in delivering new low carbon energy sources increased in the year by £300 million (69%), largely driven by investment in US Offshore Wind (purchase of 3.2 GW seabed lease) and increased investment in onshore renewables, with the latter reflecting the construction of the Noble and Yellowbud projects. PwC Assured Data Denotes information subject to limited assurance by PricewaterhouseCoopers LLP see page 61 for full definition. 1. Two of our previously reported KPIs: Contribution of our corporate responsibility work and Education, skills and capabilities, have been retired as similar metrics are reported in our RBR. 24 National Grid plc Annual Report and Accounts 2021/22 The Board uses a range of metrics¹, reported periodically, against which we measure Group performance. These metrics are aligned to our strategic priorities. Key performance indicators

Financial measures continued Non-financial measures Strategy link KPI and performance Progress in 2021/22 Cumulative low-carbon generation connected to our UK ET network (GW) Low-carbon generation supported by our network to date. 20.9 19.0 18.0 2021/22 2020/21 2019/20 A total of 20.9 GW of low-carbon generation is currently connected to our network, following additional offshore wind capacity connecting at Triton Knoll (540 MW), Hornsea 2 (1320 MW) and Lincs Offshore Wind farm (9 MW). The government’s 10 point plan alongside the new Energy Strategy and commitment to annual Contract for Difference (CfD) allocation rounds, indicates further increases in low-carbon capacity over the coming years. Connections of renewable schemes to US electric distribution network (MW) The table represents the amount of customer-owned renewable energy capacity installed on our distribution network across our US footprint. Given the variability and unpredictability of customer-driven projects, the Company does not presently have a MW target. Current targets primarily focus on regulatory compliance and customer need date attainment. 569 470 329 2021/22 2020/21 2019/20 The Company interconnected 569 MW of distributed renewable energy resources in 2021/22 across our service territory, an all-time high and a 20% increase compared with the previous fiscal year. The Company interconnected a record number of distributed renewable energy applications in 2021/22 across our service territory, totalling to 13,400 applications. The State of Massachusetts, New York and Rhode Island installed a record amount of distributed renewable energy capacity (216 MW, 244 MW and 109 MW respectively). Cumulative low-carbon generation connected to our UK Electricity Distribution network (GW) Low-carbon generation connected to our UK ED network, to date. 6.7 6.2 6.2 2021/22 2020/21 2019/20 A total 10.2 GW distribution generation is connected to our network to date, of which 6.7 GW is low-carbon generation. This includes biofuels, wind, solar, hydro and storage. Further reading: You can find out additional detail to support some of these KPIs in our Responsible Business Report. This document can be found by visiting: nationalgrid.com/responsibility Strategy link KPI and performance Progress in 2021/22 NGV capital investment (£m) NGV is focused on investment in a broad range of energy businesses across the UK and US, including our interconnector business, large-scale renewable generation, LNG storage and regasification, and energy metering. 913 530 2021/22 2020/21 NGV capital investment, including Long Island Power Authority (LIPA) Gen (‘Genco’) has increased year-on-year by £383 million (72%). This is principally due to investment in US offshore wind (purchase of 3 GW seabed lease), increased investment in onshore renewables, reflecting the construction of the Noble and Yellowbud projects, and the Cap.25 project within Grain LNG. Prior year data has been restated to include Genco and exclude NG Metering. This is to align to NGV’s current structure. 2019/20 data is not included to align with the data in the financial statements. 25 S trateg ic R ep o rt National Grid plc Annual Report and Accounts 2021/22

Strategy link KPI and performance Progress in 2021/22 Climate change – Scope 1, 2 and 3 emissions This is a measure of our reduction of Scope 1, Scope 2 and Scope 3 emissions of the six primary Kyoto greenhouse gases. Our target is to reduce our combined Scope 1 and 2 greenhouse gas emissions by 80% by 2030, 90% by 2040 and to net zero by 2050, compared with our 1990 emissions of 21.6 million tonnes1. Furthermore, we target reducing our Scope 3 emissions by 37.5% by 2034 from 2019 emissions of 33.2 million tonnes. The percentages in the chart below reflect a reduction in our Scope 1 and 2 emissions, from the relevant baseline. The figures are million tonnes of CO2 equivalent. 7.5265% 68% 70% 6.9 6.5 2021/22 2020/21 2019/20 The figures in the chart below represent our Scope 3 emissions and are million tonnes of CO2 equivalent. 30.1 28.9 30.8 2021/22 2020/21 2019/20 1. This 1990 baseline will be updated to reflect portfolio changes in 2022/23. The 1990 baseline does not include emissions from our newly acquired UK ED business (WPD). 2. PwC Assured Data: total Scope 1 and 2 emissions only. Further reading You can read more about the Task Force on Climate-related Financial Disclosures and our wider sustainability activities and performance on pages 70 – 83. Our Scope 1 greenhouse gas emissions for 2021/22 equate to 5.3 million tonnes of CO2 equivalent (2020/21: 4.7 million tonnes) and our Scope 2 emissions (including electricity line losses) equate to 2.2 million tonnes (2020/21: 2.2 million tonnes). This is a total of 7.5 million tonnes of CO2 equivalent for Scope 1 and 2 emissions. These figures include line losses and are equivalent to an intensity of around 411 tonnes per £1 million of revenue (2020/21: 467 tonnes). Our Scope 3 emissions for 2021/22 were 30.0 million tonnes of CO2 equivalent (2020/21: 28.9 million tonnes). 75% of Scope 1 and 2 emissions were in our US business, with 25% in the UK. For our Scope 3 emissions, 91% were in our US business with 9% in our UK business. Our total energy consumption is 3,502 GWh where the UK and US are responsible for 2,341 GWh and 1,161 GWh respectively. This excludes fuels consumed for power generation in the US which is 19,610 GWh and system losses which are 11,117 GWh. We measure and report in accordance with the World Resources Institute and World Business Council for Sustainable Development Greenhouse Gas Protocol. Scope 1, 2 and 3 emissions are subject to independent limited assurance against ISAE 3410 Assurance Engagements on Greenhouse Gas Statements. This data complies with the UK government’s Streamlined Energy and Carbon Reporting (SECR) requirements. For further detail, please see page 68. Network reliability We aim to deliver reliability by planning our capital investments to meet challenging demand and supply patterns, designing and building robust networks, having risk-based maintenance and replacement programmes, and detailed and tested incident response plans. We measure network reliability separately for each of our business areas. The table below represents our performance across all our networks in terms of availability. % 2021/22 2020/21 2019/20 UK Electricity Transmission 99.99993 99.99997 99.99997 UK Gas Transmission 100.00000 100.00000 99.99960 UK Electricity Distribution 99.99469 99.99455 99.99469 NE Electricity Transmission 99.97636 99.95428 99.91471 NY Electricity Transmission 99.95261 99.95429 99.98194 NE Electricity Distribution 99.92725 99.91239 99.95205 NY Electricity Distribution 99.95681 99.92788 99.93180 Interconnector availability IFA interconnector 61.3 95.4 91.4 IFA2 interconnector 90.4 96.5 — BritNed interconnector 80.4 75.1 98.6 NSL interconnector 63.3 – – Nemo Link interconnector 99.0 99.2 96.1 In both the UK and US, we continued to maintain high levels of reliability on all our networks. The fire at our IFA interconnector resulted in reduced capacity. The NSL interconnector started commercial operations in 2021/22. Non-financial measures continued 26 National Grid plc Annual Report and Accounts 2021/22 Key performance indicators continued 08_OurStrategy_Innovation_KPI_p20_27_v112.indd 26 27/05/2022 16:44

Strategy link KPI and performance Progress in 2021/22 Customer satisfaction We measure customer and stakeholder satisfaction, while also maintaining engagement with these groups and improving service levels. 2021/22 2020/21 2019/20 Target UK Electricity Transmission (/10) 7.78 8.4 8.2 7.78 UK Electricity System Operator (/10) 7.3 7.5 7.6 8.15 UK Electricity Distribution 9.03 9.18 9.11 — UK Gas Transmission (/10) 8.6 8.2 8.0 7.9 NE residential — Customer Trust Advice survey (%) 59.9 63.3 55.0 — NY residential — Customer Trust Advice survey (%) 64.3 68.1 63.1 — Metering NPS score (index) +53 +61 +40 — 2021/22 was the trial year for the UK ET Quality of Connections Incentive introduced by Ofgem. This measures key touchpoints throughout the Customer Connection journey and gives us the ability to target specific areas of improvement. UK ET and GT figures represent our baseline targets set by Ofgem for reward or penalty under RIIO-T2 (maximum score is 10). Prior year information is based on RIIO-T1. The change in target in 2021/22 reflects the new Incentive mechanism and change in methodology going forward. The US metrics measure customers’ sentiment with National Grid by asking customers their level of trust in our advice to make good energy decisions. These metrics are tied to the value customers feel they receive from National Grid. The NPS score reported represents the UK metering business. Although this has seen a decline in 2021/22, action plans are in place to improve the score, going forward. Group lost time injury (LTI) frequency rate (LTIs per 100,000 hours worked) This is the number of worker LTIs per 100,000 hours worked in a 12-month period (including fatalities) and includes our employee and contractor population. Target: <0.1 LTIs 0.13 0.10 0.13 2021/22 2020/21 2019/20 As at 31 March 2022, our Group lost time injury frequency rate (LTIFR) was 0.13, which is higher than the Group target of 0.10. This is a combined employee and contractor LTI rate, which reflects our continued focus on encouraging good safety behaviours across the entire workforce. This result excludes WPD data which can be found on page 51. We are working to harmonise WPD’s LTIFR records for data collection, with those of the Group. We have had a number of disappointing months regarding incidents, the proportion of which relate to slips trips and falls and musculoskeletal strains and twists, where lack of concentration and complacency play a part. In recent months, we completed a review of safety and we are using the outputs to define a Group-wide programme to address these going forward. The programme will include focus on effective behavioural programmes. The 2019/20 result has been restated. The change results from a review of data collation processes that identified a small anomaly regarding collation of hours worked information Employee engagement index (%) This is a measure of how engaged our employees feel, based on the percentage of favourable responses to questions repeated annually in our employee engagement survey. Our target is to increase engagement compared with the previous year. 81 81 77 2021/22 2020/21 2019/20 We measure employee engagement through our employee engagement survey (EES) called Grid:voice. Our engagement score was 81%. The result also includes WPD colleagues. Workforce diversity (%) – ethnicity We measure the percentage of ethnic minorities in our workforce. We aim to develop and operate a business that has an inclusive and diverse culture (see page 65 — 66). 20.2 19.5 18.8 2021/22 2020/21 2019/20 Our ethnic diversity data for 2021/22 does not include WPD colleagues. We are working to harmonise WPD’s ethnicity records for data collection, with those of the Group. We will look to include WPD data next year. Workforce diversity (%) – gender We measure the percentage of women in our workforce. We aim to develop and operate a business that has an inclusive and diverse culture (see page 65 — 66). 24.7 23.1 24.7 2021/22 2020/21 2019/20 Our gender diversity data for 2021/22 has been updated to include WPD colleagues, following the acquisition of WPD. 27 S trateg ic R ep o rt National Grid plc Annual Report and Accounts 2021/22 08_OurStrategy_Innovation_KPI_p20_27_v112.indd 27 27/05/2022 16:44

When the conflict began, we immediately established a crisis assessment team, of multi-disciplined leaders, to oversee and coordinate our response. We evaluated the immediate threat, analysed the risk profile across time horizons including scenario planning, and completed a strategic impact assessment. Although the immediate impact to National Grid was minimal, we increased our focus on risks and strengthened controls associated with cyber and physical security, security of energy supply, political and societal expectations, our supply chains, and sanction compliance. We supported the UK government with advice on stabilising energy markets, reducing UK (and EU) dependence on Russian energy and developing the British Energy Security Strategy. We made charity donations and provided electrical equipment to support the Ukrainian people (including 500 diesel generator units). The war, heightened energy bills, and changes to UK and EU energy policy have increased uncertainty across the energy sector. We are continually evaluating how we manage our risks, deliver for our customers, and fulfil our role as The Energy Transition Company. Ukraine-Russia 28 National Grid plc Annual Report and Accounts 2021/22 The Board is committed to protecting and enhancing our reputation and assets, while safeguarding the interests of our shareholders. Managing our risks National Grid is exposed to a variety of uncertainties that could have a material adverse effect on the Group’s financial condition, our operational results, our reputation, and the value of our shares. The Board oversees the Company’s risk management and internal control systems; it sets and monitors the amount of risk the Company is prepared to seek or accept in pursuing our strategic objectives – our risk appetite. The Board assesses the Company’s Group Principal Risks (GPRs) and monitors the risk management process through risk review and challenge sessions twice a year. Risk management process Risk strategy, policy and processes are set at Group level with the business responsible for implementation. Our Enterprise Risk Management (ERM) process provides a framework to identify, assess, prioritise, manage, monitor and report risks. It supports achieving our vision, strategy and business model as described on pages 4 – 7. This year we established a new risk governance structure with the creation of the Group Executive Ethics, Risk and Compliance Committee (Group ERC), along with equivalent committees in the business units, providing enhanced oversight and governance of risk top-down and bottom- up across the Group. Our corporate risk profile contains the GPRs that the Board considers to be the main uncertainties currently facing the Group as we endeavour to achieve our strategic objectives. These top risks are agreed through discussions on the Group’s risk profile with the Group ERC, Audit & Risk Committee and the Board. The risks are reported and debated with the Group ERC every two months, and with the Board at least every six months. Internal control and risk management Top-down, bottom-up assessment Risk management activities take place at all levels of our organisation. Through a ‘top-down, bottom-up’ approach, all business areas identify the main risks to our business model and our business objectives. For each risk the effectiveness of our internal controls is assessed when calculating the financial, operational and reputational impacts, and how likely the risk is to materialise. Where current risk levels are outside of agreed target scores and our risk appetite, the business area identifies and takes actions to close the gap. Cascade and escalation mechanisms are in place throughout the organisation as appropriate for risk appetite, risks, controls and action plans. Business First Line The business units and functions that are responsible for taking, owning and managing risks. The First Line works closely with the Second Line to agree policies and risk limits that align with risk appetite. Business Assurance Second Line The risk oversight teams provide independent oversight of risks, and establish policies and limits for the First Line. The assurance teams monitor risks and controls in support of the business. Assurance provides advice, but also effective challenge to the First Line. Governance (Board and Audit & Risk Committee) Establishes the strategy, operating model and risk framework. Evaluates reports. Internal Audit Third Line The Internal Audit function provides independent assurance over risks and controls. The Third Line function communicates directly with the Board and senior management regarding the effectiveness of risk and controls management. M aturity 09b_Internal_control_and_risk_management_p28_32_v53.indd 28 27/05/2022 16:45

Emerging risks 29 S trateg ic R ep o rt National Grid plc Annual Report and Accounts 2021/22 Changes during the year The Company’s risk profile has been developed drawing upon the most significant risks across our business profiles. Eight GPRs are now carried at Group ERC and Board level as detailed below. We reviewed all GPRs at least twice during the year, including an assessment of the key controls, the key risk indicators (KRIs), risk scores, alignment to risk appetite, and future mitigation actions. Through these reviews, our data management and disruptive forces risks were identified for de-escalation or retirement. There are no significant flags or hot spots that indicate a shift in risk exposure. This year we split our principal climate change risk to establish a discrete transition climate change risk and incorporated the physical impacts from climate change on our assets (adaptation) into our significant disruption of energy risk, to ensure a clear focus on the actions needed to mitigate these different risks. The significant disruption of energy risk focuses on network reliability and resilience. Emerging risks (ERs) are less defined than GPRs and typically do not pose an immediate threat. They are future focused, with greater uncertainty and are more difficult to quantify; however, they could threaten the future achievement of our strategy. Utilising future scenarios, horizon scanning and emerging risk assessments, we identify ERs that could potentially threaten the achievement of our strategic objectives in the future. Our ongoing ER process includes the identification, assessment, response, and reporting of ERs. Assessment includes the potential impact and velocity (time to impact) and our response is to then either watch, monitor or manage the risks that are reported to the Board and Group ERC using our emerging risk radar. Following our agreement to sell a 60% stake in the UK GT business and completion of our preliminary integration activities associated with the acquisition of WPD, we retired our ‘transaction-related’ GPR. Continued economic and political turmoil is significant, with years of global energy policy and strategy increasingly being affected. For National Grid, while our current risk levels are predominantly unchanged, the rapidly evolving situation and uncertainty require very careful monitoring and assessment of our GPRs and ERs. They have created an increase in the underlying (inherent) threat across our cyber, disruption of energy, political and societal expectations, and satisfactory regulatory risks, which we are continuously monitoring. Our principal risks and uncertainties Accepting that it is not possible to identify, anticipate or eliminate every risk that may arise, and that risk is an inherent part of doing business, our risk management process aims to provide reasonable assurance that we understand, monitor and manage the main uncertainties we face in achieving our objectives. This aim includes considering inherent risks, which in turn exist because of the nature of day-to-day operations in our industry, including financial risks, which exist because of our financing activities. Our GPRs, and a summary of actions taken by management, are provided on pages 30 – 32. We have provided an overview of the key inherent risks we face on pages 253 − 256, and specifically our key financial risks, which are incorporated within note 32 to the consolidated financial statements on pages 211 − 223. Risk trends reported on the pages that follow take into account controls and any additional mitigation actions, and may be influenced by internal or external developments. • Emerging risk assessments • Assessment outcomes determine how we will manage the emerging risk (watch, monitor, manage) • Future scenarios (strategy) • Horizon scanning • Emerging risks • Reporting of emerging risk watchlists, radar and risk management 1. Identify 3. Response 4. Report 2. Assess 09b_Internal_control_and_risk_management_p28_32_v53.indd 29 27/05/2022 16:45

30 National Grid plc Annual Report and Accounts 2021/22 People risks It is through the high-quality work of our employees that we will achieve our vision, respond to the changing needs of our stakeholders and create a competitive advantage. Building and fostering an engaged and talented team that has the knowledge, training, skills and experience to achieve our strategic objectives is vital to our success. We must attract, integrate and retain the talent we need at all levels of the business. These risks link to our strategic priority to ‘empower colleagues for great performance’. Risk Actions taken by management Capability and leadership There is a risk that we do not have sufficient capability and leadership capacity. *Risk trend: Neutral (2020/21: Neutral) Strategic priority link * Risk trends are assessed to include any external factors outside our control as well as the strength and effectiveness of our controls and additional mitigations as reviewed by management up to 31 March 2022. We are involved in a number of initiatives to help secure the future engineering talent we require, including industrial placements and internships in the UK and US, advanced and higher apprenticeships in the UK and a graduate development programme across both the US and UK. We are focused on ensuring we have high levels of diversity in these future talent pools. Our entry-level talent development schemes (graduate training and apprenticeships) are a potential source of competitive advantage in the marketplace. We also continue to develop the rigour of our succession planning and development planning process, particularly at senior levels. We are now applying it deeper into the organisation as well as giving continued attention to the ethnic diversity of both our management and field force. There are multiple activities underway to support this agenda, including ‘neutral’ talent and selection processes, development interventions and a global launch of our diversity, equality and inclusion (DEI) strategy and resources. Financial risks While all risks have a direct or indirect financial impact, financial risks are those which relate to financial objectives and performance. Financial risk management is a critical process used to make investment decisions and aims to maximise investment returns and earnings for a given level of risk. None of our financial risks are currently classified as GPR. Our key financial risks are described in note 32 to the financial statements on pages 211 – 223. Strategic risks Strategic risk is the risk of failing to achieve our overall strategic business plans and objectives, as well as failing to have the ‘right’ strategic plan. We intentionally accept some risk so we can generate the desired returns from our strategy. Management of strategic risks focuses on reducing the probability that the inherent risk would materialise, while improving our ability to respond to the risk effectively should it occur. The risk owners, executive leaders and their teams develop and monitor ways to control the risks. These risks link to our strategic priorities of ‘enable the energy transition for all’ and ‘deliver for customers efficiently’. The political climate and policy decisions of our regulators were key considerations in assessing our risks. Risk Actions taken by management Climate change There is a risk that we fail to identify and/or deliver upon actions necessary to address the transitional impacts (from a changing energy system) of climate change on our business and demonstrate our leadership of climate change in the energy sector. Risk trend: Neutral (2020/21: Neutral) Strategic priority link Putting in place measures to: • evolve our environmental sustainability metrics to better reflect our strategy, measure our impact and track our progress; • address our GHG emissions and meet our sustainability commitments, including net zero by 2050, hosting our first environmental, social and governance (ESG) investor seminar, including the publication of our Responsible Business Charter setting out what responsibility means for us and our commitments and ambitions over the coming years − progress is reported in our annual Responsible Business Report; • advocate for legislative and policy changes that advance decarbonisation, while proposing and delivering actions in the regions we operate to accelerate decarbonisation for the public and our customers. This work is wide-ranging from system improvements to supporting renewable generation connections, EV proposals, oil to gas/electricity heat conversions, energy efficiency, interconnectors, thought leadership and investment in new and emerging areas. Note that a number of the above measures also address the physical impacts of climate change on our operations; • regularly assess the potential range of net zero pathways and future impact on our gas assets, including evaluation of new and evolving technologies and alternative fuel sources (e.g. hydrogen); • work to include renewable gases in our US gas distribution networks; • commit to making disclosures which are aligned with the Task Force on Climate- related Financial Disclosures (TCFD), including physical and transitional scenario analysis (see pages 70 − 83); • support the charging infrastructure required for increased use of EVs; • promote energy-efficiency programmes for customers in the US; • facilitate decarbonisation in the US and UK, including zero-carbon operation of the GB electricity system through ESO in the UK; and • continue work on programmes to develop skills in our current and future workforce. Internal control and risk management continued 09b_Internal_control_and_risk_management_p28_32_v53.indd 30 27/05/2022 16:45

31 S trateg ic R ep o rt National Grid plc Annual Report and Accounts 2021/22 Risk Actions taken by management Satisfactory regulatory outcomes There is a risk that we fail to influence future energy policies and secure satisfactory regulatory agreements. Risk trend: Neutral (2020/21: Neutral) Strategic priority link In both the UK and the US, we strive to maintain a good understanding of the regulatory agenda and emerging issues, so that we can select and develop robust, public interest aligned responses in good time. Our reputation as a competent operator of important national infrastructure is critical to our ability to do this. We have plans and governance structures in place to address key regulatory proceedings such as UK price controls and US rate case filings. Ongoing work to support our regulatory relationships includes: • in the UK, influencing policy through a range of avenues, including inputting and responding to government consultations and other outputs, direct engagement with government departments and engagement with wider stakeholders such as parliamentarians, trade associations and third parties; • in the US, influencing policy through a range of avenues, including inputting and responding to legislative proposals, regulatory rulemakings and requests for information and other outputs; advocating with Congress and the Administration; and engagement with wider stakeholders such as trade associations, think tanks and other non-government organisations; • establishing a regulatory strategy focusing on a transition to performance-based regulation; • establishing US and UK regulatory steering committees; and • increased focus on understanding the needs and expectations of all our stakeholders through regulatory relationship surveys, investor surveys and review of media sentiment. Political and societal expectations and perceptions There is a risk that we do not position ourselves appropriately to political and societal expectations. Risk trend: Neutral (2020/21: Increasing) Strategic priority link Processes and resources are in place to review, monitor and influence perceptions of our business and our reputation by: • enhancing and consolidating our digital roadmap and social channels; • developing an internal forum to increase management of stakeholder and media reputational issues; • meeting our commitment to be a responsible business (see pages 60 − 69); and • promoting partnerships and proactive policy-change discussions across the jurisdictions where we operate. Considerations on emerging risks and horizon-scanning activities have also been addressed as part of financial and reputational impact assessments. These processes, along with twice-yearly Board strategy discussions, are reviewed regularly to ensure they continue to support our short- and long-term strategy. We regularly monitor and analyse market conditions, competitors and their potential. Operational risks Operational risks relate to the losses resulting from inadequate or failed internal processes, people and systems, or due to external events. These risks normally fall within our low-risk appetite level as there is no strategic benefit from accepting the risk, as it will not be in line with our vision and values. Our operational principal risks have a low inherent likelihood of occurring. However, should an event occur, without effective prevention or mitigation controls, it would be likely to have a high level of impact. The risk owners, executive leaders and their teams develop and monitor actions to control the risks. Operational risks are managed through policy, standards, procedure-based controls, active prevention and monitoring. The operational risks link to our strategic priority to ‘deliver for customers efficiently’. Principal risk assessment includes reasonable worst-case scenario testing, e.g. gas transmission pipeline failure, loss of licence to operate, cyber security attack, and the financial and reputational impact should a single risk or multiple risks materialise. Risk Actions taken by management COVID-19 There is a risk that we fail to respond to significant disruptive factors caused by the COVID-19 pandemic. Risk trend: Decreasing: driven by the move to ‘living with COVID-19’ policies in the UK and US (2020/21: Decreasing) Strategic priority link The COVID-19 pandemic affected several areas of our business, and we responded with a comprehensive plan, supporting the safety of our workforce and customers. • Mitigating procedures are now part of business as usual, with further improvements to the Crisis Management Framework (CMF) planned. • As COVID-19 rates reduce and the UK and US begin to move to an endemic status, we expect the risk will be retired as a GPR in 2022/23. Throughout 2021/22 we have monitored effects on our people, operations, strategic objectives, regulatory and political engagement, and financial implications. Our approach has been proactive to ensure our business can continue to serve its customers appropriately. 09b_Internal_control_and_risk_management_p28_32_v53.indd 31 27/05/2022 16:45

32 National Grid plc Annual Report and Accounts 2021/22 Risk Actions taken by management Cyber security There is a risk that we are unable to adequately anticipate and manage disruptive forces on our systems because of a cyber-attack, or poor recovery of critical systems or malicious external or internal parties. Risk trend: Increasing: driven by increased threat from global geopolitical tensions (2020/21: Decreasing) Strategic priority link We are committed to providing secure and resilient services and continue to commit significant resources and financial investment to maintaining the security of our systems and our data. Our approach is holistic and includes: • close partnerships with UK and US government agencies, including the Department for Business, Energy and Industrial Strategy (BEIS), the Centre for Protection of National Infrastructure (CPNI), the Department of Energy and Climate Change and the Department of Homeland Security, to understand risks and collaborate on risk management activities; • utilising good practice frameworks including the National Institute of Standards and Technology Cybersecurity Framework to ensure we can identify, protect, detect, respond and recover from cyber security threats (i.e. implementation of control frameworks across our security programmes in IT, operational technologies and Critical National Infrastructure (CNI); and • a strong focus on compliance with our regulatory obligations including the European Union Directive on Security of Network and Information Systems Regulation (the ‘NIS Directive’) and US North American Electric Reliability Corporation Critical Infrastructure Protection. Asset failure There is a risk of a catastrophic asset failure leading to a significant safety or environmental event. Risk trend: Neutral (2020/21: Neutral) Strategic priority link We continue to focus on risk mitigation actions designed to reduce the risk and help meet our business objectives, including the following: Ongoing preventative measures: • inspection and maintenance programmes including defect management; • UK and US winter-preparedness plans; • US storm-hardening programme; and • outage planning. Event response: • emergency response plans; • incident-management system; • disaster recovery; and • business continuity management. Embedded Group-wide process safety management system: • to make sure a rigorous and consistent framework of risk management exists across our high-hazard asset portfolio, with safety-critical assets clearly identified on the asset register. Implemented asset management and data management standards, including: • supporting guidelines to provide clarity on what is expected; and • a strong focus on what we need in place to keep us safe, secure and legally compliant. Established capability frameworks to make sure our workforce has the appropriate skills and expertise to meet the performance requirements in these standards. Significant disruption of energy There is a risk that we fail to predict and respond to a significant disruption of energy supply. Risk trend: Neutral (2020/21: Increasing) Strategic priority link We continue to apply a holistic approach to managing this risk through preventative mitigating actions to maintain network reliability, and timely and effective response plans. Key management actions include the following: Ongoing preventative measures: • inspection and maintenance programmes including defect management; • flood contingency plans for substations; • System Operator supply and demand forecasting; • UK and US winter-preparedness plans; • US gas-mains replacement programmes; • US storm-hardening programme; • outage planning; and • diversity of suppliers in our US gas procurement. Event response: • emergency response plans; • incident-management system; • disaster recovery; and • business continuity management. We have also reviewed market resource adequacy and balancing (where applicable). The short-term controls and investments needed for a resilient network are in place, but further work remains to be done to build our climate adaptation forecasting and control framework for the next decade. Internal control and risk management continued 09b_Internal_control_and_risk_management_p28_32_v53.indd 32 27/05/2022 16:45

33 S trateg ic R ep o rt National Grid plc Annual Report and Accounts 2021/22 The Board’s consideration of the longer-term viability of the Company is an extension of our business planning process. The process includes financial forecasting, a strict risk management assessment and regular budget reviews and scenario planning incorporating industry trends, considering any emerging issues and economic conditions. Our business strategy aims to enhance our long-term prospects by making sure our operations and finances are sustainable. Using our established top-down, bottom-up risk- management process, we monitor and challenge the GPRs facing the Company as described on pages 28 − 32. Over the year, the Board has considered the preventative and mitigating controls and risk management actions in place for the GPRs and discussed the potential financial and reputational impact of the GPRs on our ability to achieve the Company’s business plan. The assessment of the potential impact of our GPRs on the longer-term viability of the Company tests the significant solvency and liquidity risks involved in achieving our business objectives and priorities. Although it has considered adopting varying time periods, the Board believes five years is the most appropriate timeframe over which we should assess the long-term viability of the Company. Our GPRs are subject to annual stress testing to assess whether we have a reasonable expectation that the Company will be able to continue in operation and meet its liabilities as they fall due (our continued viability). Viability is assessed considering the following criteria: Reasonable worst- case scenario (RWCS) A theoretical generic representation of a challenging yet plausible manifestation of a risk. The RWCS is considered worst-case once the high-impact, low-likelihood manifestations of a risk have been discounted. Five-year horizon A five-year assessment period represents a reasonable time horizon that coincides with our more detailed annual business plan models that reflect the UK price control periods. It is a period over which we can foresee and quantify reasonably accurately the potential impact of future risk events. Cliff-edge risks Cliff-edge risks are threats that would occur beyond the assessment period, have a reasonably certain impact and are sufficiently large to threaten our viability. We consult the business to look for significant and potential cliff-edge risks beyond the five-year period. If any such risks are identified, then an assessment period beyond five years is considered. Financial and reputational risk capacity We primarily assess our viability from the RWCS in two ways: financial risk capacity and reputational risk capacity. Business plan stress testing We assess the financial impact and financial risk capacity of our risk testing using the latest business plan. Individual risk testing For each principal risk we assess the potential financial and reputational impact. Risk cluster testing We also test for risk clusters. This is the impact of more than one of the principal risks materialising during the assessment period, or where the materialisation of one risk could exacerbate another. Mitigation actions Where a risk scenario would potentially exceed our financial risk capacity, we consider reasonable management mitigation. We considered each GPR for inclusion within the testing and, where appropriate, identified and assessed a RWCS for impacts on operations or financial performance over the five-year assessment time period as detailed below: Operational impacts Scenario 1 A significant cyber-attack. Scenario 2 Significant supply disruption event occurring in the US during peak season. Scenario 3 A significant process safety gas pipeline failure in NY. Performance impacts Scenario 4 Poor outcome of future US rate case filings, and low performance under RIIO-T2 and RIIO-ED2. Scenario 5 A breach of compliance rules for onshore competition in electricity transmission by ET. NY legislation and political relationships leading to loss of NY licences. Scenario 6 Inability to recover NY/NE COVID-19-related bad debts through future regulatory agreements. Scenario 7 Not meeting our net zero targets. In addition to testing individual GPRs, we also considered the impact of a cluster of the GPRs materialising over the assessment period. By assessing the interconnectivities of our GPRs we have selected the risk cluster RWCS that poses the most significant threat to our viability. Our cluster RWCS is a catastrophic cyber-attack, contributing to a catastrophic asset failure and a significant safety event, causing a significant disruption of energy, and ultimately to a loss of our regulatory licences. The scenario is assumed to occur in our US NY gas businesses. Viability statement We considered the reputational and financial impacts for each scenario. The GPR relating to leadership capacity was not tested, as the Board did not feel this would threaten the viability of the Company within the five-year assessment period. The Board assessed our reputational and financial headroom and reviewed GPR testing results using that headroom. The testing of risk clusters also included an assessment of the impact upon the business plan. No GPR or cluster was found to have an impact on the viability of the Company over the five- year assessment period. Preventative and mitigating controls in place to minimise the likelihood of occurrence and/or financial and reputational impact are contained within our assurance system. In assessing the impact of the GPRs on the Company, the Board has considered the fact that we operate in stable markets and the robust financial position of the Group, including the ability to sell assets, raise capital and suspend or reduce the payment of dividends. Each Director was satisfied that they had sufficient information to judge the viability of the Company. Based on the assessment described above and on pages 28 − 32 the Directors have a reasonable expectation that the Company will be able to continue operating and meet its liabilities over the period to May 2027. 10_Viability_statement_p33_35_v40.indd 33 27/05/2022 16:48
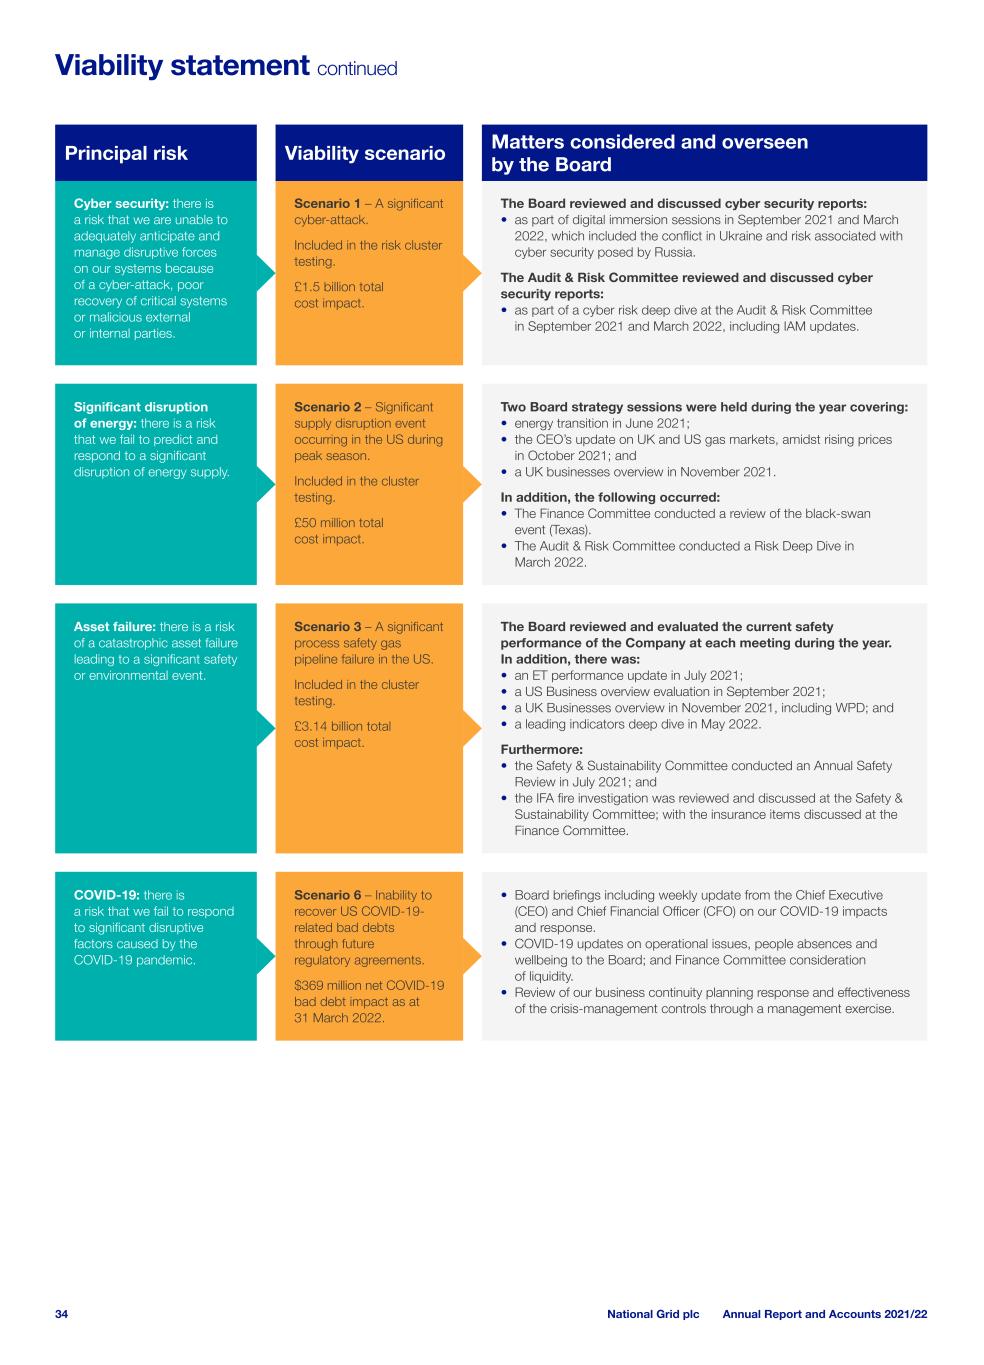
34 National Grid plc Annual Report and Accounts 2021/22 Viability statement continued Principal risk Viability scenario Matters considered and overseen by the Board Cyber security: there is a risk that we are unable to adequately anticipate and manage disruptive forces on our systems because of a cyber-attack, poor recovery of critical systems or malicious external or internal parties. Scenario 1 – A significant cyber-attack. Included in the risk cluster testing. £1.5 billion total cost impact. The Board reviewed and discussed cyber security reports: • as part of digital immersion sessions in September 2021 and March 2022, which included the conflict in Ukraine and risk associated with cyber security posed by Russia. The Audit & Risk Committee reviewed and discussed cyber security reports: • as part of a cyber risk deep dive at the Audit & Risk Committee in September 2021 and March 2022, including IAM updates. Significant disruption of energy: there is a risk that we fail to predict and respond to a significant disruption of energy supply. Scenario 2 – Significant supply disruption event occurring in the US during peak season. Included in the cluster testing. £50 million total cost impact. Two Board strategy sessions were held during the year covering: • energy transition in June 2021; • the CEO’s update on UK and US gas markets, amidst rising prices in October 2021; and • a UK businesses overview in November 2021. In addition, the following occurred: • The Finance Committee conducted a review of the black-swan event (Texas). • The Audit & Risk Committee conducted a Risk Deep Dive in March 2022. Asset failure: there is a risk of a catastrophic asset failure leading to a significant safety or environmental event. Scenario 3 – A significant process safety gas pipeline failure in the US. Included in the cluster testing. £3.14 billion total cost impact. The Board reviewed and evaluated the current safety performance of the Company at each meeting during the year. In addition, there was: • an ET performance update in July 2021; • a US Business overview evaluation in September 2021; • a UK Businesses overview in November 2021, including WPD; and • a leading indicators deep dive in May 2022. Furthermore: • the Safety & Sustainability Committee conducted an Annual Safety Review in July 2021; and • the IFA fire investigation was reviewed and discussed at the Safety & Sustainability Committee; with the insurance items discussed at the Finance Committee. COVID-19: there is a risk that we fail to respond to significant disruptive factors caused by the COVID-19 pandemic. Scenario 6 – Inability to recover US COVID-19- related bad debts through future regulatory agreements. $369 million net COVID-19 bad debt impact as at 31 March 2022. • Board briefings including weekly update from the Chief Executive (CEO) and Chief Financial Officer (CFO) on our COVID-19 impacts and response. • COVID-19 updates on operational issues, people absences and wellbeing to the Board; and Finance Committee consideration of liquidity. • Review of our business continuity planning response and effectiveness of the crisis-management controls through a management exercise. 10_Viability_statement_p33_35_v40.indd 34 27/05/2022 16:48

35 S trateg ic R ep o rt National Grid plc Annual Report and Accounts 2021/22 Principal risk Viability scenario Matters considered and overseen by the Board Satisfactory regulatory outcomes: there is a risk that we fail to influence future energy policies and secure satisfactory regulatory agreements. Scenario 4 – Poor outcome of future US rate case filings, and low performance under RIIO-T2 and RIIO-ED2. £500 million cost impact from lower average allowed RoE in US rate cases. £780 million cost impact from nil outperformance under RIIO-T2 and RIIO-ED2. The Board received updates and performed reviews in relation to: • the CMA appeal; • WPD Regulatory strategy; • NY Monitor; • RIIO-T2 overview; • US business overview evaluation; • UK and US gas market amidst rising prices; • the UK regulatory landscape and regulatory framework; and • ESO future outlook. Climate change: there is a risk that we fail to identify and/or deliver upon actions necessary to address the transitional impacts (from a changing energy system) of climate change on our business and demonstrate our leadership of climate change in the energy sector. Scenario 7 – Not meeting our net zero targets. No immediate financial impacts; various reputational impacts were considered. The Board and its Committees discussed sustainability metrics and strategy to reflect and track our impact and progress, including: • a bi-annual review of GPR climate change and climate risk, plus the energy policy environment in the UK; • ESG discussions around energy transition and climate change, including investor expectations; • a discussion on the climate resolution at the 2021 AGM; • disclosures in line with the TCFD recommendations; • the review and approval of the publication of the Responsible Business Charter; • a review of GHG emissions performance by the Safety & Sustainability Committee; and • active participation as a Principal Partner in COP26. Political and societal expectations and perceptions: there is a risk that we do not position ourselves appropriately to political and societal expectations. Scenario 5 – A breach of compliance rules for onshore competition in electricity transmission by UK ET. NY legislation and political relationships leading to loss of NY licences. £400 million UK fines and penalties. Reasonable (rate base) consideration for US assets. The Board received updates and reviews in relation to: • Western Link outcomes; • the NY Monitor update and review meeting with NY Monitor; • the US business overview evaluation; • Audit & Risk Committee-led meetings which were specific to the Federal Investigation (Fraud and Bribery) during July to October 2021; • COP26, leading up to the event in Glasgow; • the Bid Defence Plan; • the UK political landscape; • UK and US gas markets amidst rising prices; • a deep dive on the energy policy environment in the UK; and • the short-, medium- and long-term impacts of the war in Ukraine. Capability and leadership: there is a risk that we do not have capability and leadership capacity. N/A Capability and leadership is an integral part of the Board’s vision and strategy. The Board’s approach included: • the approval of Board Committee changes which were made effective from 1 September 2021; • regular leadership updates throughout the year, including a deep dive on leadership in September 2021; • bi-annual updates on people matters; • the People & Governance (P&G) Committee’s consideration of the structure, size and composition of the Board and Committees (the P&G Committee also led on Board succession planning – identifying and proposing individuals to be Directors of the Company and establishing the criteria for new positions); and • a review of the Diversity Policy. 10_Viability_statement_p33_35_v40.indd 35 27/05/2022 16:48

Revenue and profits InvestmentCash flows 1 32 The vast majority of our revenues are set in accordance with our regulatory agreements (see pages 245 – 252), and are calculated based on a number of factors including investment in network assets, performance on incentives, allowed returns on equity and cost of debt, and customer satisfaction. We invest efficiently in our networks to achieve strong and sustainable growth in our regulated asset base over the long term. We also invest in assets in our non-regulated businesses. We continually assess, monitor and challenge investment decisions so we can continue to run safe, reliable and cost-effective networks. Our ability to convert revenue to profit and cash is important. By managing our operations efficiently, safely and for the long term, we generate substantial operating cash flows. Coupled with long-term debt financing, as well as additional capital generated through the take-up of the shareholder scrip dividend option during periods of higher investment, we are able to invest in growing our asset base and fund our dividends. Capital allocation Our capital allocation is determined by the need to make the investments and outputs required under our regulatory frameworks in the UK and US (which accounted for over 90% of our capital expenditure in 2021/22), balanced with the desire to invest in our other businesses, such as NGV and NGP, which may achieve higher growth. The investments we make seek a balance between growth through investments, such as the WPD acquisition, investments in our higher-growth NGV businesses and through NGP, and the continued growth of our steady cash flow core regulated operations, while ensuring we continue to deliver a consistent and reliable dividend to our shareholders. Revenue (%) 10.2% 17.3% 7.4% 6.9% 23.0% 28.1% 7.1% Statutory operating profit (%) 21.1% 0.1% 18.2% 12.7% 15.3% 21.9% 10.7% Capital investment (%) 17.1% 1.5% 12.8% 3.7% 22.3% 28.0% 14.5% Financial review UK Electricity Transmission UK Electricity System Operator UK Electricity Distribution UK Gas Transmission New England New York National Grid Ventures and Other activities 36 National Grid plc Annual Report and Accounts 2021/22 11_Financial_Review_p36_49_v33.indd 36 27/05/2022 16:49

Summary of Group financial performance Performance management framework In managing the business, we focus on various non-IFRS measures which provide meaningful comparisons of performance between years, monitor the strength of the Group’s balance sheet as well as profitability and reflect the Group’s regulatory economic arrangements. Such alternative and regulatory performance measures are supplementary to, and should not be regarded as a substitute for, IFRS measures, which we refer to as statutory results. We explain the basis of these measures and, where practicable, reconcile these to statutory results in ‘Other unaudited financial information’ on pages 268 – 279. Our regulatory performance measures have only been calculated for the total Group (or individual entities where relevant), as these are not based on IFRS measures. Specifically, we measure the financial performance of the Group from different perspectives: • Capital investment and asset growth: Currently we expect to invest c. £7 billion per year. • Accounting profit: In addition to statutory IFRS measures we distinguish between adjusted results, which exclude exceptional items and remeasurements, and underlying results, which further take account of: (i) volumetric and other revenue timing differences arising from our regulatory contracts; and (ii) major storm costs, which are recoverable in future periods, neither of which give rise to economic gains or losses. In doing so, we intend to make the impact of such items clear to users of the financial information in this Annual Report. • Economic profit: Measures such as Return on Equity (RoE) and Value Added take account of the regulated value of our assets and of our regulatory economic arrangements to illustrate the returns generated on shareholder equity. • Balance sheet strength: Maintaining a strong investment grade credit rating allows us to finance our growth ambitions at a competitive rate. Hence, we monitor credit metrics used by the major rating agencies to ensure we are generating sufficient cash flow to service our debts. This balanced range of measures of financial well-being informs our dividend policy, which from 2021/22 is to grow the dividend per share at least in line with rate of CPIH each year. Summary of Group financial performance for the year ended 31 March 2022 Financial summary for continuing operations Last year we announced that we would make a strategic pivot towards higher growth electricity. On 14 June 2021, we acquired Western Power Distribution plc (WPD) an electricity distribution business based in the South West of the UK. Our planned disposals of the Narragansett Electric Company (NECO) business in Rhode Island and UK Gas Transmission (and metering) are expected to complete during 2022/23. The combination of these transactions has resulted in a change to the Group’s structure and a new organisational structure has been implemented. As a result, the operating segments reported to our Board have changed from those reported in 2020/21. Our segmental reporting for continuing operations is aligned with our five regulated business units, along with National Grid Ventures (NGV) and Other non-regulated businesses. The UK Electricity System Operator is now separately reported from UK Electricity Transmission. The acquisition of WPD introduces a UK Electricity Distribution segment. Our US Regulated segment has been divided between the jurisdictions of New England and New York, to align more closely with our regulatory framework. Lastly, as part of the new organisational structure, our generation business on Long Island in New York is now reported as part of NGV. The expected disposal in the third quarter of 2022/23 of a majority stake in our UK Gas Transmission businesses (including metering, which was previously reported within NGV) means that this business is now classified as a discontinued operation. The expected disposal of NECO does not meet the definition of a discontinued operation under IFRS, so is reported within New England as part of continuing operations. Both UK Gas Transmission and NECO are classified as held for sale in the balance sheet as at 31 March 2022. NECO was also reported as held for sale in the comparative balance sheet at 31 March 2021. Unless otherwise stated, the following commentary and analyses are for the continuing operations of the Group (as defined by IFRS 5 ‘Non-current Assets Held for Sale and Discontinued Operations’). Within the Financial review, ‘Total Group’ refers to results and balances including discontinued or held for sale businesses (as defined by IFRS 5). Where applicable, comparative amounts have been restated accordingly. Financial summary for continuing operations £m 2021/22 2020/21 Change Statutory results: Operating profit 4,371 2,401 82% Profit after tax 2,183 1,304 67% Earnings per share (pence) 60.6p 37.0p 64% Dividend per share (pence), including proposed final dividend 50.97p 49.16p 4% Capital expenditure 6,185 4,727 31% Alternative performance measures: Underlying operating profit 3,992 2,688 49% Underlying profit after tax 2,351 1,493 57% Adjusted earnings per share (pence) 61.4p 36.7p 67% Underlying earnings per share (pence) 65.3p 42.4p 54% Underlying dividend cover 1.3 0.9 49% Capital investment 6,739 4,843 39% Financial summary total – including discontinued operations £m 2021/22 2020/21 Change Statutory results: Operating profit 5,008 2,895 73% Profit after tax 2,354 1,641 43% Earnings per share (pence) 65.4p 46.6p 40% Capital expenditure 6,446 4,931 31% Alternative performance measures: Adjusted operating profit, pre timing and major storm costs1 4,726 3,283 44% Adjusted profit after tax, pre timing and major storm costs1 2,760 1,911 44% Adjusted earnings per share (pence) 71.0p 46.4p 53% Adjusted earnings per share, pre timing and major storm costs (pence) 76.7p 54.2p 42% Capital investment 7,000 5,047 39% Retained cash flow/adjusted net debt 8.9% 6.6% 230bps Regulatory performance measures: Asset growth 8.7% 5.6% 310bps Group Return on Equity2 11.4% 10.6% 80bps Value Added 3,833 1,808 112% Regulatory gearing 81% 65% 1600bps 1. Comparable to ‘underlying’ results, but including discontinued operations. 2. Group RoE methodology amended in 2021/22 to calculate accretion charge on inflation-linked debt at long-run inflation rates. This provides alignment to treatment of RAV indexation in the metric. Prior year comparatives have not been restated. Statutory results from continuing operations of £2,183 million were up £879 million from the prior year. Statutory EPS for continuing operations of 60.6p was 23.6p higher than the prior year. The Group’s statutory results for the year were impacted by net exceptional charges of £320 million (2021: £52 million net charge) and remeasurement gains of £292 million (2021: £62 million gains). Our ‘adjusted’ results exclude exceptional items, but are impacted by revenue timing and major (deferrable) storm costs, as explained on page 39. Our ‘underlying’ results are presented excluding the total impact of exceptional items, remeasurements, timing and major storm costs. A reconciliation between these alternative performance measures and our statutory performance is detailed on page 38 and in the section ‘Other unaudited financial information’ on pages 268 – 279. National Grid plc Annual Report and Accounts 2021/22 37

Underlying operating profit for continuing operations was up 49%, driven by the acquisition of WPD, improved performance in NGV, NG Partners and UK Electricity Transmission, along with higher property sales, no depreciation on NECO in New England (held for sale treatment) and a lower adverse impact from COVID-19 compared with 2020/21. Our joint ventures and associates contribution increased (mainly UK interconnector revenues). These factors were partly offset by higher net financing costs from both inflation on RPI-linked debt and interest on a higher level of borrowings related to the acquisition of WPD. Other interest was favourable year-on-year. The tax charge was higher driven by increased taxable profits and additional deferred tax charges in the UK and the US. Underlying profit after tax increased by 57% and resulted in a 54% increase in underlying EPS to 65.3p. Profit after tax for discontinued operations of £171 million was down £166 million compared with the prior year principally due to exceptional charges related to deferred tax from the change in the UK corporation tax rate, higher interest costs driven by inflation, partly offset by cessation of depreciation following held for sale treatment and higher revenues under RIIO-2. Capital investment of £7.0 billion (including discontinued operations of £0.3 billion) along with RAV indexation helped increase our asset growth to 8.7%. We delivered Value Added (our measure of economic profit) of £3.8 billion (including UK Gas Transmission) in 2021/22, significantly higher than in 2020/21 mainly as a result of higher RAV indexation. Group RoE of 11.4% was up from 10.6% for 2020/21. RCF/net debt at 8.9% was higher than 6.6% in 2020/21. The recommended full-year dividend per share of 50.97p is in line with the new policy announced in March 2021 of increasing in line with UK CPIH inflation and is covered 1.3 times by underlying EPS. Profitability and earnings The table below reconciles our statutory profit measures for continuing operations, at actual exchange rates, to adjusted and underlying versions. Reconciliation of profit and earnings from continuing operations Operating profit Profit after tax Earnings per share £m 2021/22 2020/21 Change 2021/22 2020/21 Change 2021/22 2020/21 Change Statutory results 4,371 2,401 82% 2,183 1,304 67% 60.6p 37.0p 64% Exceptional items (166) 60 320 52 8.9p 1.5p Remeasurements (392) (34) (292) (62) (8.1) p (1.8p) Adjusted results 3,813 2,427 57% 2,211 1,294 71% 61.4p 36.7p 67% Timing 16 111 19 88 0.5p 2.5p Major storm costs 163 150 121 111 3.4p 3.2p Underlying results 3,992 2,688 49% 2,351 1,493 57% 65.3p 42.4p 54% Reconciliation of profit and earnings from discontinued operations Statutory operating profit for discontinued operations of £637 million (2021: £494 million) includes £17 million of exceptional items (2021: £5 million) and timing under-recovery of £80 million (2021: £96 million). Depreciation of the assets in UK Gas Transmission was ceased following reclassification to held for sale (in accordance with IFRS 5) on 1 September 2021. Tax on exceptional items for discontinued operations comprises a £1 million credit in respect of other exceptional items (2021: £nil) and a deferred tax exceptional charge related to the change in the UK corporation tax rate of £145 million (2021: £nil). In our adjusted results for discontinued operations, tax on timing was £15 million (2021: £18 million). Statutory earnings per share from discontinued operations was 4.8p (2021: 9.6p) and underlying earnings per share from discontinued operations was 11.4p (2021: 11.8p). Exceptional income/(expense) from continuing operations Impact on operating profit Impact on profit after tax Impact on EPS £m 2021/22 2020/21 2021/22 2020/21 2021/22 2020/21 Environmental insurance recovery and change in environmental provisions 38 14 28 11 0.8p 0.3p Transaction and separation costs (223) (24) (204) (24) (5.7) p (0.7) p New operating model implementation costs (66) (50) (52) (39) (1.4p) (1.1) p Net gain on disposal of St William joint venture and release of deferred income 417 — 366 — 10.1p —p Deferred tax arising on the change in UK corporation tax rate — — (458) — (12.7p) —p Total 166 (60) (320) (52) (8.9) p (1.5) p This year we have classified the following items as exceptional: • Environmental insurance recovery: a £38 million gain related to an insurance receivable for site remediation costs related to our US Superfund sites environmental provision, recorded as exceptional in line with the treatment of the related costs; • Transaction and separation costs: £223 million of transaction costs associated with the acquisition of Western Power Distribution (WPD), the sale of NECO and the sale of UK Gas Transmission (2021: £24 million); • New operating model implementation costs and efficiency programme: £66 million of costs in relation to the design and implementation of our new operating model that is designed to transform our operating framework (2021: £50 million); • Gain on disposal of St William property joint venture and release of deferred income: £228 million gain on the divestment of a 50% interest in an equity investment in March 2022 along with release of £189 million of deferred income arising on historical sales made to that joint venture; and • Change in UK corporation tax rate: a £458 million deferred tax charge for the increase in UK corporation tax rate from 19% to 25% which takes effect from 1 April 2023. In the prior year we also classified as exceptional the £14 million credit for partial release of US environmental provisions previously treated as exceptional. We also exclude certain unrealised gains and losses on mark-to-market financial instruments from adjusted profit; see notes 5 and 6 to the financial statements for further information. Net remeasurement gains of £392 million on commodity contract derivatives (i.e. ‘mark-to-market’ movements on derivatives used to hedge the cost of buying wholesale gas and electricity on behalf of our US customers) occured during the year, in addition to net remeasurement gains of £59 million on financing-related instruments (used to hedge interest and currency risk on net borrowings); along with a further £56 million of remeasurement losses related to our share of post-tax results of joint ventures. The expected future exceptional costs related to the new operating model and cost efficiency programme are expected to be in the region of £100 million. Financial review continued 38 National Grid plc Annual Report and Accounts 2021/22

Exceptional items for discontinued operations Discontinued operations includes an exceptional item of £17 million (2021: £5 million) related to cost efficiency programme and separation costs ahead of the sale of the UK Gas Transmission and Metering business. Timing over/(under)-recoveries In calculating underlying profit, we exclude regulatory revenue timing over- and under-recoveries and major storm costs (as defined below). Under the Group’s regulatory frameworks, most of the revenues we are allowed to collect each year are governed by regulatory price controls in the UK and rate plans in the US. If more than this allowed level of revenue is collected, an adjustment will be made to future prices to reflect this over-recovery; likewise, if less than this level of revenue is collected, an adjustment will be made to future prices in respect of the under-recovery. We also collect revenues from customers and pass these on to third parties (e.g. NYSERDA). These variances between allowed and collected revenues and timing of revenue collections for pass-through costs give rise to over- and under-recoveries. The following table summarises management’s estimates of such amounts for the two years ended 31 March 2022 for continuing and discontinued operations. All amounts are shown on a pre-tax basis and, where appropriate, opening balances are restated for exchange adjustments and to correspond with subsequent regulatory filings and calculations. All amounts are translated at the current year average exchange rate of $1.35:£1. £m 2021/22 2020/211 Balance at start of year (restated) 43 259 In-year (under)/over-recovery – continuing operations (16) (111) In-year (under)/over-recovery – discontinued operations (80) (96) Balance at end of year (53) 52 1. March 2021 balances restated for segmental changes and to correspond with 2020/21 regulatory filings and calculations. In 2021/22, we experienced timing under-recoveries of £85 million in UK Electricity Transmission, over-recoveries of £22 million in UK Electricity Distribution, under-recoveries of £47 million in UK Electricity System Operator, under-recoveries of £32 million in New England and over- recoveries of £126 million in New York. In calculating the post-tax effect of these timing recoveries, we impute a tax rate, based on the regional marginal tax rates, consistent with the relative mix of UK and US balances. Major storm costs We also take account of the impact of major storm costs in the US where the aggregate amount is sufficiently material in any given year. Such costs (net of certain deductibles and allowances) are recoverable under our rate plans but are expensed as incurred under IFRS. Accordingly, where the net total incurred cost exceeds $100 million in any given year, we exclude the net costs from underlying earnings. In 2021/22, we incurred deferrable storm costs, which are eligible for future recovery of $220 million (2021: $201 million). Segmental operating profit The tables below set out operating profit on adjusted and underlying bases. Adjusted operating profit £m 2021/22 2020/21 Change UK Electricity Transmission 1,067 1,094 (2) % UK Electricity Distribution 909 — n/a UK Electricity System Operator 7 (60) (112) % New England 743 611 22% New York 780 665 17% NGV and Other activities 307 117 162% Continuing operations 3,813 2,427 57% Discontinued 654 499 31% Total 4,467 2,926 53% Underlying operating profit £m 2021/22 2020/21 Change UK Electricity Transmission 1,152 1,052 10% UK Electricity Distribution 887 — n/a UK Electricity System Operator 54 70 (23) % New England 886 727 22% New York 706 722 (2) % NGV and Other activities 307 117 162% Continuing operations 3,992 2,688 49% Statutory operating profit increased in the year, primarily as a result of the 9.5 months’ contribution from WPD, the exceptional gain on disposal of our St William joint venture, higher UK Electricity Transmission revenues, increased interconnector revenues and fair value gains in NG Partners, no depreciation of our Rhode Island business and a lower adverse impact from COVID-19 compared with 2020/21. These benefits were partly offset by higher exceptional charges than in 2020/21 along with adverse year-on- year movements on timing recoveries. The reasons for the movements in underlying operating profit are described in the segmental commentaries below. Unless otherwise stated, the discussion of performance in the remainder of this Financial review focuses on underlying results. UK Electricity Transmission £m 2021/22 2020/21 Change Revenue 2,035 1,974 3% Operating costs (980) (894) 10% Statutory operating profit 1,055 1,080 (2) % Exceptional items 12 14 (14) % Adjusted operating profit 1,067 1,094 (2) % Timing 85 (42) (302) % Underlying operating profit 1,152 1,052 10% Analysed as follows: Net revenue 1,883 1,823 3% Regulated controllable costs (227) (192) 18% Post-retirement benefits (26) (32) (19) % Other operating costs (55) (44) 25% Depreciation and amortisation (508) (461) 10% Adjusted operating profit 1,067 1,094 (2) % Timing 85 (42) (302) % Underlying operating profit 1,152 1,052 10% UK Electricity Transmission statutory operating profit was £25 million lower in the year, mainly due to adverse year-on-year timing movements. In 2021/22, there were £12 million of exceptional costs related to establishing our new operating model (2021: £14 million). Timing under-recoveries of £85 million in 2021/22 compared with over-recoveries of £42 million in 2020/21 are primarily due to the under-recovery of pass-through costs, inflation true-ups and last year’s collection of prior period under-recoveries, partly offset by an over-collection of Transmission Network Use of System (TNUoS) revenues in the current year. Adjusted operating profit reduced by £27 million (2%), but this included £127 million adverse year-on-year timing movements. Underlying operating profit increased by 10%. Net revenues (adjusted for timing) were higher under the first year of RIIO-T2, with indexation and lower totex capitalisation rates (increased ‘fast money’) offsetting the lower returns in the current year. In the prior year, revenue was impacted by an adverse MOD adjustment in the final year of the RIIO-T1 price control. Regulated controllable costs were higher from additional workload agreed for RIIO-T2, inflationary increases and the non-recurrence of favourable credits in 2020/21, which more than offset 2021/22 efficiency savings and the absence of prior period COVID-19-related costs. Other costs were higher, mainly relating to a £10 million settlement related to Western Link. The increase in depreciation and amortisation reflects continued investment. In 2021/22, a benefit arising from the review of assets’ useful economic lives was broadly offset by asset write-offs. National Grid plc Annual Report and Accounts 2021/22 39

UK Electricity Distribution £m 2021/22 2020/21 Change Revenue 1,482 — n/a Operating costs (573) — n/a Statutory operating profit 909 — n/a Exceptional items — — n/a Adjusted operating profit 909 — n/a Timing (22) — n/a Underlying operating profit 887 — n/a Analysed as follows: Net revenue 1,357 — n/a Regulated controllable costs (180) — n/a Post-retirement benefits (24) — n/a Other operating costs (86) — n/a Depreciation and amortisation (158) — n/a Adjusted operating profit 909 — n/a Timing (22) — n/a Underlying operating profit 887 — n/a ‘UK Electricity Distribution’ refers to WPD, which was acquired on 14 June 2021. The results presented are for the 9.5-month period of ownership and no amounts for WPD are included in the consolidated results of the Group for year ended 31 March 2021. Statutory operating profit of £909 million for the 9.5 months included £22 million of timing over-recoveries of ‘Distribution Use of System’ (DUoS) volumes and the adverse impact on our revenues from UK corporation tax capital allowance ‘super deductions’, partly offset by an under-collection of earned incentives and inflation true-ups. Excluding timing, underlying profit was £887 million for the 9.5 months of ownership since June 2021. Controllable costs and post-retirement benefit costs of £204 million were lower than the estimated equivalent period in the prior year, mainly as a result of the disruption arising from COVID-19 during 2020/21. These costs include engineering management costs, supporting our customers and the maintenance of our four electricity distribution networks, including activities such as vegetation management in order to prevent line damage. Depreciation and amortisation charges include amortisation of fair value adjustments applied to property, plant and equipment (PP&E) at the date of acquisition. UK Electricity System Operator £m 2021/22 2020/21 Change Revenue 3,455 2,018 71% Operating costs (3,450) (2,071) 67% Statutory operating profit/(loss) 5 (53) (109) % Exceptional items 2 (7) (129) % Adjusted operating profit/(loss) 7 (60) (112) % Timing 47 130 (64) % Underlying operating profit 54 70 (23) % Analysed as follows: Net revenue 240 107 124% Controllable costs (129) (99) 30% Post-retirement benefits (16) (13) 23% Other operating costs (5) (9) (44) % Depreciation and amortisation (83) (46) 80% Adjusted operating profit/(loss) 7 (60) (112) % Timing 47 130 (64) % Underlying operating profit 54 70 (23) % UK Electricity System Operator statutory operating profit increased £58 million in the year. In 2021/22 there were £2 million of exceptional costs related to establishing our new operating model, compared to a £7 million credit related to release of previous reorganisation provisions in the prior year. Timing under-recoveries of £47 million in 2021/22 compared with under-recoveries of £130 million in the prior year. Timing in 2021/22 predominately included £44 million for the Balancing Services Use of System (BSUoS) price cap deferral support scheme compared with £109 million in 2020/21 for TNUoS demand under-recovery during COVID-19 and £22 million for the BSUoS Covid Support Scheme. Adjusted operating profit increased by £67 million almost entirely driven by the £83 million year-on-year timing movement, partly offset by asset impairments. Excluding the impact of timing, underlying operating profit decreased by 23%. Net revenue (adjusted for timing) was £50 million higher, reflecting higher revenues under RIIO-2 related to additional workload agreed under the new price control and higher earned incentives. Regulated controllable costs including pensions were £33 million higher in total, in line with the expected higher volume of work required to deliver the ambitious RIIO-2 business plan. Depreciation and amortisation was £37 million higher as a result of our investment in transformational IT systems, in addition to asset impairments for work that may no longer be required. New England £m 2021/22 2020/21 Change Revenue 4,550 4,214 8% Operating costs (3,786) (3,600) 5% Statutory operating profit 764 614 24% Exceptional items 80 8 900% Remeasurements (101) (11) 818% Adjusted operating profit 743 611 22% Timing 32 11 191% Major storm costs 111 105 6% Underlying operating profit 886 727 22% Analysed as follows: Net revenue 2,500 2,430 3% Regulated controllable costs (813) (810) — Post-retirement benefits (40) (43) (7) % Bad debt expense (45) (127) (65) % Other operating costs (494) (450) 10% Depreciation and amortisation (365) (389) (6) % Adjusted operating profit 743 611 22% Timing 32 11 191% Major storm costs 111 105 6% Underlying operating profit 886 727 22% New England statutory operating profit increased by £150 million, as a result of the £90 million year-on-year favourable movements in commodity contract remeasurements (which are passed on to customers), mostly offset by exceptional charges booked in the current year for the disposal of our Rhode Island business and the cost efficiency programme. In 2020/21, exceptional charges were lower, comprising £8 million of costs related to establishing our new operating model and transaction costs. Timing under-recoveries of £32 million in 2021/22 compared with timing under- recoveries of £11 million in 2020/21, related to revenue decoupling and recovery of cost on our energy efficiency programme. Storm costs (deferrable and non-deferrable) were broadly flat year-on-year, with a lower number of storm events occurring during 2021/22, but a higher ‘per storm’ cost. These factors, along with an adverse impact from COVID-19 in the prior year and exchange movements, resulted in an overall increase in statutory operating profit and adjusted operating profit. Financial review continued 40 National Grid plc Annual Report and Accounts 2021/22

Adjusted operating profit increased by £132 million (22%), including £21 million year-on-year adverse timing under-recoveries. Major storm costs of £111 million exceed our threshold to be excluded from underlying, but were a repeat of the high level of deferrable storm costs we incurred in 2020/21. Underlying operating profit increased by 22%. Net revenues (adjusted for timing) increased by £91 million from the benefits of rate case increments in Massachusetts Gas and Massachusetts Electric, capital trackers and higher revenues from new customer connections along with income from sale of property. New England controllable costs were held broadly flat year-on-year, with increases from higher workload, IT costs and inflationary impacts, being mostly offset by efficiency savings, favourable settlements and non-recurrence of costs incurred in the prior period including COVID-19 disruption costs. Provisions for bad and doubtful debts of £45 million were £82 million lower than 2020/21, which had additional provision for receivables related to the impact of COVID-19. Depreciation and amortisation increased due to the growth in assets, but was more than offset by a benefit from cessation of depreciation in NECO as a result of it being reclassified to held for sale. Other costs were higher due to increased property taxes and increases in environmental reserves. New York £m 2021/22 2020/21 Change Revenue 5,561 4,605 21% Operating costs (4,466) (3,910) 14% Statutory operating profit 1,095 695 58% Exceptional items (24) (7) n/a Remeasurements (291) (23) n/a Adjusted operating profit 780 665 17% Timing (126) 12 n/a Major storm costs 52 45 16% Underlying operating profit 706 722 (2) % Analysed as follows: Net revenue 3,400 3,136 8% Regulated controllable costs (963) (981) (2) % Post-retirement benefits (44) (47) (6) % Bad debt expense (87) (198) (56) % Other operating costs (989) (792) 25% Depreciation and amortisation (537) (453) 19% Adjusted operating profit 780 665 17% Timing (126) 12 n/a Major storm costs 52 45 16% Underlying operating profit 706 722 (2) % New York statutory operating profit increased by £400 million, principally as a result of the £268 million year-on-year favourable movements in commodity contract remeasurements (which are passed on to customers) and net exceptional gains including £38 million environmental insurance recovery for costs related to our obligations to clean up Superfund sites, compared to a £14 million environmental credit (reversal of cost previously booked as exceptional) in the prior year. Timing over-recoveries of £126 million in 2021/22 compared with timing under-recoveries of £12 million in 2020/21, driven by commodity price fluctuations and high auction sale prices on transmission wheeling. Major (i.e. deferrable) storm costs of £52 million were £7 million higher year-on-year, but as in 2020/21, the total costs passed our threshold ($100 million in aggregate with New England) and so are excluded from our underlying results. These factors, along with a prior year adverse impact from COVID-19 disruption resulted in an overall increase in statutory operating profit and in adjusted operating profit. Adjusted operating profit increased by £115 million (17%), aided by £138 million year-on-year favourable timing swings and lower year-on-year impact of COVID-19, but partly offset by higher environmental charges in 2021/22. After further adjusting to exclude the impact of timing and major storm costs, underlying operating profit decreased by 2%. Net revenues (adjusted for timing) increased by £126 million from the benefits of rate case increases in KEDNY, KEDLI and Niagara Mohawk (partly offset by use of deferral credits to reduce the impact on customer bill increases and a ‘make whole’ adjustment for the rate case settlement in downstate New York). Regulated controllable costs were lower year-on-year, with increased workload and IT costs and also inflationary impacts, more than offset by cost efficiency savings, favourable credits in 2021/22 and the non-recurrence of costs arising in 2020/21. Provisions for bad and doubtful debts decreased by £111 million, driven by 2020/21’s additional provision for receivables related to the impact of COVID-19. Depreciation and amortisation increased due to the growth in assets and the accelerated depreciation of certain gas assets and IT systems. Other costs were higher due to an increase in environmental provisions (mostly driven by inflation), increased property taxes, cost of removal and customer funded work, partly offset by receipt of a historical property tax refund. NGV and Other activities £m 2021/22 2020/21 Change Statutory operating profit 543 65 735% Exceptional items (236) 52 (554) % Adjusted operating profit 307 117 162% Timing — — n/a Underlying operating profit 307 117 162% Analysed as follows: NGV 286 185 55% Property 40 22 82% Corporate and Other activities (19) (90) (79) % Underlying operating profit 307 117 162% NGV’s statutory operating profits were £100 million higher than 2020/21, driven by higher interconnector revenues, which benefited from a full year’s contribution from our second French interconnector (IFA2) and the commissioning of North Sea Link earlier than expected, along with the impact of higher commodity prices and increased revenues in our onshore renewables in the US. These were partly offset by a write-down for assets damaged by a fire at Sellindge in September 2021, which caused an unplanned outage for our legacy French interconnector (IFA1) and a £3 million exceptional charge in relation to establishing our new operating model (2021: £2 million). In Other activities, we incurred an exceptional gain of £417 million related to the disposal of our 50% interest in the St William property joint venture and release of associated deferred income on historical sales made to the joint venture. We also incurred an exceptional charge of £22 million related to establishing our new operating model (2021: £26 million), £95 million (2021: £24 million) of transaction costs for the acquisition of WPD, and £61 million of costs incurred for the separation of NECO and UK Gas Transmission. In 2021/22, underlying operating profit of £21 million (including corporate costs), compared with net costs of £68 million in 2020/21. This increase included benefits from higher fair value gains on our NG Partners investments and the release of an aged liability related to historical balances for unclaimed dividends in the Group. Excluding the gain on disposal of St William, the underlying performance of the property business was up £18 million, driven by increased sales compared with 2020/21. National Grid plc Annual Report and Accounts 2021/22 41

Financing costs and taxation – continuing Net finance costs Net finance costs (excluding remeasurements) for the year were 25% higher than last year at £1,081 million, with the £216 million increase driven by interest costs of £130 million (net of amortisation of debt fair value adjustments) for debt acquired with WPD, £99 million of interest and fees for £8 billion of additional borrowings used to finance the acquisition, a £145 million impact of higher inflation on our RPI-linked debt and an increase in borrowings as a result of organic asset growth. These higher costs were partly offset by favourable year-on-year non-debt interest income, with benefits from interest on pension and other post- employment benefit (OPEB) liabilities, increased capitalised interest and higher levels of other interest income from US financial investments compared with 2020/21. The effective interest rate for continuing operations of 3.2% is in line with the prior year rate. Joint ventures and associates The Group’s share of net profits from joint ventures and associates increased by £82 million compared with 2020/21, mainly as a result of higher interconnector revenues in both Nemo Link up £37 million and in BritNed up £28 million and higher sales in our St William property joint venture (prior to disposal of this investment in March 2022) and an improved contribution from our joint venture investment in NG Partners. Tax The underlying effective tax rate (excluding joint ventures and associates) of 24.3% was 260bps higher than last year (2020/21: 21.7%). The tax charge in 2021/22 included additional deferred tax charges in the UK for the change in the UK corporation tax rate and the unitary state deferred tax remeasurement which occurred as a result of the expected sale of our Rhode Island business in the US. The Group’s tax strategy is detailed later in this review. Discontinued operations On 27 March 2021, we announced the agreed sale of 100% of our UK Gas Transmission business (including metering) to a new entity (the ‘Acquiring Entity’) in exchange for £2.2 billion cash consideration, £2.0 billion of debt financing and a 40% interest in the Acquiring Entity on completion. The other 60% in the Acquiring Entity will be owned by a consortium of Macquarie Infrastructure and Real Assets and British Columbia Investment Management Corporation. The sale is expected to complete in the third quarter of this financial year subject to the receipt of all regulatory approvals. The results of our 100% share of this business (including metering) are presented as ‘discontinued operations’ in 2021/22, with comparatives restated accordingly. On 1 September 2021, this business met the IFRS 5 criteria to be classified as held for sale and depreciation was stopped from that date. As described in note 10 to the financial statements, separation and transaction costs relating to the disposal of this business are included within discontinued operations. UK Gas Transmission (including metering) £m 2021/22 2020/21 Change Revenue 1,374 1,122 22% Operating costs (737) (628) 17% Statutory operating profit 637 494 29% Exceptional items 17 5 240% Adjusted operating profit 654 499 31% Timing 80 96 (17) % Adjusted operating profit (excluding timing) 734 595 23% Analysed as follows: Net revenue 977 889 10% Regulated controllable costs (160) (157) 2% Post-retirement benefits (17) (18) (6) % Other operating costs (55) (28) 96% Depreciation and amortisation (91) (187) (51) % Adjusted operating profit 654 499 31% Timing 80 96 (17) % Adjusted operating profit (excluding timing) 734 595 23% UK Gas Transmission statutory operating profit increased £143 million in the year. In 2021/22, there were £14 million of costs incurred in separating the business from the Group and transaction-related costs in preparation of the sales process; and £3 million (2021: £5 million) of exceptional costs related to the reorganisation and cost efficiency programme. Timing under-recoveries of £80 million arose in 2021/22, mainly related to recovery of shrinkage costs from higher gas prices. This compared with under-recoveries of £96 million in the prior year from under-collections relating to the change to the gas capacity charging regime and lower demand, partly offset by a lower return of prior period over-recoveries. Adjusted operating profit increased by £155 million (31%), including £16 million less adverse timing year-on-year. Excluding the impact of timing, adjusted operating profit increased by 23%, mostly from the cessation of depreciation since 31 August 2021, when the business was classified as held for sale. In 2021/22, depreciation of £91 million was £96 million lower than the prior year. Net revenue was £88 million higher, reflecting new prices under RIIO-T2 and the impact of the change to CPIH and regulatory depreciation profile change under the new price control. Regulated controllable costs (including pensions) and other costs were £29 million higher as a result of increased customer-funded works, higher Network Innovation Competition costs, higher meter displacements and a beneficial provision release in the prior period. Within UK Gas Transmission, our non-regulated metering business’s operating profit of £150 million was in line with the prior year, with the benefit from lower depreciation being offset by the adverse impact of fewer meters as these are being phased out and replaced by smart meters. Financial review continued 42 National Grid plc Annual Report and Accounts 2021/22

Capital investment, asset growth and Value Added Value Added is a measure that reflects the value to shareholders of our dividend and the growth in National Grid’s regulated and non-regulated assets (as measured in our regulated asset base, for regulated entities), net of the growth in overall debt. It is a key metric used to measure our performance and underpins our approach to sustainable decision-making. Value Growth, which is derived from Value Added, forms part of our long-term management incentive arrangements. A key part of our investor proposition is growth in our regulated asset base. The regulated asset base is a regulatory construct, representing the invested capital on which we are authorised to earn a cash return. By investing efficiently in our networks, we add to our regulatory asset base over the long term and this in turn contributes to delivering shareholder value. Our regulated asset base comprises our regulatory asset value in the UK, plus our rate base in the US. We also invest in related activities that are not subject to network regulation and this further contributes to asset growth. Capital investment Capital investment comprises capital expenditure in critical energy infrastructure, equity investments, funding contributions and loans to joint ventures and associates and, in the case of National Grid Partners, investments in financial assets. At actual exchange rates At constant currency £m 2021/22 2020/21 Change 2021/22 2020/21 Change UK Electricity Transmission 1,195 984 21% 1,195 984 21% UK Electricity Distribution 899 — n/a 899 — n/a UK Electricity System Operator 108 88 23% 108 88 23% New England 1,561 1,437 9% 1,561 1,429 9% New York 1,960 1,738 13% 1,960 1,729 13% NGV and Other activities 1,016 596 70% 1,016 596 70% Continuing 6,739 4,843 39% 6,739 4,826 40% Discontinued 261 204 28% 261 204 28% Total Group 7,000 5,047 39% 7,000 5,030 39% Capital investment in UK Electricity Transmission increased by £211 million compared with 2020/21, primarily due to London Power Tunnels 2 and Hinkley-Seabank, partly offset by lower Smartwires spend. The acquisition of WPD during the year resulted in a £899 million increase in reported capital investment year-on-year. In New England, capital investment was up £132 million on a constant currency basis, reflecting higher spend on gas assets driven by decreased COVID-19 restrictions compared with 2020/21 and higher investment in electric assets related to asset condition. In New York, capital investment was £231 million higher (on a constant currency basis), as a result of accelerated leak-prone pipe replacement work in our gas businesses, investment in Northwest Nassau connection, higher investment in our electric assets to reinforce the network and increase capacity and reliability, investment in SmartPath Connect and Energy Highway, and decreased COVID-19 restrictions compared with 2020/21. Capital investment in NGV was significantly higher than in 2020/21, with continued investment in the Viking Link interconnector (Denmark), increased spend on our Grain LNG facility, partly offset by completion of the North Sea Link interconnector (Norway) this year, but a £373 million step up in US Ventures’ capital investment, including purchase of a 3.2 GW potential offshore wind seabed lease in New York. In addition, a total amount of £93 million was invested by National Grid Partners in 2021/22, compared to £38 million in the prior year. In UK Gas Transmission, capital investment increased by £57 million from non-load spend, with increased work at St Fergus, continued investment at Peterborough and Huntingdon compressor stations, increased investment at Hatton and higher cyber spend compared to 2020/21. Asset Growth and Value Added To help readers’ assessment of the financial position of the Group, the table below shows an aggregated position for the Group, as viewed from a regulatory perspective. The measures included in the table below are calculated in part from financial information used to derive measures sent to and used by our regulators in the UK and US, and accordingly inform certain of the Group’s regulatory performance measures, but are not derived from, and cannot be reconciled to, IFRS. These alternative performance measures include regulatory assets and liabilities and certain IFRS assets and liabilities of businesses that are classified as held for sale under IFRS 5. There are certain significant assets and liabilities included in our IFRS balance sheet, which are treated differently in the analysis below, and to which we draw readers’ attention. Our UK OpCo RAVs are different to the IFRS carrying value of PP&E and intangibles in these entities. This is a result of the annual indexation (inflationary uplift) adjustment applied to RAV compared with the IFRS value of these assets (which are held at amortised cost), or in the case of WPD, the result of acquisition fair value adjustments (where PP&E at acquisition has been valued above RAV). In addition, under IFRS we recognise liabilities in respect of US environmental remediation costs, and pension and OPEB costs. For regulatory purposes, these are not shown as obligations because we are entitled to full recovery of costs through our existing rate plans. The impact of US tax reform in 2017/18 which resulted in a reduction in IFRS deferred tax liabilities, and from a regulatory perspective remains as a future obligation, results in a regulatory liability within US rate base (£0.7 billion in New England and £0.9 billion in New York at 31 March 2022). In our Value Added calculation, we have recognised an asset to reflect expected future recovery of £202 million COVID-19-related provision for bad and doubtful debts that we have included in 2021/22 (2021: £179 million). Regulatory IOUs which reflect net over- or under-recoveries compared with our regulatory allowances are treated within this table as obligations but do not qualify for recognition as liabilities (or assets) under IFRS. The increase in regulatory assets and other balances (including goodwill) and the increase in net debt as a result of the WPD acquisition along with associated transaction costs have been excluded when calculating the in-year Value Added for 2021/22. However, these balances are included within amounts reported as at 31 March 2022. Adjusted net debt movements exclude movements on derivatives which are designated in cash flow hedging arrangements and for which there is no corresponding movement in total assets and other balances. Within our Value Added calculation, total assets and other balances, goodwill and adjusted net debt movement all exclude the impact of reclassifications to held for sale for NECO in 2020/21 and the UK Gas business in 2021/22. Separation and transaction costs related to the disposal of these entities are also excluded from in-year Value Added and have been deferred to match against the anticipated proceeds on disposal of these businesses in 2022/23. National Grid plc Annual Report and Accounts 2021/22 43

The table below includes related balances and net debt for UK Gas Transmission and Metering and NECO, despite being reclassified as held for sale under IFRS. 2021/22 2020/21 £m 31 March 2022 Acquisition of WPD1 31 March 20212 Value Added Change 31 March 2021 31 March 2020 Change UK RAV 31,593 8,476 20,876 2,241 11 % 20,872 20,431 2 % US rate base 22,178 — 20,687 1,491 7 % 20,041 18,598 8 % Total RAV and rate base 53,771 8,476 41,563 3,732 9 % 40,913 39,029 5 % NGV and Other 5,226 — 4,920 306 6 % 4,458 3,942 13 % Total assets 58,997 8,476 46,483 4,038 9 % 45,371 42,971 6 % UK other regulated balances3 84 230 (140) (6) (160) (368) US other regulated balances4 2,621 — 1,995 626 1,974 1,613 Other balances (878) (168) (336) (374) (336) (514) Total assets and other balances 60,824 8,538 48,002 4,284 46,849 43,702 3,147 Cash dividends 922 1,413 Adjusted net debt movement1 (1,373) (2,752) Value Added 3,833 1,808 1. The acquisition of WPD on 14 June 2021 resulted in an increase in assets which has been excluded from the total change in the year used to calculate Asset Growth and Value Added for 2021/22. The increase in goodwill and intangible licence recognised on the acquisition of WPD and the associated fair value of net debt acquired and cash proceeds (along with associated transaction costs) are excluded from the total adjusted net debt movement in the year used to calculate Asset Growth and Value Added. 2. March 2021 balances restated for segmental changes and to correspond with 2020/21 regulatory filings and calculations. 3. Includes totex-related regulatory IOUs of £271 million (2021: £293 million), under-recovered timing balances of £346 million (2021: £153 million over-recovered) and under-recovered legacy balances related to previous price controls of £9 million (2021: £nil). 4. Includes assets for construction work-in-progress of £2,139 million (2021: £1,671 million), other regulatory assets related to timing and other cost deferrals of £759 million (2021: £714 million) and net working capital liabilities of £277 million (2021: £390 million). Figures relating to prior periods have, where appropriate, been re-presented at constant currency, for opening balance adjustments following the completion of the UK regulatory reporting pack process in 2021 and finalisation of US balances. During 2021/22, our combined regulated asset base and NGV and Other businesses’ assets grew by £4.0 billion or 9% on a constant currency basis compared with an increase of 6% in the prior year. UK RAV growth was 10.7% including CPIH indexation of 6.2% and RPI indexation of 9.0% while US rate base grew strongly by 7.2%. Value Added, which reflects the key components of value delivery to shareholders (i.e. dividend and growth in the economic value of the Group’s assets, net of growth in net debt) was £3.8 billion in 2021/22. This was higher than last year’s £1.8 billion, with £1.0 billion of the year-on-year increase arising from higher RAV indexation in UK Transmission, £0.8 billion of RAV growth from WPD (for the 9.5 months owned in 2021/22), stronger NGV and Other performance, higher US returns and a smaller adverse impact from COVID-19 compared with 2020/21, offset by higher interest and increased tax paid. Of the £3.8 billion Value Added, £0.9 billion was paid to shareholders as cash dividends and £2.9 billion was retained in the business. Value Added per share was 106.5p compared with 51.3p in 2020/21. Financial review continued 44 National Grid plc Annual Report and Accounts 2021/22

Cash flow, net debt and funding Net debt is the aggregate of cash and cash equivalents, borrowings, current financial and other investments and derivatives (excluding commodity contract derivatives) as disclosed in note 29 to the financial statements. ‘Adjusted net debt’ used for the RCF/adjusted net debt calculation is principally adjusted for pension deficits and hybrid debt instruments. For a full reconciliation see page 274. The following table summarises the Group’s cash flow for the year, reconciling this to the change in net debt. Summary cash flow statement £m 2021/22 2020/21 Change Cash generated from continuing operations 5,788 3,967 46% Cash capital expenditure and acquisition of investments (5,781) (4,741) 22% Disposal of St William joint venture 413 — n/a Dividends from joint ventures and associates 166 80 108% Business net cash inflow/(outflow) from continuing operations 586 (694) (184) % Net interest paid (1,013) (737) 37% Net tax paid (298) (91) 227% Ordinary dividends (922) (1,413) (35%) Other cash movements 30 14 114% Net cash outflow from continuing operations (1,617) (2,921) (45) % Acquisition of WPD1 (7,837) — n/a Discontinued operations 657 408 n/a Proceeds from bridge loan taken out to acquire WPD 8,200 — n/a Other net cash flows from investing and financing transactions 628 2,608 n/a Increase/(decrease) in cash and cash equivalents 31 95 (67) % Reconciliation to movement in net debt Increase/(decrease) in cash and cash equivalents 31 95 (67) % Increase in borrowings for bridge loan (8,200) — n/a Less: other net cash flows from investing and financing transactions (628) (2,608) n/a Cash and borrowings reclassified as held for sale at end of year 4,063 1,119 n/a Fair value of net debt acquired with WPD (8,147) — n/a Other non-cash movements in net debt (1,382) 1,438 n/a Increase in net debt (14,263) 44 n/a Net debt at start of year (28,546) (28,590) —% Net debt at end of year (42,809) (28,546) 50.0% 1. Includes £44 million cash and cash equivalents acquired with WPD Cash flow generated from continuing operations was £5.8 billion, £1,821 million higher than last year, mainly due to the contribution from WPD, lower adverse year-on-year timing under-recoveries, higher revenues compared to 2020/21, higher spend on provisions and exceptional charges, offset by favourable working capital inflows on payables. Cash expended on investment activities increased as a result of continued organic growth in our regulated and non-regulated businesses, the impact of acquiring WPD, partly offset by disposal of financial investments. The disposal of our St William investment in March 2022 generated £413 million of proceeds in the year. The cash acquisition of WPD in June 2021 for £7.9 billion increased net debt, along with a further £8.2 billion increase from the fair value of net debt acquired. Net interest paid increased as a result of the bridge loan taken out to finance the purchase of WPD, interest for borrowings acquired with WPD and increased base rates on borrowings. The Group made net tax payments of £298 million during 2021/22. The cash dividend of £922 million, reflected a higher scrip uptake of 48% (2021: 17%). Discontinued operations represents UK Gas Transmission and Metering which generated higher cash inflows in 2021/22, principally as a result of improved year-on-year performance and no pension deficit payments in 2021/22. Non-cash movements primarily reflect changes in the sterling- dollar exchange rate, accretions on index-linked debt, lease additions and other derivative fair value movements, offset by the amortisation of fair value adjustments on the debt acquired with WPD. Closing net debt of £42.8 billion excludes £1.2 billion of net debt in NECO and £4.1 billion of net debt in NG Gas plc which has been classified as held for sale on 31 March 2022. During the year we raised over £4.2 billion of new long-term senior debt to refinance maturing debt and to fund a portion of our significant capital programme. The new bonds issued include further borrowings under our Green Financing Framework. In addition, we raised £8.2 billion under a bridge financing facility to fund the purchase of the UK Electricity Distribution business. This bridge facility remained outstanding at 31 March 2022 as we continue to progress the sales of our US Rhode Island business and our UK Gas Transmission business. We expect the proceeds from these sales to be received, and for the bridge facility to be repaid in full, this financial year (2022/23). As at 18 May 2022, we have £6.8 billion of undrawn committed facilities available for general corporate purposes, including £350 million related to National Grid Gas plc, all of which have expiry dates beyond May 2023. National Grid’s balance sheet remains robust, with strong investment grade ratings from Moody’s, Standard & Poor’s (S&P) and Fitch. The Board has considered the Group’s ability to finance normal operations as well as funding a significant capital programme, taking account of the disruption caused by the energy crisis. This includes stress-testing of the Group’s finances under a ‘reasonable worst case’ scenario, assessing the timing of the NECO and National Grid Gas plc transactions, and the further levers at the Board’s discretion to ensure our businesses are adequately financed. As a result, the Board has concluded that the Group will have adequate resources to do so. National Grid plc Annual Report and Accounts 2021/22 45

Financial position The following table sets out a condensed version of the Group’s IFRS balance sheet. Summary balance sheet £m 31 March 2022 31 March 2021 Change Goodwill and intangibles 12,804 6,031 112% Property, plant and equipment 57,532 47,043 22% Assets and liabilities held for sale 2,812 3,557 (21) % Other net assets/(liabilities) (334) (1,896) (82) % Tax balances (6,685) (4,817) 39% Net pension asset/(liabilities) 3,075 715 330% Provisions (2,539) (2,227) 14% Net debt (42,809) (28,546) 50% Net assets 23,856 19,860 20% Goodwill and intangibles increased as a result of the acquisition of WPD during the year. Property, plant and equipment increased as a result of the continuing capital investment programme, the acquisition of WPD and foreign exchange gains offset by reclassifications to held for sale. Assets held for sale comprises assets and liabilities of NECO and UK Gas Transmission (including metering) both of which we expect to sell during 2022/23 (see note 10 to the financial statements). Tax balances increased principally as a result of the acquisition of WPD, deferred tax on actuarial gains on pension assets, accelerated tax depreciation from ongoing capital investment and the impact of the UK tax rate change on deferred tax balances. Net pension assets increased in both the US and UK as a result of higher asset valuations from investment returns, higher discount rates on liabilities and foreign exchange movements along with the acquisition of WPD. Provisions were higher principally as a result of increases in environmental and other provisions, the impact of acquiring WPD and foreign exchange movements. Other movements are largely explained by net working capital inflows, reclassifications to held for sale, the impact of the acquisition of WPD and changes in the sterling-dollar exchange rate. Regulatory gearing, measured as net debt as a proportion of total regulatory asset value and other business invested capital increased significantly in the year to 81% as at 31 March 2022. This was up from 65% at the previous year end, principally as a result of an £8 billion ‘bridge loan’ used to acquire the equity of WPD and £8 billion fair value of net debt acquired with WPD. The proceeds from the sales of NECO and UK Gas Transmission expected to occur in 2022/23 will be used to repay this loan, which would substantially reduce the level of gearing in the Group. Taking into account the benefit of our hybrid debt, adjusted gearing as at 31 March 2022 was 80%. Once this bridge loan is repaid, gearing should return to a level appropriate for the current overall Group credit rating of BBB+/Baa1 (S&P/Moody’s). Retained cash flow as a proportion of adjusted net debt was 8.9%. This is above the long-term average level of 7% indicated by Moody’s, as consistent with maintaining our current Group rating. Off-balance sheet items There were no significant off-balance sheet items other than the commitments and contingencies detailed in note 30 of the financial statements. Economic returns In addition to Value Added, one of the principal ways in which we measure our performance in generating value for shareholders is to divide regulated financial performance by regulatory equity, to produce RoE. As explained on page 274, regulated financial performance adjusts reported operating profit to reflect the impact of the Group’s various regulatory economic arrangements in the UK and US. In order to show underlying performance, we calculate RoE measures excluding exceptional items of income or expenditure. Group RoE is used to measure our performance in generating value for our shareholders by dividing regulated and non-regulated financial performance, after interest and tax, by our measure of equity investment in all our businesses, including the regulated businesses, NGV and Other activities and joint ventures. Group RoE includes our UK Gas Transmission business. Regulated RoEs are measures of how the businesses are performing compared with the assumptions and allowances set by our regulators. US jurisdictional and UK entity regulated returns are calculated using the capital structure assumed within their respective regulatory arrangements and, in the case of the UK, assuming inflation of 3% RPI under RIIO-1 and 2% CPIH under RIIO-2. As these assumptions differ between the UK and the US, RoE measures are not directly comparable between the two geographies. In our performance measures, we compare achieved RoEs to the level assumed when setting base rate and revenue allowances in each jurisdiction. Return on Equity £m 2021/22 2020/21 Change UK Electricity Transmission 7.7 % 13.8 % -610 bps UK Electricity Distribution 13.6 % n/a n/a UK Gas Transmission 7.8 % 9.6 % -180 bps New England 8.3 % 7.5 % 80 bps New York 8.8 % 6.7 % 210 bps Group Return on Equity¹ 11.4 % 10.6 % 80 bps 1. Group RoE methodology amended in 2021/22 to calculate accretion charge on inflation-linked debt at long-run inflation rates. This provides alignment to treatment of RAV indexation in the metric. Prior year comparatives have not been restated. As a result of the new RIIO-2 price control, the allowed returns that UK Electricity Transmission and UK Gas Transmission can earn have decreased compared with the allowed returns under RIIO-1. In 2021/22, UK Electricity Transmission achieved operational returns of 7.7%, 140bps higher than base allowed return under RIIO-2, mainly from totex performance related to savings on capital delivery. UK Electricity Distribution achieved an operational return of 13.6% in 2021/22 under RIIO-1, or 400bps outperformance, mostly as a result of strong incentives performance, but also totex outperformance driven by efficient capital expenditure. UK Gas Transmission’s return decreased due to lower returns allowed under the new RIIO-2 price control, but achieved operational returns in 2021/22 were 7.8%, 110bps higher than allowed, from totex outperformance, driven by cost efficiencies and incentives. New England’s achieved return of 8.3% was 85% of the allowed return of 9.8% in 2021/22 as a result of higher IT and workforce costs, but this was an improvement on the achieved return of 7.5% or 77% of the allowed return in 2020/21, driven by rate increases and a smaller adverse impact from COVID-19 compared with the prior year. New York’s achieved return of 8.8% was 99% of the allowed return of 8.9% in 2021/22. This was an improvement compared with an achieved return of 6.7% in 2020/21, as a result of new rate agreements and a property tax rebate in the current year, and non-deferrable storm costs exceeding allowances plus non-recurring charges in the prior year. The quoted returns for New England and New York represent the weighted average return across OpCos within each jurisdiction. US returns were not affected by the COVID-19-related bad debt provisions recognised in 2020/21 which included an adjustment reflecting our expectation for future recovery of these bad debt costs. Overall Group RoE, which incorporates NGV, Property, Corporate and Other plus financing and tax performance was 11.4%. Financial review continued 46 National Grid plc Annual Report and Accounts 2021/22

Tax transparency As a responsible taxpayer, we have voluntarily included additional tax disclosures, which we believe are of significant interest to many of our stakeholders. Tax strategy National Grid is a responsible taxpayer. Our approach to tax is consistent with the Group’s broader commitments to doing business responsibly and upholding the highest ethical standards. This includes managing our tax affairs, as we recognise that our tax contribution supports public services and the wider economy. We endeavour to manage our tax affairs so that we pay and collect the right amount of tax, at the right time, in accordance with the tax laws in all the territories in which we operate. We will claim valid tax reliefs and incentives where these are applicable to our business operations, but only where they are widely accepted through the relevant tax legislation such as those established by government to promote investment, employment and economic growth. We do not have operations in tax havens or low tax jurisdictions without commercial purpose. We have a strong governance framework and our internal control and risk management framework helps us manage risks, including tax risk, appropriately. We take a conservative approach to tax risk. However, there is no prescriptive level or pre-defined limit to the amount of acceptable tax risk. Our financial statements have been audited. The figures in the tax transparency disclosures in the Annual Report and Accounts have been taken from our financial systems, which are subject to our internal control framework. We act with openness and honesty when engaging with relevant tax authorities and seek to work with tax authorities on a real-time basis. We engage proactively in developments of external tax policy and engage with relevant bodies where appropriate. Ultimate responsibility and oversight of our tax strategy and governance rests with the Finance Committee, with executive management delegated to our Chief Financial Officer who oversees and approves the tax strategy on an annual basis. For more detailed information, please refer to our published global tax strategy on our website. Country-by-country reporting summary We have disclosed in the table below data showing the scale of our activities in each of the countries we operate in. This allows our stakeholders to see the profits earned, taxes paid and the context of those payments. 2021/22 Revenue Profit/ (loss) before income tax3 £m Income tax accrued – current year4 £m Tangible assets/ (liabilities) other than cash and cash equivalents5 £mTax jurisdiction Unrelated party1 £m Related party2 £m Total £m United Kingdom 9,165 122 9,287 2,501 290 27,846 United States 10,646 45 10,691 1,395 6 29,686 Isle of Man — 18 18 (48) — — Luxembourg — — — — — — Netherlands — 33 33 — — — Guernsey6 — 4 4 — — — Cross-border consolidation — — — — — — Total 19,811 222 20,033 3,848 296 57,532 2020/21 Revenue Profit/ (loss) before income tax3 £m Income tax accrued – current year4 £m Tangible assets/ (liabilities) other than cash and cash equivalents5 £mTax jurisdiction Unrelated party1 £m Related party2 £m Total £m United Kingdom 5,482 106 5,588 1,718 213 20,796 United States 9,297 43 9,340 341 3 26,247 Isle of Man — 15 15 23 — — Luxembourg — — — 1,667 — — Netherlands — 52 52 1 — — Guernsey — — — — — — Cross-border consolidation — — — (1,667) — — Total 14,779 216 14,995 2,083 216 47,043 1. Unrelated party revenue comprises revenue from continuing operations of £18,449 million (2021: £13,665 million) and revenue from discontinued operations of £1,362 million (2021: £1,114 million). 2. Related party revenue only includes cross-border transactions and comprises related party revenue from continuing operations of £189 million (2021: £164 million) and related party revenue from discontinued operations of £33 million (2021: £52 million). 3. Profit/(loss) before income tax (PBT) from operations after exceptionals comprises continuing operations PBT of £3,441 million (2021: £1,664 million) and discontinued operations PBT of £407 million (2021: £419 million). 4. Current year income tax accrued comprises current year income tax from continuing operations of £261 million (2021: £160 million) and current year income tax from discontinued operations of £35 million (2021: £56 million). See the tax charge to tax paid reconciliation below for further information. 5. Tangible assets comprises property, plant and equipment and excludes tangible fixed assets for business classified as held for sale of £7,892 million (UK Gas Transmission £4,719 million, NECO £3,173 million) (2021: NECO £2,713 million). 6. The Guernsey captive was acquired as part of the acquisition of the WPD Group during the year ended 31 March 2022. Our Hong Kong entity is UK tax resident and is now dormant and our entities in Australia and Canada are dormant. Our entity in Ireland is in liquidation and our entities in Jersey were fully liquidated and dissolved during the period. Therefore, those jurisdictions have not been included in the table above. Our Isle of Man and Guernsey companies are captive insurance companies which are treated as controlled foreign companies for UK tax purposes and as such UK corporation tax is paid on their profits by National Grid. In the Netherlands, we have a finance company which borrowed money externally and on-lent it to another Group company. Both loans have now been settled. It is taxed on its profits in the Netherlands at the corporate tax rate of 25%. As part of our response to the Labour Party’s proposal to nationalise nearly all of National Grid’s UK assets we implemented measures, which included a Luxembourg holding company, in order to strengthen our ability to get a fair value for the assets in the event of a nationalisation. Transfer pricing is not a significant issue for the Group since there are limited transactions between Group companies, but any transactions between related parties are made on an arm’s-length basis and aligned to OECD principles. National Grid plc Annual Report and Accounts 2021/22 47

Group’s total tax charge to tax paid The total tax charge for the year disclosed in the financial statements in accordance with accounting standards and the equivalent total corporate income tax paid during the year will differ. The principal differences between these two measures are as follows: Reconciliation of Group’s total tax charge to tax paid (continuing and discontinued) £m 2021/22 2020/21 Total Group tax charge1 1,494 442 Adjustment for Group non-cash deferred tax (1,233) (218) Adjustments for Group current tax (charge)/credit in respect of prior years 35 (8) Group current tax charge 296 216 Group tax instalment payments (repayable)/payable in the following year (1) (7) Tax recoverable offset against current tax payments due — (55) Tax instalment payments overpaid in the current year 18 — Group tax payments/(refunds) in respect of prior years paid in the current year 15 (8) Group tax payments relating to tax disclosed elsewhere in the financial statements 3 11 Group tax paid2 331 157 Profit before income tax3 3,848 2,083 % % Effective cash tax rate4 8.6 7.5 Effective tax rate5 38.8 21.2 1. Total Group tax charge from operations after exceptionals comprises tax charges of continuing operations of £1,258 million (2021: £360 million) and discontinued operations of £236 million (2021: £82 million). 2. Total Group tax paid comprises tax paid for continuing operations of £298 million (2021: £91 million) and discontinued operations of £33 million (2021: £66 million). 3. PBT from continuing operations after exceptionals comprises continuing operations PBT of £3,441 million (2021: £1,664 million) and discontinued operations PBT of £407 million (2021: £419 million). 4. Effective cash tax rate for continuing operations after exceptionals is 8.8% (2021: 5.5%) and discontinued operations is 8.1% (2021: 15.8%). 5. Effective tax rate for continuing operations after exceptionals is 36.6% (2021: 21.6%) and discontinued operations is 57.5% (2021: 19.6%). Effective cash tax rate The effective cash tax rate for the total Group is 8.6%. The difference between this and the accounting effective rate of 38.8% is due to the following factors. An increase in future tax rates impacting the calculation of deferred taxes. National Grid is a capital-intensive business, across both the UK and the US, and as such invests significant sums each year in its networks. In 2021/22 the Group’s total capital expenditure was £6,446 million. To promote investment, tax legislation allows a deduction for qualifying capital expenditure at a faster rate than the associated depreciation in the statutory accounts. The impact of this is to defer cash tax payments into future years. In the current period, the US federal taxable income was offset by brought- forward net operating losses which primarily arose from deductions for qualifying capital expenditure incurred by National Grid in earlier years. Hence no significant federal tax payments were made in the current period. The Group continued to make significant payments into some of the UK defined benefit pension schemes. These payments have further reduced the overall cash tax paid in the UK. Group’s total tax contribution The total amount of taxes we pay and collect globally year-on-year is significantly more than just the tax which we pay on our global profits. To provide a full picture, we have disclosed the Group’s global total tax contribution which includes contributions from both continuing and discontinued businesses. Group’s total tax contribution 2021/22 (taxes paid/collected) Taxes borne Taxes collected Key: £m u People 221 u Product 206 u Profit 331 u Property 1,191 u Miscellaneous 15 Total 1,964 Key: £m u People 697 u Product 1,056 u Miscellaneous 2 Total 1,755 2021/22 Tax contribution Tax jurisdiction Income tax paid/ (repaid) on cash basis1 £m Property taxes £m Other taxes borne £m Taxes collected £m Total tax contribution £m Number of employees2 as at 31 March 2022 United Kingdom 315 302 114 1,110 1,841 13,424 United States 16 889 328 645 1,878 17,332 Ireland — — — — — — Isle of Man — — — — — — Luxembourg — — — — — — Netherlands — — — — — — Total 331 1,191 442 1,755 3,719 30,756 1. See the tax charge to tax paid reconciliation above for further information. 2. Number of employees is calculated as the total National Grid workforce across all parts of the business, including Non-executive Directors and Executive Directors. All are active, permanent employees as well as both full-time and part-time employees. 2020/21 Tax contribution Tax jurisdiction Income tax paid/ (repaid) on cash basis1 £m Property taxes £m Other taxes borne £m Taxes collected £m Total tax contribution £m Number of employees2 as at 31 March 2021 United Kingdom 158 225 58 672 1,113 6,657 United States (1) 816 309 602 1,726 17,026 Ireland — — — — — — Isle of Man — — — — — — Luxembourg — — — — — — Netherlands — — — — — — Total 157 1,041 367 1,274 2,839 23,683 1. See the tax charge to tax paid reconciliation above for further information. 2. Number of employees is calculated as the total National Grid workforce across all parts of the business, including Non-executive Directors and Executive Directors. All are active, permanent employees as well as both full-time and part-time employees. Financial review continued 48 National Grid plc Annual Report and Accounts 2021/22
For 2021/22, our total tax contribution globally was £3,719 million (2020/21: £2,839 million), taxes borne were £1,964 million (2020/21: £1,565 million) and taxes collected were £1,755 million (2020/21: £1,274 million). Our taxes borne have increased in the year primarily due to higher income taxes paid. Taxes collected have increased as a result of higher indirect taxes. Approximately two thirds of the tax borne by the Group continues to be in relation to property taxes, of which £889 million are paid in the US across over 1,100 cities and towns in Massachusetts, New Hampshire, New York, Rhode Island and Vermont. These taxes are the municipalities’ principal source of revenue to fund school districts, police and fire departments, road construction and other local services. In the UK, we participate in the 100 Group’s Total Tax Contribution Survey. The survey ranks the UK’s biggest listed companies in terms of their contribution to the total UK government’s tax receipts. The most recent results of the survey for 2020/21 ranks National Grid as the 19th highest contributor of UK taxes (2019/20: 19th), the 15th highest in respect of taxes borne (2019/20: 11th) and the 3rd highest in respect of capital expenditure (£1,594 million; 2019/20: £1,663 million) on fixed assets (2019/20: 6th). Our ranking in the survey is proportionate to the size of our business and capitalisation relative to the other contributors to the survey. However, National Grid’s contribution to the UK and US economies is broader than just the taxes it pays over to and collects on behalf of the tax authorities. Both in the UK and the US we employ thousands of individuals directly. We also support jobs in the construction industry through our capital expenditure, which in 2021/22 was £6,446 million, as well as supporting a significant number of jobs in our supply chain. Furthermore, as a utility we provide a core essential service which allows the infrastructure of the country/states we operate in to run smoothly. This enables individuals and businesses to flourish and contribute to the economy and society. Development of future tax policy We believe that the continued development of a coherent and transparent tax policy across the Group is critical to help drive growth in the economy. We continue to engage on consultations with policymakers where the subject matter impacts taxes borne or collected by our business, with the aim of openly contributing to the debate and development of tax legislation for the benefit of all our stakeholders. To ensure that the needs of our stakeholders are considered in the development of tax policy we are a member of a number of industry groups which participate in the development of future tax policy, such as the Electricity Tax Forum and CBI Employment Taxes Working Group, together with the 100 Group in the UK, which represents the views of Finance Directors of FTSE 100 companies and several other large UK companies. We undertake similar activities in the US, where the Group is an active member in the Edison Electric Institute, the American Gas Association, the Global Business Alliance, the American Clean Power Association, the Energy Storage Association and the Solar Energy Industries Association. Feedback from these groups, such as the results of the 100 Group Total Tax Contribution Survey, and consideration of third party reporting frameworks like the GRI (Global Reporting Initiative) helps to ensure that we consider the needs of our stakeholders and are engaged at the earliest opportunity on tax issues which affect our business. Pensions In 2021/22, defined benefits pensions and other post-retirement benefits operating costs increased to £321 million (2020/21: £302 million) with £66 million related to an increase from the acquisition of WPD in 2021/22. During the year, our pensions and other post-retirement benefit plans improved from a net surplus position of £715 million at 31 March 2021 to a net surplus of £3,075 million at 31 March 2022. This was principally the result of actuarial gains on plan assets of £0.8 billion (as a result of higher investment returns) and actuarial gains on plan liabilities of £1.6 billion (reflecting higher discount rates from corporate bond yields net of higher expectations for long-term RPI inflation). The acquisition of WPD in June 2021 increased the Group’s net pension surplus by £566 million, but this was offset by the reclassification of National Grid Gas plc’s section of the NGUKPS (£664 million in surplus) at 31 March 2022 to held for sale. Employer contributions during the year were £300 million (2020/21: £274 million), including £84 million (2020/21: £88 million) of deficit contributions. As at 31 March 2022, the total UK and US assets and liabilities and the overall net IAS 19 (revised) accounting surplus (2020/21: surplus) is shown below. Further information can be found in note 25 to the financial statements. Net pension and other post-retirement obligations UK US Total Plan assets (£m) 16,865 10,148 27,013 Plan liabilities (£m) (14,275) (9,663) (23,938) Net surplus (£m) 2,590 485 3,075 As at 31 March 2022, we recognised in the statement of financial position pension assets of £3,885 million (UK pensions £2,668 million; US pensions £732 million; and US other £485 million) and pensions liabilities of £810 million (UK pensions £78 million; US pensions £248 million; and US other £484 million). Dividend The Board has recommended an increase in the final dividend to 33.76p per ordinary share ($2.0929 per American Depository Share), which will be paid on 17 August 2022 to shareholders on the register of members as at 6 June 2022. If approved, this will bring the full-year dividend to 50.97p per ordinary share, an increase of 3.7% over the 49.16p per ordinary share in respect of the financial year ended 31 March 2021. This is in line with the increase in average UK CPIH inflation for the year ended 31 March 2022 as set out in our dividend policy. Our aim is to grow the annual dividend in line with CPIH, thus maintaining the dividend per share in real terms. The Board will review this policy regularly, taking into account a range of factors including expected business performance and regulatory developments. At 31 March 2022, National Grid plc had £12 billion of distributable reserves, which is sufficient to cover more than five years of forecast Group dividends. If approved, the final dividend will absorb approximately £1.2 billion of shareholders’ funds. This year’s dividend is covered approximately 1.3x by underlying earnings. The Directors consider the Group’s capital structure and dividend policy at least twice a year when proposing an interim and final dividend and aim to maintain distributable reserves that provide adequate cover for dividend payments. New accounting standards We did not adopt any new accounting standards in 2021/22. Amendments to certain existing accounting standards were adopted during the year, but these had no material impact on the Group’s results or financial statement disclosures. Post balance sheet events On 6 April 2022, the UK government announced that ESO will become part of an independent system operator public body, following the Future System Operator consultation. On 11 May 2022, Ofgem approved the Group’s request to return £200 million of interconnector revenues subject to the cap and floor regime to consumers ahead of schedule. For further details, see note 38 to the financial statements. National Grid plc Annual Report and Accounts 2021/22 49

UK Electricity Transmission We performed well in 2021/22 as we maintained our focus on safe, customer-led, reliable, innovative and efficient operations to drive forward the net zero agenda. Western Link delivers green energy to where it is needed and enables a more efficient electricity system. Due to delays with the complex construction phase, the joint venture agreed to a £15 million payment into Ofgem’s redress fund (NGET’s share was £10 million) and to return £143 million to consumers in payments through mechanisms outlined in the price control. This has ensured ET did not benefit from the delay. We have delivered £24 million efficiencies with our Evolution programme. Grow our organisational capability The introduction of SmartWires provides greater control and flexibility of the power flow across our transmission boundaries and the installation of Connectnow is the first Digital Transmission Owner portal in the UK, allowing our customers to understand where to connect and to manage their project portfolios. Our Deeside Innovation Centre is now operational and enabling the trialling of innovative energy solutions. This will accelerate the deployment of new technologies to facilitate net zero and reduce the cost of maintaining and managing the network. Empower colleagues for great performance It is over 12 months since any of our 2,500 field and office-based employees suffered an LTI. However, we are disappointed that the frequency of LTIs amongst our contractors has increased above our 0.1 target following 18 contractor LTIs in the year. We are actively working with our contractors to eliminate this gap by ensuring requirements are clear and consistent across all parties. We are digitalising our operations in order to better enable our people; for example, our Agile Field Force programme has freed up 20,000 hours of engineer time every year. This enables engineers to focus on using their core skills to maintain and install new assets. Looking ahead In order to migrate to a cleaner energy system, we need to connect increasing amounts of renewable energy from the North Sea and the UK’s East Coast. The complexity and scale of the infrastructure investments associated with our East Coast programme will require us to make a step change in how we work with developers, suppliers, environmental groups and local communities so we can find the best local and environmental solutions possible. We will reform the customer connections process to be more efficient, connecting our customers more quickly and making full use of the data and products available to drive transparency. We will release capacity for our teams through reduced admin time, using standardisation and by enabling customers to self-serve to ensure all our work adds value. Highlights ET has performed strongly over 2021/22, increasing annual investment by 20% as part of our £8 billion RIIO-T2 promise. We have maintained our focus on safety, customers, reliability and innovation to continue driving forward the net zero agenda. We submitted a technical appeal to the CMA regarding the RIIO-T2 cost of equity and outperformance wedge. The CMA found in our favour on the outperformance wedge, which has since been dropped from the RIIO-T2 regulatory framework. We have installed 53 T-pylons as part of the route connecting Hinkley Point C nuclear power station to over 6 million homes and businesses. We have completed almost 6.2 miles (10 kilometres) of underground tunnelling as part of our London Power Tunnels (LPT2) project and met 100% of our milestones. Enable the energy transition for all We outperformed this year’s proportion of our SF6 Science Based Targets to reduce emissions by 50% by 2030 through a programme of targeted repair, refurbishment and asset replacement. We have been collaborating with suppliers, universities and innovators across the world to trial SF6-free assets. We have switched 10% of our operational fleet to electric as part of the process of going fully electric by 2030. We connected over 5 GW of generation to the network as part of our commitment to connect over 15 GW of customer capacity over RIIO-T2 to provide the UK with clean power and flexible storage. Despite a quadrupling of new connection requests, our teams achieved a Quality of Connection (customer satisfaction) score of 7.8 in 2021/22. Deliver for our customers efficiently Over the year, we have replaced over 900 assets to maintain a safe and reliable network. The network stood up well against the recent storms and although we experienced multiple circuit trips, the majority were returned via the automatic protection Delayed Auto Reclose (DAR) system. No loss of demand occurred through any of the storms, with only 27 MW of Energy Not Supplied against our incentive target of 103 MW. The first of 53 T-pylons, erected in September 2021 as part of the Hinkley Connection project in the UK 50 National Grid plc Annual Report and Accounts 2021/22 Our business units 12_Our_business_units_UK_p50_52_v64.indd 50 27/05/2022 16:50

UK Electricity Distribution We have performed well in 2021/22 as we maintained excellent customer service and delivery of our innovative projects. Highlights WPD has delivered excellent service for our 8 million customers and remains on track to outperform the majority of our RIIO-ED1 targets. We have continued to outperform our targets for customer minutes lost and customer interruptions by 30% and 27% respectively from the underlying performance benchmark, accident rates have reduced to 0.62 accidents per 100 staff, and our Scope 1 and 2 emissions (excluding losses) have continued to get smaller with a 52% reduction since 2014/15. We have also supported almost 26,000 fuel poor customers, leading to estimated annual savings of £14.6 million for these customers. Our hard work in conducting our business with the highest standards is reflected in WPD winning the Disruptor Award at the Utility Week Awards for our Flexible Power initiative. Enable the energy transition for all We have several innovative delivery projects underway to drive a fair energy transition for all. In RIIO-ED2, we will build on these foundations to ensure customers are able to connect low-carbon technologies (LCTs) quickly and easily. We have centralised our process for domestic LCTs, offering a next day approval for most EVs and heat pumps. Our RIIO-ED2 Business Plan includes core commitments which are targets to ensuring that vulnerable customers do not miss the benefits associated with the shift to a smart energy system. This includes offering 600,000 Priority Service Register (PSR) customers a bespoke smart energy action plan, supporting local communities via a Community Matters social initiative and installing solar PV on schools in areas of high economic deprivation. In May 2022, Ofgem announced that WPD had agreed to pay £3.7 million for each of the four licences we operate, totalling £14.9 million. This followed the outcome of an investigation into the level of information, advice and services provided to customers on the PSR. We have made changes to our policies and processes to ensure we are fully complying with the expectations Ofgem has clarified in our licence. Deliver for our customers efficiently Even though we had to change some practices due to the COVID-19 pandemic, we have continued to provide the highest level of service to our 8 million customers. Our hard work is reflected in our excellent performance against the Broad Measure of Customer Satisfaction (BMCS) results, scoring 9.03 out of 10 overall. Grow our organisational capability We have established plans and work programmes to build a ‘green recovery’ from the effects of the COVID-19 pandemic. The nationwide call for evidence to support network investment projects saw WPD receive feedback from more than 200 stakeholders, and this helped us target the network investment to the areas that see the most benefit. All 73 projects have been given the go-ahead, each meeting the Ofgem-backed initiative’s criteria of enabling net zero and providing a wider social benefit. The successful projects, which will be completed in the next two years, range from installing new substations to reinforcing existing parts of the network. In total, 55% of the projects relate to customers wanting to connect public EV charging hubs in some form and we estimate that customers could connect up to 50% more ultra-rapid EV chargers because of these investments, many at motorway service areas. Empower colleagues for great performance During the year, the WPD Chief Executive met up with small groups of colleagues to hear their views on WPD. The sessions were attended by colleagues across various roles and encouraged suggestions to be brought forward to drive an overall performance improvement within the organisation. This direct feedback from colleagues will be crucial in producing ideas, innovations and solutions to the many challenges and opportunities that we will have in the business going forward. Looking ahead We are determined to achieve a sustainable energy future by delivering a dynamic, innovative and high-functioning energy grid that stands ready to serve many generations to come. Change is already well underway, with unprecedented levels of flexibility and efficiency, and new distribution system operator capabilities already in place. In RIIO-ED2, we will accelerate the rate of this change, placing customers at the heart of a swift and effective transition to a smart, decarbonised energy future. We will utilise innovative and digitalised solutions to enhance our operations. We will instil a culture across our business that maximises every opportunity to innovate and work smarter for our customers. We have embedded £723 million of efficiency savings into our RIIO-ED2 Business Plan thanks to our proven track record of innovation development and roll-out. Without this, required investment in RIIO-ED2 would have been £7.4 billion, which would have resulted in increases to customer bills. Instead, by working smarter and embracing a culture of continual innovation, we will deliver our RIIO-ED2 commitments with a budget of £6.7 billion whilst maintaining affordability for our customers. In addition, we will deliver an extra £95 million of efficiency savings over RIIO-ED2. We anticipate a 108% increase in the level of load-related schemes, with only an 8% increase in engineering management and support costs. By adopting a ‘flexibility first’ approach to all load-related investment decisions, we have committed that by 2028 we will avoid over £94 million of network reinforcement costs by operating the existing primary and secondary networks more flexibly. Works to improve the overhead network in Droitwich, North Worcestershire, UK 51 S trateg ic R ep o rt National Grid plc Annual Report and Accounts 2021/22 12_Our_business_units_UK_p50_52_v64.indd 51 27/05/2022 16:51

Our business units continued UK Gas Transmission* UK Electricity System Operator We have commenced RIIO-T2 strongly and made good progress preparing for the sale of a majority stake in the Gas Transmission business. We are working with stakeholders to support progress towards net zero while maintaining energy security and minimising costs for consumers. Highlights The RIIO-T2 price control will provide a high degree of cash flow certainty for the GT business for the five-year period to March 2026. Detailed plans are in place to deliver against our targets, through continued strong incentive performance, as well as preparing for the energy transition. GT made a strong start to RIIO-T2, with strong financial results, customer metrics, and continued high levels of safety and operational performance. We continued to support our colleagues through the COVID-19 pandemic, ensuring alignment to government guidelines at all times. GT continues to work with industry peers to support the transition to a hydrogen network and has now commenced construction of FutureGrid – a £9 million full-scale hydrogen test facility, funded through the Network Innovation Competition. Looking ahead Following the announcement on 18 March 2021 of the intention to sell a majority stake in the GT business, preparations have been ongoing throughout the year for the design of a standalone business. The sale of a 60% equity interest in the GT business to a consortium of Macquarie Asset Management and British Columbia Investment Management Corporation was announced on 27 March 2022. The results of GT are presented as discontinued operations in 2021/22. We are committed to supporting our people through the remaining stages of the sales process, providing access to all necessary information as well as increased engagement across the business. We are working closely with BEIS, Ofgem and all other industry stakeholders to provide assurance of our unrelenting focus on delivery of RIIO-T2 performance and ensuring security of supply throughout the transitional period and beyond. Highlights As Great Britain’s electricity system operator, we are at the heart of the energy transition, operating one of the safest, most reliable and fastest decarbonising networks in the world. The ESO launched its Future Energy Scenarios in July 2021, which outlines four different, credible pathways for the future of energy between now and 2050. Bacton Gas Terminal, Norfolk, UK ESO Control Centre, UK * Discontinued operation. Looking ahead In April 2022, BEIS and Ofgem announced their decision to establish an expert, impartial Future System Operator to drive progress towards net zero while maintaining energy security and minimising costs for consumers, which will incorporate and build upon the existing capabilities of the ESO. We will continue to work closely with government, the regulator and industry as we enter the transition period, which will require communication and engagement with our impacted colleagues, who are an essential part of this new organisation, and a complex separation activity, particularly of IT systems. 52 National Grid plc Annual Report and Accounts 2021/22 12_Our_business_units_UK_p50_52_v64.indd 52 27/05/2022 16:51

affordability and equity, safety, reliability, and resilience. Our plan strives to retain customer choice around heating solutions, reduce overall energy costs, increase investment and adoption of energy-efficiency measures, and make provisions for utilising non-pipe alternatives where safe and cost effective. Deliver for our customers efficiently We aim to provide a fairer, cleaner and more affordable gas service to our customers. The Department of Public Utilities approved our five-year rate plan on 1 October 2021. The plan supports capital investment and provides resources to meet our work plans over the next five years. We also received approval of our geothermal demonstration programme, which secured funding for four district geothermal system installations for existing Massachusetts gas customers. Grow our organisational capability In July 2021, the Company’s Massachusetts Phase 3 Electric Vehicle proposal was filed with the DPU to build upon our first two Electric Vehicle Market Development Programs by providing offerings to meet the diverse transportation needs of all the Company’s customers, building the infrastructure required to support state-wide EV adoption, and helping to enable the Commonwealth’s broader transition to a clean transportation future. The Company is proposing to run the Phase III Program for a period of four years, with a total budget of approximately $278 million. In October 2021, we appointed a New England President to our Group Executive Committee. The Committee’s wide range of experience will help lead the clean energy transition for all of our communities. The sale of our Rhode Island electricity and gas business will serve as a vital step in furthering our strategic vision. To prepare for the sale, we established a transition team of over 250 people across 19 functional areas to set up both the future Massachusetts and Rhode Island businesses for success. The sale has received all required regulatory approvals, including from the Rhode Island Division of Public Utilities and Carriers. That decision, however, has been appealed to the RI Superior Court by the RI Attorney General. We are confident that the Division’s approval of the sale will be upheld and look forward to closing the transaction as expeditiously as possible. Empower colleagues for great performance Our colleagues worked to create an equitable impact in our communities. The New England Gas Diversity, Equality and Inclusion Council is a grassroots group of both union and management field employees. The group recently launched two initiatives to recruit and retain employees from diverse backgrounds, including hosting a pipeline career development day at local high schools. By investing in our communities through education and upskilling talent to adapt to the changing energy system, we are tackling our DEI commitments. Looking ahead Customers are always at the forefront of everything we do, and we must consistently deliver a safe and reliable service. The various organisational changes in our region will allow us to provide a better service to our customers. This is the foundation for us to continue to be greener, stronger and more reliable. New England In 2021/22, we performed well throughout the region while still dealing with the effects of the COVID-19 pandemic, severe weather events and significant organisational changes. There was a continued focus on safety, storm response and the clean energy transition. Highlights We used lessons learnt throughout the pandemic to help navigate the ever-changing COVID-19 protocols in the region. Colleagues continued to work safely, whether in the field or utilising our hybrid or remote work model. In addition, we found ways to give back and support the communities we serve by assisting with COVID-19 vaccinations and donating hygienic safety products to non- profit organisations. New England faced several challenging storms this fiscal year. Our field crews and emergency response organisation conducted thorough emergency planning and collaborations across divisions, which resulted in our crews safely and efficiently restoring power to our customers. Our restoration efforts were recognised once again as we were awarded EEI Emergency Response Awards for both Tropical Storm Henri and the October Nor’easter. Safety is a pillar of our daily operations, and we continue to focus on the wellbeing and safety of our workforce and customers alike. We have improved our safety score for near misses and good catches and, as at 31 March 2022, our LTIFR was 0.18. Enable the energy transition for all In 2021, we worked with the City of Melrose to deploy 15 pole-mounted EV chargers to expand EV adoption, accelerate usage and lower installation costs. This project is the first deployment of elevated, pole-mounted EV chargers by an investor-owned utility in the US. We have focused on advancing clean transportation by working with cities such as Beverly on an electric school bus project, incorporating a fully electric-powered backhoe into our fleet, and proposing our largest ever EV programme with Massachusetts regulators. The Company also continued to reduce methane emissions from our gas network. We replaced over 170 miles (274 kilometres) of leak-prone gas pipes across New England, improving pipeline safety and reducing greenhouse gas emissions. In March 2022, as part of the DPU 20-80 proceeding, we and our fellow Massachusetts gas utilities filed a plan with the Department of Public Utilities that outlines exactly how to get to a decarbonised heating future. We believe our approach will most effectively balance Boston Common Park, Massachusetts, US 53 S trateg ic R ep o rt National Grid plc Annual Report and Accounts 2021/22 Our business units continued

New York In 2021/22, we achieved overall strong results throughout the region. Throughout the various organisational model changes, severe weather events, rate cases and public opposition in our region, we prioritised safety, bold clean energy and climate action plans, and our commitment to the communities we serve. Deliver for our customers efficiently In New York, we are serving our customers and communities through our new initiative, Project C. Project C focuses on four key priorities: clean energy and sustainability; workforce development; neighbourhood investment and community engagement; and environmental justice and social equity. By providing grants to non-profits, recreational programmes, and local economic development partners, we will support the revitalisation of communities and small businesses across our service area. With the cost of heating increasing this past winter, we collaborated with AARP New York and the Public Utility Law Project (PULP) to make income-eligible customers aware of our Energy Affordability Programme (EAP). Our Consumer Advocates helped seniors with enrolment in EAP and provided information on other no-cost, energy-saving programmes to improve the comfort of their homes. Grow our organisational capability We play a key role in combatting climate change and providing climate solutions. As part of the lead-up to COP26, we joined forces with government leaders from around the world at Climate Week NYC, where we were the headline partner, to focus on fulfilling and increasing commitments to climate action. Several National Grid leaders contributed to the global conversation on climate change and how to take action. Another significant highlight in our region was bringing 900 of our Long Island gas field employees through a gas business enablement go-live. We successfully provided colleagues with tools and applications to meet the needs of our customers, communities and regulators. Empower colleagues for great performance After nearly three years of planning, our new Brooklyn, New York office at 2 Hanson Place opened in 2021. This highly anticipated space was built on the Smart workspace strategy, and we ensured it incorporated principles of sustainability and human wellbeing in its design and operations. The building was also designed to WELL and Leadership in Energy and Environmental Design building standards, which resulted in an Award of Excellence by the New England chapter of CoreNet Global. Looking ahead The New York team had a good year, and we are excited about what is ahead. We will continue to make strategic investments in our network, invest in our communities through Project C, and create a stronger, more diverse workforce for the future. Highlights New York encountered several challenging storms, but we remained focused on emergency planning and restoration efforts. This year we received an EEI Emergency Response Award and the 2021 ReliabilityOne® Award for Outstanding Suburban and Rural Service Area Utility in the Northeast as we hit our regulated reliability goals for the 14th consecutive year. Safety remained one of our top priorities in the region. We continued to use the tools and processes developed at the onset of the pandemic to safely navigate through the various spikes in COVID-19. We have improved our safety score for near misses and good catches, and as at 31 March 2022, our LTIFR was 0.13. Enable the energy transition for all In New York, we are doing our part to fulfil the clean energy transition. In 2021, we worked with the town of Hempstead, New York, and introduced one of the country’s first and largest clean hydrogen demonstration projects. The HyGrid Project located in Point Lookout on Long Island will blend green hydrogen into the existing distribution system to heat approximately 800 homes and fuel a fleet of municipal vehicles. We are also working with the New York Power Authority to build the Smart Path Connect project, a $1 billion transmission upgrade that will enable the integration of 1 GW of renewable energy to the grid. In addition, we have proposed nearly $700 million in short-term transmission upgrades in upstate New York that would unlock roughly 2.6 GW of clean energy resources. The solid rate case agreements that have been completed for KEDNY, KEDLI and NMPC are essential steps in energy transition. These rate agreements will provide us with the funding needed to create the energy infrastructure and service our New York customers demand and deserve. View of Albany, New York, US 54 National Grid plc Annual Report and Accounts 2021/22 Our business units continued 13_Our_business_units_US_p53_54_v50.indd 54 27/05/2022 16:53

National Grid Ventures and Other activities Highlights This section relates to NGV, non-regulated businesses and other commercial operations not included within the business segments. NGV, which operates separately from our core regulated units, is focused on competitive markets across the UK and US. Its portfolio includes electricity interconnectors, LNG storage and regasification, large-scale renewable generation, conventional generation and competitive transmission. Other activities primarily relate to NGP, the corporate investment and innovation arm of National Grid, as well as UK property, insurance and corporate activities. Despite ongoing challenges presented by the COVID-19 pandemic in the US and UK, NGV businesses performed well in 2021/22, including commissioning the North Sea Link interconnector between the UK and Norway and the Prairie Wolf Solar Project in Illinois. NGV also successfully secured a seabed lease in the New York Bight offshore auction together with RWE Renewables. In March 2022, National Grid Property completed the sale of National Grid’s 50% interest in the St William Homes LLP joint venture to The Berkeley Group plc. The safety and wellbeing of colleagues continues to be a key priority across NGV. As at 31 March 2022, NGV’s LTIFR was 0.14. Enable the energy transition for all NGV plays an important role for the National Grid Group in developing, constructing, operating and investing in infrastructure to support the energy transition and security of supply in both the UK and the US. In the UK, NGV is the leading developer and operator of interconnectors, which are high- voltage subsea cables that enable the UK to share excess power, such as wind, solar and hydro generation, with neighbouring markets. In October 2021, NGV commissioned North Sea Link, which at 447 miles (720 kilometres) is the world’s longest subsea interconnector. NGV also operates links to Belgium, France and the Netherlands. By 2030, we estimate that 90% of the energy imported by NGV interconnectors will be from zero-carbon energy sources. NGV is part of the Northern Endurance Partnership, a consortium developing CO2 transport and storage technology for the East Coast Cluster (ECC) in the North of England. The ECC, which aims to transport carbon emissions from the Humber and Teesside for safe storage deep under the Southern North Sea, is one of two industrial clusters selected by the UK government to be delivered this decade. Ofgem has agreed to National Grid’s offer to make an early payment of £200 million of interconnector revenues to consumers, via the regulator, as part of the interconnector regulatory regime. The payments will be made over the next two years, to help reduce consumer energy bills. In the US, NGV and RWE Renewables successfully secured a seabed lease as part of the US Bureau of Ocean Energy Management’s New York Bight auction. Community Offshore Wind, a joint venture between the two companies, will develop the awarded seabed, which has the potential to host 3 GW of capacity. NGV’s National Grid Renewables business started commercial operations of its 200 MW Prairie Wolf Solar Project in Illinois and began construction on 674 MW of solar and energy storage projects in Texas and Ohio. NGV is part owner of New York Transco, which started construction of the largest transmission project in New York in 40 years to enable 1 GW of renewable energy onto the system. NGP had a portfolio which comprised 38 companies and four fund investments at a fair value of $491 million, as at 31 March 2022. Deliver for our customers efficiently In the UK, NGV’s interconnector portfolio comprises 6.4 GW of operational capacity. Together with France’s Réseau de Transport d’Électricité (RTE), NGV operates the IFA and IFA2 interconnectors connecting France and Great Britain. IFA, a 2 GW HVDC cable, suffered a major fire in September 2021. Half of the link, representing 1 GW, was safely returned to service the following month. The remaining 1 GW is expected to return to service in December 2022. IFA2 is a 1 GW cable stretching 149 miles (240 kilometres). BritNed is an independent joint venture between National Grid and TenneT, the Dutch transmission system operator. It owns and operates a 1 GW HVDC link between Great Britain and the Netherlands. Nemo Link is an independent joint venture between National Grid and Elia, the Belgian transmission system operator. It owns and operates a 1 GW HVDC link between Great Britain and Belgium. NGV’s Grain LNG is one of three LNG importation facilities in the UK. It operates under long-term take or pay contracts with customers and provides importation services of ship berthing, temporary storage, ship reloading and regasification into the National Transmission System (NTS). Grain LNG’s road tanker loading facility also offers the UK’s transport and off-grid industrial sector a more environmentally friendly alternative to diesel or heavy fuel oil. The facility allows tanker operators to load and transport LNG in bulk across the UK via road or rail. NGV is a part owner of Millennium Pipeline, which provides consumers in the northeastern US with additional natural gas infrastructure to meet growing consumer demand for cleaner and more reliable energy. It is strategically positioned to serve utility and power plant loads across New York State and into New England. Grow our organisational capability NGV established a portfolio management function to optimise the existing portfolio and identify future opportunities for growth. Empower colleagues for great performance NGV prides itself on a diverse and inclusive culture, which includes 46% diversity across new hires in 2021/22. Looking ahead In the UK, NGV will grow its interconnector portfolio by 1.4 GW in the next two years, with construction underway on the Viking Link interconnector. Developed together with Danish transmission system operator Energinet, Viking Link will be a 475 mile (765 kilometre) long subsea link connecting Great Britain and Denmark. NGV will have 7.8 GW of operational interconnector capacity when Viking Link becomes operational in 2023/24. Work is also underway to expand Grain LNG’s storage capacity from 1.0 million m³ to 1.2 million m³ by 2025, further supporting the UK’s gas security of supply. Inside the UK valve hall at NGV’s 1GW IFA2 interconnector 55 S trateg ic R ep o rt National Grid plc Annual Report and Accounts 2021/22 14_Our_business_units_NGV_and_other_activities_p55_v46.indd 55 27/05/2022 16:54

Effective engagement with our stakeholders is key to successful achievement of the Group’s strategy in the long term. Section 172(1) statement During the year, the Directors acted in the way they considered, in good faith, most likely to promote the long-term success of the Company for the benefit of its members as a whole, with due regard to the matters set out in section 172 of the Companies Act 2006. Examples of how the Directors have had regard to these matters during the year are set out on pages 56 – 59, which together form our section 172(1) statement. The Board recognises its responsibilities to each of National Grid’s stakeholder groups and to wider society. The Directors endeavour to ascertain the interests and views of our stakeholders and consider these when taking decisions. The Board oversees a governance framework that enables decisions to be taken at the right time in the most appropriate forum. We recognise that it is not always possible to achieve each stakeholder’s preferred outcome and consideration of each stakeholder group depends on the matter at hand. The Board strives to balance the different priorities and interests of our stakeholders in a way compatible with the long-term, sustainable success of the business and which maintains a standard of business conduct aligned to our values and purpose. An overview of business-level engagement and outcomes is reported to the Board or appropriate Board Committee on a regular basis. The cadence and content of such reports to the Board are considered bi-annually as part of the forward business review by the Chair, Chief Executive and Group General Counsel & Company Secretary, to ensure sufficient consideration is given to pertinent matters and affected stakeholders. One of the Board’s objectives is to routinely bring external viewpoints into Board discussions, which have included external speakers, training sessions and organisational deep dives led by colleagues from across the business, during the year. The Board has identified the stakeholder groups it considers key and some examples of how we have engaged with these groups, together with the outcomes and impacts of engagement on our business and Board decisions, are set out on pages 57 – 58. These examples are not exhaustive and we have integrated reporting on how stakeholder views are considered throughout this report. The following should therefore be read in conjunction with this statement: • Pages 92 – 94 set out key matters considered by the Board during the year. • Pages 4 – 7 describe our business model including how our business interacts with our key stakeholders, and why they are important to us. • Pages 60 – 69 set out our commitment to being a responsible business and the action we have taken during the year. • Pages 15 – 19 explain developments in our business environment and our responses. • Pages 101 – 103 explain the activities of the Audit & Risk Committee in response to allegations of fraud and bribery offences by former National Grid employees in our US business. Our approach to stakeholder engagement Most engagement with key stakeholders is carried out by management teams and takes place at business level and the Directors engage directly with stakeholders where possible. Reporting mechanisms are in place to collate feedback and developments from such engagement and enable a flow of this information to the Board and Board Committees, to inform decision making. Financing, stewardship, constructive engagement Investment, partnership relationships Expertise, talent, living our values Expertise, talent, living our values Partnership and commitment, industry viewpoints Expecta ion setting, insight Expert industry views and insight Long-term growth prospects, heart of the energy transition Long term growth prospects, heart of the energy transition Long term growth prospects, heart of the energy transition Quality products and services Value-led culture, purposeful work, development Public policy, engagement, insights and feedback Safe, reliable service deliv ry Regulatory frameworks, collaboration Our investors Our regulators Communities and governments Contractors and suppliers Our colleagues Our customers National Grid 56 National Grid plc Annual Report and Accounts 2021/22 Stakeholder engagement Our stakeholders 15_Our_stakeholders_s172_p56_59_v62.indd 56 27/05/2022 16:55

How we engaged In November 2021 we held our ‘Doing Right Now’ Investor Day, attended by the Chief Executive and senior leaders, where we announced our new organisational structure and associated cost-efficiency target, and further clarified our five-year plan announced in May 2021. The Chief Executive attended the UK Global Investment Summit in October 2021, which focused on opportunities for investors and businesses as part of the UK’s Green Economic Recovery. Our Remuneration Committee engaged with shareholders on key remuneration topics, particularly development of the new remuneration policy, which will be put to a shareholder vote at our 2022 AGM. Outcomes and actions An independent investor-perception study following the Investor Day found the Company’s critical role at the heart of the energy transition was well understood and there was a high degree of trust that the Company will fulfil this role successfully. The need to maintain the momentum to integrate our ESG reporting and talk more about future opportunities for the network, particularly in the US, was highlighted. Responses have informed our ongoing investor relations communication strategy and we will address key themes at investor events throughout 2022. At the 2021 AGM, the Board proposed, and shareholders approved, an amendment to Company’s Articles of Association to enable the holding of hybrid AGMs. This flexibility will enable more of our shareholders to participate in future AGMs, using online facilities. We intend to hold a hybrid AGM for the first time in 2022. Our unique investment proposition is set out on pages 8 – 9. Engagement with our stakeholders Stakeholder group – Our investors How we engaged As COVID-19 restrictions in the UK eased, the Board was able to safely participate in site visits in early 2022. Following extensive oversight by the Board of the investigation into a catastrophic fire at the IFA interconnector site in Sellindge during 2021, three Non-executive Directors visited the site in March 2022. They met with a range of workers on site and heard views on safety practices. The annual Grid:voice engagement survey provides insights into what is important to our colleagues and how they are feeling about the Company’s strategy and leadership. The results of this survey were provided to the Board and plans put in place to progress any areas of improvement identified. Further information about the Board’s employee engagement programme is set out on pages 96 – 97. Outcomes and actions Feedback from our annual Grid:voice survey has led to development of our home-working IT capabilities and of our flexible working policy, following a strong indication of a preference among the workforce to continue with hybrid ways of working. Specific indicators are used as a measure of culture in relation to employee perception of safety and leadership. You can learn about how the Board oversees corporate culture and the progress we are making on these indices on page 95. Employee engagement and workforce diversity are two of our non-financial KPIs. Further information is on page 27. Read about our commitments to our colleagues and how we are living our corporate values on pages 65 – 66. Stakeholder group – Our colleagues How we engaged Bi-annual updates are provided to the Board on UK, US and NGV customers, including progress on deliverables linked to our strategic priorities. As recommended by the NY Monitor, the Company produced a supplementary report to its Natural Gas Long-Term Capacity Report for Brooklyn, Queens, Staten Island and Long Island (published in 2020), which analysed gas supply constraints in downstate NY and identified options for meeting future demand. The supplementary report was based on the results of an extensive outreach programme to measure customer and other stakeholder support for the various supply options for future demand. Engagement occurred through multiple channels, including social media and web platforms. Regular reports and analysis were provided to the Board to inform strategy development in this area. WPD has an established customer panel that meets quarterly, with members who represent a wide range of customers and other key stakeholder groups. This enduring, expert engagement plays an important role in challenging our approaches, helping WPD achieve its purpose of delivering good value and high-quality services for its customers. Outcomes and actions The Board spent considerable time discussing the customer viewpoints presented as part of the downstate New York supply analysis together with the report’s findings and consideration of the robustness of the report’s methodology. The Board noted the impact of adverse weather conditions on customers across the network during 2021 and early 2022. Several storms in the UK and the US caused power outages in a number of areas. The Company was able to provide a strong operational response to Storm Henri in New England, due largely to the Company’s investment in Rhode Island infrastructure over the past five years. You can read more about our storm response on page 19, in our business unit updates on pages 50 – 55, and in our Safety & Sustainability Committee report on page 106. To address the challenges of engaging with end customers, who often have little prior knowledge of WPD, an enduring cohort of 96 customers have undergone a programme of research and focus groups over several months, enriching their understanding and ability to offer informed scrutiny of our plans. Stakeholder group – Our customers 57 S trateg ic R ep o rt National Grid plc Annual Report and Accounts 2021/22 15_Our_stakeholders_s172_p56_59_v62.indd 57 27/05/2022 16:55

How we engaged Regular reports relating to interactions with our suppliers were provided to the Group Executive Committee and to the Board. Additional information about specific challenges as they arise, such as those presented by the heightened energy prices in the UK and the related security of supply are included in management reports to the Board to inform discussions. In January 2022, the Safety & Sustainability Committee welcomed external speakers from Quanta Services Inc., a major supplier of infrastructure services to the Group in the US. The Board receives an annual update on the approach taken to address modern slavery risks across our supply chain and the proposed commitments for the following year. Outcomes and actions We strive to work only with businesses that adhere to our Code of Conduct and continue to work closely with our suppliers and peers to share and build upon existing knowledge and promote best practices within the industry. We have worked with Ofgem via the ENA with WPD participation in working groups to facilitate the recovery of Supplier of Last Resort (SoLR) costs for suppliers. In response to developments in the UK gas and energy markets, we established an organisation-level Energy Market Risk Committee to monitor and consolidate the risks and impacts of the current market for reporting to the Board. The Board considers and approves the Company’s Modern Slavery Statement annually. This statement is available at nationalgrid.com/modern-slavery-statement. Stakeholder group – Suppliers and contractors How we engaged We were a principal partner at COP26 in 2021. The Company hosted a number of sessions and events, including the Chief Executive co-hosting the launch of the Green Grids Initiative with the UK government. One of the Board’s aims is to provide positive advocacy for key public policy and regulatory changes in support of net zero. The Chief Executive and other members of senior leadership have met directly with members of the UK and US governments during the year as part of the Company’s ESG outreach to highlight our continuing efforts towards a clean energy transition. In response to the situation in Ukraine, the business has established a Crisis Assessment Team to assess the situation on an ongoing basis and additional Board reporting has been implemented to ensure prompt information flows. The Board advises as to actions that may be undertaken quickly, where appropriate. Outcomes and actions As part of enabling the energy transition for all, the US business established independent New York and New England Advisory Boards to provide objective input and external expertise to US senior leaders. The boards will enable the Company to build on existing relationships while creating new relationships, and advance the Company’s profile as a socially responsible and purpose-led organisation among our stakeholders in the US. The Company was invited and agreed to participate in the Green Grids Initiative’s UK secretariat after COP26. Further information on this and our other COP26 activities is on pages 16, 17 and 69. WPD was the first DNO to develop a Social Contract as a vehicle for delivering social and environmental value for our employees, customers and wider society. Co-created with stakeholders, the Social Contract sets out our ambitions to maximise the positive impact of what we do. Read about our community programmes on page 62. Stakeholder group – Communities, governments and environment How we engaged The Board receives regular updates from the business on regulatory matters. The NY Monitor attended the Company’s Board meeting in June 2021 to engage in discussion with the Directors about the Company’s supplementary report to its Natural Gas Long-Term Capacity Report for Brooklyn, Queens, Staten Island and Long Island (published in 2020). The session covered the culture of the Company’s US business, issues of supply and demand in New York and the need for third-party and regulatory support for innovative change. There was a second meeting with the NY Monitor in September 2021, hosted by a subset of the Directors. The Company seeks to maintain a collaborative relationship with all its regulators. The Board met with Ofgem senior leadership in March 2022. Outcomes and actions During the year, US regulatory matters, the RIIO-ED2 regulatory consultation and our engagement with Ofgem have been considered in depth by the Board. The Board discussed the complexity of the downstate New York supply challenges and confirmed that this would continue to form part of the Board’s agenda in 2022. The Board noted the Company’s engagement with Ofgem on changes to SoLR rules which will improve the viability of suppliers to retail customers. As we work to drive progress towards net zero and a secure energy future, the Company has, and will continue to, consult extensively with Ofgem and BEIS on development and implementation of the FSO. Read more about the ESO on page 52. Stakeholder group – Our regulators 58 National Grid plc Annual Report and Accounts 2021/22 Our stakeholders continued 15_Our_stakeholders_s172_p56_59_v62.indd 58 27/05/2022 16:55

Case study: Strategic portfolio repositioning Section 172 considerations: Likely long-term consequences of decisions The decision to undertake a strategic portfolio pivot, and specifically the three transactions announced during the 2021/22 financial year, considers the long-term sustainable growth profile of the Group as key. The transactions are aligned to our wider ambition to be at the heart of the energy transition. The decision to acquire WPD, the UK’s largest electricity distribution business, increases our exposure to electricity, which is expected to see a high level of asset growth as a part of the UK government’s plans to decarbonise the energy system. Interests of our colleagues The Board has considered the impacts of the integration of WPD on existing and incoming employees and of separation on employees of NECO and GT at every stage. This includes the technological and operational aspects of their work environments and continuity of rewards. The Board oversaw an engagement plan for the integration of WPD employees and the Chief Executive toured key WPD sites in September 2021. The CEO of WPD will lead the UK distribution business as part of the enlarged Group. Fostering business relationships with suppliers, customers and others The Company expects to provide benefits for customers and suppliers as a result of greater interconnectivity of the network following the onboarding of WPD. In conjunction with the NGG Sale, the Company engaged in dialogue with BEIS in relation to the newly implemented National Security and Investment Act 2021 in the UK. Impact on community and environment The Company recognises the importance of WPD to the communities it serves and has announced its intention to maintain the WPD headquarters in Bristol and offices in other key locations. WPD’s community programmes have been maintained and are being integrated into the Group’s wider projects. The strategic portfolio repositioning is aligned to the Group’s wider ESG strategy. For more information see page 74. Maintaining a reputation for high standards of business conduct The Board oversees the process for obtaining the appropriate regulatory approvals required for each of the transactions before they are able to complete. Regular updates on progress were provided to the Board. Need to act fairly between members The Company endeavours to provide investors with clear and transparent reporting on its plans and progress. The Investor Day in 2021 was an opportunity for investors to hear about the Group’s five- year plan and to ask questions of a broad group of business leaders. The Company maintains an investment grade credit rating supporting its sustainable dividend policy. In March 2021, we announced our plan to reposition our portfolio through three strategic transactions: the acquisition of WPD, and the sale of NECO and of a majority stake in NGG. The Board has spent a significant amount of time during the year overseeing the progress of these transactions and considering the ongoing implications for our business and stakeholders. A Transaction Steering Committee (chaired by the Chief Executive) and a Transaction Management Office were established to provide executive-level oversight and a layer of governance over the transaction programmes. Regular reports and updates were provided to the Board on progress, including deep dives and the results of ongoing stakeholder engagement to inform decision-making at all stages. Read more about our strategic portfolio positioning in our Chair’s statement and Chief Executive’s review on pages 10 – 14 and our strategy and risk management for climate change on page 74. The Nemo Link Interconnector that runs between Britain and Belgium powers the Richborough and Canterbury, high-voltage overhead line. 59 S trateg ic R ep o rt National Grid plc Annual Report and Accounts 2021/22

Our RBC focuses our actions on where we can create the most positive impact for society. Responsibility at National Grid Our purpose is to Bring Energy to Life and we do this through the delivery of the electricity and gas that powers our customers and communities, safely, reliably, fairly and affordably, and this is the core of our role as a responsible citizen. It is also vital to focus on how we fulfil our purpose, minimising negative impacts and enhancing our overall contribution to society. We published our RBC in October 2020 and the commitments we made then remain the foundation of our activity. The RBC contains a series of commitments under five headings: the environment, our communities, our colleagues, the economy and our governance. These commitments are now built into business plans and performance against each commitment is regularly reviewed. During 2021/22, we received external validation from the SBTI for our National Grid Group interim GHG reduction targets, aligned to a ‘Well below 2°C’ pathway. Alongside this, we have undertaken a programme to release value from unclaimed shares over 12 years old and will explore ways to use this value to enhance our community investment programmes. Our approach to reporting We have published our second separate RBR for 2021/22, which has been guided by internationally recognised reporting standards. The RBR contains information relating to our material focus areas and provides detail on our management approach, performance and the new commitments set out in the RBC. Certain metrics are subject to independent external assurance. Our performance data is subject to different levels of assurance, including external (limited) assurance for key metrics, and a reporting process and controls review by National Grid’s Finance second line risk and controls team. This section of our Annual Report provides a high-level summary of our approach to responsible business and meets regulatory requirements with regard to certain responsible business-related topics. Except where expressly stated or clear from the context, the data in this section does not include WPD data. You can find the RBR and RBC here: nationalgrid.com/responsibility The environment While continuing to manage our environmental performance responsibly, we have emphasised the need to facilitate the transition to a clean energy system, to achieve net zero by 2050 for our Scope 1 and 2 emissions, dramatically reduce our Scope 3 emissions and continue to improve the biodiversity of land that we own. Our governance We will hold ourselves accountable on these commitments and ensure that stakeholder voices continue to be heard at the highest level, and that they influence our approach. We will ensure we maintain the highest standards of ethical conduct. Our people While continuing to ensure our people are kept safe and healthy, and that work conditions meet their expectations, we are stepping up our efforts in relation to diversity and inclusion – focusing on fairness in pay and opportunity, transparency and training around issues of gender and ethnicity. The economy We are continuing to develop our infrastructure, invest in innovation that benefits our customers and wider society, and pay the right tax, as well as working to influence our supply chain to focus on diversity and responsible behaviour. Our communities While continuing to place public safety and network reliability and resilience as top priorities, we are focusing in particular on the affordability and fairness of our service to the community and developing the skills of young people from some of the more deprived communities where we operate to help us in the clean energy transition. Material issues for Global Reporting Initiative (GRI) reporting purposes Our governance • Board representation and role • Stakeholder engagement • Emerging risks • Skills for the future on the Board • Transparency and reporting • Culture • Ethics and human rights • Compliance Our people • Social mobility • Diversity, equity and inclusion • Fair pay • Employee rights • Employee health and safety • Mental health and wellbeing • Purpose, values and culture The economy • Right tax • Fair return • Investment (long-term and local) • Green financing • Supplier prompt payment • Supply chain engagement Our communities • Affordability • Community engagement • Science, technology, engineering and mathematics (STEM) education • Workforce development • Network reliability • Customer satisfaction • Cyber security • Public safety • Connectivity The environment • Enabling a clean energy system • Our own emissions • Air quality • Land use • Water • Circular economy • Habitat and biodiversity • The energy transition 60 National Grid plc Annual Report and Accounts 2021/22 Our commitment to being a responsible business 16_Our_commitment_to_responsible_business_p60_69_v117.indd 60 27/05/2022 16:58

61 S trateg ic R ep o rt National Grid plc Annual Report and Accounts 2021/22 Our approach to managing responsible business matters Our overall approach to responsible business can be summarised as: • identifying our key stakeholders, understanding how they interact with our operations, activities and value chain, and the issues that are relevant to them; • adopting a logical process for prioritising those issues, to identify the most material matters; and • responding to the priorities by developing appropriate strategies, policies, programmes, targets and performance indicators, and reporting regularly and transparently on our progress. In establishing our priorities, we are also guided by recognised frameworks such as the United Nations Global Compact Principles and Sustainable Development Goals. Over the years, we have developed a series of processes and policies to ensure we manage responsibility issues effectively. Descriptions of the policies and the outcomes pursued in relation to the matters listed on page 60 are discussed, where material, throughout this section and our RBR. A full list of our policies, and our Code of Ethics, can be found online, at nationalgrid.com/about-us/corporate-governance. Assurance We engaged PricewaterhouseCoopers LLP (PwC) to undertake a limited assurance engagement for 2021/22 data only, using the International Standard on Assurance Engagements (ISAE) 3000 (Revised): ‘Assurance Engagements Other Than Audits or Reviews of Historical Financial Information’ and ISAE 3410: ‘Assurance Engagements on Greenhouse Gas Statements’. PwC have provided an unqualified opinion in relation to the 2021/22 KPIs and other data that are identified with the symbol and feature on page 1, pages 26 − 27, page 68 and page 83. Details of PwC’s full limited assurance opinion and National Grid’s Reporting Methodology are set out in the RBR. Data that has been assured by PwC is identified with the symbol . Non-financial information This section provides information as required by regulation in relation to: Social matters – pages 15 – 19; and – page 62 Environmental matters – pages 15 – 19; and – pages 67 – 83; Business model – pages 4 – 7 Human rights – page 64 and page 263 Principal risks – pages 28 – 32 Our employees – pages 21 − 22 – page 27 – pages 50 – 55 – pages 65 – 66 – page 95 – 96 KPIs – pages 24 – 27 Anti-corruption and anti-bribery – page 63 – 64 (see also pages 101 – 105) Audit & Risk Committee report (our due diligence) – pages 101 – 105 People & Governance Committee – pages 99 – 100 Our stakeholders – pages 56 – 59 Safety & Sustainability Committee – page 106 In addition, other information describing the business relationships, products and services which are likely to cause adverse impacts in relation to the matters above can be found as follows: 16_Our_commitment_to_responsible_business_p60_69_v117.indd 61 27/05/2022 16:58

We go beyond our role in delivering safe, reliable energy for our communities so that everyone can play a role in an affordable energy transition. Our commitments Progress in 2021/22 Status We will deliver sustainable energy reliably. We’re committed to making sure our systems are resilient and can play a leading role in disaster recovery UK ET – 99.99993% US ET – 99.95894% US ED – 99.93472% Our networks continue to run at a high level of reliability Provide access to skills development for 45,000 people by 2030, particularly lower-income communities 5,233 people (cumulative since 2020/21) 3,972 people 2021/22 only Our skills programmes have continued at a lower level through COVID-19 Deliver energy in a fair and affordable way to the communities we serve We invested £18.3 million during 2021/22 to support communities affected by COVID-19 and recent rises in energy prices We are investing more in community support for COVID-19 and rising energy prices An energy transition for all The technological and environmental benefits of the clean energy transition should benefit everyone, and we will play our role in ensuring that no one is left behind. A fully decarbonised transportation infrastructure, for example, should be accessible by everyone across the communities we serve. Part of this role includes protecting and supporting vulnerable customers. In the US, we do this through low-income programmes and energy-efficiency programmes. In the UK, in 2017, we established a £150 million Warm Homes Fund designed to support local authorities and others in helping approximately 50,000 households suffering from fuel poverty. During 2021/22, this fund has helped the Fuel Bank Foundation to provide crisis support. We are also supporting Citizens Advice in its work to support those struggling with the rising cost of living, including energy bills. In 2020, we also launched the Green Light Signal, a smart light bulb that turns green when electricity in your region is more than 50% low carbon. The bulb and new WhenToPlugIn app are designed to engage customers and communities in the transition to low carbon and build understanding of progress. Benefiting communities We are supporting opportunity and growth in our communities. We launched Grid for Good in 2020 to achieve social mobility for disconnected young people in the communities we serve. This year the programme has supported 3,972 young people, helping to inspire and develop the skills needed for net zero. In the UK, we support communities affected by our infrastructure “ We have released significant new funds into our community investment programme.” projects, where grants are available for local projects that bring social, economic or environmental benefits. In addition, as part of capital delivery projects, we work with third-party organisations to provide community benefits at scale. In the US, we support the National Grid Foundation, a non-profit charitable organisation. The Foundation awards grants to non-profit organisations focused on educational and environmental challenges. The Foundation currently disburses nearly $4 million a year; for 2021, this was $3.77 million. In 2021/22, we launched Project C for our community to promote and develop our community programmes in New York State. Across Massachusetts, New York and Rhode Island, we provided total funding of approximately $12 million a year through centrally-led programmes in support of charitable organisations. During the year, we recorded over 23,416 hours volunteered by our colleagues in support of a variety of causes. As we come out of COVID-19 restrictions, we will need to grow our programmes to meet our 2030 commitment of 500,000 hours. Engaging with our communities We seek regular feedback from our customers and communities and act to improve performance. Our approach has been to go beyond providing the safe, resilient energy systems society expects, and work to ensure our economic and social role has the greatest possible impact. This involves developing infrastructure such as our work in East Anglia and helping consumers use energy more efficiently. Our WhenToPlugIn app in the UK informs consumers when the electricity in their homes is coming from clean and green energy sources. We also partner with charity organisations such as Trussell Trust and Red Cross and encourage employees to volunteer in the community. 1,167 National Grid employees have registered to volunteer their time to support our Grid for Good programme. 62 National Grid plc Annual Report and Accounts 2021/22 Our communities Our commitment to being a responsible business continued 16_Our_commitment_to_responsible_business_p60_69_v117.indd 62 27/05/2022 16:58
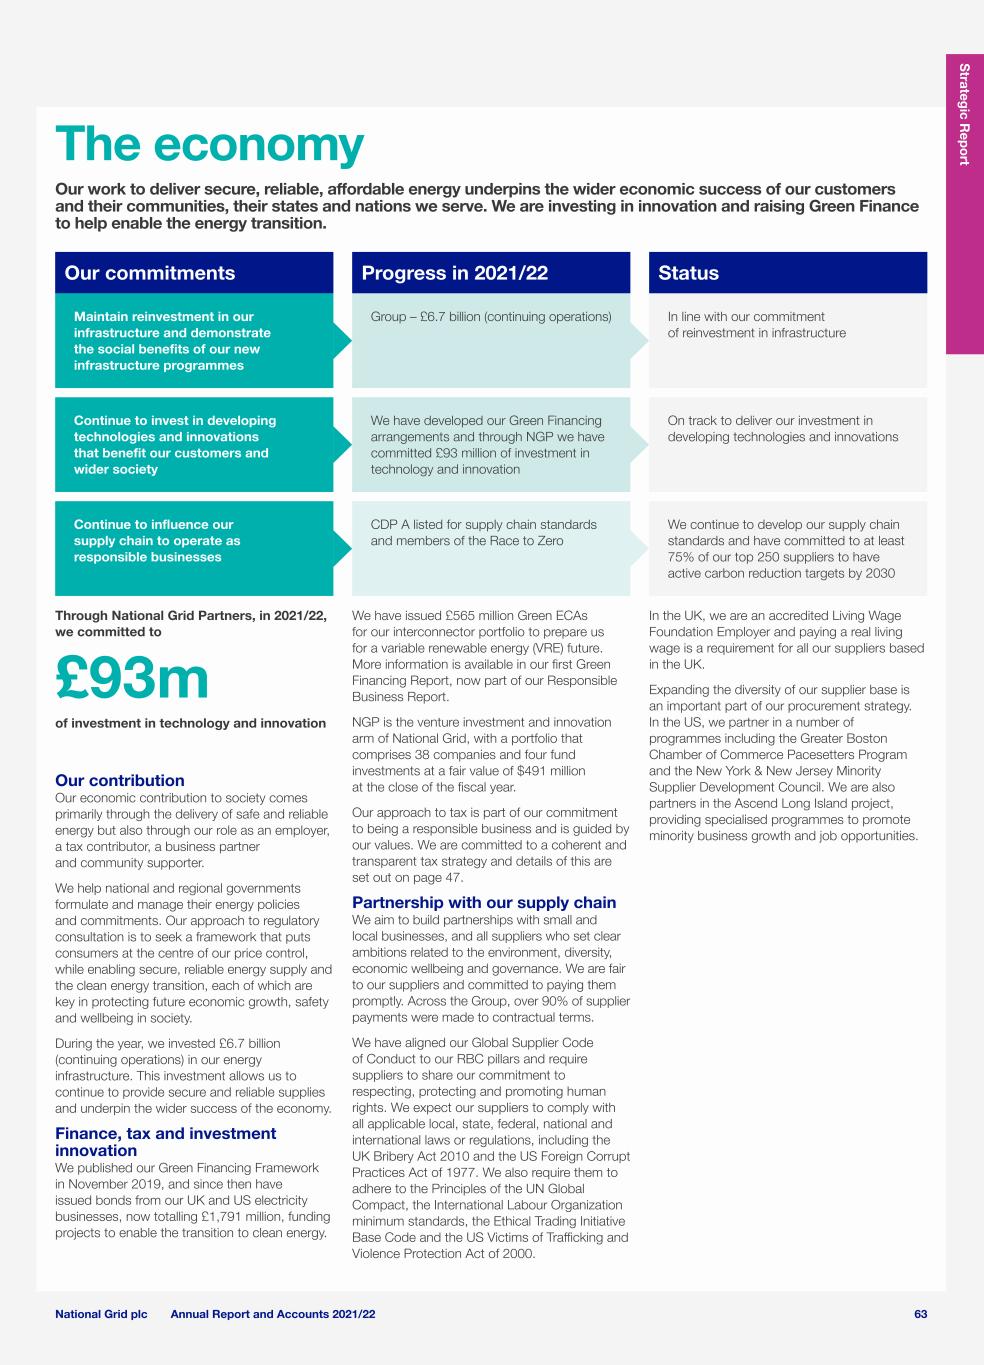
Our work to deliver secure, reliable, affordable energy underpins the wider economic success of our customers and their communities, their states and nations we serve. We are investing in innovation and raising Green Finance to help enable the energy transition. Our commitments Progress in 2021/22 Status Maintain reinvestment in our infrastructure and demonstrate the social benefits of our new infrastructure programmes Group – £6.7 billion (continuing operations) In line with our commitment of reinvestment in infrastructure Continue to invest in developing technologies and innovations that benefit our customers and wider society We have developed our Green Financing arrangements and through NGP we have committed £93 million of investment in technology and innovation On track to deliver our investment in developing technologies and innovations Continue to influence our supply chain to operate as responsible businesses CDP A listed for supply chain standards and members of the Race to Zero We continue to develop our supply chain standards and have committed to at least 75% of our top 250 suppliers to have active carbon reduction targets by 2030 We have issued £565 million Green ECAs for our interconnector portfolio to prepare us for a variable renewable energy (VRE) future. More information is available in our first Green Financing Report, now part of our Responsible Business Report. NGP is the venture investment and innovation arm of National Grid, with a portfolio that comprises 38 companies and four fund investments at a fair value of $491 million at the close of the fiscal year. Our approach to tax is part of our commitment to being a responsible business and is guided by our values. We are committed to a coherent and transparent tax strategy and details of this are set out on page 47. Partnership with our supply chain We aim to build partnerships with small and local businesses, and all suppliers who set clear ambitions related to the environment, diversity, economic wellbeing and governance. We are fair to our suppliers and committed to paying them promptly. Across the Group, over 90% of supplier payments were made to contractual terms. We have aligned our Global Supplier Code of Conduct to our RBC pillars and require suppliers to share our commitment to respecting, protecting and promoting human rights. We expect our suppliers to comply with all applicable local, state, federal, national and international laws or regulations, including the UK Bribery Act 2010 and the US Foreign Corrupt Practices Act of 1977. We also require them to adhere to the Principles of the UN Global Compact, the International Labour Organization minimum standards, the Ethical Trading Initiative Base Code and the US Victims of Trafficking and Violence Protection Act of 2000. Through National Grid Partners, in 2021/22, we committed to £93m of investment in technology and innovation Our contribution Our economic contribution to society comes primarily through the delivery of safe and reliable energy but also through our role as an employer, a tax contributor, a business partner and community supporter. We help national and regional governments formulate and manage their energy policies and commitments. Our approach to regulatory consultation is to seek a framework that puts consumers at the centre of our price control, while enabling secure, reliable energy supply and the clean energy transition, each of which are key in protecting future economic growth, safety and wellbeing in society. During the year, we invested £6.7 billion (continuing operations) in our energy infrastructure. This investment allows us to continue to provide secure and reliable supplies and underpin the wider success of the economy. Finance, tax and investment innovation We published our Green Financing Framework in November 2019, and since then have issued bonds from our UK and US electricity businesses, now totalling £1,791 million, funding projects to enable the transition to clean energy. In the UK, we are an accredited Living Wage Foundation Employer and paying a real living wage is a requirement for all our suppliers based in the UK. Expanding the diversity of our supplier base is an important part of our procurement strategy. In the US, we partner in a number of programmes including the Greater Boston Chamber of Commerce Pacesetters Program and the New York & New Jersey Minority Supplier Development Council. We are also partners in the Ascend Long Island project, providing specialised programmes to promote minority business growth and job opportunities. 63 S trateg ic R ep o rt National Grid plc Annual Report and Accounts 2021/22 The economy 16_Our_commitment_to_responsible_business_p60_69_v117.indd 63 27/05/2022 16:58

Adopting the right approach to governance and the highest ethical standards is critical to the success of our business. Our commitments Progress in 2021/22 Status Continue to review and adapt our policies to reflect and support our responsible business commitments and ambitions Appointment of a Chief Sustainability Officer, joining our Chief Diversity Officer. All RBR commitments embedded into business planning and targets In 2021/22 we have moved our governance to better reflect our RBC priorities Continually review the Company culture to ensure it is inclusive Purpose has moved to be the most important cultural aspect in our annual leadership culture survey In 2021/22 purpose has moved to be at the heart of how we do business Commitment to a Group Executive Committee diversity ratio of 50% and ambition to achieve the same for Board diversity The diversity of our Board is now 53.8%, Group Executive Committee diversity is 53.8%, and the diversity of our Senior Leadership Group is 49.5% We have made positive progress in achieving diversity at Board level and good progress on diversity at senior leader level Stakeholder engagement We prioritise our responsibilities to our different but interrelated stakeholder groups and are careful to ensure we understand the interests of our stakeholders and reflect them in our decisions. Stakeholder engagement plays an important role in how our Board ensures responsibility in governance. This includes listening to our stakeholders’ views, inviting external guests to meetings, and using independent research to bring the voice of the customer and other stakeholders into the Boardroom. Highest ethical standards – ethical business conduct We regard the potential for bribery and corruption as a significant risk to the business and have established policies and governance that set and monitor our approach to preventing financial crimes, fraud, bribery and corruption, including our Code of Ethics (covering anti-bribery and anti-corruption). We have a Company-wide framework of controls designed to prevent and detect bribery. Our Code sets out the standards and behaviours we expect from all employees to meet our values of ‘do the right thing’, ‘find a better way’ and ‘make it happen’. Our Group Ethics, Risk and Compliance Committee oversees the Code of Ethics and associated awareness programmes. We issue this Code and operate an e-learning course for all colleagues so they adequately understand our zero-tolerance approach. We also have an Anti-Financial Crimes policy that applies to all colleagues and those working on our behalf. It sets out our zero-tolerance approach to bribery, fraud, money laundering, tax evasion and other corrupt business practices. To ensure compliance with the UK Bribery Act 2010 and other relevant legislation, we operate an anti-financial crime risk assessment process across the Company and ensure adequate procedures are in place. Any cases alleging bribery are referred immediately to the relevant ECC so the members can satisfy themselves that cases are managed effectively, including ensuring any lessons learnt are communicated across the business. We investigate all allegations of ethical misconduct thoroughly, take corrective action and share lessons learnt. We also record trends and metrics relating to such allegations. Each business function is required to consider its specific risks and maintain a compliance framework, setting out the controls it has in place to detect and prevent bribery. Business areas self-assess the effectiveness of controls and provide evidence that supports reported compliance. Each year, all function heads are asked to certify the compliance in their area, and to provide details of any exceptions. This culminates in the presentation of a Certificate of Assurance from the Chief Executive to the Board (following consideration by the Audit & Risk Committee). You can read more about the Audit & Risk Committee’s role, including its ongoing assessment of the adequacy of our anti-bribery and anti-corruption policies and processes, on pages 101 – 105. In New York, we were the victim of criminal activity where former employees circumvented controls to commit fraud in the procurement of DNY Facilities work. We engaged professional consultants to perform a comprehensive review of our control framework. Whilst our procurement controls were found to be effective, we are implementing recommendations to make improvements to our control framework and Ethics and Business Conduct Program. Highest ethical standards – human rights Respect for human rights is incorporated into our employment practices, and values, and is integral to our Code of Ethics. This is vital in maintaining our reputation as a company our stakeholders want to do business with, and our employees want to work for. Although we do not have specific policies relating to human rights, slavery or human trafficking, we cover these issues through related policies and procedures such as our approach to diversity, anti-discrimination, privacy, equal opportunity and, in addition, our Global Supplier Code of Conduct integrates human rights into the way we screen and interact with our supply chain. Whistleblowing We have a confidential internal helpline, and an external ‘Speak-Up’ helpline available at all times in all the regions where we operate. We publicise the contact information to our colleagues and on our external website so concerns can be reported anonymously. Our policies make it clear that we will support and protect whistleblowers and not tolerate any form of retaliation. 64 National Grid plc Annual Report and Accounts 2021/22 Our governance Our commitment to being a responsible business continued 16_Our_commitment_to_responsible_business_p60_69_v117.indd 64 27/05/2022 16:58

Our colleagues are vital to our business and we strive to be the employer of choice, attracting a diverse range of highly skilled people who feel they can be themselves at work. Our commitments Progress in 2021/22 Status Be as transparent as possible internally and externally on gender and ethnicity/race We have begun internal reporting on a much wider range of diversity metrics, to underpin our commitment to diversity ON TRACK – Following launch of internal reporting, we expect further granularity of external data over the next 2 years Achieve 50% diversity in our Senior Leadership Group and new talent programmes by 2025 Our Senior Leadership Group diversity is 49.5% and new talent programmes are at 55.6% We have made steady progress on diversity of these key groups and we expect to achieve target ahead of 2025 Grid:voice engagement score 81% (2020/21: 81%) Safe to say ‘yes’ index in Grid:voice 73% (2020/21: 67%) “ Our employee engagement score has stayed consistent.” Leaders who model change • Leaders are responsible for change and encourage colleagues to make decisions and take responsibility. • Measured feedback for all leaders to adjust and align behaviour and increase accountability. • Leaders act safely, inclusively and with integrity. Develop a results-orientated and purpose-driven mindset • Greater accountability. • Improve success for our customers and continue to improve efficiency. • Embrace bold thinking and new ideas. • One team, focused on finding solutions. Our values are at the heart of everything we do • Colleagues are recognised for living our values. • Encourage storytelling of how we are changing; encouraging colleagues to speak up where people are not living our values. • Our values are instilled into our people, processes, policies and ways of working. Our culture Our values Do the right thing Find a better way Make it happen Reflecting the communities we serve Diversity is central to our business at every level of operation and we want our Board and Group Executive Committee to reflect the communities we serve. Our Board diversity is now 53.8% and our Group Executive Committee diversity is 53.8%. We also measure the diversity of our Senior Leadership Group¹, to indicate the diversity of internal progression potential to the executive level. The diversity of this group is 49.5%, which we consider positive for a technical or engineering organisation, but we will not consider ourselves sufficiently diverse as an organisation until we reflect our customers and the communities we serve. 1. Senior Leadership Group: this includes the Group Executive Committee members and the c.110 senior colleagues in the Company. Please note, this differs from the definition of senior management which includes both senior colleagues and subsidiary directors. 65 S trateg ic R ep o rt National Grid plc Annual Report and Accounts 2021/22 Our people 16_Our_commitment_to_responsible_business_p60_69_v117.indd 65 27/05/2022 16:58

Engaging our colleagues We rely on our colleagues to achieve success for the business. We aim to attract and retain the best people by striving to be recognised as an employer of choice that values diversity. We work towards going beyond the main aspects of the employer-employee relationship, to create a culture focused on the value we can add to society. Colleague and contractor safety and wellbeing We have a fundamental duty of care to ensure our colleagues are kept safe at work, and that their health is not affected as a result of their employment. The health, safety and wellbeing of employees and contractors is our primary concern. Any safety incident is one too many, and we work to improve our performance through effective policies, standards, procedures and training. We measure safety performance through a combination of leading and lagging indicators, and LTIFR is one of the core KPIs of the business (see page 27). We take a proactive, risk-based approach to managing health and wellbeing, and have documented standards relating to occupational health and safety, process safety, and wellbeing and health. Incidents are reported to the highest level, and the Safety & Sustainability Committee of the Board undertakes regular deep dives on safety-related topics (see page 106). Living wage and gender pay gap We believe everyone should be appropriately rewarded for their time and effort. In the UK, we are accredited by the Living Wage Foundation, a commitment which extends to our contractors and the work they do on our behalf. We also go above the Living Wage requirements and voluntarily pay our trainees the Living Wage. We undertake a Living Wage review each year to ensure continued alignment and increase individual salaries as required, and also promote the commitment to our suppliers. We review gender and ethnicity pay gaps annually in both the UK and US, and further information is provided in the RBR. Promoting an inclusive and diverse workforce Our policy is that people who identify as having a disability should be given full and fair consideration for all vacancies against the requirements for the role. Where possible, we make reasonable accommodations and provide additional resources for employees who identify as having a disability. We are committed to equal opportunity in recruitment, training, promotion and career development for all colleagues, including those with disabilities. The gender demographic table on the right shows the breakdown in numbers of employees by gender at different levels of the organisation. We have included information relating to subsidiary directors, in accordance with the Companies Act 2006 (Strategic Report and Directors’ Report) Regulations 2013. ‘Senior management’ is defined as those managers who are at the same level, or one level below, the Group Executive Committee. It also includes those who are Directors of subsidiaries, or who have responsibility for planning, directing or controlling the activities of the Group, or a strategically significant part of the Group, and are employees of the Group. For further, more-detailed information relating to our Gender demographic as at 31 March 2022 Our Board1 Senior management2 Whole Company3 Male 7 110 23,639 Female 6 58 7,117 Total 13 168 30,7564 Male (%) 53.8% 65.5% 76.9% Female (%) 46.2% 34.5% 23.1% 1. ‘Board’ refers to members as defined on the Company website. 2. ‘Senior management’ refers to subsidiary Directors as well as the Senior Leadership Group. 3. In scope are active, permanent employees. Band A-F, Staff, Union, Schemes & Expats, NG Renewables, WPD. 4. Total Company Headcount includes UK GT and metering and varies from RBR due to WPD employees shown separately in RBR but included in Annual Report. approach and performance on gender and ethnic diversity, please see our RBR. We continue to be recognised in awards and benchmarks including being listed Outstanding Employer for Race at the UK Ethnicity Awards, recognised in the top 10 for Company and Diversity Team of the Year at the British Diversity Awards and moved from 480 to 187 in the Financial Times special report on Diversity Leaders. We have close partnerships with external best practice organisations and are active members of sector- and industry-wide groups that ensure we are sharing best practice and campaigning at a sector-wide level for greater inclusion for all. In March 2022, a group of National Grid leaders volunteered at Mudchute Park and Farm, a community charity set in 32 acres of countryside in the Isle of Dogs, London. Mudchute runs a working farm, stables and educational activities – giving under-privileged and under-represented communities in East London the chance to learn and play in a safe, natural setting. It receives a small grant but relies on volunteers and fundraising, so has struggled to cover the costs of animal care and the services it runs during the pandemic. Working in teams and encouraged by TV presenter Tommy Walsh – a keen supporter of the charity – our leaders transformed a wild stretch of ground into an attractive wooded garden in just a few hours. They cleared weeds, built features to attract bees, insects and pondlife, laid paths, erected raised beds, planted flowers and fruit saplings, and repaired and painted a playhouse. Their work leaves a legacy that will make a difference to hundreds of local school children and others in the neighbourhood for years to come. National Grid has committed to continue its support for the charity and provide opportunities for colleagues to return to undertake further work. Case study: Community action in East London Volunteering work at Mudchute Park and Farm, East London, UK 66 National Grid plc Annual Report and Accounts 2021/22 Our commitment to being a responsible business continued 16_Our_commitment_to_responsible_business_p60_69_v117.indd 66 27/05/2022 16:58

We are at the heart of the transition to net zero for our customers and the communities we serve, enabling the renewable and low-carbon energy supply and reducing emissions from our own emissions to net zero by 2050. Our commitments Progress in 2021/22 Status We will reduce Scope 1 and 2 greenhouse gas (GHG) emissions 80% by 2030, 90% by 2040 and net zero by 2050 from a 1990 baseline Connection of renewables and low- carbon supplies continues but for 2021/22 this reduction is outweighed by growth in LIPA emissions ON TRACK – Our long-term plan to reduce emissions despite additional running of generation under contract with LIPA We will reduce Scope 3 GHG emissions by 37.5% by 2034 from a 2019 baseline Recovery of gas demand post-COVID-19 has led to a short-term return of emissions, rising back to historical pre-COVID-19 levels ON TRACK – We are developing a long-term plan to drive down emissions in line with our 2034 targets and we have announced our vision in the US to fully eliminate fossil fuels from both our gas and electric systems by 2050, if not sooner We will reduce SF6 emissions from our operations by 50% by 2030, from a 2019 baseline During 2021/22 we reduced emissions through leakage reduction and announced a further important partnership with Hitachi to deliver a retrofit gas replacement for SF6 ON TRACK – Our work remains in line with our long-term plan to reduce emissions through leakage and then innovate with partners to find a lower emissions alternative We will move to a 100% electric fleet by 2030 for our light-duty vehicles We have joined EV100 to support the wider campaign to electrify, and launched a partnership with Ford for light trucks ON TRACK – New programmes on light trucks and electric-only fleet choices to help achieve this commitment We will reduce energy consumption in our offices by 20% by 2030 72% reduction in energy consumption against our 2020 baseline ON TRACK – We have a number of schemes in the pipeline to make our buildings more efficient We will improve the natural environment by 10% on the land we own by 2030 We have remediated 21.6 hectares of land in 2021/22 ON TRACK – With programmes delivering improvement to the natural environment ahead of 2030 We will achieve zero-carbon emissions from business air travel We have delivered this commitment with a significant reduction in air travel due to COVID-19 and all remaining travel has been offset ACHIEVED – We will continue to restrict air travel to below 50% of pre-2019 levels to maintain our commitments in the RBR Energy consumption Our energy consumption is a key area of focus as this, in turn, affects our carbon emissions. Our energy consumption consists of both fuel consumed and energy purchased from third parties, including renewable energy. Total energy consumption was 3,502 GWh (12,606,859 Gigajoules), an increase of 12% on the previous year. Of this, 99% was from non-renewable sources, with no significant change from the previous year. Total energy consumption in the UK was 2,341 GWh and total energy consumption in the US was 1,161 GWh. Operational energy use was 1,190 GWh (2020/21; 1,748 GWh), our transport energy use was 362 GWh (2020/21; 369 GWh), electricity consumption was 987 GWh (2020/21; 852 GWh) and heating was 163 GWh (2020/21; 156 GWh). Electricity consumption includes the energy consumed in operating the generation assets in the US. Total energy does not include fuels consumed for power generation on behalf of LIPA, the contracting body, amounting to 19,610 GWh (net of energy required to operate the generation assets), a 21% increase on the prior year. Energy consumption related to power generation can vary greatly year-on-year and is determined by LIPA. We therefore report an energy consumption figure net of power generation allowing us to report underlying energy consumption across our business. For transparency, we have reported energy consumption from power generation as a separate line item. Transport covers company car business travel, and our own operational ground and aviation fleet. In addition to energy consumed, we calculate that system losses accounted for a further 11,117 GWh, of which 51% occurred in the US. This was a 0.3% decrease on the previous year. Note: 2020/21 energy consumption has been re-stated to account for a minor misstatement following data reconciliation. 67 S trateg ic R ep o rt National Grid plc Annual Report and Accounts 2021/22 The environment 16_Our_commitment_to_responsible_business_p60_69_v117.indd 67 27/05/2022 16:58

We are working to reduce our business travel emissions by changing to alternative fuel vehicles and reducing business flights. The response required by the COVID-19 pandemic has resulted in more flexible ways of working and has reduced business travel. We will reduce the energy consumed in our buildings and procure green energy where possible. Our Scope 1 emissions were 5.3 mtCO2e, a 12% increase on the prior year (4.7 mtCO2e). Of this, 89% arose in the US and 11% in the UK. The increase resulted mainly from generation emissions exceeding projected levels due to increased LIPA operating hours, required to replace shortfalls in off-island generation and transmission. Scope 2 emissions are reported on a market and location basis: • market based – 2.2 mtCO2e, similar to the prior year • location based – 2.2 mtCO2e, similar to the prior year Approximately 57% of Scope 2 emissions (location basis) were generated in the UK, with the remainder through US operations. Reduction in Scope 2 emissions was mainly due to a reduction in emissions from line losses, resulting from a reduction in grid electricity carbon intensity. We generate GHG emissions across Scope 1 (direct emissions from our operational activities), Scope 2 (indirect emissions from our purchase and use of gas and electricity) and Scope 3 (other indirect emissions from activities and sources outside of our ownership or control). Our RBC sets out a number of ambitious climate-related commitments, the most significant of which is to achieve net zero by 2050. Through this commitment we will reduce Scope 1 and 2 emissions by 80% by 2030, 90% by 2040, and net zero by 2050, from a 1990 baseline. At the end of 2021/22, we have achieved a 65% reduction. Our Scope 3 target covers emissions across our entire value chain with a commitment to reduce the carbon emissions by 37.5% by financial year 2034 (from a financial year 2019 baseline). Our interim Scope 1, 2 and 3 emission reduction targets are validated by the SBTi, demonstrating a clear, credible commitment to achieve our longer-term net zero strategy in line with a well below 2°C pathway. Other commitments, including those relating to reductions in SF6 emissions and increasing the proportion of EVs in our own fleet, are set out in the RBC. We will publish our Climate Transition Plan in June 2022 as part of the RBR. Our total Scope 3 emissions are calculated as 30.1 mtCO2e for the year, an increase of 4% on the prior year. We measure and report in accordance with the World Resources Institute and World Business Council for Sustainable Development Greenhouse Gas Protocol. 100% of our Scope 1, 2 and 3 emissions are independently assured against ISAE 3410 Assurance Engagements on Greenhouse Gas Statements, using an ‘Operational Control’ approach to determine our GHG emissions organisational boundary. The sources of Scope 1, 2 and 3 emissions are detailed in the RBR. We have also published a document, ‘Our Reporting Methodology’, which details the methodologies and protocols used for calculating key responsible business metrics. Further reading page 26 68 National Grid plc Annual Report and Accounts 2021/22 Climate change Streamlined Energy and Carbon Reporting (SECR) mtCO2e 2021/22 2020/21 Scope 1 (direct emissions) 5.3 4.7 Scope 2 (direct emissions) Market based 2.2 2.3 Location based 2.2 2.2 Total Scope 3 emissions 30.1 28.9 US Cat 3 (fuel and energy related activities) 4.3 4.1 US Cat 11 (use of sold products) 18.9 18.2 UK and US Cat 1 (purchased goods and services) 6.7 6.6 UK and US Cat 7 (employee commuting) 5 5 UK and US Cat 6 (business travel) 11 6 UK & US Cat 5 (waste generated in operations) 7 6 Our commitment to being a responsible business continued 16_Our_commitment_to_responsible_business_p60_69_v117.indd 68 27/05/2022 16:58

As part of our principal partner role for COP26, we supported the UK government in developing a new international partnership, the Green Grids Initiative. The first programme of this initiative, a new UK-India initiative was launched at COP26, with the CEO attending the launch alongside the Prime Minister of the UK, Boris Johnson, and the Prime Minister of India, His Excellency Shri Narendra Modi, and Director General of the International Solar Alliance, Dr Ajay Mathur. The programme, which is also supported by the US government, aims to share lessons and expertise between the two countries and, in doing so, accelerate international decarbonisation efforts. We are providing personnel and expertise to support the programme. This initiative forms part of a number of programmes launched or supported by the UK COP26 presidency. We have also supported engagements with Indonesia, South Africa, Vietnam and Laos as part of our principal partnership of COP26, sharing lessons and expertise with peer utilities and energy ministries in those countries to build confidence in the path to net zero. Case study: COP26 activities – Green Grids Initiative Case study: Green Light Signal and EV Road Trip As we connect low-carbon power to our electricity networks we are creating the means to decarbonise much of the economy, including power, transport, industry and some heat. Engaging our customers and communities in the transition to net zero is key to building confidence and understanding of the transition to net zero. As part of our engagement, our customers and communities told us they were not sure how green their power was today and whether the transition would happen. So we wanted to show them. To show customers and communities how things were changing, in the UK we created a smart light bulb that turns green when the local power is low carbon, and in the US we created a number of EV Road Trips, to help build confidence in the transition to EVs. The Green Light Signal and associated ‘WhenToPlugIn’ app featured in UK national media, saw thousands of downloads, lit up 10 Downing Street ahead of COP26, and won a Bronze award at the Eurobest advertising awards. Our EV Road Trip received over 2 million impressions on social media and positive coverage from a range of stakeholders and the media. Right to left: National Grid CEO, John Pettigrew; UK Prime Minister, Boris Johnson; Indian Prime Minister, Shri Narendra Modi; and Director General of the International Solar Alliance, Dr Ajay Mathur – at the launch of the Green Grids Initiative, ‘One Sun One World One Grid’ at COP26 The EV Road Trip, took place in 2021, covering New York, Massachusetts and Rhode Island Green Light Signal, a smart bulb that glows green when the local power is low carbon 69 S trateg ic R ep o rt National Grid plc Annual Report and Accounts 2021/22 16_Our_commitment_to_responsible_business_p60_69_v117.indd 69 27/05/2022 16:59

Climate change is the defining challenge of the 21st century and in our role as The Energy Transition Company we understand the critical role we need to play in navigating the change and uncertainty facing the economies we serve in reaching their carbon reduction targets. That change and uncertainty presents significant risks and opportunities to our business model that we manage with the due focus and attention required to enable the positive, responsible change needed by all of our stakeholders. We are committed to developing a business model that is consistent with the objectives of the Paris Agreement, and therefore set a commitment in November 2019 to reduce our Scope 1 and 2 emissions to net zero by 2050. The details of the interim targets that we have set to achieve this are included in our RBC that we published in October 2020. This includes approved science-based targets for Scope 1, 2 and 3 emissions across our Group. This year sees the second iteration of our RBR which details our progress against all commitments set out in our RBC, including our emissions reduction targets. In this year’s disclosure we have fully complied with the FCA listing rule LR 9.8.6R(b). Our climate-related financial disclosures are considered to be consistent with the TCFD’s recommendations and recommended disclosures. Please see the index on page 71 for where we respond to each recommendation and recommended disclosure. In reaching full compliance this year, we have refreshed our energy transition scenarios and completed the first stage of our comprehensive Group-wide assessment into the physical risks facing the Group under 2°C and 4°C scenarios, with the outcomes detailed in this disclosure. We have also published our first Climate Transition Plan, which provides greater detail and clarity on how we will achieve our emissions reduction targets. Development of a best-in-class Climate Change Risk Tool to assess the physical impacts from climate change scenarios Acquisition of WPD which completes the pivot of our UK business towards electricity Specific science-based targets aligned to a 1.5 degree pathway for our UK Electricity Transmission and UK Electricity System Operator businesses Publication of provisional EU Taxonomy aligned KPIs, including our forecast EU Taxonomy aligned capital expenditure for the next five years CDP Climate A rating for 6th year in a row Continued development of our net zero strategy Principal partner for COP26 climate change conference Increased alignment of Executive remuneration to climate reduction targets Highlights of the year Crocker Wind Farm, National Grid Renewables, South Dakota, US 70 National Grid plc Annual Report and Accounts 2021/22 Task Force on Climate-related Financial Disclosures

Governance Disclose the organisations governance around climate-related risks and opportunities a) Describe the board’s oversight of climate-related risks and opportunities: page 72 – ‘Governance of climate-related risks and opportunities’ b) Describe management’s role in assessing and managing climate- related risks and opportunities: page 73 – ‘Management’s role’ Strategy Disclose the actual and potential impacts of climate-related risks and opportunities on the organisation’s businesses, strategy and financial planning where such information is material a) Describe the climate-related risks and opportunities the organisation has identified over the short, medium, and long term: page 79 – ‘Our significant climate-related risks and opportunities and our strategic response’ b) Describe the impact of climate-related risks and opportunities on the organisation’s businesses, strategy and financial planning: page 74 – ‘Our strategy and risk management for responding to climate change’, page 79 – ‘Our significant climate-related risks and opportunities and our strategic response’ c) Describe the resilience of the organisation’s strategy, taking into consideration different climate-related scenarios, including a 2°C or lower scenario: page 76 – ‘Physical modelling’, page 78 – ‘Transition scenarios modelling’ Our climate-related financial disclosures cover all of the TCFD’s recommendations and recommended disclosures. The following index navigates between our disclosures and the TCFD’s recommendations and recommended disclosures: Risk management Disclose how the organisation identifies, assesses, and manages climate-related risks a) Describe the organisation’s processes for identifying and assessing climate-related risks: page 74 – ‘Our strategy and risk management for responding to climate change’, page 74 – ‘Identifying and assessing the impacts of climate-related risks and opportunities’ b) Describe the organisation’s processes for managing climate-related risks: page 75 – ‘Climate change and enterprise risk management’ c) Describe how processes for identifying, assessing, and managing climate-related risks are integrated into the organisation’s overall risk management: page 74 – ‘Identifying and assessing the impacts of climate-related risks and opportunities’ Metrics and targets Disclose the metrics and targets used to assess and manage relevant climate-related risks and opportunities where such information is material a) Disclose the metrics used by the organisation to assess climate-related risks and opportunities in line with its strategy and risk management process: page 83 – ‘Climate change metrics and targets’, page 79 – ‘Our significant climate-related risks and opportunities and our strategic response’ b) Describe Scope 1, Scope 2 and, if appropriate, Scope 3 GHG emissions, and the related risks: page 83 – ‘Climate change metrics and targets’ shows cross-reference to separate ARA disclosure: page 26 c) Describe the targets used by the organisation to manage climate- related risks and opportunities and performance against targets: page 83 – ‘Climate change metrics and targets’ shows targets, where considered relevant The world’s first row of T-pylons, Hinckley Connection Project, UK 71 S trateg ic R ep o rt National Grid plc Annual Report and Accounts 2021/22

Board Audit & Risk Committee Ethics, Risk and Compliance Committee Group Executive Committee Other meetings and forums Remuneration Committee Reputation & Stakeholder Management Committee Responsible Business Steering Group People & Governance Committee Safety, Health and Sustainability Committee TCFD Steering Group Safety & Sustainability Committee Group Policy and Regulation Committee Investment Committee Business Unit Green Financing Committees Finance Committee Climate governance Governance of climate-related risks and opportunities The Board’s role The Board of Directors is responsible for setting and leading the Company’s climate- related strategy and goals, and has oversight of climate-related risks and opportunities impacting the Group. The Board in turn delegates some elements of responsibility to various sub- committees as described below. Our Board members bring a variety of skills and experience to the Board, including expertise in ESG and climate change matters. See page 88 – 89 for an overview of the Board’s skills and experience. In the year, the Board received regular updates from the Chair of the Safety & Sustainability Committee, providing an overview of matters discussed at the Committee meetings. This included updates on progress against goals and targets for addressing climate-related issues. The Board also receives a CEO report at each Board meeting which informs on how the Company is tracking against performance against metrics and targets and progress is reported through a regular dashboard. Additional updates received by the Board in the year are outlined here: • The Board was informed that the carbon emission reduction targets that had been set had been verified by the SBTi. • The Board was updated on current ESG positioning in the Company, including key strategy enhancements to keep pace with and to choose where to lead as a responsible business, and assurance around the right governance in place to provide a central organisational focus to drive strategy and performance. The Board was also updated on the impact of acquiring WPD on the Company’s ESG agenda and opportunities including climate-related matters. • The Board discussed various aspects of the US business with US management, which included an update on the significant acceleration of the energy transition following President Biden’s election and the Company’s key clean energy ambitions in the US strategy. • An enrichment session was hosted by the Chief Sustainability Officer and management to provide focus for the Board on the Company’s ESG and climate-related commitments, ahead of Board approval of year-end sustainability reporting. The session promoted the understanding of the architecture of the ESG commitments, the flow of approvals at various Committees, key stakeholders that are engaged in the process and to assure that ESG stewardship is well embedded at Board level. The Board also reviewed its entire governance framework in the year to ensure the remit of the Committees remained appropriate and well placed to progress the Board’s agenda going forward, in particular around tackling climate change and monitoring progress against net zero aims. Three of the Board Committees refreshed their remit and focus, including the Safety, Environment & Health Committee, which became the Safety & Sustainability Committee. Within the business there has been a continuing move towards clearer ownership of climate issues; a Chief Sustainability Officer was appointed in September 2021, providing a single point of accountability across the Group for our overarching sustainability strategy to help deliver the energy transition and ensure we drive our own emissions down to net zero by 2050. The Chief Sustainability Officer attends all Safety & Sustainability Committee meetings and provides regular updates at Board and management level, including holding a Board ESG enrichment session, covering ESG commitments, reporting and developments. The remit of the Board and its Committees under our governance framework is set out on page 91. Terms of reference for the Board and its Committees are available at nationalgrid.com. 72 National Grid plc Annual Report and Accounts 2021/22 Task Force on Climate-related Financial Disclosures continued 17_TCFD_p70_83_v86.indd 72 27/05/2022 17:02

The Safety & Sustainability Committee is responsible for assessing and monitoring the Group environmental sustainability strategy and performance, as well as how the Company adapts its business strategy considering potential climate change risks and opportunities. This includes reviewing whether appropriate progress is being made against our net zero aims. Progress around GHG emissions was considered and challenged in the year. The remit of the Committee was extended in the year to provide further oversight of climate-related matters including climate scenarios within TCFD and progress against the Company’s climate transition plan which they reviewed in the year. The Committee also noted the changes to the Group Climate Change Risk which moved from what was a single strategic risk, to two risks – one strategic and one operational. The Remuneration Committee recommends to the Board the remuneration policy for Executive Directors and the leadership team including approving how ESG targets are incorporated into our incentive arrangements. The Committee also reviews workforce remuneration and monitors related policies, satisfying itself that incentives and rewards are aligned to National Grid’s strategy, culture and long-term sustainable success. During the year the Committee considered the remuneration policy to be presented to shareholders for approval at the 2022 AGM and increased the proportion of incentives linked to ESG and progress against climate-related targets. The People & Governance Committee oversees a diverse succession pipeline, helping to ensure we have the right people to deliver our strategy and net zero ambition. During the year the Committee approved the appointment of several new Non-executive Directors, taking into consideration skills and experience including climate. Martha Wyrsch, appointed in 2021, brings sound knowledge and experience around climate-related issues through her experience as CEO of a major international gas transmission business, as well as leading the growth and development of Vestas’ renewables business in the US, where she spearheaded the expansion of its wind farm portfolio. Anne Robinson joined the Board in January 2022, bringing strong ESG experience and insight into investor perception around climate. Anne and Martha both joined the Safety & Sustainability Committee on appointment and along with the other members received an induction tailored to the Committee including around climate issues. See page 100 for more information around the skills and experience of our Board. The Audit & Risk Committee has oversight over non-financial disclosures and assurance, including our RBR reporting, TCFD reporting and reporting in line with leading ESG frameworks such as the Sustainability Accounting Standards Board (SASB), the Global Reporting Index (GRI) and the EU Taxonomy. The Committee received papers in March and May 2022 on the financial reporting and disclosure considerations in relation to climate change. The Finance Committee oversees our financing strategy, including the issuance of National Grid plc’s €850 million Green Bond in September 2021. The Finance Committee also considers the financial impact of environmental factors on our credit metrics and relevant considerations with regard to debt investors, pension and insurance strategy. Management’s role The Board delegates to management responsibility for asset investment and maintenance planning, implementation of the net zero strategy and overseeing the development of the RBC. Management is also responsible on a day-to-day basis for the climate-related risks and opportunities faced by the Group and for delivering the roadmaps to achieve the net zero strategy set by the Board. Throughout the year, the Group Executive Committee created a number of sub-committees with delegated responsibility over specialist areas that receive updates on climate-related matters ahead of presentation, where applicable, to the Board and Committees. The Safety, Health and Sustainability Sub-Committee reviews and manages Group-wide safety, environment and health tracking/monitoring and related decisions. The Chief Sustainability Officer attends this Committee, providing a link between management and Board discussions around climate-related issues. In the year, the Committee spent time reviewing progress against the Company’s climate-related targets and shaped related strategy. In particular, the Committee reviewed potential impacts on our climate strategy and progress towards net zero from external events including the war in Ukraine and the energy crisis. The Reputation & Stakeholder Management Executive Sub-Committee provides oversight of responsible business policy development and engagement including in relation to the RBR and climate-related disclosures. The Ethics, Risk and Compliance Committee oversees the implementation of the Group’s risk management framework and assessment of principal risks including climate change. The Policy and Regulation Sub-Committee agrees and provides strategic oversight of Group public policy priorities and positions. The Investment Committee has delegated authority to approve investment decisions including those related to our Renewables business. Other forums A TCFD steering group comprising representatives from Group External Reporting, Sustainability, Corporate Strategy, Group Risk and Company Secretariat oversees progress against the TCFD recommendations and the publication of our annual disclosure. A Responsible Business steering group, chaired by the Chief Sustainability Officer, provides oversight of the integration of responsible business into National Grid including the development of ESG targets and future ESG strategy. Business Unit Green Financing Committees chaired by the Group Treasurer, provide governance over our Green Financing Programme and approve the publication of our Green Financing Report, which provides an analysis of how we utilised the proceeds from our portfolio of Green Bonds and their environmental impact. Our businesses. Further delegation and responsibility is given to the core operational businesses including the Business Unit Presidents, who are responsible and held accountable for delivering the net zero roadmaps for their businesses. Our functions. Corporate Affairs, Group Finance, Sustainability and Group HR are responsible for supporting the businesses in achieving their net zero pathways. Paula Rosput Reynolds, onsite at London Power Tunnels, London, UK 73 S trateg ic R ep o rt National Grid plc Annual Report and Accounts 2021/22 17_TCFD_p70_83_v86.indd 73 27/05/2022 17:02

Our strategy and risk management for responding to climate change National Grid has four strategic priorities, as set out on pages 20 – 21, the first of which is to enable the energy transition for all. We have committed to support the decarbonisation of the communities that we serve, migrating to cleaner energy solutions. We have also committed to enabling a fully decarbonised electricity grid, to lead the way on the decarbonisation of gas and to enable the decarbonisation of transport. To support these strategic ambitions, we have recently executed a strategic pivot, via three transactions which will enhance our role in the energy transition. These transactions were the acquisition of WPD, the UK’s largest electricity distribution network operator, in June 2021; and the proposed sales of our Rhode Island gas and electricity business in the US and of a majority stake in our UK Gas Transmission business expected to complete during 2022. Upon successful completion of all transactions, the contribution of electricity to National Grid’s portfolio will increase to around 70% of the Group. Across all of our businesses, we aim to play a leading role in enabling and accelerating the transition to a clean energy system, balancing decarbonisation, affordability and reliability of supply. Working closely with governments, other stakeholders, subject matter experts, and partners around the world and through our work for COP26, we focus on the technical and commercial solutions that will help achieve net zero for the energy sector. The biggest impact we can have is in enabling the economy-wide clean energy transition, but we must also reduce our own impact on the environment and strengthen our resiliency to risks that we have less control over. To accomplish this, our RBC commitments to reduce Scope 1 (direct emissions from our operational activities), Scope 2 (indirect emissions from our purchase and use of electricity) and Scope 3 (other indirect emissions from our value chain activities) emissions align with the requirements of the Paris Agreement and SBTi. These commitments, along with our overall suite of environmental sustainability initiatives, are reviewed in accordance with our quarterly business reviews, incorporating the risk and opportunities management processes detailed below, and reported accordingly to the Group Executive Committee and Board. Carbon pricing is one of the tools we use to support the delivery of our emissions reduction targets. We participate in traded carbon markets where our operations are covered by these frameworks, have regulatory incentives to reduce SF6 and methane emissions that are underpinned by a carbon price, and have applied an internal carbon price of $60/£45 per tonne (set in 2017) in investment decision making. Additionally our latest UK regulatory agreements apply a price of £241/tonne. We’ve found that a carbon price alone is unlikely to drive the changes needed to meet our net zero goals. As important are policies and commitments, such as those we have to remove and reduce SF6 leakage on our networks, and replace our fleet with electric vehicles. We are currently reviewing our approach to investment decision making to ensure we have the right mix of approaches to meet our commitments. Identifying and assessing the impact of climate-related risks and opportunities The scale of ambition and speed of change required to meet net zero emission targets, along with the changes in weather patterns, present both risks and opportunities to our business. These risks and opportunities, which are informed by our physical and transition risk scenario analysis and our horizon scanning processes, are built into our business planning and investment decision processes where we assess the degree of exposure to climate-related financial risks and opportunities. For our regulated businesses, our plans to address these are formulated with and agreed to by our regulators. Our management is incentivised through our target setting and remuneration policy to deliver the actions necessary to achieve our net zero objectives. This year, we agreed new ESG-related targets for our long-term incentive programme as detailed on page 113. We also launched a suite of internal climate change e-learning modules to help all employees learn more about climate change and our role in the energy transition. To accompany this, we conducted extensive pre- and post-COP26 employee engagement campaigns. See page 75 for detail on our scenario modelling and page 79 for further detail on the significant risks and opportunities we identified and our response. With funding from Ofgem’s Strategic Innovation Fund (SIF), we are delivering three innovation projects to help deliver a net zero electricity network. • The Sustainable Electrical Gas Insulated Lines (SEGIL) project will investigate the feasibility of an SF6-free Gas Insulated Line (GIL) solution to provide cost competitive, high-capacity transmission connections over 2000MVA to increase available network capacity for new offshore wind generation. The project will look at the options to replace SF6 with alternative low-carbon footprint gases as a viable means of GIL insulation. • The Super Conductor Applications for Dense Energy Transmission (SCADENT) project will develop an understanding of the barriers, opportunities, and benefits of modernising existing electricity infrastructure by replacing conventional cables with the use of High Temperature Superconductor (HTS) cable technology. This will increase network capacity, delivering time, cost, and carbon savings with reduced energy losses and wider environmental benefits including reduced disturbance to local communities caused by construction activities. • The Eye in the Sky Project, which utilises satellite data to improve grid resilience in emergency situations, will investigate new satellite data analytics solutions that can help GB networks to improve the visibility of infrastructure and assets, response in emergency and risk assess effects of climate change. Novel uses of satellite data and digital platforms can significantly improve network planning, modelling and forecasting capabilities, and improve the response to climate change effects like flooding, strong wind, snow storm or wildfire and provide warning to the networks for better planning and resource allocation during extreme weather events. Case study Innovation for net zero 74 National Grid plc Annual Report and Accounts 2021/22 Task Force on Climate-related Financial Disclosures continued 17_TCFD_p70_83_v86.indd 74 27/05/2022 17:02

Climate change and enterprise risk management Climate change is considered as part of our ERM process and has been one of our GPRs since autumn 2019. The ERM process is the framework through which the Group identifies, assesses, prioritises, manages, monitors and reports risks. This process is described on page 28 and includes the identification of a series of Group-wide controls and actions to mitigate the climate change principal risk (this is further described on page 30). Historically, the climate change risk at the GPR level was managed through one broad risk covering both physical and transitional impacts of climate change on our business. In December 2021, the Executive Ethics, Risk & Compliance Committee agreed to split the climate change GPR into two distinct elements: adaptation and mitigation child risks. This has enabled greater alignment to our strategic objectives. The adaptation activity, absorbed within the ‘significant disruption of energy’ risk’s control framework, will help ensure we continue to ‘deliver for our customers efficiently’, and the new standalone mitigation risk is aligned to our strategic objective, ‘enable the energy transition for all’. This has generated greater oversight, focus and adoption of two distinct and proportionate control frameworks in line with the new Group risk appetite – mitigating downside risk, and maximising opportunities, where applicable. Original Group climate change principal risk There is a risk that we fail to identify and/or deliver upon actions necessary to address the physical and transitional impacts of climate change on our business and demonstrate our leadership of climate change within the energy sector. 1. Climate change adaptation risk The adaptation risk relates to the physical impact of climate change to our assets across the Group. This adaptation element of the original climate change risk is managed as part of the ‘significant disruption of energy’ GPR, wider resilience activity and associated internal controls. 2. Climate change mitigation risk The mitigation risk relates to our Group-wide strategy for climate change including our commitments of achieving net zero, and the role our Group plays in driving the energy transition. This is now managed as a standalone GPR. We have further developed our risk and opportunity horizon scanning to assess critical trends to the energy transition. With our senior stakeholders and supported by external risk experts, we identified key indicators and metrics which are measured on a monthly basis versus thresholds. These are analysed against our current strategy and business plans for their potential impact and plausibility. Emerging risks are managed under our risk management framework with results reviewed by senior leadership (detailed further on page 29). Integration of climate change into our overall risk management Consistent with the Group’s overall approach to risk management and internal control, climate change risk management activities take place through all levels of our organisation. Our risk governance model drives an effective ‘top-down, bottom-up’ approach which allows the Group Executive Committee to define and cascade the GPRs to each business area; and in parallel, all business areas identify and escalate the operational risks that could impact their business model and objectives. The disclosure on page 28 provides further detail. The Group’s Risk Taxonomy supports all levels of the business to categorise any climate change risk into one of our four taxonomy groups: strategic, operational, financial and compliance; sub-categories beneath these four groups allow the business to select a more granular taxonomy grouping with an assigned risk appetite. The individual business unit or Group Function Risk Committees oversee, discuss and challenge new and existing climate change risks using the ERM framework and scoring methodology to ensure each risk has an appropriate inherent, current and target score for likelihood, financial and reputational impact. Where current risk levels are outside of agreed target scores and our risk appetite (based on the taxonomy), the business area implements actions and internal controls to close the gap. To support accountability for both aspects of climate change risk, each business unit and applicable Group functions are currently in the process of considering, and where necessary, adopting an individual adaptation and mitigation child risk. As WPD is new to the Group, we are still in the process of integrating WPD into our ERM processes and will report back on our progress with respect to WPD’s climate change risk management next year. Our climate-related scenario analysis Scenario analysis to 2050 and beyond guides our strategic and financial planning with respect to climate change. Our scenarios consider the potential physical impacts to the Group of average global temperature increases of 2°C and 4°C. We also consider potential transitional impacts of scenarios of average global temperature increases of 1.5°C in accordance with the Paris climate agreement. Transitional scenarios modelled Physical scenarios modelled Slow progress • Decarbonisation progress is made but too slow to meet net zero targets • Increase in distributed generation and local solutions where local authorities compensate for lack of overall national progress • System becomes increasingly unequal Orderly transition • Reaches most net zero targets through an orderly approach • Governments pursue suite of solutions for large-scale and consumer options • Coordinated pathway between key market players e.g. orderly reduction in natural gas • Increased investment in renewable electric generation and networks • Gas network evolution to allow H2 clusters and/or clean gas blending Acceleration • Reaches 2030 net zero targets to be on track for 2050 • Electrification of heat and transport at fast pace • Accompanied by large-scale investments (network, storage) • Increased grid scale and interconnection with smart homes and end-use electrification • Faster gas demand reduction 75 S trateg ic R ep o rt National Grid plc Annual Report and Accounts 2021/22
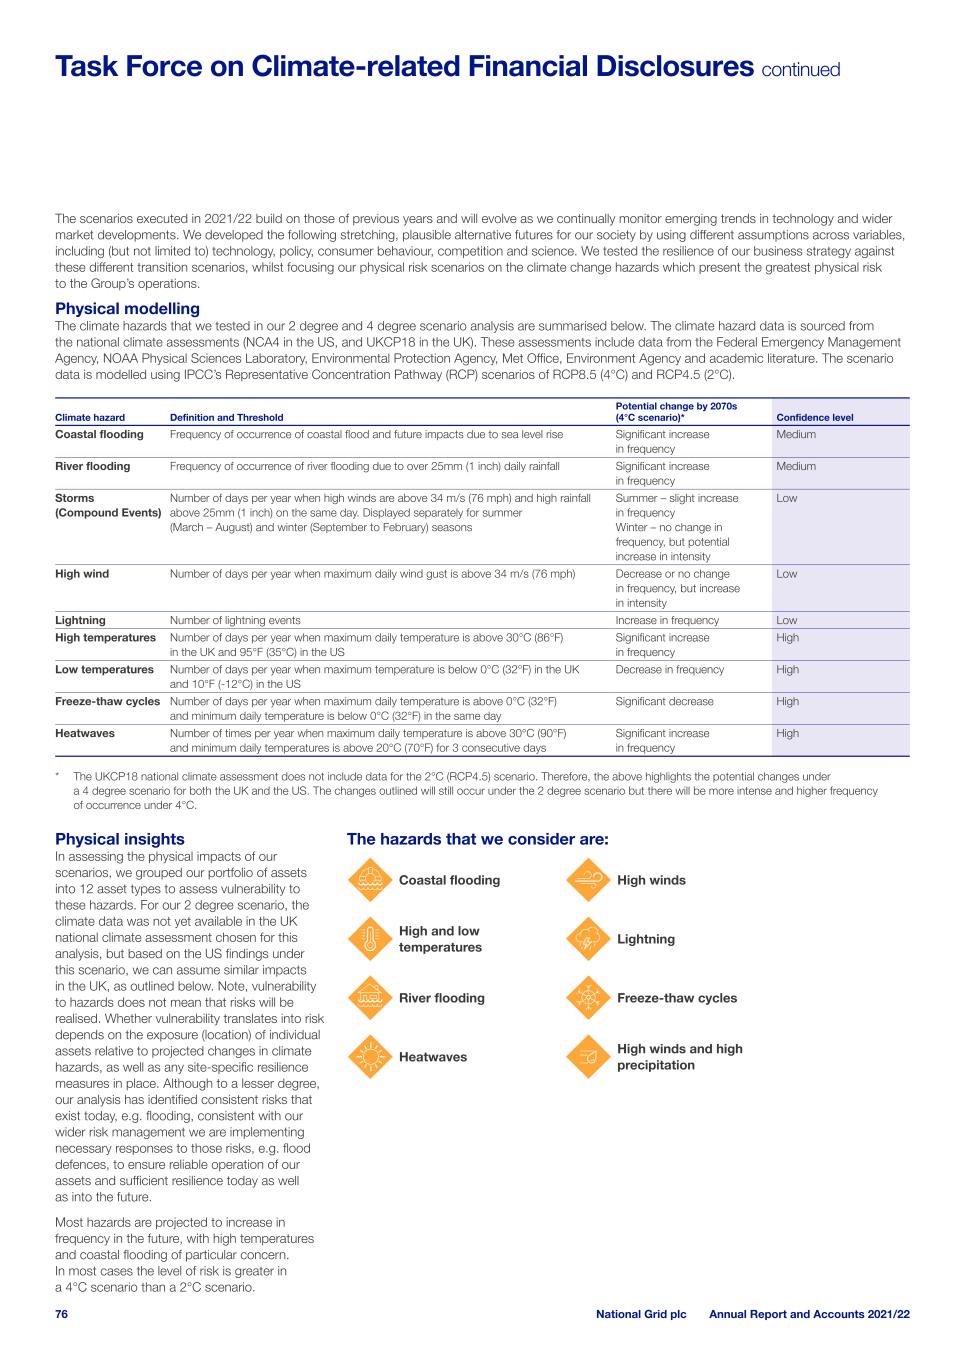
The hazards that we consider are: Coastal flooding River flooding High and low temperatures Heatwaves High winds Freeze-thaw cycles Lightning High winds and high precipitation Physical insights In assessing the physical impacts of our scenarios, we grouped our portfolio of assets into 12 asset types to assess vulnerability to these hazards. For our 2 degree scenario, the climate data was not yet available in the UK national climate assessment chosen for this analysis, but based on the US findings under this scenario, we can assume similar impacts in the UK, as outlined below. Note, vulnerability to hazards does not mean that risks will be realised. Whether vulnerability translates into risk depends on the exposure (location) of individual assets relative to projected changes in climate hazards, as well as any site-specific resilience measures in place. Although to a lesser degree, our analysis has identified consistent risks that exist today, e.g. flooding, consistent with our wider risk management we are implementing necessary responses to those risks, e.g. flood defences, to ensure reliable operation of our assets and sufficient resilience today as well as into the future. Most hazards are projected to increase in frequency in the future, with high temperatures and coastal flooding of particular concern. In most cases the level of risk is greater in a 4°C scenario than a 2°C scenario. The scenarios executed in 2021/22 build on those of previous years and will evolve as we continually monitor emerging trends in technology and wider market developments. We developed the following stretching, plausible alternative futures for our society by using different assumptions across variables, including (but not limited to) technology, policy, consumer behaviour, competition and science. We tested the resilience of our business strategy against these different transition scenarios, whilst focusing our physical risk scenarios on the climate change hazards which present the greatest physical risk to the Group’s operations. Physical modelling The climate hazards that we tested in our 2 degree and 4 degree scenario analysis are summarised below. The climate hazard data is sourced from the national climate assessments (NCA4 in the US, and UKCP18 in the UK). These assessments include data from the Federal Emergency Management Agency, NOAA Physical Sciences Laboratory, Environmental Protection Agency, Met Office, Environment Agency and academic literature. The scenario data is modelled using IPCC’s Representative Concentration Pathway (RCP) scenarios of RCP8.5 (4°C) and RCP4.5 (2°C). Climate hazard Definition and Threshold Potential change by 2070s (4°C scenario)* Confidence level Coastal flooding Frequency of occurrence of coastal flood and future impacts due to sea level rise Significant increase in frequency Medium River flooding Frequency of occurrence of river flooding due to over 25mm (1 inch) daily rainfall Significant increase in frequency Medium Storms (Compound Events) Number of days per year when high winds are above 34 m/s (76 mph) and high rainfall above 25mm (1 inch) on the same day. Displayed separately for summer (March – August) and winter (September to February) seasons Summer – slight increase in frequency Winter – no change in frequency, but potential increase in intensity Low High wind Number of days per year when maximum daily wind gust is above 34 m/s (76 mph) Decrease or no change in frequency, but increase in intensity Low Lightning Number of lightning events Increase in frequency Low High temperatures Number of days per year when maximum daily temperature is above 30°C (86°F) in the UK and 95°F (35°C) in the US Significant increase in frequency High Low temperatures Number of days per year when maximum temperature is below 0°C (32°F) in the UK and 10°F (-12°C) in the US Decrease in frequency High Freeze-thaw cycles Number of days per year when maximum daily temperature is above 0°C (32°F) and minimum daily temperature is below 0°C (32°F) in the same day Significant decrease High Heatwaves Number of times per year when maximum daily temperature is above 30°C (90°F) and minimum daily temperatures is above 20°C (70°F) for 3 consecutive days Significant increase in frequency High * The UKCP18 national climate assessment does not include data for the 2°C (RCP4.5) scenario. Therefore, the above highlights the potential changes under a 4 degree scenario for both the UK and the US. The changes outlined will still occur under the 2 degree scenario but there will be more intense and higher frequency of occurrence under 4°C. 76 National Grid plc Annual Report and Accounts 2021/22 Task Force on Climate-related Financial Disclosures continued
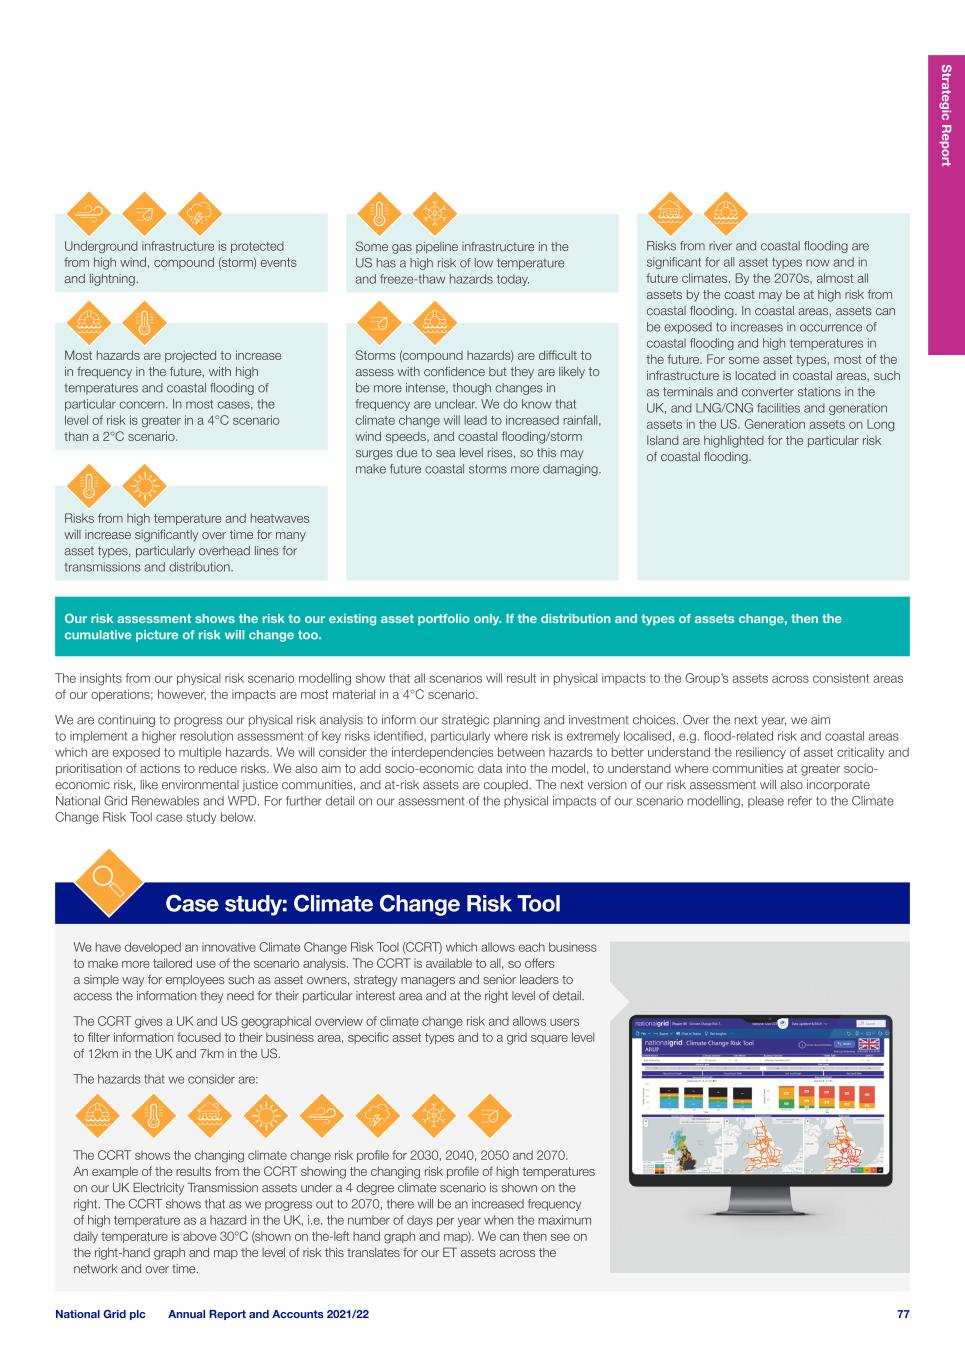
Storms (compound hazards) are difficult to assess with confidence but they are likely to be more intense, though changes in frequency are unclear. We do know that climate change will lead to increased rainfall, wind speeds, and coastal flooding/storm surges due to sea level rises, so this may make future coastal storms more damaging. Our risk assessment shows the risk to our existing asset portfolio only. If the distribution and types of assets change, then the cumulative picture of risk will change too. Risks from river and coastal flooding are significant for all asset types now and in future climates. By the 2070s, almost all assets by the coast may be at high risk from coastal flooding. In coastal areas, assets can be exposed to increases in occurrence of coastal flooding and high temperatures in the future. For some asset types, most of the infrastructure is located in coastal areas, such as terminals and converter stations in the UK, and LNG/CNG facilities and generation assets in the US. Generation assets on Long Island are highlighted for the particular risk of coastal flooding. Risks from high temperature and heatwaves will increase significantly over time for many asset types, particularly overhead lines for transmissions and distribution. Underground infrastructure is protected from high wind, compound (storm) events and lightning. Most hazards are projected to increase in frequency in the future, with high temperatures and coastal flooding of particular concern. In most cases, the level of risk is greater in a 4°C scenario than a 2°C scenario. Some gas pipeline infrastructure in the US has a high risk of low temperature and freeze-thaw hazards today. We have developed an innovative Climate Change Risk Tool (CCRT) which allows each business to make more tailored use of the scenario analysis. The CCRT is available to all, so offers a simple way for employees such as asset owners, strategy managers and senior leaders to access the information they need for their particular interest area and at the right level of detail. The CCRT gives a UK and US geographical overview of climate change risk and allows users to filter information focused to their business area, specific asset types and to a grid square level of 12km in the UK and 7km in the US. The hazards that we consider are: The CCRT shows the changing climate change risk profile for 2030, 2040, 2050 and 2070. An example of the results from the CCRT showing the changing risk profile of high temperatures on our UK Electricity Transmission assets under a 4 degree climate scenario is shown on the right. The CCRT shows that as we progress out to 2070, there will be an increased frequency of high temperature as a hazard in the UK, i.e. the number of days per year when the maximum daily temperature is above 30°C (shown on the-left hand graph and map). We can then see on the right-hand graph and map the level of risk this translates for our ET assets across the network and over time. Case study: Climate Change Risk Tool The insights from our physical risk scenario modelling show that all scenarios will result in physical impacts to the Group’s assets across consistent areas of our operations; however, the impacts are most material in a 4°C scenario. We are continuing to progress our physical risk analysis to inform our strategic planning and investment choices. Over the next year, we aim to implement a higher resolution assessment of key risks identified, particularly where risk is extremely localised, e.g. flood-related risk and coastal areas which are exposed to multiple hazards. We will consider the interdependencies between hazards to better understand the resiliency of asset criticality and prioritisation of actions to reduce risks. We also aim to add socio-economic data into the model, to understand where communities at greater socio- economic risk, like environmental justice communities, and at-risk assets are coupled. The next version of our risk assessment will also incorporate National Grid Renewables and WPD. For further detail on our assessment of the physical impacts of our scenario modelling, please refer to the Climate Change Risk Tool case study below. 77 S trateg ic R ep o rt National Grid plc Annual Report and Accounts 2021/22

Urgent collective action required across society To reach net zero requires new policies and technology development. Action is required by a wide range of stakeholders in the industry as a result of the public expectations on climate change; there is a push for new policies, action and government and State targets in the regions we operate. Retaining consumer buy-in will be key To reach net zero, consumers can drive domestic heating and transport decarbonisation by switching to low-carbon alternatives such as EVs and heat pumps. EVs are expected to represent 90% of the fleet by 2050 with 30% of households electrified. Electricity use and share of final demand will increase Grids are expected to grow to deliver an increase of 50 – 160% of current demand by 2050 as fuel switching reduces final energy demand with both heating and transport sectors decarbonising. Energy supply structure will shift There will be a shift to renewables power, notable offshore wind and solar. Offshore wind is expected to triple in output from 2030 to 2050. Pathways will adapt to global and local realities The US Northeast region is expected to import hydrogen to support decarbonisation, but in the UK Blue hydrogen and CCUS may develop due to policy and geology. 1 2 3 4 5 Insight and factors Transition scenarios modelling Our transition scenarios are developed using driving forces which we monitor regularly as part of our risk management process and annually in our strategic horizon scan. In our analysis, we do not make a judgement on the likelihood of any one scenario relative to others; and by design, the analysed scenarios do not encompass all possible future pathways and their associated risks. There are limitations within the scope of our modelling, e.g. available data across other sectors, but to minimise this impact we have utilised a wide range of resources and compared our results with external scenarios. Transition insights Whilst current global climate policies and actions suggest a lower than 4°C scenario, a 4°C scenario was still modelled in line with our approach to scenario modelling outlined above. The transition impact to the Group is most significant in scenarios resulting in a lower degree of warming given the increased action required. The following five transition insights are therefore most relevant to a 2°C (or lower) scenario. However each still applies, albeit to a lesser extent, to a 4°C scenario as well. How we manage our climate-related risks As part of our ERM process, risk owners and other key stakeholders establish internal controls to manage the risk within appetite. Regular risk reviews consider the effectiveness of individual controls as well as the collective strength of the internal control framework which determines the financial and reputational impact, and likelihood of the risk to materialise. Where current risk levels are outside of agreed target scores and our risk appetite, remedial or continuous improvement plans will be agreed to mitigate the current risk score. The controls for our new climate change principal risk (mitigation) have evolved in line with our strategy and regulatory frameworks. They include controls on strategic oversight and governance (for example, Board and Group Executive Committee sign-off on strategy and oversight of delivery against net zero action plans), business unit roadmap and operational plans to deliver net zero targets (that are aligned to Group’s strategy) and investment plans (providing leadership to structural changes, e.g. bringing to scale new technologies). Controls related to the climate change risk are also reflected throughout other relevant risks, for example regulatory outcomes; political and societal expectations; and significant disruption of energy. The significant disruption of energy risk and controls demonstrates how we are adapting as an organisation to manage the impact of climate change to our assets. Our key climate adaptation controls include the following: • Fit for Future of Electricity Strategy: a corporate strategy that considers the future electricity business, including our network resilience and changing environment, and the steps to ensure our business remains resilient in the future, such as enhanced design standards, and investments on asset hardening and flood protection. • Engineers Governance forums: Chief Engineers and Engineering Duty Holders meet to provide guidance and data-sharing on key topics such as resilience. • Resilience and Asset Management Business Management Standards (BMS): sets out minimum requirements and framework for resilience capability and managing asset risk to ensure each business unit is prepared for the next disruptive event, including the changing environment. • Organisational Resilience Competency Framework: to guide, measure and where applicable, heighten our resilience response across the Group under different climate change scenarios. • Business Continuity and Crisis Management: ongoing development of a new business continuity software application to ensure a consistent view across the Group, and internal crisis management tool to respond more effectively to incidents, drive consistency, and identify and track actions. The quality of assurance over key controls has been enhanced following roll-out of a new control testing methodology, that integrates the first line and second lines of defence. None of the transition scenarios tested threaten the viability of the Group and we are in a strong position to adapt our portfolio to maximise the opportunities of the energy transition. Further detail on the transition risks and opportunities identified in our scenario analysis, including estimated qualitative and quantitative impacts where applicable, can be found on pages 79 – 82. 78 National Grid plc Annual Report and Accounts 2021/22 Task Force on Climate-related Financial Disclosures continued

79 S trateg ic R ep o rt National Grid plc Annual Report and Accounts 2021/22 Key controls related to Group and business areas GPRs are self-assessed by first line teams (control owners and/or performers), and tested by second line teams, who review the design and operating effectiveness; all captured in our GRC system. Any ineffective controls are identified and remediated. Risk owners across the Group have the ability to view assurance of their controls in real time, using newly developed PowerBI dashboards. As outlined above, with regard to our greenhouse gas emissions, where specific actions are identified to achieve our strategy, drive desired behaviours and manage our risks, we set SMART targets for those accountable. Performance against those targets is published transparently, principally through the RBR and the results contribute to the assessment of remuneration for those accountable. For the most material performance measures, an external assurance opinion is received over the accuracy of preparation; a copy of this opinion can be found on our website. Our significant climate-related risks and opportunities and our strategic response Guided by our scenario modelling, strategic planning and risk management approaches articulated above, the climate-related risks and opportunities that pose a potentially significant financial or reputational impact are detailed below, along with our basis of measuring the risk/opportunity and our strategic response to each risk/opportunity that underpins our resilience assessments. To assess the relative materiality, we established scope of impact, timeframe and likelihood for each risk and opportunity using internal analysis, market data and input from subject matter experts across our business. Refer to the subsequent section for further information on measurement indicators, including our performance against them. We assessed which businesses would be impacted against whether there was a risk that could materially affect our ability to meet business objectives and/ or, is of material importance to stakeholders. The timeframes we have used to assess the climate-related risks and opportunities are short: up to 2025, medium: from 2025 to 2030 and long-term: from 2030 to 2050. Our ‘likelihood’ assessment is an indicative estimate of the probability for material financial impacts with reference to the following categorisation: • Low: Very unlikely to unlikely • Moderate: About as likely as not to occur • High: Likely to very likely to occur Risk/opportunity Potential impact Our response 1. Transition Risk & Opportunity Retaining customer buy-in will be key: cost transparency and scrutiny on Network Operators is likely to increase as there will be a focus on the impact of transition costs on customers’ bills. Whilst National Grid can support the progression towards an affordable transition, there is a risk that customers and/or regulators may perceive that too little is being done to manage pressures on affordability, resulting in damaged reputation and damaged regulatory relationships. Business: Group-wide Timeframe: Short, medium and long term Likelihood: Moderate Measurement indicators: % of NG transmission/distribution costs on customer bills, customer trust survey, feedback through the fair transition plan. The reputation of our business has wide implications to our operations; affecting our regulatory negotiations and the resulting regulatory returns and incentives of the frameworks within which we operate. Our reputation can affect our cost of doing business, from customer feedback, employee retention, productivity, supplier relationships, and ultimately our share price. All have impacts that can move in either way, depending on our perceived success in enabling the fair and affordable energy transition. Due to the nature of the risk/ opportunity, and the degree of external variables affecting the matter, it is difficult to meaningfully quantify the risk. However, if not managed effectively, it could undermine the corporate strategy and materially impact our financial performance. Being at the ‘heart of a clean and fair transition’ is our purpose and our regulatory strategy team has a strong focus on affordability for consumers, working with regulators to minimise impacts to customer bills and to introduce affordability mechanisms. We will also advocate for anticipatory investment to minimise the costs to consumers and will use our CCRT to inform our investment decisions to ensure the resilience of our assets. An example of our focus on affordability for customers is our recently launched Expanded Solar-For-All programme in the US, where nearly 160,000 National Grid upstate New York electricity customers will benefit from new solar-energy bill credit, thanks to a joint offering from National Grid and the New York State Energy Research and Development Authority (NYSERDA). The Expanded Solar-For-All programme, approved by state regulators in January 2022, will automatically provide monthly credits to income-eligible customers enrolled in National Grid’s Energy Affordability Programme. The programme is designed to deliver the benefits of community solar to low-income customers, who are often shut out of renewable energy sources due to cost. Community solar is a large array of solar panels at an offsite location that allows customers to access solar power without installing panels on their homes. Developers build and operate the community solar projects, and energy delivery companies like National Grid purchase and distribute the credits generated by the projects to participating customers. The bill credits would grow over three years as the programme expands, with customers receiving monthly discounts. In Expanded Solar-For-All’s first phase, National Grid anticipates providing $240 million in total bill credits during the 25-year lifetime of the programme. A proposed second phase would further expand the programme, doubling the total anticipated bill credits to $480 million over the programme’s lifetime. The second phase will be contingent on approval by state regulators. The Expanded Solar-For-All programme brings to life two pillars of Project C, National Grid’s commitment to the communities where we work and live: clean energy and sustainability, and environmental justice and social equity. 17_TCFD_p70_83_v86.indd 79 27/05/2022 17:03

80 National Grid plc Annual Report and Accounts 2021/22 Risk/opportunity Potential impact Our response 2. Transition Risk & Opportunity Urgent collective action is required: with its central role as the backbone of the energy sector, National Grid can play a crucial role in the transition. As a result, public focus will increase on our Company, increasing reputational risk. Business: Group-wide Timeframe: Short, medium and long term Likelihood: Moderate Measurement indicators: GHG emissions, Climate Transition Plan, customer feedback The reputation of our business has wide implications to our operations; affecting our regulatory negotiations and the resulting regulatory returns and incentives of the frameworks within which we operate. Our reputation can affect our cost of doing business, from employee retention, productivity, supplier relationships, customer feedback, cost of/access to finance and ultimately our share price. All have impacts that can move in either way, depending on our perceived success in enabling the energy transition. Due to the nature of the risk/ opportunity, and the degree of external variables affecting the matter, it is difficult to meaningfully quantify the risk. However, if not managed effectively, the matter could undermine our corporate strategy and materially impact our financial performance. To date, we have endeavoured to take account of this by being at the heart of a fair, clean and affordable future, working with governments, policy makers and regulators to shape net zero strategy. Accordingly, we have positioned ourselves as ‘The Energy Transition Company’ acting as a principal sponsor of COP26, and our ESO business has set an ambition to operate a zero-carbon system by 2025, with the goal to run 100% carbon free energy 24/7/365 by 2035. We will continue to focus on enabling the transition, including working in partnership with our regulators and other stakeholders to develop investment plans in line with the net zero commitments of their jurisdictions, whilst managing the costs to consumers. We have developed roadmaps and track progress against key milestones for each of our business units which include the actions, conditions and assumptions that will support the delivery of our emissions reduction targets. These plans are consolidated into a group roadmap which is presented in our Climate Transition Plan, which we’ve published alongside this year’s Responsible Business Report. 3. Transition Opportunity Electricity use and share of final demand will increase: with the transition pivoting energy needs from fossil fuels to cleaner gas and electricity, the Group will deliver a larger share of society’s needs in the future. This will increase investment opportunities as growth is across transmission and distribution electricity networks. Business: ET, ED, NY, NE, NGV, ESO Timeframe: Short, medium and long term Likelihood: High Measurement indicators: EU Taxonomy KPIs, green capex forecasts, GHG emissions Sensitivities have been run versus our business plan to investigate the impact of the scenarios and we will continue to monitor triggers to capital expenditure. We estimate that the Orderly Transition or Acceleration scenario would result in an increase over the Slow Progress scenario of between 0.5% to 1.0% in underlying operating profit CAGR over the period to 31 March 2031. Capital expenditure increases may include expanding electricity networks, natural gas leak reductions and investment and expansion of renewable generation operations, but these are expected to be within our regulatory regime. Beyond 2030, and in line with our scenario modelling, the trends towards greater electrification, driven by expanded renewables generation and investment into decarbonising our gas networks is expected to continue and may accelerate. Our acquisition of WPD positions National Grid for this increase in electricity use across transmission and distribution. We are also continuing to invest in both onshore renewables via National Grid Renewables and in our interconnector portfolio, which will form an important part of UK decarbonisation. Across our businesses, we are also heavily investing in the infrastructure required to support the decarbonisation of transport and during 2021 in the US we delivered 1,684 EV charging ports in our jurisdictions, a company record for a calendar year. We are also carrying out critical studies and pilots exploring how to decarbonise our gas networks, for example the HyGrid project described in Transition Risk 6 and the FutureGrid project, which is testing the possibility of converting the NTS in the UK to transport hydrogen. In the UK, we are continuing to work with the Department for Transport and the Office of Zero Emissions Vehicles to ensure that the underlying network infrastructure is in place, ahead of need, to support the successful delivery of Project Rapid. We welcomed the Transport Decarbonisation Plans commitment to publish an Electric Vehicle Charging Infrastructure Strategy and establish a Delivery Body to progress the grid upgrades required to meet future ambitions. We also continue to engage with key stakeholders from across all modes of transport through our ‘ask, not tell’ engagement principles to understand the main barriers and potential future demand and infrastructure requirements for each sector. Task Force on Climate-related Financial Disclosures continued 17_TCFD_p70_83_v86.indd 80 27/05/2022 17:03

81 S trateg ic R ep o rt National Grid plc Annual Report and Accounts 2021/22 Risk/opportunity Potential impact Our response 4. Transition Risk Electricity use and share of final demand will increase, alongside increasing volumes of intermittent renewable energy. System resilience will be key to ensure security of supply. Business: ET, ED, ESO Timeframe: Short, medium and long term Likelihood: Moderate Measurement indicators: Network reliability Our role as the ESO is pivotal to delivering the energy transition. If the system operator is not prepared with the systems and processes to operate a decarbonised energy supply system, there will be significant costs from increased market inefficiency and the potential for network outages impacting our customers. In the shorter term, failures could affect us through lost regulatory incentive income, which link directly to reliability. See our Segmental analysis and Revenue notes on pages 156 and 158 for further detail on the size of our ESO business. Our ESO business is investing to ensure it is able to operate the system safely and securely at zero carbon whenever there is sufficient renewable generation online and available to meet the total national load. This year, the ESO agreed to contracts with five parties, worth £328 million over a six-year period, in a world-first approach to managing the stability of the electricity system. We are also supporting the accelerated development of electricity grids worldwide. At COP26 we joined the UK and Indian governments to launch the Green Grids Initiative, One Sun One World One Grid (GGI-OSOWOG), aiming to accelerate global expansion and modernisation of energy grids. This is an ambitious plan backed by over 80 countries and looks to harness the full potential of renewable resources globally, through much greater interconnection of electricity grids, so electricity can be moved from where it’s generated to where it’s needed. The GGI will help make this happen by bringing together a global coalition of stakeholders, including governments and businesses, to speed up the expansion of energy grids across regions and continents. We are playing a leading role in this as a member of the GGI. 5. Transition Opportunity Energy supply structure will shift: Growth in investment will occur in our markets as well as in adjacent markets, providing opportunity for our NGV and NGP businesses. As pathways adapt to global and local realities, technologies and market expectations will develop new commercial opportunities from the transition towards net zero that will continue to present opportunities to shape our portfolio and strategy. Business: NGV, NGP Timeframe: Short and medium term Likelihood: Moderate Measurement indicators: NGP value creation, NGV capital investment, EU Taxonomy KPIs, cumulative investments into large-scale renewables, investment in R&D With effective investment and proactive market engagement, there will be opportunities to grow new and existing revenue streams and to generate sustained green capital investment. We also anticipate the opportunity for investment in large-scale renewables to expand as the energy transition accelerates, with further innovation to create opportunities of additional revenue streams in the future. Our capital investment forecast to 2026 contains c.£1.6bn relating to renewables. Our NGV and NGP businesses actively monitor and participate in emerging growth opportunities and will continue to do so in the future. During the year, National Grid Renewables invested £199 million into renewable generation assets via the Emerald joint venture. Further to this, NG Renewables invested £223 million in the offshore wind seabed lease awarded in the New York Bight. During the year, NGP, our venture capital business that invests in energy technology startups, made 13 new investments bringing the total portfolio value to $491 million across 38 investments. Example investments include: TS Conductor, a California-based company whose technology replaces legacy materials in high-voltage electricity transmission lines with a next-generation conductor that doubles the lines’ capacity without the need to retrofit towers or other infrastructure; and Risilience, a UK-based startup that helps companies manage their transformation to net zero emissions. We also continue to invest in our interconnector portfolio and, once Viking Link becomes commercially operational in 2023/24, NGV will hold 7.8 GW of interconnector capacity and the focus will switch to multi-purpose interconnectors, which will increase interconnection and facilitate the construction and expansion of wind farms in the North Sea. 17_TCFD_p70_83_v86.indd 81 27/05/2022 17:03

82 National Grid plc Annual Report and Accounts 2021/22 Risk/opportunity Potential impact Our response 6. Transition Risk Pathways will adapt to global and local realities: there are multiple net zero pathways for heating which have different impacts for our US gas activities. Whilst all pathways expect a reduction of the usage of fossil gas in the long term, there are opportunities for the development of fossil-free alternative fuels. The different pathways result in a risk that our natural gas infrastructure will not be useful as long as is currently assumed in our financial planning and accounting. Business: NY, NE Timeframe: Long term Likelihood: Moderate Measurement indicators: Gas UEL sensitivities, GHG emissions, Climate Transition Plan We have performed sensitivity analysis to assess the impact shortening the useful economic lives of our gas business assets would have upon the Group’s financial results, which may result in an increase in depreciation expenses of up to £180 million to 2050 for US regulated assets. This sensitivity calculation excludes any assumptions regarding the residual value for our asset base and the effect shortening asset depreciation lives would be expected to have on our regulatory recovery mechanisms. For further information, see page 181. We are pursuing zero fossil fuel gas and electric systems by 2050, if not sooner, in the US. The vision proposes a hybrid approach to heating that enables customers to have more affordable and practical choices to become fossil-free. More details can be found in our Vision Report https://www.nationalgrid.com/us/fossilfree. We will continue to engage in key regulatory proceedings and processes in New York and Massachusetts to maximise recovery on our gas business assets. These include the ongoing DPU 20-80 ‘Future of Gas’ proceeding in Massachusetts and a KEDNY/KEDLI depreciation study that will be submitted to the New York PSC in advance of our rate case filing in 2023. 7. Physical risk Our assets are at risk of physical impacts from extreme weather events such as storms and flooding. There will also be increased frequency of weather incidents and changing long-term climate trends leading to asset damage and operational risks. Business: Group-wide Timeframe: Short, medium and long term Likelihood: High Measurement indicators: Network reliability, major storm costs, climate change risk tool outputs We experience significant costs as a result of asset damage and operational interruptions due to major storms (2021/22: £163 million 2020/21: £150 million). We therefore continue to invest in storm hardening across the Group, with a further £36 million invested in the year. We are in the process of expanding our scenario modelling to forecast the likely financial implications of a 2 and 4 degree scenario over the long term. We expect to report these results in our 2022/23 reporting. An example of our work in this area is the $741 million of investment our New York business has committed to in the five year capital investment forecast to FY26. This investment covers a range of storm hardening measures, upgrades and repairs to our infrastructure to make it less susceptible to storm damage. These include inspection and maintenance, minor storm hardening, vegetation management, flood mitigation, side tap fusing, and multi-value transmission reliability. In the UK, our ESO business has undertaken Mapping Impacts and Visualisation of Risks (MIVOR) of extreme weather on system operation to evaluate the impacts of extreme weather events on system operation up to 2050 under RCP 4.5. The results will enhance the accuracy of energy system impact modelling and will also focus on the impacts of the whole supply chain, renewable generation, network assets, and demand, ensuring that the learnings produced are relevant to the whole energy system. Task Force on Climate-related Financial Disclosures continued 17_TCFD_p70_83_v86.indd 82 27/05/2022 17:03

comprise several business unit level metrics that are then tracked and monitored by business unit, and presented to senior management on a quarterly basis, with accountability at the local level. With reference to the principles of the EU Taxonomy, we have disclosed the proportion of our IFRS revenue, operating expenditures and capital expenditures that align with the climate change mitigation and adaptation objectives of the EU’s taxonomy. Given the climate change mitigation objective’s alignment to the principles of the Paris Agreement, the disclosures provide a transparent view of the Group’s compatibility with the net zero goals of the economies we serve during the year ended 31 March 2022. Our assessment is presented within our RBR; please see page 53 of our RBR for the complete disclosure. We continually review our metrics and targets to ensure that the data we are measuring is meaningful, aligns with our strategy, and is providing the information the business and our stakeholders need to effectively monitor our performance and demonstrate our progress. In June 2022, we published our Climate Transition Plan alongside our RBR. Note, whilst we do not consider water use as a significant climate-related financial risk for the Group, performance metrics are contained in the RBR. Climate change metrics and targets We have metrics and targets that allow us to measure our impact on the environment, demonstrate our commitment and monitor our performance. These were published in October 2020 within our RBC and, on an annual basis, we report our progress against those targets in our RBR and our key metrics in respect of our GHG emissions can be found on page 26. We have a commitment to reduce our impact by achieving net zero for our Scope 1 and 2 emissions by 2050, with interim targets of an 80% reduction by 2030 and a 90% reduction by 2040, from a 1990 baseline. Alongside this, we have a Scope 3 emissions reduction target of a 37.5% reduction by FY 2034 from an FY 2019 baseline year. This target includes all of our Scope 3 emissions. Our GHG emissions reduction targets are science-based and approved by the SBTi. Numerous underlying metrics support and complement this goal as part of our broader sustainability ambition, including reducing our energy consumption, enhancing the natural value of our landholdings, recycling and/or reusing our recovered assets and reducing our office waste. These are discussed in more detail on page 67 and in our RBR. The metrics Measurement indicator Risk/Opportunity 2021/22 2020/21 Scope 1, 2 and 3 emissions and intensity1 1, 3, 6 See page 26 Consumer Trust Survey (US)1 1, 2 62.4% 66.2% NG UK’s transmission costs’ contribution to consumer bills1 2 £29.04 £29.52 NG UK’s distribution costs’ contribution to consumer bills1 2 £98.85 £95.81 US Electric: Average Customer Bill (Low Income Customers Excluded)1 2 $1,613.35 $1,563.14 US Gas: Average Customer Bill (Low Income Customers Excluded)1 2 $1,314.24 $1,156.45 US Electric: Average Low Income (only) Customer Bill1 2 $1,107.07 $1,026.82 US Gas: Average Low Income (only) Customer Bill1 2 $904.72 $771.56 Green Capex five-year forecast (2021/22-2025/26) 3 c.£24bn n/a (1st year of reporting) Network reliability1 4, 7 See page 26 NGP value creation 5 See page 55 Cumulative investments into large-scale renewables 5 See page 81 NGV capital investment 5 See page 25 Investment in R&D 5 See page 162 Gas UEL sensitivities 6 See page 181 Major storm costs 7 See page 39 1. Refer to RBR reporting methodology for calculation methodology: https://www.nationalgrid.com/responsibility/responsible-business-report Further, we are closely monitoring developments regarding the UK’s greening finance initiative, the formation of the ISSB and the proposals to deliver a comprehensive global baseline of sustainability-related disclosure standards. Whilst we currently leverage the GRI, SASB, EU Taxonomy, EEI and TCFD frameworks in our RBR to maximise the usefulness of our reporting, we are encouraged to see advancement to further align sustainability reporting disclosures. Please also refer to the RBR for the limited scope assurance opinion received over our most material sustainability metrics. A complete index of the quantitative measurement indicators used to manage each climate-related financial risk and opportunity is below: 83 S trateg ic R ep o rt National Grid plc Annual Report and Accounts 2021/22 17_TCFD_p70_83_v86.indd 83 27/05/2022 17:03

Governance at a glance 86 UK Corporate Governance Code 2021/22 – Compliance Statement 86 Chair’s statement 87 Our Board 88 – 89 Corporate Governance overview 90 – 98 People & Governance Committee report 99 – 100 Audit & Risk Committee report 101 – 105 Safety & Sustainability Committee report 106 Finance Committee report 107 Directors’ Remuneration report 108 – 131 Doing Right Now Transforming our network We are rewiring the Capital, reinforcing London’s electricity supply for decades to come. A six-year, £1 billion project in South London via 19 miles (30 kilometres) of deep underground tunnels. 84 National Grid plc Annual Report and Accounts 2021/22 18_Corp_Governance_and_Compliance_p84_98_v189.indd 84 27/05/2022 17:05

Corporate Governance Report C o rp o rate G o vernance 85National Grid plc Annual Report and Accounts 2021/22 18_Corp_Governance_and_Compliance_p84_98_v189.indd 85 27/05/2022 17:06

The Company is subject to the Principles and Provisions of the UK Corporate Governance Code (the ‘Code’), which it has applied consistently. The table below outlines how the Group has structured the Governance section of the Annual Report on the Principles of the Code. For the year ended 31 March 2022, the Board considers it has complied in full with the Provisions of the Code. This Corporate Governance report as a whole explains how the Company has applied the Principles and complied with the Provisions of the Code, but the below acts as a guide to where the most relevant explanations are given: Principles of the Code 1. Board leadership and company purpose Chair’s statement 87 Role of the Board 91 Section 172 statement 56 – 59 Purpose and values 65 Board engagement with stakeholders 96 – 97 Oversight of strategy 20 – 21 Assessment of risks and viability 28 – 35 Measurement of strategy (KPIs) 24 – 27 2. Division of responsibilities Board independence 88 – 90 Board Committees 91 Committee reports 99 – 110 Board attendance 90 External appointments of Board members 88 – 89 3. Composition, succession and evaluation Board biographies 88 – 89 Board composition and tenure 88 – 89 & 100 Committee membership 88 – 89 Board evaluation 97 Board succession planning 99 – 100 People & Governance Committee report 99 – 100 4. Audit, risk and internal controls Audit & Risk Committee report 101 – 105 Risk 28 – 32 Principal risks 28 – 32 Emerging risks 29 External auditor 104 – 105 Fair, balanced and understandable 101 Viability Statement 33 – 35 5. Remuneration Directors’ Remuneration report 108 – 131 Remuneration policy 113 & 124 – 128 98% 46% Board meeting attendance for the year ended 31 March 2022 female representation on our Board as at date of report 15% 66% ethnic minority representation on our Board as at date of report Average % of issued share capital voted at 2021 AGM 78% 50.97p employee engagement score for 2021/22 dividend per ordinary share in 2021/22 Increase of 3.7% on prior year 100 4 perfect score on Human Rights Campaign Foundation’s 2022 Corporate Equality Index Board members appointed in 2021/22 99% shareholder vote ‘For’ 2021 AGM resolution on climate change commitments and targets UK Corporate Governance Code – 2021/22 Compliance Statement 86 National Grid plc Annual Report and Accounts 2021/22 Key highlights Governance at a glance 18_Corp_Governance_and_Compliance_p84_98_v189.indd 86 27/05/2022 17:06

likely to face in the next several years. We asked ourselves, what topics would be worthy of the Board’s time? Why were they important? How would we get the most salient information? Which external and internal resources would be available to shape our perspectives? These questions may appear simplistic. But in my experience, effective stewardship starts by making sure that a board spends time on the matters that really count. I hope to use this report as a means to share with you some of the issues we are tackling in our Board discussions. None of the foregoing has any meaning unless we cast a critical eye on our own performance. We have adopted board goals and we retained an independent advisor to help us assess our group effectiveness as well as the effectiveness of each director; see page 97 for further detail. These honest conversations on how we are doing are foundational to our being the kind of board which you can entrust the stewardship of your Company. Board composition As you will have noted, several distinguished Board members reached the end of their terms in the year. Sir Peter Gershon, previous Board Chair until I assumed the role when he stepped down on 31 May 2021, is a distinguished businessman and advisor to government, known for his laser-like focus on productivity and performance. Dr. Paul Golby, a member of the Royal Academy of Engineering, has deep, relevant experience across the power sector, and contributed immeasurably to all the technical and strategy decisions the Company has made during his tenure. Mark Williamson, with a long career in finance, has wisely counselled on our financial and controls framework, as well as being the trusted Senior Independent Director, and Nicola Shaw, a key member of the management team in the role as UK Executive Director since 2016. All four retired from the Board in 2021. Jonathan Dawson, who will leave the Board at the AGM, has been the independent voice for the alignment of strategy and reward. In addition, Amanda Mesler, who has been a member of our Board for the last four years, has decided not to stand for re-election. Amanda was a great supporter of the investments in technology that have proved invaluable over these last several years. On behalf of my Board colleagues, I express my appreciation to all of them. Nevertheless, from this loss comes opportunity. We have been fortunate to have recruited five new directors who bring fresh perspectives and diverse experience to the Board. Ian Livingston, former Chief Executive of BT, comes with the battle scars of industry transformation and expertise in finance. Tony Wood, a sitting CEO and a member of the Royal Academy of Aeronautical Engineering, brings the perspective that safety, productivity and innovation are not to be traded off, but must be driven apace in lock-step. Martha Wyrsch has worked directly in the energy sector in all its aspects – power, natural gas, and renewables, regulated and unregulated. She brings wisdom and practical advice to the boardroom. Dear shareholders, I am pleased to present to you the 2021/22 Corporate Governance Report, my first as Chair of the Company. The year in review There has been no shortage of opportunities for engaged governance by the National Grid Board. The Company had a full agenda coming into the fiscal year: overseeing performance amidst a lingering pandemic and then the safe return to work; ensuring that our provision of service is consistent with society’s expectations of us; advancing our agenda of change as we make commitments to reach net zero; seeing through several major transactions; and supporting an evolving Group culture of accountability, agility and performance. The foregoing promised a busy year. Over the summer of 2021, a crisis in the retail energy markets in the UK began to unfold. Leading up to COP26, there were increasing pressures on both sides of the Atlantic for more rapid decarbonisation of energy. Then the threats of war became a stark reality. Ukraine was invaded and, almost overnight, energy supply security became the dominant theme. Our stakeholders have to be assured that we can identify and manage all of these risks. At the same time, we have to help balance aspirations regarding transformation with the exigencies of current delivery. All of these responsibilities are our job as board members, along with ensuring that we have a qualified, engaged, diverse workforce to succeed amidst an era of great change. My tenure as Chair commenced as directors were nearing or had completed their nine-year terms. Identifying suitable qualified replacements who could quickly come up to speed and yet bring fresh perspectives was essential. Fortunately, a well-vetted business plan was already in place and the change in board composition was orderly. We were able to quickly review Committee remits and composition and to refine the responsibilities and ownership of the Committees where much of the Board’s work is undertaken. Nevertheless, one thing I’ve observed in my years as a Non-executive Director is that operationally urgent matters can easily overtake consideration of truly important matters in a busy board agenda. So last summer, our Board took the time for what I believe was a critical set of conversations – namely coming to agreement on what were the big strategic questions that National Grid was Anne Robinson, an active executive in one of the largest asset management companies in the world, has substantial business and transactional experience and, in her current role, the most relevant background in ESG that we could imagine. Iain Mackay, who is joining the Board upon election at this AGM, is a sitting CFO with experience in industry prior to joining the fast-paced world of pharmaceuticals. These new Directors, along with those who continue to serve, bring strategic thoughtfulness, engagement, constructive challenge, independence and gravitas to our deliberations. As a group, they demonstrate our continued commitment to diversity on our Board and within National Grid’s organisation overall. Stakeholder engagement Whilst virtual engagement has become the norm over the past two years, it has been a great pleasure to resume in-person engagement in recent months. One can get an authentic sense of what is going on within an organisation or with society at large by meeting people, listening to how individuals and groups have fared, and seeing first-hand the challenges on the ground. In recent months, Board members have undertaken site visits. We have also had virtual and in-person engagement sessions throughout the year with employees. Page 96 provides more detail. Annual General Meeting Last year I was one of the many individuals affected by COVID-19 travel restrictions and was unable to participate in the 2021 AGM in person. Given the situation at the time, we did not encourage attendance by any shareholder. For our 2022 meeting, we revert to business as usual but with another option. I’m pleased to share that we are offering the opportunity for you to participate in a ‘hybrid AGM’. You will be able to join the meeting online and yet be able to participate in live voting and the Q&A session, as if you were in the room. Please note, too, that we are putting to vote for the first time our Climate Transition Plan this year. The discussion of this resolution should illuminate National Grid’s resolve to move to net zero and to provide metrics by which we can all track progress. Further details on this are outlined in the Notice of Meeting for the AGM and on the Company’s website. Looking forward Your Board will continue to focus on the key issues, challenge the Group’s leadership, and collectively seek to make wise decisions. In an ever-changing world, we pledge to you that whatever lies ahead, we have the best interests of your Company, its customers, and its people central to our deliberations. Paula Rosput Reynolds Chair 87 C o rp o rate G o vernance National Grid plc Annual Report and Accounts 2021/22 Chair’s statement 18_Corp_Governance_and_Compliance_p84_98_v189.indd 87 27/05/2022 17:07

Paula Rosput Reynolds (65) Chair Appointed: 1 January 2021 as Chair Designate and Chair with effect from 31 May 2021 Tenure: 1 year Skills and competencies: Paula’s strong business acumen is shown by her impressive track record of leading complex international businesses. In her board and leadership roles, Paula has demonstrated her decisive and pioneering nature, which will be crucial in moving National Grid’s vision forward, as it embarks on its journey to enable the clean-energy transition and net zero by 2050. Her knowledge of the energy market and experience supporting organisations through transitional periods is an asset to the Board, as National Grid continues to grow and embrace opportunities. Paula is Chair of the People & Governance Committee and the high- calibre appointments made under Paula’s leadership in the last year are pivotal in ensuring the succession and composition of the Board matches the culture, strategy and leadership needs of the Company. These skills combined with her insight into strategic and regulatory issues support her in leading and governing an effective board. External appointments: • Senior Independent Director and Chair of the Remuneration Committee at BP p.l.c. • Non-executive Director of General Electric • President and CEO of PreferWest LLC • Member of UK Prime Minister’s Business Council John Pettigrew FEI FIET (53) Chief Executive Appointed: 1 April 2014 and Chief Executive with effect from 1 April 2016 Tenure: 8 years Skills and competencies: John joined the Group as a graduate in 1991, progressing through many senior management roles and demonstrating a strong track record of developing and implementing global strategies for profitable growth. John contributes widely into external industry discussions shaping energy policy and brings significant know-how and commerciality to his leadership of the executive team and management of the Group’s businesses. John continues to lead the implementation of the Group’s strategy. This year he progressed the Company’s strategic pivot, including the integration of WPD and the successful sale of a majority stake in our UK Gas Transmission business. He also led the Company’s Principal Partnership of COP26 in Glasgow. External appointments: • Non-executive Director and Senior Independent Director of Rentokil Initial plc • Member of the UK Government’s Inclusive Economy Partnership • Member of the Electric Power Research Institute Board • Member of the CBI’s President’s Committee • Member of the Edison Electric Institute Executive Committee Ian Livingston (57) Non-executive Director; Independent Appointed: 1 August 2021 Tenure: Less than 1 year Skills and competencies: Ian is a chartered accountant who qualified with Arthur Andersen & Co and went on to become the youngest FTSE 100 CFO when appointed to the Dixons Group plc Board. Ian brings a wealth of experience to National Grid, having held both CFO and CEO positions in large, high-profile public companies operating in the UK and internationally. He has extensive experience of operating in a regulatory environment and is widely regarded in both the corporate and financial world for his record of consistently achieving enhanced shareholder value. Ian is Chair of the Remuneration Committee, where he brings significant experience and broad business perspective to discussions. He has a variety of non-commercial interests and involvement with a number of charities in education and social care. External appointments: • Chair of Currys plc (until 8 September 2022) • Non-executive Director of S&P Global Andy Agg (52) Chief Financial Officer (CFO) Appointed: 1 January 2019 Tenure: 3 years Skills and competencies: Andy trained and qualified as a chartered accountant with PwC and is a member of the ICAEW. He has significant financial experience, having held a number of senior finance leadership roles across the Group, including Group Financial Controller, UK CFO and Group Tax and Treasury Director. Andy brings in-depth knowledge of National Grid, in both the UK and the US, and has broad experience across operational and corporate finance roles. He contributes broadly on a wide range of topics at Board, Finance and Audit & Risk Committee meetings and has been instrumental in achieving the successful sale of a majority stake in our UK Gas Transmission business during the year. External appointments: • Member of The 100 Group Main Committee and Chair of the Tax Committee Liz Hewitt (65) Non-executive Director; Independent Appointed: 1 January 2020 Tenure: 2 years Skills and competencies: Liz qualified as a chartered accountant with Arthur Andersen & Co. In her executive career she worked in private equity for 3i Group plc, Gartmore Investment Management Limited and Citicorp Venture Capital Ltd gaining insights into a wide variety of industries. Her work at Smith & Nephew gave her global insight. She was seconded for a year to HM Government. Liz has extensive experience as an audit committee chair and as a member of nominations and remuneration committees. She is considered to be a financial expert in the context of audit committee work. Her broad industrial and global experience and her financial knowledge bring a wide perspective to her role as Chair of the Audit & Risk Committee and in Board discussions and decision-making. External appointments: • Director of Silverwood Property Limited • Non-executive Director of St George’s Fields Limited; and of St George’s Fields No.2 Limited FA AR P E F E Justine Campbell (51) Group General Counsel & Company Secretary Appointed: 1 January 2021 Tenure: 1 year Skills and competencies: Justine trained and qualified as a lawyer at Freshfields in London and Brussels. She has held senior executive positions at several multi-national companies and is an experienced lawyer with particular expertise in regulated sectors. She is responsible for safety, legal, risk, compliance and governance activities across the Group, the effective operating of National Grid plc’s Board and Committees and advising on key issues of corporate governance. External appointment: • Member of the GC100 Group Executive Committee FE Jonathan Dawson (70) Non-executive Director; Independent Appointed: 4 March 2013 Tenure: 9 years Skills and competencies: Jonathan, through his broad range of expertise within the finance and pensions sector, brings significant in-depth understanding in remuneration and financial matters to the Group. Jonathan previously held positions as Chairman of the Remuneration Committee and Senior Independent Director of Next plc and Chairman of the Audit & Risk Committee and Senior Independent Director at Jardine Lloyd Thompson Group plc. As a Non-executive Director, Jonathan brings an innovative perspective, scrutiny, constructive challenge and independent oversight to the Board. External appointments: • Chairman of River and Mercantile Group plc • Chairman and a founding partner of Penfida Ltd R F Thérèse Esperdy (61) Non-executive Director and Senior Independent Director; Independent Appointed: 18 March 2014 Tenure: 8 years Skills and competencies: Thérèse has significant international investment banking experience, having held a variety of leadership roles spanning 27 years. Her career began at Lehman Brothers and in 1997 she joined Chase Securities and subsequently JPMorgan Chase & Co, where she held a number of senior positions. With a distinguished career in the investment banking sector, Thérèse brings significant banking, strategic and international financial management expertise and knowledge of financial markets to the Board and to her role as Chair of the Finance Committee. Thérèse’s specialist knowledge combined with her sharp and incisive thinking enables her to contribute to, and constructively challenge on, a wide range of Board debates. External appointments: • Chair of Imperial Brands PLC • Non-executive Director of Moody’s Corporation AF P Group General Counsel & Company Secretary 88 National
Grid plc Annual Report and Accounts 2021/22 Our Board 18_Corp_Governance_and_Compliance_p84_98_v189.indd 88 27/05/2022 17:09

Key A Audit & Risk Committee F Finance Committee P People & Governance Committee R Remuneration Committee S Safety & Sustainability Committee E Group Executive Committee Committee Chair Other changes during the year: Sir Peter Gershon, Paul Golby and Mark Williamson stepped down as Non-executive Directors on 31 May 2021, 26 July 2021 and 31 December 2021 respectively. Nicola Shaw stepped down as Executive Director on 26 July 2021. Biographies as at 18 May 2022 Amanda Mesler (58) Non-executive Director; Independent Appointed: 17 May 2018 Tenure: 4 years Skills and competencies: Amanda brings to the Group extensive international leadership and general management experience from the technology and fintech sectors. She has over 27 years of experience at senior management and board level at large international companies. She led a $1 billion global practice at Electronic Data Services and has experience sitting on audit, risk and remuneration committees. Amanda provides an entrepreneurial perspective to the Board and valuable insight into the Company’s increasingly important technical evolution. External appointments: • Non-executive Director of Amadeus IT Group S.A. • Chair of Minna Technologies • Advisor to Macquarie Capital Anne Robinson (51) Non-executive Director; Independent Appointed: 19 January 2022 Tenure: Less than 1 year Skills and competencies: Anne has over 20 years of legal experience in the financial services industry, where she has counselled senior executives on a wide range of legal, regulatory and business issues. Anne has worked throughout her career to champion diversity, equity and inclusion whilst being a strong advocate for sponsorship and mentorship of other women in the legal profession. Anne brings to the Board expansive and varied legal experience in the financial services and consulting fields as well as experience of working closely with boards and investors on a broad range of ESG issues. Anne earned a BS from Hampton University and a JD from Columbia University Law School. External appointments: • Managing Director, General Counsel, and Corporate Secretary of Vanguard • Director of Minority Corporate Counsel Association • Director of Children’s Rights • Millstein Center Advisory Board at Columbia Law School Martha Wyrsch (64) Non-executive Director; Independent Appointed: 1 September 2021 Tenure: Less than 1 year Skills and competencies: Martha has held a number of senior positions in the energy industry and has significant experience of the US market, having been a Fortune 100 General Counsel and CEO of a major international gas-transmission business, as well as leading the growth and development of Vestas’ renewables business in the US. As an accomplished director for publicly listed companies, in both the UK and the US, Martha brings to the Board relevant experience across the renewable energy sector, as well as a strong understanding of the US regulatory environment, bringing enriching discussion and strategic thought to the Board. External appointments: • Independent Director of Quanta Services, Inc. • Independent Director of First American Financial Corp. • Advisor to Summit Carbon Solutions Earl Shipp (64) Non-executive Director; Independent Appointed: 1 January 2019 Tenure: 3 years Skills and competencies: With an extensive career in the chemicals industry and having held a senior leadership role in a safety-critical process environment, Earl brings significant safety, project management, environmental, sustainability and strategic expertise to the Board and its Committees, particularly in relation to safety management. This, along with his innovative way of thinking, enables Earl to contribute on a wide range of issues to Board and Committee debates and to effectively chair the Safety & Sustainability Committee. External appointments: • Non-executive Director of Olin Corporation • Non-executive Director of Great Lakes Dredge and Dock Co. Jonathan Silver (64) Non-executive Director; Independent Appointed: 16 May 2019 Tenure: 3 years Skills and competencies: Jonathan has considerable knowledge of the US-regulated energy environment, experience and understanding of integrating public policy and technology into a utility as well as a strong background in finance. Previously, Jonathan was the head of the US government’s $40 billion clean energy investment fund. Jonathan’s strong background in finance and government policy along with his long career at the intersection of policy, technology, finance, and energy brings innovative and positive insight to the Board’s policy discussions and to its interaction with management. External appointments: • Independent Director of EG Acquisition Corp. • Senior Advisor to Guggenheim Partners • Director of Plug Power Inc. • Director of Intellihot Inc. Tony Wood (56) Non-executive Director; Independent Appointed: 1 September 2021 Tenure: Less than 1 year Skills and competencies: Tony has proven business leadership credentials as an experienced CEO, and brings to the Board significant engineering experience. He is currently CEO of Meggitt plc and has led the operational and cultural transformation of the company, transitioning from an industrial holding structure to a focused and customer-led business, leveraging technology investment. Tony also held the position of President of the aerospace division at Rolls-Royce, during which time he developed a strong reputation as an operator, turning around and growing several challenging business units and internationalising the company’s footprint. External appointments: • CEO of Meggitt PLC • Director of ADS Group Limited R SP SA P A R S S P 89 C o rp o rate G o vernance National Grid plc Annual Report and Accounts 2021/22 18_Corp_Governance_and_Compliance_p84_98_v189.indd 89 27/05/2022 17:11
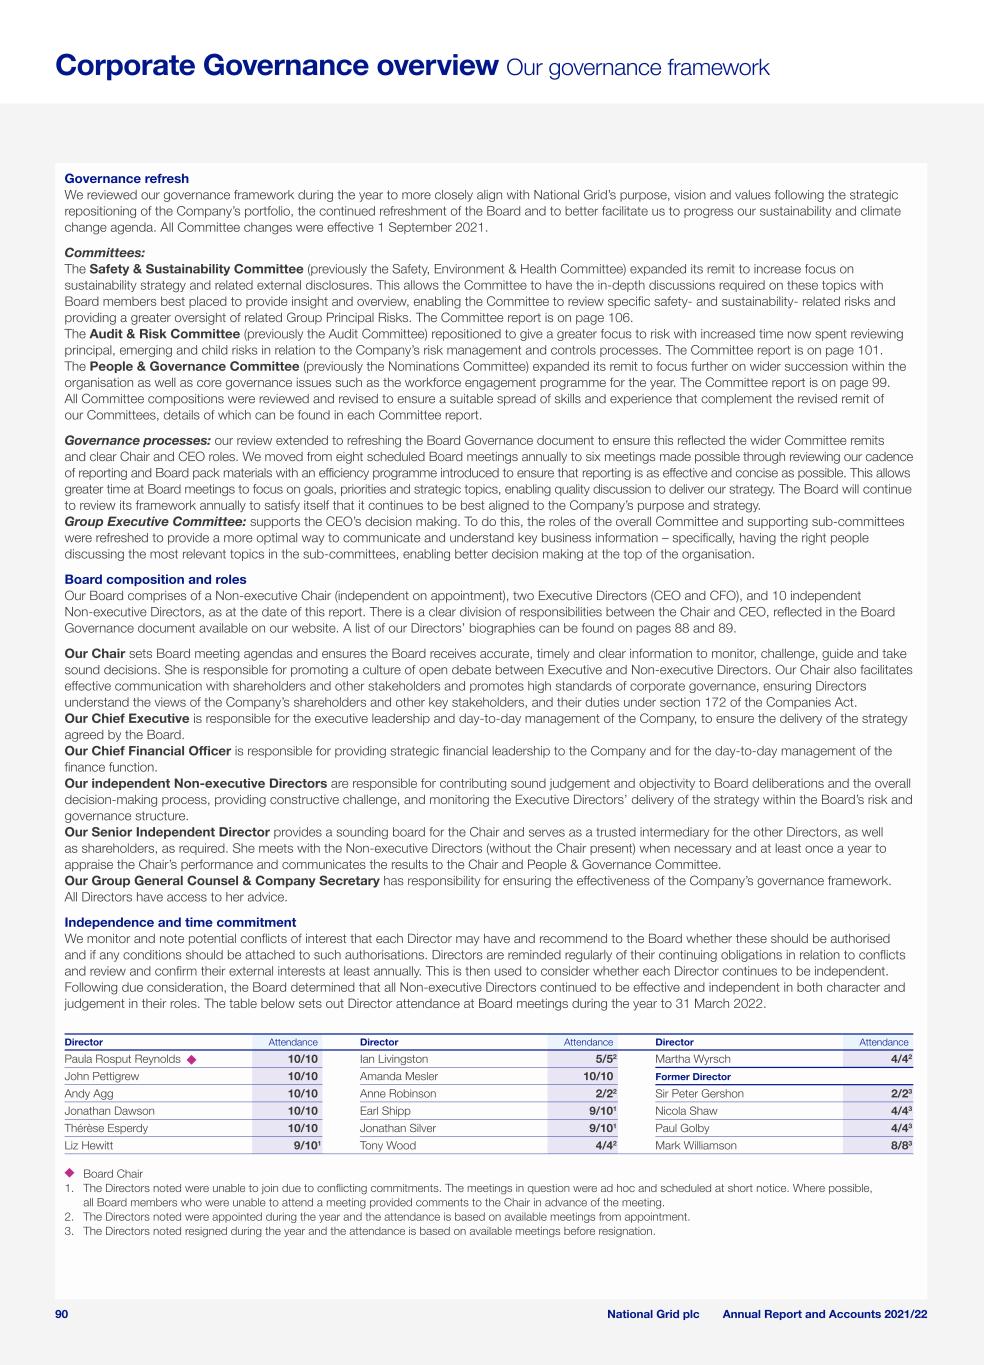
Governance refresh We reviewed our governance framework during the year to more closely align with National Grid’s purpose, vision and values following the strategic repositioning of the Company’s portfolio, the continued refreshment of the Board and to better facilitate us to progress our sustainability and climate change agenda. All Committee changes were effective 1 September 2021. Committees: The Safety & Sustainability Committee (previously the Safety, Environment & Health Committee) expanded its remit to increase focus on sustainability strategy and related external disclosures. This allows the Committee to have the in-depth discussions required on these topics with Board members best placed to provide insight and overview, enabling the Committee to review specific safety- and sustainability- related risks and providing a greater oversight of related Group Principal Risks. The Committee report is on page 106. The Audit & Risk Committee (previously the Audit Committee) repositioned to give a greater focus to risk with increased time now spent reviewing principal, emerging and child risks in relation to the Company’s risk management and controls processes. The Committee report is on page 101. The People & Governance Committee (previously the Nominations Committee) expanded its remit to focus further on wider succession within the organisation as well as core governance issues such as the workforce engagement programme for the year. The Committee report is on page 99. All Committee compositions were reviewed and revised to ensure a suitable spread of skills and experience that complement the revised remit of our Committees, details of which can be found in each Committee report. Governance processes: our review extended to refreshing the Board Governance document to ensure this reflected the wider Committee remits and clear Chair and CEO roles. We moved from eight scheduled Board meetings annually to six meetings made possible through reviewing our cadence of reporting and Board pack materials with an efficiency programme introduced to ensure that reporting is as effective and concise as possible. This allows greater time at Board meetings to focus on goals, priorities and strategic topics, enabling quality discussion to deliver our strategy. The Board will continue to review its framework annually to satisfy itself that it continues to be best aligned to the Company’s purpose and strategy. Group Executive Committee: supports the CEO’s decision making. To do this, the roles of the overall Committee and supporting sub-committees were refreshed to provide a more optimal way to communicate and understand key business information – specifically, having the right people discussing the most relevant topics in the sub-committees, enabling better decision making at the top of the organisation. Board composition and roles Our Board comprises of a Non-executive Chair (independent on appointment), two Executive Directors (CEO and CFO), and 10 independent Non-executive Directors, as at the date of this report. There is a clear division of responsibilities between the Chair and CEO, reflected in the Board Governance document available on our website. A list of our Directors’ biographies can be found on pages 88 and 89. Our Chair sets Board meeting agendas and ensures the Board receives accurate, timely and clear information to monitor, challenge, guide and take sound decisions. She is responsible for promoting a culture of open debate between Executive and Non-executive Directors. Our Chair also facilitates effective communication with shareholders and other stakeholders and promotes high standards of corporate governance, ensuring Directors understand the views of the Company’s shareholders and other key stakeholders, and their duties under section 172 of the Companies Act. Our Chief Executive is responsible for the executive leadership and day-to-day management of the Company, to ensure the delivery of the strategy agreed by the Board. Our Chief Financial Officer is responsible for providing strategic financial leadership to the Company and for the day-to-day management of the finance function. Our independent Non-executive Directors are responsible for contributing sound judgement and objectivity to Board deliberations and the overall decision-making process, providing constructive challenge, and monitoring the Executive Directors’ delivery of the strategy within the Board’s risk and governance structure. Our Senior Independent Director provides a sounding board for the Chair and serves as a trusted intermediary for the other Directors, as well as shareholders, as required. She meets with the Non-executive Directors (without the Chair present) when necessary and at least once a year to appraise the Chair’s performance and communicates the results to the Chair and People & Governance Committee. Our Group General Counsel & Company Secretary has responsibility for ensuring the effectiveness of the Company’s governance framework. All Directors have access to her advice. Independence and time commitment We monitor and note potential conflicts of interest that each Director may have and recommend to the Board whether these should be authorised and if any conditions should be attached to such authorisations. Directors are reminded regularly of their continuing obligations in relation to conflicts and review and confirm their external interests at least annually. This is then used to consider whether each Director continues to be independent. Following due consideration, the Board determined that all Non-executive Directors continued to be effective and independent in both character and judgement in their roles. The table below sets out Director attendance at Board meetings during the year to 31 March 2022. Director Attendance Director Attendance Director Attendance Paula Rosput Reynolds 10/10 Ian Livingston 5/52 Martha Wyrsch 4/42 John Pettigrew 10/10 Amanda Mesler 10/10 Former Director Andy Agg 10/10 Anne Robinson 2/22 Sir Peter Gershon 2/23 Jonathan Dawson 10/10 Earl Shipp 9/101 Nicola Shaw 4/43 Thérèse Esperdy 10/10 Jonathan Silver 9/101 Paul Golby 4/43 Liz Hewitt 9/101 Tony Wood 4/42 Mark Williamson 8/83 Board Chair 1. The Directors noted were unable to join due to conflicting commitments. The meetings in question were ad hoc and scheduled at short notice. Where possible, all Board members who were unable to attend a meeting provided comments to the Chair in advance of the meeting. 2. The Directors noted were appointed during the year and the attendance is based on available meetings from appointment. 3. The Directors noted resigned during the year and the attendance is based on available meetings before resignation. 90 National Grid plc Annual Report and Accounts 2021/22 Corporate Governance overview Our governance framework 18_Corp_Governance_and_Compliance_p84_98_v189.indd 90 27/05/2022 17:11

Board of Directors To operate efficiently and give the right level of attention and consideration to relevant matters, the Board delegates authority to its Board Committees. Each Committee Chair reports to the Board on their Committee’s activities after each meeting. Key matters considered by the Board include: • establishing the organisation’s vision, mission and purpose; • the Company’s strategy and long-term strategic objectives; • risk appetite and determination of Group Principal Risks; • overall corporate governance arrangements; • systems of internal control and risk management; • ensuring legal compliance and ethical integrity; • annual business plan and budget; • significant changes in capital structure; • ensuring the Company has adequate resources and that resources are managed responsibly; • succession planning for Board and senior management; • half-year and full-year results statements, Annual Report and Accounts and other statutory announcements; • oversight of the Company’s response to major crises and other significant challenges; • oversight of material ESG issues; • recruiting new Board members and assessing Board performance; • enhancing the organisation’s public standing and; • determination of the framework or policy for the remuneration of the Chair, Chief Executive, Executive Directors, Group General Counsel & Company Secretary, and direct reports to the Chief Executive, following recommendation from the Remuneration Committee. Group Executive Committee • Oversees the safety, operational and financial performance of the Company. It is responsible for making the day-to-day management and operational decisions it considers necessary to safeguard the interests of the Company and to further the strategy, business objectives and targets established by the Board. • Delegates authority to a number of sub-committees. • Members have a broad range of skills and expertise that are updated through training and development. Some also hold external non- executive directorships, giving them valuable board experience. Those members of the Committee who are not directors regularly attend Board and Committee meetings for specific agenda items. Remuneration Committee • Consideration and implementation of Remuneration Policy. • Consideration and exercise of discretion. • Incentive design and setting of targets. Sub-committees and other management committees Safety, Health & Sustainability Executive Sub-Committee; Ethics, Risk & Compliance Executive Sub-Committee; Reputation & Stakeholder Executive Sub-Committee; Policy & Regulation Executive Sub-Committee; Investment Committee; Disclosure Committee; Employee Share Schemes Sub-Committee. People & Governance Committee • Board and Committee composition. • Succession planning. • Board appointments. • Workforce engagement. Audit & Risk Committee • Financial reporting. • Internal controls, risk management and external compliance. • Corporate audit. • External audit and assurance. • ESG and climate change related disclosures. Finance Committee • Financing policies and decisions. • Credit exposure. • Hedging. • Foreign exchange transactions. • Tax strategy and policy. • Guarantees and indemnities. Safety & Sustainability Committee • Safety, health and sustainability strategy and policies. • Performance targets. • ESG and climate change- related targets, disclosures and action plans. How the Board operates Board and Committees Our Group Executive Committee Two Executive Directors are members of the Group Executive Committee, as well as being on the Board. The Group General Counsel & Company Secretary is also a member of the Group Executive Committee. See their biographies on page 88 – 89. Full biographies for the Group Executive Committee are available at: nationalgrid.com Governance structure The schedule of matters reserved for the Board and terms of reference for each Board Committee are available in our Board Governance Document at: nationalgrid.com Reports from each of the Board Committees, together with details of their activities, are set out on pages 99 – 131. 91 C o rp o rate G o vernance National Grid plc Annual Report and Accounts 2021/22 18_Corp_Governance_and_Compliance_p84_98_v189.indd 91 27/05/2022 17:11

Board focus during the year Our Board is collectively responsible for the effective oversight of the Company and its businesses. It determines the Company’s strategic direction and objectives, business plan, dividend policy, viability and governance structure to help achieve long-term success and deliver sustainable shareholder value. The Board also plays a major role in setting and leading the Company’s culture and wider sustainability goals. It considers key stakeholders in its decision making and, in doing so, ensures that Directors comply with their duty under section 172 of the Companies Act 2006. Our stakeholders considered in Board discussions Key matters considered Outcome Strategy Oversight and execution of several major strategic transactions Following the strategic pivot in the UK portfolio towards electricity with last year’s acquisition of WPD and the proposed sale of NECO and a majority stake in UK Gas Transmission, it was paramount that the Company continue to execute the current strategic pivot and transactions successfully. The Board maintained oversight of the transactions at every meeting and was updated on the progress of the integration of WPD into the Group and status of the NECO and UK Gas Transmission sales including key challenges and risks. In March 2022, the Board approved the delegation to a sub-committee to approve the transaction for the sale of a majority interest in UK Gas Transmission and our Metering business to a consortium comprised of Macquarie Asset Management and British Columbia Investment Management Corporation. In March 2022, the Board also approved the sale of National Grid’s interest in St William Homes LLP, to its joint venture partner, The Berkeley Group plc. Strategic priorities and Board performance With the addition of new Board members and the dynamic external environment, the Board established an agenda to review each business unit to understand its current performance, regulatory structure, financial framework, culture and our future strategy. The Board deliberated how to spend its time throughout the year by identifying key areas for strategic discussion. The Board set goals for itself to ensure clarity of direction at every meeting. External insights were also provided throughout the year: • the Board heard from an expert in UK energy policy and discussed the challenges of the energy transition; • the Chief Economist at bp plc provided energy forecasts and insights on the energy transition; and • the CEO of Tennet (a leading European electricity transmission system operator) gave perspectives on the opportunities associated with developing offshore transmission in the UK and North West Europe. The Board also met with the New York Independent System Operator, the Chair and CEO of Ofgem, and the representatives of the business community in New York to discuss key issues, challenges and to hear their perspectives. The Board were also briefed by brokers in the year. Our commitment to reach net zero In the year, the Board discussed ESG matters, including key strategic enhancements to keep pace with stakeholder expectations and to be aligned with commitments as a responsible business. The Safety & Sustainability Committee and the Audit & Risk Committee reviewed climate change reporting disclosures, within their respective remits. The Board approved the Climate Transition Plan in May 2022 – ahead of the 2022 AGM. See the Remuneration Committee report on how we have linked ESG to Director remuneration at page 108. Enrichment sessions Outside of Board meetings, Directors joined additional sessions with our Strategy team to learn more on emerging topics including heat pump technology, CCUS and prospects for hydrogen. The Board also met out of cycle in April 2022 for a focused session looking at the disclosures required by the Company in relation to ESG. The Board also received a briefing on key energy policy announcements and energy security decisions being made in the UK. Colleagues Investors Regulators Communities Customers Suppliers 92 National Grid plc Annual Report and Accounts 2021/22 Corporate Governance overview continued 18_Corp_Governance_and_Compliance_p84_98_v189.indd 92 27/05/2022 17:11

Key matters considered Outcome Business Plan and financial performance Aligning the Strategic Business Plan and budget to the strategy In the year, the Board discussed and approved the Strategic Business Plan, to promote alignment of financial performance and strategy. It further reviewed a five-year view of the Group which incorporated portfolio changes. In June 2021, the Board received the budget revision, reflecting the impact of portfolio changes and the changes to the operating model on the Group’s targets. Dividend Since approval in January 2021, it was agreed that from FY21/22 the Company would seek to grow the dividend in line with CPIH, reflecting a move from RPI to CPIH in the UK regulated businesses. The Board considered the dividend policy at its November 2021 and May 2022 meetings and approved the proposed interim and final dividend payments. RIIO-T2 financial structure During the year, the Board reviewed the RIIO-T2 framework and how the Company will align its approach to operations given the change in regulatory incentives. Following the acquisition of WPD, the Board discussed and approved the RIIO-ED2 business plan for submission in December 2021 and received updates on the ongoing process. Political and regulatory environment Impacts on the UK energy market Throughout the year, the Board was updated on the disruption in the UK market as retail suppliers began to fail and how National Grid was responding. In early 2022, the Board was briefed on how the crisis in Ukraine could potentially affect the UK and the wider energy environment. As the conflict continued, the Board continued to be briefed on the significant impacts on the UK energy market, including the high and volatile prices, impact on consumers and direct impacts on the Company. The Board continued to have oversight of the impact on affordability and UK Security of Supply, cyber security and potential cost recovery. UK RIIO-T2 price control During the year, regular updates were provided on the RIIO-T2 price control appeal process and the holistic five-year strategy to deliver RIIO-T2 in ET. Early in the year, the Board challenged the Company’s response to the provisional determinations and following the submission of a technical appeal to the Competition and Markets Authority (CMA) around the RIIO-T2 cost of equity and outperformance wedge; the CMA found in favour of our arguments on the outperformance wedge. US The Board reviewed the current US regulatory structure, including the current regulatory and financial frameworks in place and core components of the US regulatory framework and the performance profile of the US business. Twice in 2021, the Board met with the Monitor who was overseeing gas capacity planning for New York. The Board reviewed the Long Term Capacity Report; the Company is compliant with the terms of settlement. The Board discussed the stakeholder engagement plan and key challenges and risks going forward. The Board noted the rate case agreements that had been completed for KEDNY, KEDLI and NMPC, and noted the filing of a plan with the Massachusetts Department of Public Utilities. 93 C o rp o rate G o vernance National Grid plc Annual Report and Accounts 2021/22 18_Corp_Governance_and_Compliance_p84_98_v189.indd 93 27/05/2022 17:11

Key matters considered Outcome People and culture Evolution of the Group culture of accountability, agility and performance The Board is responsible for monitoring and assessing both the culture of the Group and its alignment with the Company’s purpose, values and strategy. These elements are vital to our long-term success as a Company, as the availability of resources and operating procedures require Board engagement inside and outside of the boardroom. You can read more about how the Board monitors culture on page 95. Risk Review and approval of Group Principal Risks and emerging risks During the year, the Board completed a review of the Company’s risk appetite, principal risks and emerging risks and how we manage them. It was agreed to retire the disruptive forces risk and de-escalate the data management risk. In May 2022, the Board reviewed and approved the effectiveness of the Group’s risk management system, following updates in the year from the Audit & Risk Committee and the Safety & Sustainability Committee on focused risks within their remit. You can read more about our risks on pages 28 – 32. Governance Refreshing our governance framework With so much change within the business and the rapidly changing external landscape, the Board reviewed the entire governance framework to ensure it remained fit for purpose. Committee composition and remit were refreshed and refined. You can read more about this on page 90. The Board will continue its focus on the strategic priorities, including monitoring the actions, milestones and timelines to deliver the strategy. We will continue using enrichment sessions outside of the regularly scheduled Board meetings to deepen the Board’s working knowledge on selected topics. All Board members will also continue to undertake site visits to see the work of National Grid for themselves. Looking forward: 94 National Grid plc Annual Report and Accounts 2021/22 Corporate Governance overview continued 18_Corp_Governance_and_Compliance_p84_98_v189.indd 94 27/05/2022 17:11

Members of the Board visited the IFA interconnector site at Sellindge in March 2022. Following a catastrophic fire at the site in September 2021, the Board and Committees have had oversight of the investigation into the root cause. The site visit consisted of a tour of the facility and an overview of the damage and reparations. It also provided the opportunity for Board members to hear directly from employees and contractors on site. For further information on culture, please see page 65. The Board plays a significant role in monitoring and assessing both the culture of the Group and its alignment with the Company’s purpose, values and strategy. The People & Governance Committee also plays a key role in keeping momentum in relation to management development and succession. This year, focus has been on executive development in particular. Although not all Board members sit on the People & Governance Committee, they have access to all Committee papers and regularly attend the People & Governance Committee meetings. The Chair reports back to the full Board following each meeting, which also provides the opportunity for full Board input and to ensure it is monitoring culture effectively. There has been a vast amount of change both within the organisation and externally over the last few years. The importance of creating the right culture throughout the Company, to ensure our colleagues are embracing positive and inclusive behaviours and values in everything we do, has never been more important. The Board assesses the Company’s culture and the progress being made from two key data sources: • lagging indicators from the Grid:voice survey and the Spencer Stuart culture diagnostic; and • leading indicators taken from the culture change activity underway across the organisation. The full Board joined the People & Governance Committee to discuss with Spencer Stuart matters including the context, backgrounds and updates to the work that the Company had been undertaking to identify and cultivate senior talent. The full Board reviewed the assessments undertaken against the methodology used to assess the talent pipelines. Grid:voice employee survey Our Grid:voice survey this year provided a set of strong results, with improvements in a number of areas including the ‘Safe to Say’ scores, which are six points higher than the high performing norm. This has demonstrated that there is an open culture within the organisation where individuals feel that they are able to express their views, opinions and concerns. The Board also monitors areas that are not as strong performing as others and tracks progress. Consideration in the year was also given to WPD’s results, the first year that these had been included. There is focus required in this area to work to align the results with the rest of the organisation and the Board will monitor to ensure progress is achieved. Leading indicators of change In addition to the quantitative data, the Board also monitors leading indicators of change. Throughout the year this has been through the results of the organisation’s ‘Living our Values Everyday’ campaign, ‘Untapped AI’ personal development coaching activity and through the ‘Team Effectiveness’ facilitation programme. Looking forward Our culture diagnostic work will continue to progress with the next goal in this area to move the characteristics of ‘Results’ further up and move ‘Order’ down. The challenge will be to maintain the changes made around ‘Purpose’ and ‘Caution’, whilst focusing organisation-wide and everyday action change on becoming more ‘Customer’ and ‘Performance’ orientated. The Board will continue to spend considerable time on culture and monitor the progress in this area. One of the Board’s goals for 2022/23 is to ensure laser-like focus is on management succession, including a focus on continuous culture improvement. The biggest impact on colleague engagement and culture is line managers and the tone that is set from the top of the organisation. Recognising this, the Company’s ‘leadership index’ sets expectations for leadership behaviour, and provides actionable insight for leaders to focus development that has a positive impact on their immediate team. 2022 was the third full ‘leadership index’ that has been created and demonstrated positive progress with a reduction in the number of leaders scoring below our target levels. This has highlighted the positive and significant impact our individual leaders across the organisation can have on their own behaviour. Culture diagnostic The culture diagnostic work has shown a clear shift towards our desired culture and in particular indicated that the characteristic of ‘Caution’ had moved downwards and ‘Purpose’ had moved upwards, demonstrating a significant step forward over the last 12 months. The strongest culture traits for the Group are now ‘Purpose’, ‘Caring’ and ‘Order’. 95 C o rp o rate G o vernance National Grid plc Annual Report and Accounts 2021/22 How the Board monitors culture 18_Corp_Governance_and_Compliance_p84_98_v189.indd 95 27/05/2022 17:11

Workforce engagement Throughout the year we continued with our ‘Full Board Employee Voice’ approach, utilising and enhancing existing colleague engagement methods and communication channels to ensure meaningful engagement across all locations. The programme, overseen by the People & Governance Committee, monitors the effectiveness of the programme and reviews the chosen mechanism under the Code at least annually. The variety of engagement is a great way of building and maintaining trust and communication whilst providing our people with an appropriate forum to influence change. In the year we shared a selection of short videos of our new Non-executive Directors with our colleagues to help familiarise them with their Board. Board engagement programme Small sessions These sessions make up the majority of the Board engagement programme in the year. They consist of around 10 individuals in attendance and a different subset of Board members. Attendees are coordinated by HR and are diverse across our workforce. Some of the sessions are open discussion with no set agenda whilst others have recommended topics; for example, in May 2022, our employees discussed our Climate Transition Plan and the new Remuneration Policy ahead of these going to the AGM for shareholder vote. Employee Resource Groups (ERG) and high-potential employees The Chair met with multiple ERG leads and participated in a ‘learning from leaders’ session with the ‘Women in National Grid’ (WING) ERG. Our high-potential employees also had the opportunity to meet with the Board and share their views. This was a great opportunity for the Board to meet our high-potential employees informally and reconfirmed the need to actively support their career development, a topic very much on the People & Governance Committee’s agenda for the year ahead. Virtual ‘town hall’ Our Chair and CEO hosted a virtual town hall in January 2022 with a cross-section of the US workforce. Discussions included community engagement, diversity and inclusion, the clean energy transition and gas supply. This was one of the first opportunities for some of our colleagues to meet our Chair since she had been in role. Committee focused These included an Audit & Risk Committee virtual session in January 2022 with US finance colleagues and a Finance Committee discussion with colleagues from the Pension, Tax, Financial Planning and Treasury teams in July 2021. Engineering dinner Earl Shipp and Tony Wood attended a dinner in March 2022 to recognise engineers involved in world-leading Energy Transition projects including T-Pylons, the UK’s new nuclear power station and the Storm Eunice response. The event provided the opportunity for individuals to discuss a range of topics including SF6, engineering capability and the strategic direction taken by the Board. Site visits It was really positive for Directors to be able to get back out on site following the COVID-19 pandemic, and this year saw optional visits scheduled around Board meetings. These vital engagement forums provided the opportunity for smaller groups of the Board to hear views from and see the workforce in action and included the IFA interconnector at Sellindge, the London Power Tunnels and WPD’s control centre. Feedback and decision making Following all engagement, the Board takes the time to discuss the views of the workforce and takes these into consideration throughout wider Board discussions, a topic on each Board agenda going forward. Following feedback in the external Board evaluation this year, a set of ‘ground rules’ were re-established by the Board to increase transparency around engagement and to ensure that following any non-scheduled engagement events, views heard are captured and reported back to the boardroom or the CEO/CFO, where appropriate. Looking ahead The People & Governance Committee reviewed the engagement mechanism at its March 2022 meeting and agreed that the current approach remained the most appropriate mechanism. The variety of sessions provides a valuable link between our colleagues and the Directors, and we look forward to hearing more from our employees this year. As the world and priorities continue to evolve, we will continue to keep the overall approach under review and updated and refined as required. Engagement is key to the Group’s long-term success and the Board directly and indirectly engages with key stakeholders, ensuring it understands their interests and takes them into account in Board decision making. You can read the Board’s section 172(1) statement on page 56. Shareholder engagement The Board is committed to maintaining good communications with existing and potential shareholders. The Company has a comprehensive investor relations programme where a range of key investors are met with in person or virtually at small meetings and larger investor roadshow events. The Board Chair also engages with large shareholders and the Remuneration Committee Chair engages specifically on remuneration practices. Management also hosts webcasts for both our half-year and full-year results and takes questions from investors and analysts to ensure an open dialogue with the market. Presentations given to analysts and investors covering the Group’s results, along with all results and other regulatory announcements as well as further information for investors, are included on the investor relations section of our website at nationalgrid.com/investors. Further information on our engagement with our retail shareholders is set out on page 97 under Annual and General Meetings of shareholders. Capital Markets Day In November 2021 we hosted our first Capital Markets Day. This was a hybrid event giving investors the opportunity to engage online or in person with key members of the Group Executive Committee and National Grid leaders. As part of this, we held a number of ‘teach in’ sessions to support investors’ knowledge of our business units and key strategy areas for the Group. The Capital Markets Day videos are on our website at nationalgrid.com/investors. ‘Grid Guide to...’ Throughout the year our investor series continued. The series consists of short, virtual sessions covering our ambitions and progress across a range of ESG themes. Some of the key sessions of the 2021/22 programme included: • May 2021 – Grid Guide to... Our People; • July 2021 – Grid Guide to... the Decarbonisation of Transport; • October 2021 – Grid Guide to... the Future of Heat in downstate New York; and • March 2022 – Grid Guide to... National Grid’s Sustainable Supply Chain. 96 National Grid plc Annual Report and Accounts 2021/22 Board engagement Corporate Governance overview continued 18_Corp_Governance_and_Compliance_p84_98_v189.indd 96 27/05/2022 17:11

Annual and General Meetings of shareholders In April 2021, we held a General Meeting to seek approval from our shareholders for the acquisition of WPD. We also announced our intention to sell a majority stake in UK Gas Transmission and the sale of NECO at this time. This meeting took place behind closed doors due to COVID-19 restrictions; however, shareholders were invited to submit questions in advance of the meeting and were answered in a shareholder webcast. In July 2021, our Annual General Meeting (AGM) took place in London. We also facilitated the ability for shareholders to view the meeting remotely, register and ask any questions both in person or virtually. Voting levels were largely consistent with previous years, despite the disruption caused by COVID-19 restrictions in place. All resolutions were passed at the meeting in line with the Board’s recommendations. The pandemic has clearly demonstrated the efficiency of virtual and hybrid meetings and allows for greater levels of engagement and participation by individuals. A resolution to amend our Articles of Association to allow for hybrid AGMs was approved in 2021. Our 2022 AGM in July will be conducted in the hybrid format. The Notice convening the 2022 AGM will be made available to shareholders in advance of the meeting. This will provide shareholders with the appropriate time to consider matters. The results of the proxy votes on each resolution will be collated independently by the Company’s registrar and will be published on the Company’s website after the meeting. Looking forward We maintain a comprehensive investor relations programme throughout the year. Please visit our website to keep up to date as events are announced at nationalgrid.com/investors. Materials from recent seminars and access to our educational videos and podcasts can also be found online and on our social media channels. Performance evaluation 2021/22 external Board evaluation Our annual evaluation provides the Board and its Committees with an opportunity to consider and reflect on the quality and effectiveness of their decision making, and for each member to consider their own contribution and performance. In accordance with the Code, which outlines in the Provisions that the Company should undertake an externally facilitated evaluation every three years, the 2021/22 Board evaluation was conducted externally. In May 2021, National Grid engaged Independent Board Evaluation (IBE) to facilitate this year’s Board evaluation. Following initial briefings in October 2021, the evaluation began with Board and Committee observations in November 2021. This was supplemented with Director and management interviews. Results were fed back to the Chair in December 2021 and then presented to the Board in January 2022. The Board agreed the set of actions outlined below in March 2022. National Grid confirms neither the principal consultant nor IBE has any connection with the Company, individual Directors nor the Company Secretary. Findings of the Board evaluation The Board has been through significant change over the past year, as noted in the evaluation. Findings of the evaluation take into account the appointment of a new Chair with effect from 31 May 2021 and a number of changes amongst the Non-executive Directors. The Board views these changes as positive. The review noted that National Grid is underpinned by robust governance and compliance. Succession planning, culture and strategy were identified as key areas of focus for the year ahead, with opportunity for Board materials to be further streamlined. Board Committees’ effectiveness Each Board Committee was included as part of the evaluation and each Committee received a detailed report. IBE noted that the Committee structure had also been through a period of change, which has refocused the remit of each Committee. The Chair has engaged on feedback with each Committee Chair and, following the Board agreeing its action plan and goals in March 2022, each Committee will set an outline of key areas of focus for 2022/23. Performance of the Chair As part of IBE’s evaluation, in line with the Code, each individual Director’s effectiveness was evaluated, including our Chair’s performance. Detailed feedback was shared directly with the Senior Independent Director, Thérèse Esperdy. An overview of the findings was shared during a private session between Thérèse and Paula. The Board recognised in its feedback that Paula had led the Board effectively during a period of significant change whilst outlining vital key strategic priorities for the business. Focus area Board actions for 2022/23 Strategy • Finalise Board strategic topics for 2022/23 and ensure agendas align. Capability • Strengthen focus on talent and succession at all levels. Include regular reviews on People & Governance agendas and align with opportunities for the Board to meet high-potential employees. Culture • Incorporate the results of the culture scorecard in People & Governance Committee deliberations. Employee engagement • Review and refine the overall approach to employee engagement. • Ensure key insights from engagement opportunities are shared with the Board. Engagement with management • Ensure effective communication flows to provide the right insights, including early sight of emerging issues when required. Process and meeting management • Continue to improve discipline around Board papers and processes. • Routinely bring outside views into the boardroom. ESG • Ensure that ESG commitments are embedded in the Board’s stewardship. 97 C o rp o rate G o vernance National Grid plc Annual Report and Accounts 2021/22 18_Corp_Governance_and_Compliance_p84_98_v189.indd 97 27/05/2022 17:11

Directors’ induction, development and training The Chair has overall responsibility for ensuring that our Non-executive Directors receive a comprehensive induction and suitable ongoing development and training. This is key to enabling Board effectiveness individually and as a whole. New directors receive comprehensive induction programmes and induction packs, tailored to their experience, background, committee membership and requirements of their role. They are encouraged to engage with the business by visiting key sites in the UK and US. As our internal and external business environment continues to change, it is important to ensure that Directors’ skills and knowledge are refreshed and updated regularly. During the year, Non-executive Directors attended a detailed session on digital initiatives across the Group ahead of a digital discussion at the Board meeting. The Board also had the opportunity to attend a series of enrichment sessions; topics presented through the year included heat pumps, CCUS, hydrogen and ESG. Further enrichment sessions are scheduled for 2022/23 on topics such as energy market reform, customer disruption and offshore wind market operations and projects. Significant focus was given to prepare Ian to step into the role of Chair of the Remuneration Committee from January 2022 alongside an introduction to the Group’s Remuneration Policy. Ian also received an overview of the Group’s strategy, key business operations and matters pertinent to the Audit & Risk Committee. Martha joined as a member of the Safety & Sustainability Committee and Remuneration Committee. Focus was given to key safety, sustainability and remuneration-related matters. In September 2021, Martha visited National Grid’s diversion site supporting HS2, gaining first-hand insight on the challenges the team faced during the project. On appointment, Anne joined as a member of the Safety & Sustainability Committee. Focus was given to key safety and sustainability matters alongside an overview of the Group and current strategy. Anne will also join the Remuneration Committee in July 2022 and will be undertaking sessions on remuneration. Tony joined as a member of the Safety & Sustainability and People & Governance Committees. Focus was given to key matters in relation to safety and sustainability alongside an overview of the Group. As part of his induction, Tony visited two key UK sites, Isle of Grain and London Power Tunnels, in August 2021. Ian Livingston Anne Robinson Martha Wyrsch Tony Wood Induction area Provided by Topics covered Attended by Governance and Director Duties Chair of the Board Group General Counsel & Company Secretary Head of Company Secretariat External Legal Counsel • Priority areas for the Board • Governance framework and corporate structure • Overall legal matters • Director duties for a listed company • Market Abuse Regulations IL AR MW TW Remuneration Committee Chair of the Remuneration Committee Chief People & Culture Officer Group Head of Reward External remuneration consultant (PwC) • Priority areas for the Remuneration Committee including Committee Chair succession • Remuneration Policy • Remuneration matters IL MW Audit & Risk Committee Chair of the Audit & Risk Committee Chief Financial Officer Group Head of Audit Chief Risk Officer Group Financial Controller External auditor (Deloitte) • Priority areas for the Audit & Risk Committee • Regulatory finance model • Financial reporting framework • Risk management framework and principal risks • External audit including lead partner succession IL Safety & Sustainability Committee Group Head of Safety Group Chief Engineer • Priority areas for the Safety & Sustainability Committee • National Grid’s approach to safety and sustainability • Engineering assurance • Climate change and climate risk AR MW TW Strategy Chief Strategy & External Affairs Officer Chief Sustainability Officer • National Grid’s strategy and transition to net zero • COP26 IL AR MW TW “ As such a large cohort of Directors has joined the Board during the year, it’s been crucial that we get them up to speed quickly. Our induction, development and training programme has been vital in supporting this.” Paula Rosput Reynolds 98 National Grid plc Annual Report and Accounts 2021/22 Corporate Governance overview continued 18_Corp_Governance_and_Compliance_p84_98_v189.indd 98 27/05/2022 17:12

emerging leaders, and to identify where we need to introduce new skills and experience into the organisation. In its first year, the Committee has focused on executive development in particular. However, we have also reviewed the results of the culture survey, reviewed the demographics of our workforce and turnover, and used our engagement sessions to learn more about the temperament and issues of the wider workforce. In line with our expanded remit, the Committee considered our workforce engagement mechanism and agreed to continue with our chosen method of enhancing existing Board engagement sessions. We discuss the learnings of these engagement sessions at every Board meeting, discussing whether we have the pulse of the organisation. We also have a schedule for the year to ensure we are meeting with organisations on both sides of the Atlantic, in offices, depots, and on the front line. At year end, the Committee considered whether these small and larger engagements remain appropriate and effective for us to stay in touch with all levels of the organisation and at this time we are agreed that they do; however, we will continue to challenge and review effectiveness in this area. See pages 96-97 for an overview of Board engagement activity through the year. Diversity, equity and inclusion (DEI) In 2021, the Company appointed its first senior executive with a remit specifically tied to diversity and inclusion. Natalie Edwards, our Global Chief Diversity Officer, has met with us to review the global DEI strategy, which includes a clear set of DEI commitments which will provide clarity and direction for the organisation. The work of the team in engaging with the workforce has been exemplary and we anticipate having Natalie meet with us frequently given the importance of this agenda. We also welcome the FCA’s new listing rule requirements around diversity and inclusion reporting. These will apply for our next year’s report; however I’m happy to report that we are already in compliance with these measures. Culture and accountability High-performing organisations are characterised by, among other things, clarity on goals and performance. To this end, the Board had an independent consultant review our board effectiveness and gather feedback on each of us as a contributor. Through this process, we are seeking to model the very culture that we seek to strengthen in the organisation. We are actively engaged with the Remuneration Committee and the Board as a whole in ensuring that there are clear objectives for the organisation and leaders so that we both monitor progress and measure outcomes. See page 95 to read more about how we as a Board monitor the culture of the Company. Paula Rosput Reynolds Committee Chair Year in review On appointment, I requested Justine Campbell, Group General Counsel & Company Secretary to undertake a full review of the appropriateness of the Board Committee structure, terms of reference for the respective committees and overall effectiveness. The outcome of that review was to update the remits of the various committees. Notably, the Safety, Environment and Health Committee was repurposed as the Safety & Sustainability Committee, the Audit Committee as the Audit & Risk Committee and the Nominations Committee was repurposed as the People & Governance Committee. All were with effect from 1 September 2021. With respect to the latter Committee, the subject of this letter, let me simply restate the obvious: people make all the difference. So we formed a committee that looked not just at the process of governance but its content. To read further about the Committee refresh and governance framework, see page 90. Board composition Sir Peter Gershon, our prior chair, was kind enough to appoint me to chair of the Nominations Committee when I joined the Board in January 2021. Having the opportunity to chair both this Committee and the Board allows for me to ensure there is alignment across our governance practices and to ensure robust oversight of succession. Sir Peter recognised that the Board would have quite a bit of turnover in membership due to a substantial number of directors reaching the limits of their terms and that I should be the one leading the process of identifying new directors. In the year we recruited a number of new directors from diverse backgrounds and experiences, four of whom were seated earlier in the financial year and one who will join the Board ahead of this AGM. All Board members participated in the recruitment and it was encouraging how much agreement there was as to the talent we needed. There was also a unanimity of view that we were seeking seasoned senior professionals who were confident in their capabilities, independent in their thought processes, curious about our business, and invested in a commitment to a net zero future. Collectively, they bring vitality and energy to the boardroom, gracefully balancing support and challenge. Because such a large cohort of directors has come on board at one time, we will seek to stagger terms so that we don’t encounter the same ‘cliff’ of retirements in the future as we experienced this year. Management development and succession In my first meeting as Board Chair, we began by exploring what were the most important things we needed to accomplish as a Board. From that discussion, we adopted goals for our work. One area that stood out was the need for a more robust process of reviewing management development and executive succession, a key responsibility of this Committee. We worked with our Chief Executive to review the succession pipeline for many of the key roles in the Company, to discuss development plans to our Key decisions during the year • Approved four Board appointments in the year • Reviewed and approved Board and Committee composition and refreshment • Reviewed and approved the Board Diversity Policy and progress against objectives • Reviewed and approved the continuation of the Board ‘workforce engagement’ approach Composition and Committee attendance: The Committee is made up of four independent Non-executive Directors and the Chair of the Board. Committee members Attendance Paula Rosput Reynolds1 4/4 Thérèse Esperdy¹ 4/4 Jonathan Silver¹ 4/4 Earl Shipp¹ 4/4 Tony Wood3 3/3 Former Committee members Attendance Paul Golby2 1/1 Liz Hewitt2 1/1 Mark Williamson2 1/1 Amanda Mesler2 1/1 Jonathan Dawson2 1/1 Committee Chair 1. Member of the Nominations Committee until 1 September 2021 and became a member of the refreshed People & Governance Committee from this date. 2. Member of the Nominations Committee until 1 September 2021. 3. Became a member of the Committee on appointment to the Company on 1 September 2021. 99 C o rp o rate G o vernance National Grid plc Annual Report and Accounts 2021/22 People & Governance Committee report 19_People_and_Governance_Committee_p99_100_v62.indd 99 27/05/2022 17:15

Objectives Progress The Board aspires to meet and ultimately exceed the target of 33% of Board and the CEO’s direct report positions to be held by women. There are currently six female Directors on the Board, resulting in 46% women on the Board. We currently have 33% female direct reports to the CEO. The Board aspires to meet and ultimately exceed the Parker Review target for FTSE 100 boards to have at least one Director from a non-white ethnic minority by 2021. We currently have two Directors from a non-white ethnic minority. The Board aspires to achieve 50% diversity* on the Board. We currently have 54% diversity on the Board. * Diversity of the Board is defined, in this context, as female and non-white ethnic minorities. Our Policy determines that: • all Board appointments and succession plans are made on merit and objective criteria, in the context of the skills and experience that are needed for the Board to be effective and to guard against ‘group think’; • we will only engage executive search firms who have signed up to the UK Voluntary Code of Conduct on Gender Diversity; and • we will continue to make key diversity data, both about the Board and our wider employee population, available in the Annual Report and Accounts. In the year, the Committee will review the Policy and associated objectives to consider if these remain appropriate and update as necessary to ensure these remain relevant and stretching. Report on progress against our objectives (as set out above) will continue to be outlined in the Annual Report and Accounts. Examples of the initiatives to support inclusion and diversity throughout our Company are set out on page 66. Appointments, skills and the talent pipeline The Board has a wide range of skills and experience and considers this when appointing new Directors. Skills such as ESG and climate change have been given greater focus in recent years to reflect the evolving strategy of the Company. The graph to the side provides an overview of the breadth of skills and experience currently on the Board. The Committee took account of these, as well as level of experience required and diversity, when considering appointments in the year. The appointments of Ian, Tony, Martha and Anne followed a transparent and thorough process, outlined below. • Russell Reynold Associates and MWM Consulting were appointed jointly as the search firm for each appointment made throughout the year. There are no connections between the search firms, the Company and its individual directors. They reviewed our requirements and developed specific criteria for candidate selection alongside the requirement for broader Non-executive Director characteristic requirements, including deep engineering expertise, transformational experience and strong credentials in the future of energy and ESG considerations. • Individual role profiles were created and a short list of candidates presented for consideration to the Chair of the People & Governance Committee. • Preferred candidates met with members of the Board, who reported back to the People & Governance Committee. • Leading candidates were identified and the People & Governance Committee recommended these for approval by the Board. The Committee discussed the talent pipeline regularly, giving focus to ensuring development opportunities also reached further into the organisation and identified those less advanced in their careers but with long-term potential. A Future Leaders Programme was highlighted to the Committee and would be built into the regular talent updates. The programme focuses on less senior colleagues, enabling a wider group of potential future talent to enjoy a structured development programme, using digital tools as well as tailored support. At senior management level, the Committee approved the appointment of Ben Wilson as Chief Strategy & External Affairs Officer, Stephen Woerner as President, New England, and Will Serle, who joined the Company as Chief People & Culture Officer. Phil Swift also joined with the integration of WPD as President, WPD. All four individuals joined the Group Executive Committee. Alison Kay, interim Chief Strategy & External Affairs Officer, Andy Doyle, Chief People & Culture Officer; and Badar Khan, President, US, stepped down in the year. Diversity policy objectives – progress update The People & Governance Committee noted progress against the following Board Diversity Policy objectives at its March 2022 meeting: Our Board diversity As at 31 March 2022 Male 7 Female 6 Board gender British 6 American 7 Board members by nationality Executive 2 Non-executive 11 Executive and Non-executive Directors < 3 years 6 3-6 years 4 > 6 years 3 Tenure Engineering Competitive Market Digital Risk management General Management Safety Compliance/Regulation ESG Energy International Government/Political Cyber Technology/Innovation M&A Finance/Audit/Banking Climate change 3 6 13 6 2 10 10 9 12 4 12 12 2 11 6 9 Board skills and experience 100 National Grid plc Annual Report and Accounts 2021/22 People & Governance Committee report continued 19_People_and_Governance_Committee_p99_100_v62.indd 100 27/05/2022 17:15

Engagement In October 2021, we had a roundtable session giving Committee members the opportunity to engage with key management personnel in the UK and US, and this doubled as an induction session for Jonathan and Ian, whom I was glad to welcome to the Committee. We also held a virtual question and answer session with members of the US Finance, Risk and Global Internal Audit teams in January 2022. We are looking forward to returning to the US later in 2022 when I hope to host a similar in-person session. These were key parts of the wider stakeholder engagement focus for the Board which is detailed on pages 96–97. Transactions We have performed an active role monitoring the progress of the various transactions across the Group. We received regular updates relating to the integration of WPD’s financial reporting and risk and controls framework into the Group and we had an informative session with the CEO and CFO of WPD in November 2021, who provided an overview of the business. We were regularly kept up to date on the Company’s strategic portfolio transactions, including updates from management in relation to the accounting issues linked to the UK Gas Transmission (NGG) and NECO sales. Thank you I would like to thank Committee members, the management team and Deloitte for their commitment throughout an extremely busy year and for their contribution, support and integrity provided in support of the Committee’s work. A sincere thank you must go to Doug King, who has completed his fifth and final statutory audit for National Grid. He has been a pleasure to work with and we are extremely grateful for his constructive challenge and professionalism over the past five years. Liz Hewitt Committee Chair Role of the Committee The work of the Audit & Risk Committee has never been more important: investors, regulators and other stakeholders require ever more informative and reliable reporting, not just of the results and financial position, but of resilience, risk management and the Company’s environmental, social and governance (ESG) position and progress. The Committee also oversees and evaluates the Company’s approach and controls relating to the prevention and detection of fraud and bribery, including overseeing the effectiveness of whistleblowing mechanisms. In September 2021, the Committee’s remit was expanded to have an increased delegation from the Board in relation to risk. We have spent significant time updating the reporting cadence of risk matters, working closely with the Chief Risk Officer to support effective oversight of the Company’s principal, emerging and child risks and associated enterprise risk- management processes. Review of the year I’m delighted to be writing to you following my first full financial year as Audit & Risk Committee Chair. During the year, we met four times as part of the standard schedule of Committee meetings. After the virtual world we endured in 2020/21, it was great to be able to meet in person again. Following the public announcement of the federal investigations into allegations of fraud and bribery by former National Grid employees in our US business, the Committee met four extra times in the year to provide oversight of the internal investigations. We also endorsed management broadening the scope of its investigations to receive assurance that the now substantiated allegations of fraud and bribery were isolated incidents and National Grid’s controls are appropriate and continue to operate effectively to mitigate future instances. The Committee also received updates on the successful go-live of the new enterprise resource planning (ERP) and general ledger system in the UK and we continued our oversight of ESG reporting and assurance matters. In particular, we have discussed the rapid market and regulatory developments in this space and management’s strategies to respond to these changes. It is vital that the Committee goes the extra mile by spending additional time on significant matters that present themselves each year. Nonetheless, we must ensure a laser-like focus on regulatory and compliance matters within our remit. We maintain an extensive and detailed agenda focusing on the audit, compliance and risk processes within the Company, working closely with management, the external auditor, Corporate Audit and the Finance and Legal teams. Key matters of business considered during the year are set out on page 103. Key actions during the year • Increased oversight of risk matters • Review of WPD acquisition accounting and first annual goodwill impairment test • Additional meetings to consider fraud and bribery allegations • Hosted colleague engagement sessions specific to the Committee’s remit Composition and Committee attendance: The Committee is made up of five independent Non-executive Directors. Committee members Attendance Liz Hewitt 8/8 Thérèse Esperdy 8/8 Ian Livingston¹ 3/3 Amanda Mesler 8/8 Jonathan Silver¹ 3/3 Former Committee members Attendance Paul Golby2 1/2 Committee Chair 1. Ian Livingston and Jonathan Silver joined the Committee effective 1 September 2021. 2. Paul Golby was unable to attend the additional Committee meeting on 6 July 2021 due to a prior commitment and stepped down from the Board effective 26 July 2021. Statement of Compliance with the Competition and Markets Authority (CMA) Order The Company confirms that it has complied with The Statutory Audit Services for Large Companies Market Investigation (Mandatory Use of Competitive Tender Processes and Audit Committee Responsibilities) Order 2014 (Article 7.1), including with respect to the Audit & Risk Committee’s responsibilities for agreeing the audit scope and fees and authorising non-audit services. Fair, balanced and understandable The Committee was satisfied that the Annual Report and Accounts, taken as a whole, is fair, balanced and understandable and provides the necessary information for shareholders to assess the Company’s position and performance, business model and strategy. This was recommended to the Board at its meeting in May 2022. Committee financial experience The Board is satisfied that the Chair, as a chartered accountant with significant board-level financial and audit experience, is suitably qualified and has recent and relevant financial experience. The Committee as a whole is deemed to have competence relevant to the sector in which the Company operates. 101 C o rp o rate G o vernance National Grid plc Annual Report and Accounts 2021/22 Audit & Risk Committee report 20_Audit_and_Risk_Committee_p101_105_v87.indd 101 27/05/2022 17:16
Significant issues/judgements relating to the financial statements In considering the financial results announcements and the financial results contained in the Annual Report and Accounts, the Committee reviewed the significant issues and judgements made by management in determining those results. The significant issues and judgements considered for the year ended 31 March 2022 are set out in the following table. In addition, the Committee and the external auditor discussed the significant issues addressed by the Committee during the year. You can read more in the Independent Auditor’s Report on pages 135 – 146. Matter considered Factors and reasons considered, including financial outcomes WPD goodwill impairment test • In March and May 2022, the Committee reviewed the output of the provisional and then final WPD goodwill and indefinite life intangible asset impairment test. The Committee challenged the reasonableness of the duration of the cash flow forecast used in the test and reviewed the key assumptions, including the cash flows, discount rate and terminal value. The Committee also received Deloitte’s audit conclusions over both the impairment work and the execution of management’s impairment SOX controls. The Committee concluded that the judgements taken and estimates made by management were supportable and should be disclosed as areas of judgement and key sources of estimation uncertainty. Proposed disposal of a majority stake in the UK Gas Transmission business • During the year, the Committee oversaw the judgements and accounting for the proposed sale of a majority stake in UK Gas Transmission. In particular, the Committee reviewed management’s judgement on the date the business qualified as held for sale and a discontinued operation. Based upon management’s analysis versus the criteria outlined in IFRS 5, the Committee was satisfied the judgement was appropriate. Useful life of gas assets in the context of climate change • Consistent with prior years, the Committee reviewed and concurred with management’s judgement that, notwithstanding the regulatory and legislative commitments to net zero in the jurisdictions that we operate in, there will be a role for our gas networks beyond 2050 in a range of possible scenarios and that nothing suggests that our gas asset lives should be shortened at this point. The Committee also agreed with management that the additional disclosures and sensitivities previously added to the notes to the financial statements should be retained, along with the disclosures of the matter as a key judgement and key source of estimation uncertainty. Application of the Group’s Exceptional Items Framework • In March 2022, the Committee approved revisions to the Group’s Exceptional Items Framework (Framework) to include a disclosure section, reflecting the latest guidance and recommendations from the FRC following its October 2021 Thematic Review into Alternative Performance Measures. This update also reflected transactions that had occurred since the previous update to the Framework in September 2020. • Throughout the year, the Committee considered papers from management setting out how the Framework had been applied to certain events and transactions over the period, as set out in Note 5 to the financial statements. • For each item, the Committee considered the judgements made by management, including challenging when transactions were concluded as not qualifying for exceptional treatment. • Based on the reviews performed, the Committee was satisfied the Framework had been correctly applied throughout the year. Financial reporting Going concern and viability The Committee reviewed the Group’s going concern statement, viability statement (as set out on page 153 and pages 33–35 respectively) and the supporting assessment reports prepared by management. During 2021/22, there has been continued review of the Group’s viability and going concern with support of the Finance Committee. The financial statements are prepared on a going concern basis such that the Company and the Group have adequate resources to continue in operation for at least 12 months from the date of signing the consolidated financial statements. Statutory reporting framework policy The Board has responsibility for effective management of risk for the Group including determining its risk appetite, identifying key strategic and emerging risks, and reviewing the risk management and internal control framework. The Committee, in supporting the Board to assess the effectiveness of risk management and internal control processes, relies on a number of Company-specific internal control mechanisms to support the preparation of the Annual Report and Accounts and the financial reporting process. This includes both the Board and Committees receiving regular management reports to include analysis of results, forecasts and comparisons with last year’s results, and assurance from the external auditor. With the regulatory environment evolving quickly, the Committee is kept fully informed of all new legislation, FRC advice and best practice and the requirements of the Code and Disclosure and Transparency Rules. During 2021/22, the Committee has been kept up to date with changes to legislation and regulatory reviews and has had oversight of the potential impacts. The Committee and Board receive, in advance of the full-year results, a periodic SOX report on management’s opinion on the effectiveness of internal control over financial reporting. This report concerns the Group-wide programme to comply with the requirements of SOX and is received directly from the Group SOX and Controls team. In relation to the financial statements, the Company has specific internal mechanisms that govern the financial reporting process and the preparation of the Annual Report and Accounts. The Committee oversees that the Company provides accurate, timely financial results and implements accounting standards and judgements effectively, including in relation to going concern and viability. Our financial processes include a range of system, transactional and management oversight controls. Our businesses prepare detailed monthly management reports that include analysis of their results, along with comparisons to relevant budgets, forecasts and the previous year’s results. Monthly business reviews, attended by the Chief Executive and Chief Financial Officer (CFO), supplement these reports. Each month, the CFO presents a consolidated financial report to the Board. 102 National Grid plc Annual Report and Accounts 2021/22 Audit & Risk Committee report continued 20_Audit_and_Risk_Committee_p101_105_v87.indd 102 27/05/2022 17:16

103 C o rp o rate G o vernance National Grid plc Annual Report and Accounts 2021/22 Key matters considered by the Committee The key matters considered by the Committee during the course of the year ended 31 March 2022 are set out below: Matter considered Factors and reasons considered, including financial outcomes Financial reporting • In addition to the significant issues and judgements highlighted on page 102, the Committee also considered the accounting for the Company’s disposal of its investment in the St William Homes LLP joint venture, the results of the purchase price acquisition exercise for the WPD acquisition, the ongoing impact of COVID-19 on our US retail customers’ bad and doubtful debts provision, the accounting for the Company’s interconnectors subject to cap and floor arrangements, and management’s evaluation of the IFRS Interpretation Committee’s agenda decisions on cloud computing arrangement costs. • Monitored and reviewed the integrity of the Group’s financial information and other formal documents relating to its financial performance, including the appropriateness of accounting policies, use of the going concern assumption and viability assessment. • Recommended to the Board management’s key accounting judgements and key sources of estimation uncertainty, including those related to pension valuations and environmental provisions for the 2021/22 half-year and full-year financial statements and the filing of other reports with the SEC containing financial information. ESG reporting • Reviewed management’s proposed strategy for ESG reporting and assurance, and its proposal for implementing an ESG reporting system to ensure accurate, reliable and timely ESG reporting. • Received an update on the preparation of the Responsible Business Report and the Company’s fifth TCFD disclosure. This included reviewing management’s assessment of full compliance with TCFD’s 11 recommendations. • Reviewed management’s voluntary disclosures aligned with the EU Taxonomy, including the key judgements taken in preparing the disclosure. Also, management’s disclosure maps on two leading ESG reporting frameworks: the Global Reporting Initiative and Sustainability Accounting Standards Board. • Recommended approval of the Responsible Business Report and related publications to the Board, following review of PwC’s external assurance report. WPD acquisition • In addition to the WPD accounting matters noted on page 102, in September 2021, the Committee received an update on the implementation of management’s Financial Position and Prospects Risk Mitigation Plan. • In November 2021, the WPD CEO and CFO attended the Committee to provide an overview of WPD. Internal controls • The Committee provided oversight over management’s internal investigation following the federal investigations into allegations of fraud and bribery by former National Grid employees in our US business. The Committee endorsed management broadening the scope to confirm the Company’s controls remain appropriate and continue to operate effectively. • Received regular updates on progress towards the Group’s annual US regulatory attestation. • In September 2021 and March 2022, the Committee received updates on management’s structured programme of work to strengthen the maturity of the Group’s risk and controls framework. • In May 2022, the Group CFO presented a close out update on the implementation of the new ERP and general ledger system and completion of the roll-out. Risk and viability statement • Received regular updates on the actions being taken to manage the risk in line with the Group’s risk appetite. • Received confirmation from each of the businesses and functions that risks are managed appropriately and continue to consider external influence and matters outside of the Group’s control. • Monitored the internal control processes and reviewed and challenged the going concern and viability statements, including testing for reasonable worst-case scenarios. • Satisfied itself that the Board and management’s risk management processes were functioning effectively and provided sufficient assurance. External auditor • Received an update report at each meeting, including updates on the status of, and results from, the annual audit process. • Considered the external auditor’s report on the 2021/22 half- and full-year results. • Considered throughout the year the external audit plan, including monitoring the approach, scope and risk assessments contained within. • Assessed the effectiveness and independence of Deloitte, as well as continued review and oversight of non-audit services from Deloitte. • Continued to hold private meetings with Deloitte and maintained dialogue throughout the year. • Engaged with Deloitte regularly on the forward planning and succession planning for the lead Audit Partner; this included the confirmed successor attending a number of Committee meetings during the year. • Recommended the reappointment of Deloitte as the Company’s external auditor to the Board. Corporate audit • Received regular updates on the 2021/22 audit plan and the significant findings and approved the audit plan for 2022/23. • Approved the Corporate Audit Charter which had been updated to reflect best practice and recent corporate governance developments. • Engaged with the Global Internal Audit team regularly as part of its role in the internal investigation into fraud and bribery controls. Compliance, governance and disclosure matters • Reviewed and approved the updated terms of reference for the Committee. • Received updates on ethics and business conduct, including whistleblowing to support the oversight, management and mitigation of business conduct issues as part of the controls framework. • Discussed the whistleblowing procedures in place and confirmed internal procedures remained effective, noting the communications during the year to employees, including additional communications in relation to fraud and bribery. • Received bi-annual updates in September 2021 and March 2022 of compliance with external legal requirements and regulations, including any non-compliance issues and steps being taken to improve compliance across the Group. 20_Audit_and_Risk_Committee_p101_105_v87.indd 103 27/05/2022 17:16
104 National Grid plc Annual Report and Accounts 2021/22 Audit & Risk Committee report continued Risk management and internal control Risk management Risk management is the responsibility of the Board and is key to achieving our strategic priorities. The system of risk management is established by the Board, which sets risk appetite and maintains the system of internal controls to manage risk within the Group. The Audit & Risk Committee has delegated responsibility from the Board for the oversight of the Group’s systems of internal control and risk management. This includes policies, compliance, legislation including compliance with SOX and the UK Bribery Act 2010, appropriateness of financial disclosures, procedures, business conduct and internal audit. As part of the framework across the Group, National Grid’s values – ‘do the right thing’, ‘find a better way’ and ‘make it happen’ – continue to communicate and promote a culture of integrity across the Group. During the year, the Board reviewed the principal risks facing the Group (as set out on pages 28 – 32). The Committee provided oversight and reviewed the risk management process to ensure that processes are in place to manage risk appropriately. Internal control and risk management effectiveness We continually monitor the effectiveness of our internal control and risk management processes to make sure they continue to be effective, robust and remain fit for purpose. Controls are in place to reduce either the likelihood or impact of any risk once it has occurred. Following the review over the year the Committee recommended to the Board that the processes had the correct authority, expertise and independence and provided sufficient assurance to the Company. This review includes financial, operational and compliance controls. The Committee also monitors and addresses any business conduct issues or compliance issues. The Certificate of Assurance (CoA) process operates via a cascade system and takes place annually in support of the Company’s full-year results. The Company has a Chief Risk Officer who leads on the Group’s risk management processes. Corporate Audit also supports the Group’s risk management and internal control processes. They maintain an independent and objective approach to evaluate and enhance process developments. The Global Head of Audit appointment is a matter reserved for the Committee and has responsibility for the internal audit function, attends all Committee meetings and has access to the Committee Chair as necessary. At each of the Committee’s meetings, progress of the internal audit process is reviewed including significant outstanding actions. The Committee also has regular private meetings with the Global Head of Audit. The Committee notes timelines and where actions are overdue, challenges these. Corporate Audit is responsible for developing the audit plan including engaging in major change programmes across the business. In March 2022, the Committee received the FRC’s Audit Quality Review Inspection Report of Deloitte for the audit of the Company’s financial statements for 2020/21. The Committee noted there were no key findings from the review and three areas of good practice highlighted by the FRC. The Committee also regularly engages and receives the views of senior management and members of the Finance team in forming conclusions on auditor effectiveness. Meetings are held around each scheduled Committee meeting between Committee members and the external auditor, without management being present to encourage open and transparent feedback. This additional time outside of the formal meeting environment helps us to monitor the independence, quality and effectiveness of the external audit functions. During the year, the Committee: • reviewed the quality of audit planning, including approach, scope, progress and level of fees; • reviewed the outcome of recommendations from the Deloitte Insights Report; The Committee Chair signed the updated Corporate Audit Charter in December 2021 following agreement from the Audit & Risk Committee and Safety & Sustainability Committee in November 2021 and December 2021 respectively. The Committee also received the results of the Internal Quality Assessment that took place in 2021/22. External audit The Committee is responsible for overseeing the relationship with the external auditor. The Committee Chair meets with the external auditor prior to each meeting and outside the meeting cycle on a regular basis. • Deloitte is the external auditor to the Company. • Appointed in 2017 following a formal tender process. • Reappointed at the 2021 AGM for the year ended 31 March 2022. • The Committee was authorised by shareholders to set Deloitte’s remuneration at the 2021 AGM. • Current lead Audit Partner is Doug King and 2021/22 was the fifth and final year of his term. Chris Thomas has been selected as Doug King’s successor and will oversee the statutory audit for 2022/23. The Committee has spent significant time with both Doug and Chris during 2021/22 to make sure the succession is seamless; this included Chris attending a number of Committee meetings in the year alongside Doug. Following consideration of the auditor’s independence and objectivity, the audit quality and the auditor’s performance, the Committee was satisfied with the effectiveness, independence and objectivity of Deloitte and recommended to the Board its reappointment for the year ended 31 March 2023. A resolution to reappoint Deloitte and give authority to the Committee to determine its remuneration will be submitted to shareholders at the 2022 AGM. In accordance with the CMA Order Article 4, the Committee believes that a competitive tender no later than 2026 is in the best interests of the Company given the independence, objectivity and performance of Deloitte to date and to ensure the appropriate time and planning required to execute a comprehensive tender process. This approach is in line with current regulation that requires a tender every 10 years. Effectiveness, quality and performance As part of the Committee’s responsibilities, consideration is regularly given to the effectiveness of the external auditor to verify that the quality, challenge and output of the external audit process is sufficient. Throughout the year the Committee also looks at the quality of the auditor’s reports and considers its response to accounting, financial control and audit issues as they arise. To maintain high levels of quality the Committee reviews and challenges, where appropriate, the external audit plan prior to approval. Audit quality reports received by the Committee External auditor Insights Report On an annual basis, the Committee receives a report summarising the financial reporting and/or internal control areas that, based on the results of the most recent audit, Deloitte considers management should prioritise during the year ahead. This year, the report included management’s responses to the recommendations, along with an update on prior year recommendations. Management survey Management undertook a survey in FY22 that sought views from over 100 key stakeholders involved in the external audit process across the Company. The questions comprised of the following areas: • The external auditor’s performance; key performance indicators included: – planning and scope; – robustness of the audit process; – independence and objectivity; – quality of delivery; – quality of people and service; and – understanding of the Company. • National Grid’s commitment to the audit. Management, the external auditor, and the Committee discussed the results of the survey, which showed that the external auditor’s score had remained consistent with the prior year. Deloitte agreed to put in place an action plan for areas of improvement. 20_Audit_and_Risk_Committee_p101_105_v87.indd 104 27/05/2022 17:16

105 C o rp o rate G o vernance National Grid plc Annual Report and Accounts 2021/22 • held private meetings with Deloitte without management present; • held meetings with the UK Partner and US Partner; • confirmed that the Deloitte external audit process had been delivered effectively; and • met with, and approved the appointment of, and transition plan for, Chris Thomas, the new lead Audit Partner who will take over for the 2022/23 audit year. Auditor independence and objectivity The independence of the external auditor is essential to the provision of an objective opinion on the true and fair view presented in the financial statements. The Committee considered the safeguards in place, including the annual review by Corporate Audit, to assess the external auditor’s independence. The external auditor reported to the Committee in May 2022 that it had considered its independence in relation to the audit and confirmed that it complies with UK regulatory and professional requirements, SEC regulations and Public Company Accounting Oversight Board (PCAOB) standards and that its objectivity is not compromised. The Committee took this into account when considering the external auditor’s independence and concluded that Deloitte continued to be independent for the purposes of the external audit and confirmed that this recommendation was free from third-party influence and restrictive contractual clauses. Non-audit services In line with the FRC’s Ethical Standard and to maintain the external auditor’s objectivity and independence, we have a policy governing Deloitte’s provision of non-audit services. The cap on the total fees that may be paid to the external auditor for non-audit services in any given year is 70% of the average audit fees paid in the last three financial years. The provision of any non-audit service by the external auditor requires prior approval. A subset of services where, due to their nature, we believe there is no threat to the auditor’s independence or objectivity qualify as pre-approved. These services must have a value under £250,000 (increased by Committee approval during the year from £50,000) and be reviewed in advance by the CFO. These services are limited to: • audit, review or attest services. These are services that generally only the external auditor can provide, in connection with statutory and regulatory filings. They include comfort letters, statutory audits, attest services, consents and assistance with review of filing documents; and • other areas, such as provision of access to technical publications. Management presents a list of all non-audit work requests to the Committee to ensure the Committee is monitoring all non-audit services provided. Non-audit service approvals during 2021/22 principally related to comfort letters for debt issuances and refreshes of debt issuance programmes. External auditor fees The amounts payable to the external auditor, Deloitte, in the past two years were: Statutory auditor’s fees (£m) 19.8 19.918.9 1.0 17.0 2.8 16.9 1.1 2021/22 2020/21 2021/22 2019/20 18.0 Audit services Non-audit services 18.9 1.0 Total billed non-audit services provided by Deloitte during the year ended 31 March 2022 were £1.0 million, representing 5% of total audit and non-audit fees. In 2020/21, non-audit services totalled £2.8 million (14% of total audit and non-audit fees). Further information on the fees paid to Deloitte for audit, audit-related and other services is provided in Note 4 to the financial statements on page 162. Total audit and audit-related fees include the statutory fee and fees paid to Deloitte for other services that the external auditor is required to perform, such as regulatory audits and SOX attestation. Non-audit fees represent all non-statutory services provided by Deloitte. 20_Audit_and_Risk_Committee_p101_105_v87.indd 105 27/05/2022 17:16

Key decisions during the year • Approved the year-end sustainability disclosures • Approved the Company’s environmental sustainability strategy • Approved the Committee’s revised remit as the Safety & Sustainability Committee • Approved the FY22 Audit Plan in respect of safety and sustainability matters Composition and Committee attendance: The Committee is made up of four independent Non-executive Directors. Committee members Attendance Earl Shipp 6/6 Anne Robinson1 2/2 Tony Wood2 4/4 Martha Wyrsch2 4/4 Former Committee members Attendance Mark Williamson3 2/2 Liz Hewitt2 2/2 Amanda Mesler2 2/2 Paul Golby4 1/1 Committee Chair 1. Anne Robinson was appointed to the Committee effective 19 January 2022. 2. Tony Wood and Martha Wyrsch were appointed to the Committee and Amanda Mesler and Liz Hewitt stepped down from the Committee effective 1 September 2021. 3. Mark Williamson joined the Committee effective 1 September 2021 and stepped down from the Board effective 31 December 2021. 4. Paul Golby stepped down from the Board effective 26 July 2021. 106 National Grid plc Annual Report and Accounts 2021/22 in January 2022 following the completion of the investigation. Lessons learnt have already been communicated throughout the organisation and will influence our practices going forward. Throughout the year, several significant storms in the UK and the US highlighted that we have to redouble our preparedness. The storms saw large swathes of customers disconnected from power for, in some cases, significant periods of time. Our people worked tirelessly to restore service to every last disconnection safely and securely. The emergence of extreme weather has potential impacts on our assets and our workforce. We will continue to provide oversight of the Company’s efforts to adapt to extreme weather and to ensure our safety processes are robust and resilient to withstand whatever may come our way. Sustainability The second priority of this Committee is sustainability. In line with the Committee’s expanded remit, we considered the Company’s TCFD strategy through the year and are pleased to report that the Company has fully aligned its disclosures with the TCFD Recommended Disclosures. See pages 70 – 83 for further information. Whilst the Audit & Risk Committee focuses on the financial aspect of TCFD, we spent time considering the climate scenario analysis and the Company’s wider climate strategy and commitments. We also received, for the first time this year, the Company’s Climate Transition Plan for review. At the 2021 AGM, shareholders approved our first ever climate resolution, outlining our targets for net zero and our commitment to bring the Company’s climate transition plan to a vote at the 2022 AGM. This plan will provide the opportunity to review our metrics and data in this area. We also continued to review the Company’s wider sustainability strategy and performance. National Grid’s Responsible Business Report provides additional insights into our organisational aims and ambitions, and our performance against our net zero targets and wider sustainability strategy. We convened an ad-hoc Committee meeting in March 2022 to specifically consider our external reporting obligations in relation to sustainability and reviewed and commented on the initial drafts of these. We also brought the entire Board together for a separate session to undertake a thorough review of the aims, ambitions and measures to ensure that these commitments are embedded in the Board’s stewardship. Looking forward As we navigate these changing and challenging times, we will continue to ensure we are having the right discussions and challenging the progress and pace at which we are moving. It is sure to be another busy year and I look forward to providing you with a further update on our progress. Earl Shipp Committee Chair and growing societal expectations, the Committee welcomed new members. We thus have a refreshed composition, providing significant experience across engineering, safety, and process-focused industries as well as in-depth knowledge of the energy transition, climate change and stewardship of environmental and sustainability matters. Despite the widening of our remit, we have not lost sight of the health considerations we have customarily monitored. We saw continuing COVID-19 impacts being felt in both the UK and US through most of the year. Towards the end of the fiscal year, we monitored the gradual and safe return to the workplace for those who have been working from home. It is appropriate to recognise everyone’s perseverance and forbearance throughout the last two years. In particular, the contributions of our front-line workers, who continued to work in the field through the pandemic, were exemplary. They have done a marvellous job designing, implementing and complying with numerous protocols to keep themselves healthy and thus protecting our customers as well. Our numbers of sickness within the workforce were low and productivity was maintained throughout. Nevertheless, the prolonged pandemic took an emotional toll on the entire organisation and the Committee has been briefed on the strengthening of the support the Company offers through various employee assistance programmes. Safety, wellbeing and asset protection Safety is always our number one priority. We monitored both process and personal safety at every meeting and requested ‘deep dives’ into selected events where we felt our independent oversight would be of value. Whilst we have continued strong progress on our leading safety indicators, our lagging (LTIFR) safety performance has been challenging to sustain through the pandemic. This is a key area of focus and one that we will continue to track as a Committee. The integration of WPD also progressed throughout the year and we familiarised ourselves with WPD’s measurement programme and how it would be aligned with National Grid’s. In January 2022, Phil Swift, President of WPD, provided us with an overview of the safety management of WPD, including lessons learnt that were being shared between National Grid and WPD. Overall, we are mindful of the amount of organisational change ongoing. Given this backdrop, we have reviewed safety performance and progress; we will continue to challenge the organisation to keep its strong safety focus. You can see some of our key safety results at page 27. In September 2021, there was a fire at one of our interconnectors at Sellindge, where we own and operate HVDC facilities across the English Channel. We are grateful that no one was injured in this incident, in part due to the excellent training and quick thinking of our operators on duty at the time. The damage to the facility and the potential risk to human life were thoroughly reviewed by the Committee; we convened an additional meeting in December 2021 to receive a report from the Group Chief Engineer on the status of the investigation and a further update was provided Safety & Sustainability Committee report Review of the year I’m pleased to present to you my first report as Chair of the Safety & Sustainability Committee. After a review undertaken earlier in 2021, we refreshed our remit. In addition to health and safety, we agreed to increase monitoring of sustainability-related issues including external climate-related disclosure requirements. You’ll note our new name, the Safety & Sustainability Committee, with effect from 1 September 2021. To ensure we are well positioned to advise the Board on these wider strategic considerations, given the rapidly changing external environment 21_Safety_and_Sustainability_Committee_p106_v48.indd 106 27/05/2022 17:20

Key decisions during the year • Approved the Group’s financial risk appetite, aligning this with the Board’s refreshed risk appetite framework • Reviewed the pension arrangements linked to the Group’s key transactions and approval of the Group pension strategy • Considered the structure of the sale of the equity interest in the St William Homes LLP joint venture to The Berkeley Group plc • Approved forecast expenditure for 2022/23 insurance renewals Composition and Committee attendance: The Committee is made up of three independent Non-executive Directors and two Executive Directors. Committee members Attendance Thérèse Esperdy 4/4 Jonathan Dawson 4/4 Liz Hewitt2 2/2 Andy Agg 4/4 John Pettigrew 4/4 Former Committee members Attendance Mark Williamson1 1/1 Jonathan Silver2 2/2 Committee Chair 1. Mark Williamson stepped down from the Board effective 31 December 2021. 2. Liz Hewitt joined the Committee and Jonathan Silver stepped down from the Committee effective 1 September 2021. 107 C o rp o rate G o vernance National Grid plc Annual Report and Accounts 2021/22 Insurance The fire at one of our interconnectors at Sellindge pushed significant focus on insurance for the Committee and has had an impact on the Company’s approach to renewals for 2022/23, whilst market conditions have continued to harden. The Head of Insurance has spent significant time with the Committee providing updates on the claims process whilst I’ve worked with my fellow Committee Chairs on implications of safety and accounting. Tax Following President Biden’s election, we’ve stayed abreast of the US congressional tax proposals and potential impacts on the Group. In November 2021, we invited KPMG to update us on the key expected outcomes but indeed, at the time of writing, congressional action is still a moving target. In the UK, with the increase in the minimum statutory rate, we have reviewed the changes that arise in the current year deferred taxes and the exceptional charge to remeasure the opening deferred tax liabilities going forward. Pensions In the UK, pension investments are managed by independent Trustees. However, it is the Committee’s duty to ensure funding is adequate to meet obligations. As the funding positions of the various defined benefit schemes improve, it allows the Trustees to reduce investment risk to everyone’s benefit. This year, we oversaw the transfer of WPD’s pension arrangements to National Grid and Trustee appointments will be refreshed in 2022/23. During the year, we invited Mercer to provide external expertise to the Committee on the UK pension landscape. We also received detail on the Pension Schemes Act 2021 and the potential implications this had on the Group. In the US, pension investments are overseen by an internal fiduciary committee comprising senior leaders with appropriate levels of financial experience. Over the course of the year, we have worked to ensure the transition of pension and other retiree benefits of our Rhode Island colleagues as they move across to PPL. There has also been further de-risking of our pension and retiree welfare investments in light of the improvement to funding positions in recent years. Looking forward Given the impact of geopolitical events on energy markets and inflation in the broad economy, we continue to monitor the Group’s risk appetite. We regularly review stress tests and seek to bring our expertise from other sectors of the economy to foster a holistic view of financial markets. Thérèse Esperdy Committee Chair Review of the year This year we met on four scheduled occasions to undertake our responsibility as a Committee of monitoring the financial risk of the Group, focusing on the key areas within our remit: Treasury, Tax, Pensions and Insurance. Despite continued challenges presented by the pandemic, we engaged directly with a number of the finance professionals in the Company. Jonathan Silver and I met with a cross-section of members in the Treasury, Tax, Pensions and Financial Planning teams in Massachusetts. As most organisations are now back in offices, we will continue to arrange separate engagement sessions. Transactions It has been vital to continue our focus on the Group’s financing strategy, which is supporting the portfolio repositioning of the Group. We received regular updates during 2021/22 on the progress of the ongoing transactions. As a Committee we’ve been particularly interested to hear about the progress of WPD colleague integration into key departments such as Treasury, Tax, Pensions and Insurance; I’m pleased to report the integration continues to progress well. We’ve monitored progress of the sale of a majority stake in UK Gas Transmission throughout the year, including a review of the engagement with credit rating agencies and of the UK Gas Transmission derivative book ahead of the launch of the sale process. We have also continued to monitor progress on the sale of NECO to PPL. Financial risk appetite During the year, the Committee reviewed the Group’s financial risk appetite and took the opportunity to evaluate how financial risk was managed in line with the Board’s refreshed risk appetite framework. Treasury It has been another busy year for the Company in terms of bond issuances. I’m delighted that National Grid continues to attract strong investor demand in the market at both holding and operating company levels. The issuances we’ve seen have typically had large orderbooks and tight spreads. We continue to contribute to the Group’s Green Financing commitments and in August 2021 National Grid plc issued a dual tranche €1.5 billion bond across 7 years and 12 years; the 7-year tranche was issued in a green format. In March 2022, we received a presentation from one of our core global banking partners that provided a macro market update and included key updates on the external view of National Grid’s bond issuances and impacts of the conflict in Ukraine and retail energy crisis. Throughout the year, we monitored the actions of the credit rating agencies. As noted above, we still have significant transactional activity ongoing and hence closely monitor our gearing, which will be reduced as asset proceeds are used to restore ratings headroom. Finance Committee report 22_Finance_Committee_p107_v54.indd 107 27/05/2022 17:21

Key activities during the year • Development of 2022 Directors’ Remuneration Policy • Stakeholder consultation • Incorporation of portfolio transactions into remuneration • New members and transition of the Committee The Committee is made up of four independent Non-executive Directors Composition and Committee attendance: Committee members Attendance Ian Livingston1 4/4 Martha Wyrsch2 3/4 Jonathan Dawson 7/7 Amanda Mesler 4/4 Former Committee members Attendance Mark Williamson3 5/5 Earl Shipp2 2/3 Jonathan Silver2 3/3 Committee Chair 1. Ian Livingston joined the Committee effective 1 August 2021 and became Committee Chair effective 1 January 2022. 2. Martha Wyrsch was appointed to the Committee and Earl Shipp and Jonathan Silver stepped down from the Committee effective 1 September 2021. 3. Mark Williamson stepped down from the Board effective 31 December 2021. To do this, we set out to answer several key questions: • What are the right performance measures that clearly link the Company’s performance and long-term strategy to value creation? • How can we better reflect the strategic importance of the Company’s net zero strategy in remuneration? • How can we create flexibility given the increasingly dynamic external context? Over the last several months, the Committee and I have valued the engagement and collaboration of many of our major shareholders. The key elements of our new Remuneration Policy are summarised on page 113 and details are available on pages 124 − 128. Our Remuneration Policy proposal will be subject to a binding vote at the 2022 AGM. Our Directors’ Remuneration 2021/22 report is structured to cover three key areas: 1) Remuneration at a glance 2) 2021/22 implementation report 3) 2022 Directors’ Remuneration Policy and implementation Performance and remuneration outcomes during the year Salary, pension and benefits Our review of Executive Directors’ salaries this year considered external market factors alongside wider workforce pay increases. The Committee has awarded salary increases of 3.75% to John Pettigrew and 6.5% to Andy Agg, both effective 1 July 2022. These changes are compared to an average increase of 4% across the UK wider workforce. Our previous Directors’ Remuneration Report (DRR) disclosed a three year plan to bring Andy Agg’s base salary to a level broadly equal to the market median for his role. Andy’s increase this year is the last installment to align his base pay. As set out in our DRR last year, we acknowledged expectations from our shareholders to align Executive Directors’ pension contribution rates with the majority of the UK wider workforce and have set out an approach to progressively do so. To that end, the pension allowances of John Pettigrew and Andy Agg were reduced to 12% of salary as of 1 April 2022, in line with pension contribution levels in the UK wider workforce, representing a material reduction in their fixed remuneration levels. Annual Performance Plan (APP) The APP for 2021/22 was based on financial performance measures (60%), operational measures (20%) and individual objectives (20%) that reflect key business and operational performance goals. Dear shareholders, This is my first letter since becoming Chair in January 2022. Firstly, I would like to thank my predecessor Jonathan Dawson for his strong stewardship of the Remuneration Committee over the last nine years and all his help in ensuring a smooth transition of the Chair. This year has presented a full agenda for the Board and Remuneration Committee. An ambitious business plan to deliver against the backdrop of an increasingly dynamic and demanding external context presented several important considerations for remuneration, particularly in the context of the new Remuneration Policy. With the COVID-19 crisis a persistent and dominant theme at the start of the year, the Company maintained its position of no employees furloughed, no compulsory redundancies, and no pay reductions. In November 2021, the world turned its attention to COP26 and the necessity and urgency of a net zero future for all intensified – further underscoring the importance of the Company’s Climate Transition Plan and net zero strategy, a key area we focused on in our Directors’ Remuneration Policy review this year. In the final months of the financial year, the effects of higher gas prices, exacerbated by the tragic world events in Ukraine, presented serious affordability challenges for both consumers and businesses. The recent announcement of the early return of £200 million of interconnector revenue to UK consumers over the next two years and a plan to deliver £400 million of sustainable cost efficiencies per annum by 2024, with £140 million delivered to-date, demonstrate the Company’s commitment to doing its part to support and enable a more affordable energy future for consumers. Despite these challenges, the Company delivered strong operational performance this year, reflecting substantial investment and a focus on delivering a clean, fair, and affordable energy future. In March 2021, the Company announced the acquisition of WPD, the UK’s largest electricity distribution business, and the sale of our US Rhode Island business. In March 2022, the Company announced the sale of a 60% equity stake in the UK Gas Transmission business. These transactions are a significant evolution of the Group’s strategy and a major pivot towards electricity. The impact of the portfolio changes on financial results and performance outturns for the year are shown in greater detail in the implementation section of our remuneration report. This year also presented the opportunity to review our Directors’ Remuneration Policy (last approved in 2019) and examine how it might evolve. As we undertook this review, we sought to ensure that the best interests of all of our stakeholders today and over the next few years are properly addressed. 108 National Grid plc Annual Report and Accounts 2021/22 Directors’ Remuneration report 24_Remco_Chairs_Statement_p108_110_v49.indd 108 27/05/2022 17:22

Financial performance (60%) The Company has again had a successful year, delivering strong financial results while investing in the net zero energy transition. In parallel, we saw the solid execution of a complex set of portfolio transactions to integrate WPD, progress on the agreement to sell the US Rhode Island business, and the sale of a majority stake in the UK Gas Transmission business. Formulaic outturns from the financial portion of the APP were 89.0% of the maximum based on achievement of 78.0% of maximum for Group Underlying EPS and 100% of maximum for Group RoE. APP outcomes are determined by financial results, with technical adjustments to targets including currency adjustments, unbudgeted pension costs and scrip dividend dilution, all in line with past practice. Operational performance (20%) The Committee allocated 10% of the operational portion of the 2021/22 APP to ensure strong execution of the portfolio transactions and a focus on value delivery for shareholders. Over the year, we announced the sale of a 60% equity stake in the UK Gas Transmission business, effectively managed regulatory and legal processes, and demonstrated solid progress on the initial integration of WPD into the Group. In this context, the Committee has set the performance outturn for the transactions at 10 out of 12 which is 83.33% of the maximum. ESG measures make up the remaining 10% of the operational portion of the 2021/22 APP. These measures reflect quantifiable environmental emissions and diversity targets aligned to key commitments set out in our RBC. The outturn for the ESG portion of the APP was 6 out of 8 which equates to 75% of the maximum, reflecting solid delivery of SF6, CO2 and methane emission reductions, and progress on DEI goals. Individual objectives (20%) Performance against individual objectives resulted in outturns of 80% and 85% of the maximum for John Pettigrew and Andy Agg respectively. Taking all the elements of performance together, the overall APP awards to the Executive Directors on the Board on 31 March 2022 were 85.2% of the maximum for John Pettigrew and 86.2% of the maximum for Andy Agg. The details of the 2021/22 APP are further outlined on pages 114 − 116. In reaching its overall decisions on the APP, the Committee considered the strong performance and delivery throughout the year across financial, operational, and individual objectives and determined no discretion was required to the APP formulaic outcome. Long-Term Performance Plan (LTPP) The measurement period of the 2019 LTPP ended on 31 March 2022 and consisted of two measures – Group Value Growth and Group RoE. As discussed in last year’s report, the weighting of performance measures for the 2019 LTPP is one third Group RoE and two thirds Group Value Growth. The formulaic vesting outcome of the 2019 LTPP was 74.22% of the maximum. The Committee reviewed whether there were any factors which might cause it to reduce the vesting levels and concluded after careful consideration that the vesting levels fairly reflected business performance and shareholder experience over the performance period. As communicated in our DRR last year, we took the decision, given the timing and complexity of the portfolio transactions, to disclose the performance targets for the 2021 LTPP in this year’s report. Note the 2021 LTPP award reverts to equal weighting of Group RoE and Group Value Growth performance measures. More details are set out on page 117. Single figure and shareholding The 2021/22 total remuneration single figures for John Pettigrew and Andy Agg are £6.5 million and £3.5 million respectively. These outcomes reflect strong, consistent short-term annual performance delivery in 2021/22 and longer-term value creation. The 2019 LTPP outcome makes up nearly £4 million of the overall single figure for John Pettigrew and nearly £2 million for Andy Agg. The value of the 2019 LTPP award is driven by the material share price growth of over 30% over the three-year performance period which in addition to dividends resulted in a total shareholder return (TSR) of 52%. These outcomes also reflect the heavy weighting on long-term share-based pay in our reward structure. In last year’s DRR, we set out an intent to review our post-employment shareholding requirement. As part of our Policy review, the Committee has concluded no changes are required. This decision considers an in-employment shareholding requirement (CEO: 500% of salary and other Executive Directors: 400% of salary) which is at the top end of market practice, and a post-employment shareholding requirement (200% of salary), which is in line with market practice. The Committee felt strongly it would be in the interest of shareholders to preserve the Executive Directors’ shareholding requirements levels to ensure strong alignment with the shareholder experience. Our 2022 Policy renewal During the year, the Committee conducted a review of the Executive Directors’ Remuneration Policy, considering: 1) alignment to our business strategy and wider stakeholders (incentive measures and target-setting); 2) alignment to our talent strategy (quantum and market practice); and 3) corporate governance requirements. Having discussed these proposals with a number of our shareholders and governance bodies, the Committee proposes to make the following key changes to the Remuneration Policy, subject to their approval by shareholders at the 2022 AGM. Financial and operational performance measures: • Retain Group RoE in both the APP and LTPP to ensure the efficiency of annual operational delivery and the quality and sustainability of long-term shareholder value creation. • Replace Group Value Growth in our LTPP with a three-year cumulative Underlying EPS measure. We believe a more recognised and commonly used measure will simplify remuneration and enhance transparency for both shareholders and employees, and create strong alignment to the Company’s investor proposition. • Retain an in-year earnings measure – i.e. Underlying EPS in our APP to ensure we continue to incentivise and reward strong operational delivery. Whilst we recognise our short-term (APP) and long-term (LTPP) financial measures are similar, we believe these are the right measures to support delivery of the business strategy and the resultant creation of shareholder value. The combination of annual and long-term earnings and returns measures act together to incentivise strong operational delivery in-year, together with long-term sustainable growth. As such, financial measures have been designed to incentivise different elements of performance in the short-term (APP) and the long-term (LTPP). See pages 129 − 130 for a further overview of our financial performance measures for 2022/23. Environmental, Social and Governance Our 2022 Policy expands the focus of ESG and incorporates further measures aligned to targets set out in our RBC. • Broaden and simplify ESG measures in the APP to reflect key elements of our responsible business strategy – customers, colleagues and DEI. • Introduce net zero transition measures aligned to: i) quantitative reductions in our Scope 1 emissions; and ii) the enablement of the net zero transition. 109 C o rp o rate G o vernance National Grid plc Annual Report and Accounts 2021/22 24_Remco_Chairs_Statement_p108_110_v49.indd 109 27/05/2022 17:22

Finally, we recognise the value of some flexibility in the Policy to better adapt to business and market changes. As such, our new Policy provides greater flexibility to: • enable the Committee to set appropriate financial, strategic, and ESG measures and weightings in respect of each APP/ LTPP award; and • provide for the possibility of a one-year additional maximum incentive level of up to 50%, to be used only in exceptional circumstances (e.g. recruitment). No material changes would be made to performance measures without prior consultation with major shareholders. Other matters When taking remuneration decisions in relation to Executive Directors, the Committee takes into consideration remuneration data across the industry (through market benchmarking) and our wider workforce (e.g. CEO pay ratio, gender and ethnic pay gap data, and colleagues’ views on executive pay) to ensure decisions are fair, equitable, and aligned to performance in line with the Company’s values. Fair and equitable reward is at the heart of National Grid’s values. Within the UK, National Grid continues to be an accredited real living wage employer by the Living Wage Foundation. Our UK mean gender base pay gap of -1.6% (median of 2.4%) has shown a strong trend since 2018 in closing the pay gap between genders working in comparable roles. Across the US, our mean gender base pay gap continues to improve from 13.5% in 2021 to 12.6% this year. Additional gender and ethnic pay gap data is reported in our Responsible Business Report (RBR). Payment to past Directors Nicola Shaw stood down from the Board on 26 July 2021 and stayed with the Company until after the conclusion of the RIIO-T2 CMA appeal process and continued as Chair of the Company’s subsidiaries, National Grid Electricity Transmission plc and National Grid Gas plc. She was deemed to be a good leaver given her overall long-term strong performance and contribution to the business. She remained in active employment until 31 October 2021, after which she was not eligible for 2021/22 APP and received salary and benefits until her final employment date of 30 April 2022, as per the terms of her contract. Her APP was pro-rated for her period of active employment for 2021/22. Her 2019 LTPP will vest at the normal vesting date in July 2022, subject to performance conditions and is pro-rated for time served to the final employment date of 30 April 2022, in accordance with the plan rules. Details of Nicola Shaw’s remuneration in relation to the period 1 April 2021 to 26 July 2021 (qualifying service as an Executive Director) and 27 July 2021 to 31 March 2022, are presented in the Single Total Figure of Remuneration table on page 114. All payments are in accordance with her service agreement, the Directors’ Remuneration Policy and in line with our June 2021 Corporate Governance disclosure. Conclusion On behalf of the Committee, I would like to thank shareholders for their input and engagement this year. We continue to aim to maintain an open dialogue on remuneration matters and welcome your further comments and feedback. We respectfully ask for your support at the forthcoming AGM. Lord Ian Livingston Committee Chair 110 National Grid plc Annual Report and Accounts 2021/22 Directors’ Remuneration report continued 24_Remco_Chairs_Statement_p108_110_v49.indd 110 27/05/2022 17:22
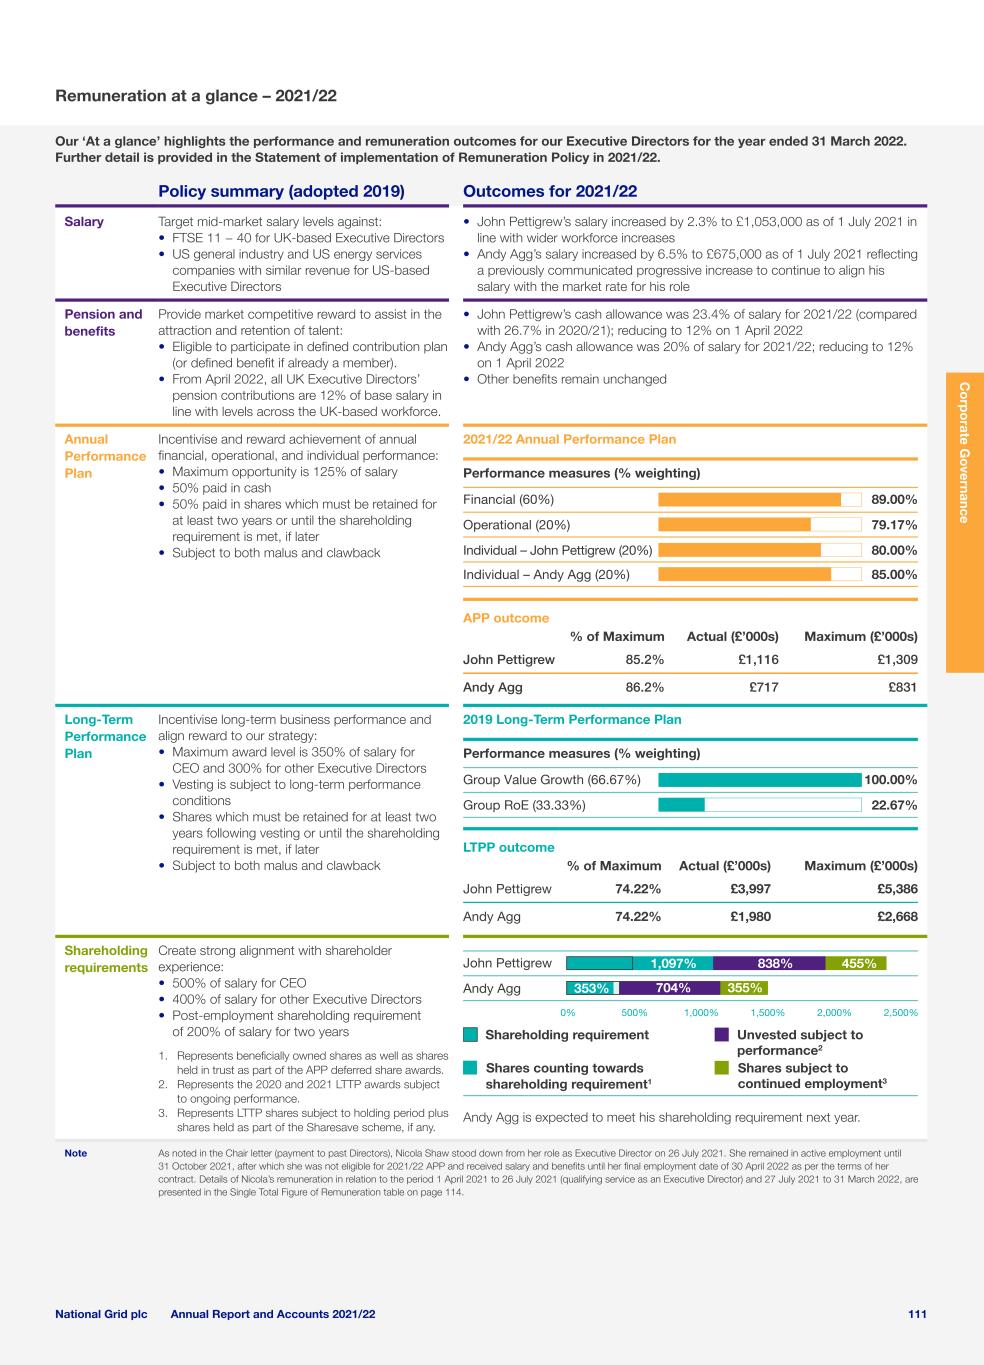
Our ‘At a glance’ highlights the performance and remuneration outcomes for our Executive Directors for the year ended 31 March 2022. Further detail is provided in the Statement of implementation of Remuneration Policy in 2021/22. Policy summary (adopted 2019) Outcomes for 2021/22 Salary Target mid-market salary levels against: • FTSE 11 − 40 for UK-based Executive Directors • US general industry and US energy services companies with similar revenue for US-based Executive Directors • John Pettigrew’s salary increased by 2.3% to £1,053,000 as of 1 July 2021 in line with wider workforce increases • Andy Agg’s salary increased by 6.5% to £675,000 as of 1 July 2021 reflecting a previously communicated progressive increase to continue to align his salary with the market rate for his role Pension and benefits Provide market competitive reward to assist in the attraction and retention of talent: • Eligible to participate in defined contribution plan (or defined benefit if already a member). • From April 2022, all UK Executive Directors’ pension contributions are 12% of base salary in line with levels across the UK-based workforce. • John Pettigrew’s cash allowance was 23.4% of salary for 2021/22 (compared with 26.7% in 2020/21); reducing to 12% on 1 April 2022 • Andy Agg’s cash allowance was 20% of salary for 2021/22; reducing to 12% on 1 April 2022 • Other benefits remain unchanged Annual Performance Plan Incentivise and reward achievement of annual financial, operational, and individual performance: • Maximum opportunity is 125% of salary • 50% paid in cash • 50% paid in shares which must be retained for at least two years or until the shareholding requirement is met, if later • Subject to both malus and clawback 2021/22 Annual Performance Plan Performance measures (% weighting) Financial (60%) Operational (20%) Individual – John Pettigrew (20%) Individual – Andy Agg (20%) 89.00% 79.17% 80.00% 85.00% APP outcome % of Maximum Actual (£’000s) Maximum (£’000s) John Pettigrew 85.2% £1,116 £1,309 Andy Agg 86.2% £717 £831 Long-Term Performance Plan Incentivise long-term business performance and align reward to our strategy: • Maximum award level is 350% of salary for CEO and 300% for other Executive Directors • Vesting is subject to long-term performance conditions • Shares which must be retained for at least two years following vesting or until the shareholding requirement is met, if later • Subject to both malus and clawback 2019 Long-Term Performance Plan Performance measures (% weighting) Group Value Growth (66.67%) Group RoE (33.33%) 100.00% 22.67% LTPP outcome % of Maximum Actual (£’000s) Maximum (£’000s) John Pettigrew 74.22% £3,997 £5,386 Andy Agg 74.22% £1,980 £2,668 Shareholding requirements Create strong alignment with shareholder experience: • 500% of salary for CEO • 400% of salary for other Executive Directors • Post-employment shareholding requirement of 200% of salary for two years 1. Represents beneficially owned shares as well as shares held in trust as part of the APP deferred share awards. 2. Represents the 2020 and 2021 LTTP awards subject to ongoing performance. 3. Represents LTTP shares subject to holding period plus shares held as part of the Sharesave scheme, if any. John Pettigrew Andy Agg Shareholding requirement Unvested subject to performance2 Shares counting towards shareholding requirement1 Shares subject to continued employment3 0% 500% 1,000% 1,500% 2,000% 2,500% 455% 355% 838% 704% 1,097% 353% Andy Agg is expected to meet his shareholding requirement next year. Note As noted in the Chair letter (payment to past Directors), Nicola Shaw stood down from her role as Executive Director on 26 July 2021. She remained in active employment until 31 October 2021, after which she was not eligible for 2021/22 APP and received salary and benefits until her final employment date of 30 April 2022 as per the terms of her contract. Details of Nicola’s remuneration in relation to the period 1 April 2021 to 26 July 2021 (qualifying service as an Executive Director) and 27 July 2021 to 31 March 2022, are presented in the Single Total Figure of Remuneration table on page 114. 111 C o rp o rate G o vernance National Grid plc Annual Report and Accounts 2021/22 Remuneration at a glance – 2021/22 25_Remco_At_a_Glance_p111_113_v46.indd 111 27/05/2022 17:28

Notes: Maximum total figure of remuneration for 2020/21 for John Pettigrew was £6.557 million and £2.625 million for Andy Agg. The 2021/22 single total figures of remuneration for John Pettigrew and Andy Agg are £6.506 million and £3.517 million respectively. These outcomes reflect strong annual performance delivery in 2021/22 and longer-term value creation as evidenced in the 2019 LTPP outcome. The single total figures of remuneration are in large driven by the heavy weighting on long-term share awards which make up to two-thirds of total remuneration, and nearly 80% of variable pay. The 2019 LTPP performance is driven in part by the impact of share price growth of 31.6%, yielding a Total Shareholder Return (TSR) of 52% over the three-year performance period in addition to long-term business performance delivery. The 2021/22 total single figures represent an achievement of 79.4% for John Pettigrew and 75.7% for Andy Agg of the total maximum opportunity for 2021/22. This is line with last year’s outcomes which were 81.8% for John Pettigrew and 83.9% for Andy Agg of the total maximum opportunity for 2020/21. Alignment of remuneration with our business strategy We align our performance linked elements of remuneration (APP and LTPP) through our strategic priorities, our RBC commitments, and our vision of a clean, fair and affordable energy future. Our vision and values Our vision is to be at the heart of a clean, fair and affordable energy future. Every day we do the right thing, find a better way, and make it happen. Our strategic priorities Enable the energy transition for all Grow our organisational capability Our RBC commitments The environment Our people Our communities The economy Our governance Deliver for customers efficiently Empower colleagues for great performance Key principles of our remuneration strategy • Reward delivery of the Group’s strategy in a matter that is simple, transparent, and aligned to shareholders’ interests • Attract, motivate, and retain senior executives with market-competitive reward • Align performance measures to the way National Grid earns its returns for shareholders, with targets set to incentivise stretching financial and operational performance in line with shareholder expectations • Reflect and underpin the Company’s vision, values, and contribution to society How we achieve this in practice • Alignment of APP and LTPP performance measures to core financial and non-financial KPIs • Heavy weighting towards share-based long-term pay to reflect the nature and duration of National Grid’s businesses and asset lives • A mandatory two-year holding period for APP share awards and vested LTPP awards • A very high minimum shareholding requirement for senior executives (500% for the CEO – equivalent to nine times the after-tax salary) • A post-employment shareholding required for all senior executives Our 2022 Remuneration Policies are aligned to our business strategy Enable the energy transition for all Deliver for customers efficiently Grow our organisational capability Empower colleagues for great performance Addition of net zero measures in LTPP aligned to commitment set our in our RBC Financial measures strongly aligned to incentivise operational excellence and long-term value creation Increased flexibility to better adapt measures to align to critical priorities that underpin short/ longer-term performance Emphasis on Company culture and DEI in APP Single total figure of remuneration for 2021/22 A comparison of the 2021/22 single total figure of remuneration, with the maximum remuneration if variable pay had vested in full, is set out below. John Pettigrew (in £’000s) Minimum On target Maximum Single figure 2021/22 Single figure 2020/21 Fixed pay APP LTPP Share price growth 0 2,000 4,000 10,0008,0006,000 4,796 8,199 6,506 5,367 1,398 Andy Agg (in £’000s) Minimum On target Maximum Single figure 2021/22 Single figure 2020/21 Fixed pay APP LTPP Share price growth 0 2,000 4,000 10,0008,0006,000 2,732 4,644 3,517 2,204 820 112 National Grid plc Annual Report and Accounts 2021/22 Directors’ Remuneration Report continued Remuneration at a glance – 2021/22 continued 25_Remco_At_a_Glance_p111_113_v46.indd 112 27/05/2022 17:28

Our proposed Remuneration Policy seeks to ensure strong alignment with National Grid’s strategic priorities and to measure the success of management in achieving key short-and long-term financial, operational, and ESG objectives. The key elements of our Policy and the implementation for 2022/23 are set out below: • ESG and, in particular, the energy transition, is at the heart of our strategic priorities. Our Policy expands the focus on ESG measures in the APP and incorporates further measures in the LTPP aligned to targets set out in our RBC. • The replacement of Group Value Growth with a cumulative Underlying EPS measure in the LTPP creates a simpler and transparent measure of performance aligned to measure long-term value creation together with Group RoE. • Flexibility in the Policy to adapt to the changing nature of the business and enable the attraction, retention, and incentivisation of talent in an increasingly competitive market. In addition to the above, the proposed Policy also provides, in exceptional circumstance only (such as recruitment), flexibility to award up to 50% of salary in addition to the normal policy maximum across APP/LTPP for one year only. Remuneration Policy 2022 overview Proposed Policy changes (2022) Implementation in 2022/23 Salary • No change • John Pettigrew’s salary will increase by 3.75% to £1,092,500 – below the average increase of the wider workforce at 4% • Andy Agg’s salary will increase by 6.5% to £719,000 – in line with previously communicated intention to align his salary with the market rate over a multi-year period subject to performance and progression in the role Pension and benefits • All new and existing UK-based Executive Directors will receive pension contributions of up to 12% of base salary for the defined contribution (DC) scheme or cash in lieu, in line with the level for new joiners across the UK wider workforce • John Pettigrew’s and Andy Agg’s pension cash allowance will be 12% from 1 April 2022 Annual Performance Plan (APP) • No change • Proposed measures for 2022/23: – Group RoE (35%) – Underlying EPS (35%) – Operational measures – Customer, Colleagues, Diversity (15%) – Individual objectives (15%) Long-Term Performance Plan • No change to opportunity levels, vesting period and holding period • Financial measures to comprise at least 60% of the LTPP; introduction of an ESG measure expected to make up 20% of the LTPP • Flexibility to set a mix of financial, strategic and ESG measures and weightings every year • In the event of future proposals to make material changes to measures/weightings, the Committee will engage with shareholders as appropriate • Proposed measures for 2022/23: – Cumulative three-year Underlying EPS (40%) – Group RoE (40%) – Net zero transition measures (20%) Shareholding requirements • No change Malus and Clawback • Enhanced wording to reflect the corporate governance changes and market practice NED fees • Simplified structure to have one standard base fee for US and UK based NEDs • Provides flexibility to reflect additional responsibilities where these are material to the roles • Alignment of NED fees to market rates (see page 131) 113 C o rp o rate G o vernance National Grid plc Annual Report and Accounts 2021/22 25_Remco_At_a_Glance_p111_113_v46.indd 113 27/05/2022 17:28

2021/22 Remuneration Implementation Single Total Figure of Remuneration – Executive Directors The following table shows a single total figure in respect of qualifying service for 2021/22, together with comparative figures for 2020/21. All figures shown as £’000’s: John Pettigrew Andy Agg Nicola Shaw¹ 2022 2021 2022 2021 qualifying service as Executive Director – 1 April ’21 to 26 July ’21 27July ’21 to 31 March ’22 2022 (Total) 2021 Salary 1,047 1,029 665 624 181 391 571 562 Benefits in kind 101 110 22 32 4 14 18 15 Pension 245 275 133 125 42 91 134 150 Total fixed pay 1,393 1,414 820 781 227 496 723 727 APP 1,116 1,035 717 618 359 refer to APP note 359 537 LTPP 3,997 2,918 1,980 805 1,765 refer to LTPP note 1,765 1,364 Total variable pay 5,113 3,953 2,697 1,423 2,124 – 2,124 1,901 Total remuneration 6,506 5,367 3,517 2,204 2,351 496 2,847 2,628 Notes: 1. Nicola Shaw stood down from the Board on 26 July 2021 and stayed with the Company until after the conclusion of the RIIO-T2 CMA appeal process and continued as Chair of the Company’s subsidiaries, National Grid Electricity Transmission plc and National Grid Gas plc. She remained in active employment until 31 October 2021, after which she was not eligible for the 2021/22 APP and received salary and benefits until her final employment date of 30 April 2022 as per the terms of her contract. For reporting purposes, we have presented the complete APP and LTPP amount in the qualifying service column. Please refer to the APP note below for reference amounts for the respective period. Salary: As of 1 July 2021, John Pettigrew and Nicola Shaw were each awarded a salary increase of 2.3% in line with the wider workforce increase. Andy Agg was awarded an increase of 6.5% as part of a multi-year plan to progressively align his salary with the market rate for his role since his appointment in January 2019. Benefits in kind: Benefits in kind (BIK) include private medical insurance, life assurance, a fully expensed car or cash alternative and the use of a car and a driver when required. For John Pettigrew, the use of a car and driver amounted to approximately £85,500 for 2021/22 (and approximately £89,000 for 2020/21). There were no Sharesave options granted to any Executive Directors during 2021/22. Pension: Pension contributions/cash in lieu for John Pettigrew and Nicola Shaw are 23.4% of salary for 2021/22 and 20% of salary for Andy Agg. Contributions will fall to 12% of salary for all Executive Directors from 1 April 2022. APP: Nicola Shaw’s APP is pro-rated for her period of active employment for 2021/22, i.e. 1 April 2021 to 31 October 2021. For reference, the pro-rated APP for the qualifying service as an Executive Director (1 April 2021 to 26 July 2021) is 55% of the total amount (i.e. circa £197,000 of the total amount of £359,000) and remaining 45% (i.e. circa £162,000 of the total amount of £359,000) for the period 27 July 2021 to 31 October 2021. Details on her financial, operational and individual objective assessment can be found on page 115 − 116. LTPP: The 2019 LTPP is due to vest in July 2022. The average share price over the three months from 1 January 2022 to 31 March 2022 of 1,098.09 pence has been applied and estimated dividend equivalents are included. The 2020/21 LTPP figures have been restated to reflect the actual share price on vesting and all dividend equivalent shares. As the vesting share price of 930.43 pence was higher versus the estimate of 855.04 pence (and the additional dividend equivalent shares added for the dividend with a record date of 4 June 2021 with a dividend rate of 32.16 pence per share), the actual value at vesting was circa £296,000, £82,000 and £138,000 higher than for the estimate published last year for John Pettigrew, Andy Agg and Nicola Shaw, respectively. Nicola Shaw’s 2019 LTPP will vest at the normal vesting dates 1 July 2022 subject to performance conditions and is pro-rated for time served to the date of 30 April 2022 in accordance with plan rules. Impact of share price change: The 2019 LTPP awards were granted on 28 June 2019 with a share price of 834.11 pence. The impact of share price change for the 2019 LTPP, comparing share price at grant versus the average share price for the period 1 January 2022 to 31 March 2022 of 1,098.09 pence, is an increase of 263.98 pence (31.6%) per share compared with an increase of 2.1% for the 2018 LTPP performance period (excluding dividends). Total pension benefits Andy Agg, John Pettigrew and Nicola Shaw received a cash allowance in lieu of participation in a pension arrangement. There are no additional benefits on early retirement. The values of these benefits received during this year, are shown in the single total figure of remuneration table. John Pettigrew has also accrued defined benefit (DB) entitlements; he opted out of the DB scheme on 31 March 2016 with a deferred pension and lump sum payable at his normal retirement date of 26 October 2031. At 31 March 2022, John Pettigrew’s accrued DB pension was reduced to £85,409 per annum and his accrued lump sum was £256,225. These figures reflect a permanent change in John Pettigrew’s pension entitlements going forward. No additional DB entitlements have been earned over the financial year, other than an increase for price inflation due under the pension scheme rules and legislation. Under the terms of the pension scheme, if John Pettigrew qualifies for ill-health requirements, or is made redundant, a pension may be payable earlier than his normal retirement date. A lump sum death in service benefit is also provided in respect of these DB entitlements. 2021/22 Annual Performance Plan APP awards reward delivery against annual financial, operational and strategic performance targets and goals. For 2021/22, financial measures represent 60% of the award, operational measures 20%, and individual objectives the remaining 20% of the maximum. Payment of the APP award is made in shares (50% of the award) and cash (50% of the award). Shares (after any sales to pay associated tax) must be retained until the shareholding requirement is met, and in any event for a minimum of two years after receipt. For financial measures, threshold, target and stretch performance levels are set by the Committee for the performance period and pay out at 0%, 50% and 100% of the maximum calculated on a straight-line basis. Operational measures have been assessed on a four-point scale (not met, partially achieved, achieved and over-achieved) based on quantitative targets set at the beginning of the year by the Committee. Target and stretch performance levels for the individual objectives are also predetermined by the Committee for the performance period, and an assessment of the performance relative to the target and stretch performance levels is made at the end of the performance year on each objective. Executive Directors have a maximum opportunity of 125% of base salary. 114 National Grid plc Annual Report and Accounts 2021/22 Content contained within a blue box indicates that all the information in the panel is audited. Directors’ Remuneration Report continued Statement of implementation of Remuneration Policy in 2021/22 26_Remco_Policy_p114_131_v87.indd 114 27/05/2022 17:29
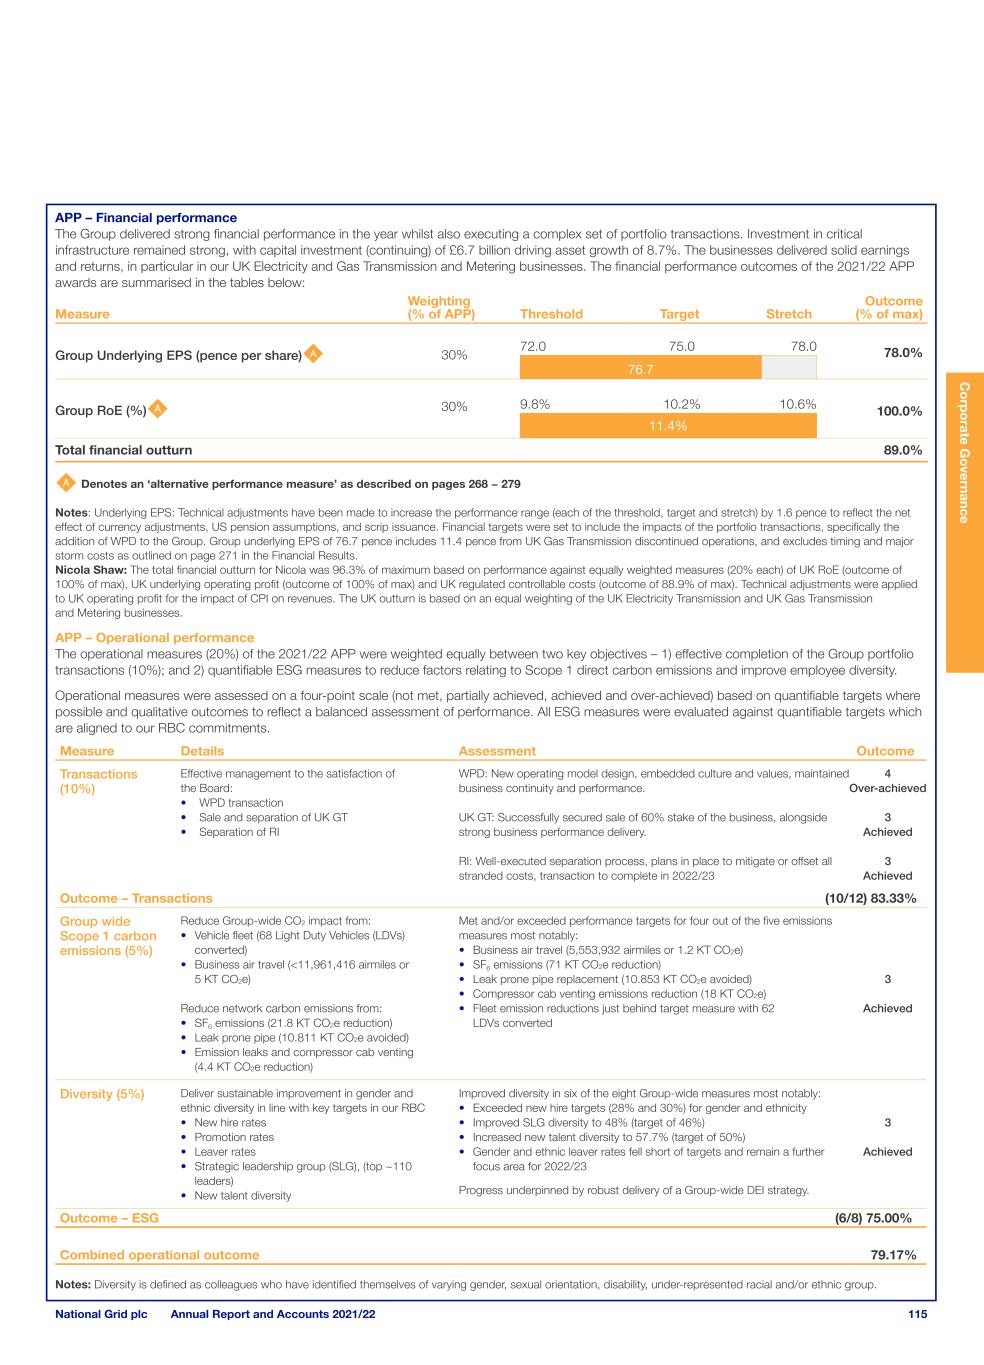
APP – Financial performance The Group delivered strong financial performance in the year whilst also executing a complex set of portfolio transactions. Investment in critical infrastructure remained strong, with capital investment (continuing) of £6.7 billion driving asset growth of 8.7%. The businesses delivered solid earnings and returns, in particular in our UK Electricity and Gas Transmission and Metering businesses. The financial performance outcomes of the 2021/22 APP awards are summarised in the tables below: Measure Weighting (% of APP) Threshold Target Stretch Outcome (% of max) Group Underlying EPS (pence per share) 30% 72.0 75.0 78.0 78.0% 76.7 Group RoE (%) 30% 9.8% 10.2% 10.6% 100.0% 11.4% Total financial outturn 89.0% Denotes an ‘alternative performance measure’ as described on pages 268 − 279 Notes: Underlying EPS: Technical adjustments have been made to increase the performance range (each of the threshold, target and stretch) by 1.6 pence to reflect the net effect of currency adjustments, US pension assumptions, and scrip issuance. Financial targets were set to include the impacts of the portfolio transactions, specifically the addition of WPD to the Group. Group underlying EPS of 76.7 pence includes 11.4 pence from UK Gas Transmission discontinued operations, and excludes timing and major storm costs as outlined on page 271 in the Financial Results. Nicola Shaw: The total financial outturn for Nicola was 96.3% of maximum based on performance against equally weighted measures (20% each) of UK RoE (outcome of 100% of max), UK underlying operating profit (outcome of 100% of max) and UK regulated controllable costs (outcome of 88.9% of max). Technical adjustments were applied to UK operating profit for the impact of CPI on revenues. The UK outturn is based on an equal weighting of the UK Electricity Transmission and UK Gas Transmission and Metering businesses. APP – Operational performance The operational measures (20%) of the 2021/22 APP were weighted equally between two key objectives – 1) effective completion of the Group portfolio transactions (10%); and 2) quantifiable ESG measures to reduce factors relating to Scope 1 direct carbon emissions and improve employee diversity. Operational measures were assessed on a four-point scale (not met, partially achieved, achieved and over-achieved) based on quantifiable targets where possible and qualitative outcomes to reflect a balanced assessment of performance. All ESG measures were evaluated against quantifiable targets which are aligned to our RBC commitments. Measure Details Assessment Outcome Transactions (10%) Effective management to the satisfaction of the Board: • WPD transaction • Sale and separation of UK GT • Separation of RI WPD: New operating model design, embedded culture and values, maintained business continuity and performance. UK GT: Successfully secured sale of 60% stake of the business, alongside strong business performance delivery. RI: Well-executed separation process, plans in place to mitigate or offset all stranded costs, transaction to complete in 2022/23 4 Over-achieved 3 Achieved 3 Achieved Outcome – Transactions (10/12) 83.33% Group wide Scope 1 carbon emissions (5%) Reduce Group-wide CO2 impact from: • Vehicle fleet (68 Light Duty Vehicles (LDVs) converted) • Business air travel (<11,961,416 airmiles or 5 KT CO2e) Reduce network carbon emissions from: • SF6 emissions (21.8 KT CO2e reduction) • Leak prone pipe (10.811 KT CO2e avoided) • Emission leaks and compressor cab venting (4.4 KT CO2e reduction) Met and/or exceeded performance targets for four out of the five emissions measures most notably: • Business air travel (5,553,932 airmiles or 1.2 KT CO2e) • SF 6 emissions (71 KT CO2e reduction) • Leak prone pipe replacement (10.853 KT CO2e avoided) • Compressor cab venting emissions reduction (18 KT CO2e) • Fleet emission reductions just behind target measure with 62 LDVs converted 3 Achieved Diversity (5%) Deliver sustainable improvement in gender and ethnic diversity in line with key targets in our RBC • New hire rates • Promotion rates • Leaver rates • Strategic leadership group (SLG), (top ~110 leaders) • New talent diversity Improved diversity in six of the eight Group-wide measures most notably: • Exceeded new hire targets (28% and 30%) for gender and ethnicity • Improved SLG diversity to 48% (target of 46%) • Increased new talent diversity to 57.7% (target of 50%) • Gender and ethnic leaver rates fell short of targets and remain a further focus area for 2022/23 Progress underpinned by robust delivery of a Group-wide DEI strategy. 3 Achieved Outcome – ESG (6/8) 75.00% Combined operational outcome 79.17% Notes: Diversity is defined as colleagues who have identified themselves of varying gender, sexual orientation, disability, under-represented racial and/or ethnic group. 115 C o rp o rate G o vernance National Grid plc Annual Report and Accounts 2021/22 26_Remco_Policy_p114_131_v87.indd 115 27/05/2022 17:29

APP – Individual objectives In addition to the financial and operational goals previously discussed, the Board approves annual individual performance goals for the Executive Directors in line with key operational and strategic priorities. Performance is assessed at the end of the financial year by the Board and Remuneration Committee. The CEO completed a self-evaluation which was shared with members of the Board for their comments. The Chair compiled these comments, and based on these comments, proposed a scoring for each of the goals. The CEO undertook the same process for the other Executive Directors and presented his recommendations to the Committee in May 2022. The table below sets out the 2021/22 individual objectives together with associated performance commentaries and the Committee’s assessment of the performance outcome for each of the Executive Directors: Individual objectives and performance summary – John Pettigrew Outcome Execute on the announced portfolio repositioning and deliver results on organisational streamlining • Successful execution of the strategic pivot to electricity; purchase of WPD • Effective management of divestitures and transition of WPD into the Group whilst ensuring solid business performance/continuity • Progression and development of the Company’s long-term strategic blueprint 80% Demonstrate substantial progress in modernising how the Group works, enhancing a culture of accountability • Demonstrated progress in shifting the Group’s culture, with a strong focus on DEI and positive employee satisfaction results • Made progress to improve bench strength of senior leadership group and Group Executive team Raise the level of engagement with the public, communities and government • COP26 and Capital Markets Day – repositioned National Grid across key stakeholder groups as a critical part of the energy transition • Strengthened governmental, public and community relations, and key relationships in particular at the local level Individual objectives and performance summary – Andy Agg Outcome Successfully execute the portfolio repositioning • Effectively managed financing strategy and credit ratings approach for the acquisition of WPD • Strong execution of portfolio repositioning; divestment of 60% stake in UK Gas Transmission, 50% stake in St William Homes LLP • Successfully ensured the mitigation of all stranded costs resulting from the portfolio transactions 85% Demonstrate progress in the Group-wide and Finance transformation programmes • Strong leadership across the Group driving in-year delivery and progression of £400 million of cost efficiencies per annum by the end of 2023/24 • Delivered solid progress against key transformation milestones, advanced key process and technology enabled efficiencies • Improved talent, succession potential, and capabilities within the CFO function Deliver enhanced investor engagement programme • Successfully engaged investors on the five-year investor framework and strategic pivot to electricity with positive feedback/sentiment • Increased transparency of our responsible business strategy yielding positive engagement and external ESG company ratings Individual objectives and performance summary – Nicola Shaw Outcome Successfully execute on UK businesses priorities • Effectively managed UK businesses to deliver on track mid-year financial performance for first year of RIIO-T2 • Successfully implemented operating model to stand up separate Electricity and Gas Transmission UK businesses 65% Deliver a successful Competition & Markets Authority outcome • Led process to submit all RIIO-T1 reopeners with Ofgem • Managed and executed the CMA process effectively; with a positive result on the out-performance wedge Grow National Grid’s positioning on the UK’s net zero future • Established East Coast asset investment strategy to facilitate connection of 40+ GW of offshore renewables by 2030 • Fostered strong relationships with key stakeholders to lay the groundwork for the development of net zero investment roadmap 2019 Long-Term Performance Plan award The 2019 LTPP that will vest on 1 July 2022 was structured as outlined below in consideration of the transition to RIIO-T2 in the UK during the performance period. The financial measures and weightings of the 2019 LTPP below are the same for all Executive Directors. • Group RoE over a two-year period (2019/20 − 2020/21) determines one third of the award • Group Value Growth over the three-year period (2019/20 − 2021/22) determines two thirds of the award The outturns of the 2019 LTPP reflect solid business performance over the three-year period, and are summarised below: Performance measure Weighting Threshold 20% vesting Maximum 100% vesting Actual % of maximum Group RoE 33.33% 11.0% 12.5% 22.67%11.1% Group Value Growth 66.67% 10.0% 12.0% 100.00%12.7% Overall vesting outcome 74.22% Denotes an ‘alternative performance measure’ as described on pages 268 − 279 As disclosed in last year’s DRR, the Group Value Growth measure in 2019 includes an upward adjustment versus the reported measure to reflect the value added from the sale of the residual interest in the UK Gas Distribution business and to adjust for the revised timing of UK cash tax payments. The Committee decided not to reflect upward adjustments to Group RoE or Group Value Growth for prior years (+0.3% in 2019/20 and +0.2% in 2020/21) resulting from the revisions described in note 1F to the consolidated financial statements in 2020/21 into the 2019 LTPP. 116 National Grid plc Annual Report and Accounts 2021/22 Directors’ Remuneration Report continued Statement of implementation of Remuneration Policy in 2021/22 continued 26_Remco_Policy_p114_131_v87.indd 116 27/05/2022 17:29

2019 LTPP Vesting The 2019 LTTP vesting reflects both the final performance outturn and the impact share price and dividends from the time of issue to vesting date. For the 2019 award, the share price appreciation represents a material proportion of the total vesting value. The 2019 LTPP awards were granted on 28 June 2019 with a share price of 834.11 pence. Comparing the share price at grant versus the average share price for the period 1 January 2022 to 31 March 2022 of 1,098.09 pence, yields a share price gain for the 2019 LTPP of 263.9 pence (31.6%) per share in addition to estimated dividend yield of 148.7 pence per share. The amounts due to vest under the 2019 LTPP for the performance period that ended on 31 March 2022 which are included in the 2021/22 single total figure table on page 114, are shown in the table below. The current share price valuation is an estimate based on the average share price over the three months from 1 January 2022 to 31 March 2022 of 1,098.09 pence and the proposed dividend with record date of 6 June 2022, subject to shareholder approval, is included. The total value of awards vesting and dividend equivalent shares are subject to a two-year holding period. Shares awarded Performance outcome (% of maximum) Vested shares based on performance Face value of the award at grant (£’000s) Share price appreciation (£’000s) Dividend equivalent shares (£’000s) Total value (£’000s) John Pettigrew 431,969 74.22 320,607 2,674 846 477 3,997 Andy Agg 213,999 74.22 158,830 1,325 419 236 1,980 Nicola Shaw¹ 190,739 74.22 141,566 1,181 374 211 1,765 1. Nicola Shaw’s 2019 LTPP will vest at the normal vesting date of July 2022 subject to performance conditions. The amount shown under ‘Shares awarded’ is pro-rated for time served to the termination date of 30 April 2022 in accordance with the plan rules. Assessment of National Grid shareholder returns The figure below outlines National Grid plc’s 10-year annual TSR performance against the FTSE 100 Index since 31 March 2012 and illustrates the growth in value of a notional £100 holding invested in National Grid on 31 March 2012, compared with the same invested in the FTSE 100 Index. The FTSE 100 Index has been chosen because it is a widely recognised performance benchmark for large companies in the UK and it is a useful reference to assess relative value creation for National Grid shareholders. Over the last 10-year period, National Grid’s relative TSR is 194% versus the FTSE 100 at 82% demonstrating sustainable long-term value for our shareholders. Over the more recent three-year performance period for the 2019 LTPP, National Grid’s relative TSR was 52% versus the FTSE 100 relative TSR of 13%, which underscores the strong alignment of our Remuneration Policy with the value delivered for our shareholders. 31/3/12 100.00 100.00 122.88 143.95 159.98 186.07 199.42 161.74 193.11 204.03 208.61 293.91 113.80 121.57 130.70 121.43 151.08 151.26 160.67 164.84 161.46 182.16 31/3/13 31/3/14 31/3/15 31/3/16 31/3/17 31/3/18 31/3/19 31/3/20 31/3/21 31/3/22 300 250 200 150 100 50 National Grid FTSE 100 IndexTotal Shareholder Return (£) V al ue o f hy p o th et ic al £ 10 0 ho ld in g Data source: Datastream by Refinitiv Notes: The TSR level shown at 31 March each year is the average of the closing daily TSR levels for the 30-day period up to and including that date. It assumes dividends are reinvested. 2021 Long-Term Performance Plan 2021 LTPP performance conditions As disclosed in last year’s DRR, we reverted to equal weighting for Group RoE and Group Value Growth, measured over the entire three-year performance period, for the 2021 LTPP. Below are the performance ranges for the two measures in the 2021 LTPP. As noted, setting of targets was delayed to enable proper consideration of the portfolio transactions for WPD, UK Gas Transmission, and the US Rhode Island businesses. Performance measures Weighting Threshold 20% vesting Maximum 100% vesting Group RoE 50% 9.75% 11.00% Group Value Growth 50% 9.25% 11.00% Notes: Vesting between threshold and maximum will be on a straight-line basis. The calculation for the Group RoE measure will reflect the updated methodology from 2021/22 going forward as outlined on page 277 of the Annual Report. 117 C o rp o rate G o vernance National Grid plc Annual Report and Accounts 2021/22 26_Remco_Policy_p114_131_v87.indd 117 27/05/2022 17:29

2021 LTPP (conditional awards) made during the year The face value of the awards are calculated using the volume weighted average share price at the date of grant. The share price at the date of grant on 28 June 2021 was 924.68 pence. The 2021 LTPP grant will vest on 1 July 2024. The total value of awards vesting and dividend equivalent shares are subject to a two-year holding period following vesting. Basis of award (% of base) Number of shares Face value (£’000) Proportion vesting at threshold performance Performance period end date John Pettigrew 350% 398,568 £3,686 20% 31 March 2024 Andy Agg 300% 218,993 £2,025 20% 31 March 2024 Statement of Directors’ shareholdings and share interests The Executive Directors are required to build up and hold a shareholding from vested share plan awards. The following table shows the position of each of the Executive Directors in relation with the shareholding requirement and the number of shares owned by the Non-executive Directors, including connected persons. The shareholding is as of 31 March 2022 and the salary used to calculate the value of the shareholding is the gross annual salary as of 31 March 2022. John Pettigrew continues to meet his shareholding requirement. Andy Agg, who was appointed the CFO in 2019, has not yet met his shareholding requirement and is expected to do so in 2023. The projections assume on-target performance/vesting outcomes. They will not be allowed to sell shares, except for covering associated tax liabilities, until their individual shareholding requirements are met. Non-executive Directors do not have a shareholding requirement. Further shares have been purchased in each of April and May 2022 on behalf of each of John Pettigrew and Andy Agg via the Share Incentive Plan (an HMRC tax-advantaged all-employee share plan), thereby increasing the beneficial interests by 25 shares (12 in April and 13 in May) for John Pettigrew and 24 shares (12 each in April and May) for Andy Agg. There have been no other changes in Directors’ shareholdings between 1 April 2022 and 19 May 2022. The expected vesting dates for the conditional share awards subject to performance conditions are 1 July 2022, 3 July 2023 and 1 July 2024 for the 2019 LTPP, 2020 LTPP and 2021 LTPP respectively. Directors Share ownership requirements (multiple of salary) Number of shares owned outright (including connected persons) Value of shares held as a multiple of current salary Number of options granted under the Sharesave Plan Conditional share awards subject to performance conditions (LTPP 2019, 2020, and 2021) Executive Directors John Pettigrew 500% 1,052,126 1,097% 4,219 1,235,754 Andy Agg 400% 216,807 353% 4,316 646,787 Non-executive Directors Liz Hewitt – 2,500 – – – Jonathan Dawson – 45,632 – – – Amanda Mesler – 1,500 – – – Earl Shipp (ADSs) – 1,000 – – – Anne Robinson (ADSs) – – – – – Tony Wood – – – – – Martha Wyrsch (ADSs) – 5,000 – – – Ian Livingston – 1,838 – – – Jonathan Silver (ADSs) – – – – – Paula Rosput Reynolds (ADSs) – 2000 – – – Thérèse Esperdy (ADSs) – 1587 – – – Notes: John Pettigrew: On 31 March 2022, John Pettigrew held 4,219 options granted in previous years under the Sharesave Plan with an exercise price of 711 pence per share and they can, subject to their terms, be exercised at 711 pence per share between 1 April 2025 and 30 September 2025. The number of conditional share awards subject to performance conditions is as follows: 2019 LTPP: 431,969; 2020 LTPP: 405,217; 2021 LTPP: 398,568. Andy Agg: On 31 March 2022, Andy Agg held 4,316 options granted in previous years under the Sharesave Plan with an exercise price of 695 pence per share and they can, subject to their terms, be exercised at 695 pence per share between 1 April 2026 and 30 September 2026. The number of conditional share awards subject to performance conditions is as follows: 2019 LTPP: 213,999; 2020 LTPP: 213,795; 2021 LTPP: 218,993. Earl Shipp, Jonathan Silver, Paula Rosput Reynolds, Martha Wyrsch, Anne Robinson and Thérèse Esperdy: Holdings are shown as American Depositary Shares (ADSs). Each ADS represents five ordinary shares. Post-employment shareholding requirements Past Executive Directors are required to continue to hold their shares/ADSs in line with our current and proposed Directors’ Remuneration Policy. To enforce this, the Executive Directors have agreed to give permission for the Company to periodically check with its third-party share scheme administrator whether the minimum shareholding requirement is being maintained. The Executive Directors have acknowledged that if they breach their post-employment shareholding requirement for any reason, the Company may enforce at its discretion one or more of the following processes: to request they repay to the Company an amount equivalent in value to the shareholding requirement that has not been met; the Company may withdraw/vary the vesting of any future shares granted under the LTPP; the Company may publish a public statement in a form, as the Company may decide that the Director has failed to comply with the post-employment shareholding requirement. Executive Directors are reminded annually, when employed, of the post-employment shareholding requirement. At termination, the minimum shareholding requirement is confirmed to the Director and checks are made by the Company at the 12-month and 24-month anniversary of leaving and at the financial year-end 31 March to ascertain if their post-employment shareholding requirement has been met. 118 National Grid plc Annual Report and Accounts 2021/22 Directors’ Remuneration Report continued Statement of implementation of Remuneration Policy in 2021/22 continued 26_Remco_Policy_p114_131_v87.indd 118 27/05/2022 17:29

Nicola Shaw stood down from the Board on 26 July 2021 and remained subject to an in-employment shareholding requirement until her final employment date of 30 April 2022, at which time she will be subject to a post-employment shareholding requirement of 200% of base salary for a period of two years. As of 31 March 2022, Nicola Shaw continues to meet her in-employment shareholding requirement. Shareholder dilution The Company has a number of multiple all-employee share plans that provide employees the opportunity to become shareholders. These plans include Sharesave and the Share Incentive Plan (SIP) in the UK and the 401(k) and Employee Stock Purchase Plan in the US. Where shares may be issued or treasury shares reissued to satisfy incentives, the aggregate dilution resulting from executive share-based incentives will not exceed 5% in any 10-year period. Dilution resulting from all incentives, including all-employee incentives, will not exceed 10% in any 10-year period. The Committee reviews dilution levels against these limits annually and under these limits the Company, as at 31 March 2022, had a headroom of 3.9% and 7.8% respectively. CEO pay ratio We have disclosed our CEO pay ratios comparing the CEO single total figure of remuneration to the equivalent pay for the 25th quartile, median, and 75th quartile UK employees (calculated on a full-time equivalent basis), as well as the median Group-wide pay ratio. CEO Pay Ratios 2021/22 to 2018/19 UK Group-wide Year Method 25th percentile pay ratio Median pay ratio 75th percentile pay ratio Median pay ratio 2021/22 Option A 135:1 105:1 81:1 76:1 2020/21 Option A 104:1 81:1 62:1 54:1 2019/20 Option A 111:1 86:1 66:1 53:1 2018/19 – voluntary Option A 96:1 76:1 58:1 48:1 Notes: Following the completion of the WPD acquisition in June 2021, this year’s CEO pay ratio includes circa 6,600 UK WPD employees in the data set. Salaries as at 31 March 2022 and estimated performance-based annual payments for 2021/22 have been annualised for part-time employees to reflect full-time equivalents. Performance payments have not been further adjusted to compensate where new employees have not completed a full performance year. The comparison with UK employees is specified by the Companies (Miscellaneous Reporting) Regulations 2018 (as amended). US employees represent approximately 56% of our total employees. Our median pay ratio on a Group-wide basis is 76:1, calculated on the same basis as the UK pay ratios and at an exchange rate of $1.348:£1. The CEO pay ratio has increased to 105:1 at the UK median. The increase is explained by the increase in the CEO’s single total figure of remuneration primarily due to the impact of the 2019 LTPP performance driven in part by the impact of share price growth of 31.6% over the three-year performance period and strong long-term business performance delivery. For reference, the impact of share price change for the 2019 LTPP, comparing share price at grant versus the average share price for the period 1 January 2022 to 31 March 2022 of 1,098.09 pence, for each Executive Director is an increase of 263.98 pence (31.6%) per share excluding the dividend (versus an increase of 2.1% for the 2018 LTPP). This year the 2019 LTPP vesting represents circa 61% (last year 54%) of the CEO’s single total figure of remuneration. Excluding estimated 2019 LTPP vesting, our UK median pay ratio is 40:1 (last year 39:1). On a Group basis, the median pay ratio has increased to 76:1. The lower Group median pay ratio reflects the higher level of wages in the regions of the US where we operate as compared with the UK. Nearly 56% of our employees are US-based. Excluding estimated 2019 LTPP vesting, the Group- wide median pay ratio is 29:1. These results highlight a key feature of our remuneration strategy to weight Executive and senior leadership compensation more heavily towards longer-term performance share based reward. Across the wider workforce, employee compensation is largely focused on in-year annual delivery. The 2021/22 base pay and total pay including benefits for the CEO versus UK workforce is shown below. 2021/22 Base pay and benefits – CEO, UK wider workforce UK Pay and benefits data CEO remuneration UK employee 25th percentile UK employee 50th percentile UK employee 75th percentile Base salary £1,047,115 £36,598 £42,054 £55,726 Total pay and benefits £6,505,511 £48,038 £61,834 £80,297 119 C o rp o rate G o vernance National Grid plc Annual Report and Accounts 2021/22 26_Remco_Policy_p114_131_v87.indd 119 27/05/2022 17:29

Flexibility is provided to adopt one of three methods for calculating the ratios. We have chosen Option A, which is a calculation based on the pay of all UK employees on a full-time equivalent basis, as this option is considered to be more statistically robust. The ratios are based on total pay and benefits inclusive of short-term and long-term incentives applicable for the respective financial year 1 April – 31 March. The reference employees at the 25th, 50th and 75th percentile have been determined by reference to pay and taxable benefits as at the last day of the respective financial year, 31 March, with estimates for the respective APP payouts and performance outcomes of the LTPP and dividend equivalents. Most employees are eligible for a performance-based annual payment. Our principles for pay setting and progression in our wider workforce are the same as for our executives – mid-market approach to total reward sufficiently competitive to attract and retain high-calibre individuals without over-paying and providing the opportunity for individual development and career progression. The pay ratios reflect how remuneration arrangements differ, as accountability increases for more senior roles within the organisation, and in particular the ratios reflect the weighting towards long-term value creation and alignment with shareholder interests for the CEO. We are satisfied that the median pay ratio reported this year is consistent with our wider pay, reward and progression policies for employees. The median reference employee falls within our collectively bargained employee population and has the opportunity for annual pay increases, annual performance payments and career progression and development opportunities. The CEO received a pay increase of 2.3% in 2021/22 in line with the increase budget awarded across the UK employee population (no increase was granted in 2020/21). Relative importance of spend on pay The chart below shows the relative importance of spend on pay compared with other costs and disbursements (dividends, tax, net interest and capital expenditure). Given the capital-intensive nature of our business and the scale of our operations, these costs were chosen as the most relevant measures for comparison purposes. All amounts exclude exceptional items and remeasurements. Relative importance of spend on pay Payroll costs Dividends Tax Net interest Capital expenditure +9% 1,622 1,770 +6% 1,742 1,852 +100% 334 669 +25% 865 1,081 +31% 4,727 6,185 2020/21 £m 2021/22 £m Notes: 1. The dividend figure for 2020/21 has been restated at £1,742 million (from £1,738 million) to reflect the actual value of dividends paid. 2. 2020/21 payroll costs, tax, net interest and capital investment have been re-presented to reflect the classification of the UK Gas Transmission business as a discontinued operation. 3. Percentage increase/decrease of the costs between years is shown. Chief Executive’s pay in the last ten financial years Steve Holliday was CEO throughout the five-year period from 2012/13 to 2015/16. John Pettigrew became CEO on 1 April 2016. Steve Holliday John Pettigrew 12/13 13/14 14/15 15/16 16/17 17/18 18/19 19/20 20/21 21/22 Single total figure of remuneration (£’000) 3,170 4,801 4,845 5,151 4,623 3,648 4,651 5,205 5,367 6,506 Single total figure of remuneration including only 2014 LTPP (£’000) 3,931 APP proportion of maximum awarded 55.65% 77.94% 94.80% 94.60% 73.86% 82.90% 84.20% 70.58% 80.43% 85.20% PSP/LTPP (proportion of maximum vesting) 25.15% 76.20% 55.81% 63.45% 90.41% 85.20% 84.20% 84.90% 68.00% 74.22% Notes: John Pettigrew: Single total figure for 2021/22 is explained in the single total figure of remuneration table for Executive Directors and single total figure for 2020/21 has been restated to reflect actual share price for 2018 LTPP vesting in 2021 and all dividend equivalent shares, consistent with comparative figures shown in this year’s single total figure of remuneration table. 2014 LTPP: The 2016/17 single total figure of remuneration includes both the 2013 LTPP award and the 2014 LTPP award due to a change in the vesting period of four years (2013 LTPP) to three years (2014 LTPP). PSP/LTPP plans: Prior to 2014, LTPP awards were made under a different LTI framework which incorporated a four-year performance period for the RoE element of the awards. The last award under this framework was made in 2013 and was fully vested in 2017. Awards made from 2014 are subject to a three-year performance period. The first of these awards vested in 2017. 120 National Grid plc Annual Report and Accounts 2021/22 Directors’ Remuneration Report continued Statement of implementation of Remuneration Policy in 2021/22 continued 26_Remco_Policy_p114_131_v87.indd 120 27/05/2022 17:29

Single total figure of remuneration – Non-executive Directors The following table shows a single total figure in respect of qualifying service for 2021/22, together with comparative figures for 2020/21: Fees £’000 Other emoluments £’000 Total £’000 2021/22 2020/21 2021/22 2020/21 2021/22 2020/21 Paula Rosput Reynolds 599 21 18 0 616 21 Sir Peter Gershon Resigned on 31.05.2021 90 540 12 82 102 622 Jonathan Dawson 108 112 3 1 111 113 Thérèse Esperdy 141 142 10 0 151 142 Paul Golby Resigned on 26.07.2021 33 104 2 1 35 105 Liz Hewitt 113 99 9 0 122 99 Ian Livingston Appointed on 01.08.2021 66 n/a 1 n/a 67 n/a Amanda Mesler 93 91 2 0 94 91 Earl Shipp 113 104 7 0 120 104 Jonathan Silver 99 104 9 0 109 104 Mark Williamson Resigned 31.12.2021 87 122 3 0 90 122 Tony Wood Appointed on 01.09.2021 48 NA 2 n/a 50 NA Martha Wyrsch Appointed on 01.09.2021 56 NA 3 n/a 59 NA Anne Robinson Appointed on 19.01.2022 19 NA 0 n/a 19 NA Total 1,665 1,439 81 84 1,745 1,523 Notes: Receiving the US-based Board fee: Thérèse Esperdy, Earl Shipp, Jonathan Silver, Anne Robinson and Martha Wyrsch. Receiving the UK-based Board fee: Jonathan Dawson, Paul Golby, Liz Hewitt, Amanda Mesler, Mark Williamson, Ian Livingston and Tony Wood. Therese Esperdy: Fees include £25,000 for serving on the National Grid USA Board; she stepped down from the National Grid USA Board on 18 November 2021. Paula Rosput Reynolds joined the Board on 1 January 2021 as a Non-executive Director and was appointed as Chair of the Board from 31 May 2021. She is not eligible for any benefits. Other emoluments: In accordance with the Company’s expenses policies, Non-executive Directors receive reimbursement for their reasonable expenses for attending Board meetings. In instances where these costs are treated by HMRC as taxable benefits, the Company also meets the associated tax cost to the Non-executive Directors through a PAYE settlement agreement with HMRC and these costs are included in the table above. For 2020/21 due to COVID-19 travel restrictions, most of the NEDs did not incur travel-related expenses. The total emoluments paid to Executive and Non-executive Directors in the year was £14.2 million (2020/21: £11.7 million). Percentage change in Remuneration (Executive Directors, Non-executive Directors, employee average) In line with the revised Shareholder Rights Directive (2019), we have included percentage change in salary/fee, bonus and benefits for each of the Directors compared to prior years. The regulations cover employees of the Parent Company only and not across the Group, and since we have very few people employed by our Parent Company (National Grid plc), we have voluntarily chosen a comparator group of all employees in the UK and the US to provide a representative comparison. In line with the regulations, we shall build this information to display a five-year history. 2020/21 2021/22 Executive Directors Salary Benefits Bonus Salary Benefits Bonus John Pettigrew 1.3% -4.7% 15.4% 1.7% -8.8% 7.8% Andy Agg 4.9% 40.6% 17.7% 6.5% -31.6% 15.9% Nicola Shaw 1.3% 1.1% 38.8% 1.7% 18.3% -33.1% Non Executive Directors Jonathan Dawson 0.5% 37.1% n/a -3.0% 417.6% n/a Therese Esperdy 0.4% -100.0% n/a -0.8% n/a n/a Sir Peter Gershon 0.5% -5.5% n/a -83.3% -85.0% n/a Paul Golby 0.5% -87.5% n/a -68.5% 213.8% n/a Liz Hewitt 334.8% -100.0% n/a 14.5% n/a n/a Amanda Mesler 0.5% -100.0% n/a 1.6% n/a n/a Paula Rosput Reynolds n/a n/a n/a 2816.8% n/a n/a Earl Shipp 0.5% -100.0% n/a 8.6% n/a n/a Jonathan Silver 14.3% -100.0% n/a -4.2% n/a n/a Mark Williamson -8.6% -100.0% n/a -29.2% n/a n/a Ian Livingston n/a n/a n/a n/a n/a n/a Tony Wood n/a n/a n/a n/a n/a n/a Martha Wyrsch n/a n/a n/a n/a n/a n/a Anne Robinson n/a n/a n/a n/a n/a n/a Employee median -8.49% 1.65% -5.52% 2.8% 6.1% 40% Note: For Nicola Shaw, the 2021/22 data reflects the salary, benefits and bonus paid for the complete year as presented in the single total figure of remuneration table. 121 C o rp o rate G o vernance National Grid plc Annual Report and Accounts 2021/22 26_Remco_Policy_p114_131_v87.indd 121 27/05/2022 17:29

For 2021/22, the percentage change data for salary/fees reflects that, other than for Andy Agg, the salary/fee increases for Directors were 2.3% in line with the wider workforce increases. For 2020/21, the percentage change data for salary/fees reflects that, other than for Andy Agg, there were no salary/ fee increases for Directors. In contrast, the majority of managers and all those covered by trade union agreements were eligible to receive an annual salary increase during 2020/21. The average salary increase budget for the UK and the US employees, subject to performance review, was 2.3% and 2.5% respectively in 2020/21. Budgets vary for employees covered by collective agreements depending on arrangements agreed with the respective trade unions. The Committee takes account of the general salary increase budgets available for managers/non-unionised employees when reviewing Directors’ salaries/fees. Further alignment between Executive Director pay and arrangements available to the wider workforce is evidenced by the approach that all employees have the opportunity to receive a bonus which is linked to either a combination of individual and Company/business performance measures, or Company/ business performance measures only, thus enabling employees as well as the Executive Directors to benefit in the Company’s success annually. Payments for loss of office and payments to past Directors Nicola Shaw stood down from the Board on 26 July 2021 and stayed with the Company until after the conclusion of the RIIO-T2 CMA appeal process and continued as Chair of the Company’s subsidiaries, National Grid Electricity Transmission plc and National Grid Gas plc. She remained in active employment until 31 October 2021, after which she was not eligible for 2021/22 APP and received salary and benefits until her final employment date of 30 April 2022 as per the terms of her contract. Her APP is pro-rated for her period of active employment for 2021/22, i.e. 1 April 2021 to 31 October 2021. Her 2019 LTPP will vest at the normal vesting date of July 2022 subject to performance conditions and is pro-rated for time served to the termination date of 30 April 2022 in accordance with the plan rules. Details of Nicola’s remuneration in relation to the period 1 April 2021 to 26 July 2021 (qualifying service as an Executive Director) and 27 July 2021 to 31 March 2022 is disclosed in the Single Total Figure of Remuneration table on page 114. All payments are in accordance with her service agreement, the Directors’ Remuneration Policy (and in line with our June 2021 Corporate Governance disclosure) and subject to applicable tax withholdings. The Committee agreed to grant good leaver treatment for Nicola’s in-flight LTPP awards given her overall long-term strong performance and contribution to the business. Nicola’s awards under the 2020 LTPP will be pro-rated for completed months held since the award date until 30 April 2022. These awards will vest at the same time as other participants, subject to performance measured at the vesting date and any discretion the Committee may decide to exercise at the time of vesting, in line with our Directors’ Remuneration Policy. These shares will be subject to the two-year post-vesting holding requirement and post-employment shareholding requirement. There have been no payments made to past Directors during 2021/22. External appointments and retention of fees Experience as a board member of another company is considered to be valuable personal development, which in turn is of benefit to the Company. The table below details the Executive Director (at 31 March 2022) who served as non-executive director in other companies during the year ended 31 March 2022: Company Retained fees John Pettigrew Rentokil Initial plc £70,000 Role of Remuneration Committee The Committee is responsible for recommending to the Board the Remuneration Policy for the Executive Directors, the other members of the Group Executive Committee and the Chair, and for implementing this Policy. The aim is to align the Remuneration Policy to the Company strategy and key business objectives, and ensure it reflects our shareholders’, customers’ and regulators’ interests. The Committee receives input on Policy implementation within the wider workforce before reaching decisions on matters such as salary increases and annual incentive payouts and closely reviews the appropriateness of pay positioning by reference to external measures (benchmarking remuneration packages) and internal review of Company performance and pay gaps (CEO pay ratios, gender and ethnicity pay gaps) and from this year, the relativity year-on-year of salary, benefits and annual performance incentives compared with the same for the rest of the workforce. • Clarity: we identify and communicate a range of performance measures in our incentives which clearly link to the successful execution of the Company’s strategy. • Simplicity: elements of our remuneration framework and their purpose are clearly articulated within our market-standard Remuneration Policy and we believe this is understood by all our stakeholders. • Risk: risk is managed in a number of ways and evidenced through our Remuneration Policy, for example: setting maximum levels for incentive plans; implementing measures that are aligned to Company performance and shareholder interests; focusing on the long term and creating value through the LTPP; reviewing formulaic outcomes; malus and clawback provisions; and having a high shareholding requirement for senior executives. • Predictability: full information on the potential values which could be earned are disclosed; our policy outlines threshold, target and maximum opportunity with varying actual incentive outcomes dependent on performance; and all the checks and balances set out above under Risk are disclosed as part of the Remuneration Policy. • Proportionality: whilst incentive plans reward executives’ performance in successfully delivering the business strategy, there is also a focus on sustaining this through holding periods that apply to vested shares and annual incentives paid out as shares; all executives are also subject to significant shareholding and post-employment shareholding requirements. The policy does not reward poor performance and the range of potential payouts under the Policy is appropriate. • Alignment to culture and strategy: our culture recognises that how we do things is as vital as what we do and this is reflected in the type of performance conditions used in our incentive plans. Both the measures themselves and the targets set aim to reinforce this approach. Our policy has operated as intended in terms of Company performance and quantum; a review of key considerations and decisions pertaining to its implementation is provided in the Committee Chair’s statement. 122 National Grid plc Annual Report and Accounts 2021/22 Directors’ Remuneration Report continued Statement of implementation of Remuneration Policy in 2021/22 continued 26_Remco_Policy_p114_131_v87.indd 122 27/05/2022 17:29

The Committee’s activities in 2021/22 Meeting/circulations Main areas of discussion April Discussion on 2020/21 expected incentive plan outcomes (APP and outstanding LTPP) for the Group Executive Committee 2020/21 APP individual objective scoring for the Group Executive Committee Discussion on the 2021/22 APP financial and operational measures and LTPP 2021 award for the Group Executive Committee Discussion on the 2021/22 APP strategic objectives for the Group Executive Committee Market data review and base salary increase proposals for the Group Executive Committee May Approval of 2020/21 APP and 2018 LTPP outcomes for the Group Executive Committee Approval of pay decisions for the Group Executive Committee Review and approval of Chair fees Approval of the 2021/22 APP strategic objectives for the Group Executive Committee Approval of LTPP plan rules Items related to Executive Director leaver arrangements and WPD senior management team remuneration arrangements July Approval of 2021/22 APP targets (financial and operational) and 2018 LTPP vesting Debrief of AGM season, remuneration trends and initial discussion for 2022 Remuneration Policy August* Items related to new Group Executive Committee appointment October Approval of 2021 LTPP targets November Approval of the revision to 2021/22 APP targets to incorporate transactions impact Performance update on incentive plans (APP and outstanding LTPP) Items related to various Group Executive Committee members’ (i) leaving arrangements, and (ii) remuneration arrangements Approval of 2021/22 Sharesave plan Review of gender and ethnicity pay gaps January Provisional approval 2022 Remuneration Policy; approval of the consultation plan Items related to various Group Executive Committee members’ (i) leaving arrangements (ii) remuneration arrangements (iii) incentive plan outcomes, and (iv) forward looking objectives February* Review of shareholder letter on proposed Remuneration Policy March AGM season debrief and discussion on feedback from shareholder consultation on 2022 Remuneration Policy Discussion on 2021/22 expected incentive plan outcomes (APP and outstanding LTPP) for the Group Executive Committee 2021/22 APP individual objective scoring for the Group Executive Committee Discussion on the 2022/23 APP financial and operational measures and LTPP 2022 award for the Group Executive Committee Discussion on the 2022/23 APP strategic objectives for the Group Executive Committee Market data review and base salary increase proposals for the Group Executive Committee Approval of proposed amends to Employee Share Schemes Sub-Committee Terms of Reference * By circulation. Advisors to the Remuneration Committee PricewaterhouseCoopers LLP (PwC) was selected by the Committee to become its independent advisor from 3 August 2020 and provided advice and counsel to the Committee throughout the 2021/22 financial year. PwC is member of the Remuneration Consultants Group (RCG) and have signed up to RCG’s code of conduct. The Committee is satisfied that any potential conflicts were appropriately managed. Work undertaken by PwC in its role as independent advisor to the Committee, has incurred fees of £243,500 on the basis of time charged to perform services and deliverables. The Committee reviews the objectivity and independence of the advice it receives from its advisors each year. It is satisfied that PwC provided credible and professional advice. PwC has provided general and technical remuneration services in relation to employees below Board and Group Executive Committee level that include broad-based employee reward support and data assurance services. In addition, Willis Towers Watson (WTW) provided benchmarking support to the Committee in the year and incurred fees of £15,600. The Committee considers the views of the Chair on the performance and remuneration of the CEO, and of the CEO on the performance and remuneration of the other members of the Group Executive Committee. The Committee is also supported by the Group General Counsel & Company Secretary, who acts as Secretary to the Committee; the Chief People & Culture Officer; the Group Head of Reward; and, as required, the CFO, the Group Head of Pensions and Group Financial Controller. Voting on Directors’ Remuneration Policy and the Directors’ Remuneration Report Directors’ Remuneration Policy adopted at the 2019 AGM Directors’ Remuneration Report 2020/21 3% For Against 97% 3% 97% Note: The Directors’ Remuneration Policy voting figures shown refer to votes cast at the 2019 AGM and represent 64.66% of the voting share capital. The Directors’ Remuneration Report voting figures shown refer to votes cast at the 2021 AGM (in respect of the 2019 remuneration policy adopted at the 2019 AGM) and represent 66.73% of the voting share capital. 123 C o rp o rate G o vernance National Grid plc Annual Report and Accounts 2021/22 26_Remco_Policy_p114_131_v87.indd 123 27/05/2022 17:29

124 National Grid plc Annual Report and Accounts 2021/22 2022 Directors’ Remuneration Policy Our Remuneration strategy sets out to ensure strong alignment with our strategic priorities and creation of value for shareholders whilst providing market competitive remuneration to enable the attraction and retention of top leadership talent. Our existing Policy (adopted in 2019) continues to function well, providing remuneration outcomes well aligned to Company performance and our shareholders’ experience. As such, the 2022 Policy, effective July 2022 subject to shareholder approval, incorporates modest refinements to reflect the importance of the Company’s responsible business strategy and ESG goals in both the short and long-term and the increasingly dynamic external context which advantages greater agility and flexibility. We have engaged widely with shareholders and proxy advisory service organisations and are grateful for the engagement, feedback, and positive support on our Policy proposals. The Committee is committed to maintaining an open dialogue and members remain available to answer questions throughout the AGM process and forthcoming year ahead on our 2022 Directors’ Remuneration Policy as outlined below. Policy tables – Executive Directors Element Operation Maximum levels Performance assessment Salary Purpose and link to business strategy: to attract, motivate and retain high-calibre individuals. Salaries are generally reviewed annually and are targeted broadly at the mid-market of our peer group. However, a number of other factors are also taken into account: • business performance and individual contribution; • the individual’s skills and experience; • scope of the role, including any changes in responsibility; • market data, including base pay and total remuneration; and • opportunity in the relevant comparator group. No prescribed maximum annual increase although increases are generally aligned to or below salary increases received by other Company employees and to market movements. Increases in excess of this may be made at the Committee’s discretion in circumstances such as a significant change in responsibility, progression if more recently appointed in the role and alignment to mid-market levels. Not applicable. Benefits Purpose and link to business strategy: to provide competitive and cost effective benefits to attract and retain high-calibre individuals. Benefits currently provided include: • company car or a cash alternative (UK only); • use of a car and driver when required; • private medical insurance; • life assurance; • personal accident insurance (UK only); • opportunity to purchase additional benefits (including personal accident insurance for US) under flexible benefits schemes available to all employees; and • opportunity to participate in HMRC (UK) or Internal Revenue Service (US) tax-advantaged all-employee share plans. UK Sharesave: Monthly contributions from net salary for a period of three or five years. The savings can be used to purchase shares at a discounted price set at the launch of each plan period. Share Incentive Plan: UK employees may use gross salary to purchase shares. These shares are placed in trust. Employee Stock Purchase Plan (ESPP) (423(b) plan): eligible US employees may purchase ADSs on a monthly basis at a discounted price. Other benefits may be offered at the discretion of the Committee. In circumstances where an Executive Director is located outside of the UK, benefits will be set such that they are competitive in the local market. The cost of providing benefits will vary from year to year in line with market. Participation in tax-advantaged all-employee share plans is subject to limits set by relevant tax authorities. Not applicable. Pension Purpose and link to business strategy: to reward sustained contribution and assist in attraction and retention. Externally hired Executive Directors may participate in a DC arrangement or alternatively choose to receive cash in lieu. In cases of internal promotion to the Board, the Company will recognise legacy DB pension arrangements of existing employees in both the UK and US where these have been provided under an existing arrangement. In line with market practice, pensionable pay for UK-based Executive Directors includes base salary only and for US-based Executive Directors it includes base salary and APP awards. UK Directors: DC: annual contributions for new appointments and existing Executive Directors of up to 12% of base salary. Executive Directors may take a full or partial cash supplement in lieu. Life assurance of four times base salary and a dependant’s pension of one third of basic salary is provided. Executives with HMRC pension protection may be offered lump sum life assurance only, equal to four times base salary. US Directors: DC contributions of up to 9% of basic salary plus APP award with additional 401(k) plan match up to 4%. DB: no additional DB entitlements will be earned over the financial years from the date of appointment, other than an increase for price inflation due under the pension scheme rules and legislation. Under the terms of the pension scheme, if the Executive Director satisfies the ill-health requirements, or is made redundant, a pension may be payable earlier than the normal retirement date. A lump sum death in service benefit is also provided in respect of these DB entitlements. Not applicable. None of the current Executive Directors are active members of a defined benefit plan. Directors’ Remuneration Report continued Directors’ Remuneration Policy 26_Remco_Policy_p114_131_v87.indd 124 27/05/2022 17:29
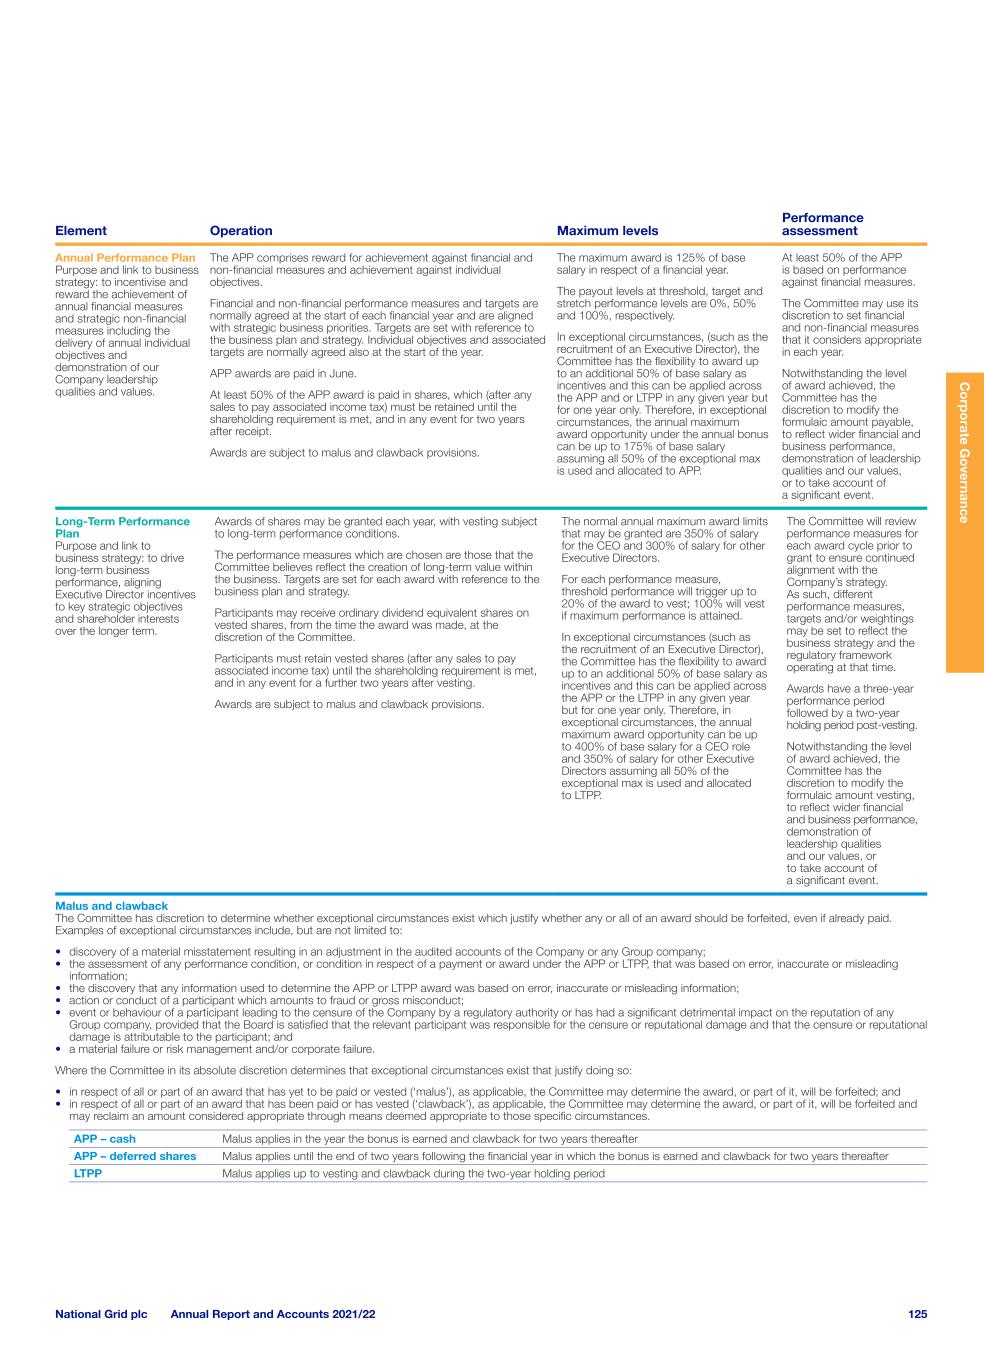
125 C o rp o rate G o vernance National Grid plc Annual Report and Accounts 2021/22 Element Operation Maximum levels Performance assessment Annual Performance Plan Purpose and link to business strategy: to incentivise and reward the achievement of annual financial measures and strategic non-financial measures including the delivery of annual individual objectives and demonstration of our Company leadership qualities and values. The APP comprises reward for achievement against financial and non-financial measures and achievement against individual objectives. Financial and non-financial performance measures and targets are normally agreed at the start of each financial year and are aligned with strategic business priorities. Targets are set with reference to the business plan and strategy. Individual objectives and associated targets are normally agreed also at the start of the year. APP awards are paid in June. At least 50% of the APP award is paid in shares, which (after any sales to pay associated income tax) must be retained until the shareholding requirement is met, and in any event for two years after receipt. Awards are subject to malus and clawback provisions. The maximum award is 125% of base salary in respect of a financial year. The payout levels at threshold, target and stretch performance levels are 0%, 50% and 100%, respectively. In exceptional circumstances, (such as the recruitment of an Executive Director), the Committee has the flexibility to award up to an additional 50% of base salary as incentives and this can be applied across the APP and or LTPP in any given year but for one year only. Therefore, in exceptional circumstances, the annual maximum award opportunity under the annual bonus can be up to 175% of base salary assuming all 50% of the exceptional max is used and allocated to APP. At least 50% of the APP is based on performance against financial measures. The Committee may use its discretion to set financial and non-financial measures that it considers appropriate in each year. Notwithstanding the level of award achieved, the Committee has the discretion to modify the formulaic amount payable, to reflect wider financial and business performance, demonstration of leadership qualities and our values, or to take account of a significant event. Long-Term Performance Plan Purpose and link to business strategy: to drive long-term business performance, aligning Executive Director incentives to key strategic objectives and shareholder interests over the longer term. Awards of shares may be granted each year, with vesting subject to long-term performance conditions. The performance measures which are chosen are those that the Committee believes reflect the creation of long-term value within the business. Targets are set for each award with reference to the business plan and strategy. Participants may receive ordinary dividend equivalent shares on vested shares, from the time the award was made, at the discretion of the Committee. Participants must retain vested shares (after any sales to pay associated income tax) until the shareholding requirement is met, and in any event for a further two years after vesting. Awards are subject to malus and clawback provisions. The normal annual maximum award limits that may be granted are 350% of salary for the CEO and 300% of salary for other Executive Directors. For each performance measure, threshold performance will trigger up to 20% of the award to vest; 100% will vest if maximum performance is attained. In exceptional circumstances (such as the recruitment of an Executive Director), the Committee has the flexibility to award up to an additional 50% of base salary as incentives and this can be applied across the APP or the LTPP in any given year but for one year only. Therefore, in exceptional circumstances, the annual maximum award opportunity can be up to 400% of base salary for a CEO role and 350% of salary for other Executive Directors assuming all 50% of the exceptional max is used and allocated to LTPP. The Committee will review performance measures for each award cycle prior to grant to ensure continued alignment with the Company’s strategy. As such, different performance measures, targets and/or weightings may be set to reflect the business strategy and the regulatory framework operating at that time. Awards have a three-year performance period followed by a two-year holding period post-vesting. Notwithstanding the level of award achieved, the Committee has the discretion to modify the formulaic amount vesting, to reflect wider financial and business performance, demonstration of leadership qualities and our values, or to take account of a significant event. Malus and clawback The Committee has discretion to determine whether exceptional circumstances exist which justify whether any or all of an award should be forfeited, even if already paid. Examples of exceptional circumstances include, but are not limited to: • discovery of a material misstatement resulting in an adjustment in the audited accounts of the Company or any Group company; • the assessment of any performance condition, or condition in respect of a payment or award under the APP or LTPP, that was based on error, inaccurate or misleading information; • the discovery that any information used to determine the APP or LTPP award was based on error, inaccurate or misleading information; • action or conduct of a participant which amounts to fraud or gross misconduct; • event or behaviour of a participant leading to the censure of the Company by a regulatory authority or has had a significant detrimental impact on the reputation of any Group company, provided that the Board is satisfied that the relevant participant was responsible for the censure or reputational damage and that the censure or reputational damage is attributable to the participant; and • a material failure or risk management and/or corporate failure. Where the Committee in its absolute discretion determines that exceptional circumstances exist that justify doing so: • in respect of all or part of an award that has yet to be paid or vested (‘malus’), as applicable, the Committee may determine the award, or part of it, will be forfeited; and • in respect of all or part of an award that has been paid or has vested (‘clawback’), as applicable, the Committee may determine the award, or part of it, will be forfeited and may reclaim an amount considered appropriate through means deemed appropriate to those specific circumstances. APP – cash Malus applies in the year the bonus is earned and clawback for two years thereafter APP – deferred shares Malus applies until the end of two years following the financial year in which the bonus is earned and clawback for two years thereafter LTPP Malus applies up to vesting and clawback during the two-year holding period 26_Remco_Policy_p114_131_v87.indd 125 27/05/2022 17:29

Shareholding requirement – in employment The requirement of Executive Directors to build up and hold a significant value of National Grid shares ensures they share a significant level of risk with shareholders and aims to align their interests. Executive Directors are required to build up and retain shares in the Company. The level of holding required is 500% of salary for the CEO and 400% of salary for the other Executive Directors. Unless the shareholding requirement is met, Executive Directors will not be permitted to sell shares, other than to pay income tax liabilities on shares just vested or in exceptional circumstances approved by the Committee. Shareholding requirement – post employment The requirement of Executive Directors to continue to hold National Grid shares after leaving ensures they continue to share a risk with shareholders and maintain alignment with shareholders’ interests. Executive Directors will be required to hold 200% of base salary calculated at their leaving date, or maintain their actual holding percentage if lower, expressed as a number of shares and held for a period of two years. This calculation excludes the value of any awards not yet vested for ‘good leavers’ that will vest according to the normal schedule and which in any event must be held for a two-year period. The calculation will include recently vested LTPP awards or APP awards paid as shares which are subject to respective two-year holding periods, even after employment. Until the post-employment shareholding requirement is met, Executive Directors will not be permitted to sell shares, other than to pay income tax liabilities on shares just vested or in exceptional circumstances approved by the Committee. Our peer group The Committee reviews its Remuneration Policy against appropriate peer groups annually to make sure we remain competitive in the relevant markets. The primary focus for reward market comparisons is currently the FTSE 11 − 40 for UK-based Executive Directors and US general industry and US energy services companies with similar levels of revenue for US-based Executive Directors. These peer groups are considered appropriate for a large, complex, international and predominantly regulated business. The Committee may amend the peer group and reference other peer groups as deemed appropriate. Policy tables – Non-executive Directors (NEDs) Element Operation Maximum levels Performance metrics, weighting and time period applicable Fees for NEDs Purpose and link to business strategy: to attract NEDs who have a broad range of experience and skills to oversee the implementation of our strategy NED fees (excluding those of the Chair) are set by the Group Executive Committee in conjunction with the Chair. The Chair fees are set by the Committee. Fee structure: • Chair fee (all inclusive); • basic fee; • Committee chair fee; • Committee membership fee; • Senior Independent Director fee; and • additional Board responsibilities. Fees are reviewed every year taking into account those in companies of similar scale and complexity. The Chair is eligible to receive benefits as deemed appropriate and necessary in respect of the role, which may include, for example, private medical and personal accident cover, the use of a company car and driver, and financial advice. NEDs do not participate in incentives, pension or any other benefits. However, they are eligible for reimbursement for all Company-related travel expenses. In instances where these costs are treated by HMRC as taxable benefits, the Company also meets the associated tax cost to the Non-executive Directors through a PAYE settlement agreement with HMRC. NEDs who also sit on National Grid subsidiary boards may receive additional fees related to service on those boards. There are no prescribed maximum fee levels although fee increases are generally aligned to salary increases received by other Company employees and market movement for NEDs of companies of similar scale and complexity. The cost of benefits provided to the Chair is not subject to a predetermined maximum since the purchase cost will vary from year to year. Not applicable. Legacy arrangements For the avoidance of doubt, the Committee may approve payments to satisfy commitments agreed prior to the approval of this Remuneration Policy, for example, those outstanding and unvested incentive awards which have been disclosed to shareholders in previous Remuneration Reports and any commitment made to a person before that person became an Executive Director. Operation of the policy The Committee reviews annually the overall appropriateness and relevance of the Remuneration Policy and whether any changes should be put to shareholders. Decisions on the measures and targets for performance-related pay (APP and LTPP) and payouts are made taking account of overall financial and business performance. A member of the Audit & Risk Committee is required to be a member of the Committee and this ensures the Committee receives knowledgeable input on setting financial measures and assessing outturns including any adjustments and judgements considered by the Audit & Risk Committee. The Committee also works closely with the People & Governance Committee in respect of pay and conditions of newly appointed Directors to ensure their remuneration is within Policy. The Committee will also link in with the Employee Share Schemes Sub-Committee as required. Consistent with the UK Corporate Governance Code, members of the Remuneration Committee are independent Non-executive Directors who do not receive any variable remuneration and do not participate in decisions about their own remuneration. 126 National Grid plc Annual Report and Accounts 2021/22 Directors’ Remuneration Report continued Directors’ Remuneration Policy continued 26_Remco_Policy_p114_131_v87.indd 126 27/05/2022 17:29

Other features of the Remuneration Policy Policy on recruitment remuneration Salaries for new Executive Directors appointed to the Board will be set in accordance with the terms of the approved Remuneration Policy in force at the time of appointment, and in particular will take account the appointee’s skills, experience and the scope and assessment of the market rate for the role. Where appropriate, salaries may be set below market level initially, with the Committee retaining discretion to award increases in salary in excess of the wider workforce and inflation to progressively bring the salary up to the market level over time, where this is justified by individual and Company performance. Any such increases will be disclosed accordingly, along with a supporting rationale where appropriate. Benefits consistent with those offered to other Executive Directors under the approved Remuneration Policy in force at the time of appointment will be offered, taking account of local market practice. The Committee may also agree that the Company will meet certain recruitment costs, for example legal fees, certain relocation expenses or provide tax equalisation as appropriate. Pension contributions for new Executive Directors appointed to the Board will be set in accordance with the terms of the approved Remuneration Policy in force at the time of appointment. Ongoing incentive pay (APP and LTPP) for new Executive Directors will be in accordance with the approved Remuneration Policy in force at the time of appointment. This means the normal maximum APP award in any year would be 125% of salary and the normal maximum LTPP award would be 350% of salary for the CEO and 300% of salary for other Executive Directors. In exceptional recruitment circumstances, the Committee has the flexibility to award up to an additional 50% of basic salary as incentive pay and this can be applied across the APP/LTPP in any given year but for one year only. The total maximum variable pay in any year will be 525%, excluding any buyout awards. For an externally appointed Executive Director, the Company may offer additional cash or share-based payments that it considers necessary to buy out current entitlements from the former employer that will be lost on recruitment to National Grid. Any such arrangements would, so far as practicable, reflect the delivery mechanisms, time horizons and levels of conditionality of the remuneration lost. In order to facilitate buy-out arrangements, existing incentive arrangements will be used to the extent possible, although awards may also be granted outside of these shareholder-approved schemes if necessary and as permitted under the Listing Rules. For an internally appointed Executive Director, any outstanding APP awards will be determined according to the original terms but paid at the end of the year. Any outstanding LTPP awards will be paid according to the original terms. Fees for a new Chair or Non-executive Director will be set in line with the approved Policy in force at the time of appointment. Service contracts/letters of appointment In line with our Policy, all Executive Directors have service contracts which are terminable by either party with 12 months’ notice commencing immediately after announcement. Non-executive Directors are subject to letters of appointment. The Board Chair’s appointment is subject to six months’ notice by either party; for other Non-executive Directors, notice is one month. Both Executive Directors and Non-executive Directors are required to be re-elected at each AGM. Examples of circumstances which could trigger ‘good leaver’ treatment include: redundancy, retirement, illness, injury, disability and death. In these circumstances, awards will be released to the departing Executive Director or, in the case of death, to their estate. Long-term share plan awards held by ‘good leavers’ will normally vest, subject to performance measured at the normal vesting date and be reduced pro-rata for completed time of service starting on the date of grant, as per the plan rules. Such awards would vest at the same time as for other participants, apart from circumstances in which the award recipient has died, in which case the awards may vest as soon as practicable (based on a forecast of performance). At the Committee’s discretion, the Company may also agree other payments such as an agreed amount for legal fees associated with the departure of the Executive Director and outplacement support. No compensation would be paid for loss of office of Directors on a change of control of the Company. No compensation is payable to the Chair or Non-executive Directors if they are required to stand down or are not re-elected at the AGM. Copies of Directors’ service contracts and letters of appointment are available for inspection at the Company’s registered office. Policy on payment for loss of office The contracts contain provisions for payment in lieu of notice, at the sole and absolute discretion of the Company. Such contractual payments are limited to payment of salary only for the remainder of the notice period. In the UK, such payments would usually be phased on a monthly basis, over a period not greater than 12 months, and the Executive Director would be expected to mitigate any losses where employment is taken up during the notice period. In the US, for tax compliance purposes, the policy is to make any payment in lieu of notice as soon as reasonably practicable, and in any event within two and a half months of the later of 31 December and 31 March immediately following the notice date. In the event of a UK Director’s role becoming redundant, statutory compensation would apply and the relevant pension plan rules may result in the early payment of an unreduced pension. On termination of employment, no APP award would generally be payable. However, the Committee has the discretion to deem an individual to be a ‘good leaver’, in which case a pro-rata discretionary payment could be paid, based on performance (as measured at the end of the financial year) and the achievement of individual objectives during the financial year up to termination. 127 C o rp o rate G o vernance National Grid plc Annual Report and Accounts 2021/22 26_Remco_Policy_p114_131_v87.indd 127 27/05/2022 17:29

In the UK, any discretionary payment would generally be paid at the normal time. In the US the payment may be made earlier if required for tax compliance purposes, in which case the Committee would apply discretion to determine an appropriate level of financial performance. Examples of circumstances which could trigger ‘good leaver’ treatment include redundancy, retirement, illness, injury, disability and death. The Committee may apply discretion to determine if any pro-rata discretionary payment should be made sooner than it would normally be paid, for example, in the case of death. On termination of employment, outstanding awards under the share plans will be treated in accordance with the relevant plan rules approved by shareholders. Unvested share awards would normally lapse. ‘Good leaver’ provisions apply at the Committee’s discretion and in specified circumstances. External appointments Executive Directors may, with the approval of the Board, accept one external appointment as a Non-executive Director of another company and retain any fees received for the appointment. Experience as a board member of another company is considered to be valuable personal development, which in turn is of benefit to the Company. Corporate and share capital events The Group’s employee share plans (including the LTPP) contain standard provisions that allow awards (and where relevant their exercise prices) to be adjusted, or in some cases vest or be exchanged, on the occurrence of a corporate or share capital event such as a capitalisation or rights issue, sub-division, consolidation or reduction of share capital, demerger, special dividend or distribution, listing or change of control, normally at the discretion of the Committee. Total remuneration opportunity The total remuneration for each of the Executive Directors that could result from the 2022 Remuneration Policy under three different performance levels (below threshold, when only fixed pay is receivable, on target and maximum) is shown below. The maximum receivable assuming 50% share price growth (or a reduction) in LTPP awards over a three-year performance period, and the basis for this calculation, is set out in the notes below. John Pettigrew Fixed pay On target Maximum Fixed pay APP LTPP £4,416 £6,628 £1,439100% 33% 15% 52% 21% 21% 58% Andy Agg Fixed pay On target Maximum Fixed pay APP LTPP £2,618 £3,930 £855100% 33% 17% 50% 22% 23% 55% Notes: 1. Fixed pay consists of salary, pension and benefits in kind as provided under the Remuneration Policy. Salary is that to be paid in 2022/23, taking account of the increases that will be effective from 1 July 2022 as shown on page 129. Benefits in kind and pension are as shown in the Single Total Figure of Remuneration table for 2021/22 on page 114. 2. APP calculations are based on 125% of salary for the period 1 April 2022 to 31 March 2023. APP payout is 0% for threshold performance, 50% for on-target performance and the maximum of 100% is for achieving stretch. 3. LTPP calculations are based on awards with a face value of 350% of 1 July 2022 salary for John Pettigrew and 300% of 1 July 2022 salary for Andy Agg. LTPP payout is 20% for threshold performance and the maximum of 100% is for achieving stretch and straight line vesting between. Excludes changes in share price and dividend equivalents. 4. For LTPP calculations, assuming either a 50% share price growth (or reduction) over the three-year performance period, the increase (or decrease) in LTPP value and maximum total compensation for each of the Executive Directors would be (all amounts expressed as £’000): • John Pettigrew: LTI value would increase (or decrease) from £3,824 to £5,736 (or £1,912) and maximum total compensation would rise (or reduce) from £6,628 to £8,540 (or £4,716) respectively • Andy Agg: LTI value would increase (or decrease) from £2,157 to £3,236 (or £1,079) and maximum total compensation would rise (or reduce) from £3,930 to £5,008 (or £2,809) respectively. Consideration of remuneration policy elsewhere in the Company The design and implementation of executive remuneration takes into consideration the wider workforce context and remuneration strategy to ensure they are mutually reinforcing. Our executive Remuneration Policy is well aligned to policies for our non-unionised workforce, and the Committee actively considers employee feedback and views on executive pay. The Company issues an employee engagement survey each year, which includes remuneration as a topic, and regularly engages with employees on a variety of topics including remuneration to ensure employees have an opportunity to share their feedback and views. All employees are entitled to base salary, benefits, and pension contributions. The approach to assessing salaries, benefits, pensions and other elements of remuneration is consistent across the Group with an objective to ensure they remain competitive at relevant mid-market levels for all job bands/roles, including roles that are subject to union negotiation. We are pleased to report that National Grid continues to be accredited by the Living Wage Foundation as a real Living Wage employer for our UK businesses (excluding the recent acquisition of WPD). Further plans and efforts are underway to achieve equivalent accreditations for WPD and the rest of our global businesses in the US. Middle to senior leaders are eligible to participate in our long-term incentive plans either through performance share awards or restricted share awards (under the LTPP) to incentivise and reward their individual contributions toward the Company’s longer-term strategic priorities. Performance measures for the LTPP are consistent with measures set for Executive Directors to ensure strong alignment and focus on the Company’s strategic goals. Across the wider workforce, a greater emphasis and focus is placed on delivery of the Company’s annual operational and financial business plans. As such, the majority of employees are eligible to participate in the APP. Performance measures for annual incentives are cascaded through the organisation and designed to ensure they incentive elements of business performance within an individual’s control and are aligned to employee’s annual goals. All Company employees are encouraged to become shareholders through a number of all-employee share plans and a significant proportion of our employees participate annually. These plans include Sharesave and the SIP in the UK and the 401(k) and 423(b) plans in the US which are summarised on page 124. 128 National Grid plc Annual Report and Accounts 2021/22 Directors’ Remuneration Report continued Directors’ Remuneration Policy continued 26_Remco_Policy_p114_131_v87.indd 128 27/05/2022 17:29

Implementation of the Remuneration Policy for 2022/23 The Remuneration Policy to be adopted at the 2022 AGM, subject to shareholder approval, will be implemented during 2022/23 as outlined below: Salary and pensions Salary increases will normally be in line with the increase awarded to other employees in the UK and the US, subject to performance. Higher salary increases may also be awarded for a change in responsibility. Additionally, in line with the Policy on recruitment remuneration, salaries for new directors may be set below market level initially and aligned to market level over time (provided the increase is merited by the individual’s contribution and performance). As explained in the Chair’s statement, for 2022 a salary increase of 3.75% for John Pettigrew and 6.5% for Andy Agg will be awarded, effective from 1 July 2022. From 1 July 2022 From 1 July 2021 % increase John Pettigrew £1,092,500 £1,053,000 3.75% Andy Agg £719,000 £675,000 6.5% The pension contribution for new and existing Executive Directors has been set to 12% effective 1 April 2022, in line with pension contribution rates for the UK wider workforce. 2022/23 Annual Performance Plan The 2022/23 APP measures will be split across financial measures, operational measures and individual objectives, weighted 70%, 15% and 15% respectively. The increase in the financial element of the APP this year reflects a balancing of operational measures which total 15% (versus 20% in 2021/22) and individual objectives which total 15% (versus 20% in 2021/22). The maximum APP award for both the Executive Directors for 2022/23 is 125% of basic salary, in line with the Policy, subject to shareholder approval. Measure Weighting Financial measures Underlying EPS 35% Group RoE 35% Operational measures Customers: Group Customer Satisfaction Index 5% Colleagues: Group Having a Voice Index 5% Diversity, Equity, and Inclusion: % Diversity of Strategic Leadership Group (top ~110 leaders) 5% Individual objectives 15% Financial measures Underlying EPS and Group RoE have been retained as financial measures in the 2022/23 APP. In both measures for remuneration purposes, the part year contributions of UK Gas Transmission are included in the performance targets. Group RoE remains a relevant and key measure of performance as a primarily regulated asset-based company. In the short-term (APP), Group RoE targets are set to ensure strong in year returns and operational results. An ‘annual profit’ measure in the APP also remains key, given in particular the importance of regulated earnings to the business strategy. Underlying EPS is a well-understood and established measure internally and externally, and as such remains the most appropriate APP earnings measure for the business. Similar to Group RoE, annual target setting considers specific challenges and opportunities in the year ahead and is flexed accordingly whilst remaining consistent with our longer-term performance goals. Financial APP targets are considered commercially sensitive and consequently will be disclosed in the 2022/23 Directors’ Remuneration Report. Operational measures The 2022/23 APP operational measures are designed to incentivise key annual priorities aligned to the Company’s strategy as a responsible business and broader ESG goals and are weighted equally across three key measures focused on customers, colleagues and DEI. Operational measures will continue to be assessed on a four-point scale (not met, partially achieved, achieved and over-achieved) based on quantifiable targets and qualitative outcomes to reflect a balanced assessment of performance. The Group Customer Satisfaction Index is an equally weighted index of quantifiable and predominantly externally measured customer satisfaction scores/ measures across each of the Company’s business units. The inclusion of a customer measure in the APP reflects the strategic importance and focus on delivering excellent service and business outcomes for customers. The colleague ‘Having a Voice’ measure is a quantitative Group wide index from our annual Company-wide employee survey of more than 30,000 colleagues. The index measures the level of transparency and cultural openness in the organisation – a key area of focus for us. Specifically, the year ahead will maintain a strong focus on embedding the Company’s purpose, values, and culture as part of the deeper integration of WPD as well as continue to evolve the culture and ways of working across the Group. The diversity measure is a quantifiable target for the level of diversity in the strategic leadership group (SLG ~ top 110) in line with a key strategic priority to build a strong, diverse, and inclusive strategic leadership team and pipeline of talent to support the delivery of the Company’s strategy. Individual objectives The Committee has approved individual objectives for the Executive Directors in line with key strategic and operational priorities for the year ahead. John Pettigrew’s individual objectives for 2022/23 are focused on: 1) delivery of the enterprise-wide transformation; 2) execution of the Company and Board’s strategic blueprint; and 3) development and progression of a diverse, inclusive, strategic leadership group talent and capabilities. Andy Agg’s annual performance objectives are focused on: 1) management of the portfolio repositioning, credit strategy, and investor sentiment; 2) achievement of key regulatory outcomes (ED2) and performance; and 3) progression of the Finance function’s transformation and talent agenda. 129 C o rp o rate G o vernance National Grid plc Annual Report and Accounts 2021/22 26_Remco_Policy_p114_131_v87.indd 129 27/05/2022 17:29

2022 Long Term Performance Plan The 2022 LTPP performance measures and weightings for all Executive Directors comprise two equally weighted financial measures totalling 80% and two equally weighted net zero transition measures with a combined weighting of 20% as outlined in the table below. The maximum 2022 LTPP award is 350% and 300% of base salary for John Pettigrew and Andy Agg respectively, in line with the proposed Policy, subject to shareholder approval. LTPP targets and performance are measured over the entire three-year performance period, which for the 2022 LTPP is 1 April 2022 – 31 March 2025. Subject to approval by the shareholders at the 2022 AGM, the 2022 Remuneration Policy and the LTPP plan rules (approved at the July 2021 AGM that reflect updates to align to market practice and good governance, in particular for malus and clawback provisions) would apply to the 2022 LTPP awards. Measure Weighting Financial measures Cumulative three-year Underlying EPS 40% Group RoE 40% Net zero transition measures National Grid Scope 1 emissions 10% Enablement of net zero transition: Strategic initiatives (Scope 2 and 3) 10% Denotes an ‘alternative performance measure’ as described on pages 268 − 279 Financial measures LTPP financial measures are selected to reflect key drivers of the Company’s longer-term strategy and value creation for shareholders. Given the primarily regulated and long-term nature of our businesses, earnings growth and sustainable investment returns are important measures of long-term shareholder value creation. Whilst we recognise our short-term (APP) and long-term (LTPP) financial measures are similar, we believe these are the right measures to support delivery of the business strategy and the resultant creation of shareholder value. The combination of annual and long-term earnings and returns measures act together to incentivise strong operational delivery in a year, and long-term efficient asset growth and a sustainable dividend. As such, the 2022 LTPP financial measures are designed to incentivise different elements of performance over the long term as compared to the short term. Specifically in LTPP, Group RoE is averaged across the three-year performance period with targets set to ensure the company delivers sustainable performance for shareholders. Similarly, the Underlying EPS measure is a cumulative measure that sums Underlying EPS for the three years in the LTPP performance period and sets out to incentivise sustainable long-term earnings growth and value creation for shareholders. As such, LTPP Underlying EPS targets have been set in line with the Company’s five-year investor frame with target performance aligned to the top end of the range. The LTPP Underlying EPS measure will not be subject to the technical adjustments made in annual Group EPS measure. Below are the performance ranges for the financial measures in the 2022 LTPP. The targets have been set in consideration of the forthcoming RIIO-ED2 final determination, the portfolio transactions and the Company’s forward Strategic Business Plan. Financial performance measures Weighting Threshold 20% vesting Maximum 100% vesting Cumulative 3 year Underlying Group EPS 40% 199 p 217 p Group RoE 40% 9.50% 10.75% Notes: Vesting between threshold and maximum will be on a straight-line basis. The calculation for the Group RoE measure will reflect the updated methodology from 2021/22 going forward as outlined on page 277 of the Annual Report. Targets assume UK Gas Transmission minority stake is treated as a discontinued operation from start of 2023/24. Underlying EPS growth reflects the cumulative summation of the Underlying EPS results for each of the three years in the performance period; 2022/23, 2023/24 and 2024/25. Net zero transition measures The net zero transition measures set out targets and outcomes to achieve 1) reductions in the Company’s direct Scope 1 emissions and 2) enable the broader net zero energy transition to achieve reductions in Scope 2 and Scope 3 emissions through greater reliance on low carbon/renewable energy sources in line with goals set out in our RBC. The reduction of Scope 1 emissions target is a cumulative measure aligned to meet the Company’s 2030 goals and the SBTi (Science Based Target initiative) well below 2°C pathway. The Scope 1 reduction target excludes Long Island Power Authority (LIPA) generation asset emissions as management do not have direct control over decisions to run the assets. In recent years, LIPA operation has been well above predicted levels driven by regional factors including availability of local supply. Broader considerations and actions regarding the longer term for LIPA have been incorporated into the second measure as part of enabling the net zero transition. Net zero transition measures Weighting Threshold 20% vesting Maximum 100% vesting Reduction of Scope 1 emissions 10% -50 ktCO2e -117 ktCO2e Note: Target represents cumulative savings as measured against the 2022 Scope 1 emissions baseline. These targets include best current estimates of the addition of WPD and removal of the UK Gas Transmission and US Rhode Island businesses. 130 National Grid plc Annual Report and Accounts 2021/22 Directors’ Remuneration Report continued How our Remuneration Policy will be implemented in 2022/23 26_Remco_Policy_p114_131_v87.indd 130 27/05/2022 17:29

The second measure reflects National Grid’s role in enabling the net zero transition to a carbon neutral future by 2050. This measure will assess delivery against key net zero strategic priorities and quantified outcomes that underpin the Company’s strategy to enable a net zero future by 2050. There are four key areas of focus; 1) US energy-efficiency programmes and generation; 2) UK net zero transmission strategy including interconnectors and transmission investment to connect offshore wind; 3) US future of gas strategy including the transition to renewable natural gas (RNG), hydrogen, and hybrid/electrification of heat; and 4) low-carbon electricity distribution investment in line with government and regulatory plans. Assessment of this measure will be based on a four-point scale (not met, partially achieved, achieved and over-achieved) based on delivery of quantifiable and qualitative outcomes to reflect a balanced assessment of performance. Fees for NEDs Non-executive Director fees were reviewed mid-year in light of the Board Committee and membership changes to ensure alignment to the market and simplify the fee structure. The fee increases will be effective from 1 January 2022 and paid retrospectively as of 1 July 2022. Role From 1 January 2022 (£’000) From 1 July 2021 (£’000) % increase vs 2021 Chair 700.0 700.0 0.0% Senior Independent Director 30.0 23.6 27.1% Board fee 80.0 71.1 (UK based) 12.5% 84.4 (US based) -5.2% Chair Audit & Risk Committee 31.9 31.9 0.0% Chair Remuneration Committee 30.0 31.9 -6.0% Chair other Committees (Finance, Safety & Sustainability) 25.0 24.4 2.5% Audit & Risk Committee member 23.0 11.0 109.1% Remuneration Committee member 18.0 11.0 63.6% Other Committee member (Finance, Safety & Sustainability, People & Governance) 15.0 11.0 36.4% Note: For the People & Governance Committee, no fees are paid for the Committee Chair, the Senior Independent Director or the Board Chair. The Directors’ Remuneration Report has been approved by the Board and signed on its behalf by: Ian Livingston Committee Chair 18 May 2022 131 C o rp o rate G o vernance National Grid plc Annual Report and Accounts 2021/22 How our Remuneration Policy will be implemented in 2022/23

Directors’ statement and independent auditor’s reports Statement of Directors’ responsibilities 134 Independent auditor’s report 135 Consolidated financial statements under IFRS Primary statements Consolidated income statement 147 Consolidated statement of comprehensive income 149 Consolidated statement of changes in equity 150 Consolidated statement of financial position 151 Consolidated cash flow statement 152 Notes to the consolidated financial statements Note 1 – Basis of preparation and recent accounting developments 153 Note 2 – Segmental analysis 156 Note 3 – Revenue 158 Note 4 – Other operating income and costs 162 Note 5 – Exceptional items and remeasurements 164 Note 6 – Finance income and costs 167 Note 7 – Tax 168 Note 8 – Earnings per share (EPS) 172 Note 9 – Dividends 173 Note 10 – Assets held for sale and discontinued operations 173 Note 11 – Goodwill 176 Note 12 – Other intangible assets 178 Note 13 – Property, plant and equipment 180 Note 14 – Other non-current assets 183 Note 15 – Financial and other investments 183 Note 16 – Investments in joint ventures and associates 185 Note 17 – Derivative financial instruments 187 Note 18 – Inventories and current intangible assets 189 Note 19 – Trade and other receivables 190 Note 20 – Cash and cash equivalents 191 Note 21 – Borrowings 192 Note 22 – Trade and other payables 194 Note 23 – Contract liabilities 195 Note 24 – Other non-current liabilities 195 Note 25 – Pensions and other post-retirement benefits 196 Note 26 – Provisions 204 Note 27 – Share capital 206 Note 28 – Other equity reserves 207 Note 29 – Net debt 208 Note 30 – Commitments and contingencies 210 Note 31 – Related party transactions 211 Note 32 – Financial risk management 211 Note 33 – Borrowing facilities 224 Note 34 – Subsidiary undertakings, joint ventures and associates 225 Note 35 – Sensitivities 230 Note 36 – Additional disclosures in respect of guaranteed securities 232 Note 37 – Acquisitions 233 Note 38 – Post balance sheet events 234 Company financial statements under FRS 101 Basis of preparation Company accounting policies 235 Primary statements Company balance sheet 237 Company statement of changes in equity 238 Notes to the Company financial statements Note 1 – Fixed asset investments 239 Note 2 – Debtors 239 Note 3 – Creditors 240 Note 4 – Derivative financial instruments 240 Note 5 – Investments 240 Note 6 – Borrowings 241 Note 7 – Share capital 241 Note 8 – Shareholders’ equity and reserves 241 Note 9 – Parent Company guarantees 241 Note 10 – Audit fees 241 Doing Right Now Fairness and affordability We are committed to delivering energy safely, reliably and affordably to the communities we serve. As well as affordability, we will play our role in ensuring no one is left behind in the short term due to increased energy prices, or in the longer-term transition to clean energy. National Grid plc Annual Report and Accounts 2021/22132 28_Financials_Statement_Auditors_Report_132_146_v42.indd 132 27/05/2022 17:39

Financial Statements Financial S tatem ents National Grid plc Annual Report and Accounts 2021/22 133 28_Financials_Statement_Auditors_Report_132_146_v42.indd 133 27/05/2022 17:39
134 National Grid plc Annual Report and Accounts 2021/22 The Directors are responsible for preparing the Annual Report and Accounts, including the Group financial statements and the Parent Company financial statements in accordance with applicable law and regulations. Company law requires the Directors to prepare financial statements for each financial year. Under that law, the Directors are required to prepare the Group financial statements in accordance with International Accounting Standards in conformity with the requirements of the Companies Act 2006 and International Financial Reporting Standards (IFRS) as adopted by the UK. The financial statements also comply with IFRS as issued by the IASB. In addition, the Directors have elected to prepare the Parent Company financial statements in accordance with United Kingdom Generally Accepted Accounting Practice (United Kingdom Accounting Standards and applicable law), including FRS 101 ‘Reduced Disclosure Framework’. Under company law, the Directors must not approve the accounts unless they are satisfied that they give a true and fair view of the state of affairs of the Group and Parent Company and of the profit or loss of the Group and Parent Company for that period. In preparing the Group financial statements, International Accounting Standard 1 requires that Directors: • properly select and apply accounting policies; • present information, including accounting policies, in a manner that provides relevant, reliable, comparable and understandable information; • provide additional disclosures when compliance with the specific requirements in IFRS are insufficient to enable users to understand the impact of particular transactions, other events and conditions on the entity’s financial position and financial performance; and • make an assessment of the Group’s ability to continue as a going concern. In preparing the Parent Company financial statements, the Directors are required to: • select suitable accounting policies and then apply them consistently; • make judgements and accounting estimates that are reasonable and prudent; • state whether applicable UK Accounting Standards have been followed, subject to any material departures disclosed and explained in the financial statements; and • prepare the financial statements on the going concern basis unless it is inappropriate to presume that the Company will continue in business. The Directors are responsible for keeping adequate accounting records that are sufficient to show and explain the Group and Parent Company’s transactions and disclose with reasonable accuracy at any time the financial position of the Group and Parent Company on a consolidated and individual basis, and to enable them to ensure that the Group financial statements comply with the Companies Act 2006. They are also responsible for safeguarding the assets of the Parent Company and its subsidiaries and hence for taking reasonable steps for the prevention and detection of fraud and other irregularities. The Directors are responsible for the maintenance and integrity of the Company’s website. Legislation in the United Kingdom governing the preparation and dissemination of financial statements may differ from legislation in other jurisdictions. Having made the requisite enquiries, so far as the Directors in office at the date of the approval of this Report are aware, there is no relevant audit information of which the auditors are unaware and each Director has taken all reasonable steps to make themselves aware of any relevant audit information and to establish that the auditors are aware of that information. Statement of Directors’ responsibilities Each of the Directors, whose names and functions are listed on pages 88 – 89, confirms that: • to the best of their knowledge, the Group financial statements and the Parent Company financial statements, which have been prepared in accordance with IFRS as issued by the IASB and IFRS as adopted by the UK and UK GAAP FRS 101 respectively, give a true and fair view of the assets, liabilities, financial position and profit of the Company on a consolidated and individual basis; • to the best of their knowledge, the Strategic Report contained in the Annual Report and Accounts includes a fair review of the development and performance of the business and the position of the Company on a consolidated and individual basis, together with a description of the principal risks and uncertainties that it faces; and • they consider that the Annual Report and Accounts, taken as a whole, are fair, balanced and understandable and provides the information necessary for shareholders to assess the Company’s position and performance, business model and strategy. This Responsibilities Statement was approved by the Board and signed on its behalf. Directors’ Report The Directors’ Report, prepared in accordance with the requirements of the Companies Act 2006 and the UK Listing Authority’s Listing Rules, and Disclosure Rules and Transparency Rules, comprising pages 1 – 131 and 242 – 288, was approved by the Board and signed on its behalf. Strategic Report The Strategic Report, comprising pages 1 – 83, was approved by the Board and signed on its behalf. By order of the Board Justine Campbell Group General Counsel & Company Secretary 18 May 2022 Company number: 04031152 28_Financials_Statement_Auditors_Report_132_146_v42.indd 134 27/05/2022 17:39

135 Financial S tatem ents National Grid plc Annual Report and Accounts 2021/22 INTENTIONALLY LEFT BLANK
136 National Grid plc Annual Report and Accounts 2021/22 INTENTIONALLY LEFT BLANK
137 Financial S tatem ents National Grid plc Annual Report and Accounts 2021/22 INTENTIONALLY LEFT BLANK
138 National Grid plc Annual Report and Accounts 2021/22 INTENTIONALLY LEFT BLANK
139 Financial S tatem ents National Grid plc Annual Report and Accounts 2021/22 INTENTIONALLY LEFT BLANK
140 National Grid plc Annual Report and Accounts 2021/22 INTENTIONALLY LEFT BLANK
141 Financial S tatem ents National Grid plc Annual Report and Accounts 2021/22 INTENTIONALLY LEFT BLANK
142 National Grid plc Annual Report and Accounts 2021/22 INTENTIONALLY LEFT BLANK
143 Financial S tatem ents National Grid plc Annual Report and Accounts 2021/22 INTENTIONALLY LEFT BLANK
144 National Grid plc Annual Report and Accounts 2021/22 INTENTIONALLY LEFT BLANK
145 Financial S tatem ents National Grid plc Annual Report and Accounts 2021/22 INTENTIONALLY LEFT BLANK
146 National Grid plc Annual Report and Accounts 2021/22 INTENTIONALLY LEFT BLANK
Consolidated income statement
for the years ended 31 March
| | | | | | | | | | | |
| 2022 | Notes | | Total
£m |
| Continuing operations | | | |
| Revenue | 2(a),3 | | 18,449 | |
| Provision for bad and doubtful debts | 4 | | (167) | |
| Other operating income/(costs) | 4 | | (13,911) | |
| Operating profit | 2(b) | | 4,371 | |
| Finance income | 6 | | 50 | |
| Finance costs | 6 | | (1,072) | |
| Share of post-tax results of joint ventures and associates | 16 | | 92 | |
| Profit before tax | 2(b) | | 3,441 | |
| Tax | 7 | | (1,258) | |
| Profit after tax from continuing operations | | | 2,183 | |
| Profit after tax from discontinued operations | 10 | | 171 | |
| Total profit for the year (continuing and discontinued) | | | 2,354 | |
| Attributable to: | | | |
| Equity shareholders of the parent | | | 2,353 | |
Non-controlling interests from continuing operations | | | 1 | |
| Earnings per share (pence) | | | |
| Basic earnings per share (continuing) | 8 | | 60.6 | |
| Diluted earnings per share (continuing) | 8 | | 60.3 | |
| Basic earnings per share (continuing and discontinued) | 8 | | 65.4 | |
| Diluted earnings per share (continuing and discontinued) | 8 | | 65.0 | |
| | | | | | | | | | | |
20211 | Notes | | Total £m |
| Continuing operations | | | |
| Revenue | 2(a),3 | | 13,665 | |
| Provision for bad and doubtful debts | 4 | | (325) | |
| Other operating income/(costs) | 4 | | (10,939) | |
| Operating profit | 2(b) | | 2,401 | |
| Finance income | 6 | | 58 | |
| Finance costs | 6 | | (853) | |
| Share of post-tax results of joint ventures and associates | 16 | | 58 | |
| Profit before tax | 2(b) | | 1,664 | |
| Tax | 7 | | (360) | |
| Profit after tax from continuing operations | | | 1,304 | |
| Profit after tax from discontinued operations | 10 | | 337 | |
| Total profit for the year (continuing and discontinued) | | | 1,641 | |
| Attributable to: | | | |
| Equity shareholders of the parent | | | 1,640 | |
| Non-controlling interests from continuing operations | | | 1 | |
| Earnings per share (pence) | | | |
| Basic earnings per share (continuing) | 8 | | 37.0 | |
| Diluted earnings per share (continuing) | 8 | | 36.8 | |
| Basic earnings per share (continuing and discontinued) | 8 | | 46.6 | |
| Diluted earnings per share (continuing and discontinued) | 8 | | 46.3 | |
1. Comparative amounts have been re-presented to reflect the classification of the UK Gas Transmission business as a discontinued operation. See notes 1 and 10 for further information.
National Grid plc Annual Report and Accounts 2021/22 147
Consolidated income statement
for the years ended 31 March continued
| | | | | | | | | | | |
20201 | Notes | | Total £m |
| Continuing operations | | | |
| Revenue | 2(a),3 | | 13,360 | |
| Provision for bad and doubtful debts | 4 | | (234) | |
| Other operating income/(costs) | 4 | | (10,847) | |
| Operating profit | 2(b) | | 2,279 | |
| Finance income | 6 | | 54 | |
| Finance costs | 6 | | (1,020) | |
| Share of post-tax results of joint ventures and associates | 16 | | 87 | |
| Profit before tax | 2(b) | | 1,400 | |
| Tax | 7 | | (370) | |
| Profit after tax from continuing operations | | | 1,030 | |
| Profit after tax from discontinued operations | 10 | | 235 | |
| Total profit for the year (continuing and discontinued) | | | 1,265 | |
| Attributable to: | | | |
| Equity shareholders of the parent | | | 1,264 | |
| Non-controlling interests from continuing operations | | | 1 | |
| Earnings per share (pence) | | | |
| Basic earnings per share (continuing) | 8 | | 29.7 | |
| Diluted earnings per share (continuing) | 8 | | 29.6 | |
| Basic earnings per share (continuing and discontinued) | 8 | | 36.5 | |
| Diluted earnings per share (continuing and discontinued) | 8 | | 36.3 | |
1. Comparative amounts have been re-presented to reflect the classification of the UK Gas Transmission business as a discontinued operation. See notes 1 and 10 for further information.
148 National Grid plc Annual Report and Accounts 2021/22
Consolidated statement of comprehensive income
for the years ended 31 March
| | | | | | | | | | | | | | | | | |
| | | 2022 | 20211 | 20201 |
| Notes | | £m | £m | £m |
| Profit after tax from continuing operations | | | 2,183 | | 1,304 | | 1,030 | |
| Profit after tax from discontinued operations | | | 171 | | 337 | | 235 | |
| Other comprehensive income from continuing operations | | | | | |
| Items from continuing operations that will never be reclassified to profit or loss: | | | | | |
| Remeasurement gains/(losses) on pension assets and post-retirement benefit obligations | 25 | | 2,172 | | 1,658 | | (782) | |
| Net gains/(losses) on equity instruments designated at fair value through other comprehensive income | | | 12 | | 46 | | (9) | |
| | | | | |
| Net losses in respect of cash flow hedging of capital expenditure | | | (1) | | (12) | | (17) | |
| Tax on items that will never be reclassified to profit or loss | 7 | | (496) | | (472) | | 232 | |
| Total items from continuing operations that will never be reclassified to profit or loss | | | 1,687 | | 1,220 | | (576) | |
| Items from continuing operations that may be reclassified subsequently to profit or loss: | | | | | |
| Retranslation of net assets offset by net investment hedge | | | 630 | | (1,347) | | 561 | |
| Net (losses)/gains in respect of cash flow hedges | | | (57) | | 67 | | (121) | |
| Net gains/(losses) in respect of cost of hedging | | | 1 | | 20 | | (80) | |
Net (losses)/gains on investment in debt instruments measured at fair value
through other comprehensive income | | | (11) | | 80 | | (15) | |
| Share of other comprehensive income/(losses) of associates, net of tax | | | 1 | | 1 | | (5) | |
| Tax on items that may be reclassified subsequently to profit or loss | 7 | | 15 | | (8) | | 33 | |
| Total items from continuing operations that may be reclassified subsequently to profit or loss | | | 579 | | (1,187) | | 373 | |
| Other comprehensive income/(loss) for the year, net of tax from continuing operations | | | 2,266 | | 33 | | (203) | |
| Other comprehensive income/(loss) for the year, net of tax from discontinued operations | 10 | | 211 | | (216) | | 38 | |
| Other comprehensive income/(loss) for the year, net of tax | | | 2,477 | | (183) | | (165) | |
| Total comprehensive income for the year from continuing operations | | | 4,449 | | 1,337 | | 827 | |
| Total comprehensive income for the year from discontinued operations | 10 | | 382 | | 121 | | 273 | |
| Total comprehensive income for the year | | | 4,831 | | 1,458 | | 1,100 | |
| Attributable to: | | | | | |
| Equity shareholders of the parent | | | | | |
| From continuing operations | | | 4,447 | | 1,338 | | 825 | |
| From discontinued operations | | | 382 | | 121 | | 273 | |
| | | 4,829 | | 1,459 | | 1,098 | |
| Non-controlling interests | | | | | |
| From continuing operations | | | 2 | | (1) | | 2 | |
1. Comparative amounts have been re-presented to reflect the classification of the UK Gas Transmission business as a discontinued operation. See notes 1 and 10 for further information.
National Grid plc Annual Report and Accounts 2021/22 149
Consolidated statement of changes in equity
for the years ended 31 March
| | | | | | | | | | | | | | | | | | | | | | | | | | | | | |
| Share capital £m | Share
premium account £m | Retained
earnings £m | Other equity reserves1 £m | | Total shareholders’
equity £m | Non-
controlling interests £m | | Total
equity £m |
| At 31 March 2019 | 458 | | 1,314 | | 21,999 | | (4,223) | | | 19,548 | | 20 | | | 19,568 | |
| Profit for the year | — | | — | | 1,264 | | — | | | 1,264 | | 1 | | | 1,265 | |
| Other comprehensive (loss)/income for the year | — | | — | | (509) | | 343 | | | (166) | | 1 | | | (165) | |
| Total comprehensive income for the year | — | | — | | 755 | | 343 | | | 1,098 | | 2 | | | 1,100 | |
| Equity dividends | — | | — | | (892) | | — | | | (892) | | — | | | (892) | |
| Scrip dividend-related share issue² | 12 | | (13) | | — | | — | | | (1) | | — | | | (1) | |
| Issue of treasury shares | — | | — | | 17 | | — | | | 17 | | — | | | 17 | |
| Purchase of own shares | — | | — | | (6) | | — | | | (6) | | — | | | (6) | |
| Share-based payments | — | | — | | 19 | | — | | | 19 | | — | | | 19 | |
| Tax on share-based payments | — | | — | | 3 | | — | | | 3 | | — | | | 3 | |
| Cash flow hedges transferred to the statement of financial position, net of tax | — | | — | | — | | (15) | | | (15) | | — | | | (15) | |
| At 1 April 2020 | 470 | | 1,301 | | 21,895 | | (3,895) | | | 19,771 | | 22 | | | 19,793 | |
| Profit for the year | — | | — | | 1,640 | | — | | | 1,640 | | 1 | | | 1,641 | |
| Other comprehensive income/(loss) for the year | — | | — | | 1,001 | | (1,182) | | | (181) | | (2) | | | (183) | |
| Total comprehensive income/(loss) for the year | — | | — | | 2,641 | | (1,182) | | | 1,459 | | (1) | | | 1,458 | |
| Equity dividends | — | | — | | (1,413) | | — | | | (1,413) | | — | | | (1,413) | |
| Scrip dividend-related share issue² | 4 | | (5) | | — | | — | | | (1) | | — | | | (1) | |
| Issue of treasury shares | — | | — | | 17 | | — | | | 17 | | — | | | 17 | |
| Purchase of own shares | — | | — | | (2) | | — | | | (2) | | — | | | (2) | |
| Share-based payments | — | | — | | 27 | | — | | | 27 | | — | | | 27 | |
| Tax on share-based payments | — | | — | | (2) | | — | | | (2) | | — | | | (2) | |
| Cash flow hedges transferred to the statement of financial position, net of tax | — | | — | | — | | (17) | | | (17) | | — | | | (17) | |
| At 1 April 2021 | 474 | | 1,296 | | 23,163 | | (5,094) | | | 19,839 | | 21 | | | 19,860 | |
| Profit for the year | — | | — | | 2,353 | | — | | | 2,353 | | 1 | | | 2,354 | |
| Other comprehensive income for the year | — | | — | | 1,871 | | 605 | | | 2,476 | | 1 | | | 2,477 | |
| Total comprehensive income for the year | — | | — | | 4,224 | | 605 | | | 4,829 | | 2 | | | 4,831 | |
| Equity dividends | — | | — | | (922) | | — | | | (922) | | — | | | (922) | |
| Scrip dividend-related share issue² | 11 | | (12) | | — | | — | | | (1) | | — | | | (1) | |
| Issue of treasury shares | — | | — | | 17 | | — | | | 17 | | — | | | 17 | |
| Transactions in own shares | — | | 16 | | (3) | | — | | | 13 | | — | | | 13 | |
| Share-based payments | — | | — | | 43 | | — | | | 43 | | — | | | 43 | |
| Tax on share-based payments | — | | — | | 7 | | — | | | 7 | | — | | | 7 | |
| Transfer of accumulated gains and losses on sale of equity investments³ | — | | — | | 82 | | (82) | | | — | | — | | | — | |
| Cash flow hedges transferred to the statement of financial position, net of tax | — | | — | | — | | 8 | | | 8 | | — | | | 8 | |
| At 31 March 2022 | 485 | | 1,300 | | 26,611 | | (4,563) | | | 23,833 | | 23 | | | 23,856 | |
1. For further details of other equity reserves, see note 28.
2. Included within the share premium account are costs associated with scrip dividends.
3. In the year ended 31 March 2022, the Group disposed of its equity instruments related to shares held as part of a portfolio of financial instruments which back some long‑term employee liabilities. The equity instruments were previously measured at FVOCI and prior to the disposal the Group recognised a gain of £12 million in the year. The accumulated gain and losses of £82 million recognised in other comprehensive income were transferred to retained earnings on disposal (see note 15).
150 National Grid plc Annual Report and Accounts 2021/22
Consolidated statement of financial position
as at 31 March
| | | | | | | | | | | | | | |
| | | 2022 | 2021 |
| Notes | | £m | £m |
| Non-current assets | | | | |
| Goodwill | 11 | | 9,532 | | 4,588 | |
| Other intangible assets | 12 | | 3,272 | | 1,443 | |
| Property, plant and equipment | 13 | | 57,532 | | 47,043 | |
| Other non-current assets | 14 | | 303 | | 293 | |
| Pension assets | 25 | | 3,885 | | 1,747 | |
| Financial and other investments | 15 | | 830 | | 755 | |
| Investments in joint ventures and associates | 16 | | 1,238 | | 867 | |
| Derivative financial assets | 17 | | 305 | | 542 | |
| Total non-current assets | | | 76,897 | | 57,278 | |
| Current assets | | | | |
| Inventories and current intangible assets | 18 | | 511 | | 439 | |
| Trade and other receivables | 19 | | 3,715 | | 2,919 | |
| Current tax assets | | | 106 | | 67 | |
| Financial and other investments | 15 | | 3,145 | | 2,342 | |
| Derivative financial assets | 17 | | 282 | | 457 | |
| Cash and cash equivalents | 20 | | 204 | | 157 | |
| Assets held for sale | 10 | | 10,000 | | 3,557 | |
| Total current assets | | | 17,963 | | 9,938 | |
| Total assets | | | 94,860 | | 67,216 | |
| Current liabilities | | | | |
| Borrowings | 21 | | (12,121) | | (3,737) | |
| Derivative financial liabilities | 17 | | (144) | | (145) | |
| Trade and other payables | 22 | | (4,915) | | (3,517) | |
| Contract liabilities | 23 | | (130) | | (66) | |
| Current tax liabilities | | | (32) | | (75) | |
| Provisions | 26 | | (240) | | (260) | |
| Liabilities held for sale | 10 | | (7,188) | | (1,568) | |
| Total current liabilities | | | (24,770) | | (9,368) | |
| Non-current liabilities | | | | |
| Borrowings | 21 | | (33,344) | | (27,483) | |
| Derivative financial liabilities | 17 | | (869) | | (754) | |
| Other non-current liabilities | 24 | | (805) | | (843) | |
| Contract liabilities | 23 | | (1,342) | | (1,094) | |
| Deferred tax liabilities | 7 | | (6,765) | | (4,815) | |
| Pensions and other post-retirement benefit obligations | 25 | | (810) | | (1,032) | |
| Provisions | 26 | | (2,299) | | (1,967) | |
| Total non-current liabilities | | | (46,234) | | (37,988) | |
| Total liabilities | | | (71,004) | | (47,356) | |
| Net assets | | | 23,856 | | 19,860 | |
| Equity | | | | |
| Share capital | 27 | | 485 | | 474 | |
| Share premium account | | | 1,300 | | 1,296 | |
| Retained earnings | | | 26,611 | | 23,163 | |
| Other equity reserves | 28 | | (4,563) | | (5,094) | |
| Total shareholders’ equity | | | 23,833 | | 19,839 | |
| Non-controlling interests | | | 23 | | 21 | |
| Total equity | | | 23,856 | | 19,860 | |
The consolidated financial statements set out on pages 147 – 234 were approved by the Board of Directors on 18 May 2022 and were signed on its behalf by:
Paula Rosput Reynolds Chair
Andy Agg Chief Financial Officer
National Grid plc
Registered number: 4031152
National Grid plc Annual Report and Accounts 2021/22 151
Consolidated cash flow statement
for the years ended 31 March
| | | | | | | | | | | | | | | | | |
| | | 2022 | 20211 | 20201 |
| Notes | | £m | £m | £m |
| Cash flows from operating activities | | | | | |
| Total operating profit from continuing operations | 2(b) | | 4,371 | | 2,401 | | 2,279 | |
| Adjustments for: | | | | | |
| Other fair value movements | | | (65) | | (22) | | — | |
| Depreciation, amortisation and impairment | | | 1,830 | | 1,485 | | 1,435 | |
| Gain on disposal of St William Homes LLP | | | (228) | | — | | — | |
| Share-based payments | | | 38 | | 23 | | 16 | |
| Changes in working capital | | | (223) | | 263 | | 331 | |
| Changes in provisions | | | 149 | | (167) | | 262 | |
| Changes in pensions and other post-retirement benefit obligations | | | (84) | | (16) | | (83) | |
| Cash generated from operations – continuing operations | | | 5,788 | | 3,967 | | 4,240 | |
| Tax paid | | | (298) | | (91) | | (92) | |
| Net cash inflow from operating activities – continuing operations | | | 5,490 | | 3,876 | | 4,148 | |
| Net cash inflow from operating activities – discontinued operations | | | 782 | | 585 | | 470 | |
| Cash flows from investing activities | | | | | |
| Acquisition of financial investments | | | (197) | | (99) | | (108) | |
| Acquisition of, and contributions to National Grid Renewables and Emerald Energy Venture LLC | | | (16) | | (26) | | (139) | |
| Acquisition of WPD² | 37 | | (7,837) | | — | | — | |
| Investments in joint ventures and associates | | | (265) | | (81) | | (82) | |
| Disposal of financial investments | | | 215 | | 66 | | 63 | |
| Disposal of interests in Quadgas HoldCo Limited | 10 | | — | | — | | 1,965 | |
| Disposal of interest in St William Homes LLP | 16 | | 413 | | — | | — | |
| Purchases of intangible assets | | | (446) | | (399) | | (295) | |
| Purchases of property, plant and equipment | | | (5,098) | | (4,209) | | (4,291) | |
| Disposals of property, plant and equipment | | | 26 | | 7 | | 66 | |
| Dividends received from joint ventures, associates and other investments | | | 166 | | 80 | | 75 | |
| Interest received | | | 40 | | 16 | | 73 | |
| Net movements in short-term financial investments | | | (781) | | (438) | | 12 | |
| Cash inflows on derivatives | | | 17 | | 225 | | 58 | |
| Cash outflows on derivatives | | | (122) | | (81) | | (281) | |
| Net cash flow used in investing activities – continuing operations | | | (13,885) | | (4,939) | | (2,884) | |
| Net cash flow used in investing activities – discontinued operations | | | (125) | | (177) | | (311) | |
| Cash flows from financing activities | | | | | |
| Proceeds from issue of treasury shares | | | 33 | | 16 | | 16 | |
| Purchase of own shares | | | (3) | | (2) | | (6) | |
| Proceeds received from loans | 29(c) | | 12,347 | | 5,150 | | 3,921 | |
| Repayment of loans | 29(c) | | (1,261) | | (1,654) | | (3,037) | |
| Payments of lease liabilities | 29(c) | | (117) | | (107) | | (115) | |
| Net movements in short-term borrowings | 29(c) | | (11) | | (619) | | (562) | |
| Cash inflows on derivatives | 29(c) | | 20 | | 17 | | 46 | |
| Cash outflows on derivatives | 29(c) | | (114) | | (183) | | (245) | |
| Interest paid | 29(c) | | (1,053) | | (753) | | (867) | |
| Dividends paid to shareholders | 9 | | (922) | | (1,413) | | (892) | |
| Net cash flow from/(used in) financing activities – continuing operations | | | 8,919 | | 452 | | (1,741) | |
| Net cash flow (used in)/from financing activities – discontinued operations | | | (1,150) | | 298 | | 135 | |
| Net increase/(decrease) in cash and cash equivalents | 29(b) | | 31 | | 95 | | (183) | |
| Reclassification to held for sale | 10,29(b) | | (11) | | (4) | | — | |
| Exchange movements | 29(b) | | 5 | | (7) | | 4 | |
| Cash and cash equivalents at start of year | | | 157 | | 73 | | 252 | |
| Cash and cash equivalents at end of year³ | 20 | | 182 | | 157 | | 73 | |
1. Comparative amounts have been re-presented to reflect the classification of the UK Gas Transmission business as a discontinued operation. See notes 1 and 10 for further information.
2. Balance consists of cash consideration paid and cash acquired from WPD.
3. Cash and cash equivalents at end of year are shown net of the Group’s bank overdraft as at 31 March 2022 of £22 million (2021: £nil; 2020: £nil).
152 National Grid plc Annual Report and Accounts 2021/22
Notes to the consolidated financial statements
1. Basis of preparation and recent accounting developments
| | |
Accounting policies describe our approach to recognising and measuring transactions and balances in the year. The accounting policies applicable across the financial statements are shown below, whereas accounting policies that are specific to a component of the financial statements have been incorporated into the relevant note. This section also shows areas of judgement and key sources of estimation uncertainty in these financial statements. In addition, we have summarised new International Accounting Standards Board (IASB) accounting standards, amendments and interpretations and whether these are effective for this year end or in later years, explaining how significant changes are expected to affect our reported results. |
National Grid’s principal activities involve the transmission and distribution of electricity in Great Britain and electricity and gas in northeastern US. The Company is a public limited liability company incorporated and domiciled in England and Wales, with its registered office at 1–3 Strand, London WC2N 5EH.
The Company, National Grid plc, which is the ultimate parent of the Group, has its primary listing on the London Stock Exchange and is also quoted on the New York Stock Exchange.
These consolidated financial statements were approved for issue by the Board on 18 May 2022.
These consolidated financial statements have been prepared in accordance with International Accounting Standards (IAS) and International Financial Reporting Standards (IFRS) and related interpretations as issued by the IASB and IFRS as adopted by the UK. They are prepared on the basis of all IFRS accounting standards and interpretations that are mandatory for the period ended 31 March 2022 and in accordance with the Companies Act 2006. The comparative financial information has also been prepared on this basis.
The consolidated financial statements have been prepared on a historical cost basis, except for the recording of pension assets and liabilities, the revaluation of derivative financial instruments and certain commodity contracts and certain financial assets and liabilities measured at fair value.
These consolidated financial statements are presented in pounds sterling, which is also the functional currency of the Company.
The notes to the financial statements have been prepared on a continuing basis unless otherwise stated.
A. Going concern
As part of the Directors’ consideration of the appropriateness of adopting the going concern basis of accounting in preparing these financial statements, the Directors have considered the impact of the planned disposals of The Narragansett Electric Company (NECO) and the UK Gas Transmission business (see note 10) and the financing for the acquisition of PPL Western Power Distribution (WPD) (see note 33). The Directors have assessed the principal risks, including by modelling both a base case and a reasonable worst-case scenario.
The main cash flow impacts identified in the reasonable worst-case scenario are:
•additional potential working capital requirements in response to energy price increases driven by the wider energy market stability challenges and the conflict between Russia and Ukraine;
•adverse impacts of inflation on our capex programme;
•adverse impact from timing across the Group, i.e. a net under-recovery of allowed revenues or reductions in over-collections;
•a significant reduction in cash collections driven by lower customer demand and increased bad debt in our US businesses and potential supplier defaults in our UK business;
•higher cash outflow than expected following the Sellindge Interconnector fire;
•higher operating costs than expected; or non-delivery of planned efficiencies across the Group; and
•the potential impact of further significant storm costs in the US.
As part of their analysis, the Board also considered the following potential levers at their discretion to improve the position identified by the analysis if the debt capital markets are not accessible:
•the payment of dividends to shareholders;
•significant changes in the phasing of the Group’s capital programme, with elements of non-essential works and programmes delayed; and
•a number of further reductions in operating expenditure across the Group primarily related to workforce cost reductions in both the UK and the US.
Having considered the reasonable worst-case scenario, the impact and timing of the planned strategic transactions, and the further levers at the Board’s discretion, the Group continues to have headroom against the Group’s committed facilities identified in note 33 to the financial statements.
In addition to the above, the ability to raise new and extend existing financing was separately included in the analysis, and the Directors noted the c.£4.2 billion of new long-term senior debt issued in the period from 1 April to 31 March 2022 as evidence of the Group’s ability to continue to have access to the debt capital markets if needed.
Based on the above, the Directors have concluded the Group is well placed to manage its financing and other business risks satisfactorily and have a reasonable expectation that the Group will have adequate resources to continue in operation for at least 12 months from the signing date of these consolidated financial statements. They therefore consider it appropriate to adopt the going concern basis of accounting in preparing the financial statements.
National Grid plc Annual Report and Accounts 2021/22 153
Notes to the consolidated financial statements continued
1. Basis of preparation and recent accounting developments continued
B. Basis of consolidation
The consolidated financial statements incorporate the results, assets and liabilities of the Company and its subsidiaries, together with a share of the results, assets and liabilities of joint operations.
A subsidiary is defined as an entity controlled by the Group. Control is achieved where the Group is exposed to, or has the rights to, variable returns from its involvement with the entity and has the ability to affect those returns through its power over the entity.
The Group accounts for joint ventures and associates using the equity method of accounting, where the investment is carried at cost plus post-acquisition changes in the share of net assets of the joint venture or associate, less any provision for impairment. Losses in excess of the consolidated interest in joint ventures and associates are not recognised, except where the Company or its subsidiaries have made a commitment to make good those losses.
Where necessary, adjustments are made to bring the accounting policies used in the individual financial statements of the Company, subsidiaries, joint operations, joint ventures and associates into line with those used by the Group in its consolidated financial statements under IFRS. Intercompany transactions are eliminated.
The results of subsidiaries, joint operations, joint ventures and associates acquired or disposed of during the year are included in the consolidated income statement from the effective date of acquisition or up to the effective date of disposal, as appropriate.
Acquisitions are accounted for using the acquisition method, where the purchase price is allocated to the identifiable assets acquired and liabilities assumed on a fair value basis and the remainder recognised as goodwill.
C. Foreign currencies
Transactions in currencies other than the functional currency of the Company or subsidiary concerned are recorded at the rates of exchange prevailing on the dates of the transactions. At each reporting date, monetary assets and liabilities that are denominated in foreign currencies are retranslated at closing exchange rates. Non-monetary assets are not retranslated unless they are carried at fair value.
Gains and losses arising on the retranslation of monetary assets and liabilities are included in the income statement, except where the application of hedge accounting requires inclusion in other comprehensive income (see note 32(e)).
On consolidation, the assets and liabilities of operations that have a functional currency different from the Company’s functional currency of pounds sterling, principally our US operations that have a functional currency of US dollars, are translated at exchange rates prevailing at the reporting date. Income and expense items are translated at the average exchange rates for the period where these do not differ materially from rates at the date of the transaction. Exchange differences arising are recognised in other comprehensive income and transferred to the consolidated translation reserve within other equity reserves (see note 28).
D. Disposal of The Narragansett Electric Company
As described further in note 10, on 17 March 2021, the Group signed an agreement to sell 100% of the share capital of a wholly owned subsidiary, NECO. Whilst all of the regulatory approvals are in place, the disposal of NECO was not finalised as at 31 March 2022 due to the appeal of one of these approvals by the Rhode Island Attorney General.
The associated assets and liabilities have been presented as held for sale in the consolidated statement of financial position. As NECO does not represent either a major line of business or a geographical area of operations, it has not met the criteria for classification as a discontinued operation and therefore its results for the period are not separately disclosed on the face of the income statement.
E. Disposal of UK Gas Transmission
As described further in note 10, on 27 March 2022, the Group agreed to sell 100% of the UK Gas Transmission business to a new entity (the ‘Acquiring Entity’) in exchange for £4.2 billion cash consideration (subject to customary completion adjustments) and a 40% interest in the Acquiring Entity. The sale is expected to complete in the third quarter of the financial year ending 31 March 2023 subject to the receipt of all regulatory approvals. The Group’s 40% interest in the Acquiring Entity is expected to be classified as an associate on the basis that the Group will retain significant influence over the business through its retained stake. The Group has the ability to appoint two out of the seven Directors to the Board of the Acquiring Entity. On 27 March 2022, the Group also entered into a Further Acquisition Agreement (FAA) for the potential sale of the remaining 40% stake. The FAA is a put option that can be exercised by the purchaser either in the period between 1 January and 31 March 2023 or in the period between 1 April and 30 June 2023. The deferral of the option window is at our discretion (subject to change depending on the timing of the closing of the sale agreement).
The Group classified the business as held for sale at the end of August 2021, when it became highly probable that the value of the business to the Group would be recovered through sale rather than continued ownership. As UK Gas Transmission represents a major separate line of business, the business has been classified separately as a discontinued operation for all periods presented in the consolidated income statement and statement of comprehensive income. Earnings per share (EPS) has also been shown split between continuing and discontinued operations.
F. Areas of judgement and key sources of estimation uncertainty
The preparation of financial statements requires management to make estimates and assumptions that affect the reported amounts of assets and liabilities, disclosures of contingent assets and liabilities, and the reported amounts of revenue and expenses during the reporting period. Actual results could differ from these estimates. Information about such judgements and estimations is in the notes to the financial statements, and the key areas are summarised below.
Areas of judgement that have the most significant effect on the amounts recognised in the financial statements are as follows:
•in relation to the planned disposal of the UK Gas Transmission business, the key judgement that has been applied is the date from which the business qualified for classification as held for sale and a discontinued operation, as explained further in note 10;
•in performing the WPD goodwill and indefinite-lived licence intangible assets impairment assessment, judgement has been applied over the forecast cash flow duration (see note 11); and
•the judgement that, notwithstanding legislation enacted and targets committing the UK, New York State and Massachusetts to achieving net zero greenhouse gas emissions by 2050, these do not trigger a reassessment of the remaining useful economic lives of our gas network assets (see key sources of estimation uncertainty below and note 13).
Key sources of estimation uncertainty that have a significant risk of causing a material adjustment to the carrying amounts of assets and liabilities within the next financial year are as follows:
•in performing the goodwill impairment assessment of the WPD group of cash-generating units, the key source of estimation uncertainty relates to the discount rate and terminal value assumptions used in the value-in-use calculations (see note 11);
•the valuation of liabilities for pensions and other post-retirement benefits (see note 25); and
•the cash flows applied in determining the environmental provisions, in particular relating to three US Superfund sites (see note 26).
154 National Grid plc Annual Report and Accounts 2021/22
1. Basis of preparation and recent accounting developments continued
In addition, we also highlight the estimates made regarding the useful economic lives of our gas network assets due to the length over which they are being depreciated, the potential for new and evolving technologies over that period, and the range of potential pathways for meeting net zero targets (see note 13 for details and sensitivity analysis).
In order to illustrate the impact that changes in assumptions for the valuation of pension assets and liabilities and cash flows for environmental provisions could have on our results and financial position, we have included sensitivity analyses in note 35. In performing our impairment assessment of goodwill and indefinite-lived licence intangible assets, we have sensitised our forecasts to factor in adjustments to key inputs to each model (see note 11). Information on what we believe to be a reasonably possible range of outcomes on the recoverability of customer receivables is included in note 19.
G. Accounting policy choices
IFRS provides certain options available within accounting standards. Choices we have made, and continue to make, include the following:
•Presentational formats: we use the nature of expense method for our income statement and aggregate our statement of financial position to net assets and total equity.
•Financial instruments: we normally opt to apply hedge accounting in most circumstances where this is permitted (see note 32(e)).
H. New IFRS accounting standards and interpretations effective for the year ended 31 March 2022
The Group early adopted the following amendments to standards which have had no material impact on the Group’s results or financial statement disclosures:
•amendments to IFRS 16 ‘Leases – COVID-19-Related Rent Concessions’;
•amendments to IFRS 3 ‘Definition of a Business’; and
•amendments to IAS 1 and IAS 8 ‘Definition of Material’.
In April 2021, the IFRS IC (Interpretation Committee) also issued an agenda decision in relation to the accounting treatment for configuration and customisation costs in a cloud computing arrangement. This guidance clarified that in order for an intangible asset to be capitalised in relation to customisation and configuration costs in a cloud computing arrangement, it is necessary for there to be control of the underlying software asset or for there to be a separate intangible asset which meets the definition in IAS 38 Intangible Assets. As at 31 March 2022, the Group has recognised a cumulative adjustment against software intangible assets of £34 million for previously capitalised customisation and configuration relating to its continuing operations. The Group has also considered the application of the new accounting guidance for its comparative periods and concluded that it does not have a material impact. Accordingly, no comparative periods have been restated.
I. New IFRS accounting standards and interpretations not yet adopted
The following new accounting standards and amendments to existing standards have been issued but are not yet effective:
•IFRS 17 ‘Insurance Contracts’;
•amendments to IFRS 3 ‘Business Combinations’;
•amendments to IAS 12 ‘Deferred Tax Related to Assets and Liabilities Arising from a Single Transaction’;
•amendments to IAS 16 ‘Property, Plant and Equipment’;
•amendments to IAS 37 ‘Provisions, Contingent Liabilities and Contingent Assets’;
•amendments to IAS 1 ‘Presentation of Financial Statements’;
•amendments to IAS 8 ‘Accounting Policies, Changes in Accounting Estimates and Errors’;
•annual improvements to IFRS standards 2018-2020; and
•amendments to IFRS Practice Statement 2 – making materiality judgements.
The Group is currently assessing the impact of the above standards, but they are not expected to have a material impact.
The Group has not adopted any other standard, amendment or interpretation that has been issued but is not yet effective.
National Grid plc Annual Report and Accounts 2021/22 155
Notes to the consolidated financial statements continued
2. Segmental analysis
| | |
This note sets out the financial performance for the year split into the different parts of the business (operating segments). The performance of these operating segments is monitored and managed on a day-to-day basis. Revenue and the results of the business are analysed by operating segment, based on the information the Board of Directors uses internally for the purposes of evaluating the performance of each operating segment and determining resource allocation between them. The Board is National Grid’s chief operating decision maker (as defined by IFRS 8 ‘Operating Segments’) and assesses the profitability of operations principally on the basis of operating profit before exceptional items and remeasurements (see note 5). As a matter of course, the Board also considers profitability by segment, excluding the effect of timing. However, the measure of profit disclosed in this note is operating profit before exceptional items and remeasurements as this is the measure that is most consistent with the IFRS results reported within these financial statements. |
As a result of the new operating model, the operating segments that were reported up to the Board have changed during the period to align with the six business units that will continue to operate, and the UK Gas Transmission business that is expected to be disposed of, which is now considered a discontinued operation (see note 10). Five of these continuing businesses meet the size criteria set out in the accounting standards to be treated as reportable operating segments. The other operating segment, remaining businesses that are not operating segments and the corporate centre activities are reported to the Board of Directors on an aggregated basis.
The following table describes the main activities for each reportable operating segment within continuing operations:
| | | | | |
UK Electricity Transmission | The high-voltage electricity transmission networks in England and Wales. |
UK Electricity Distribution | The electricity distribution networks of WPD in the East Midlands, West Midlands and South West of England and South Wales. |
| UK Electricity System Operator | The Great Britain system operator. |
| New England | Gas distribution networks, electricity distribution networks and high-voltage electricity transmission networks in New England. |
New York | Gas distribution networks, electricity distribution networks and high-voltage electricity transmission networks in New York. |
The UK Gas Transmission business, which owns the high-pressure gas transmission networks in Great Britain and gas system operator in Great Britain and includes the regulated gas metering operations (which was previously reported within NGV and Other), is now a discontinued operation and classified as held for sale (see note 10). Therefore, while it is still a reportable operating segment, it is no longer presented within continuing operations.
The National Grid Ventures (NGV) operating segment is outside our regulated core business and operates in competitive markets across the UK and the US. The business comprises all commercial operations in LNG at the Isle of Grain in the UK, our electricity generation business in the US, our electricity interconnectors and our investment in National Grid Renewables Development LLC, with a focus on investment and future activities in emerging growth areas. NGV does not meet the thresholds set out in IFRS 8 to be identified as a separate reportable segment and therefore its results are not required to be separately presented.
Other activities that do not form part of any of the segments in the above table or NGV primarily relate to our UK property business together with insurance and corporate activities in the UK and US and the Group’s investments in technology and innovation companies through National Grid Partners.
(a) Revenue
Revenue primarily represents the sales value derived from the generation, transmission and distribution of energy, together with the sales value derived from the provision of other services to customers. Refer to note 3 for further details.
Sales between operating segments are priced considering the regulatory and legal requirements to which the businesses are subject. The analysis of revenue by geographical area is on the basis of destination. There are no material sales between the UK and US geographical areas.
| | | | | | | | | | | | | | | | | | | | | | | | | | | | | | | | | | | |
| 2022 | | 2021¹ | | 2020¹ |
| Total
sales
£m | Sales
between
segments
£m | Sales
to third
parties
£m | | Total
sales
£m | Sales
between
segments
£m | Sales
to third
parties
£m | | Total
sales
£m | Sales
between
segments
£m | Sales
to third
parties
£m |
| Operating segments – continuing operations: | | | | | | | | | | | |
| UK Electricity Transmission | 2,035 | | (7) | | 2,028 | | | 1,974 | | (10) | | 1,964 | | | 1,986 | | (8) | | 1,978 | |
| UK Electricity Distribution | 1,482 | | (14) | | 1,468 | | | — | | — | | — | | | — | | — | | — | |
| UK Electricity System Operator | 3,455 | | (18) | | 3,437 | | | 2,018 | | — | | 2,018 | | | 1,716 | | — | | 1,716 | |
| New England | 4,550 | | — | | 4,550 | | | 4,214 | | — | | 4,214 | | | 4,235 | | — | | 4,235 | |
| New York | 5,561 | | — | | 5,561 | | | 4,605 | | — | | 4,605 | | | 4,601 | | — | | 4,601 | |
| NGV and Other | 1,405 | | — | | 1,405 | | | 864 | | — | | 864 | | | 834 | | (4) | | 830 | |
| Total revenue from continuing operations | 18,488 | | (39) | | 18,449 | | | 13,675 | | (10) | | 13,665 | | | 13,372 | | (12) | | 13,360 | |
| | | | | | | | | | | |
| Split by geographical areas – continuing operations: | | | | | | | | | | | |
| UK | | | 7,803 | | | | | 4,368 | | | | | 4,102 | |
| US | | | 10,646 | | | | | 9,297 | | | | | 9,258 | |
| Total revenue from continuing operations | | | 18,449 | | | | | 13,665 | | | | | 13,360 | |
1. Comparative amounts have been re-presented to reflect the new operating segments and the classification of the UK Gas Transmission business as a discontinued operation. See notes 1 and 10 for further information.
2. In connection with the disposal of St William Homes LLP in the year the Group released deferred income within NGV and Other of £189 million related to deferred profits from previous property sales (see note 5).
156 National Grid plc Annual Report and Accounts 2021/22
2. Segmental analysis continued
(b) Operating profit
A reconciliation of the operating segments’ measure of profit to profit before tax from continuing operations is provided below. Further details of the exceptional items and remeasurements are provided in note 5.
| | | | | | | | | | | | | | | | | | | | | | | | | | | | | | | | | | | |
| Before exceptional items
and remeasurements | | Exceptional items and remeasurements |
| After exceptional items and remeasurements |
| 2022 | 2021¹ | 2020¹ | | 2022 | 2021¹ | 2020¹ |
| 2022 | 2021¹ | 2020¹ |
| £m | £m | £m | | £m | £m | £m |
| £m | £m | £m |
| Operating segments – continuing operations: | |
|
| | | | |
| |
|
|
| UK Electricity Transmission | 1,067 | | 1,094 | | 1,109 | | | (12) | | (14) | | (5) | |
| 1,055 | | 1,080 | | 1,104 | |
| UK Electricity Distribution | 909 | | — | | — | | | — | | — | | — | |
| 909 | | — | | — | |
| UK Electricity System Operator | 7 | | (60) | | 211 | | | (2) | | 7 | | 1 | | | 5 | | (53) | | 212 | |
| New England | 743 | | 611 | | 523 | | | 21 | | 3 | | (53) | |
| 764 | | 614 | | 470 | |
| New York | 780 | | 665 | | 835 | | | 315 | | 30 | | (465) | | | 1,095 | | 695 | | 370 | |
NGV and Other | 307 | | 117 | | 126 | | | 236 | | (52) | | (3) | |
| 543 | | 65 | | 123 | |
| Total operating profit from continuing operations | 3,813 | | 2,427 | | 2,804 | | | 558 | | (26) | | (525) | |
| 4,371 | | 2,401 | | 2,279 | |
| |
|
| | | | |
| |
|
|
| Split by geographical area – continuing operations: | |
|
| | | | |
| |
|
|
| UK | 2,234 | | 1,113 | | 1,422 | | | 224 | | (57) | | (8) | |
| 2,458 | | 1,056 | | 1,414 | |
| US | 1,579 | | 1,314 | | 1,382 | | | 334 | | 31 | | (517) | |
| 1,913 | | 1,345 | | 865 | |
| Total operating profit from continuing operations | 3,813 | | 2,427 | | 2,804 | | | 558 | | (26) | | (525) | |
| 4,371 | | 2,401 | | 2,279 | |
1. Comparative amounts have been re-presented to reflect the new operating segments and the classification of the UK Gas Transmission business as a discontinued operation. See notes 1 and 10 for further information.
| | | | | | | | | | | | | | | | | | | | | | | | | | | | | | | | | | | |
| Before exceptional items
and remeasurements | | Exceptional items
and remeasurements |
| After exceptional items
and remeasurements |
| 2022 | 2021¹ | 2020¹ | | 2022 | 2021¹ | 2020¹ |
| 2022 | 2021¹ | 2020¹ |
| £m | £m | £m | | £m | £m | £m |
| £m | £m | £m |
| Reconciliation to profit before tax: | | | | | | | | | | | |
| Operating profit from continuing operations | 3,813 | | 2,427 | | 2,804 | | | 558 | | (26) | | (525) | | | 4,371 | | 2,401 | | 2,279 | |
| Share of post-tax results of joint ventures and associates | 148 | | 66 | | 88 | | | (56) | | (8) | | (1) | | | 92 | | 58 | | 87 | |
| Finance income | 65 | | 35 | | 70 | | | (15) | | 23 | | (16) | | | 50 | | 58 | | 54 | |
| Finance costs | (1,146) | | (900) | | (999) | | | 74 | | 47 | | (21) | | | (1,072) | | (853) | | (1,020) | |
| Profit before tax from continuing operations | 2,880 | | 1,628 | | 1,963 | | | 561 | | 36 | | (563) | | | 3,441 | | 1,664 | | 1,400 | |
1. Comparative amounts have been re-presented to reflect the classification of the UK Gas Transmission business as a discontinued operation.
(c) Capital expenditure
Capital expenditure represents additions to property, plant and equipment and non-current intangibles but excludes additional investments in and loans to joint ventures and associates.
| | | | | | | | | | | | | | | | | | | | | | | | | | | | | | | | | | | |
| Net book value of property, plant and
equipment and other intangible assets | | Capital expenditure | | Depreciation, amortisation
and impairment |
| 2022 | 2021¹ | 2020¹ | | 2022 | 2021¹ | 2020¹ | | 2022 | 2021¹ | 2020¹ |
| £m | £m | £m | | £m | £m | £m | | £m | £m | £m |
| Operating segments: | | | | | | | | | | | |
| UK Electricity Transmission | 14,678 | | 14,000 | | 13,463 | | | 1,195 | | 984 | | 951 | | | (508) | | (460) | | (431) | |
| UK Electricity Distribution | 12,522 | | — | | — | | | 899 | | — | | — | | | (158) | | — | | — | |
| UK Electricity System Operator | 404 | | 379 | | 336 | | | 108 | | 88 | | 92 | | | (83) | | (47) | | (38) | |
| New England | 11,485 | | 10,165 | | 13,127 | | | 1,561 | | 1,437 | | 1,365 | | | (364) | | (389) | | (373) | |
| New York | 18,676 | | 16,467 | | 16,920 | | | 1,960 | | 1,738 | | 1,822 | | | (537) | | (453) | | (436) | |
| NGV and Other | 3,039 | | 2,750 | | 2,490 | | | 462 | | 480 | | 562 | | | (180) | | (136) | | (157) | |
| Total | 60,804 | | 43,761 | | 46,336 | | | 6,185 | | 4,727 | | 4,792 | | | (1,830) | | (1,485) | | (1,435) | |
| | | | | | | | | | | |
| Split by geographical area – continuing operations: | | | | | | | | | | | |
| UK | 30,131 | | 16,627 | | 15,706 | | | 2,546 | | 1,504 | | 1,560 | | | (879) | | (596) | | (579) | |
| US | 30,673 | | 27,134 | | 30,630 | | | 3,639 | | 3,223 | | 3,232 | | | (951) | | (889) | | (856) | |
| Total | 60,804 | | 43,761 | | 46,336 | | | 6,185 | | 4,727 | | 4,792 | | | (1,830) | | (1,485) | | (1,435) | |
| | | | | | | | | | | |
| Asset type: | | | | | | | | | | | |
| Property, plant and equipment | 57,532 | | 42,424 | | 45,160 | | | 5,714 | | 4,335 | | 4,465 | | | (1,544) | | (1,317) | | (1,286) | |
| Non-current intangible assets | 3,272 | | 1,337 | | 1,176 | | | 471 | | 392 | | 327 | | | (286) | | (168) | | (149) | |
| Total | 60,804 | | 43,761 | | 46,336 | | | 6,185 | | 4,727 | | 4,792 | | | (1,830) | | (1,485) | | (1,435) | |
1. Comparative amounts have been re-presented to reflect the new operating segments and the classification of the UK Gas Transmission business as a discontinued operation. See notes 1 and 10 for further information.
National Grid plc Annual Report and Accounts 2021/22 157
Notes to the consolidated financial statements continued
3. Revenue
| | |
Revenue arises in the course of ordinary activities and principally comprises: • transmission services; • distribution services; and • generation services. Transmission services, distribution services and certain other services (excluding rental income but including metering) fall within the scope of IFRS 15 ‘Revenue from Contracts with Customers’, whereas generation services (which solely relate to the contract with the Long Island Power Authority (LIPA) in the US) are accounted for under IFRS 16 ‘Leases’ as rental income, also presented within revenue. Revenue is recognised to reflect the transfer of goods or services to customers at an amount that reflects the consideration to which the Group expects to be entitled to in exchange for those goods or services and excludes amounts collected on behalf of third parties and value added tax. The Group recognises revenue when it transfers control over a product or service to a customer. Revenue in respect of regulated activities is determined by regulatory agreements that set the price to be charged for services in a given period based on pre-determined allowed revenues. Variances in service usage can result in actual revenue collected exceeding (over-recoveries) or falling short (under-recoveries) of allowed revenues. Where regulatory agreements allow the recovery of under-recoveries or require the return of over-recoveries, the allowed revenue for future periods is typically adjusted. In these instances, no assets or liabilities are recognised for under- or over-recoveries respectively, because the adjustment relates to future services that have not yet been delivered. |
Below, we include a description of principal activities, by reportable segment, from which the Group generates its revenue. For more detailed information about our segments, see note 2.
(a) UK Electricity Transmission
The UK Electricity Transmission segment principally generates revenue by providing electricity transmission services in England and Wales. Our business operates as a monopoly regulated by Ofgem, which has established price control mechanisms that set the amount of annual allowed returns our business can earn (along with the Scottish and Offshore transmission operators amongst others).
The transmission of electricity encompasses the following principal services:
•the supply of high-voltage electricity – revenue is recognised based on usage. Our performance obligation is satisfied over time as our customers make use of our network. We bill monthly in arrears and our payment terms are up to 60 days. Price is determined prior to our financial year end with reference to the regulated allowed returns and estimated annual volumes; and
•construction work (principally for connections) – revenue is recognised over time, as we provide access to our network. Customers can either pay over the useful life of the connection or upfront. Where the customer pays upfront, revenues are deferred as a contract liability and released over the life of the asset.
For other construction where there is no consideration for any future services, for example diversions, revenues are recognised as the construction work is completed.
(b) UK Electricity Distribution
The UK Electricity Distribution segment principally generates revenue by providing electricity distribution services in the Midlands and South West of England and South Wales. Similar to UK Electricity Transmission, UK Electricity Distribution operates as a monopoly in the jurisdictions that it operates in and is regulated by Ofgem.
The distribution of electricity encompasses the following principal services:
•electricity distribution – revenue is recognised based on usage by customers (over time), based upon volumes and price. The price control mechanism in place that determines our annual allowances is similar to UK Electricity Transmission. Revenues are billed monthly and payment terms are typically within 14 days; and
•construction work (principally for connections) – revenue is recognised over time as we provide access to our network. Where the customer pays upfront, revenues are deferred as a contract liability and released over the life of the asset.
For other construction where there is no consideration for any future services, revenues are recognised as the construction is completed.
(c) UK Electricity System Operator
The UK System Operator earns revenue for balancing supply and demand of electricity on Great Britain’s electricity transmission system, where it acts as principal. Balancing services are regulated by Ofgem and revenue is recognised as the service is provided.
The System Operator also collects revenues on behalf of transmission operators, principally National Grid Electricity Transmission plc and the Scottish and Offshore transmission operators, from users (electricity suppliers) who connect to or use the transmission system. As the System Operator acts as an agent in this capacity, it therefore records transmission network revenues net of payments to transmission operators.
(d) New England
The New England segment principally generates revenue by providing electricity and gas distribution services and high voltage electricity transmission services in New England. Distribution services are regulated by the Massachusetts Department of Public Utilities (MADPU) and the Rhode Island Public Utilities Commission (RIPUC) and transmission services are regulated by the Federal Energy Regulatory Commission (FERC), both of whom regulate the rates that can be charged to customers.
The distribution of electricity and gas and the provision of electricity transmission facilities encompasses the following principal services:
•electricity and gas distribution and electricity transmission – revenue is recognised based on usage by customers (over time). Revenues are billed monthly and payment terms are 30 days; and
•construction work (principally for connections) – revenue is recognised over time as we provide access to our network. Where the customer pays upfront, revenues are deferred as a contract liability or customer contributions (where they relate to government entities) and released over the life of the connection.
158 National Grid plc Annual Report and Accounts 2021/22
3. Revenue continued
(e) New York
The New York segment principally generates revenue by providing electricity and gas distribution services and high-voltage electricity transmission services in New York. Distribution services are regulated by the New York Public Service Commission (NYPSC) and transmission services are regulated by the FERC, both of whom regulate the rates that can be charged to customers.
The distribution of electricity and gas and the provision of electricity transmission facilities encompasses the following principal services:
•electricity and gas distribution and electricity transmission – revenue is recognised based on usage by customers (over time). Revenues are billed monthly and payment terms are 30 days; and
•construction work (principally for connections) – revenue is recognised over time as we provide access to our network. Where the customer pays upfront, revenues are deferred as a contract liability or customer contributions (where they relate to government entities) and released over the life of the connection.
(f) NGV and Other
NGV and Other generates revenue from electricity interconnectors, LNG at the Isle of Grain, National Grid Renewables, our UK commercial property business, rental income and insurance.
The Group recognises revenue from transmission services through interconnectors and LNG importation at the Isle of Grain by means of customers’ use of capacity and volumes. Revenue is recognised over time and is billed monthly. Payment terms are up to 30 days. Revenues in respect of certain wholly owned interconnector subsidiaries are subject to a cap and floor regime constructed by Ofgem. Where an interconnector expects to breach its total five-year cap, a provision and reduction in revenue is recognised in the current reporting period (see note 26). Where an interconnector does not expect to reach its five-year floor, either an asset will be recognised where a future inflow of economic benefits is considered virtually certain, or a contingent asset will be disclosed where the future inflow is concluded to be probable.
Electricity generation revenue is earned from the provision of energy services and supply capacity to produce energy for the use of customers of LIPA through a power supply agreement where LIPA receives all of the energy and capacity from the asset until at least 2025. The arrangement is treated as an operating lease within the scope of the leasing standard where we act as lessor; with rental income being recorded as other income, which forms part of total revenue. Lease payments (capacity payments) are recognised on a straight-line basis and variable lease payments are recognised as the energy is generated.
Other revenue in the scope of IFRS 15 principally includes sales of renewables projects from National Grid Renewables to Emerald Energy Venture LLC (Emerald), which is jointly controlled by National Grid and Washington State Investment Board (WSIB) (see note 16). National Grid Renewables develops wind and solar generation assets in the US, whilst Emerald has a right of first refusal to buy, build and operate those assets. Revenue is recognised as it is earned.
Other revenue, recognised in accordance with standards other than IFRS 15, includes property sales by our UK commercial property business (including sales to our 50% share in the St William joint venture which was sold on 15 March 2022) and rental income. Property sales are recorded at a point in time (when the sale is legally completed) and rental income is recorded over time.
(g) Disaggregation of revenue
In the following tables, revenue is disaggregated by primary geographical market and major service lines. The table below reconciles disaggregated revenue with the Group’s reportable segments (see note 2).
| | | | | | | | | | | | | | | | | | | | | | | |
| Revenue for the year ended 31 March 2022 | UK Electricity Transmission
£m | UK Electricity Distribution
£m | UK Electricity System Operator
£m | New
England
£m | New
York
£m | NGV and Other
£m | Total
£m |
| Revenue under IFRS 15 | | | | | | | |
| Transmission | 1,983 | | — | | — | | 52 | | 405 | | 627 | | 3,067 | |
| Distribution | — | | 1,375 | | — | | 4,434 | | 5,110 | | — | | 10,919 | |
| System Operator | — | | — | | 3,418 | | — | | — | | — | | 3,418 | |
Other1 | 35 | | 89 | | 19 | | 10 | | 10 | | 147 | | 310 | |
| Total IFRS 15 revenue | 2,018 | | 1,464 | | 3,437 | | 4,496 | | 5,525 | | 774 | | 17,714 | |
| Other revenue | | | | | | | |
| Generation | — | | — | | — | | — | | — | | 373 | | 373 | |
Other2 | 10 | | 4 | | — | | 54 | | 36 | | 258 | | 362 | |
| Total other revenue | 10 | | 4 | | — | | 54 | | 36 | | 631 | | 735 | |
| Total revenue from continuing operations | 2,028 | | 1,468 | | 3,437 | | 4,550 | | 5,561 | | 1,405 | | 18,449 | |
1. The UK Electricity Transmission and UK Electricity Distribution other IFRS 15 revenue principally relates to engineering recharges, which are the recovery of costs incurred for construction work requested by customers, such as the rerouting of existing network assets. UK Electricity System Operator other IFRS 15 revenue reflects the net income from its role as agent in respect of transmission network revenues. Within NGV and Other, the other IFRS 15 revenue principally relates to revenue generated from our NG Renewables business.
2. Other revenue, recognised in accordance with accounting standards other than IFRS 15, includes property sales by our UK commercial property business and rental income.
National Grid plc Annual Report and Accounts 2021/22 159
Notes to the consolidated financial statements continued
3. Revenue continued
(g) Disaggregation of revenue continued
| | | | | | | | | | | | | | | | | | | | | | | |
| Geographical split for the year ended 31 March 2022 | UK Electricity Transmission
£m | UK Electricity Distribution
£m | UK Electricity System Operator
£m | New England
£m | New
York
£m | NGV and
Other
£m | Total
£m |
| Revenue under IFRS 15 | | | | | | | |
| UK | 2,018 | | 1,464 | | 3,437 | | — | | — | | 646 | | 7,565 | |
| US | — | | — | | — | | 4,496 | | 5,525 | | 128 | | 10,149 | |
| Total IFRS 15 revenue | 2,018 | | 1,464 | | 3,437 | | 4,496 | | 5,525 | | 774 | | 17,714 | |
| Other revenue | | | | | | | |
| UK | 10 | | 4 | | — | | — | | — | | 224 | | 238 | |
| US | — | | — | | — | | 54 | | 36 | | 407 | | 497 | |
| Total other revenue | 10 | | 4 | | — | | 54 | | 36 | | 631 | | 735 | |
| Total revenue from continuing operations | 2,028 | | 1,468 | | 3,437 | | 4,550 | | 5,561 | | 1,405 | | 18,449 | |
| | | | | | | | | | | | | | | | | | | | | | | |
| Revenue for the year ended 31 March 2021 | UK Electricity Transmission
£m | UK Electricity Distribution
£m | UK Electricity System Operator
£m | New
England
£m | New
York
£m | NGV and
Other
£m | Total¹
£m |
| Revenue under IFRS 15 | | | | | | | |
| Transmission | 1,875 | | — | | — | | 74 | | 329 | | 316 | | 2,594 | |
| Distribution | — | | — | | — | | 4,091 | | 4,226 | | — | | 8,317 | |
| System Operator | — | | — | | 2,076 | | — | | — | | — | | 2,076 | |
Other2 | 67 | | — | | (61) | | 8 | | 7 | | 76 | | 97 | |
| Total IFRS 15 revenue | 1,942 | | — | | 2,015 | | 4,173 | | 4,562 | | 392 | | 13,084 | |
| Other revenue | | | | | | | |
| Generation | — | | — | | — | | — | | — | | 376 | | 376 | |
Other3 | 22 | | — | | 3 | | 41 | | 43 | | 96 | | 205 | |
| Total other revenue | 22 | | — | | 3 | | 41 | | 43 | | 472 | | 581 | |
| Total revenue from continuing operations | 1,964 | | — | | 2,018 | | 4,214 | | 4,605 | | 864 | | 13,665 | |
| | | | | | | | | | | | | | | | | | | | | | | |
| Geographical split for the year ended 31 March 2021 | UK Electricity Transmission £m | UK Electricity Distribution
£m | UK Electricity System Operator
£m | New
England
£m | New
York
£m | NGV and
Other
£m | Total¹
£m |
| Revenue under IFRS 15 | | | | | | | |
| UK | 1,942 | | — | | 2,015 | | — | | — | | 327 | | 4,284 | |
| US | — | | — | | — | | 4,173 | | 4,562 | | 65 | | 8,800 | |
| Total IFRS 15 revenue | 1,942 | | — | | 2,015 | | 4,173 | | 4,562 | | 392 | | 13,084 | |
| Other revenue | | | | | | | |
| UK | 22 | | — | | 3 | | — | | — | | 59 | | 84 | |
| US | — | | — | | — | | 41 | | 43 | | 413 | | 497 | |
| Total other revenue | 22 | | — | | 3 | | 41 | | 43 | | 472 | | 581 | |
| Total revenue from continuing operations | 1,964 | | — | | 2,018 | | 4,214 | | 4,605 | | 864 | | 13,665 | |
1. Comparative amounts have been re-presented to reflect the new operating segments and the classification of the UK Gas Transmission business as a discontinued operation. See notes 1, 2 and 10 for further information.
2. The UK Electricity Transmission other IFRS 15 revenue principally relates to engineering recharges, which are the recovery of costs incurred for construction work requested by customers, such as the rerouting of existing network assets. UK Electricity System Operator other IFRS 15 revenue reflects the net income from its role as agent in respect of transmission network revenues. Within NGV and Other, the other IFRS 15 revenue principally relates to revenue generated from our NG Renewables business.
3. Other revenue, recognised in accordance with accounting standards other than IFRS 15, principally includes property sales by our UK commercial property business and rental income reported in NGV and Other.
160 National Grid plc Annual Report and Accounts 2021/22
3. Revenue continued
(g) Disaggregation of revenue continued
| | | | | | | | | | | | | | | | | | | | | | | |
| Revenue for the year ended 31 March 2020 | UK Electricity Transmission
£m | UK Electricity Distribution
£m | UK Electricity System Operator
£m | New
England
£m | New
York
£m | NGV and
Other
£m | Total¹
£m |
| Revenue under IFRS 15 | | | | | | | |
| Transmission | 1,898 | | — | | — | | 77 | | 348 | | 309 | | 2,632 | |
| Distribution | — | | — | | — | | 4,114 | | 4,205 | | — | | 8,319 | |
| System Operator | — | | — | | 1,610 | | — | | — | | — | | 1,610 | |
Other2 | 69 | | — | | 94 | | 6 | | 6 | | 51 | | 226 | |
| Total IFRS 15 revenue | 1,967 | | — | | 1,704 | | 4,197 | | 4,559 | | 360 | | 12,787 | |
| Other revenue | | | | | | | |
| Generation | — | | — | | — | | — | | — | | 369 | | 369 | |
Other3 | 11 | | — | | 12 | | 38 | | 42 | | 101 | | 204 | |
| Total other revenue | 11 | | — | | 12 | | 38 | | 42 | | 470 | | 573 | |
| Total revenue from continuing operations | 1,978 | | — | | 1,716 | | 4,235 | | 4,601 | | 830 | | 13,360 | |
| | | | | | | | | | | | | | | | | | | | | | | |
| Geographical split for the year ended 31 March 2020 | UK Electricity Transmission £m | UK Electricity Distribution
£m | UK Electricity System Operator
£m | New
England
£m | New
York
£m | NGV and
Other
£m | Total¹
£m |
| Revenue under IFRS 15 | | | | | | | |
| UK | 1,967 | | — | | 1,704 | | — | | — | | 322 | | 3,993 | |
| US | — | | — | | — | | 4,197 | | 4,559 | | 38 | | 8,794 | |
| Total IFRS 15 revenue | 1,967 | | — | | 1,704 | | 4,197 | | 4,559 | | 360 | | 12,787 | |
| Other revenue | | | | | | | |
| UK | 11 | | — | | 12 | | — | | — | | 86 | | 109 | |
| US | — | | — | | — | | 38 | | 42 | | 384 | | 464 | |
| Total other revenue | 11 | | — | | 12 | | 38 | | 42 | | 470 | | 573 | |
| Total revenue from continuing operations | 1,978 | | — | | 1,716 | | 4,235 | | 4,601 | | 830 | | 13,360 | |
1. Comparative amounts have been re-presented to reflect the new operating segments and the classification of the UK Gas Transmission business as a discontinued operation. See notes 1, 2 and 10 for further information.
2. The UK Electricity Transmission other IFRS 15 revenue principally relates to engineering recharges, which are the recovery of costs incurred for construction work requested by customers, such as the rerouting of existing network assets. UK Electricity System Operator other IFRS 15 revenue reflects the net income from its role as agent in respect of transmission network revenues. Within NGV and Other, the other IFRS 15 revenue principally relates to revenue generated from our NG Renewables business.
3. Other revenue, recognised in accordance with accounting standards other than IFRS 15, principally includes property sales by our UK commercial property business and rental income reported in NGV and Other.
Contract liabilities (see note 23) represent revenue to be recognised in future periods relating to contributions in aid of construction of £1,472 million (2021: £1,160 million; 2020: £1,158 million). Contract liabilities in the years ended 31 March 2021 and 2020 included amounts in respect of the UK Gas Transmission business of £136 million and £136 million respectively. Revenue is recognised over the life of the asset. The asset lives for connections in UK Electricity Transmission, UK Electricity Distribution, New England and New York are 40 years, 69 years, 51 years and up to 48 years respectively. The weighted average amortisation period is 31 years.
Future revenues in relation to unfulfilled performance obligations not yet received in cash amount to £5.2 billion (2021: £4.8 billion; 2020: £3.1 billion). £1.7 billion (2021: £1.6 billion; 2020: £1.5 billion) relates to connection contracts in UK Electricity Transmission which will be recognised as revenue over 25 years and £3.0 billion (2021: £3.0 billion; 2020: £1.5 billion) relates to revenues to be earned under Grain LNG contracts until 2045. The remaining amount will be recognised as revenue over 3 years.
The amount of revenue recognised for the year ended 31 March 2022 from performance obligations satisfied (or partially satisfied) in previous periods, mainly due to changes in the estimate of the stage of completion, is £nil (2021: £nil; 2020: £nil).
National Grid plc Annual Report and Accounts 2021/22 161
Notes to the consolidated financial statements continued
4. Other operating income and costs
| | |
| Below we have presented separately certain items included in our operating costs from continuing operations. These include a breakdown of payroll costs (including disclosure of amounts paid to key management personnel) and fees paid to our auditors. Other operating income includes gains arising on disposal of interests in other entities. |
| | | | | | | | | | | | | | | | | | | | | | | | | | | | | | | | | | | |
| | | | | | | 2022 | 2021¹ | 2020¹ |
| | | | | | | £m | £m | £m |
| (Gain) on disposal of St William Homes LLP (note 5) | | | | | | (228) | | — | | — | |
| Depreciation, amortisation and impairment | | | | | | 1,830 | | 1,485 | | 1,435 | |
| Payroll costs | | | | | | 1,794 | | 1,638 | | 1,558 | |
| Purchases of electricity | | | | | | 1,280 | | 1,130 | | 1,403 | |
| Purchases of gas | | | | | | 1,666 | | 1,250 | | 1,316 | |
| Property and other taxes | | | | | | 1,202 | | 1,105 | | 1,100 | |
| UK Electricity Balancing costs | | | | | | 3,152 | | 1,875 | | 1,317 | |
| Other | | | | | | 3,215 | | 2,456 | | 2,718 | |
| Other operating (income)/costs | | | | | | 13,911 | | 10,939 | | 10,847 | |
| Provision for bad and doubtful debts | | | | | | 167 | | 325 | | 234 | |
| Total operating costs from continuing operations | | | | | | 14,078 | | 11,264 | | 11,081 | |
| Operating costs from continuing operations include: | | | | |
| Inventory consumed | | 436 | | 312 | | 315 | |
| Research and development expenditure | | 11 | | 12 | | 9 | |
1. Comparative amounts have been re-presented to reflect the classification of the UK Gas Transmission business as a discontinued operation. See notes 1 and 10 for further information.
(a) Payroll costs
| | | | | | | | | | | |
| 2022 | 2021¹ | 2020¹ |
| £m | £m | £m |
Wages and salaries2 | 2,563 | | 2,170 | | 2,081 | |
| Social security costs | 201 | | 156 | | 152 | |
| Defined contribution scheme costs | 81 | | 67 | | 62 | |
| Defined benefit pension costs | 185 | | 126 | | 125 | |
| Share-based payments | 38 | | 23 | | 16 | |
| Severance costs (excluding pension costs) | 5 | | 9 | | 1 | |
| 3,073 | | 2,551 | | 2,437 | |
| Less: payroll costs capitalised | (1,279) | | (913) | | (879) | |
| Total payroll costs from continuing operations | 1,794 | | 1,638 | | 1,558 | |
1. Comparative amounts have been re-presented to reflect the classification of the UK Gas Transmission business as a discontinued operation. See notes 1 and 10 for further information.
2. Included within wages and salaries are US other post-retirement benefit costs of £39 million (2021: £43 million; 2020: £45 million). For further information refer to note 25.
(b) Number of employees
| | | | | | | | | | | | | | | | | | | | |
| 31 March 2022 | Monthly average 2022 | 31 March 2021¹ | Monthly average 20211 | 31 March 2020¹ | Monthly average 20201 |
| UK | 11,960 | | 11,393 | | 4,468 | 4,333 | 4,185 | 4,095 |
| US | 17,332 | | 17,314 | | 17,026 | 16,821 | 16,748 | 16,679 |
| Total number of employees (continuing operations) | 29,292 | | 28,707 | | 21,494 | 21,154 | 20,933 | 20,774 |
1. Comparative amounts have been re-presented to reflect the classification of the UK Gas Transmission business as a discontinued operation. See notes 1 and 10 for further information.
162 National Grid plc Annual Report and Accounts 2021/22
4. Other operating income and costs continued
(c) Key management compensation
| | | | | | | | | | | |
| 2022 | 2021 | 2020 |
| £m | £m | £m |
| Short-term employee benefits | 7 | | 7 | | 7 | |
| Compensation for loss of office | — | | — | | 1 | |
| Post-employment benefits | 1 | | 1 | | 1 | |
| Share-based payments | 5 | | 4 | | 3 | |
| Total key management compensation | 13 | | 12 | | 12 | |
Key management compensation relates to the Board, including the Executive Directors and Non-executive Directors for the years presented.
(d) Auditors’ remuneration
Auditors’ remuneration is presented below in accordance with the requirements of the Companies Act 2006 and the principal accountant fees and services disclosure requirements of Item 16C of Form 20-F:
| | | | | | | | | | | |
| 2022 | 2021 | 2020 |
| £m | £m | £m |
| Audit fees payable to the Parent Company’s auditors and their associates in respect of: | | |
Audit of the Parent Company’s individual and consolidated financial statements1 | 2.7 | | 2.5 | | 1.9 | |
The auditing of accounts of any associate of the Company | 8.9 | | 8.1 | | 8.7 | |
Other services supplied2 | 7.3 | | 6.4 | | 6.3 | |
| 18.9 | | 17.0 | | 16.9 | |
Total other services3 | | | |
| | | |
| | | |
| | | |
| All other fees: | | | |
Other assurance services4 | 0.9 | | 0.8 | | 0.6 | |
| | | |
Other non-audit services not covered above5 | 0.1 | | 2.0 | | 0.5 | |
| 1.0 | | 2.8 | | 1.1 | |
| Total auditors’ remuneration | 19.9 | | 19.8 | | 18.0 | |
1. Audit fees in each year represent fees for the audit of the Company’s financial statements and regulatory reporting for the years ended 31 March 2022, 2021 and 2020.
2. Other services supplied represent fees payable for services in relation to other statutory filings or engagements that are required to be carried out by the auditors. In particular, this includes fees for reports under section 404 of the US Public Company Accounting Reform and Investor Protection Act of 2002 (Sarbanes-Oxley), audit reports on regulatory returns and the review of interim financial statements for the six-month periods ended 30 September 2021, 2020 and 2019 respectively.
3. There were no tax compliance or tax advisory fees and no audit-related fees as described in Item 16C(b) of Form 20-F.
4. In all years, principally relates to assurance services provided in relation to comfort letters for debt issuances and, in 2021, also includes amounts related to capacity market auction monitoring services.
5. For 2021, includes the class 1 Circular in respect of the acquisition of WPD announced on 18 March 2021. In 2020, other assurance services include auction monitor work on Contracts for Difference, a review of controls over our data on New York customers and IT project assurance.
The Audit & Risk Committee considers and makes recommendations to the Board, to be put to shareholders for approval at each AGM, in relation to the appointment, re-appointment, removal and oversight of the Company’s independent auditors. The Committee also considers and approves the audit fees on behalf of the Board in accordance with the Competition and Market Authority Audit Order 2014. The auditors’ remuneration is then put to shareholders at each AGM.
Certain services are prohibited from being performed by the external auditors under the Sarbanes-Oxley Act. Of the above services, none were prohibited.
National Grid plc Annual Report and Accounts 2021/22 163
Notes to the consolidated financial statements continued
5. Exceptional items and remeasurements
| | |
| To monitor our segmental financial performance, we use a profit measure that excludes certain income and expenses. We call that measure ‘adjusted profit’. Adjusted profit (which excludes exceptional items and remeasurements as defined below) is used by management to monitor financial performance as it is considered that it aids the comparability of our reported financial performance from year to year. We exclude items from adjusted profit because, if included, these items could distort understanding of our performance for the year and the comparability between periods. This note analyses these items, which are included in our results for the year but are excluded from adjusted profit. |
Exceptional items and remeasurements from continuing operations
| | | | | | | | | | | |
| 2022 | 20211 | 20201 |
| £m | £m | £m |
| Included within operating profit | | | |
| Exceptional items: | | | |
| Release of St William Homes LLP deferred income | 189 | | — | | — | |
| Net gain on disposal of St William Homes LLP | 228 | | — | | — | |
| | | |
| New operating model implementation costs and cost efficiency programme | (66) | | (50) | | — | |
| Transaction and separation costs | (223) | | (24) | | — | |
| Environmental insurance recovery | 38 | | — | | — | |
| Changes in environmental provisions | — | | 14 | | (400) | |
| 166 | | (60) | | (400) | |
| Remeasurements – commodity contract derivatives | 392 | | 34 | | (125) | |
| 558 | | (26) | | (525) | |
1. Comparative amounts have been re-presented to reflect the classification of the UK Gas Transmission business as a discontinued operation. See notes 1 and 10 for further information.
As disclosed in note 8, the Group also presents an adjusted earnings per share measure that is calculated before exceptional items and remeasurements. This measure is presented after tax and therefore details of tax exceptional items and the tax effect of exceptional items and remeasurements are also provided in this note.
| | | | | | | | | | | |
| 2022 | 20211 | 20201 |
| £m | £m | £m |
| Included within finance income and costs | | | |
| Remeasurements: | | | |
| Net gains/(losses) on financing derivatives | 74 | | 47 | | (21) | |
| Net (losses)/gains on financial assets at fair value through profit and loss | (15) | | 23 | | (16) | |
| 59 | | 70 | | (37) | |
| Included within share of post-tax results of joint ventures and associates | | | |
| | | |
| | | |
| | | |
| Remeasurements: | | | |
| Remeasurements – net losses on financial instruments | (56) | | (8) | | (1) | |
| Total included within profit/(loss) before tax | 561 | | 36 | | (563) | |
| Included within tax | | | |
| Exceptional items – movements arising on items not included in profit before tax: | | | |
| | | |
| Deferred tax charge arising as a result of UK tax rate change | (458) | | — | | (148) | |
| Tax on exceptional items | (28) | | 8 | | 103 | |
| Tax on remeasurements | (103) | | (34) | | 37 | |
| (589) | | (26) | | (8) | |
| Total exceptional items and remeasurements after tax | (28) | | 10 | | (571) | |
| Analysis of total exceptional items and remeasurements after tax | | | |
| Exceptional items after tax | (320) | | (52) | | (445) | |
| Remeasurements after tax | 292 | | 62 | | (126) | |
| Total exceptional items and remeasurements after tax | (28) | | 10 | | (571) | |
1. Comparative amounts have been re-presented to reflect the classification of the UK Gas Transmission business as a discontinued operation. See notes 1 and 10 for further information.
164 National Grid plc Annual Report and Accounts 2021/22
5. Exceptional items and remeasurements continued
Exceptional items
Management uses an exceptional items framework that has been discussed and approved by the Audit & Risk Committee. This follows a three-step process which considers the nature of the event, the financial materiality involved and any particular facts and circumstances. In considering the nature of the event, management focuses on whether the event is within the Group’s control and how frequently such an event typically occurs. With respect to restructuring costs, these represent additional expenses incurred that are not related to the normal business and day-to-day activities. In determining the facts and circumstances, management considers factors such as ensuring consistent treatment between favourable and unfavourable transactions, the precedent for similar items, the number of periods over which costs will be spread or gains earned, and the commercial context for the particular transaction. The exceptional items framework was last updated in March 2022 and reflects the latest disclosure requirements arising in respect of FRC guidance issued in the year.
Items of income or expense that are considered by management for designation as exceptional items include significant restructurings, write-downs or impairments of non-current assets, significant changes in environmental or decommissioning provisions, integration of acquired businesses, gains or losses on disposals of businesses or investments and significant debt redemption costs as a consequence of transactions such as significant disposals or issues of equity, and the related tax, as well as deferred tax arising on changes to corporation tax rates.
Costs arising from restructuring programmes include redundancy costs. Redundancy costs are charged to the consolidated income statement in the year in which a commitment is made to incur the costs and the main features of the restructuring plan have been announced to affected employees.
Set out below are details of the transactions against which we have considered the application of our exceptional items framework in each of the years for which results are presented. No COVID-19-related costs incurred have been recognised as exceptional in any of the years presented.
2022
Net gain on disposal of St William Homes LLP and release of deferred income
During the year, the Group recognised a gain of £228 million on the disposal of its entire 50% equity interest in the St William Homes LLP joint venture to The Berkeley Group plc for cash consideration of £413 million (see note 16). In connection with the disposal, the Group also released deferred income of £189 million which related to deferred profits from previous property sales to St William Homes LLP. We have concluded that the release of the deferred income should be classified as exceptional given the crystallisation event for the release is the sale of the Group’s equity interest in St William Homes LLP.
New operating model implementation costs and cost efficiency programme
The Group incurred a further £66 million of costs in relation to the design and implementation of our new operating model and the major cost efficiency programme announced in November 2021. The costs recognised primarily relate to professional fees incurred and redundancy provisions. Whilst the costs incurred this year do not meet the quantitative threshold to be classified as exceptional on a standalone basis, when taken in aggregate with the costs expected to be incurred over the duration of the programme, we have concluded that the costs should be classified as exceptional in line with our exceptional items policy. The total cash outflow for the period was £48 million.
Transaction and separation costs
£223 million of transaction and separation costs were incurred in the period in relation to the acquisition of WPD (see note 37), the planned disposal of NECO (see note 10) and the planned disposal of our UK Gas Transmission business (see note 10). The costs relate to legal fees, bankers’ fees and other professional fees. The costs have been classified as exceptional, consistent with similar costs for the year ended 31 March 2021. The total cash outflow for the year was £196 million.
Environmental insurance recovery
In the US, the most significant component of our £1.9 billion environmental provision relates to several Superfund sites, and arose from former manufacturing gas plant facilities, previously owned or operated by the Group or its predecessor companies. Under Federal and State Superfund laws, potential liability for the historical contamination may be imposed on responsible parties jointly and severally, without regard to fault, even if the activities were lawful when they occurred. In the year, we have recognised an exceptional gain of £38 million relating to an insurance receivable for site remediation costs that are included in our Superfund sites environmental provision. The insurance receipts have been recorded as an exceptional item in line with the treatment of the related costs.
2021
New operating model implementation costs
The Group incurred £50 million of costs in relation to the design and implementation of our new operating model that is built on a foundation of six business units. The costs recognised in the year ended 31 March 2021 primarily related to professional fees incurred and redundancy provisions. In evaluating the costs incurred against the quantitative thresholds in our exceptional items framework we considered the total costs to be incurred over the duration of the programme. Whilst the costs incurred did not meet the quantitative threshold to be classified as exceptional on a standalone basis, we concluded that the costs should be classified as exceptional in line with our exceptional items policy, in order to ensure that the costs are treated in a consistent manner with similar costs incurred previously. The total cash outflow for the year was £33 million.
Transaction and separation costs
£24 million of transaction and separation costs were incurred in relation to the acquisition of WPD (see note 37) and the planned sale of NECO (see note 10). The costs related to legal fees, bankers’ fees and professional fees. Whilst the costs incurred in isolation were not sufficiently material to warrant classification as an exceptional item, we expected further costs to be incurred in the next year, for example, in regard to success fees on completion of the acquisition. When taken in aggregate, the costs incurred over both years will be sufficiently material to be classified as exceptional in line with our policy. The total cash outflow for the year was £14 million.
Changes in environmental provision
We recognised an exceptional gain of £14 million relating to the release of environmental provisions relating to one of our US Superfund sites, for which the original provision was treated as an exceptional item. The reduction in the provision arose as a result of the re-evaluation of the Group’s share of estimated costs following the finalisation of discussions on the scope of certain remediation work with government authorities. The release was recorded as an exceptional item in line with the treatment of the original provision.
National Grid plc Annual Report and Accounts 2021/22 165
Notes to the consolidated financial statements continued
5. Exceptional items and remeasurements continued
2020
Changes in environmental provisions
As a result of notices issued by governmental authorities and newly developed cost estimates prepared by third-party engineers in relation to our US Superfund sites, we re-evaluated our estimates of total costs and cost sharing allocations borne by the Company, and accordingly increased our provision by £326 million. Under the terms of our rate plans, we are entitled to recovery of environmental clean‑up costs from rate payers, but under IFRS no asset can be recognised for this recovery.
Also included in the total environmental charge was the £74 million (re-presented to reflect the classification of the UK Gas Transmission business as a discontinued operation) impact of the change in the real discount rate applied to the environmental provisions across the Group, of which £66 million related to the US and £8 million to the UK. Given the substantial and sustained change in gilts and corporate bond yields, we concluded it was appropriate to reduce the real discount rate from 1% to 0.5%. The weighted average remaining duration of our cash flows is now around 10 years.
Remeasurements
Remeasurements comprise unrealised gains or losses recorded in the consolidated income statement arising from changes in the fair value of certain of our financial assets and liabilities accounted for at fair value through profit and loss (FVTPL). Once the fair value movements are realised (for example, when the derivative matures), the previously recognised fair value movements are then reversed through remeasurements and recognised within earnings before exceptional items and remeasurements. These assets and liabilities include commodity contract derivatives and financing derivatives to the extent that hedge accounting is not available or is not fully effective.
The unrealised gains or losses reported in profit and loss on certain additional assets and liabilities treated at FVTPL are also classified within remeasurements. These relate to financial assets (which fail the ‘solely payments of principal and interest test’ under IFRS 9), the money market fund investments used by Group Treasury for cash management purposes and the net foreign exchange gains and losses on borrowing activities. These are offset by foreign exchange gains and losses on financing derivatives measured at fair value. In all cases, these fair values increase or decrease because of changes in foreign exchange, commodity or other financial indices over which we have no control.
We report unrealised gains or losses relating to certain discrete classes of financial assets accounted for at FVTPL within adjusted profit. These comprise our portfolio of investments made by National Grid Partners, our investment in Sunrun Neptune 2016 LLC and the contingent consideration arising on the acquisition of National Grid Renewables (all within NGV and Other). The performance of these assets (including changes in fair value) is included in our assessment of adjusted profit for the relevant business units.
Remeasurements excluded from adjusted profit are made up of the following categories:
i.Net gains/(losses) on commodity contract derivatives represent mark-to-market movements on certain physical and financial commodity contract obligations in the US. These contracts primarily relate to the forward purchase of energy for supply to customers, or to the economic hedging thereof, that are required to be measured at fair value and that do not qualify for hedge accounting. Under the existing rate plans in the US, commodity costs are recoverable from customers although the timing of recovery may differ from the pattern of costs incurred;
ii.Net gains/(losses) on financing derivatives comprise gains and losses arising on derivative financial instruments used for the risk management of interest rate and foreign exchange exposures. These exclude gains and losses for which hedge accounting has been effective, and have been recognised directly in the consolidated statement of other comprehensive income or are offset by adjustments to the carrying value of debt (see notes 17 and 32). Net foreign exchange gains and losses on financing derivatives used for the risk management of foreign exchange exposures are offset by foreign exchange losses and gains on borrowing activities;
iii.Net gains/(losses) on financial assets measured at FVTPL comprise gains and losses on the investment funds held by our insurance captives which are categorised as FVTPL (see note 15);
iv.Net gains/(losses) on financial liabilities measured at FVTPL comprise the change in the fair value (excluding changes due to own credit risk) of a financial liability that was designated at FVTPL on transition to IFRS 9 to reduce a measurement mismatch (see note 21); and
v.Unrealised net gains/(losses) on derivatives and other financial instruments within our joint ventures and associates.
Items included within tax
2022
Change in UK corporation tax rate
In the Spring Budget 2021, the UK government announced that from 1 April 2023 the UK corporation tax rate will increase to 25%, and this was substantively enacted on 24 May 2021. Deferred tax balances at 31 March 2022 were remeasured at the enacted rate, with £458 million recognised as exceptional, in line with previous periods.
2020
The Finance Act 2016, which was enacted on 15 September 2016, reduced the main UK corporation tax rate to 17% with effect from 1 April 2020. Deferred tax balances were calculated at this rate for the years ended 31 March 2017 to 2019. On 17 March 2020, the UK government utilised the Provisional Collection of Taxes Act 1968 to substantively enact a reversal of the reduction in the main UK corporation tax rate to 17% with effect from 1 April 2020, resulting in the rate remaining at 19%. Deferred taxes at 31 March 2020 were measured using enacted tax rates and reflected in these financial statements, resulting in a £148 million deferred tax charge (re-presented to reflect the classification of the UK Gas Transmission business as a discontinued operation), principally due to the remeasurement of deferred tax liabilities. The treatment of this charge as exceptional was consistent with the treatment for the year ended 31 March 2017 when the original reduction in the tax rate was substantively enacted, resulting in the recognition of an exceptional tax credit of £94 million.
166 National Grid plc Annual Report and Accounts 2021/22
6. Finance income and costs
| | |
This note details the interest income generated by our financial assets and interest expense incurred on our financial liabilities, primarily our financing portfolio (including our financing derivatives). It also includes the net interest on our pensions and other post-retirement assets. In reporting adjusted profit, we adjust net financing costs to exclude any net gains or losses on financial instruments included in remeasurements (see note 5). |
Finance income and costs remeasurements include unrealised gains and losses on certain assets and liabilities now treated at FVTPL. The interest income, dividends and interest expense on these items are included in finance income and finance costs before remeasurements respectively.
| | | | | | | | | | | | | | | | | |
| | | 2022 | 20211 | 20201 |
| Notes | | £m | £m | £m |
| Finance income | | | | | |
| Interest income on financial instruments: | | | | | |
| Bank deposits and other financial assets | | | 32 | | 33 | | 48 | |
| Dividends received on equities held at fair value through other comprehensive income (FVOCI) | | | 3 | | 2 | | 2 | |
| Other income | | | 30 | | — | | 20 | |
| | | 65 | | 35 | | 70 | |
| Finance costs | | | | | |
| Net interest on pensions and other post-retirement benefit obligations | 25 | | — | | (51) | | (34) | |
| Interest expense on financial liabilities held at amortised cost: | | | | | |
| Bank loans and overdrafts | | | (216) | | (53) | | (46) | |
| Other borrowings² | | | (961) | | (741) | | (846) | |
| Interest on derivatives | | | (59) | | (47) | | (92) | |
| Unwinding of discount on provisions | 26 | | (73) | | (77) | | (75) | |
| Other interest | | | 11 | | (51) | | (8) | |
| Less: interest capitalised³ | | | 152 | | 120 | | 102 | |
| | | (1,146) | | (900) | | (999) | |
| Remeasurements – Finance income | | | | | |
| Net gains/(losses) on FVTPL financial assets | | | (15) | | 23 | | (16) | |
| | | (15) | | 23 | | (16) | |
| Remeasurements – Finance costs | | | | | |
Net gains/(losses) on financing derivatives4: | | | | | |
| Derivatives designated as hedges for hedge accounting | | | 45 | | 30 | | (14) | |
| Derivatives not designated as hedges for hedge accounting | | | 29 | | 17 | | (7) | |
| | | 74 | | 47 | | (21) | |
| Total remeasurements – Finance income and costs | | | 59 | | 70 | | (37) | |
| | | | | |
| Finance income | | | 50 | | 58 | | 54 | |
Finance costs5 | | | (1,072) | | (853) | | (1,020) | |
| | | | | |
| Net finance costs from continuing operations | | | (1,022) | | (795) | | (966) | |
1. Comparative amounts have been re-presented to reflect the classification of the UK Gas Transmission business as a discontinued operation. See notes 1 and 10 for further information.
2. Includes interest expense on lease liabilities (see note 13 for details).
3. Interest on funding attributable to assets in the course of construction in the current year was capitalised at a rate of 3.2% (2021: 3.1%; 2020: 3.6%). In the UK, capitalised interest qualifies for a current year tax deduction with tax relief claimed of £16 million (2021: £11 million; 2020: £15 million). In the US, capitalised interest is added to the cost of property, plant and equipment and qualifies for tax depreciation allowances.
4. Includes a net foreign exchange gain on borrowing activities of £110 million (2021: £73 million gain; 2020: £114 million gain) offset by foreign exchange losses and gains on financing derivatives measured at fair value.
5. Finance costs include principal accretion on inflation linked liabilities of £241 million (2021: £46 million; 2020: £85 million).
National Grid plc Annual Report and Accounts 2021/22 167
Notes to the consolidated financial statements continued
7. Tax
| | |
| Tax is payable in the territories where we operate, mainly the UK and the US. This note gives further details of the total tax charge and tax liabilities, including current and deferred tax. The current tax charge is the tax payable on this year’s taxable profits. Deferred tax is an accounting adjustment to provide for tax that is expected to arise in the future due to differences in the accounting and tax bases. |
The tax charge for the period is recognised in the income statement, the statement of comprehensive income or directly in the statement of changes in equity, according to the accounting treatment of the related transaction. The tax charge comprises both current and deferred tax.
Current tax assets and liabilities are measured at the amounts expected to be recovered from or paid to the tax authorities. The tax rates and tax laws used to compute the amounts are those that have been enacted or substantively enacted by the reporting date.
The Group operates internationally in territories with different and complex tax codes. Management exercises judgement in relation to the level of provision required for uncertain tax outcomes. There are a number of tax positions not yet agreed with the tax authorities where different interpretations of legislation could lead to a range of outcomes. Judgements are made for each position having regard to particular circumstances and advice obtained.
Deferred tax is provided for using the balance sheet liability method, and is recognised on temporary differences between the carrying amount of assets and liabilities in the financial statements and the corresponding tax bases.
Deferred tax liabilities are generally recognised on all taxable temporary differences, and deferred tax assets are recognised to the extent that it is probable that taxable profits will be available against which deductible temporary differences can be utilised. However, deferred tax assets and liabilities are not recognised if the temporary differences arise from the initial recognition of goodwill or from the initial recognition of other assets and liabilities in a transaction (other than a business combination) that affects neither the accounting nor the taxable profit or loss.
Deferred tax liabilities are recognised on taxable temporary differences arising on investments in subsidiaries and joint arrangements except where the Company is able to control the reversal of the temporary difference and it is probable that the temporary difference will not reverse in the foreseeable future.
Deferred tax is calculated at the tax rates that are expected to apply in the period when the liability is settled or the asset is realised, based on the tax rates and tax laws that have been enacted or substantively enacted by the reporting date.
The carrying amount of deferred tax assets is reviewed at each reporting date and reduced to the extent that it is no longer probable that sufficient taxable profits will be available to allow all or part of the deferred tax asset to be recovered. Unrecognised deferred tax assets are reassessed at each reporting date and are recognised to the extent that it has become probable that future taxable profits will allow the deferred tax asset to be recovered.
Deferred tax assets and liabilities are offset when there is a legally enforceable right to offset current tax assets against current tax liabilities and when they relate to income taxes levied by the same tax authority, and the Company and its subsidiaries intend to settle their current tax assets and liabilities on a net basis.
168 National Grid plc Annual Report and Accounts 2021/22
7. Tax continued
The tax charge for the year can be analysed as follows:
| | | | | | | | | | | |
| 2022 | 20211 | 20201 |
| £m | £m | £m |
| Current tax: | | | |
UK corporation tax at 19% (2021: 19%; 2020: 19%) | 255 | | 157 | | 132 | |
| UK corporation tax adjustment in respect of prior years | (9) | | 15 | | 5 | |
| 246 | | 172 | | 137 | |
| Overseas corporation tax | 6 | | 3 | | (2) | |
| Overseas corporation tax adjustment in respect of prior years | (26) | | (15) | | (41) | |
| (20) | | (12) | | (43) | |
| Total current tax from continuing operations | 226 | | 160 | | 94 | |
| Deferred tax: | | | |
| UK deferred tax | 605 | | 39 | | 207 | |
| UK deferred tax adjustment in respect of prior years | (5) | | (20) | | (4) | |
| 600 | | 19 | | 203 | |
| Overseas deferred tax | 425 | | 174 | | 64 | |
| Overseas deferred tax adjustment in respect of prior years | 7 | | 7 | | 9 | |
| 432 | | 181 | | 73 | |
| Total deferred tax from continuing operations | 1,032 | | 200 | | 276 | |
| | | |
| Total tax charge from continuing operations | 1,258 | | 360 | | 370 | |
1. Comparative amounts have been re-presented to reflect the classification of the UK Gas Transmission business as a discontinued operation. See notes 1 and 10 for further information.
Tax charged/(credited) to the consolidated statement of comprehensive income and equity
| | | | | | | | | | | |
| 2022 | 20211 | 20201 |
| £m | £m | £m |
| Current tax: | | | |
| Cash flow hedges, cost of hedging and own credit reserve | — | | — | | — | |
| | | |
| | | |
| Deferred tax: | | | |
| Investments at fair value through other comprehensive income | — | | 12 | | (1) | |
| Cash flow hedges, cost of hedging and own credit reserve | (12) | | 6 | | (38) | |
| Remeasurements of pension assets and post-retirement benefit obligations | 493 | | 462 | | (226) | |
| Share-based payments | (4) | | 1 | | (2) | |
| | | |
| 477 | | 481 | | (267) | |
| Total tax recognised in the statements of comprehensive income from continuing operations | 481 | | 480 | | (265) | |
| Total tax relating to share-based payments recognised directly in equity from continuing operations | (4) | | 1 | | (2) | |
| 477 | | 481 | | (267) | |
1. Comparative amounts have been re-presented to reflect the classification of the UK Gas Transmission business as a discontinued operation. See notes 1 and 10 for further information.
National Grid plc Annual Report and Accounts 2021/22 169
Notes to the consolidated financial statements continued
7. Tax continued
The tax charge for the year, for the continuing business, is higher (2021: higher tax charge; 2020: lower tax charge) than the standard rate of corporation tax in the UK of 19% (2021: 19%; 2020: 19%):
| | | | | | | | | | | |
| 2022 | 20211 | 20201 |
| £m | £m | £m |
| Profit before tax from continuing operations | | | |
| Before exceptional items and remeasurements | 2,880 | | 1,628 | | 1,963 | |
| Exceptional items and remeasurements | 561 | | 36 | | (563) | |
| Profit before tax from continuing operations | 3,441 | | 1,664 | | 1,400 | |
Profit before tax from continuing operations multiplied by UK corporation tax rate of 19% (2021: 19%; 2020: 19%) | 654 | | 316 | | 266 | |
| Effect of: | | | |
| Adjustments in respect of prior years² | (33) | | (12) | | (31) | |
| Expenses not deductible for tax purposes | 47 | | 29 | | 24 | |
| Non-taxable income³ | (49) | | (7) | | (18) | |
| Adjustment in respect of foreign tax rates⁴ | 170 | | 42 | | 18 | |
| Deferred tax impact of change in UK tax rate | 501 | | — | | 148 | |
| Adjustment in respect of post-tax profits of joint ventures and associates included within profit before tax | (17) | | (12) | | (17) | |
Other5 | (15) | | 4 | | (20) | |
| Total tax charge from continuing operations | 1,258 | | 360 | | 370 | |
| | | |
| % | % | % |
| Effective tax rate – continuing operations | 36.6 | | 21.6 | | 26.4 | |
1. Comparative amounts have been re-presented to reflect the classification of the UK Gas Transmission business as a discontinued operation. See notes 1 and 10 for further information.
2. The prior year adjustments are primarily due to agreement of prior period tax returns.
3. Includes tax on chargeable disposals after the offset of capital losses and tax on the profits deferred to the following accounting period.
4. Includes remeasurement of US closing State deferred tax balances as a result of expected increase in the blended State tax rate following the disposal of NECO.
5. Other primarily comprises the movement in the deferred tax asset on previously unrecognised capital losses, claims for land remediation relief and impact of fair value movements on capitalised hedging.
Factors that may affect future tax charges
In the Spring Budget 2021, the UK government announced an increase in the main corporation tax rate from 19% to 25% with effect from 1 April 2023. This was substantively enacted on 24 May 2021. Deferred tax balances as at 31 March 2022, that are expected to reverse after 1 April 2023, have been calculated at 25%.
The US government continues to consider changes to federal tax legislation, but as no changes have been substantively enacted at the balance sheet date, deferred tax balances as at 31 March 2022 have been calculated at the prevailing tax rates based on the current tax laws.
We will continue to monitor the developments driven by Brexit, the OECD’s Base Erosion and Profit Shifting (BEPS) project and European Commission initiatives including fiscal aid investigations. At this time, we do not expect this to have any material impact on our future tax charges. Governments across the world including the UK and the US have introduced various stimulus/reliefs for businesses to cope with the impact of the COVID-19 pandemic, from which we do not currently expect there to be a material impact on our future tax charges.
170 National Grid plc Annual Report and Accounts 2021/22
7. Tax continued
Tax included within the statement of financial position
The following are the major deferred tax assets and liabilities recognised, and the movements thereon, during the current and prior reporting periods:
| | | | | | | | | | | | | | | | | | | | | | | |
| Regulatory licences
£m | Accelerated
tax
depreciation
£m | Share-
based
payments
£m | Pensions
and other
post-
retirement
benefits
£m | Financial
instruments
£m | Other net
temporary differences1 £m | Total
£m |
| Deferred tax liabilities/(assets) | | | | | | | |
At 1 April 2020 | — | | 6,562 | | (48) | | (360) | | (55) | | (1,653) | | 4,446 | |
Exchange adjustments and other2 | — | | (501) | | 4 | | 51 | | 4 | | 174 | | (268) | |
| Charged/(credited) to income statement | — | | 373 | | — | | (12) | | 1 | | (147) | | 215 | |
| Charged to other comprehensive income and equity | — | | — | | 2 | | 414 | | 6 | | — | | 422 | |
At 1 April 2021 | — | | 6,434 | | (42) | | 93 | | (44) | | (1,626) | | 4,815 | |
Exchange adjustments and other2 | — | | 247 | | (1) | | 1 | | 1 | | (85) | | 163 | |
| Charged/(credited) to income statement | — | | 1,050 | | 26 | | 118 | | 153 | | (117) | | 1,230 | |
| Charged/(credited) to other comprehensive income and equity | — | | — | | (6) | | 587 | | (10) | | — | | 571 | |
| Reclassification to held for sale (note 10) | — | | (643) | | 5 | | (166) | | 2 | | (1) | | (803) | |
| Acquisition of WPD (note 37) | 429 | | 622 | | — | | 142 | | (403) | | (1) | | 789 | |
| | | | | | | |
At 31 March 2022 | 429 | | 7,710 | | (18) | | 775 | | (301) | | (1,830) | | 6,765 | |
1. The deferred tax asset of £1,830 million as at 31 March 2022 (2021: £1,626 million) in respect of other net temporary differences primarily relates to net operating losses of £428 million (2021: £455 million), US environmental provisions of £511 million (2021: £453 million) and US bad debt provision of £201 million (2021: £184 million).
2. Exchange adjustments and other primarily comprises foreign exchange arising on translation of the US dollar deferred tax balances.
Deferred tax assets and liabilities are only offset where there is a legally enforceable right of offset and there is an intention to settle the balances net. The deferred tax balances (after offset) for statement of financial position purposes consist solely of deferred tax liabilities of £6,765 million (2021: £4,815 million). This balance is after offset of a deferred tax asset of £428 million (2021: £455 million) which has been recognised in respect of net operating losses (£418 million) and capital losses (£10 million).
Deferred tax assets in respect of some capital losses as well as trading losses and non-trade deficits have not been recognised as their future recovery is uncertain or not currently anticipated. The total deferred tax assets not recognised are as follows:
| | | | | | | | |
| 2022 | 2021 |
| £m | £m |
| Capital losses | 2,363 | | 1,620 | |
| Non-trade deficits | 1 | | 1 | |
| Trading losses | 7 | | 7 | |
The capital losses arose in the UK on disposal of certain businesses or assets. They are available to carry forward indefinitely but can only be offset against future capital gains. The UK non-trade deficits arose prior to 1 April 2017 and therefore can only be offset against future non-trade profits.
At 31 March 2022 and 31 March 2021, there were no recognised deferred tax liabilities for taxes that would be payable on the unremitted earnings of the Group’s subsidiaries or its associates as there are no significant corporation tax consequences of the Group’s UK, US or overseas subsidiaries or associates paying dividends to their parent companies. There are also no significant income tax consequences for the Group from the payment of dividends by the Group to its shareholders.
National Grid plc Annual Report and Accounts 2021/22 171
Notes to the consolidated financial statements continued
8. Earnings per share (EPS)
| | |
| EPS is the amount of profit after tax attributable to each ordinary share. Basic EPS is calculated on profit after tax for the year attributable to equity shareholders divided by the weighted average number of shares in issue during the year. Diluted EPS shows what the impact would be if all outstanding share options were exercised and treated as ordinary shares at year end. The weighted average number of shares is increased by additional shares issued as scrip dividends and reduced by shares repurchased by the Company during the year. The earnings per share calculations are based on profit after tax attributable to equity shareholders of the Company which excludes non-controlling interests. |
Adjusted earnings and EPS, which exclude exceptional items and remeasurements, are provided to reflect the adjusted profit sub-totals used by the Company. We have included reconciliations from this additional EPS measure to earnings for both basic and diluted EPS to provide additional detail for these items. For further details of exceptional items and remeasurements, see note 5.
(a) Basic EPS
| | | | | | | | | | | | | | | | | | | | |
| Earnings | EPS | Earnings | EPS | Earnings | EPS |
| 2022 | 2022 | 20211 | 20211 | 20201 | 20201 |
| £m | pence | £m | pence | £m | pence |
| Adjusted earnings from continuing operations | 2,210 | | 61.4 | | 1,293 | | 36.7 | | 1,600 | | 46.2 | |
| Exceptional items and remeasurements after tax from continuing operations (see note 5) | (28) | | (0.8) | | 10 | | 0.3 | | (571) | | (16.5) | |
| Earnings from continuing operations | 2,182 | | 60.6 | | 1,303 | | 37.0 | | 1,029 | | 29.7 | |
| Adjusted earnings from discontinued operations (see note 10) | 344 | | 9.6 | | 340 | | 9.7 | | 317 | | 9.2 | |
| Exceptional items and remeasurements after tax from discontinued operations | (173) | | (4.8) | | (3) | | (0.1) | | (82) | | (2.4) | |
| Earnings from discontinued operations | 171 | | 4.8 | | 337 | | 9.6 | | 235 | | 6.8 | |
| Total adjusted earnings | 2,554 | | 71.0 | | 1,633 | | 46.4 | | 1,917 | | 55.4 | |
| Total exceptional items and remeasurements after tax (including discontinued operations) | (201) | | (5.6) | | 7 | | 0.2 | | (653) | | (18.9) | |
| Total earnings | 2,353 | | 65.4 | | 1,640 | | 46.6 | | 1,264 | | 36.5 | |
| | | | | | |
| | 2022 | | 2021 | | 2020 |
| | millions | | millions | | millions |
| Weighted average number of ordinary shares – basic | | 3,599 | | | 3,523 | | | 3,461 | |
1. Comparative amounts have been re-presented to reflect the classification of the UK Gas Transmission business as a discontinued operation. See notes 1 and 10 for further information.
(b) Diluted EPS
| | | | | | | | | | | | | | | | | | | | |
| Earnings | EPS | Earnings | EPS | Earnings | EPS |
| 2022 | 2022 | 20211 | 20211 | 20201 | 20201 |
| £m | pence | £m | pence | £m | pence |
| Adjusted earnings from continuing operations | 2,210 | | 61.1 | | 1,293 | | 36.5 | | 1,600 | | 46.0 | |
| Exceptional items and remeasurements after tax from continuing operations (see note 5) | (28) | | (0.8) | | 10 | | 0.3 | | (571) | | (16.4) | |
| Earnings from continuing operations | 2,182 | | 60.3 | | 1,303 | | 36.8 | | 1,029 | | 29.6 | |
| Adjusted earnings from discontinued operations | 344 | | 9.5 | | 340 | | 9.6 | | 317 | | 9.1 | |
| Exceptional items and remeasurements after tax from discontinued operations (see note 10) | (173) | | (4.8) | | (3) | | (0.1) | | (82) | | (2.4) | |
| Earnings from discontinued operations | 171 | | 4.7 | | 337 | | 9.5 | | 235 | | 6.7 | |
| Total adjusted earnings | 2,554 | | 70.6 | | 1,633 | | 46.1 | | 1,917 | | 55.1 | |
| Total exceptional items and remeasurements after tax (including discontinued operations) | (201) | | (5.6) | | 7 | | 0.2 | | (653) | | (18.8) | |
| Total earnings | 2,353 | | 65.0 | | 1,640 | | 46.3 | | 1,264 | | 36.3 | |
| | | | | | |
| | 2022 | | 2021 | | 2020 |
| | millions | | millions | | millions |
| Weighted average number of ordinary shares – diluted | | 3,616 | | | 3,540 | | | 3,478 | |
1. Comparative amounts have been re-presented to reflect the classification of the UK Gas Transmission business as a discontinued operation. See notes 1 and 10 for further information.
(c) Reconciliation of basic to diluted average number of shares
| | | | | | | | | | | |
| 2022 | 2021 | 2020 |
| millions | millions | millions |
| Weighted average number of ordinary shares – basic | 3,599 | | 3,523 | | 3,461 | |
| Effect of dilutive potential ordinary shares – employee share plans | 17 | | 17 | | 17 | |
| Weighted average number of ordinary shares – diluted | 3,616 | | 3,540 | | 3,478 | |
172 National Grid plc Annual Report and Accounts 2021/22
9. Dividends
Interim dividends are recognised when they become payable to the Company’s shareholders. Final dividends are recognised when they are approved by shareholders.
| | | | | | | | | | | | | | | | | | | | | | | | | | | | | | | | | | | |
| 2022 | | 2021 | | 2020 |
| Pence
per share | Cash
dividend
£m | Scrip dividend
£m | | Pence per share | Cash
dividend
£m | Scrip dividend £m | | Pence per share | Cash
dividend
£m | Scrip dividend £m |
| Interim dividend in respect of the current year | 17.21 | 339 | | 282 | | | 17.00 | 348 | | 249 | | | 16.57 | 335 | | 241 | |
| | | | | | | | | | | |
| Final dividend in respect of the prior year | 32.16 | 583 | | 562 | | | 32.00 | 1,065 | | 54 | | | 31.26 | 557 | | 517 | |
| 49.37 | 922 | | 844 | | | 49.00 | 1,413 | | 303 | | | 47.83 | 892 | | 758 | |
The Directors are proposing a final dividend for the year ended 31 March 2022 of 33.76p per share that will absorb approximately £1,231 million of shareholders’ equity (assuming all amounts are settled in cash). It will be paid on 18 August 2022 to shareholders who are on the register of members at 4 June 2022 (subject to shareholders’ approval at the AGM). A scrip dividend will be offered as an alternative.
10. Assets held for sale and discontinued operations
| | |
| The results and cash flows of significant assets or businesses sold during the year are shown separately from our continuing operations, and presented within discontinued operations in the income statement and cash flow statement. Assets and businesses are classified as held for sale when their carrying amounts are recovered through sale rather than through continuing use. They only meet the held for sale condition when the assets are ready for immediate sale in their present condition, management is committed to the sale and it is highly probable that the sale will complete within one year. Depreciation ceases on assets and businesses when they are classified as held for sale and the assets and businesses are impaired if the proceeds less sale costs fall short of the carrying value. |
(a) Assets held for sale
The following assets and liabilities were classified as held for sale as at 31 March 2022:
| | | | | | | | | | | |
| Total assets
held for sale
£m | Total liabilities held for sale
£m | Net assets held for sale
£m |
| The Narragansett Electric Company | 4,129 | | (1,658) | | 2,471 | |
| UK Gas Transmission | 5,871 | | (5,530) | | 341 | |
| Net assets held for sale | 10,000 | | (7,188) | | 2,812 | |
The Narragansett Electric Company
On 17 March 2021, the Group signed an agreement to sell 100% of the share capital of a wholly owned subsidiary, NECO. NECO is part of our New England segment and is a retail distribution company providing electricity and gas to customers in Rhode Island. The associated assets and liabilities were consequently presented as held for sale in the consolidated financial statements for the year ended 31 March 2021.
As NECO does not represent a separate major line of business or geographical operations, the criteria for classification as a discontinued operation are not met and accordingly its results have not been separately disclosed on the face of the income statement.
Whilst all of the regulatory approvals are in place, the disposal of NECO was not finalised as at 31 March 2022 due to the appeal of one of these approvals by the Rhode Island Attorney General. The following assets and liabilities of NECO were classified as held for sale at 31 March 2022:
| | | | | |
| £m |
| Goodwill | 590 | |
| Intangible assets | 4 | |
| Property, plant and equipment | 3,173 | |
| Trade and other receivables | 251 | |
| Cash and cash equivalents | 6 | |
| Other assets | 105 | |
| Total assets held for sale | 4,129 | |
| Borrowings | (1,177) | |
| Pension liabilities | (12) | |
| |
| Other liabilities | (469) | |
| Total liabilities held for sale | (1,658) | |
| Net assets held for sale | 2,471 | |
No impairment losses were recognised upon remeasurement of the assets and liabilities prior to classification as held for sale. NECO generated profit after tax of £237 million for the year ended 31 March 2022 (2021: £104 million; 2020: £31 million). Current and deferred tax balances relating to NECO have not been included as held for sale on the basis that those balances will be retained by National Grid rather than transferred with the other assets and liabilities of NECO. Furthermore, the tax balances of NECO have been classified within current and non-current assets and liabilities with the corresponding offsets from the other Group members in accordance with the jurisdictional netting principles.
National Grid plc Annual Report and Accounts 2021/22 173
Notes to the consolidated financial statements continued
10. Assets held for sale and discontinued operations continued
(a) Assets held for sale continued
UK Gas Transmission
The Group announced its intention to sell the UK Gas Transmission business on 18 March 2021. On 27 March 2022, the Group agreed to sell 100% of the UK Gas Transmission business to a new entity (the ‘Acquiring Entity’) in exchange for £4.2 billion cash consideration (subject to customary completion adjustments) and a 40% interest in the Acquiring Entity. The other 60% in the Acquiring Entity will be owned by Macquarie Infrastructure and Real Assets (MIRA) and British Columbia Investment Management Corporation (BCI) (together, the ‘Consortium’). £2.0 billion of the cash consideration comes from additional debt financing raised by the Acquiring Entity at completion. The sale is expected to complete in the third quarter of the financial year ending 31 March 2023 subject to the receipt of all regulatory approvals.
On 27 March 2022, the Group also entered into a Further Acquisition Agreement (FAA) with the Consortium. This allows the Consortium to purchase the Group’s 40% interest in the Acquiring Entity for £1.4 billion plus an annualised escalation factor. The FAA can be exercised either in the period between 1 January and 31 March 2023 or in the period between 1 April and 30 June 2023. The deferral of the option window is at our discretion (subject to change, depending on the timing of the closing of the sale agreement).
The Group classified the associated assets and liabilities of the business as held for sale in the consolidated statement of financial position as at 31 August 2021, when the sale was considered to be highly probable following management approval of the sale timetable and communication thereof to potential buyers. As at 31 March 2022, the following assets and liabilities of the UK Gas Transmission business were classified as held for sale:
| | | | | |
| £m |
| Intangible assets | 159 | |
| Property, plant and equipment | 4,719 | |
| Trade and other receivables | 215 | |
| Pension assets | 664 | |
| Cash and cash equivalents | 9 | |
| Financing derivatives | 93 | |
| Other assets | 12 | |
| Total assets held for sale | 5,871 | |
| Borrowings | (4,165) | |
| Deferred tax liabilities | (803) | |
| Other liabilities | (562) | |
| Total liabilities held for sale | (5,530) | |
| Net assets held for sale | 341 | |
No impairment losses were recognised upon remeasurement of the assets and liabilities prior to classification as held for sale.
(b) Discontinued operations
Planned disposal of UK Gas Transmission
As UK Gas Transmission represents a major separate line of business, the business has also met the criteria for classification as a discontinued operation, and therefore the results of the business have been shown separately from the continuing business for all periods presented on the face of the income statement as a discontinued operation.
Disposal of Quadgas HoldCo Limited
In June 2019, the Group sold its remaining 39% interest in Cadent (held through its holding in Quadgas HoldCo Limited (Quadgas)). The aggregate carrying value of our investment in Quadgas at the disposal date was £1,956 million and the total sales proceeds were £1,965 million, resulting in a gain on disposal of £9 million.
We considered the disposal of our 39% investment in Quadgas as the final stage of the plan to dispose of our interest in the UK Gas Distribution business first announced in 2015, and accordingly treated the results and cash flows arising from Quadgas as a discontinued operation on the basis that the sale formed the final part of a ‘single coordinated plan’ to dispose of UK Gas Distribution.
174 National Grid plc Annual Report and Accounts 2021/22
10. Assets held for sale and discontinued operations continued
(b) Discontinued operations continued
The summary income statements for UK Gas Transmission and Quadgas, together representing the discontinued operations of the Group, for the years ended 31 March 2022, 2021 and 2020 are as follows:
| | | | | | | | | | | | | | | | | | | | | | | | | | | | | | | | |
| | | | | | | | 2022 | 2021 | 2020 |
| | | | | | | | £m | £m | £m |
| Discontinued operations | | | | | | | | | | |
| Revenue | | | | | | | | 1,362 | | 1,114 | | 1,180 | |
| Other operating costs | | | | | | | | (725) | | (620) | | (702) | |
| Operating profit | | | | | | | | 637 | | 494 | | 478 | |
| Finance income | | | | | | | | — | | — | | 6 | |
Finance costs1 | | | | | | | | (230) | | (75) | | (147) | |
| Profit before tax | | | | | | | | 407 | | 419 | | 337 | |
Tax2 | | | | | | | | (236) | | (82) | | (111) | |
| Profit after tax from discontinued operations | | | | | | | | 171 | | 337 | | 226 | |
| Gain on disposal | | | | | | | | — | | — | | 9 | |
| Total profit after tax from discontinued operations | | | | | | | | 171 | | 337 | | 235 | |
1. Finance costs from discontinued operations include principal accretion of inflation linked liabilities in the UK Gas Transmission business of £158 million (2021: £38 million; 2020: £76 million).
2. Of the £236 million tax charge in the year ended 31 March 2022, £145 million relates to deferred tax due to the change in the UK corporation tax rate.
The summary statement of comprehensive income for discontinued operations for the years ended 31 March 2022, 2021 and 2020 are as follows:
| | | | | | | | | | | |
| 2022 | 2021 | 2020 |
| £m | £m | £m |
| Profit after tax from discontinued operations | 171 | | 337 | | 235 | |
| Other comprehensive income/(loss) from discontinued operations | | | |
| Items from discontinued operations that will never be reclassified to profit or loss: | | | |
| Remeasurement gains/(losses) on pension assets and post-retirement benefit obligations | 309 | | (250) | | 58 | |
| Net losses on financial liability designated at fair value through profit and loss attributable to changes in own credit risk | (1) | | (11) | | (3) | |
| Net losses in respect of cash flow hedging of capital expenditure | — | | (2) | | — | |
| Tax on items that will never be reclassified to profit or loss | (94) | | 50 | | (20) | |
| Total gains/(losses) from discontinued operations that will never be reclassified to profit or loss | 214 | | (213) | | 35 | |
| Items from discontinued operations that may be reclassified subsequently to profit or loss: | | | |
| Net gains/(losses) in respect of cash flow hedges | 1 | | 3 | | (1) | |
| Net (losses)/gains in respect of cost of hedging | (4) | | (6) | | 2 | |
| Tax on items that may be reclassified subsequently to profit or loss | — | | — | | 2 | |
| Total losses from discontinued operations that may be reclassified subsequently to profit or loss | (3) | | (3) | | 3 | |
| Other comprehensive income/(loss) for the year, net of tax from discontinued operations | 211 | | (216) | | 38 | |
| Total comprehensive income for the year from discontinued operations | 382 | | 121 | | 273 | |
Details of the cash flows relating to discontinued operations are set within the consolidated cash flow statement.
National Grid plc Annual Report and Accounts 2021/22 175
Notes to the consolidated financial statements continued
11. Goodwill
| | |
| Goodwill represents the excess of what we paid to acquire businesses over the fair value of their net assets at the acquisition date. We assess whether goodwill is recoverable by performing an impairment review annually or more frequently if events or changes in circumstances indicate a potential impairment. |
Goodwill and fair value adjustments arising on the acquisition of a foreign entity are treated as assets and liabilities of the foreign entity and translated at the closing exchange rate. Goodwill is allocated to cash-generating units (CGUs) and this allocation is made to those CGUs that are expected to benefit from the acquisition in which the goodwill arose.
Impairment is recognised where there is a difference between the carrying value of the CGU and the estimated recoverable amount of the CGU to which that goodwill has been allocated. Any impairment is recognised immediately in the income statement and is not subsequently reversed. Any impairment loss is first allocated to the carrying value of the goodwill and then to the other assets within the CGU. Recoverable amount is defined as the higher of fair value less costs to sell and estimated value-in-use at the date the impairment review is undertaken. Value-in-use represents the present value of expected future cash flows, discounted using a pre-tax discount rate that reflects current market assessments of the time value of money and the risks specific to the asset for which the estimates of future cash flows have not been adjusted.
| | | | | |
| Total £m |
| Net book value at 1 April 2020 | 5,712 | |
| Exchange adjustments | (562) | |
| Reclassification to held for sale (note 10) | (562) | |
| Net book value at 1 April 2021 | 4,588 | |
| Exchange adjustments | 223 | |
| |
| Acquisition of WPD (note 37) | 4,721 | |
| Net book value at 31 March 2022 | 9,532 | |
There was no significant accumulated impairment charge as at 31 March 2022 or 31 March 2021.
Following the announcement of the planned sale of NECO (see note 10), goodwill balances relating to our Rhode Island CGU and a portion of the goodwill relating to our previously reported Federal CGU were reclassified as held for sale in the prior period. Following the implementation of our new operating model during the year ended 31 March 2022, we have reassessed our CGUs. The Federal CGU (£544 million) is now allocated across the New York, New England and National Grid Ventures Renewables CGUs. The Massachusetts CGU (£963 million) is now allocated to the New England CGU. These changes reflect the updated level at which goodwill is now monitored for internal management purposes.
Impairment review of goodwill and indefinite-lived intangibles
Goodwill and indefinite-lived intangibles (see note 12) are reviewed annually for impairment and the recoverability is assessed by comparing the carrying amount of our operations with the expected recoverable amount on a value-in-use basis which uses pre-financing and pre-tax cash flow projections based on the Group’s financial plans, approved by the Directors, as a starting point. See below for a summary of which operations our goodwill and indefinite-lived intangibles are allocated to:
| | | | | |
| 2022 |
| CGU or group of CGUs | £m |
| Goodwill: | |
| National Grid Ventures Renewables | 150 | |
| New England | 1,510 | |
| New York | 3,151 | |
WPD1 | 4,721 | |
| Total goodwill | 9,532 | |
| |
| Indefinite-lived intangibles (regulatory licences related to WPD): | |
| West Midlands | 518 | |
| East Midlands | 519 | |
| South Wales | 257 | |
| South West | 420 | |
| Total indefinite-lived intangibles | 1,714 | |
1. This is a combination of the West Midlands, East Midlands, South Wales and South West CGUs, reflecting the level at which the goodwill is monitored.
In each assessment, the value-in-use has been calculated assuming a stable regulatory framework and is based on projections that incorporate our best estimates of future cash flows, including costs, changes in commodity prices, future rates and growth. Such projections reflect our current regulatory agreements, taking into account regulatory arrangements to allow for future agreements and recovery of investment, including those related to achieving the net zero plans of the jurisdictions that we operate in. Our plans have proved to be reliable guides in the past and the Directors believe the estimates are appropriate.
176 National Grid plc Annual Report and Accounts 2021/22
11. Goodwill continued
(a) Cash flow periods, terminal value and discount rate assumptions
We select cash flow durations longer than five years, when our forecasts are considered reliable. The cash flow durations selected reflect our knowledge and understanding of the regulatory environments in which we operate, and most significantly, where markets have legislated decarbonisation commitments by 2050, we utilise longer cash flow forecasts that reflect the investment required to deliver those commitments before applying a terminal value at the point those commitments are due to be fulfilled and market growth is expected to stabilise. For our regulated WPD operations, we consider cash flow durations that run until 2050, reflecting the expected investment required in the network, in excess of economy‑wide long-term growth rates in order to deliver the energy transition. For our regulated US operations (New York and New England CGUs), we use a five-year cash flow forecast.
For our WPD business, a nominal terminal growth rate of 2.5% is assumed upon the terminal year cash flows, reflecting management’s best view, based on market and operational experience, of the expected long-term growth in the relevant market. For our US regulated operations, due to differences in the regulatory framework and the combination of gas and electricity networks, we apply a growth rate of 2.25%. This has been determined with regard to data on industry growth projections, specifically related to the energy transition, and projected growth in real gross domestic product (GDP) for the territory within which the CGU is based.
Pre-tax cash flows are discounted by applying a pre-tax discount rate reflecting the time value of money and the risks specific to the group of assets. In practice, the post-tax discount rate for the group of assets in question is taken as a starting point, before considering industry peer discount rates to apply adjustments, as required, ensuring the rate applied is independent of the entity’s capital structure and to reflect a market participants’ view of a risk adjusted discount rate specific to the CGU or group of CGUs. The post-tax discount rate is then grossed up to a pre-tax discount rate that is applied to pre-tax cash flows. The pre-tax discount rates used for the year ended 31 March 2022 were as follows: WPD Group 5.2%; WPD DNOs 4.9%; New York 5.5%; and New England 5.6%.
The discount rate and terminal growth rate applied in the year ended 31 March 2021 to the CGUs assessed at that date were 5.3% and 2.1% respectively.
(b) Key inputs and sensitivity analysis
In assessing the carrying value of goodwill and licences, we have sensitised our forecasts to factor in adjustments to key inputs to each model. Whilst regulatory licences are tested for impairment before we test goodwill, we consider the sensitivity for all balances separately for WPD and our regulated US operations below.
WPD goodwill
We identified the discount rate and the terminal growth rate as key assumptions for which the value-in-use calculation is the most sensitive in our impairment review. A reduction in the terminal growth rate to 2% resulted in WPD’s carrying amount equalling its recoverable amount. Considering the sensitivity to the discount rate applied, we found that increasing the pre-tax discount rate by 0.2% (to 5.4%) will result in WPD’s carrying amount equalling its recoverable amount (see notes 1 and 35).
WPD indefinite-lived regulatory licences
No reasonable changes to inputs to the impairment test performed over the South West, East Midlands, West Midlands and South Wales Distribution Network Operator CGUs were identified as resulting in an impairment.
Regulated US operations: New York and New England goodwill
While it is possible that a key assumption in the calculation could change, the Directors believe that no reasonably foreseeable change would result in an impairment of goodwill, in view of the long-term nature of the key assumptions and the margin by which the estimated value-in-use exceeds the carrying amount. This remains the case even after taking into account the short-term effects of COVID-19 and inflationary pressures, the most significant of which is an increase in bad debt charges in the short term, but not a risk of impairment to goodwill.
National Grid plc Annual Report and Accounts 2021/22 177
Notes to the consolidated financial statements continued
12. Other intangible assets
| | |
Other intangible assets include software which is written down (amortised) over the period we expect to receive a benefit from the asset. An amortisation expense is charged to the income statement to reflect the reduced value of the asset over time. Amortisation is calculated by estimating the number of years we expect the asset to be used (useful economic life or UEL) and charging the cost of the asset to the income statement equally over this period. Indefinite-lived intangibles comprise regulatory licences for which there is no foreseeable limit to the period over which they are expected to generate net cash inflows. These assets are considered to have an indefinite life and are not amortised but subject to a review for impairment annually, or more frequently if events or circumstances indicate a potential impairment. Any impairment is charged to the income statement as it arises. |
Identifiable intangible assets are recorded at cost less accumulated amortisation and any provision for impairment, with the exception of regulatory licences that are assessed to have indefinite lives and are therefore tested annually for impairment (see note 11 for details of impairment tests performed over indefinite-lived intangible assets). Other intangible assets are tested for impairment only if there is an indication that the carrying value of the assets may have been impaired. Impairments of assets are calculated as the difference between the carrying value of the asset and the recoverable amount, if lower. Where such an asset does not generate cash flows that are independent from other assets, the recoverable amount of the CGU to which that asset belongs is estimated. Impairments are recognised in the consolidated income statement within Other operating income and costs. Any assets which suffered impairment in a previous period are reviewed for possible reversal of the impairment at each reporting date.
The Group’s regulatory licences relate to electricity distribution licences acquired in connection with the Group’s acquisition of WPD on 14 June 2021 (see note 37). The licences provide the right to operate and invest in the relevant network that operates as a monopoly in the licensed geographic area. Once granted by Ofgem, the licence is issued to a licensee on the basis that it remains active into perpetuity. On that basis, the value attributed to the electricity distribution network licence assets is considered to have an indefinite useful life.
Internally generated intangible assets, such as software, are recognised only if: i) an asset is created that can be identified; ii) it is probable that the asset created will generate future economic benefits; and iii) the development cost of the asset can be measured reliably. Where no internally generated intangible asset can be recognised, development expenditure is recorded as an expense in the period in which it is incurred.
Cloud computing arrangements are reviewed to determine if the Group has control of the software intangible asset. Control is considered to exist where the Group has the right to take possession of the software and run it on its own or a third party’s computer infrastructure or if the Group has exclusive rights to use the software such that the supplier is unable to make the software available to other customers.
Costs relating to configuring or customising the software in a cloud computing arrangement are assessed to determine if there is a separate intangible asset over which the Group has control. If an asset is identified, it is capitalised and amortised over the useful economic life of the asset. To the extent that no separate intangible asset is identified, then the costs are either expensed when incurred or recognised as a prepayment and spread over the term of the arrangement if the costs are concluded to not be distinct.
The accounting for costs incurred in cloud computing arrangements represents the application of new accounting guidance for the Group for the year ended 31 March 2022. Certain costs which were previously capitalised in respect of the Group’s cloud computing arrangements have been expensed in the period.
178 National Grid plc Annual Report and Accounts 2021/22
12. Other intangible assets continued
Other than regulatory licences, intangible assets are amortised on a straight-line basis over their estimated useful economic lives. Amortisation periods for other intangible assets are:
| | | | | | | | | | | | | | |
| | | | Years |
| Software | | | | 3 to 10 |
| Regulatory licences | | | | Indefinite |
| | | | |
| Regulatory licences1 £m | Software £m | Assets in the course of construction
£m | Total
£m |
| Cost at 1 April 2020 | — | | 2,026 | | 557 | | 2,583 | |
| Exchange adjustments | — | | (102) | | (43) | | (145) | |
| Additions | — | | 7 | | 414 | | 421 | |
| Disposals | — | | (47) | | (2) | | (49) | |
Reclassifications2 | — | | 255 | | (240) | | 15 | |
| Reclassification to held for sale (note 10) | — | | (19) | | — | | (19) | |
| Cost at 1 April 2021 | — | | 2,120 | | 686 | | 2,806 | |
| Exchange adjustments | — | | 69 | | 11 | | 80 | |
| Additions | — | | 15 | | 513 | | 528 | |
| Acquisition of WPD (note 37) | 1,714 | | 49 | | — | | 1,763 | |
| Disposals | — | | (7) | | — | | (7) | |
Reclassifications2 | — | | 260 | | (302) | | (42) | |
| Reclassification to held for sale (note 10) | — | | (431) | | (38) | | (469) | |
| Cost at 31 March 2022 | 1,714 | | 2,075 | | 870 | | 4,659 | |
| Accumulated amortisation at 1 April 2020 | — | | (1,288) | | — | | (1,288) | |
| Exchange adjustments | — | | 61 | | — | | 61 | |
| Amortisation charge for the year | — | | (196) | | — | | (196) | |
| Accumulated amortisation of disposals | — | | 44 | | — | | 44 | |
| Reclassification to held for sale (note 10) | — | | 16 | | — | | 16 | |
| Accumulated amortisation at 1 April 2021 | — | | (1,363) | | — | | (1,363) | |
| Exchange adjustments | — | | (33) | | — | | (33) | |
Amortisation charge for the year | — | | (297) | | — | | (297) | |
| Impairment³ | — | | — | | (10) | | (10) | |
| Accumulated amortisation of disposals | — | | 7 | | — | | 7 | |
| Reclassification to held for sale (note 10) | — | | 309 | | — | | 309 | |
| Accumulated amortisation at 31 March 2022 | — | | (1,377) | | (10) | | (1,387) | |
| Net book value at 31 March 2022⁴ | 1,714 | | 698 | | 860 | | 3,272 | |
| Net book value at 31 March 2021 | — | | 757 | | 686 | | 1,443 | |
1. Relates to the licence intangibles acquired as part of the acquisition of WPD (see note 37). The Group assesses its indefinite-life intangible assets for impairment annually (see note 11).
2. Reclassifications includes amounts transferred to property, plant and equipment (see note 13).
3. Depreciation of assets in the course of construction relates to impairment provision adjustments recognised in the year.
4. The Group has capitalised £366 million (2021: £298 million) in relation to the Gas Business Enablement system in the US, of which £152 million (2021: £82 million) is in service and is being amortised over 10 years, with the remainder included within assets in the course of construction. A further £103 million (2021: £nil) in relation to our new UK general ledger system was reclassified from assets in the course of construction to software assets in the period to 31 March 2022, and is now amortised over 10 years.
National Grid plc Annual Report and Accounts 2021/22 179
Notes to the consolidated financial statements continued
13. Property, plant and equipment
| | |
Property, plant and equipment are the physical assets controlled by us. The cost of these assets primarily represents the amount initially paid for them or the fair value on the date of acquisition of a business. Cost includes both their purchase price and the construction and other costs associated with getting them ready for operation. A depreciation expense is charged to the income statement to reflect annual wear and tear and the reduced value of the asset over time. Depreciation is calculated by estimating the number of years we expect the asset to be used (useful economic life or UEL) and charging the cost of the asset to the income statement equally over this period. We operate an energy networks business and therefore have a significant physical asset base. We continue to invest in our networks to maintain reliability, create new customer connections and ensure our networks are flexible and resilient. Our business plan envisages these additional investments will be funded through a mixture of cash generated from operations and the issue of new debt. |
Property, plant and equipment is recorded at cost, less accumulated depreciation and any impairment losses. Cost includes the purchase price of the asset; any payroll and finance costs incurred which are directly attributable to the construction of property, plant and equipment together with an appropriate portion of overheads which are directly linked to the capital work performed; and the cost of any associated asset retirement obligations.
Property, plant and equipment includes assets in which the Group’s interest comprises legally protected statutory or contractual rights of use. Additions represent the purchase or construction of new assets, including capital expenditure for safety and environmental assets, and extensions to, enhancements to, or replacement of, existing assets. All costs associated with projects or activities which have not been fully commissioned at the period end are classified within assets in the course of construction.
Items within property, plant and equipment are tested for impairment only if there is some indication that the carrying value of the assets may have been impaired. Impairments of assets are calculated as the difference between the carrying value of the asset and the recoverable amount, if lower. Where such an asset does not generate cash flows that are independent from other assets, the recoverable amount of the cash-generating unit to which that asset belongs is estimated. Impairments are recognised in the income statement and if immaterial are included within the depreciation charge for the year.
(a) Analysis of property, plant and equipment
| | | | | | | | | | | | | | | | | |
| Land and buildings £m | Plant and machinery £m | Assets
in the
course of
construction
£m | Motor vehicles and office equipment £m | Total £m |
| Cost at 1 April 2020 | 3,897 | | 59,609 | | 4,771 | | 1,036 | | 69,313 | |
| Exchange adjustments | (213) | | (3,308) | | (130) | | (73) | | (3,724) | |
| Additions | 89 | | 328 | | 4,023 | | 70 | | 4,510 | |
| Disposals | (6) | | (344) | | (26) | | (48) | | (424) | |
| Reclassifications¹ | 96 | | 3,007 | | (3,243) | | 77 | | (63) | |
| Reclassification to held for sale (note 10) | (111) | | (3,231) | | (174) | | (44) | | (3,560) | |
| Cost at 1 April 2021 | 3,752 | | 56,061 | | 5,221 | | 1,018 | | 66,052 | |
| Exchange adjustments | 97 | | 1,627 | | 111 | | 37 | | 1,872 | |
| Additions | 22 | | 926 | | 4,843 | | 129 | | 5,920 | |
| Acquisition of WPD (note 37) | 200 | | 9,512 | | 185 | | 154 | | 10,051 | |
| Disposals | (165) | | (367) | | — | | (88) | | (620) | |
| Reclassifications¹ | 62 | | 4,063 | | (4,133) | | 89 | | 81 | |
| Reclassification to held for sale (note 10) | (309) | | (8,800) | | (640) | | (267) | | (10,016) | |
| Cost at 31 March 2022 | 3,659 | | 63,022 | | 5,587 | | 1,072 | | 73,340 | |
Accumulated depreciation at 1 April 2020 | (847) | | (18,042) | | — | | (662) | | (19,551) | |
| Exchange adjustments | 37 | | 698 | | — | | 46 | | 781 | |
| Depreciation charge for the year | (90) | | (1,270) | | — | | (116) | | (1,476) | |
| Disposals | — | | 339 | | — | | 48 | | 387 | |
| Reclassifications¹ | 2 | | (5) | | — | | 6 | | 3 | |
| Reclassification to held for sale (note 10) | 22 | | 798 | | — | | 27 | | 847 | |
| Accumulated depreciation at 1 April 2021 | (876) | | (17,482) | | — | | (651) | | (19,009) | |
| Exchange adjustments | (20) | | (351) | | — | | (23) | | (394) | |
| Depreciation charge for the year² | (114) | | (1,300) | | (48) | | (167) | | (1,629) | |
| Disposals | 29 | | 311 | | — | | 88 | | 428 | |
| Reclassifications¹ | 15 | | (40) | | (18) | | 2 | | (41) | |
| Reclassification to held for sale (note 10) | 193 | | 4,421 | | 6 | | 217 | | 4,837 | |
| Accumulated depreciation at 31 March 2022 | (773) | | (14,441) | | (60) | | (534) | | (15,808) | |
| Net book value at 31 March 2022 | 2,886 | | 48,581 | | 5,527 | | 538 | | 57,532 | |
| Net book value at 31 March 2021 | 2,876 | | 38,579 | | 5,221 | | 367 | | 47,043 | |
1. Represents amounts transferred between categories, (to)/from other intangible assets (see note 12), from inventories and reclassifications between cost and accumulated depreciation.
2. Depreciation of assets in the course of construction relates to impairment provision adjustments recognised in the year.
180 National Grid plc Annual Report and Accounts 2021/22
13. Property, plant and equipment continued
(a) Analysis of property, plant and equipment continued
| | | | | | | | |
| 2022 | 2021 |
| £m | £m |
| Information in relation to property, plant and equipment | | |
| Capitalised interest included within cost | 2,114 | | 2,233 | |
| | |
| | |
| Contributions to cost of property, plant and equipment included within: | | |
| Trade and other payables | 137 | | 138 | |
| Non-current liabilities | 421 | | 400 | |
| Contract liabilities – current | 130 | | 66 | |
| Contract liabilities – non-current | 1,342 | | 1,094 | |
(b) Asset useful economic lives
No depreciation is provided on freehold land or assets in the course of construction. Other items of property, plant and equipment are depreciated, on a straight-line basis, at rates estimated to write off their book values over their estimated useful economic lives. In assessing estimated useful economic lives, consideration is given to any contractual arrangements and operational requirements relating to particular assets. The assessments of estimated useful economic lives and residual values of assets are performed annually.
Unless otherwise determined by operational requirements, the depreciation periods for the principal categories of property, plant and equipment are, in general, as shown in the table below split between the UK and US, along with the weighted average remaining UEL for each class of property, plant and equipment (which is calculated by applying the annual depreciation charge per class of asset to the net book value of that class of asset).
| | | | | | | | | | | |
| | Years | |
| UK | US | Weighted average remaining UEL¹ |
| Freehold and leasehold buildings | up to 60 | up to 100 | 41 |
| Plant and machinery: |
| | |
| Electricity transmission plant and wires | up to 100 | 45 to 80 | 31 |
| Electricity distribution plant | 3 to 99 | 35 to 85 | 45 |
| Electricity generation plant | n/a | 20 to 93 | 12 |
| Interconnector plant and other | 5 to 60 | 5 to 50 | 32 |
| Gas plant – mains, services and regulating equipment | n/a | 47 to 80 | 55 |
| Gas plant – storage | 5 to 40 | 12 to 65 | 12 |
| Gas plant – meters | 7 to 30 | 14 to 40 | 24 |
| Motor vehicles and office equipment | up to 30 | up to 26 | 5 |
1. Excluded from the above table are depreciation periods in respect of items of property, plant and equipment which are classified as held for sale as at 31 March 2022.
(c) Gas asset lives
The role that gas networks play in the pathway to achieving the greenhouse gas emissions reductions targets set in the jurisdictions in which we operate is currently uncertain. However, we believe the gas assets which we own and operate today will continue to have a crucial role in maintaining security, reliability and affordability of energy beyond 2050, although the scale and purpose for which the networks will be used is dependent on technological developments and policy choices of governments and regulators.
With respect to our US gas distribution assets, asset lives are assessed as part of detailed depreciation studies completed as part of each separate rate proceeding. Depreciation studies consider the physical condition of assets and the expected operational life of an asset. We believe these assessments are our best estimate of the UEL of our gas network assets in the US.
The weighted average remaining UEL for our US gas distribution fixed asset base is circa 58 years, however a sizeable proportion of our assets are assumed to have UELs which extend beyond 2080. We continue to believe the lives identified by rate proceedings are the best estimate of the assets’ UELs, although we continue to keep this assumption under review as we learn more about possible future pathways towards net zero. Whilst the targets, goals and ambitions have now been formalised in legislation in the states in which we operate, there is widespread recognition that work needs to be done to define the possible future decarbonisation pathways. We continue to actively engage and support our regulators to enable the clean energy transition in a safe, reliable and affordable way.
Asset depreciation lives feed directly into our US regulatory recovery mechanisms, such that any shortening of asset lives and regulatory recovery periods as agreed with regulators should be recoverable through future rates, subject to agreement, over future periods, as part of wider considerations around ensuring the continuing affordability of gas in our service territories.
Given the uncertainty described relating to the UELs of our gas assets, below we provide a sensitivity on the depreciation charge for our New York and New England segments were a shorter UEL presumed:
| | | | | | | | | | | | | | | | | |
| Increase in depreciation expense for the year ended 31 March 2022 | | Increase in depreciation expense for the year ended 31 March 20211 |
| New York
£m | New England
£m | | New York
£m | New England
£m |
| UELs limited to 2050 | 140 | | 40 | | | 125 | | 35 | |
| UELs limited to 2060 | 67 | | 15 | | | 57 | | 13 | |
| UELs limited to 2070 | 31 | | 1 | | | 26 | | 2 | |
| | | | | |
| | | | | |
| | | | | |
1. Comparative amounts have been re-presented to reflect the new operating segments and the classification of the UK Gas Transmission business as a discontinued operation. See notes 1, 2 and 10 for further information.
National Grid plc Annual Report and Accounts 2021/22 181
Notes to the consolidated financial statements continued
13. Property, plant and equipment continued
(c) Gas asset lives continued
Note that this sensitivity calculation excludes any assumptions regarding the residual value for our asset base and the effect that shortening asset depreciation lives would be expected to have on our regulatory recovery mechanisms. In the event that any of the US gas distribution assets are stranded, the Group would expect to recover the associated costs. While recovery is not guaranteed and is determined by regulators in the US, there are precedents for stranded asset cost recovery for US utility companies.
(d) Right-of-use assets
The Group leases various properties, land, equipment and cars. New lease arrangements entered into are recognised as a right-of-use asset and a corresponding liability at the date at which the leased asset is available for use by the Group. The right-of-use asset and associated lease liability arising from a lease are initially measured at the present value of the lease payments expected over the lease term. The lease payments include fixed payments, any variable lease payments dependent on an index or a rate, and any break fees or renewal option costs that we are reasonably certain to incur. The discount rate applied is the rate implicit in the lease or, if that is not available, then the incremental rate of borrowing for a similar term and similar security (which is determined based on observable data for borrowing rates for the specific group entity that has entered into the lease, with specific adjustments for the term of the lease and any lease-specific risk premium). The lease term takes account of exercising any extension options that are at our option if we are reasonably certain to exercise the option and any lease termination options unless we are reasonably certain not to exercise the option. Each lease payment is allocated between the liability and finance cost. The finance cost is charged to the income statement over the lease period using the effective interest rate method. The right-of-use asset is depreciated over the shorter of the asset’s useful life and the lease term on a straight-line basis. For short-term leases (lease term of 12 months or less) and leases of low-value assets (such as computers), the Group continues to recognise a lease expense on a straight-line basis.
The table below shows the movements in the net book value of right-of-use assets included within property, plant and equipment at 31 March 2022 and 31 March 2021, split by category. The associated lease liabilities are disclosed in note 21.
| | | | | | | | | | | | | | | | | |
| Land and
buildings
£m | Plant and
machinery
£m | Assets
in the
course of
construction
£m | Motor
vehicles
and office
equipment
£m | Total
£m |
| Net book value at 1 April 2020 | 364 | | 95 | | — | | 225 | | 684 | |
| Exchange adjustments | (30) | | (4) | | — | | (22) | | (56) | |
| Additions | 60 | | 6 | | — | | 64 | | 130 | |
| Reclassifications | — | | — | | — | | (15) | | (15) | |
| Depreciation charge for the year | (29) | | (16) | | — | | (68) | | (113) | |
| Net book value at 31 March 2021 | 365 | | 81 | | — | | 184 | | 630 | |
| Exchange adjustments | 10 | | 1 | | — | | 10 | | 21 | |
| Additions | 14 | | 2 | | — | | 88 | | 104 | |
| Acquisition of WPD (note 37) | 7 | | 2 | | — | | — | | 9 | |
| Reclassification to held for sale (note 10) | (7) | | — | | — | | (4) | | (11) | |
| Modifications of leases¹ | (122) | | — | | — | | — | | (122) | |
| Disposals | (2) | | — | | — | | (1) | | (3) | |
| Depreciation charge for the year | (40) | | (16) | | — | | (67) | | (123) | |
| Net book value at 31 March 2022 | 225 | | 70 | | — | | 210 | | 505 | |
1. The Group entered into an agreement to reduce the lease term of its New England corporate office, Reservoir Woods, with effect from October 2021. The existing lease liability and right-of-use asset have been remeasured based on the terms of the modified lease.
The following balances have been included in the income statement for the years ended 31 March 2022 and 31 March 2021 in respect of right-of-use assets:
| | | | | | | | | | | | | | | | | |
| | | | 2022 | 2021 |
| | | | £m | £m |
| Included within net finance income and costs: | | | | | |
| Interest expense on lease liabilities | | | | (18) | | (21) | |
| Included within revenue: | | | | | |
| Lease income¹ | | | | 385 | | 390 | |
| Included within operating expenses: | | | | | |
| Expense relating to short-term and low-value leases | | | | (14) | | (13) | |
| | | | | |
| | | | | |
| | | | | |
| | | | | |
1. Included within lease income is £374 million (2021: £376 million) of variable lease payments, the majority of which relates to the power supply arrangement entered into with LIPA (see note 3).
The total of future minimum sublease payments expected to be received under non-cancellable subleases is £108 million (2021: £104 million).
182 National Grid plc Annual Report and Accounts 2021/22
14. Other non-current assets
| | |
Other non-current assets include assets that do not fall into any other non-current asset category (such as goodwill or property, plant and equipment) where the benefit to be received from the asset is not due to be received until after 31 March 2023. |
| | | | | | | | |
| 2022 | 2021 |
| £m | £m |
| Other receivables | 110 | | 45 | |
| | |
| Non-current tax assets | 6 | | 6 | |
| Prepayments | — | | 5 | |
| Accrued income¹ | 187 | | 237 | |
| 303 | | 293 | |
1. Includes accrued income in relation to property sales to St William Homes LLP and other companies within The Berkeley Group. Following completion of the sale of St William Homes LLP on 15 March 2022, the outstanding accrued income due from St William Homes LLP became due from other companies within The Berkeley Group (see note 16).
15. Financial and other investments
| | |
The Group holds a range of financial and other investments. These investments include short-term money market funds, quoted investments in equities or bonds of other companies, investments in our venture capital portfolio (National Grid Partners), bank deposits with a maturity of greater than three months, and investments that can not be readily used in operations, principally collateral deposited in relation to derivatives. |
The classification of each investment held by the Group is determined based on two main factors:
•its contractual cash flows – whether the assets cash flows are solely payments of the principal and interest on the financial asset on pre-determined dates or whether the cash flows are determined by other factors such as the performance of a company; and
•the business model for holding the investments – whether the intention is to hold onto the investment for the longer term (collect the contractual cash flows), or to sell the asset with the intention of managing any gain or loss on sale or to manage any liquidity requirements.
The four categories of financial and other investments are as follows:
•Financial assets at amortised cost – debt instruments that have contractual cash flows that are solely payments of principal and interest, and which are held within a business model whose objective is to collect contractual cash flows, are held at amortised cost. This category includes our receivables in relation to deposits and collateral;
•FVOCI debt and other investments – debt investments, such as bonds, that have contractual cash flows that are solely payments of principal and interest, and which are held within a business model whose objective is both to collect the contractual cash flows and to sell the debt instruments, are measured at fair value through other comprehensive income (FVOCI), with gains or losses recognised in the consolidated statement of comprehensive income instead of through the income statement. On disposal, any gains or losses are recognised within finance income in the income statement (see note 6). Other investments include insurance contracts, measured at fair value, and held to back the present value of unfunded pension liabilities in note 25;
•FVOCI equity instruments – the Group previously held equity instruments which it elected to measure at FVOCI on the basis that they were not held for trading and so the recognition of any gains and losses on these investments in the income statement would not have been representative of performance. The shares were held as part of a portfolio of financial instruments which back some long-term employee liabilities. In the year ended 31 March 2022, the Group sold all of the remaining equities as part of a plan to de-risk that investment portfolio. The fair value of the equities on the date of sale was £111 million and upon disposal realised gains and losses of £82 million were transferred to retained earnings (see note 28); and
•FVTPL investments – other financial investments are subsequently measured at fair value with any gains or losses recognised in the income statement (FVTPL). This primarily comprises our money market funds, insurance company fund investments and corporate venture capital investments held by National Grid Partners.
Financial and other investments are initially recognised on trade date. Subsequent to initial recognition, the fair values of financial assets that are quoted in active markets are based on bid prices. When independent prices are not available, fair values are determined using valuation techniques used by the relevant markets using observable market data where possible (see note 32(g) for further details).
National Grid plc Annual Report and Accounts 2021/22 183
Notes to the consolidated financial statements continued
15. Financial and other investments continued
| | | | | | | | |
| 2022 | 2021 |
| £m | £m |
| Non-current | | |
| FVOCI debt and other investments | 413 | | 416 | |
| FVOCI equity investments¹ | — | | 99 | |
| FVTPL investments | 417 | | 240 | |
| | |
| 830 | | 755 | |
| Current | | |
| FVTPL investments | 2,292 | | 1,768 | |
| Financial assets at amortised cost | 853 | | 574 | |
| 3,145 | | 2,342 | |
| 3,975 | | 3,097 | |
| Financial and other investments include the following: | | |
| Investments in short-term money market funds | 1,936 | | 1,412 | |
| Investments held by National Grid Partners | 309 | | 136 | |
| Investments in Sunrun | 109 | | 103 | |
| Balances that are restricted or not readily used in operations: | | |
Collateral2 | 806 | | 540 | |
| Insurance company and non-qualified plan investments | 534 | | 589 | |
| | |
| | |
| | |
| | |
| Cash surrender value of life insurance policies | 234 | | 283 | |
| Other investments | 47 | | 34 | |
| 3,975 | | 3,097 | |
1. In the year ended 31 March 2022, the Group sold its equity investments which were previously held in relation to non-qualified pension plans in the US.
2. The collateral balance includes £802 million (2021: £480 million) of collateral placed with counterparties with whom we have entered into a credit support annex to the International Swaps and Derivatives Association (ISDA) Master Agreement and £4 million (2021: £18 million) of restricted amounts allocated for specific projects within the National Grid Electricity System Operator. In the year ended 31 March 2021, £42 million of the balance included collateral paid by operating companies as security deposits. In the current year this collateral has been replaced with letters of credit as permitted under the Connection and Use of System Code.
FVTPL and FVOCI investments are recorded at fair value. The carrying value of current financial assets at amortised cost approximates their fair values, primarily due to short-dated maturities. The exposure to credit risk at the reporting date is the fair value of the financial investments. For further information on our credit risk, refer to note 32(a).
For the purposes of impairment assessment, the investments in bonds are considered to be low risk as they are investment grade securities; life insurance policies are held with regulated insurance companies; and deposits, collateral receivable and other financial assets at amortised cost are investment grade. All financial assets held at FVOCI or amortised cost are therefore considered to have low credit risk and have an immaterial impairment loss allowance equal to 12-month expected credit losses.
In determining the expected credit losses for these assets, some or all of the following information has been considered: credit ratings, the financial position of counterparties, the future prospects of the relevant industries and general economic forecasts.
No FVOCI or amortised cost financial assets have had modified cash flows during the period. There has been no change in the estimation techniques or significant assumptions made during the year in assessing the loss allowance for these financial assets. There were no significant movements in the gross carrying value of financial assets during the year that contribute to changes in the loss allowance. No collateral is held in respect of any of the financial investments in the above table. No balances are more than 30 days past due, and no balances were written off during the year.
184 National Grid plc Annual Report and Accounts 2021/22
16. Investments in joint ventures and associates
| | |
Investments in joint ventures and associates represent businesses we do not control but over which we exercise joint control or significant influence. They are accounted for using the equity method. A joint venture is an arrangement established to engage in economic activity, which the Group jointly controls with other parties and has rights to a share of the net assets of the arrangement. An associate is an entity which is neither a subsidiary nor a joint venture, but over which the Group has significant influence. |
| | | | | | | | | | | | | | | | | | | | | | | |
| 2022 | | 2021 |
| Associates
£m | Joint
ventures
£m | Total
£m | | Associates £m | Joint ventures £m | Total £m |
| Share of net assets at 1 April | 229 | | 638 | | 867 | | | 341 | | 654 | | 995 | |
| Exchange adjustments | 6 | | 19 | | 25 | | | (22) | | (36) | | (58) | |
| Additions | 17 | | 469 | | 486 | | | 6 | | 75 | | 81 | |
| Share of post-tax results for the year | 43 | | 49 | | 92 | | | 30 | | 28 | | 58 | |
| Share of other comprehensive income of associates, net of tax | 1 | | — | | 1 | | | 1 | | — | | 1 | |
| Dividends received | (35) | | (123) | | (158) | | | (31) | | (49) | | (80) | |
| Disposals | — | | (50) | | (50) | | | — | | — | | — | |
| Other movements¹ | 16 | | (41) | | (25) | | | (96) | | (34) | | (130) | |
| Share of net assets at 31 March | 277 | | 961 | | 1,238 | | | 229 | | 638 | | 867 | |
1. Other movements relate to tax liabilities for US and certain UK associates and joint ventures which are borne by the Group and the elimination of profits arising from sales to the Group’s share of joint ventures. Within associates, the other movements in the year ended 31 March 2021 primarily relates to the reclassification of the Group’s investment in Sunrun from an investment in an associate to financial investments.
A list of joint ventures and associates including the name and proportion of ownership is provided in note 34. Transactions with and outstanding balances with joint ventures and associates are shown in note 31. The joint ventures and associates have no significant contingent liabilities to which the Group is exposed, and the Group has no significant contingent liabilities in relation to its interests in the joint ventures and associates. The Group has capital commitments of £714 million (2021: £141 million) in relation to joint ventures and associates.
On 15 March 2022, the Group disposed of its entire 50% interest in St William Homes LLP to The Berkeley Group for cash consideration of £413 million. The receipt of cash has been recognised within net cash used in investing activities within the cash flow statement. The Group recognised a gain on disposal of £228 million within Other operating income and costs and released to revenue deferred income of £189 million which related to deferred profits related to previous property sales to St William Homes LLP. The gain on disposal and the release of deferred income are both classified as exceptional in the year (see note 5).
The following table describes the Group’s material joint ventures and associates at 31 March 2022:
| | | | | | | | | | | |
| Joint venture | % stake | | |
BritNed Development Limited1 | 50 | % | | BritNed is a joint venture with the Dutch transmission system operator, TenneT, and operates the subsea electricity link between Great Britain and the Netherlands, commissioned in 2011. |
Nemo Link Limited1 | 50 | % | | Nemo is a joint venture with the Belgian transmission operator, Elia, and is a subsea electricity interconnector between Great Britain and Belgium, which became operational on 31 January 2019. |
| Emerald Energy Venture LLC | 51 | % | | Emerald is a joint venture with Washington State Investment Board and builds and operates wind and solar assets. Emerald was acquired on 11 July 2019. |
| Bight Wind Holdings LLC | 27.3 | % | | Bight Wind is a joint venture with RWE Renewables. Following the successful win at auction of six seabed leases in northeastern US on 25 February 2022, Bight Wind will commence the development of an offshore wind project which will play a key role in supplying clean energy to customers in New York. At 31 March 2022, the Group has an amount payable to Bight Wind of £223 million in respect of a capital call to the Group which is payable in April 2022. The assets, liabilities and results of Bight Wind will become material to the Group upon recognition of the seabed lease in the year ending 31 March 2023. |
| | | |
| Material associate | % stake | | |
Millennium Pipeline Company LLC | 26.25 | % | | Millennium Pipeline Company LLC is an associate that owns a natural gas pipeline from southern New York to the Lower Hudson Valley. |
1. BritNed and Nemo have reporting periods ending on 31 December with monthly management reporting information provided to National Grid.
National Grid plc Annual Report and Accounts 2021/22 185
Notes to the consolidated financial statements continued
16. Investments in joint ventures and associates continued
Summarised financial information as at 31 March, together with the carrying amount of material investments, is as follows:
| | | | | | | | | | | | | | | | | | | | | | | | | | | | | | | | | | | |
| BritNed Development
Limited | | Nemo Link Limited | | Emerald Energy
Venture LLC | | Millennium Pipeline Company LLC |
| 2022 | 2021 | | 2022 | 2021 | | 2022 | 2021 | | 2022 | 2021 |
| £m | £m | | £m | £m | | £m | £m | | £m | £m |
| Statement of financial position | | | | | | | | | | | |
| Non-current assets | 390 | | 409 | | | 515 | | 536 | | | 1,070 | | 559 | | | 800 | | 795 | |
| Cash and cash equivalents | 77 | | 47 | | | 7 | | 31 | | | 134 | | 112 | | | 33 | | 27 | |
| All other current assets | 10 | | 24 | | | 7 | | 8 | | | 8 | | 12 | | | 29 | | 24 | |
| Non-current liabilities | (52) | | (50) | | | (34) | | (30) | | | (182) | | (182) | | | (237) | | (256) | |
| Non-current financial liabilities | (29) | | (31) | | | — | | — | | | (310) | | (104) | | | — | | — | |
| Current liabilities | (15) | | (22) | | | (33) | | (19) | | | (66) | | (25) | | | (45) | | (38) | |
| Current financial liabilities | — | | — | | | — | | — | | | (23) | | (2) | | | — | | — | |
| Net assets | 381 | | 377 | | | 462 | | 526 | | | 631 | | 370 | | | 580 | | 552 | |
Group’s ownership interest
in joint venture/associate | 191 | | 189 | | | 231 | | 263 | | | 322 | | 189 | | | 152 | | 145 | |
Group adjustment: elimination
of profits on sales to joint venture | — | | — | | | — | | — | | | (49) | | (23) | | | — | | — | |
| Carrying amount of the Group’s investment | 191 | | 189 | | | 231 | | 263 | | | 273 | | 166 | | | 152 | | 145 | |
| | | | | | | | | | | | | | | | | | | | | | | | | | | | | | | | | | | |
| BritNed Development
Limited | | Nemo Link Limited | | Emerald Energy
Venture LLC | | Millennium Pipeline Company LLC |
| 2022 | 2021 | | 2022 | 2021 | | 2022 | 2021 | | 2022 | 2021 |
| £m | £m | | £m | £m | | £m | £m | | £m | £m |
| Income statement | | | | | | | | | | | |
| Revenue | 131 | | 72 | | | 148 | | 66 | | | 25 | | 28 | | | 200 | | 199 | |
| Depreciation and amortisation | (15) | | (15) | | | (23) | | (24) | | | (17) | | (14) | | | (43) | | (43) | |
| Other costs | (9) | | (15) | | | (6) | | (6) | | | (145) | | (22) | | | (20) | | (21) | |
| Operating profit/(loss) | 107 | | 42 | | | 119 | | 36 | | | (137) | | (8) | | | 137 | | 135 | |
| Net interest expense | (2) | | (1) | | | (1) | | — | | | (5) | | — | | | (21) | | (18) | |
| Profit/(loss) before tax | 105 | | 41 | | | 118 | | 36 | | | (142) | | (8) | | | 116 | | 117 | |
| Income tax expense | (20) | | (11) | | | (22) | | (14) | | | — | | — | | | — | | — | |
| Profit/(loss) for the year | 85 | | 30 | | | 96 | | 22 | | | (142) | | (8) | | | 116 | | 117 | |
| Group’s share of profit/(loss) | 43 | | 15 | | | 48 | | 11 | | | (72) | | (4) | | | 30 | | 31 | |
| Group adjustment: tax credit/(charge) | — | | — | | | — | | — | | | 19 | | 1 | | | (8) | | (9) | |
| Group’s share of post-tax results for the year | 43 | | 15 | | | 48 | | 11 | | | (53) | | (3) | | | 22 | | 22 | |
186 National Grid plc Annual Report and Accounts 2021/22
17. Derivative financial instruments
| | |
Derivatives are financial instruments that derive their value from the price of an underlying item such as interest rates, foreign exchange rates, credit spreads, commodities, equities or other indices. In accordance with policies approved by the Board, derivatives are transacted generally to manage exposures to fluctuations in interest rates, foreign exchange rates and commodity prices. Our derivatives balances comprise two broad categories: • financing derivatives: These are used to manage our exposure to interest rates and foreign exchange rates. Specifically, we use these derivatives to manage our financing portfolio, holdings in foreign operations and contractual operational cash flows; and • commodity contract derivatives: These are used to manage our US customers’ exposure to price and supply risks. Some forward contracts for the purchase of commodities meet the definition of derivatives. We also enter into derivative financial instruments linked to commodity prices, including index futures, options and swaps, which are used to manage market price volatility. |
Derivatives are initially recognised at fair value and subsequently remeasured to fair value at each reporting date. Changes in fair values are recorded in the period they arise, in either the consolidated income statement or other comprehensive income. Where the gains or losses recorded in the income statement arise from changes in the fair value of derivatives to the extent that hedge accounting is not applied or is not fully effective, these are recorded as remeasurements, detailed in notes 5 and 6. Where the fair value of a derivative is positive it is carried as a derivative asset, and where negative as a derivative liability.
The fair value of derivative financial instruments is calculated by taking the present value of future cash flows, primarily incorporating market observable inputs. The various inputs include foreign exchange spot and forward rates, yield curves of the respective currencies, currency basis spreads between the respective currencies, interest rate and inflation curves, the forward rate curves of underlying commodities, and for those positions that are not fully cash collateralised, the credit quality of the counterparties.
Certain clauses embedded in non-derivative financial instruments or other contracts are presented as derivatives because they impact the risk profile of their host contracts and they are deemed to have risks or rewards not closely related to those host contracts.
Further information on how derivatives are valued and used for risk management purposes is presented in note 32. Information on commodity contracts and other commitments not meeting the definition of derivatives is presented in note 30.
The fair values of derivatives by category are as follows:
| | | | | | | | | | | | | | | | | | | | | | | |
| 2022 | | 2021 |
| Assets
£m | Liabilities
£m | Total £m | | Assets £m | Liabilities £m | Total £m |
| Current | 282 | | (144) | | 138 | | | 457 | | (145) | | 312 | |
| Non-current | 305 | | (869) | | (564) | | | 542 | | (754) | | (212) | |
| 587 | | (1,013) | | (426) | | | 999 | | (899) | | 100 | |
| | | | | | | |
| Financing derivatives | 298 | | (991) | | (693) | | | 942 | | (767) | | 175 | |
| Commodity contract derivatives | 289 | | (22) | | 267 | | | 57 | | (132) | | (75) | |
| 587 | | (1,013) | | (426) | | | 999 | | (899) | | 100 | |
(a) Financing derivatives
The fair values of financing derivatives by type are as follows:
| | | | | | | | | | | | | | | | | | | | | | | |
| 2022 | | 2021 |
| Assets
£m | Liabilities
£m | Total £m | | Assets £m | Liabilities £m | Total £m |
| Interest rate swaps | 89 | | (97) | | (8) | | | 325 | | (159) | | 166 | |
| Cross-currency interest rate swaps | 174 | | (642) | | (468) | | | 601 | | (351) | | 250 | |
| Foreign exchange forward contracts¹ | 35 | | (65) | | (30) | | | 16 | | (74) | | (58) | |
| Inflation-linked swaps | — | | (187) | | (187) | | | — | | (183) | | (183) | |
| 298 | | (991) | | (693) | | | 942 | | (767) | | 175 | |
1. Included within the foreign exchange forward contracts balance are £21 million (2021: £32 million) of derivative liabilities in relation to the hedging of capital expenditure and a deal-contingent foreign exchange forward contract liability of £nil (2021: £9 million) in relation to the disposal of NECO (see note 10).
National Grid plc Annual Report and Accounts 2021/22 187
Notes to the consolidated financial statements continued
17. Derivative financial instruments continued
(a) Financing derivatives continued
The maturity profile of financing derivatives is as follows:
| | | | | | | | | | | | | | | | | | | | | | | |
| 2022 | | 2021 |
| Assets
£m | Liabilities
£m | Total
£m | | Assets £m | Liabilities £m | Total
£m |
| Current | | | | | | | |
| Less than 1 year | 34 | | (136) | | (102) | | | 428 | | (70) | | 358 | |
| 34 | | (136) | | (102) | | | 428 | | (70) | | 358 | |
| Non-current | | | | | | | |
| In 1 to 2 years | 6 | | (29) | | (23) | | | 10 | | (14) | | (4) | |
| In 2 to 3 years | 28 | | (39) | | (11) | | | 24 | | (12) | | 12 | |
| In 3 to 4 years | — | | (26) | | (26) | | | 62 | | (80) | | (18) | |
| In 4 to 5 years | 12 | | (16) | | (4) | | | 4 | | (42) | | (38) | |
| More than 5 years | 218 | | (745) | | (527) | | | 414 | | (549) | | (135) | |
| 264 | | (855) | | (591) | | | 514 | | (697) | | (183) | |
| 298 | | (991) | | (693) | | | 942 | | (767) | | 175 | |
The notional contract amounts of financing derivatives by type are as follows:
| | | | | | | | |
| 2022 | 2021 |
| £m | £m |
| Interest rate swaps | (1,607) | | (2,259) | |
| Cross-currency interest rate swaps | (10,397) | | (8,389) | |
| Foreign exchange forward contracts | (6,371) | | (4,651) | |
| Inflation-linked swaps | (500) | | (500) | |
| (18,875) | | (15,799) | |
London Inter-bank Offered Rate (LIBOR) is being replaced as an interest rate benchmark by alternative reference rates and therefore we are transitioning LIBOR cash flows on our affected contracts in line with the relevant jurisdictions. During the year we transitioned derivatives which pay or receive cash flows that reference GBP LIBOR (maturing between 2023 and 2040) to alternative reference rates (not transitioned in 2021: £2,041 million, maturing between 2023 and 2026). Derivatives with a notional value of £806 million that reference USD LIBOR (maturing between 2023 and 2026) are yet to be amended (2021: £769 million, maturing between 2023 and 2026).
(b) Commodity contract derivatives
The fair values of commodity contract derivatives by type are as follows:
| | | | | | | | | | | | | | | | | | | | | | | |
| 2022 | | 2021 |
| Assets
£m | Liabilities
£m | Total
£m | | Assets
£m | Liabilities £m | Total £m |
| Commodity purchase contracts accounted for as derivative contracts | | | | | | | |
| Forward purchases of gas | 11 | | (6) | | 5 | | | 44 | | (94) | | (50) | |
| Derivative financial instruments linked to commodity prices | | | | | | | |
| Electricity capacity | 1 | | — | | 1 | | | 2 | | — | | 2 | |
| Electricity swaps | 208 | | (10) | | 198 | | | 10 | | (33) | | (23) | |
| Electricity options | 5 | | — | | 5 | | | — | | (1) | | (1) | |
| Gas swaps | 29 | | (6) | | 23 | | | 1 | | (3) | | (2) | |
| Gas options | 35 | | — | | 35 | | | — | | (1) | | (1) | |
| 289 | | (22) | | 267 | | | 57 | | (132) | | (75) | |
188 National Grid plc Annual Report and Accounts 2021/22
17. Derivative financial instruments continued
(b) Commodity contract derivatives continued
The maturity profile of commodity contract derivatives is as follows:
| | | | | | | | | | | | | | | | | | | | | | | |
| 2022 | | 2021 |
| Assets
£m | Liabilities
£m | Total
£m | | Assets £m | Liabilities £m | Total £m |
| Current | | | | | | | |
| Less than one year | 248 | | (8) | | 240 | | | 29 | (75) | (46) |
| 248 | | (8) | | 240 | | | 29 | (75) | (46) |
| Non-current | | | | | | | |
| In 1 to 2 years | 34 | | (6) | | 28 | | | 7 | (24) | (17) |
| In 2 to 3 years | 5 | | (5) | | — | | | 7 | (16) | (9) |
| In 3 to 4 years | 2 | | (2) | | — | | | 7 | (7) | — |
| In 4 to 5 years | — | | (1) | | (1) | | | 6 | (5) | 1 |
| More than 5 years | — | | — | | — | | | 1 | (5) | (4) |
| 41 | | (14) | | 27 | | | 28 | (57) | (29) |
| 289 | | (22) | | 267 | | | 57 | (132) | (75) |
The notional quantities of commodity contract derivatives by type are as follows:
| | | | | | | | |
| 2022 | 2021 |
Forward purchases of gas1 | 28m Dth | 36m Dth |
| Electricity swaps | 13,458 GWh | 12,321 GWh |
| Gas swaps | 39m Dth | 47m Dth |
| Gas options | 59m Dth | 40m Dth |
1. Forward gas purchases have terms up to one year (2021: five years). The contractual obligations under these contracts are £86 million (2021: £104 million).
18. Inventories and current intangible assets
| | |
Inventories represent assets that we intend to use in order to generate revenue in the short term, either by selling the asset itself (for example, fuel stocks) or by using it to fulfil a service to a customer or to maintain our network (consumables). |
Inventories are stated at the lower of weighted average cost and net realisable value. Where applicable, cost comprises direct materials and direct labour costs as well as those overheads that have been incurred in bringing the inventories to their present location and condition.
Emission allowances, principally relating to the emissions of carbon dioxide in the UK and sulphur and nitrous oxides in the US, are recorded as intangible assets within current assets. They are initially recorded at cost and subsequently at the lower of cost and net realisable value. A liability is recorded in respect of the obligation to deliver emission allowances, and emission charges are recognised in the income statement in the period in which emissions are made.
| | | | | | | | |
| 2022 | 2021 |
| £m | £m |
| Fuel stocks | 96 | | 94 | |
| Raw materials and consumables | 297 | | 253 | |
| Current intangible assets – emission allowances | 118 | | 92 | |
| 511 | | 439 | |
There is a provision for obsolescence of £7 million against inventories as at 31 March 2022 (2021: £10 million).
National Grid plc Annual Report and Accounts 2021/22 189
Notes to the consolidated financial statements continued
19. Trade and other receivables
| | |
Trade and other receivables include amounts which are due from our customers for services we have provided, accrued income which has not yet been billed, prepayments, contract assets where certain milestones are required to be fulfilled and other receivables that are expected to be settled within 12 months. |
Trade and other receivables are initially recognised at fair value and subsequently measured at amortised cost, less any appropriate allowances for estimated irrecoverable amounts.
| | | | | | | | |
| 2022 | 2021 |
| £m | £m |
| Trade receivables | 2,661 | | 2,152 | |
| Accrued income | 1,110 | | 886 | |
| Provision for impairment of receivables and accrued income | (741) | | (672) | |
| Trade receivables and accrued income, net | 3,030 | | 2,366 | |
| Prepayments | 429 | | 387 | |
| Contract assets | 33 | | 13 | |
| Other receivables | 223 | | 153 | |
| 3,715 | | 2,919 | |
Trade receivables are non-interest-bearing and generally have an up to 60 days term. Due to their short maturities, the fair value of trade and other receivables approximates their carrying value. The maximum exposure of trade and other receivables to credit risk is the carrying amount reported on the balance sheet.
Provision for impairment of receivables
A provision for credit losses is recognised at an amount equal to the expected credit losses that will arise over the lifetime of the trade receivables and accrued income.
| | | | | | | | |
| 2022 | 2021 |
| £m | £m |
| At 1 April | 672 | | 512 | |
| Exchange adjustments | 31 | | (57) | |
| Charge for the year, net of recoveries | 167 | | 326 | |
| Uncollectible amounts written off | (124) | | (59) | |
| Reclassification to held for sale (note 10) | (5) | | (50) | |
| At 31 March | 741 | | 672 | |
The trade receivables balance, accrued income balance and provisions balance split by geography are as follows:
| | | | | | | | | | | | | | | | | | | | | | | |
| As at 31 March 2022 | | As at 31 March 2021 |
| UK | US | Total | | UK | US | Total |
| £m | £m | £m | | £m | £m | £m |
| Trade receivables | 352 | | 2,309 | | 2,661 | | | 227 | | 1,925 | | 2,152 | |
| Accrued income | 715 | | 395 | | 1,110 | | | 547 | | 339 | | 886 | |
| Provision for impairment of receivables and accrued income | (43) | | (698) | | (741) | | | (23) | | (649) | | (672) | |
| 1,024 | | 2,006 | | 3,030 | | | 751 | | 1,615 | | 2,366 | |
There are no retail customers in the UK businesses. A provision matrix is not used in the UK as an assessment of expected losses on individual debtors is performed, and the provision is not material.
In the US, £2,243 million (2021: £1,852 million) of the trade receivables and accrued income balance is attributable to retail customers. For non-retail US customer receivables, a provision matrix is not used and expected losses are determined on individual debtors.
The provision for retail customer receivables in the US is calculated based on a series of provision matrices which are prepared by regulated entity and by customer type. The expected loss rates in each provision matrix are based on historical loss rates adjusted for current and forecasted economic conditions at the balance sheet date. The inclusion of forward-looking information in the provision matrix setting process under IFRS 9 results in loss rates that reflect expected future economic conditions and the recognition of an expected loss on all debtors even where no loss event has occurred.
In March 2020, the Group’s US distribution businesses ceased certain customer cash collection activities in response to regulatory instructions and to changes in State, Federal and City level regulations and guidance, and actions to minimise risk to the Group’s employees as a result of COVID-19. At that time, the Group also ceased customer termination activities as requested by relevant local authorities. Collection and customer termination activities resumed in New England during the year ended 31 March 2022, where permitted. Whilst certain collection activities also resumed in New York in the year, we expect to resume full collection activities over the course of the next year. Collection activities have also been supported by certain government COVID funding programmes in both New England and New York.
In calculating our provision for impairment of receivables at 31 March 2022, we were able to incorporate the actual cash collection levels experienced for the two years since the start of the pandemic to determine the expected loss rates per category of outstanding receivable by operating company, which is summarised in the provision matrix shown below. Factored into our analysis are expected cash collections based on the resumed collection activities in New England and New York during the year.
190 National Grid plc Annual Report and Accounts 2021/22
19. Trade and other receivables continued
Based on our review, we recognised a charge of £139 million which represents our best estimate based on the information available. For the year ended 31 March 2021, we recognised a charge of £325 million due to the ongoing reduction of customer terminations and collections which were ceased in the preceding year and not fully recovered as at 31 March 2022. We based our review of certain macroeconomic factors at the time, including unemployment levels and our experience regarding debtor recoverability during and in the aftermath of the 2008/09 financial crisis.
The average expected loss rates and gross balances for the retail customer receivables in our US operations are set out below:
| | | | | | | | | | | | | | | | | |
| 2022 | | 2021 |
| % | £m | | % | £m |
| Accrued income | 5 | | 382 | | | 7 | | 322 | |
| 0 – 30 days past due | 5 | | 731 | | | 7 | | 580 | |
| 30 – 60 days past due | 20 | | 213 | | | 24 | | 155 | |
| 60 – 90 days past due | 32 | | 123 | | | 36 | | 108 | |
| 3 – 6 months past due | 41 | | 161 | | | 52 | | 140 | |
| 6 – 12 months past due | 56 | | 177 | | | 66 | | 180 | |
| Over 12 months past due | 71 | | 456 | | | 71 | | 367 | |
| | 2,243 | | | | 1,852 | |
US retail customer receivables are not collateralised. Trade receivables are written off when regulatory requirements are met. Write-off policies vary between jurisdictions as they are aligned with the local regulatory requirements, which differ between regulators. There were no significant amounts written off during the period that were still subject to enforcement action. Our internal definition of default is aligned with that of the individual regulators in each jurisdiction.
For further information on our wholesale and retail credit risk, refer to note 32(a).
20. Cash and cash equivalents
| | |
Cash and cash equivalents include cash balances, together with short-term investments with an original maturity of less than three months that are readily convertible to cash. |
Net cash and cash equivalents reflected in the cash flow statement are net of bank overdrafts, which are reported in borrowings. The carrying amounts of cash and cash equivalents and bank overdrafts approximate their fair values.
Cash at bank earns interest at floating rates based on daily bank deposit rates. Short-term deposits are made for periods varying between one day and three months, depending on the immediate cash requirements, and earn interest at the respective short-term deposit rates.
Cash and cash equivalents held in currencies other than sterling have been converted into sterling at year-end exchange rates. For further information on currency exposures, refer to note 32(c).
Cash and cash equivalents at 31 March 2022 include £14 million (2021: £12 million) that is restricted. The restricted cash balances include amounts required to be maintained for insurance purposes and cash balances that can only be used for low-carbon network fund projects.
| | | | | | | | |
| 2022 | 2021 |
| £m | £m |
| Cash at bank | 204 | | 117 | |
| Short-term deposits | — | | 40 | |
| Cash and cash equivalents | 204 | | 157 | |
National Grid plc Annual Report and Accounts 2021/22 191
Notes to the consolidated financial statements continued
21. Borrowings
| | |
We borrow money primarily in the form of bonds and bank loans. These are for a fixed term and may have fixed or floating interest rates or are linked to inflation indices. We use derivatives to manage risks associated with interest rates, inflation rates and foreign exchange. Lease liabilities are also included within borrowings. Our price controls and rate plans lead us to fund our networks within a certain ratio of debt to equity or regulatory asset value and, as a result, we have issued a significant amount of debt. As we continue to invest in our networks, the value of debt is expected to increase over time. To maintain a strong balance sheet and to allow us to access capital markets at commercially acceptable interest rates, we balance the amount of debt we issue with the value of our assets, and we take account of certain other metrics used by credit rating agencies. |
All borrowings are measured at amortised cost, with the exception of one current liability which was measured at fair value through profit and loss in order to eliminate a measurement mismatch. This current liability has now matured.
Borrowings, which include interest-bearing, zero-coupon and inflation-linked debt, overdrafts and collateral payable, are initially recorded at fair value. This normally reflects the proceeds received (net of direct issue costs for liabilities measured at amortised cost). Subsequently, borrowings are stated either: i) at amortised cost; or ii) at fair value though profit and loss. Where a borrowing is held at amortised cost, any difference between the proceeds after direct issue costs and the redemption value is recognised over the term of the borrowing in the income statement using the effective interest method. For the liability held at fair value through profit and loss, interest is calculated using the effective interest method.
Where a borrowing or liability is held at fair value, changes in the fair value of the borrowing due to changes in the issuer’s credit risk are recorded in the own credit reserve within equity (see note 28). All other changes in the fair value of the liability are recognised in the income statement within remeasurements (see notes 5 and 6).
| | | | | | | | |
| 2022 | 2021 |
| £m | £m |
| Current | | |
| Bank loans¹ | 8,976 | | 1,022 | |
| Bonds² | 1,735 | | 1,987 | |
| Commercial paper | 1,303 | | 628 | |
| Lease liabilities | 107 | | 99 | |
| Other loans | — | | 1 | |
| 12,121 | | 3,737 | |
| Non-current | | |
| Bank loans | 2,211 | | 2,532 | |
| Bonds | 30,682 | | 24,209 | |
| Lease liabilities | 451 | | 586 | |
| Other loans | — | | 156 | |
| 33,344 | | 27,483 | |
| Total borrowings | 45,465 | | 31,220 | |
1. Current bank loans include £8,179 million of borrowings under the bridge facility relating to the acquisition of WPD (31 March 2021: undrawn). The bridge facility allows for the extension of the maturity date up to September 2023 but includes a requirement that the proceeds of the planned sales of NECO and the UK Gas Transmission business are applied to repay the facility. As these are expected to completed within one year the position has been classified as current.
2. Includes a liability held at fair value through profit and loss of £nil (2021: £682 million).
192 National Grid plc Annual Report and Accounts 2021/22
21. Borrowings continued
Total borrowings are repayable as follows:
| | | | | | | | |
| 2022 | 2021 |
| £m | £m |
| Less than 1 year | 12,121 | | 3,737 |
| In 1 to 2 years | 1,410 | | 1,745 |
| In 2 to 3 years | 2,544 | | 889 |
| In 3 to 4 years | 2,580 | | 2,206 |
| In 4 to 5 years | 2,493 | | 1,833 |
| More than 5 years: | | |
| By instalments | 869 | | 927 |
| Other than by instalments | 23,448 | | 19,883 |
| 45,465 | | 31,220 |
The fair value of borrowings at 31 March 2022 was £45,624 million (2021: £34,676 million). Where market values were available, the fair value of borrowings (Level 1) was £24,454 million (2021: £20,333 million). Where market values were not available, the fair value of borrowings (Level 2) was £21,170 million (2021: £14,343 million), and calculated by discounting cash flows at prevailing interest rates. The notional amount outstanding of the debt portfolio at 31 March 2022 was £44,055 million (2021: £31,010 million). There have been no new issuances since the year end.
Collateral is placed with or received from any derivative counterparty where we have entered into a credit support annex to the ISDA Master Agreement once the current mark-to-market valuation of the trades between the parties exceeds an agreed threshold. Included in current bank loans is £60 million (2021: £582 million) in respect of cash received under collateral agreements. For further details of our borrowing facilities, refer to note 33. For further details of our bonds in issue, please refer to the debt investor section of our website. Unless included herein, the information on our website is unaudited.
Certain borrowings, primarily some of our USD denominated bank loans and company car lease contracts, have payments that are linked to LIBOR. LIBOR is being replaced as an interest rate benchmark by alternative reference rates and therefore we are transitioning LIBOR cash flows on our affected contracts in line with the relevant jurisdictions. The migration project is underway, with all affected contracts where we previously paid or received GBP LIBOR amended in the year to 31 March 2022. £314 million (2021: £328 million) of bank loans affected by GBP LIBOR have been transitioned to alternative reference rates. £181 million (2021: £173 million) of lease liabilities affected by USD LIBOR have been transitioned to alternative rates and £110 million (2021: £59 million) of bank loans affected by USD LIBOR have yet to be amended.
Financial liability at fair value through profit and loss
The financial liability was designated at fair value through profit and loss. Up until the date of maturity in November 2021, the liability was analysed as follows:
i. the fair value of the liability at maturity in November 2021 was £699 million (2021: £682 million), which included cumulative changes in fair value attributable to changes in credit risk recognised in other comprehensive income, post tax of £nil (2021: £1 million);
ii. the amount repayable at maturity in November 2021 was £699 million (2021: £684 million); and
iii. the difference between carrying amount and contractual amount at maturity was £nil (2021: £2 million).
This liability was reclassified in order to eliminate a measurement mismatch with derivatives which provide an economic hedge. The associated derivatives were collateralised and did not contain significant exposure to our own credit risk. The presentation of credit risk in other comprehensive income did not, therefore, create or enlarge an accounting mismatch in profit or loss.
The change in the fair value attributable to a change in credit risk was calculated as the difference between the total change in the fair value of the liability and the change in the value of the liability due to changes in market risk factors alone. The change in the fair value due to market risk factors was calculated using benchmark yield curves as at the end of the reporting period holding the credit risk margin constant. The fair value of the liability was calculated using observed market prices.
National Grid plc Annual Report and Accounts 2021/22 193
Notes to the consolidated financial statements continued
21. Borrowings continued
Lease liabilities
Lease liabilities are initially measured at the present value of the lease payments expected over the lease term. The discount rate applied is the rate implicit in the lease or if that is not available, then the incremental rate of borrowing for a similar term and similar security. The lease term takes account of exercising any extension options that are at our option if we are reasonably certain to exercise the option and any lease termination options unless we are reasonably certain not to exercise the option. Each lease payment is allocated between the liability and finance cost. The finance cost is charged to the income statement over the lease period using the effective interest rate method.
| | | | | | | | |
| 2022 | 2021 |
| £m | £m |
| Gross lease liabilities are repayable as follows: | | |
| Less than 1 year | 132 | | 114 | |
| 1 to 5 years | 282 | | 321 | |
| More than 5 years | 259 | | 464 | |
| 673 | | 899 | |
| Less: finance charges allocated to future periods | (115) | | (214) | |
| 558 | | 685 | |
| The present value of lease liabilities are as follows: | | |
| Less than 1 year | 107 | | 99 | |
| 1 to 5 years | 247 | | 267 | |
| More than 5 years | 204 | | 319 | |
| 558 | | 685 | |
22. Trade and other payables
| | |
Trade and other payables include amounts owed to suppliers, tax authorities and other parties which are due to be settled within 12 months. The total also includes deferred amounts, some of which represent monies received from customers but for which we have not yet delivered the associated service. These amounts are recognised as revenue when the service is provided. |
Trade and other payables are initially recognised at fair value and subsequently measured at amortised cost, with the exception of contingent consideration, which is subsequently measured at fair value.
| | | | | | | | |
| 2022 | 2021 |
| £m | £m |
| Trade payables | 3,113 | | 2,165 | |
| Deferred payables | 487 | | 154 | |
| Customer contributions¹ | 137 | | 138 | |
| Social security and other taxes | 278 | | 140 | |
| Contingent consideration | 34 | | 39 | |
| Other payables | 866 | | 881 | |
| 4,915 | | 3,517 | |
1. Relates to amounts received from government-related entities for connecting to our networks, where we have obligations remaining under the contract.
Due to their short maturities, the fair value of trade payables approximates their carrying value.
194 National Grid plc Annual Report and Accounts 2021/22
23. Contract liabilities
| | |
Contract liabilities primarily relate to the advance consideration received from customers for construction contracts, mainly in relation to connections, for which revenue is recognised over the life of the asset. |
| | | | | | | | |
| 2022 | 2021 |
| £m | £m |
| Current | 130 | | 66 | |
| Non-current | 1,342 | | 1,094 | |
| 1,472 | | 1,160 | |
Significant changes in the contract liabilities balances during the period are as follows:
| | | | | | | | |
| 2022 | 2021 |
| £m | £m |
| As at 1 April | 1,160 | | 1,158 | |
| Exchange adjustments | 29 | | (65) | |
| Revenue recognised that was included in the contract liability balance at the beginning of the period | (53) | | (96) | |
| Increases due to cash received, excluding amounts recognised as revenue during the period | 510 | | 262 | |
| | |
| Reclassification to held for sale (note 10) | (174) | | (99) | |
| At 31 March | 1,472 | | 1,160 | |
24. Other non-current liabilities
| | |
Other non-current liabilities include deferred income and customer contributions which will not be recognised as income until after 31 March 2023. It also includes contingent consideration and other payables that are not due until after that date. |
Other non-current liabilities are initially recognised at fair value and subsequently measured at amortised cost, with the exception of contingent consideration, which is subsequently measured at fair value.
| | | | | | | | |
| 2022 | 2021 |
| £m | £m |
| Deferred income¹ | 41 | | 78 | |
| Customer contributions² | 421 | | 400 | |
| Contingent consideration | 7 | | 18 | |
| Other payables | 336 | | 347 | |
| 805 | | 843 | |
1. In the year ended 31 March 2021, principally the deferral of profits relating to the sale of property to St William Homes LLP, which were expected to be recognised in future years. In the year ended 31 March 2022, the Group disposed of its interests in St William Homes LLP, resulting in a release of previously deferred profits (see note 16).
2. Relates to amounts received from government-related entities for connecting to our networks, where we have obligations remaining under the contract.
There is no material difference between the fair value and the carrying value of other payables.
National Grid plc Annual Report and Accounts 2021/22 195
Notes to the consolidated financial statements continued
25. Pensions and other post-retirement benefits
| | |
| All of our employees are eligible to participate in a pension plan. We have defined contribution (DC) and defined benefit (DB) pension plans in the UK and the US. In the US we also provide healthcare and life insurance benefits to eligible employees, post-retirement. The fair value of associated plan assets and present value of DB obligations are updated annually in accordance with IAS 19 ‘Employee Benefits’. We separately present our UK and US pension plans to show the geographical split. Below we provide a more detailed analysis of the amounts recorded in the primary financial statements and the actuarial assumptions used to value the DB obligations. |
UK pension plans
Defined contribution plan
Employees of National Grid’s legacy UK businesses are eligible to join the National Grid UK Retirement Plan (NGUKRP), a section of a Master Trust arrangement managed by Legal & General. National Grid pays contributions into the NGUKRP to provide DC benefits on behalf of its employees, generally providing a double match of member contributions up to a maximum Company contribution of 12% of salary. Additionally, WPD operates a DC pension plan (WPPS) which includes three separate DC sections. Two of the DC sections are closed with no active members at 31 March 2022. There is also an open section, available to all new WPD employees.
These plans are defined contribution in nature and are designed to provide members with a pension pot for their retirement. As such, investment risks are borne by the member and there is no legal or constructive obligation on National Grid to pay additional contributions in the instance that investment performance is poor. Payments to these DC plans are charged as an expense as they fall due.
Defined benefit plans
National Grid operates various DB pension plans in the UK. These include two legally separate sections of the National Grid UK Pension Scheme (Section A and Section B of NGUKPS), three sections of the industry-wide Electricity Supply Pension Scheme (ESPS) and a legacy scheme (WPUPS). During the year, following National Grid’s announcement of its intention to sell its Gas Transmission and Metering businesses, Section B of NGUKPS was reallocated as held for sale. Each of these plans holds its assets in separate Trustee administered funds. The arrangements are managed by Trustee companies with boards consisting of company- and member-appointed directors. These plans are all closed to new members except for the ESPS schemes in very rare circumstances.
The arrangements are subject to independent actuarial funding valuations every three years, and following consultation and agreement with the Company, the qualified actuary certifies the employers’ contributions, which, together with the specified contributions payable by the employees and proceeds from the plans’ assets, are expected to be sufficient to fund the benefits payable. The latest full actuarial valuations for each of the DB plans were carried out at 31 March 2019, with the Company agreeing to fund the assessed funding shortfalls for the UK DB plans that were in deficit via recovery plan payments scheduled to finish in November 2024 or earlier, with payments of approximately £130 million across all plans still due to be paid. Separately, National Grid continues to fund the cost of future benefit accrual (over and above member contributions) for each of the DB schemes. In the year to March 2022, the aggregate level of ongoing contributions (excluding recovery plan payments) was £83 million (2021: £50 million; 2020: £70 million). National Grid also pays contributions in respect of the costs of plan administration and the Pension Protection Fund (PPF) levies for most of its DB plans.
In addition, for some plans the Company has also agreed to establish security arrangements with charges in favour of the Trustee. The value of security provided across National Grid’s DB plans was £286 million at 31 March 2022, all of which is currently provided in the form of surety bonds but may also be provided as letters of credit or cash. The assets held as security will be paid to the respective section or plan in the event that the relevant supporting employer is subject to an insolvency event or fails to make the required contributions; and applicable to NGEG of ESPS only, if NGET loses its licence to operate under relevant legislation. Counter indemnities have also been taken out to ensure the obligations will be fulfilled. In addition, further cash payments of up to a maximum of £675 million could also become due if certain trigger events occur which have been individually agreed between the plans and their relevant supporting employers.
A guarantee has also been provided to Section A of NGUKPS, with the payment contingent on insolvency or on failure to pay pension obligations to Section A and can be claimed against National Grid plc, National Grid Holdings One plc or Lattice Group Limited.
US pension plans
The US pension plans are governed by a fiduciary committee called the Retirement Plan Committee (RPC). The RPC is structured in accordance with US laws governing retirement plans under the Employee Retirement Income Security Act and comprises appointed employees of the Company.
Defined contribution plans
National Grid has a DC pension plan which allows employee as well as Company contributions. Non-union employees hired after 1 January 2011, as well as most new hire represented union employees, receive a core contribution into the DC plan ranging from 3% to 9% of salary, irrespective of the employee’s contribution into the plan. Most employees also receive a matching contribution that varies between 25% and 50% of employee contributions up to a maximum of 8% to 10%. The assets of the plans are held in trusts and administered by the RPC.
Defined benefit plans
National Grid sponsors four non-contributory qualified DB pension plans, which provide vested union employees, and vested non-union employees hired before 1 January 2011, with retirement benefits within prescribed limits as defined by the US Internal Revenue Service. National Grid also provides non-qualified DB pension arrangements for a section of current and former employees, which are closed to new entrants. Benefits under the DB plans generally reflect age, years of service and compensation, and are paid in the form of an annuity or lump sum. An independent actuary performs valuations annually. The Company funds the DB plans by contributing no less than the minimum amount required, but no more than the maximum tax-deductible amount allowed under US Internal Revenue Service regulations. The range of contributions determined under these regulations can vary significantly depending upon the funded status of the plans. At present, there is some flexibility in the amount that is contributed on an annual basis. In general, the Company’s policy for funding the US pension plans is to contribute the amounts collected in rates and capitalised in the rate base during the year, to the extent that the funding is no less than the minimum amount required. For the current financial year, these contributions amounted to approximately £116 million (2021: £110 million).
196 National Grid plc Annual Report and Accounts 2021/22
25. Pensions and other post-retirement benefits continued
US other post-retirement benefits
National Grid provides healthcare and life insurance benefits to eligible employees, post-retirement. Eligibility is based on certain age and length of service requirements and, in most cases, retirees contribute to the cost of their healthcare coverage. In the US, there is no governmental requirement to pre-fund post-retirement healthcare and life insurance plans. However, in general, the Company’s policy for funding the US retiree healthcare and life insurance plans is to contribute amounts collected in rates and capitalised in the rate base during the year. For the current financial year, these contributions amounted to £17 million (2021: £26 million).
For the last few years it has been the Company’s policy to primarily direct contributions to the DB pension plans due to concerns over tax deductible limitations relating to the retiree and healthcare and life insurance plans.
Actuarial assumptions
On retirement, members of DB plans receive benefits whose value is dependent on factors such as salary and length of pensionable service. National Grid’s obligation in respect of DB pension plans is calculated separately for each DB plan by projecting the estimated amount of future benefit payments that employees have earned for their pensionable service in the current and prior periods. These future benefit payments are discounted to determine the present value of the liabilities. Current service cost and any unrecognised past service cost are recognised immediately.
Advice is taken from independent actuaries relating to the appropriateness of the key assumptions applied, including life expectancy, expected salary and pension increases, and inflation. Comparatively small changes in the assumptions used may have a significant effect on the amounts recognised in the consolidated income statement, the consolidated statement of other comprehensive income and the net liability recognised in the consolidated statement of financial position. Remeasurements of pension assets and post-retirement benefit obligations are recognised in full in the period in which they occur in the consolidated statement of other comprehensive income.
The Company has applied the following financial assumptions in assessing DB liabilities:
| | | | | | | | | | | | | | | | | | | | | | | | | | | | | | | | | | | |
| UK pensions | | US pensions | | US other post-retirement benefits |
| 2022 | 2021 | 2020 | | 2022 | 2021 | 2020 | | 2022 | 2021 | 2020 |
| % | % | % | | % | % | % | | % | % | % |
| Discount rate – past service | 2.78 | | 2.00 | | 2.35 | | | 3.65 | | 3.25 | | 3.30 | | | 3.65 | | 3.25 | | 3.30 | |
| Discount rate – future service | 2.85 | | 2.15 | | 2.35 | | | 3.65 | | 3.25 | | 3.30 | | | 3.65 | | 3.25 | | 3.30 | |
| Rate of increase in RPI – past service | 3.60 | | 3.15 | | 2.65 | | | n/a | n/a | n/a | | n/a | n/a | n/a |
| Rate of increase in RPI – future service | 3.33 | | 3.00 | | 2.45 | | | n/a | n/a | n/a | | n/a | n/a | n/a |
| Salary increases | 3.47 | | 3.40 | | 2.90 | | | 4.60 | | 4.30 | | 3.50 | | | 4.60 | | 4.30 | | 3.50 | |
| Initial healthcare cost trend rate | n/a | n/a | n/a | | n/a | n/a | n/a | | 6.80 | | 7.10 | | 7.00 | |
| Ultimate healthcare cost trend rate | n/a | n/a | n/a | | n/a | n/a | n/a | | 4.50 | | 4.50 | | 4.50 | |
For UK pensions, single equivalent financial assumptions are shown above for presentational purposes, although full yield curves have been used in our calculations. The discount rate is determined by reference to high-quality UK corporate bonds at the reporting date. The rate of increase in salaries has been set using a promotional scale where appropriate. The rates of increases stated are not indicative of historical increases awarded or a guarantee of future increase, but merely an appropriate assumption used in assessing DB liabilities. Retail Price Index (RPI) is the key assumption that determines assumed increases in pensions in payment and deferment in the UK only.
Discount rates for US pension liabilities have been determined by reference to appropriate yields on high-quality US corporate bonds at the reporting date based on the duration of plan liabilities. The healthcare cost trend rate is expected to reach the ultimate trend rate by 2031 (2021: 2030).
The table below sets out the projected life expectancies adopted for the UK and US pension arrangements:
| | | | | | | | | | | | | | | | | | | | | | | |
| UK pensions | | US pensions |
| 2022 | 2021 | 2020 | | 2022 | 2021 | 2020 |
| years | years | years | | years | years | years |
| Assumed life expectations for a retiree age 65 | | | | | | | |
| Males | 22.0 | 21.8 | 22.1 | | 21.4 | 21.6 | 20.9 |
| Females | 23.8 | 23.7 | 23.8 | | 23.6 | 24.0 | 23.4 |
| In 20 years: | | | | | | | |
| Males | 23.2 | 23.1 | 23.3 | | 23.1 | 23.2 | 22.5 |
| Females | 25.2 | 25.2 | 25.3 | | 25.3 | 25.5 | 25.1 |
The weighted average duration of the DB obligation for each category of plan is 14 years for UK pension plans; 13 years for US pension plans and
15 years for US other post-retirement benefit plans. The table below summarises the split of DB obligations by status for each category of plan, with comparative figures for 2021.
| | | | | | | | | | | | | | | | | | | | | | | | | | |
| UK pensions | | US pensions | | US other
post-retirement benefits |
| 2022 | 2021 | | 2022 | 2021 | | 2022 | 2021 |
| % | % | | % | % | | % | % |
| Active members | 16 | | 8 | | | 36 | | 35 | | | 34 | | 34 | |
| Deferred members | 10 | | 14 | | | 9 | | 9 | | | — | | — | |
| Pensioner members | 74 | | 78 | | | 55 | | 56 | | | 66 | | 66 | |
For sensitivity analysis see note 35.
National Grid plc Annual Report and Accounts 2021/22 197
Notes to the consolidated financial statements continued
25. Pensions and other post-retirement benefits continued
Amounts recognised in the consolidated statement of financial position
| | | | | | | | |
| 2022 | 2021 |
| £m | £m |
| Present value of funded obligations | (23,541) | | (23,283) | |
| Fair value of plan assets | 27,013 | | 24,388 | |
| 3,472 | | 1,105 | |
| Present value of unfunded obligations | (326) | | (324) | |
| Other post-employment liabilities | (71) | | (66) | |
| Net defined benefit asset/(liability) | 3,075 | | 715 | |
| Represented by: | | |
| Liabilities | (810) | | (1,032) | |
| Assets | 3,885 | | 1,747 | |
| 3,075 | | 715 | |
The geographical split of pensions and other post-retirement benefits is as shown below:
| | | | | | | | | | | | | | | | | | | | | | | | | | | | | | | | | | | |
| UK pensions | | US pensions | | US other
post-retirement benefits | | Total |
| 2022 | 2021 | | 2022 | 2021 | | 2022 | 2021 | | 2022 | 2021 |
| £m | £m | £m | £m | £m | £m | | £m | £m |
| Present value of funded obligations | (14,197) | | (13,571) | | | (6,531) | | (6,681) | | | (2,813) | | (3,031) | | | (23,541) | | (23,283) | |
| Fair value of plan assets | 16,865 | | 14,680 | | | 7,263 | | 6,909 | | | 2,885 | | 2,799 | | | 27,013 | | 24,388 | |
| 2,668 | | 1,109 | | | 732 | | 228 | | | 72 | | (232) | | | 3,472 | | 1,105 | |
| Present value of unfunded obligations | (78) | | (74) | | | (248) | | (250) | | | — | | — | | | (326) | | (324) | |
| Other post-employment liabilities | — | | — | | | — | | — | | | (71) | | (66) | | | (71) | | (66) | |
| Net defined benefit asset/(liability) | 2,590 | | 1,035 | | | 484 | | (22) | | | 1 | | (298) | | | 3,075 | | 715 | |
| Represented by: | | | | | | | | | | | |
| Liabilities | (78) | | (74) | | | (248) | | (393) | | | (484) | | (565) | | | (810) | | (1,032) | |
| Assets | 2,668 | | 1,109 | | | 732 | | 371 | | | 485 | | 267 | | | 3,885 | | 1,747 | |
| 2,590 | | 1,035 | | | 484 | | (22) | | | 1 | | (298) | | | 3,075 | | 715 | |
The recognition of the pension assets in the UK and in the US reflects legal and actuarial advice that we have taken regarding recognition of surpluses under IFRIC 14. In the UK, the Group has an unconditional right to a refund in the event of a winding up. In the US, surplus assets of a Plan may be used to pay for future benefits expected to be earned under that Plan.
198 National Grid plc Annual Report and Accounts 2021/22
25. Pensions and other post-retirement benefits continued
Amounts recognised in the income statement and statement of other comprehensive income
The expense or income arising from all Group retirement benefit arrangements recognised in the Group income statements is shown below:
| | | | | | | | | | | |
| 2022 | 2021 | 2020 |
| £m | £m | £m |
| Included within operating costs | | | |
| Administration costs | 20 | | 18 | | 16 | |
| Included within payroll costs | | | |
| Defined benefit plan costs: | | | |
| Current service cost | 223 | | 175 | | 178 | |
| Past service cost – augmentations | 1 | | — | | — | |
| Past service cost/(credit) – redundancies | 1 | | (1) | | — | |
| Special termination benefit cost – redundancies | 9 | | 5 | | 2 | |
| | | |
| 234 | | 179 | | 180 | |
| Included within finance income and costs | | | |
| Net interest (income)/cost | (2) | | 38 | | 23 | |
| Total included in income statement¹ | 252 | | 235 | | 219 | |
Remeasurement gains/(losses) of pension assets and post-retirement benefit obligations2 | 2,481 | | 1,408 | | (724) | |
| Exchange adjustments | 7 | | 186 | | (97) | |
| Total included in the statement of other comprehensive income³ | 2,488 | | 1,594 | | (821) | |
1. Amounts shown in the table above include operating costs of £4 million (2021: £3 million; 2020: £4 million); payroll costs of £10 million (2021: £10 million; 2020: £10 million); and net interest income of £2 million (2021: £13 million; 2020: £11 million) presented within profit from discontinued operations. These amounts all relate to UK pensions.
2. For the year ended 31 March 2021, this included actuarial losses from the purchase of buy-in policies of £0.1 billion.
3. Amounts shown in the table above include remeasurements of pension assets and post-retirement benefit obligations resulting in a gain of £309 million (2021: £250 million loss; 2020: £58 million gain) presented within discontinued operations. These amounts all relate to UK pensions.
The geographical split of pensions and other post-retirement benefits is shown below:
| | | | | | | | | | | | | | | | | | | | | | | | | | | | | | | | | | | |
| UK pensions | | US pensions | | US other post-retirement benefits |
| 2022 | 2021 | 2020 | | 2022 | 2021 | 2020 | | 2022 | 2021 | 2020 |
| £m | £m | £m | | £m | £m | £m | | £m | £m | £m |
| Included within operating costs | | | | | | | | | | | |
| Administration costs | 11 | | 9 | | 9 | | | 7 | | 7 | | 6 | | | 2 | | 2 | | 1 | |
| Included within payroll costs | | | | | | | | | | | |
| Defined benefit plan costs: | | | | | | | | | | | |
| Current service cost | 83 | | 28 | | 33 | | | 101 | | 104 | | 100 | | | 39 | | 43 | | 45 | |
| Past service cost – augmentations | 1 | | — | | — | | | — | | — | | — | | | — | | — | | — | |
| Past service cost/(credit) – redundancies | 1 | | (1) | | — | | | — | | — | | — | | | — | | — | | — | |
| Special termination benefit cost – redundancies | 9 | | 5 | | 2 | | | — | | — | | — | | | — | | — | | — | |
| | | | | | | | | | | |
| 94 | | 32 | | 35 | | | 101 | | 104 | | 100 | | | 39 | | 43 | | 45 | |
| Included within finance income and costs | | | | | | | | | | | |
| Net interest (income)/cost | (7) | | (38) | | (31) | | | — | | 35 | | 21 | | | 5 | | 41 | | 33 | |
| Total included in income statement | 98 | | 3 | | 13 | | | 108 | | 146 | | 127 | | | 46 | | 86 | | 79 | |
Remeasurement gains/(losses) of pension assets and post-retirement benefit obligations1 | 1,577 | | (622) | | 143 | | | 532 | | 1,017 | | (588) | | | 372 | | 1,013 | | (279) | |
| Exchange adjustments | — | | — | | — | | | 11 | | 83 | | (42) | | | (4) | | 103 | | (55) | |
| Total included in the statement of other comprehensive income | 1,577 | | (622) | | 143 | | | 543 | | 1,100 | | (630) | | | 368 | | 1,116 | | (334) | |
1. For the year ended 31 March 2021, UK pensions is stated after actuarial losses from the purchase of buy-in policies of £0.1 billion.
National Grid plc Annual Report and Accounts 2021/22 199
Notes to the consolidated financial statements continued
25. Pensions and other post-retirement benefits continued
Reconciliation of the net defined benefit asset/(liability)
| | | | | | | | | | | | | | | | | | | | | | | | | | | | | | | | | | | |
| UK pensions | | US pensions | | US other
post-retirement benefits | | Total |
| 2022 | 2021 | | 2022 | 2021 | | 2022 | 2021 | | 2022 | 2021 |
| £m | £m | | £m | £m | | £m | £m | | £m | £m |
| Opening net defined benefit asset/(liability) | 1,035 | | 1,520 | | | (22) | | (1,113) | | | (298) | | (1,360) | | | 715 | | (953) | |
| Cost recognised in the income statement (including discontinued operations) | (98) | | (3) | | | (108) | | (146) | | | (46) | | (86) | | | (252) | | (235) | |
| Remeasurement and foreign exchange effects recognised in the statement of other comprehensive income | 1,577 | | (622) | | | 543 | | 1,100 | | | 368 | | 1,116 | | | 2,488 | | 1,594 | |
| Employer contributions | 167 | | 138 | | | 116 | | 110 | | | 17 | | 26 | | | 300 | | 274 | |
| Other movements | 7 | | 2 | | | — | | — | | | (29) | | (16) | | | (22) | | (14) | |
| Acquisition of WPD (note 37) | 566 | | — | | | — | | — | | | — | | — | | | 566 | | — | |
| Reclassification to held for sale (note 10) | (664) | | — | | | (45) | | 27 | | | (11) | | 22 | | | (720) | | 49 | |
| Closing net defined benefit asset/(liability) | 2,590 | | 1,035 | | | 484 | | (22) | | | 1 | | (298) | | | 3,075 | | 715 | |
Changes in the present value of defined benefit obligations (including unfunded obligations)
The table below shows the movement in defined benefit obligations across our DB plans over the year.
| | | | | | | | | | | | | | | | | | | | | | | | | | | | | | | | | | | |
| UK pensions | | US pensions | | US other
post-retirement benefits | | Total |
| 2022 | 2021 | | 2022 | 2021 | | 2022 | 2021 | | 2022 | 2021 |
| £m | £m | | £m | £m | | £m | £m | | £m | £m |
| Opening defined benefit obligations | (13,645) | | (12,844) | | | (6,931) | | (8,085) | | | (3,031) | | (3,697) | | | (23,607) | | (24,626) | |
| Current service cost | (83) | | (28) | | | (101) | | (104) | | | (39) | | (43) | | | (223) | | (175) | |
| Interest cost | (88) | | (296) | | | (240) | | (243) | | | (100) | | (112) | | | (428) | | (651) | |
| Actuarial (losses)/gains – experience | (627) | | (21) | | | (24) | | (72) | | | 107 | | 216 | | | (544) | | 123 | |
| Actuarial gains/(losses) – demographic assumptions | 133 | | (1) | | | 100 | | — | | | 71 | | — | | | 304 | | (1) | |
| Actuarial gains/(losses) – financial assumptions | 1,387 | | (1,181) | | | 329 | | (62) | | | 192 | | (25) | | | 1,908 | | (1,268) | |
| Past service (cost)/credit – redundancies | (1) | | 1 | | | — | | — | | | — | | — | | | (1) | | 1 | |
| Special termination benefit cost – redundancies | (9) | | (5) | | | — | | — | | | — | | — | | | (9) | | (5) | |
| Past service cost – augmentations | (1) | | — | | | — | | — | | | — | | — | | | (1) | | — | |
| | | | | | | | | | | |
| Medicare subsidy received | — | | — | | | — | | — | | | (24) | | (25) | | | (24) | | (25) | |
| Employee contributions | (8) | | (1) | | | — | | — | | | — | | — | | | (8) | | (1) | |
| Benefits paid | 919 | | 731 | | | 403 | | 371 | | | 159 | | 144 | | | 1,481 | | 1,246 | |
| Exchange adjustments | — | | — | | | (327) | | 804 | | | (140) | | 362 | | | (467) | | 1,166 | |
| Acquisition of WPD | (7,096) | | — | | | — | | — | | | — | | — | | | (7,096) | | — | |
| Reclassification to held for sale | 4,844 | | — | | | 12 | | 460 | | | (8) | | 149 | | | 4,848 | | 609 | |
| Closing defined benefit obligations | (14,275) | | (13,645) | | | (6,779) | | (6,931) | | | (2,813) | | (3,031) | | | (23,867) | | (23,607) | |
200 National Grid plc Annual Report and Accounts 2021/22
25. Pensions and other post-retirement benefits continued
Changes in the value of plan assets
The table below shows the movement in pension assets across our DB plans over the year.
| | | | | | | | | | | | | | | | | | | | | | | | | | | | | | | | | | | |
| UK pensions | | US pensions | | US other
post-retirement benefits | | Total |
| 2022 | 2021 | | 2022 | 2021 | | 2022 | 2021 | | 2022 | 2021 |
| £m | £m | | £m | £m | | £m | £m | | £m | £m |
| Opening fair value of plan assets | 14,680 | | 14,364 | | | 6,909 | | 6,972 | | | 2,799 | | 2,412 | | | 24,388 | | 23,748 | |
| Interest income | 95 | | 334 | | | 240 | | 208 | | | 95 | | 71 | | | 430 | | 613 | |
Return on plan assets in excess of interest1 | 684 | | 581 | | | 127 | | 1,151 | | | 2 | | 822 | | | 813 | | 2,554 | |
| Administration costs | (11) | | (9) | | | (7) | | (7) | | | (2) | | (2) | | | (20) | | (18) | |
| Employer contributions | 167 | | 138 | | | 116 | | 110 | | | 17 | | 26 | | | 300 | | 274 | |
| Employee contributions | 8 | | 1 | | | — | | — | | | — | | — | | | 8 | | 1 | |
| Benefits paid | (912) | | (729) | | | (403) | | (371) | | | (159) | | (144) | | | (1,474) | | (1,244) | |
| Exchange adjustments | — | | — | | | 338 | | (721) | | | 136 | | (259) | | | 474 | | (980) | |
| Acquisition of WPD | 7,662 | | — | | | — | | — | | | — | | — | | | 7,662 | | — | |
| Reclassification to held for sale | (5,508) | | — | | | (57) | | (433) | | | (3) | | (127) | | | (5,568) | | (560) | |
| Closing fair value of plan assets | 16,865 | | 14,680 | | | 7,263 | | 6,909 | | | 2,885 | | 2,799 | | | 27,013 | | 24,388 | |
| Actual return on plan assets | 779 | | 915 | | | 367 | | 1,359 | | | 97 | | 893 | | | 1,243 | | 3,167 | |
Expected contributions to plans
in the following year | 146 | | 93 | | | 74 | | 113 | | | 14 | | 6 | | | 234 | | 212 | |
1. For the year ended 31 March 2021, this included actuarial losses from the purchase of buy-in policies of £0.1 billion.
Asset allocations
The allocation of assets by asset class is set out below. Within these asset allocations there is significant diversification across regions, asset managers, currencies and bond categories.
UK pensions
| | | | | | | | | | | | | | | | | | | | | | | | | | | | | | | | | | | |
| 2022 | | 2021 | | 2020 |
| Quoted | Unquoted | Total | | Quoted | Unquoted | Total | | Quoted | Unquoted | Total |
| £m | £m | £m | | £m | £m | £m | | £m | £m | £m |
Equities | 1,458 | | 474 | | 1,932 | | | 555 | | 801 | | 1,356 | | | 732 | | 732 | | 1,464 | |
| Corporate bonds | 2,741 | | — | | 2,741 | | | 3,730 | | 37 | | 3,767 | | | 3,837 | | — | | 3,837 | |
| Government securities | 786 | | — | | 786 | | | 1,836 | | — | | 1,836 | | | 2,051 | | — | | 2,051 | |
| Property | 122 | | 1,002 | | 1,124 | | | 104 | | 565 | | 669 | | | 103 | | 585 | | 688 | |
| Diversified alternatives | 1,334 | | 432 | | 1,766 | | | — | | 712 | | 712 | | | — | | 893 | | 893 | |
| Liability-matching assets | 2,023 | ¹ | 6,090 | ² | 8,113 | ³ | | 1,731 | ¹ | 4,133 | ² | 5,864 | ³ | | 1,704 | ¹ | 3,278 | ² | 4,982 | ³ |
| Longevity swap | — | | (80) | | (80) | | | — | | (64) | | (64) | | | — | | (51) | | (51) | |
| Cash and cash equivalents | 477 | | — | | 477 | | | 34 | | 250 | | 284 | | | 29 | | 222 | | 251 | |
| Other (including net current assets and liabilities) | 16 | | (10) | | 6 | | | — | | 256 | | 256 | | | — | | 249 | | 249 | |
| 8,957 | | 7,908 | | 16,865 | ⁴ | | 7,990 | | 6,690 | | 14,680 | | | 8,456 | | 5,908 | | 14,364 | |
1. Consists of pooled funds which invest mainly in fixed interest securities.
2. Includes buy-in policies held by NGUKPS with a total value of £2.7 billion (2021: £4.1 billion; 2020: £3.3 billion).
3. Included within liability-matching assets above is £6.6 billion (2021: £2.5 billion; 2020: £2.8 billion) of repurchase agreements. These are used to increase the market exposure of the liability-matching portfolios.
4. The fair value of plan assets for NGUKPS Section A includes £32 million (2021: £nil; 2020: £nil) of direct holdings in WPD debt instruments.
National Grid plc Annual Report and Accounts 2021/22 201
Notes to the consolidated financial statements continued
25. Pensions and other post-retirement benefits continued
US pensions
| | | | | | | | | | | | | | | | | | | | | | | | | | | | | | | | | | | |
| 2022 | | 2021 | | 2020 |
| Quoted | Unquoted | Total | | Quoted | Unquoted | Total | | Quoted | Unquoted | Total |
| £m | £m | £m | | £m | £m | £m | | £m | £m | £m |
| Equities | 272 | | 1,904 | | 2,176 | | | 560 | | 2,359 | | 2,919 | | | 467 | | 2,043 | | 2,510 | |
| Corporate bonds | 2,311 | | 697 | | 3,008 | | | 1,547 | | 507 | | 2,054 | | | 1,640 | | 518 | | 2,158 | |
| Government securities | 335 | | 715 | | 1,050 | | | 354 | | 527 | | 881 | | | 535 | | 732 | | 1,267 | |
| Property | — | | 295 | | 295 | | | — | | 264 | | 264 | | | — | | 307 | | 307 | |
| Diversified alternatives | 142 | | 364 | | 506 | | | 167 | | 458 | | 625 | | | 162 | | 464 | | 626 | |
| Infrastructure | — | | 182 | | 182 | | | — | | 130 | | 130 | | | — | | 121 | | 121 | |
| Cash and cash equivalents | 31 | | — | | 31 | | | 24 | | — | | 24 | | | 24 | | — | | 24 | |
| Other (including net current assets and liabilities) | 12 | | 3 | | 15 | | | 12 | | — | | 12 | | | (44) | | 3 | | (41) | |
| 3,103 | | 4,160 | | 7,263 | | | 2,664 | | 4,245 | | 6,909 | | | 2,784 | | 4,188 | | 6,972 | |
US other post-retirement benefits
| | | | | | | | | | | | | | | | | | | | | | | | | | | | | | | | | | | |
| 2022 | | 2021 | | 2020 |
| Quoted | Unquoted | Total | | Quoted | Unquoted | Total | | Quoted | Unquoted | Total |
| £m | £m | £m | | £m | £m | £m | | £m | £m | £m |
| Equities | 185 | | 1,013 | | 1,198 | | | 419 | | 1,303 | | 1,722 | | | 353 | | 1,037 | | 1,390 | |
| Corporate bonds | 723 | | 2 | | 725 | | | 13 | | — | | 13 | | | 15 | | — | | 15 | |
| Government securities | 511 | | 2 | | 513 | | | 533 | | 3 | | 536 | | | 551 | | 1 | | 552 | |
| Diversified alternatives | 144 | | 120 | | 264 | | | 185 | | 172 | | 357 | | | 162 | | 161 | | 323 | |
| Other¹ | — | | 185 | | 185 | | | — | | 171 | | 171 | | | — | | 132 | | 132 | |
| 1,563 | | 1,322 | | 2,885 | | | 1,150 | | 1,649 | | 2,799 | | | 1,081 | | 1,331 | | 2,412 | |
1. Other primarily comprises insurance contracts.
Main defined benefit risks
National Grid underwrites the financial and demographic risks associated with our DB plans. Although the governing bodies have sole responsibility for setting investment strategies and managing risks, National Grid closely works with and supports the governing bodies of each plan, to assist them in mitigating the risks associated with their plans and to ensure that the plans are funded to meet their obligations.
The most significant risks associated with the DB plans are:
| | | | | |
| Main risks | Description and mitigation |
| Investment risk | The plans invest in a variety of asset classes, with actual returns likely to differ from the underlying discount rate adopted, impacting on the funding position of the plan through the net balance sheet asset or liability. Each plan seeks to balance the level of investment return required with the risk that it can afford to take, to design the most appropriate investment portfolio. |
Changes in bond yields | Liabilities are calculated using discount rates set with reference to the yields in high-quality bonds prevailing in the UK and US debt markets and will fluctuate as yields change. Volatility of the net balance sheet asset or liability is controlled through liability-matching strategies. The investment strategies allow for the use of synthetic as well as physical assets to be used to hedge interest rate risk. |
| Inflation risk | Changes in inflation will affect the current and future pensions but are partially mitigated through investing in inflation-matching assets and hedging instruments as well as bulk annuity buy-in policies. The investment strategies allow for the use of synthetic as well as physical assets to be used to hedge inflation risk. |
| Member longevity | Longevity is a key driver of liabilities and changes in life expectancy have a direct impact on liabilities. Improvements in life expectancy will lead to pension payments being paid for longer than expected and benefits ultimately being more expensive. This risk has been partly mitigated by recent scheme investment transactions including a longevity insurance contract (longevity swap) for NGEG of ESPS and two buy-in policies for Section A of NGUKPS. |
| Counterparty risk | This is managed by having a diverse range of counterparties and through having a strong collateralisation process (including for the longevity swap held by NGEG of ESPS). Measurement and management of counterparty risk is delegated to the relevant investment managers. For our bulk annuity policies, various termination provisions were introduced in the contracts, managing our exposure to counterparty risk. The insurers’ operational performance and financial strength are monitored on a regular basis. |
| Default risk | Investments are predominantly made in regulated markets in assets considered to be of investment grade. Where investments are made either in non-investment grade assets or outside of regulated markets, investment levels are kept to prudent levels and subject to agreed control ranges, to control the risk. |
| Liquidity risk | The pension plans hold sufficient cash to meet benefit requirements, with other investments being held in liquid or realisable assets to meet unexpected cash flow requirements. The plans do not borrow money, or act as guarantor, to provide liquidity to other parties (unless it is temporary). |
Currency risk | Fluctuations in the value of foreign denominated assets due to exposure to currency exchange rates is managed through a combination of segregated currency hedging overlay and currency hedging carried out by some of the investment managers. |
202 National Grid plc Annual Report and Accounts 2021/22
25. Pensions and other post-retirement benefits continued
DB plan investment strategies
The Trustees and RPC, after taking advice from professional investment advisors and in consultation with National Grid, set their key principles, including expected returns, risk and liquidity requirements. They formulate an investment strategy to manage risk through diversification, taking into account expected contributions, maturity of the pension liabilities, and in the UK, the strength of the covenant. These strategies allocate investments between return-seeking assets such as equities and property, and liability-matching assets such as buy-in policies, government securities and corporate bonds which are intended to protect the funding position.
The approximate investment allocations for our plans at 31 March 2022 are as follows:
| | | | | | | | | | | |
| UK pensions | US pensions | US other post-retirement benefits |
| % | % | % |
| Return-seeking assets | 28 | | 41 | | 51 | |
| Liability-matching assets | 72 | | 59 | | 49 | |
The governing bodies can generally delegate responsibility for the selection of specific bonds, securities and other investments to appointed investment managers. Investment managers are selected based on the required skills, expertise in those markets, process and financial security to manage the investments. Their performance is regularly reviewed against measurable objectives, consistent with each pension plan’s long-term objectives and accepted risk levels.
In the UK, each of our pension plans has Responsible Investment (RI) Policies, which take into account Environmental, Social and Governance (ESG) factors and generally incorporate the six UN-backed Principles for Responsible Investment (UNPRI). Each of the Trustee boards believes that ESG factors can be material to financial outcomes and should therefore be considered alongside other factors. They recognise that their primary responsibility remains a fiduciary one, i.e., their first duty is to ensure the best possible return on investments with the appropriate level of risk. However, they also recognise the increasing materiality of ESG factors and that they have a fiduciary and regulatory duty to consider RI, including ESG factors and their potential impact on the quality and sustainability of long-term investment returns. The principle defined contribution arrangement in the UK, the NGUKRP, is operated by Legal & General, which embeds ESG factors in the investment options offered to members. As well as offering a range of self-select ethical funds, it directly incorporates its Climate Impact Pledge into the default investment option, which acts to align the fund to a carbon net zero future.
Whilst in the US there is no regulatory requirement to have ESG-specific principles embedded in investment policies, our investment managers often utilise ESG principles to inform their decision-making process.
National Grid plc Annual Report and Accounts 2021/22 203
Notes to the consolidated financial statements continued
26. Provisions
| | |
Provisions are recognised when an obligation exists resulting from a past event, and it is probable that cash will be paid to settle it, but the exact amount of cash required can only be estimated. The majority of our provisions relate to environmental remediation, specifically in relation to certain Superfund sites in the US, being sites we own or have owned in the past where hazardous substances are present as a result of the historic operations of manufactured gas plants in Brooklyn, New York. We also recognise provisions for decommissioning costs for various assets we would be required to remove at the end of their lives; the costs associated with restructuring plans; the costs in respect of insured past events; for certain Ofgem arrangements in respect of specific interconnectors which require the return of excess revenues above a cap; and for lease contracts we have entered into that are now loss-making. In determining the quantum of the provision we recognise, we make estimates in relation to management’s best judgement of the evaluation of the likelihood and the probability of exposure to potential loss, and the costs that would be incurred. Should circumstances change following unforeseeable developments, the likelihood or quantum could alter. |
Provisions are recognised where a legal or constructive obligation exists at the reporting date, as a result of a past event, where the amount of the obligation can be reliably estimated and where the outflow of economic benefit is probable.
The quantum of the provision recognised for decommissioning, environmental, restructuring and other costs is based on estimated future expenditure, discounted to present values. An initial estimate of decommissioning and environmental costs attributable to property, plant and equipment is recorded as part of the original cost of the related property, plant and equipment. Provisions to decommission significant portions of our regulated transmission and distribution assets are not recognised where no legal obligations exist, and a realistic alternative exists to incurring costs to decommission assets at the end of their life. In any case, even if a legal or constructive obligation did exist, it is not currently determinable when remediation work would take place and therefore no provision would be recorded at this point.
Changes in the provision arising from revised estimates, discount rates or changes in the expected timing of expenditure that relates to property, plant and equipment are recorded as adjustments to their carrying value and depreciated prospectively over their remaining estimated useful economic lives; otherwise such changes are recognised in the income statement.
The unwinding of the discount is included within the income statement within finance costs.
| | | | | | | | | | | | | | | | | |
| Environmental £m | Decommissioning £m | Restructuring £m | Other £m | Total provisions £m |
| At 1 April 2020 | 2,071 | | 254 | | 35 | | 294 | | 2,654 | |
| Exchange adjustments | (185) | | (9) | | (1) | | (21) | | (216) | |
| Additions | 26 | | 42 | | 11 | | 67 | | 146 | |
| Unused amounts reversed | (38) | | (27) | | — | | (16) | | (81) | |
| Unwinding of discount | 66 | | 7 | | — | | 5 | | 78 | |
| Utilised | (161) | | (16) | | (19) | | (62) | | (258) | |
| Reclassification to held for sale (note 10) | (79) | | (7) | | — | | (10) | | (96) | |
| At 31 March 2021 | 1,700 | | 244 | | 26 | | 257 | | 2,227 | |
| Exchange adjustments | 82 | | 4 | | 1 | | 10 | | 97 | |
| Additions | 158 | | 37 | | 16 | | 212 | | 423 | |
| Acquisition of WPD (note 37) | — | | 37 | | — | | 29 | | 66 | |
| Unused amounts reversed | (25) | | (4) | | (1) | | (31) | | (61) | |
| Unwinding of discount | 64 | | 6 | | — | | 3 | | 73 | |
| Utilised | (99) | | (26) | | (22) | | (47) | | (194) | |
| Reclassification to held for sale (note 10) | (3) | | (40) | | (3) | | (46) | | (92) | |
| | | | | |
| At 31 March 2022 | 1,877 | | 258 | | 17 | | 387 | | 2,539 | |
| | | | | | | | | | | |
| 2022 | | 2021 |
| £m | | £m |
| Current | 240 | | | 260 | |
| Non-current | 2,299 | | | 1,967 | |
| 2,539 | | | 2,227 | |
204 National Grid plc Annual Report and Accounts 2021/22
26. Provisions continued
Environmental provisions
The environmental provision represents the estimated restoration and remediation costs relating to a number of sites owned and managed by subsidiary undertakings, together with certain US sites that National Grid no longer owns. The environmental provision is as follows:
| | | | | | | | | | | | | | | | | | | | | | | | | | | | | | | | | | | |
| 2022 | | 2021 |
| Discounted
£m | | Real undiscounted
£m | | Real
discount
rate | | Discounted
£m | | Real undiscounted
£m | | Real discount rate |
| UK sites | 152 | | | 160 | | | 0.5 | % | | 167 | | | 171 | | | 0.5 | % |
| US sites | 1,725 | | | 1,789 | | | 0.5 | % | | 1,533 | | | 1,583 | | | 0.5 | % |
| 1,877 | | | 1,949 | | | | | 1,700 | | | 1,754 | | | |
The remediation expenditure in the UK relates to old gas manufacturing sites and also to electricity transmission sites. Cash flows are expected to be incurred until 2069. A number of estimation uncertainties affect the calculation of the provision, including the impact of regulation, the accuracy of site surveys, unexpected contaminants, transportation costs, the impact of alternative technologies, the expected timing and duration of cash flows, and changes in the real discount rate. This provision incorporates our best estimate of the financial effect of these uncertainties, but future changes in any of the assumptions could materially impact the calculation of the provision. The undiscounted amount is the undiscounted best estimate of the liability having regard to these uncertainties.
The remediation expenditure in the US is expected to be incurred until 2069, of which the majority relates to three Superfund sites (being sites where hazardous substances are present as a result of the historic operations of manufactured gas plants in Brooklyn, New York). The weighted average duration of the cash flows is 11 years. The uncertainties regarding the calculation of this provision are similar to those considered in respect of UK sites. Under the terms of our rate plans, we are entitled to recovery of environmental clean-up costs from rate payers.
Decommissioning provisions
The decommissioning provisions include £258 million (2021: £244 million) of expenditure relating to asset retirement obligations estimated to be incurred until 2104.
Restructuring provisions
In 2022, we continued to undertake design and implementation activities in respect of our new operating model and cost efficiency programme, which resulted in the recognition of an increased provision of £16 million in the year (2021: £11 million). The income statement expense relating to the provision has been treated as an exceptional item, and details are provided in note 5.
Other provisions
Included within other provisions at 31 March 2022 are the following amounts:
• £163 million (2021: £166 million) of estimated liabilities in respect of past events insured by insurance subsidiary undertakings, including employer liability claims. In accordance with insurance industry practice, these estimates are based on experience from previous years, but we currently expect that cash flows will be incurred until 2037;
• £121 million (2021: £nil) of estimated liabilities in respect of interconnector excess revenues which will be repayable in future reporting periods in accordance with the cap and floor regime constructed by Ofgem (see notes 3 and 38). These estimates are based on the respective interconnectors’ performance against their cumulative caps and cash outflows will be required to settle these liabilities by the financial year ending 31 March 2028;
• £28 million (2021: £27 million) in respect of onerous lease commitments and rates payable on surplus properties with expenditure expected to be incurred until 2039; and
• £26 million (2021: £13 million) in respect of emissions provisions with expenditure expected to be incurred until 2023.
National Grid plc Annual Report and Accounts 2021/22 205
Notes to the consolidated financial statements continued
27. Share capital
| | |
| Ordinary share capital represents the total number of shares issued which are publicly traded. We also disclose the number of treasury shares the Company holds, which are shares that the Company has bought itself, predominantly to actively manage scrip issuances and settle employee share option and reward plan liabilities. |
Share capital is accounted for as an equity instrument. An equity instrument is any contract that includes a residual interest in the consolidated assets of the Company after deducting all its liabilities and is recorded at the proceeds received, net of direct issue costs, with an amount equal to the nominal amount of the shares issued included in the share capital account and the balance recorded in the share premium account.
| | | | | | | | |
| Allotted, called-up and fully paid |
| million | £m |
| At 1 April 2020 | 3,780 | | 470 | |
| Issued during the year in lieu of dividends¹ | 35 | | 4 | |
| At 31 March 2021 | 3,815 | | 474 | |
| Issued during the year in lieu of dividends¹ | 89 | | 11 | |
| At 31 March 2022 | 3,904 | | 485 | |
1. The issue of shares under the scrip dividend programme is considered to be a bonus issue under the terms of the Companies Act 2006, and the nominal value of the shares is charged to the share premium account.
The share capital of the Company consists of ordinary shares of 12204⁄473 pence nominal value each including ADSs. The ordinary shares and ADSs allow holders to receive dividends and vote at general meetings of the Company. The Company holds treasury shares but may not exercise any rights over these shares including the entitlement to vote or receive dividends. There are no restrictions on the transfer or sale of ordinary shares.
In line with the provisions of the Companies Act 2006, the Company has amended its Articles of Association and ceased to have authorised share capital.
The Company has implemented a share forfeiture programme following the completion of a tracing and notification exercise to any shareholders who have not had contact with the Company over the past 12 years, in accordance with the provisions set out in the Company’s Articles of Association. Under the share forfeiture programme, the shares and dividends associated with shares of untraced members have been forfeited, with the resulting proceeds transferred to the Company to use in line with the Company’s corporate responsibility strategy. During the financial year, the Company received £16 million of proceeds from the sale of untraced shares and derecognised £32 million of liabilities related to unclaimed dividends, which are reflected in share premium and the income statement respectively.
Treasury shares
At 31 March 2022, the Company held 259 million (2021: 266 million) of its own shares. The market value of these shares as at 31 March 2022 was £3,038 million (2021: £2,296 million).
For the benefit of employees and in connection with the operation of the Company’s various share plans, the Company made the following transactions in respect of its own shares during the year ended 31 March 2022:
i. During the year, 4 million (2021: 4 million) treasury shares were gifted to National Grid Employee Share Trusts and 2 million (2021: 2 million) treasury shares were re-issued in relation to employee share schemes, in total representing 0.2% (2021: 0.2%) of the ordinary shares in issue as at 31 March 2022. The nominal value of these shares was £1 million (2021: £1 million) and the total proceeds received were £17 million (2021: £17 million). National Grid settles share awards under its Long Term Incentive Plan and the Save As You Earn scheme, by the transfer of treasury shares to its employee share trusts.
ii. During the year, the Company made payments totalling £3 million (2021: £2 million) to National Grid Employee Share Trusts to enable the Trustees to make purchases of National Grid plc shares to settle share awards in relation to all employee share plans and discretionary reward plans. The cost of such purchases is deducted from retained earnings in the period that the transaction occurs.
The maximum number of ordinary shares held in treasury during the year was 266 million (2021: 272 million) representing 6.8% (2021: 7.1%) of the ordinary shares in issue as at 31 March 2022 and having a nominal value of £33 million (2021: £34 million).
206 National Grid plc Annual Report and Accounts 2021/22
28. Other equity reserves
| | |
| Other equity reserves are different categories of equity as required by accounting standards and represent the impact of a number of our historical transactions or fair value movements on certain financial instruments that the Company holds. |
Other equity reserves comprise the translation reserve (see accounting policy C in note 1), cash flow hedge reserve and the cost of hedging reserve (see note 32), debt instruments at fair value through other comprehensive income reserve (FVOCI debt) and equity investments at fair value through other comprehensive income reserve (FVOCI equity) (see note 15), the capital redemption reserve and the merger reserve.
The merger reserve arose as a result of the application of merger accounting principles under the then prevailing UK GAAP, which under IFRS 1 was retained for mergers that occurred prior to the IFRS transition date. Under merger accounting principles, the difference between the carrying amount of the capital structure of the acquiring vehicle and that of the acquired business was treated as a merger difference and included within reserves. The merger reserve represents the difference between the carrying value of subsidiary undertaking investments and their respective capital structures following the Lattice demerger from BG Group plc and the 1999 Lattice refinancing.
The cash flow hedge reserve will amortise as the committed future cash flows from borrowings are paid or capitalised in fixed assets (as described in note 32). Cost of hedging, FVOCI debt and FVOCI equity reserves arose as a result of the adoption of IFRS 9 on 1 April 2018. See note 15 for further detail on FVOCI debt and FVOCI equity reserves; and note 32 in respect of cost of hedging reserve.
As the amounts included in other equity reserves are not attributable to any of the other classes of equity presented, they have been disclosed as a separate classification of equity.
| | | | | | | | | | | | | | | | | | | | | | | | | | | | | |
| Translation £m | Cash flow hedge £m | Cost of hedging £m | FVOCI equity £m | FVOCI
debt
£m | Own
credit
£m | Capital redemption £m | Merger £m | Total £m |
| At 1 April 2019 | 750 | | 61 | | 17 | | 34 | | 48 | | 13 | | 19 | | (5,165) | | (4,223) | |
| Exchange adjustments¹ | 560 | | — | | — | | — | | — | | — | | — | | — | | 560 | |
| Net losses taken to equity | — | | (142) | | (33) | | (13) | | (15) | | (3) | | — | | — | | (206) | |
| Share of net losses of associates taken to equity | — | | (5) | | — | | — | | — | | — | | — | | — | | (5) | |
| Transferred to profit or loss | — | | 14 | | (45) | | — | | — | | — | | — | | — | | (31) | |
| Net losses in respect of cash flow hedging of capital expenditure | — | | (17) | | — | | — | | — | | — | | — | | — | | (17) | |
| Tax | — | | 29 | | 11 | | 4 | | (2) | | — | | — | | — | | 42 | |
| Cash flow hedges transferred to the statement of financial position, net of tax | — | | (15) | | — | | — | | — | | — | | — | | — | | (15) | |
| At 1 April 2020 | 1,310 | | (75) | | (50) | | 25 | | 31 | | 10 | | 19 | | (5,165) | | (3,895) | |
| Exchange adjustments¹ | (1,345) | | — | | — | | — | | — | | — | | — | | — | | (1,345) | |
| Net gains/(losses) taken to equity | — | | 14 | | 11 | | 36 | | 80 | | (11) | | — | | — | | 130 | |
| Share of net gains of associates taken to equity | — | | 1 | | — | | — | | — | | — | | — | | — | | 1 | |
| Transferred to profit or loss | — | | 56 | | 3 | | — | | — | | — | | — | | — | | 59 | |
| Net losses in respect of cash flow hedging of capital expenditure | — | | (14) | | — | | — | | — | | — | | — | | — | | (14) | |
| Tax | — | | (13) | | 8 | | (10) | | — | | 2 | | — | | — | | (13) | |
| Cash flow hedges transferred to the statement of financial position, net of tax | — | | (17) | | — | | — | | — | | — | | — | | — | | (17) | |
| At 1 April 2021 | (35) | | (48) | | (28) | | 51 | | 111 | | 1 | | 19 | | (5,165) | | (5,094) | |
| Exchange adjustments¹ | 629 | | — | | — | | — | | — | | — | | — | | — | | 629 | |
| Net losses taken to equity² | — | | (96) | | (2) | | (70) | | (11) | | (1) | | — | | — | | (180) | |
| Share of net gains of associates taken to equity | — | | 1 | | — | | — | | — | | — | | — | | — | | 1 | |
| Transferred to profit or loss | — | | 40 | | (1) | | — | | — | | — | | — | | — | | 39 | |
| Net losses in respect of cash flow hedging of capital expenditure | — | | (1) | | — | | — | | — | | — | | — | | — | | (1) | |
| Tax | — | | 11 | | 2 | | 19 | | 3 | | — | | — | | — | | 35 | |
| Cash flow hedges transferred to the statement of financial position, net of tax | — | | 8 | | — | | — | | — | | — | | — | | — | | 8 | |
| At 31 March 2022 | 594 | | (85) | | (29) | | — | | 103 | | — | | 19 | | (5,165) | | (4,563) | |
1. The exchange adjustments recorded in the translation reserve comprise a gain of £754 million (2021: loss of £1,507 million; 2020: gain of £545 million) relating to the translation of foreign operations offset by a loss of £125 million (2021: gain of £183 million; 2020: gain of £5 million) relating to borrowings, cross-currency swaps and foreign exchange forward contracts used to hedge the net investment in non-sterling denominated subsidiaries.
2. In the year ended 31 March 2022, the Group disposed of its equity instruments related to shares held as part of a portfolio of financial instruments which back some long‑term employee liabilities. The equity instruments were previously measured at FVOCI and prior to the disposal the Group recognised a gain of £12 million in the year. The accumulated gain and losses of £82 million recognised in other comprehensive income were transferred to retained earnings on disposal (see note 15).
National Grid plc Annual Report and Accounts 2021/22 207
Notes to the consolidated financial statements continued
29. Net debt
| | |
| We define net debt as the amount of borrowings and financing derivatives less cash and current financial investments. |
(a) Composition of net debt
Net debt is comprised as follows:
| | | | | | | | | | | |
| 2022 | 2021 | 2020 |
| £m | £m | £m |
| Cash and cash equivalents (see note 20) | 204 | | 157 | | 73 | |
| Current financial investments (see note 15) | 3,145 | | 2,342 | | 1,998 | |
| Borrowings (see note 21) | (45,465) | | (31,220) | | (30,794) | |
| Financing derivatives¹ (see note 17) | (693) | | 175 | | 133 | |
| (42,809) | | (28,546) | | (28,590) | |
1. The financing derivatives balance included in net debt excludes the commodity derivatives (see note 17).
(b) Analysis of changes in net debt
| | | | | | | | | | | | | | | | | | | | | | | | | | | | | |
| | Notes | | Cash and cash equivalents £m | Financial investments1 £m | Borrowings £m | Financing derivatives £m | | Total2 £m |
| At 1 April 2019 | | | | 252 | | 1,981 | | (28,730) | | (32) | | | (26,529) | |
| Impact of transition to IFRS 16 | | | | — | | — | | (474) | | — | | | (474) | |
Cash flow | | | | (183) | | (42) | | 450 | | 450 | | | 675 | |
| Fair value gains and losses | | | | — | | 1 | | (57) | | (246) | | | (302) | |
| Foreign exchange movements | | | | 4 | | 24 | | (807) | | — | | | (779) | |
Interest income/(charges) | | 6 | | — | | 34 | | (1,092) | | (39) | | | (1,097) | |
| Other non-cash movements | | | | — | | — | | (84) | | — | | | (84) | |
| At 1 April 2020 | | | | 73 | | 1,998 | | (30,794) | | 133 | | | (28,590) | |
| Cash flow | | | | 95 | | 429 | | (2,336) | | 4 | | | (1,808) | |
| Fair value gains and losses | | | | — | | 14 | | 159 | | 31 | | | 204 | |
| Foreign exchange movements | | | | (7) | | (106) | | 1,710 | | — | | | 1,597 | |
Interest income/(charges) | | 6 | | — | | 7 | | (946) | | 7 | | | (932) | |
| Other non-cash movements | | | | — | | — | | (136) | | — | | | (136) | |
| Reclassification to held for sale | | 10 | | (4) | | — | | 1,123 | | — | | | 1,119 | |
| At 1 April 2021 | | | | 157 | | 2,342 | | (31,220) | | 175 | | | (28,546) | |
| Cash flow | | 29(c) | | 9 | | 752 | | (9,993) | | 262 | | | (8,970) | |
| Fair value gains and losses | | | | — | | (12) | | 286 | | (604) | | | (330) | |
| Foreign exchange movements | | | | 5 | | 53 | | (652) | | — | | | (594) | |
| Interest income/(charges) | | 6 | | — | | 43 | | (1,177) | | (59) | | | (1,193) | |
| Other non-cash movements | | | | — | | (15) | | 34 | | — | | | 19 | |
| Acquisition of WPD | | 37 | | 44 | | 69 | | (8,286) | | 26 | | | (8,147) | |
| Reclassification to held for sale³ | | 10 | | (11) | | (87) | | 5,543 | | (493) | | | 4,952 | |
| | | | | | | | | |
| At 31 March 2022 | | | | 204 | | 3,145 | | (45,465) | | (693) | | | (42,809) | |
| Balances at 31 March 2022 comprise: | | | | | | | | | |
| Non-current assets | | | | — | | — | | — | | 264 | | | 264 | |
| Current assets | | | | 204 | | 3,145 | | — | | 34 | | | 3,383 | |
| Current liabilities | | | | — | | — | | (12,121) | | (136) | | | (12,257) | |
| Non-current liabilities | | | | — | | — | | (33,344) | | (855) | | | (34,199) | |
| | | | 204 | | 3,145 | | (45,465) | | (693) | | | (42,809) | |
1. Cash flows on current financial investments comprise £29 million (2021: £7 million; 2020: £35 million) of interest received and £781 million of cash outflows (2021: £436 million outflows; 2020: £7 million outflows) of net cash flow movements in short-term financial investments, as presented in the consolidated cash flow statement.
2. Includes accrued interest at 31 March 2022 of £351 million (2021: £263 million; 2020: £246 million).
3. Reclassification to held for sale represents the opening net debt position of the UK Gas Transmission business. The closing net debt position of the UK Gas Transmission business is disclosed in note 10.
208 National Grid plc Annual Report and Accounts 2021/22
29. Net debt continued
(c) Reconciliation of cash flow from liabilities within net debt to cash flow statement
| | | | | | | | | | | | | | | | | | | | | | | | | | |
| 2022 | | 20211 | | 20201 |
| Borrowings and other
£m | Financing derivatives
£m | | Borrowings and other
£m | Financing derivatives
£m | | Borrowings and other
£m | Financing derivatives
£m |
| Cash flows per financing activities section of cash flow statement: | | | | | | | | |
| Proceeds received from loans | 12,347 | | — | | | 5,150 | | — | | | 3,921 | | — | |
| Repayment of loans | (1,261) | | — | | | (1,654) | | — | | | (3,037) | | — | |
| Payments of lease liabilities | (117) | | — | | | (107) | | — | | | (115) | | — | |
| Net movements in short-term borrowings | (11) | | — | | | (619) | | — | | | (562) | | — | |
| Cash inflows on derivatives | — | | 20 | | | — | | 17 | | | — | | 46 | |
| Cash outflows on derivatives | — | | (114) | | | — | | (183) | | | — | | (245) | |
| Interest paid | (998) | | (55) | | | (711) | | (42) | | | (802) | | (65) | |
| Cash flows per financing activities section of cash flow statement | 9,960 | | (149) | | | 2,059 | | (208) | | | (595) | | (264) | |
| Adjustments: | | | | | | | | |
| Non-net debt-related items | 33 | | — | | | 29 | | — | | | 34 | | — | |
| Derivative cash (outflow)/inflow in relation to capital expenditure | — | | (8) | | | — | | 10 | | | — | | 13 | |
| Derivative cash inflows per investing section of cash flow statement | — | | 17 | | | — | | 225 | | | — | | 58 | |
Derivative cash outflows per investing section of cash flow statement | — | | (122) | | | — | | (81) | | | — | | (281) | |
| | | | | | | | |
| Cash flows relating to financing liabilities within net debt | 9,993 | | (262) | | | 2,088 | | (54) | | | (561) | | (474) | |
| | | | | | | | |
| Analysis of changes in net debt: | | | | | | | | |
| Borrowings | 9,993 | | — | | | 2,088 | | — | | | (561) | | — | |
| Financing derivatives | — | | (262) | | | — | | (54) | | | — | | (474) | |
| Cash flow movements relating to financing liabilities within net debt | 9,993 | | (262) | | | 2,088 | | (54) | | | (561) | | (474) | |
1. Comparative amounts have been re-presented to reflect the classification of the UK Gas Transmission business as a discontinued operation. See notes 1 and 10 for further information.
(d) Reconciliation of changes in liabilities arising from financing activities
The table below reconciles changes in liabilities arising from financing activities, including both changes arising from cash flows and non-cash changes. For the purposes of this table, the liabilities arising from financing activities are those for which cash flows were, or future cash flows will be, classified in the consolidated cash flow statement within financing activities. As a result we have separately disclosed the reconciliation below, excluding derivatives associated with our net investment hedges and derivatives associated with the hedging of capital expenditure, given that they are both classified in the consolidated cash flow statement within investing activities.
| | | | | | | | | | | | | | | | | | | | |
| Notes | | Borrowings £m | Financing derivatives £m | | Total £m |
| At 1 April 2019 | | | (28,730) | | 228 | | | (28,502) | |
| Impact of transition to IFRS 16 | | | (474) | | — | | | (474) | |
Cash flow¹ | | | 450 | | 240 | | | 690 | |
| Fair value gains and losses | | | (57) | | (231) | | | (288) | |
| Foreign exchange movements | | | (807) | | — | | | (807) | |
Interest charges | 6 | | (1,092) | | (9) | | | (1,101) | |
| Other non-cash movements | | | (84) | | — | | | (84) | |
| At 1 April 2020 | | | (30,794) | | 228 | | | (30,566) | |
| Cash flow¹ | | | (2,336) | | 158 | | | (2,178) | |
| Fair value gains and losses | | | 159 | | (301) | | | (142) | |
| Foreign exchange movements | | | 1,710 | | — | | | 1,710 | |
| Interest charges | 6 | | (946) | | 11 | | | (935) | |
| Other non-cash movements | | | (136) | | — | | | (136) | |
| Reclassification to held for sale | 10 | | 1,123 | | — | | | 1,123 | |
| At 1 April 2021 | | | (31,220) | | 96 | | | (31,124) | |
| Cash flow | | | (9,993) | | 149 | | | (9,844) | |
| Fair value gains and losses | | | 286 | | (472) | | | (186) | |
| Foreign exchange movements | | | (652) | | — | | | (652) | |
| Interest charges | 6 | | (1,177) | | (54) | | | (1,231) | |
| Other non-cash movements | | | 34 | | — | | | 34 | |
| Acquisition of WPD | 37 | | (8,286) | | 26 | | | (8,260) | |
| Reclassification to held for sale² | 10 | | 5,543 | | (495) | | | 5,048 | |
| At 31 March 2022 | | | (45,465) | | (750) | | | (46,215) | |
1. Comparative amounts include financing cash flows attributable to the UK Gas Transmission business which was classified as a discontinued operation in the year (see notes 1 and 10). In order to reconcile financing cash flows to the consolidated cash flow statement for the years ended 31 March 2021 and 2020, cash flows from financing activities for both continuing operations and discontinued operations should be included, along with non-debt related items in note 29(c).
2. Reclassification to held for sale represents the opening net debt position of the UK Gas Transmission business. The closing net debt position of the UK Gas Transmission business is disclosed in note 10.
National Grid plc Annual Report and Accounts 2021/22 209
Notes to the consolidated financial statements continued
30. Commitments and contingencies
| | |
Commitments are those amounts that we are contractually required to pay in the future as long as the other party meets its obligations. These commitments primarily relate to energy purchase agreements and contracts for the purchase of assets which, in many cases, extend over a long period of time. We also disclose any contingencies, which include guarantees that companies have given, where we pledge assets against current obligations that will remain for a specific period. Contingent assets are disclosed where the Group concludes that an inflow of economic benefits is probable. |
| | | | | | | | |
| 2022 | 2021 |
| £m | £m |
| Future capital expenditure | | |
Contracted for but not provided1 | 2,881 | | 2,716 | |
Energy purchase commitments2 | | |
| Less than 1 year | 1,386 | | 1,255 | |
| In 1 to 2 years | 1,366 | | 894 | |
| In 2 to 3 years | 1,219 | | 975 | |
| In 3 to 4 years | 1,189 | | 959 | |
| In 4 to 5 years | 1,088 | | 896 | |
| More than 5 years | 12,266 | | 10,805 | |
| 18,514 | | 15,784 | |
Guarantees | | |
| Guarantee of sublease for US property (expires 2040) | 149 | | 149 | |
| Guarantees of certain obligations of Grain LNG (expire up to 2025) | 31 | | 33 | |
| Guarantees of certain obligations for construction of HVDC West Coast Link (expected expiry 2059) | 84 | | 85 | |
| | |
Guarantees of certain obligations of National Grid North Sea Link Limited (various expiry dates) | 569 | | 584 | |
| Guarantees of certain obligations of St William Homes LLP (various expiry dates) | 44 | | 53 | |
Guarantees of certain obligations of National Grid IFA 2 Limited (expected expiry 2022) | 130 | | 170 | |
| Guarantees of certain obligations of National Grid Viking Link Limited (expected expiry 2024) | 1,177 | | 1,276 | |
| Other guarantees and letters of credit (various expiry dates) | 380 | | 486 | |
| 2,564 | | 2,836 | |
1. Included within future capital expenditure is £205 million (2021: £186 million) pertaining to the UK Gas Transmission business.
2. Energy purchase commitments relate to contractual commitments to purchase electricity or gas that are used to satisfy physical delivery requirements to our customers or for energy that we use ourselves (i.e. normal purchase, sale or usage) and hence are accounted for as ordinary purchase contracts (see note 32(f)). Details of commodity contract derivatives that do not meet the normal purchase, sale or usage criteria, and hence are accounted for as derivative contracts, are shown in note 17(b).
Through the ordinary course of our operations, we are party to various litigation, claims and investigations. We do not expect the ultimate resolution of any of these proceedings to have a material adverse effect on our results of operations, cash flows or financial position.
Contingent assets
In September 2021, a fire at the IFA interconnector station in Sellindge, Kent caused significant damage to infrastructure on site. This incident has resulted in claims under the Group’s insurance policy for the rebuild cost of the damaged property and lost revenue arising from the business interruption. The Group believes that a favourable outcome is probable. However, the contingent asset has not been recognised as a receivable at 31 March 2022 because receipt of the amount is dependent on the outcome of the reinsurers formally agreeing liability and signing off on the investigation report. As at 31 March 2022, the investigation report is with the reinsurers for review and the final amount and timing of any insurance proceeds is not known with certainty.
The exceptional environmental insurance recovery described in note 5 is the result of one of a number of legal proceedings that are ongoing between the Group and insurance companies who have provided historic cover over sites which were environmentally impacted in the past. Following the resolution of that claim, the Group has reassessed the likelihood of recovery in other similar legal proceedings and now believes that it is more likely than not that one or more of them will be successful. However, legal proceedings in each case still have a number of stages to complete, including in certain cases court proceedings.
210 National Grid plc Annual Report and Accounts 2021/22
31. Related party transactions
| | |
| Related parties include joint ventures, associates, investments and key management personnel. |
The following significant transactions with related parties were in the normal course of business. Amounts receivable from and payable to related parties are due on normal commercial terms:
| | | | | | | | | | | |
| 2022 | 2021 | 2020 |
| £m | £m | £m |
| Sales: Goods and services supplied to a pension plan | 3 | | 3 | | 5 | |
| Sales: Goods and services supplied to joint ventures¹ | 284 | | 79 | | 101 | |
| Sales: Goods and services supplied to associates² | — | | 1 | | 33 | |
| Purchases: Goods and services received from joint ventures³ | 19 | | 35 | | 61 | |
| Purchases: Goods and services received from associates³ | 41 | | 43 | | 56 | |
| | | |
| Receivable from joint ventures⁴ | 43 | | 263 | | 255 | |
| Receivable from associates | 1 | | — | | 1 | |
Payable to joint ventures5 | 247 | | 17 | | — | |
| Payable to associates | 4 | | 3 | | 4 | |
| Interest income from joint ventures | — | | — | | 2 | |
| Interest income from associates | — | | — | | 8 | |
| | | |
Dividends received from joint ventures6 | 123 | | 49 | | 34 | |
Dividends received from associates7 | 35 | | 32 | | 41 | |
1. During the year, £74 million of sales were made to Emerald Energy Venture LLC (2021: £50 million; 2020: £21 million) and a further £7 million (2021: £6 million; 2020; £32 million) of sales were made to NGET/SPT Upgrades Limited. Prior to the Group’s disposal of its equity interest in St William Homes LLP on 15 March 2022, a further £202 million (2021: £14 million; 2020: £38 million) of property sites were sold to St William Homes LLP.
2. In previous years, sales related to transactions with Quadgas, until the date it ceased to be a related party following the disposal of our 39% stake in June 2019 (see note 10) and included income of £31 million in 2020 relating to a Transitional Service Agreement following the sale of the UK Gas Distribution business to Quadgas.
3. During the year, the Group received goods and services from a number of US associates, both for the transportation of gas and for pipeline services in the US, most notably, £38 million (2021: £41 million; 2020: £31 million) of purchases from Millennium Pipeline Company LLC. The Group purchased assets of £18 million (2021: £17 million; 2020: £nil) from BritNed Development Limited. The Group also purchased assets of £0.3 million (2021: £5 million; 2020: £58 million) from NGET/SPT Upgrades Limited (a joint venture).
4. Amounts receivable from joint ventures include £33 million (2021: £19 million; 2020: £nil) from Emerald Energy Venture LLC. Amounts receivable in comparative periods include amounts due from St William Homes LLP, which is no longer a related party of the Group (2021: £241 million; 2020: £242 million).
5. Amounts payable to joint ventures include £223 million due to Bight Wind Holdings LLC, NGV’s joint venture with RWE Renewables, in respect of a capital call to NGV following the successful auction of six seabed leases in New York.
6. Includes dividends of £39 million (2021: £18 million; 2020: £25 million) received from BritNed Development Limited and £77 million (2021: £25 million; 2020: £8 million) from Nemo Link Limited.
7. Includes dividends of £34 million (2021: £31 million; 2020: £32 million) received from Millennium Pipeline Company LLC.
Details of investments in principal subsidiary undertakings, joint ventures and associates are disclosed in note 34, and information relating to pension fund arrangements is disclosed in note 25. For details of Directors’ and key management remuneration, refer to note 4(c).
32. Financial risk management
| | |
| Our activities expose us to a variety of financial risks including credit risk, liquidity risk, capital risk, currency risk, interest rate risk, inflation risk and commodity price risk. Our risk management programme focuses on the unpredictability of financial markets and seeks to minimise potential volatility of financial performance from these risks. We use financial instruments, including derivative financial instruments, to manage these risks. |
Risk management related to financing activities is carried out by a central treasury department under policies approved by the Finance Committee of the Board. The objective of the treasury department is to manage funding and liquidity requirements, including managing associated financial risks, to within acceptable boundaries. The Finance Committee provides written principles for overall risk management, and written policies covering the following specific areas: foreign exchange risk, interest rate risk, credit risk, liquidity risk, use of derivative financial instruments and non-derivative financial instruments, and investment of excess liquidity. The Finance Committee has delegated authority to administer the commodity price risk policy and credit policy for US‑based commodity transactions to the Energy Procurement Risk Management Committee and the National Grid USA Board of Directors.
We have exposure to the following risks, which are described in more detail below:
• credit risk;
• liquidity risk;
• currency risk;
• interest rate risk;
• commodity price risk; and
• capital risk.
Where appropriate, derivatives and other financial instruments used for hedging currency and interest rate risk exposures are formally designated as fair value, cash flow or net investment hedges as defined in IFRS 9. Hedge accounting allows the timing of the profit or loss impact of qualifying hedging instruments to be recognised in the same reporting period as the corresponding impact of hedged exposures. To qualify for hedge accounting, documentation is prepared specifying the risk management objective and strategy, the component transactions and methodology used for measurement of effectiveness.
National Grid plc Annual Report and Accounts 2021/22 211
Notes to the consolidated financial statements continued
32. Financial risk management continued
Hedge accounting relationships are designated in line with risk management activities further described below. The categories of hedging entered into are as follows:
• currency risk arising from our forecasted foreign currency transactions (capital expenditure or revenues) is designated in cash flow hedges;
• currency risk arising from our net investments in foreign operations is designated in net investment hedges; and
• currency and interest rate risk arising from borrowings are designated in cash flow or fair value hedges.
Critical terms of hedging instruments and hedged items are transacted to match on a 1:1 ratio by notional values. Hedge ineffectiveness can nonetheless arise from inherent differences between derivatives and non-derivative instruments and other market factors including credit, correlations, supply and demand, and market volatilities. Ineffectiveness is recognised in the remeasurements component of finance income and costs (see note 6). Hedge accounting is discontinued when a hedging relationship no longer qualifies for hedge accounting.
Certain hedging instrument components are treated separately as costs of hedging with the gains and losses deferred in a component of other equity reserves and released systematically into profit or loss to correspond with the timing and impact of hedged exposures, or released in full to finance costs upon an early discontinuation of a hedging relationship.
Refer to sections (c) currency risk and (d) interest rate risk below for further details on hedge accounting.
(a) Credit risk
We are exposed to the risk of loss resulting from counterparties’ default on their commitments including failure to pay or make a delivery on a contract. This risk is inherent in our commercial business activities. Exposure arises from derivative financial instruments, deposits with banks and financial institutions, trade receivables and committed transactions with wholesale and retail customers.
Treasury credit risk
Counterparty risk arises from the investment of surplus funds and from the use of derivative financial instruments. As at 31 March 2022, the following limits were in place for investments and derivative financial instruments held with banks and financial institutions:
| | | | | | | | |
| Maximum limit
£m | Long-term limit
£m |
| Triple ‘A’ G7 sovereign entities (AAA) | 2,708 | | 2,031 | |
| Triple ‘A’ vehicles (AAA) | 500 | | — | |
| Triple ‘A’ range institutions and non-G7 sovereign entities (AAA) | 2,462 | | 1,847 | |
| Double ‘A+’ G7 sovereign entities (AA+) | 2,462 | | 1,847 | |
| Double ‘A’ range institutions (AA) | 1,477 to 1,970 | 1,108 to 1,477 |
| Single ‘A’ range institutions (A) | 492 to 985 | 369 to 739 |
The maximum limit applies to all transactions, including long-term transactions. The long-term limit applies to transactions which mature in more than 12 months’ time.
As at 31 March 2022 and 2021, we had a number of exposures to individual counterparties. In accordance with our treasury policies, counterparty credit exposure utilisations are monitored daily against the counterparty credit limits. Counterparty credit ratings and market conditions are reviewed continually with limits being revised and utilisation adjusted, if appropriate. Management does not expect any significant losses from non-performance by these counterparties. Further information on financial investments subject to impairment provisioning is included in note 15.
Commodity credit risk
The credit policy for US-based commodity transactions is owned by the Finance Committee to the Board, which establishes controls and procedures to determine, monitor and minimise the credit exposure to counterparties.
Wholesale and retail credit risk
Our principal commercial exposure in the UK is governed by the credit rules within the regulated codes: Uniform Network Code and Connection and Use of System Code. These set out the level of credit relative to the RAV for each credit rating. In the US, we are required to supply electricity and gas under state regulations. Our policies and practices are designed to limit credit exposure by collecting security deposits prior to providing utility services, or after utility services have commenced if certain applicable regulatory requirements are met. Collection activities are managed on a daily basis. Sales to retail customers are usually settled in cash, cheques, electronic bank payments or by using major credit cards. We are committed to measuring, monitoring, minimising and recording counterparty credit risk in our wholesale business. The utilisation of credit limits is regularly monitored, and collateral is collected against these accounts when necessary.
In March 2020, the Group’s US distribution business temporarily ceased certain cash collection and termination activities in response to regulatory instructions following the COVID-19 pandemic. At the time this resulted in the recognition of expected credit losses. In the year ended 31 March 2022, collection activities resumed in New England and New York and are supported by certain government COVID funding programmes, which has been factored into the assessment of expected credit losses for the year (see note 19 for further details).
212 National Grid plc Annual Report and Accounts 2021/22
32. Financial risk management continued
(a) Credit risk continued
Offsetting financial assets and liabilities
The following tables set out our financial assets and liabilities which are subject to offset and to enforceable master netting arrangements or similar agreements. The tables show the amounts which are offset and reported net in the statement of financial position. Amounts which cannot be offset under IFRS, but which could be settled net under terms of master netting arrangements if certain conditions arise, and with collateral received or pledged, are shown to present National Grid’s net exposure.
Financial assets and liabilities on different transactions would only be reported net in the balance sheet if the transactions were with the same counterparty, a currently enforceable legal right of offset exists, and the cash flows were intended to be settled on a net basis.
Amounts which do not meet the criteria for offsetting on the statement of financial position, but could be settled net in certain circumstances, principally relate to derivative transactions under ISDA agreements, where each party has the option to settle amounts on a net basis in the event of default of the other party.
Commodity contract derivatives that have not been offset on the balance sheet may be settled net in certain circumstances under ISDA or North American Energy Standards Board (NAESB) agreements.
For bank account balances and bank overdrafts, there are no ‘Gross amounts offset’ under cash pooling arrangements (2021: £nil). Our UK bank accounts for National Grid subsidiaries previously participated in GBP, EUR and USD Composite Accounting System overdraft facilities subject to offsetting gross and net overdraft limits. EUR and USD offsetting arrangements were discontinued in the prior year and GBP offsetting arrangements have no impact as at 31 March 2022. In the US, no offsetting arrangements exist, and cash transactions are settled through Service Company bank accounts with subsequent intercompany payables and receivables reported by subsidiaries with the Service Company.
The gross amounts offset for trade payables and receivables, which are subject to general terms and conditions, are insignificant.
| | | | | | | | | | | | | | | | | | | | | | | | | | |
| | | | | Related amounts
available to be offset but
not offset in statement
of financial position | | |
| At 31 March 2022 | Gross
carrying
amounts
£m | Gross
amounts
offset
£m | Net amount
presented in
statement of
financial
position
£m | | Financial instruments
£m | Cash
collateral
received/
pledged
£m | | Net amount
£m |
| Assets | | | | | | | | |
| Financing derivatives | 298 | | — | | 298 | | | (136) | | (55) | | | 107 | |
| Commodity contract derivatives | 289 | | — | | 289 | | | (8) | | (50) | | | 231 | |
| 587 | | — | | 587 | | | (144) | | (105) | | | 338 | |
| Liabilities | | | | | | | | |
| Financing derivatives | (991) | | — | | (991) | | | 136 | | 771 | | | (84) | |
| Commodity contract derivatives | (22) | | — | | (22) | | | 8 | | 3 | | | (11) | |
| (1,013) | | — | | (1,013) | | | 144 | | 774 | | | (95) | |
| | | | | | | | |
| (426) | | — | | (426) | | | — | | 669 | | | 243 | |
| | | | | | | | | | | | | | | | | | | | | | | | | | |
| | | | | Related amounts
available to be offset but
not offset in statement
of financial position | | |
| At 31 March 2021 | Gross
carrying
amounts £m | Gross
amounts
offset
£m | Net amount
presented in
statement of
financial
position £m | | Financial instruments £m | Cash
collateral
received/
pledged £m | | Net amount £m |
| Assets | | | | | | | | |
| Financing derivatives | 942 | | — | | 942 | | | (234) | | (561) | | | 147 | |
| Commodity contract derivatives | 57 | | — | | 57 | | | (8) | | — | | | 49 | |
| 999 | | — | | 999 | | | (242) | | (561) | | | 196 | |
| Liabilities | | | | | | | | |
| Financing derivatives | (767) | | — | | (767) | | | 234 | | 467 | | | (66) | |
| Commodity contract derivatives | (132) | | — | | (132) | | | 8 | | 4 | | | (120) | |
| (899) | | — | | (899) | | | 242 | | 471 | | | (186) | |
| | | | | | | | |
| 100 | | — | | 100 | | | — | | (90) | | | 10 | |
National Grid plc Annual Report and Accounts 2021/22 213
Notes to the consolidated financial statements continued
32. Financial risk management continued
(b) Liquidity risk
Our policy is to determine our liquidity requirements by the use of both short-term and long-term cash flow forecasts. These forecasts are supplemented by a financial headroom analysis which is used to assess funding requirements for at least a 24-month period and maintain adequate liquidity for a continuous 12-month period.
We believe our contractual obligations, including those shown in commitments and contingencies in note 30, can be met from existing cash and investments, operating cash flows and other financing that we reasonably expect to be able to secure in the future, together with the use of committed facilities if required.
Our debt agreements and banking facilities contain covenants, including those relating to the periodic and timely provision of financial information by the issuing entity, restrictions on disposals and financial covenants, such as restrictions on the level of subsidiary indebtedness and interest coverage. Failure to comply with these covenants, or to obtain waivers of those requirements, could in some cases trigger a right, at the lender’s discretion, to require repayment of some of our debt and may restrict our ability to draw upon our facilities or access the capital markets.
The following is a payment profile of our financial liabilities and derivatives:
| | | | | | | | | | | | | | | | | |
| At 31 March 2022 | Less than
1 year £m | 1 to 2
years
£m | 2 to 3
years
£m | More than
3 years
£m | Total
£m |
| Non-derivative financial liabilities | | | | | |
| Borrowings, excluding lease liabilities | (11,589) | | (1,322) | | (2,468) | | (28,119) | | (43,498) | |
| Interest payments on borrowings¹ | (970) | | (928) | | (883) | | (12,525) | | (15,306) | |
| Lease liabilities | (132) | | (96) | | (79) | | (366) | | (673) | |
| Other non-interest-bearing liabilities | (3,979) | | (336) | | — | | — | | (4,315) | |
| Contingent consideration | (37) | | (8) | | — | | — | | (45) | |
| Derivative financial liabilities | | | | | |
| Financing derivatives – receipts² | 3,149 | | 1,008 | | 2,075 | | 4,726 | | 10,958 | |
| Financing derivatives – payments² | (3,401) | | (1,189) | | (2,336) | | (5,468) | | (12,394) | |
| Commodity contract derivatives – receipts² | 1 | | 1 | | — | | — | | 2 | |
| Commodity contract derivatives – payments² | (29) | | 2 | | (1) | | — | | (28) | |
| Derivative financial assets | | | | | |
| Financing derivatives – receipts² | 4,512 | | 316 | | 1,427 | | 464 | | 6,719 | |
| Financing derivatives – payments² | (4,405) | | (282) | | (1,313) | | (405) | | (6,405) | |
| Commodity contract derivatives – receipts² | 234 | | 37 | | 3 | | — | | 274 | |
| Commodity contract derivatives – payments² | (52) | | (8) | | (3) | | — | | (63) | |
| (16,698) | | (2,805) | | (3,578) | | (41,693) | | (64,774) | |
| | | | | | | | | | | | | | | | | |
| At 31 March 2021 | Less than 1 year £m | 1 to 2
years
£m | 2 to 3 years £m | More than 3 years £m | Total £m |
| Non-derivative financial liabilities | | | | | |
| Borrowings, excluding lease liabilities | (3,350) | | (1,690) | | (806) | | (25,562) | | (31,408) | |
| Interest payments on borrowings¹ | (810) | | (755) | | (731) | | (12,018) | | (14,314) | |
| Lease liabilities | (118) | | (108) | | (90) | | (599) | | (915) | |
| Other non-interest-bearing liabilities | (3,207) | | (350) | | — | | — | | (3,557) | |
| Contingent consideration | (40) | | (24) | | — | | — | | (64) | |
| Derivative financial liabilities | | | | | |
| Financing derivatives – receipts² | 3,773 | | 749 | | 451 | | 4,326 | | 9,299 | |
| Financing derivatives – payments² | (3,899) | | (877) | | (533) | | (5,153) | | (10,462) | |
| Commodity contract derivatives – receipts² | 12 | | — | | — | | — | | 12 | |
| Commodity contract derivatives – payments² | (83) | | (23) | | (14) | | (12) | | (132) | |
| Derivative financial assets | | | | | |
| Financing derivatives – receipts² | 2,162 | | 926 | | 833 | | 1,789 | | 5,710 | |
| Financing derivatives – payments² | (1,700) | | (834) | | (780) | | (1,536) | | (4,850) | |
| Commodity contract derivatives – receipts² | 21 | | 4 | | 1 | | 1 | | 27 | |
| Commodity contract derivatives – payments² | (21) | | (4) | | (2) | | — | | (27) | |
| (7,260) | | (2,986) | | (1,671) | | (38,764) | | (50,681) | |
1. The interest on borrowings is calculated based on borrowings held at 31 March without taking account of future issues. Floating rate interest is estimated using a forward interest rate curve as at 31 March. Payments are included on the basis of the earliest date on which the Company can be required to settle.
2. The receipts and payments line items for derivatives comprise gross undiscounted future cash flows, after considering any contractual netting that applies within individual contracts. Where cash receipts and payments within a derivative contract are settled net, and the amount to be received/(paid) exceeds the amount to be paid/(received), the net amount is presented within derivative receipts/(payments).
214 National Grid plc Annual Report and Accounts 2021/22
32. Financial risk management continued
(c) Currency risk
National Grid operates internationally with mainly pound sterling as the functional currency for the UK companies and US dollar for the US businesses. Currency risk arises from three major areas: funding activities, capital investment and related revenues, and holdings in foreign operations. This risk is managed using financial instruments including derivatives as approved by policy, typically cross-currency interest rate swaps, foreign exchange swaps and forwards.
Funding activities – our policy is to borrow in the most advantageous market available. Foreign currency funding gives rise to risk of volatility in the amount of functional currency cash to be repaid. This risk is reduced by swapping principal and interest back into the functional currency of the issuer. All foreign currency debt and transactions are hedged except where they provide a natural offset to assets elsewhere in the Group.
Capital investment and related revenues – capital projects often incur costs or generate revenues in a foreign currency, most often euro transactions done by the UK business. Our policy for managing foreign exchange transaction risk is to hedge contractually committed foreign currency cash flows over a prescribed minimum size, typically by buying euro forwards to hedge future expenditure, and selling euro forwards to hedge future revenues. For hedges of forecast cash flows our policy is to hedge a proportion of highly probable cash flows.
Holdings in foreign operations – we are exposed to fluctuations on the translation into pounds sterling of our foreign operations. The policy for managing this translation risk is to issue foreign currency debt or to replicate foreign debt using derivatives that pay cash flows in the currency of the foreign operation. The primary managed exposure arises from dollar denominated assets and liabilities held by our US operations, with a smaller euro exposure in respect of joint venture investments.
Derivative financial instruments were used to manage foreign currency risk as follows:
| | | | | | | | | | | | | | | | | | | | | | | | | | | | | | | | | | | |
| 2022 | | 2021 |
| Sterling
£m | Euro
£m | Dollar
£m | Other
£m | Total
£m | | Sterling £m | Euro £m | Dollar £m | Other £m | Total £m |
| Cash and cash equivalents | 111 | | — | | 93 | | — | | 204 | | | 63 | | — | | 94 | | — | | 157 | |
| Financial investments | 1,725 | | — | | 1,420 | | — | | 3,145 | | | 1,215 | | — | | 1,127 | | — | | 2,342 | |
| Borrowings | (22,910) | | (7,052) | | (14,118) | | (1,385) | | (45,465) | | | (12,210) | | (5,351) | | (12,660) | | (999) | | (31,220) | |
| Pre-derivative position | (21,074) | | (7,052) | | (12,605) | | (1,385) | | (42,116) | | | (10,932) | | (5,351) | | (11,439) | | (999) | | (28,721) | |
| Derivative effect | (1,378) | | 6,849 | | (7,570) | | 1,406 | | (693) | | | (826) | | 5,459 | | (5,494) | | 1,036 | | 175 | |
| Net debt position | (22,452) | | (203) | | (20,175) | | 21 | | (42,809) | | | (11,758) | | 108 | | (16,933) | | 37 | | (28,546) | |
The exposure to dollars largely relates to our net investment hedge activities and exposure to euros largely relates to hedges for our future non-sterling capital expenditure.
The currency exposure on other financial instruments is as follows:
| | | | | | | | | | | | | | | | | | | | | | | | | | | | | | | | | | | |
| 2022 | | 2021 |
| Sterling
£m | Euro
£m | Dollar
£m | Other
£m | Total
£m | | Sterling £m | Euro £m | Dollar £m | Other £m | Total £m |
| Trade and other receivables | 407 | | — | | 1,788 | | — | | 2,195 | | | 282 | | — | | 1,387 | | — | | 1,669 | |
| Trade and other payables | (1,459) | | — | | (2,554) | | — | | (4,013) | | | (1,207) | | — | | (1,878) | | — | | (3,085) | |
| Other non-current liabilities | (90) | | — | | (253) | | — | | (343) | | | (77) | | — | | (288) | | — | | (365) | |
The carrying amounts of other financial instruments are denominated in the above currencies, which in most instances are the functional currency of the respective subsidiaries. Our exposure to dollars is due to activities in our US subsidiaries. We do not have any other significant exposure to currency risk on these balances.
Hedge accounting for currency risk
Where available, derivatives transacted for hedging are designated for hedge accounting. Economic offset is qualitatively determined because the critical terms (currency and volume) of the hedging instrument match the hedged exposure. If a forecast transaction was no longer expected to occur, the cumulative gain or loss previously reported in equity would be transferred to the income statement. This has not occurred in the current or comparative years.
Cash flow hedging of currency risk of capital expenditure and revenues is designated as hedging the exposure to movements in the spot translation rates only. The timing of forecasted transactions is not designated as a hedged risk. Gains and losses on hedging instruments arising from forward points and foreign currency basis spreads are excluded from designation and are recognised immediately in profit or loss, along with any hedge ineffectiveness. On recognition of the hedged purchase or sale in the financial statements, the associated hedge gains and losses, deferred in the cash flow hedge reserve in other equity reserves, are transferred out of reserves and included with the recognition of the underlying transaction. Where a non-financial asset or a non-financial liability results from a forecast transaction or firm commitment being hedged, the amounts deferred in reserves are included directly in the initial measurement of that asset or liability.
Net investment hedging is also designated as hedging the exposure to movements in spot translation rates only: spot-related gains and losses on hedging instruments are presented in the cumulative translation reserve within other equity reserves to offset gains or losses on translation of the hedged balance sheet exposure. Any ineffectiveness is recognised immediately in the income statement. Amounts deferred in the cumulative translation reserve with respect to net investment hedges are subsequently recognised in the income statement in the event of disposal of the overseas operations concerned. Any remaining amounts deferred in the cost of hedging reserve are also released to the income statement.
Hedges of foreign currency funding are designated as cash flow hedges or fair value hedges of forward exchange risk (hedging both currency and interest rate risk together, where applicable). Gains and losses arising from foreign currency basis spreads are excluded from designation and are treated as a cost of hedging, deferred initially in other equity reserves and released into profit or loss over the life of the hedging relationship. Hedge accounting for funding is described further in the interest rate risk section below.
National Grid plc Annual Report and Accounts 2021/22 215
Notes to the consolidated financial statements continued
32. Financial risk management continued
(d) Interest rate risk
National Grid’s interest rate risk arises from our long-term borrowings. Our interest rate risk management policy is to seek to minimise total financing costs (being interest costs and changes in the market value of debt). Hedging instruments principally consist of interest rate and cross-currency swaps that are used to translate foreign currency debt into functional currency and to adjust the proportion of fixed-rate and floating-rate in the borrowings portfolio to within a range set by the Finance Committee of the Board. The benchmark interest rates hedged are currently based on LIBOR for USD and Sterling Overnight Index Average (SONIA) for GBP.
LIBOR is being replaced as an interest rate benchmark by alternative reference rates in certain currencies including our functional currencies, USD and GBP, and foreign currencies in which we operate. This impacts contracts including financial liabilities that pay LIBOR-based cash flows, and derivatives that receive or pay LIBOR-based cash flows. The change in benchmark also affects discount rates which will impact the valuations of certain liabilities. We have disclosed our exposure to LIBOR on our derivative portfolio in note 17, on our borrowings in note 21 and on our hedging arrangements in note 32(e). We are managing the risk by transitioning LIBOR cash flows to alternative reference rates on our affected contracts in line with the relevant jurisdictions. The migration project is underway, with all affected contracts where we previously paid or received GBP LIBOR amended in the year to 31 March 2022 (see note 21). The Finance Committee of the Board have delegated to the treasury department the authority to determine which benchmarks are the most appropriate. A combination of LIBOR and the successor benchmarks, primarily GBP SONIA and USD Secured Overnight Financing Rate (SOFR) will be used in the portfolio during the migration period.
We also consider inflation risk and hold some inflation-linked borrowings. We believe that these provide a partial economic offset to the inflation risk associated with our UK inflation-linked revenues.
The table in note 21 sets out the carrying amount, by contractual maturity, of borrowings that are exposed to interest rate risk before taking into account interest rate swaps.
Net debt was managed using derivative financial instruments to hedge interest rate risk as follows:
| | | | | | | | | | | | | | | | | | | | | | | | | | | | | | | | | | | |
| 2022 | | 2021 |
| Fixed rate £m | Floating rate £m | Inflation linked £m | Other1 £m | Total £m | | Fixed rate £m | Floating rate £m | Inflation linked £m | Other1 £m | Total £m |
| Cash and cash equivalents | 82 | | 118 | | — | | 4 | | 204 | | | 64 | | 67 | | — | | 26 | | 157 | |
| Financial investments | — | | 3,107 | | — | | 38 | | 3,145 | | | — | | 2,309 | | — | | 33 | | 2,342 | |
| Borrowings | (30,616) | | (10,484) | | (4,365) | | — | | (45,465) | | | (23,163) | | (1,762) | | (6,295) | | — | | (31,220) | |
| Pre-derivative position | (30,534) | | (7,259) | | (4,365) | | 42 | | (42,116) | | | (23,099) | | 614 | | (6,295) | | 59 | | (28,721) | |
| Derivative effect | 2,860 | | (3,366) | | (187) | | — | | (693) | | | 2,869 | | (2,511) | | (183) | | — | | 175 | |
| Net debt position | (27,674) | | (10,625) | | (4,552) | | 42 | | (42,809) | | | (20,230) | | (1,897) | | (6,478) | | 59 | | (28,546) | |
1. Represents financial instruments which are not directly affected by interest rate risk, such as investments in equity or other similar financial instruments.
Hedge accounting for interest rate risk
Borrowings paying variable or floating-rates expose National Grid to cash flow interest rate risk, partially offset by cash held at variable rates. Where a hedging instrument results in paying a fixed-rate, it is designated as a cash flow hedge because it has reduced the cash flow volatility of the hedged borrowing. Changes in the fair value of the derivative are initially recognised in other comprehensive income as gains or losses in the cash flow hedge reserve, with any ineffective portion recognised immediately in the income statement.
Borrowings paying fixed-rates expose National Grid to fair value interest rate risk. Where the hedging instrument pays a floating-rate, it is designated as a fair value hedge because it has reduced the fair value volatility of the borrowing. Changes in the fair value of the derivative and changes in the fair value of the hedged item in relation to the risk being hedged are both adjusted on the balance sheet and offset in the income statement to the extent the fair value hedge is effective, with the residual difference remaining as ineffectiveness.
Both types of hedges are designated as hedging the currency and interest rate risk arising from changes in forward points. Amounts accumulated in the cash flow hedge reserve (cash flow hedges only) and the deferred cost of hedging reserve (both cash flow and fair value hedges) are reclassified from reserves to the income statement on a systematic basis as hedged interest expense is recognised. Adjustments made to the carrying value of hedged items in fair value hedges are similarly released to the income statement to match the timing of the hedged interest expense.
When hedge accounting is discontinued, any remaining cumulative hedge accounting balances continue to be released to the income statement to match the impact of outstanding hedged items. Any remaining amounts deferred in the cost of hedging reserve are released immediately to the income statement as finance costs.
The Group early-adopted Phase I of IFRS Interest Rate Benchmark Reform amendments related to hedge accounting with effect from 1 April 2019, and Phase II with effect from 1 April 2020. The amendments impact our fair value hedging relationships where derivative cash flows will have been transitioned from paying LIBOR to paying an alternative reference rate. The hedged risk must be re-documented to reflect this, and allow existing hedge designations to continue unchanged during the period of uncertainty relating to the timing and method of benchmark migrations. This process has been completed for sterling LIBOR contracts but remains in progress for US dollar contracts.
The amendments will be applied until the earliest point in time of the Group’s contracts that reference LIBOR being amended, the hedging relationship being formally discontinued or formal market conventions ending uncertainty being published and widely adopted. If amended cash flows do not cause a hedging relationship to be discontinued, then the amendments will cease to be applied only when that relationship is discontinued under IFRS 9.
The IFRS amendments impact fair value and cash flow hedges of interest rate risk and related hedging instruments, and certain net investment hedges that use cross-currency interest rate swaps to pay a foreign currency floating rate and receive a functional currency floating rate. The notional values of hedging instruments, for each type of hedging relationship impacted, are shown in the hedge accounting tables in note 32(e). These amounts also correspond to the exposures designated as hedged.
216 National Grid plc Annual Report and Accounts 2021/22
32. Financial risk management continued
(e) Hedge accounting
In accordance with the requirements of IFRS 7, certain additional information about hedge accounting is disaggregated by risk type and hedge designation type in the tables below:
| | | | | | | | | | | | | | |
| Year ended 31 March 2022 | Fair value hedges of foreign currency and interest rate risk
£m | Cash flow hedges of foreign currency and interest rate risk
£m | Cash flow hedges of foreign currency risk
£m | Net investment hedges
£m |
| Consolidated statement of comprehensive income | | | | |
| Net gains/(losses) in respect of: | | | | |
| Cash flow hedges | — | | (103) | | (1) | | — | |
| Cost of hedging | (7) | | 16 | | — | | (7) | |
| | | | |
| Transferred to profit or loss in respect of: | | | | |
| Cash flow hedges | — | | 43 | | — | | — | |
| Cost of hedging | 1 | | — | | — | | (2) | |
| | | | |
| Consolidated statement of changes in equity | | | | |
| Other equity reserves – cost of hedging balances | (15) | | (16) | | — | | (3) | |
| | | | |
| Consolidated statement of financial position | | | | |
Derivatives – carrying value of hedging instruments¹ | | | | |
| Assets – current | — | | — | | 1 | | 10 | |
| Assets – non-current | 49 | | 67 | | 1 | | 82 | |
| Liabilities – current | (21) | | (22) | | (37) | | (16) | |
| Liabilities – non-current | (310) | | (303) | | (8) | | — | |
| | | | |
| Profiles of the significant timing, price and rate information of hedging instruments | | | | |
| Maturity range | Jul 2022 – Sep 2044 | Jun 2022 – Nov 2040 | Apr 2022 – Feb 2027 | Sep 2022 – Sep 2027 |
| Spot foreign exchange range: | | | | |
| GBP:USD | n/a | 1.30 – 1.66 | 1.34 – 1.41 | 1.22 – 1.34 |
| GBP:EUR | 1.11 – 1.24 | 1.08 – 1.24 | 1.04 – 1.19 | 1.18 |
| EUR:USD | 1.13 – 1.17 | 1.13 – 1.15 | n/a | n/a |
| Interest rate range: | | | | |
| GBP | SONIA +84bps/+374bps | 0.976% – 7.410% | n/a | n/a |
| USD | LIBOR +68bps/+115bps | 2.095% – 3.864% | n/a | n/a |
1. The use of derivatives may entail a derivative transaction qualifying for more than one hedge type designation under IFRS 9. Therefore, the derivative amounts in the table above are grossed up by hedge type, whereas they are presented net at an instrument level in the statement of financial position.
National Grid plc Annual Report and Accounts 2021/22 217
Notes to the consolidated financial statements continued
32. Financial risk management continued
(e) Hedge accounting continued
| | | | | | | | | | | | | | |
| Year ended 31 March 2021 | Fair value hedges of foreign currency and interest rate risk
£m | Cash flow hedges of
foreign currency and
interest rate risk
£m | Cash flow hedges of
foreign currency risk
£m | Net investment hedges
£m |
| Consolidated statement of comprehensive income | | | | |
| Net losses in respect of: | | | | |
| Cash flow hedges | — | | 14 | | (14) | | — | |
| Cost of hedging | (15) | | (24) | | — | | 50 | |
| | | | |
| Transferred to profit or loss in respect of: | | | | |
| Cash flow hedges | — | | 56 | | — | | — | |
| Cost of hedging | 1 | | 2 | | — | | — | |
| | | | |
| Consolidated statement of changes in equity | | | | |
| Other equity reserves – cost of hedging balances | (11) | | (30) | | — | | 6 | |
| | | | |
| Consolidated statement of financial position | | | | |
| Derivatives – carrying value of hedging instruments¹ | | | | |
| Assets – current | — | | 10 | | 2 | | 5 | |
| Assets – non-current | 187 | | 59 | | 1 | | 140 | |
| Liabilities – current | — | | (12) | | (24) | | (17) | |
| Liabilities – non-current | (113) | | (255) | | (22) | | — | |
| | | | |
| Profiles of the significant timing, price and rate information of hedging instruments | | | | |
| Maturity range | Jan 2023 – Jan 2043 | Sep 2021 – Nov 2040 | Apr 2021 – Feb 2027 | Mar 2022 – Sep 2027 |
| Spot foreign exchange range: | | | | |
| GBP:USD | 1.64 | 1.30 – 1.66 | 1.31 – 1.41 | 1.22 – 1.40 |
| GBP:EUR | 1.11 – 1.24 | 1.08 – 1.24 | 1.04 – 1.29 | 1.15 – 1.16 |
| EUR:USD | 1.13 – 1.17 | 1.13 – 1.14 | n/a | n/a |
| Interest rate range: | | | | |
| GBP | LIBOR +30bps/+408bps | 0.976% – 5.845% | n/a | n/a |
| USD | LIBOR –68bps/+115bps | 2.513% – 3.864% | n/a | n/a |
1. The use of derivatives may entail a derivative transaction qualifying for more than one hedge type designation under IFRS 9. Therefore, the derivative amounts in the table above are grossed up by hedge type, whereas they are presented net at an instrument level in the statement of financial position.
218 National Grid plc Annual Report and Accounts 2021/22
32. Financial risk management continued
(e) Hedge accounting continued
The following tables show the effects of hedge accounting on financial position and year-to-date performance for each type of hedge. These tables also present notional values of hedging instruments (and equal hedged exposures) impacted by IFRS 9 Interest Rate Benchmark Reform amendments.
(i) Fair value hedges of foreign currency and interest rate risk on recognised borrowings:
| | | | | | | | | | | | | | | | | | | | | | | | | | | | | |
| As at 31 March 2022 | | | Balance of fair value hedge adjustments in borrowings | | Change in value used for calculating ineffectiveness | | |
| Hedging instrument notional | | Continuing hedges | Discontinued hedges | | Hedged item | Hedging instrument | | Hedge ineffectiveness |
| Hedge type | £m | | £m | £m | | £m | £m | | £m |
Foreign currency and interest rate risk on borrowings1,2 | (3,362) | | | 437 | | (55) | | | 340 | | (301) | | | 39 | |
1. The carrying value of the hedged borrowings is £2,966 million, of which £nil is current and £2,966 million is non-current.
2. Included within the hedging instrument notional balance is £2,556 million impacted by Interest Rate Benchmark Reform amendments with £806 million still to be transitioned.
| | | | | | | | | | | | | | | | | | | | | | | | | | | | | |
| As at 31 March 2021 | | | Balance of fair value hedge adjustments in borrowings | | Change in value used for calculating ineffectiveness | | |
| Hedging instrument notional | | Continuing hedges | Discontinued hedges | | Hedged item | Hedging instrument | | Hedge ineffectiveness |
| Hedge type | £m | | £m | £m | | £m | £m | | £m |
Foreign currency and interest rate risk on borrowings1,2 | (2,755) | | | 121 | | (85) | | | 153 | | (127) | | | 26 | |
1. The carrying value of the hedged borrowings was £2,714 million, of which £nil was current and £2,714 million was non-current.
2. Included within the hedging instrument notional balance was £2,679 million impacted by Interest Rate Benchmark Reform amendments.
(ii) Cash flow hedges of foreign currency and interest rate risk:
| | | | | | | | | | | | | | | | | | | | | | | | | | | | | |
| As at 31 March 2022 | | | Balance in cash flow hedge reserve | | Change in value used for calculating ineffectiveness | | |
| Hedging instrument notional | | Continuing hedges | Discontinued hedges | | Hedged item | Hedging instrument | | Hedge ineffectiveness |
| Hedge type | £m | | £m | £m | | £m | £m | | £m |
Foreign currency and interest rate risk on borrowings¹ | (6,287) | | | (48) | | — | | | 74 | | (74) | | | — | |
| Foreign currency risk on forecasted cash flows | (835) | | | (40) | | 1 | | | 18 | | (18) | | | — | |
1. Included within the hedging instrument notional balance is £100 million impacted by Interest Rate Benchmark Reform amendments.
| | | | | | | | | | | | | | | | | | | | | | | | | | | | | |
| As at 31 March 2021 | | | Balance in cash flow hedge reserve | | Change in value used for calculating ineffectiveness | | |
| Hedging instrument notional | | Continuing hedges | Discontinued hedges | | Hedged item | Hedging instrument | | Hedge ineffectiveness |
| Hedge type | £m | | £m | £m | | £m | £m | | £m |
Foreign currency and interest rate risk on borrowings¹ | (4,884) | | | (11) | | (6) | | | (16) | | 16 | | | — | |
| Foreign currency risk on forecasted cash flows | (988) | | | (31) | | 3 | | | 17 | | (17) | | | — | |
1. Included within the hedging instrument notional balance was £176 million impacted by Interest Rate Benchmark Reform amendments.
(iii) Net investment hedges of foreign currency risk:
| | | | | | | | | | | | | | | | | | | | | | | | | | | | | |
| As at 31 March 2022 | | | Balance in translation reserve | | Change in value used for calculating ineffectiveness | | |
| Hedging instrument notional | | Continuing hedges | Discontinued hedges | | Hedged item | Hedging instrument | | Hedge ineffectiveness |
| Hedge type | £m | | £m | £m | | £m | £m | | £m |
Currency risk on foreign operations¹ | (3,489) | | | (125) | | (2,643) | | | 125 | | (125) | | | — | |
1. Included within the hedging instrument notional balance is £nil impacted by Interest Rate Benchmark Reform amendments.
| | | | | | | | | | | | | | | | | | | | | | | | | | | | | |
| As at 31 March 2021 | | | Balance in translation reserve | | Change in value used for calculating ineffectiveness | | |
| Hedging instrument notional | | Continuing hedges | Discontinued hedges | | Hedged item | Hedging instrument | | Hedge ineffectiveness |
| Hedge type | £m | | £m | £m | | £m | £m | | £m |
| Currency risk on foreign operations¹ | (2,786) | | | 183 | | (2,826) | | | (183) | | 183 | | | — | |
1. Included within the hedging instrument notional balance was £nil impacted by Interest Rate Benchmark Reform amendments.
National Grid plc Annual Report and Accounts 2021/22 219
Notes to the consolidated financial statements continued
32. Financial risk management continued
(f) Commodity price risk
We purchase electricity and gas to supply our customers in the US and to meet our own energy needs. Substantially all our costs of purchasing electricity and gas for supply to customers are recoverable at an amount equal to cost. The timing of recovery of these costs can vary between financial periods leading to an under- or over-recovery within any particular year that can lead to large fluctuations in the income statement. We follow approved policies to manage price and supply risks for our commodity activities.
Our energy procurement risk management policy and delegations of authority govern our US commodity trading activities for energy transactions. The purpose of this policy is to ensure we transact within pre-defined risk parameters and only in the physical and financial markets where we or our customers have a physical market requirement. In addition, state regulators require National Grid to manage commodity risk and cost volatility prudently through diversified pricing strategies. In some jurisdictions we are required to file a plan outlining our strategy to be approved by regulators. In certain cases, we might receive guidance with regard to specific hedging limits.
Energy purchase contracts for the forward purchase of electricity or gas that are used to satisfy physical delivery requirements to customers, or for energy that the Group uses itself, meet the expected purchase or usage requirements of IFRS 9. They are, therefore, not recognised in the financial statements until they are realised. Disclosure of commitments under such contracts is made in note 30.
US states have introduced a variety of legislative requirements with the aim of increasing the proportion of our electricity that is derived from renewable or other forms of clean energy. Annual compliance filings regarding the level of Renewable Energy Certificates (and other similar environmental certificates) are required by the relevant department of utilities. In response to the legislative requirements, National Grid has entered into long-term, typically fixed-price, energy supply contracts to purchase both renewable energy and environmental certificates. We are entitled to recover all costs incurred under these contracts through customer billing.
Under IFRS, where these supply contracts are not accounted for as leases, they are considered to comprise two components, being a forward purchase of power at spot prices, and a forward purchase of environmental certificates at a variable price (being the contract price less the spot power price). With respect to our current contracts, neither of these components meets the requirement to be accounted for as a derivative. The environmental certificates are currently required for compliance purposes, and at present there are no liquid markets for these attributes. Accordingly, this component meets the expected purchase or usage exemption of IFRS 9. We expect to enter into an increasing number of these contracts, in order to meet our compliance requirements in the short to medium term. In future, if and when liquid markets develop, and to the extent that we are in receipt of environmental certificates in excess of our required levels, this exemption may cease to apply, and we may be required to account for forward purchase commitments for environmental certificates as derivatives at fair value through profit and loss.
220 National Grid plc Annual Report and Accounts 2021/22
32. Financial risk management continued
(g) Fair value analysis
Included in the statement of financial position are financial instruments which are measured at fair value. These fair values can be categorised into hierarchy levels that are representative of the inputs used in measuring the fair value. The best evidence of fair value is a quoted price in an actively traded market. In the event that the market for a financial instrument is not active, a valuation technique is used.
| | | | | | | | | | | | | | | | | | | | | | | | | | | | | |
| 2022 | | 2021 |
| Level 1
£m | Level 2
£m | Level 3
£m | Total
£m | | Level 1 £m | Level 2 £m | Level 3 £m | Total £m |
| Assets | | | | | | | | | |
| Investments held at FVTPL | 2,292 | | — | | 417 | | 2,709 | | | 1,768 | | — | | 240 | | 2,008 | |
| Investments held at FVOCI¹ | — | | 413 | | — | | 413 | | | 99 | | 416 | | — | | 515 | |
| Financing derivatives | — | | 298 | | — | | 298 | | | — | | 942 | | — | | 942 | |
| Commodity contract derivatives | — | | 238 | | 51 | | 289 | | | — | | 12 | | 45 | | 57 | |
| 2,292 | | 949 | | 468 | | 3,709 | | | 1,867 | | 1,370 | | 285 | | 3,522 | |
| Liabilities | | | | | | | | | |
| Financing derivatives | — | | (804) | | (187) | | (991) | | | — | | (584) | | (183) | | (767) | |
| Commodity contract derivatives | — | | (15) | | (7) | | (22) | | | — | | (75) | | (57) | | (132) | |
| Liabilities held at fair value | — | | — | | — | | — | | | (682) | | — | | — | | (682) | |
| Contingent consideration² | — | | — | | (41) | | (41) | | | — | | — | | (57) | | (57) | |
| — | | (819) | | (235) | | (1,054) | | | (682) | | (659) | | (297) | | (1,638) | |
| 2,292 | | 130 | | 233 | | 2,655 | | | 1,185 | | 711 | | (12) | | 1,884 | |
1. Investments held includes instruments which meet the criteria of IFRS 9 or IAS 19.
2. Contingent consideration relates to the acquisition of National Grid Renewables.
| | | | | |
Level 1: | Financial instruments with quoted prices for identical instruments in active markets. |
| |
Level 2: | Financial instruments with quoted prices for similar instruments in active markets or quoted prices for identical or similar instruments in inactive markets, and financial instruments valued using models where all significant inputs are based directly or indirectly on observable market data. |
| |
Level 3: | Financial instruments valued using valuation techniques where one or more significant inputs are based on unobservable market data. |
Our Level 1 financial investments and liabilities held at fair value are valued using quoted prices from liquid markets.
Our Level 2 financial investments held at fair value are valued using quoted prices for similar instruments in active markets, or quoted prices for identical or similar instruments in inactive markets. Alternatively, they are valued using models where all significant inputs are based directly or indirectly on observable market data.
Our Level 2 financing derivatives include cross-currency, interest rate and foreign exchange derivatives. We value these by discounting all future cash flows by externally sourced market yield curves at the reporting date, taking into account the credit quality of both parties. These derivatives can be priced using liquidly traded interest rate curves and foreign exchange rates, and therefore we classify our vanilla trades as Level 2 under the IFRS 13 framework.
Our Level 2 commodity contract derivatives include over-the-counter gas and power swaps as well as forward physical gas deals. We value our contracts based on market data obtained from the New York Mercantile Exchange (NYMEX) and the Intercontinental Exchange (ICE) where monthly prices are available. We discount based on externally sourced market yield curves at the reporting date, taking into account the credit quality of both parties and liquidity in the market. Our commodity contracts can be priced using liquidly traded swaps. Therefore, we classify our vanilla trades as Level 2 under the IFRS 13 framework.
Our Level 3 financing derivatives include inflation-linked swaps, where the market is illiquid. In valuing these instruments, we use in-house valuation models and obtain external valuations to support each reported fair value.
Our Level 3 commodity contract derivatives primarily consist of our forward purchases of electricity and gas that we value using proprietary models. Derivatives are classified as Level 3 where significant inputs into the valuation technique are neither directly nor indirectly observable (including our own data, which are adjusted, if necessary, to reflect the assumptions market participants would use in the circumstances).
Our Level 3 investments include equity instruments accounted for at fair value through profit and loss. These equity holdings are part of our corporate venture capital portfolio held by National Grid Partners and comprise a series of small unquoted investments where prices or valuation inputs are unobservable. These investments are either recently acquired or there have been recent funding rounds with third parties and therefore the valuation is based on the latest transaction price and any subsequent investment-specific adjustments.
Our Level 3 investments also include our investment in Sunrun Neptune 2016 LLC, which is accounted for at fair value through profit and loss. The investment is fair valued by discounting expected cash flows using a weighted average cost of capital specific to Sunrun Neptune 2016 LLC.
In light of the current ongoing impact of the COVID-19 pandemic, the valuations of certain assets and liabilities can be more subjective. While there have been significant movements in market indices, we are satisfied that there has been no significant impact on the fair values of our financial instruments measured at fair value, and that any impact is reflected in the fair values in the table above.
National Grid plc Annual Report and Accounts 2021/22 221
Notes to the consolidated financial statements continued
32. Financial risk management continued
(g) Fair value analysis continued
The changes in value of our Level 3 financial instruments are as follows:
| | | | | | | | | | | | | | | | | | | | | | | | | | | | | | | | | | | |
| Financing derivatives | | Commodity contract
derivatives | | Other3 | | Total |
| 2022 | 2021 | | 2022 | 2021 | | 2022 | 2021 | | 2022 | 2021 |
| £m | £m | | £m | £m | | £m | £m | | £m | £m |
| At 1 April | (183) | | (235) | | | (12) | | 2 | | | 183 | | 137 | | | (12) | | (96) | |
Net gains/(losses) for the year1,2 | (4) | | 51 | | | 56 | | (16) | | | 102 | | (2) | | | 154 | | 33 | |
| Purchases | — | | — | | | 17 | | (1) | | | 93 | | 32 | | | 110 | | 31 | |
| Settlements | — | | 1 | | | (17) | | (1) | | | (2) | | 16 | | | (19) | | 16 | |
| Reclassification to held for sale (note 10) | — | | — | | | — | | 4 | | | — | | — | | | — | | 4 | |
| At 31 March | (187) | | (183) | | | 44 | | (12) | | | 376 | | 183 | | | 233 | | (12) | |
1. Loss of £4 million (2021: £51 million gain) is attributable to derivative financial instruments held at the end of the reporting period and has been recognised in finance costs in the income statement.
2. Gain of £27 million (2021: £46 million loss) is attributable to commodity contract derivative financial instruments held at the end of the reporting period.
3. Other comprises our investments in Sunrun Neptune 2016 LLC and the investments made by National Grid Partners, which are accounted for at fair value through profit and loss as well as the contingent consideration arising from the acquisition of National Grid Renewables.
The impacts on a post-tax basis of reasonably possible changes in significant Level 3 assumptions are as follows:
| | | | | | | | | | | | | | | | | | | | | | | | | | |
| Financing derivatives | | Commodity contract derivatives | | Other3 |
| 2022 | 2021 | | 2022 | 2021 | | 2022 | 2021 |
| £m | £m | | £m | £m | | £m | £m |
| 10% increase in commodity prices¹ | — | | — | | | 9 | | 3 | | | — | | — | |
| 10% decrease in commodity prices¹ | — | | — | | | (8) | | (1) | | | — | | — | |
| +10% market area price change | — | | — | | | — | | (4) | | | — | | — | |
| -10% market area price change | — | | — | | | — | | 7 | | | — | | — | |
| +20 basis points change in Limited Price Inflation (LPI) market curve² | (84) | | (83) | | | — | | — | | | — | | — | |
| -20 basis points change in LPI market curve² | 82 | | 83 | | | — | | — | | | — | | — | |
| +50 basis points change in discount rate | — | | — | | | — | | — | | | (10) | | (5) | |
| -50 basis points change in discount rate | — | | — | | | — | | — | | | 10 | | 5 | |
1. Level 3 commodity price sensitivity is included within the sensitivity analysis disclosed in note 35.
2. A reasonably possible change in assumption of other Level 3 derivative financial instruments is unlikely to result in a material change in fair values.
3. The investments acquired in the period were on market terms, and sensitivity is considered insignificant at 31 March 2022.
The impacts disclosed above were considered on a contract-by-contract basis with the most significant unobservable inputs identified.
222 National Grid plc Annual Report and Accounts 2021/22
32. Financial risk management continued
(h) Capital risk management
The capital structure of the Group consists of shareholders’ equity, as disclosed in the consolidated statement of changes in equity, and net debt (note 29). National Grid’s objectives when managing capital are: to safeguard our ability to continue as a going concern; to remain within regulatory constraints of our regulated operating companies; and to maintain an efficient mix of debt and equity funding thus achieving an optimal capital structure and cost of capital. We regularly review and manage the capital structure as appropriate in order to achieve these objectives.
Maintaining appropriate credit ratings for our operating and holding companies is an important aspect of our capital risk management strategy and balance sheet efficiency. We monitor our balance sheet efficiency using several metrics including retained cash flow/net debt (RCF/debt), regulatory gearing and interest cover. For the year ended 31 March 2022, these metrics for the Group were 8.9% (2021: 6.6%), 81% (2021: 65%) and 4.7x (2021: 4.5x), respectively. As expected, regulatory gearing at 31 March 2022 was higher than our long-run projections due to the fact that we are only part way through the transactions that make up our strategic pivot. Once the strategic pivot is complete, we expect to continue to generate strong cash flows and for regulatory gearing to decrease and to settle at slightly above 70%. As a result, and combined with the benefit of our hybrid debt, we expect gearing levels, and the other standard metrics we monitor, to be consistent with our current, strong investment grade, overall Group credit rating.
We monitor the RAV gearing within National Grid Electricity Transmission plc (NGET), WPD and the regulated transmission business within National Grid Gas plc (NGG) which became a discontinued operation in the period (see note 10). This is calculated as net debt expressed as a percentage of RAV, and indicates the level of debt employed to fund our UK regulated businesses. It is compared with the level of RAV gearing indicated by Ofgem as being appropriate for these businesses, at around 55% to 65%. We also monitor net debt as a percentage of rate base for our US operating companies, comparing this with the allowed rate base gearing inherent within each of our agreed rate plans, typically around 50%.
As part of the Group’s debt financing arrangements, we are subject to a number of financial covenants associated with existing borrowings and facility arrangements:
•the requirement to maintain subsidiary indebtedness relating to non-US and US subsidiaries (excluding National Grid North America Inc.) limiting the total indebtedness in absolute terms to £35 billion for non-US Subsidiaries and $35 billion for US subsidiaries. As at 31 March 2022, headroom on these covenants exceeds £10 billion;
•The Articles of Association of National Grid plc limit Group total borrowings less cash and short-term investments in absolute terms to £55 billion. As at 31 March 2022 headroom on the limit exceeds £10 billion;
•Interest cover ratios relating to the WPD companies within the Group requiring a consolidated EBITDA to interest payable of not less than 3:1. These covenants range in outturn from 5:1 to 6:1 at the reporting date; and
•Net debt to RAV gearing covenants limiting gearing to 85% of RAV for each WPD operating company. As at 31 March 2022, actual gearing of less than 60% is reported for all impacted companies.
We consider the risk of breaching these covenants as remote given the level of headroom present.
The majority of our regulated operating companies in the US and the UK are subject to certain restrictions on the payment of dividends by administrative order, contract and/or licence. The types of restrictions that a company may have that would prevent a dividend being declared or paid unless they are met include:
• the requirement to notify by certification to regulators and certain lenders;
• dividends must be approved in advance by the relevant US state regulatory commission;
• the subsidiary must have one or two recognised rating agency credit ratings of at least investment grade depending on contractual requirements;
• dividends must be limited to cumulative retained earnings, including pre-acquisition retained earnings and in line with relevant company legislation;
• the securities of National Grid plc must maintain an investment grade credit rating, and if that rating is the lowest investment grade bond rating it cannot have a negative watch/review for downgrade notice by a credit rating agency;
• the subsidiary must not carry out any activities other than those permitted by the licences;
• the subsidiary must not create any cross-default obligations or give or receive any intra-group cross-subsidies;
• the percentage of equity compared with total capital of the subsidiary must remain above certain levels; and
• in the case of WPD, the percentage of debt compared with total RAV of the subsidiary must remain below 85%.
These restrictions are subject to alteration in the US as and when a new rate case or rate plan is agreed with the relevant regulatory bodies for each operating company and, in the UK, through the normal licence review process.
As most of our business is regulated, at 31 March 2022 the majority of our net assets are subject to some of the restrictions noted above. These restrictions are not considered to be significantly onerous, nor do we currently expect they will prevent the planned payment of dividends in future in line with our dividend policy.
All the above requirements are monitored on a regular basis in order to ensure compliance. The Group has complied with all externally imposed capital requirements to which it is subject.
National Grid plc Annual Report and Accounts 2021/22 223
Notes to the consolidated financial statements continued
33. Borrowing facilities
| | |
To support our liquidity requirements and provide backup to commercial paper and other borrowings, we agree committed credit facilities with financial institutions over and above the value of borrowings that may be required. These committed credit facilities are undrawn. |
At 31 March 2022, we had bilateral committed credit facilities of £5,978 million (2021: £5,410 million). In addition, we had committed credit facilities from syndicates of banks of £936 million at 31 March 2022 (2021: £115 million). An analysis of the maturity of these undrawn committed facilities is shown below:
| | | | | | | | |
| 2022 | 2021 |
| £m | £m |
| Undrawn committed borrowing facilities expiring: | | |
| Less than 1 year | — | | — | |
| In 1 to 2 years | 936 | | 1,668 | |
| In 2 to 3 years | 4,373 | | 534 | |
| In 3 to 4 years | 1,605 | | 1,718 | |
| In 4 to 5 years | — | | 1,605 | |
| More than 5 years | — | | — | |
| 6,914 | | 5,525 | |
Of the unused facilities at 31 March 2022, £6,823 million (2021: £5,410 million) is available for liquidity purposes, while £91 million (2021: £115 million) is available as backup to specific US borrowings. The increase in total facility positions reflects the increased size of the Group following the acquisition of WPD. £845 million of the undrawn syndicated facilities due to mature in one to two years were renegotiated between 1 April and 19 May 2022, with no uplift in the amount and a new expiry date of May 2025.
Included in the table above within three to four years is a facility of £350 million related to National Grid Gas plc, a company treated as held for sale.
In addition, we have the following facilities which are not included in the table above:
•for the separately regulated business of National Grid Electricity System Operator Limited, the Group has a facility of £550 million (2021: £550 million). This facility is not available as Group general liquidity support;
•the Group continues to have access to Export Credit Agreements (ECAs) funding specific projects totalling £1,396 million (2021: £1,345 million), of which £489 million (2021: £446 million) is undrawn; and
•the Group entered into a loan facility in relation to the acquisition of WPD (see note 37) of £8,250 million (31 March 2021: £8,250 million) to finance the consideration, of which £8,179 million has been drawn since the year end with no further drawdown available (31 March 2021: undrawn). The bridge facility allows for the extension of the facility maturity date up to September 2023 but includes a requirement that the proceeds of the planned sales of NECO and the UK Gas Transmission business are applied to repay the facility.
224 National Grid plc Annual Report and Accounts 2021/22
34. Subsidiary undertakings, joint ventures and associates
| | |
| While we present consolidated results in these financial statements as if we were one company, our legal structure is such that there are a number of different operating and holding companies that contribute to the overall result. This structure has evolved through acquisitions as well as regulatory requirements to have certain activities within separate legal entities. |
Subsidiary undertakings
A list of the Group’s subsidiaries as at 31 March 2022 is given below. The entire share capital of subsidiaries is held within the Group except where the Group’s ownership percentages are shown. These percentages give the Group’s ultimate interest and therefore allow for the situation where subsidiaries are owned by partly owned intermediate subsidiaries. Where subsidiaries have different classes of shares, this is largely for historical reasons, and the effective percentage holdings given represent both the Group’s voting rights and equity holding. Shares in National Grid (US) Holdings Limited, National Grid (US) Investments 2 Limited, National Grid Hong Kong Limited, National Grid Luxembourg SARL and NGG Finance plc are held directly by National Grid plc. All other holdings in subsidiaries are owned by other subsidiaries within the Group. All subsidiaries are consolidated in the Group’s financial statements.
Principal Group companies are identified in bold. These companies are incorporated and principally operate in the countries under which they are shown. All entities incorporated in the United States are taxed in the United States on their worldwide income other than where indicated in the footnotes below. Other entities are tax resident in their jurisdiction of incorporation other than where indicated in the footnotes below.
Incorporated in England and Wales
Registered office: 1–3 Strand, London WC2N 5EH, UK (unless stated otherwise in footnotes).
| | |
| Birch Sites Limited |
| Carbon Sentinel Limited |
Central Networks Trustees Limited1 |
| Droylsden Metering Services Limited |
| Gridcom Limited |
Hyder Profit Sharing Trustees Limited1 |
| Icelink Interconnector Limited |
Kelston Properties 2 Limited1 |
| Lattice Group Employee Benefit Trust Limited |
| Lattice Group Limited |
| Lattice Group Trustees Limited |
Meter Operator Services Limited*1 |
Meter Reading Services Limited*1 |
| Natgrid Limited |
NatGrid One Limited2 |
NatgridTW1 Limited2 |
National Grid (US) Holdings Limited2 |
National Grid (US) Investments 2 Limited2 |
National Grid (US) Investments 4 Limited2 |
National Grid (US) Partner 1 Limited2 |
| National Grid Carbon Limited |
| National Grid Commercial Holdings Limited |
| National Grid Distributed Energy Limited |
| National Grid Electricity Group Trustee Limited |
| National Grid Electricity System Operator Limited |
| National Grid Electricity Transmission plc |
| National Grid Energy Metering Limited |
| National Grid Gas Holdings Limited |
| National Grid Gas plc |
| National Grid Grain LNG Limited |
National Grid Holdings Limited2 |
| National Grid Holdings One plc |
| National Grid Hydrogen Limited |
| National Grid IFA 2 Limited |
| National Grid Interconnector Holdings Limited |
| National Grid Interconnectors Limited |
National Grid International Limited2 |
| National Grid Metering Limited |
| National Grid North Sea Link Limited |
| National Grid Offshore Limited |
| National Grid Partners Limited |
| National Grid Plus Limited |
| National Grid Property Holdings Limited |
| National Grid Smart Limited |
| National Grid Ten |
| National Grid Thirty Six Limited |
National Grid Twelve Limited2 |
| | |
| National Grid Twenty Eight Limited |
| National Grid Twenty Seven Limited |
National Grid Twenty Three Limited2 |
| National Grid UK Limited |
| National Grid UK Pension Services Limited |
| National Grid Ventures Limited |
| National Grid Viking Link Limited |
| National Grid William Limited |
| NG Nominees Limited |
| NGC Employee Shares Trustee Limited |
| NGG Finance plc |
| Ngrid Intellectual Property Limited |
| NGT Two Limited |
| Port Greenwich Limited |
Sheet Road Management Company Limited (51%)3 |
South Wales Electricity Share Scheme Trustees Limited1 |
South Western Helicopters Limited1 |
| Supergrid Electricity Limited |
| Supergrid Energy Transmission Limited |
| Supergrid Limited |
| Thamesport Interchange Limited |
| The National Grid Group Quest Trustee Company Limited |
| The National Grid YouPlan Trustee Limited |
| Transco Limited |
Warwick Technology Park Management Company (No 2) Limited (60.56%)4 |
Western Power Distribution (East Midlands) plc1 |
Western Power Distribution (South Wales) plc1 |
Western Power Distribution (South West) plc1 |
Western Power Distribution (West Midlands) plc1 |
Western Power Distribution Holding Company Limited1 |
Western Power Distribution Investments Limited1 |
Western Power Distribution plc1 |
Western Power Generation Limited1 |
Western Power Pension Trustee Limited1 |
WPD Distribution Network Holdings Limited1 |
WPD Investment Holdings limited1 |
WPD Island Limited1 |
WPD Limited1 |
WPD Midlands Limited1 |
WPD Midlands Networks Contracting Limited*1 |
WPD Property Investments Limited1 |
WPD Share Scheme Trustees Limited1 |
WPD Smart Metering Limited1 |
WPD Telecoms Limited1 |
WPD WEM Holdings Limited1 |
WPD WEM Limited1 |
WW Share Scheme Trustees Limited1 |
1. Registered office: Avonbank, Feeder Road, Bristol, Avon, BS2 0TB.
2. Companies where National Grid plc has issued guarantees over the liabilities of the companies as at 31 March 2022 and for which the companies are taking the exemption from the requirements of an audit for their individual financial statements as permitted by section 479A of the Companies Act.
3. Registered office: Netley Old Hall Farm, Dorrington, Shrewsbury, United Kingdom, SY5 7JY.
4. Registered office: Shire Hall, PO Box 9, Warwick CV34 4RL, UK.
* In process of strike-off.
National Grid plc Annual Report and Accounts 2021/22 225
Notes to the consolidated financial statements continued
34. Subsidiary undertakings, joint ventures and associates continued
Subsidiary undertakings continued
Incorporated in the US
Registered office: National Registered Agents, Inc., 1209 Orange Street, Wilmington, DE 19801, USA (unless stated otherwise in footnotes).
| | |
| Apple River Solar, LLC |
| Armenia Solar, LLC |
| Ashland Solar, LLC |
| Athens Solar, LLC |
| Autauga Solar, LLC |
| Banner Solar, LLC |
| Bazile Creek Wind Farm, LLC |
| Bee Hollow Solar, LLC |
| Bell Plaine Solar, LLC |
| Benevolent Solar, LLC |
Blaze Solar, LLC1 |
| Blevins Solar, LLC |
| Blue Ridge Wind, LLC |
| Blue Spring Solar, LLC |
| Blues Solar, LLC |
| Bluewater Solar, LLC |
| Boone Solar, LLC |
Boston Gas Company2 |
| Bridges Solar, LLC |
British Transco Capital, Inc.3 |
British Transco Finance, Inc.3 |
| Brock Solar, LLC |
Broken Bridge Corp.4 |
| Brook Trout Solar, LLC |
| Burley Solar, LLC |
| Burlington Solar, LLC |
| Burr Ridge Wind, LLC |
| Cage Ranch Solar II, LLC |
| Cage Ranch Solar III, LLC |
| Cage Ranch Solar, LLC |
| Caldwell Solar II, LLC |
| Caldwell Solar, LLC |
| Canby Solar, LLC |
| Cass Wind Farm, LLC |
| Cattle Ridge Wind Farm 2, LLC |
| Cedar Grove Solar, LLC |
| Centennial Solar, LLC |
| Clay Boswell Solar, LLC |
| Clear Creek Solar, LLC |
| Clermont Solar, LLC |
| Clinton County Solar, LLC |
| Coles Solar, LLC |
| Compass Prairie Wind, LLC |
Coneflower Solar, LLC5 |
| Conestoga Wind, LLC |
| Copperhead Solar, LLC |
| Creekview Solar, LLC |
| Crocker Wind Farm 2, LLC |
Dahlia Solar, LLC5 |
| Dakota Hills Wind Farm, LLC |
Day Lily Solar, LLC5 |
| Deatsville Solar, LLC |
| Deer Trail Solar, LLC |
Dodson Creek Solar, LLC6 |
| Donnellson Solar, LLC |
| Elburn Solar, LLC |
| Eldena Solar, LLC |
| Elk Creek Solar 2, LLC |
| Elk Creek Solar, LLC |
EUA Energy Investment Corporation2 |
| Exie Solar, LLC |
| Falls City Solar, LLC |
Fayette Solar, LLC7 |
| Fillmore County Solar Project, LLC |
| Firstview Wind Farm, LLC |
| Fort Solar, LLC |
| Front Range Wind Farm, LLC |
Gardenia Solar, LLC5 |
| Golden Solar, LLC |
| Goldendale Solar, LLC |
| Goldenrod Wind Farm, LLC |
| Goldfinch Solar, LLC |
| Grand Junction Solar, LLC |
Granite State Power Link LLC3 |
| Grant Solar 2, LLC |
| Grant Solar, LLC |
| Grayson Solar, LLC |
| Greenbrier Creek Solar, LLC |
| Greensky Solar, LLC |
| | |
| Greenwood Solar, LLC |
Grid NY LLC8 |
Grindstone Wind Farm, LLC9 |
| Hale County Solar, LLC |
| Hansford Energy Storage, LLC |
| Harmony Solar ND 2, LLC |
| Harmony Solar ND, LLC |
| Harrington Solar, LLC |
| Hartley Solar, LLC |
| Hearth Solar, LLC |
| Hill River Solar, LLC |
| Honeybee Solar, LLC |
| Hoosier Solar, LLC |
| Hoskins Solar, LLC |
| Illumination Solar, LLC |
| Innovation Solar, LLC |
Itasca Energy Development, LLC5 |
| Itasca Energy Services, LLC |
| Jack Rabbit Wind, LLC |
| Jackson County Solar, LLC |
| Junction Solar, LLC |
KeySpan CI Midstream Limited3 |
KeySpan Energy Corporation8 |
KeySpan Energy Services Inc.3 |
KeySpan Gas East Corporation8 |
KeySpan International Corporation3 |
KeySpan MHK, Inc.3 |
KeySpan Midstream Inc.3 |
KeySpan Plumbing Solutions, Inc.8 |
| Knox Solar, LLC |
KSI Contracting, LLC3 |
KSI Electrical, LLC3 |
KSI Mechanical, LLC3 |
| Lake Charlotte Solar, LLC |
| Lake Iris Solar, LLC |
| Lakeside Solar, LLC |
Land Management & Development, Inc.8 |
Landwest, Inc.8 |
| Lansing Solar, LLC |
| Leola Wind Farm, LLC |
| Liberty Solar, LLC |
Lilac Solar, LLC5 |
| Livingston County Solar, LLC |
| Long Mount Solar, LLC |
| Lordsburg Solar, LLC |
| Louisa Solar, LLC |
| Lowlands Solar, LLC |
| Lydia Solar, LLC |
| Marion County Solar, LLC |
Massachusetts Electric Company2 |
| Maverick Wind Farm, LLC |
| Meadowlands Solar, LLC |
Metrowest Realty LLC3 |
| Miller Creek Solar, LLC |
| Millers Ferry Solar, LLC |
| Morgan County Solar, LLC |
Morning Glory Solar, LLC5 |
| Muddy Creek Solar, LLC |
| Mustang Ridge Wind Farm, LLC |
Mystic Steamship Corporation6 |
Nantucket Electric Company2 |
National Grid Development Holdings Corp.3 |
National Grid Electric Services LLC8 |
National Grid Energy Management LLC3 |
National Grid Energy Services LLC3 |
National Grid Energy Trading Services LLC8 |
National Grid Engineering & Survey Inc.8 |
National Grid Generation LLC8 |
National Grid Generation Ventures LLC8 |
National Grid Glenwood Energy Center, LLC3 |
National Grid IGTS Corp.8 |
National Grid Insurance USA Ltd10 |
National Grid Islander East Pipeline LLC3 |
National Grid LNG GP LLC3 |
National Grid LNG LLC3 |
National Grid LNG LP LLC3 |
National Grid Millennium LLC3 |
National Grid NE Holdings 2 LLC2 |
National Grid North America Inc.3 |
226 National Grid plc Annual Report and Accounts 2021/22
34. Subsidiary undertakings, joint ventures and associates continued
Subsidiary undertakings continued
| | |
|
National Grid Partners Inc.8 |
National Grid Partners LLC3 |
National Grid Port Jefferson Energy Center LLC3 |
| National Grid Renewables Development, LLC |
National Grid Renewables E Wind, LLC5 |
National Grid Renewables Operations, LLC3 |
National Grid Renewables Projects, LLC5 |
| National Grid Renewables Stutsman, LLC |
National Grid Renewables, LLC3 |
National Grid Services Inc.3 |
National Grid US 6 LLC3,† |
National Grid US LLC3 |
National Grid USA Service Company, Inc.2 |
National Grid USA3 |
NEES Energy, Inc.2 |
New England Electric Transmission Corporation4 |
New England Energy Incorporated2 |
New England Hydro Finance Company, Inc. (53.704%)2 |
New England Hydro-Transmission Corporation (53.704%)4 |
New England Hydro-Transmission Electric Company, Inc. (53.704%)2 |
New England Power Company2 |
Newport America Corporation11 |
| Newton Solar, LLC |
NG Renewables Energy Marketing, LLC3 |
| NG Renewables Energy Services, LLC |
NGNE LLC3 |
NGV Emerald Energy Venture Holdings, LLC3 |
NGV OSW Holdings, LLC3 |
NGV US Distributed Energy Inc.3 |
NGV US Transmission Inc.3 |
NGV US, LLC3 |
Niagara Mohawk Energy, Inc.3 |
Niagara Mohawk Holdings, Inc.8 |
Niagara Mohawk Power Corporation8 |
| Niobrara Wind, LLC |
NM Properties, Inc.8 |
Noble Solar, LLC12 |
| Nordic VOS, LLC |
North East Transmission Co., Inc.3 |
| North Fork Wind, LLC |
Northeast Renewable Link LLC3 |
Opinac North America, Inc.3 |
| Parklawn Solar, LLC |
| Pennington Solar, LLC |
| Peony Solar, LLC |
Philadelphia Coke Co., Inc.3 |
| Pierce County Solar, LLC |
| Pike County Solar, LLC |
| Pipestone Solar, LLC |
| Plum Creek Wind Farm 2, LLC |
| Plum Creek Wind Farm, LLC |
Port of the Islands North, LLC8 |
| Portage Solar, LLC |
| Prairie Oasis Solar, LLC |
Prairie Rose Wind 2, LLC5 |
| Prosperity Wind Farm 2, LLC |
| Prosperity Wind Farm, LLC |
| Red Rock Solar SD, LLC |
| Red Wolf Solar, LLC |
| | |
|
| Regal Solar 2, LLC |
| Regal Solar, LLC |
| River North Solar, LLC |
| Robertson Solar, LLC |
| Rock Ridge Wind Farm, LLC |
| Rolling Hills Solar, LLC |
Ross County Solar, LLC6 |
| Royal Solar 2, LLC |
| Royal Solar, LLC |
| Royerton Solar, LLC |
| Saginaw Bay Solar, LLC |
| Sandstone Creek Solar 2, LLC |
| Sandstone Creek Solar, LLC |
| Sapphire Sky Wind Farm, LLC |
Sherco Solar 2, LLC5 |
Sherco Solar, LLC5 |
| Silver City Solar, LLC |
| Simpson Solar, LLC |
| Spotlight Solar, LLC |
| Spring Brook Solar, LLC |
| Spring River Solar, LLC |
| Springfield Solar Farm, LLC |
| Stony Brook Wind, LLC |
| Stony Point Solar, LLC |
| Stove Creek Solar, LLC |
| Sturgis Solar, LLC |
| Summit Lake Solar, LLC |
| Sunbeam Solar, LLC |
| Sunrise Solar, LLC |
| Sycamore Creek Solar, LLC |
| Thacker Solar, LLC |
The Brooklyn Union Gas Company8 |
The Narragansett Electric Company11 |
Torchlight Solar, LLC5 |
Transgas Inc.2 |
| Tri-City Solar, LLC |
| Uintah Solar, LLC |
| Unbridled Solar, LLC |
Upper Hudson Development Inc.8 |
| Valley Solar, LLC |
Vermont Green Line Devco, LLC (90%)3 |
| Vibrant Solar, LLC |
Virgo Community Solar Gardens, LLC5 |
| Virtue Solar, LLC |
| Vivid Solar, LLC |
| Wallowa Solar, LLC |
Wayfinder Group, Inc.2 |
| Wheatfield Solar, LLC |
| White Elm Wind Farm, LLC |
Wild Springs Solar, LLC5 |
| Wildcat Ridge Wind Farm, LLC |
| Wildhorse Creek Solar, LLC |
| Willard Solar, LLC |
| Williams County Solar, LLC |
| Wiregrass Solar, LLC |
| Woodlands Solar, LLC |
| Worthington Solar, LLC |
| Yellowhammer Solar, LLC |
| Young County Solar, LLC |
National Grid plc Annual Report and Accounts 2021/22 227
Notes to the consolidated financial statements continued
34. Subsidiary undertakings, joint ventures and associates continued
Subsidiary undertakings continued
Incorporated in Australia
Registered office: Level 7, 330 Collins Street, Melbourne, VIC 3000, Australia
National Grid Australia Pty Limited
Incorporated in Canada
Registered office: Stewart McKelvey LLP, c/o Charles Reagh, Queen’s Marque, 600-1741 Lower Water Street, Halifax, Nova Scotia, B3J 0J2, Canada
KeySpan Energy Development Co.
Incorporated in Guernsey
Registered office: 1st & 2nd Floors Elizabeth House, Les Ruettes Brayes, St Peter Port, GY1 1EW, Guernsey, Channel Islands
WPD Limited (Guernsey)†
Registered office: PO Box 155, Mill Court, La Charroterie, St. Peter Port, Guernsey, GY1 4ET, Guernsey, Channel Islands
Aztec Insurance Limited
Incorporated in Hong Kong
Registered office: Level 54, Hopewell Centre, 183 Queen’s Road East, Hong Kong
National Grid Hong Kong Limited†
Incorporated in the Isle of Man
Registered office: Third Floor, St George’s Court, Upper Church Street, Douglas, IM1 1EE, Isle of Man, UK
National Grid Insurance Company (Isle of Man) Limited
NGT Holding Company (Isle of Man) Limited*†
Incorporated in Luxembourg
Registered office: 412F, Route d’Esch, L-2086, Luxembourg, Grand Duchy of Luxembourg
National Grid Luxembourg SARL
Incorporated in the Netherlands
Registered office: Westblaak 89, 3012 KG Rotterdam, PO Box 21153, 3001 AD, Rotterdam, Netherlands
British Transco International Finance B.V.
Incorporated in the Republic of Ireland
Registered office: c/o Moore Stephens Nathans, Third Floor, Ulysses House, 23/24 Foley Street, Dublin, D01 W2T2, Ireland
National Grid Company (Ireland) Designated Activity Company*
1.Registered office: National Registered Agents, Inc., 160 Greentree Drive, Suite 101, Dover DE 19904, USA.
2.Registered office: Corporation Service Company, 84 State Street, Boston MA 02109, USA.
3.Registered office: Corporation Service Company, 251 Little Falls Drive, Wilmington DE 19808, USA.
4.Registered office: Corporation Service Company, 10 Ferry Street, Suite 313, Concord NH 03301, USA.
5.Registered office: National Grid Renewables Development, LLC, 8400 Normandale Lake Blvd. Suite 1200, Bloomington, MN 55437, USA.
6.Registered office: The Corporation Trust Company, Corporation Trust Center, 1209 Orange Street, Wilmington, Delaware, 19801, USA.
7.Registered office: 60 Mine Lake Court, Suite 200, Raleigh, Wake County, NC 27615, USA.
8.Registered office: Corporation Service Company, 80 State Street, Albany NY 12207, USA.
9.Registered office: National Registered Agents, Inc., 30600 Telegraph Road, Suite 2345, Bingham Farms, MI 48025-5720, USA.
10.Registered office: One MetroTech Center, Brooklyn NY 11201, USA.
11.Registered office: Corporation Service Company, 222 Jefferson Boulevard, Suite 200, Warwick RI 02888, USA.
12.Registered office: National Registered Agents, Inc., 1999 Bryan Street, Dallas, Dallas County TX 75201, USA.
* In liquidation.
† Entity is tax resident in the United Kingdom.
228 National Grid plc Annual Report and Accounts 2021/22
34. Subsidiary undertakings, joint ventures and associates continued
Joint ventures Associates
A list of the Group’s joint ventures as at 31 March 2022 is given below. All joint ventures are included in the Group’s financial statements using the equity method of accounting. Principal joint ventures are identified in bold.
Incorporated in England and Wales
Registered office: 1–3 Strand, London WC2N 5EH, UK (unless stated otherwise in footnotes).
BritNed Development Limited (50%)*
Joint Radio Company Limited (50%)1**
National Places LLP (50%)2
Nemo Link Limited (50%)
NGET/SPT Upgrades Limited (50%)†
Incorporated in the US
Registered office: Corporation Service Company, 251 Little Falls Drive, Wilmington, DE 19808, USA (unless stated otherwise in footnotes).
Bight Wind Holdings, LLC (27.27%)3
Clean Energy Storage Systems LLC (previously Clean Energy Generation, LLC) (50%)
Emerald Energy Venture LLC (51%)
Island Park Energy Center, LLC (50%)
Islander East Pipeline Company, LLC (50%)3
LI Energy Storage System, LLC (50%)
LI Solar Generation, LLC (50%)
Incorporated in France
Registered office: 1 Terrasse Bellini, Tour Initiale, TSA 41000 – 9291,
Paris La Defense, CEDEX, France
IFA2 (50%)
A list of the Group’s associates as at 31 March 2022 is given below. Unless otherwise stated, all associates are included in the Group’s financial statements using the equity method of accounting. Principal associates are identified in bold.
Incorporated in the US
Registered office: Corporation Service Company, 251 Little Falls Drive, Wilmington, DE 19808, USA (unless stated otherwise in footnotes).
Clean Line Energy Partners LLC (32%)3
Connecticut Yankee Atomic Power Company (19.5%)4
Direct Global Power, Inc. (26%)3
Energy Impact Fund LP (9.41%)5
KHB Venture LLC (33.33%)6
Maine Yankee Atomic Power Company (24%)7
Millennium Pipeline Company, LLC (26.25%)3
New York Transco LLC (28.3%)8
NYSEARCH RMLD, LLC (22.63%)
The Hive IV, LLC (28.2%)3
Yankee Atomic Electric Company (34.5%)9
Incorporated in Belgium
Registered office: Avenue de Cortenbergh 71, 1000 Brussels, Belgium
Coreso SA (15.84%)
Other investments
A list of the Group’s other investments as at 31 March 2022 is given below.
Incorporated in England and Wales
Registered office: 1 More London Place, London SE1 2AF, UK
Energis plc (33.06%)‡
Registered office: Third Floor, Northumberland House, 303–306 High Holborn, London, WC1V 7JZ
Electralink Limited (27.04%)
1. Registered office: Friars House, Manor House Drive, Coventry, CV1 2TE, UK.
2. Registered office: 80 Cheapside, London, EC2V 6EE, UK.
3. Registered office: The Corporation Trust Company, Corporation Trust Center, 1209 Orange Street, Wilmington DE 19801, USA.
4. Registered office: Carla Pizzella, 362 Injun Hollow Road, East Hampton CT 06424-3099, USA.
5. Registered office: Harvard Business Services, Inc., 16192 Coastal Highway, Lewes DE 19958, USA.
6. Registered office: De Maximus Inc., 135 Beaver Street, 4th Floor, Waltham MA 02452, USA.
7. Registered office: Joseph D Fay, 321 Old Ferry Road, Wiscasset ME 04578, USA.
8. Registered office: Corporation Service Company, 80 State Street, Albany NY 12207, USA.
9. Registered office: Karen Sucharzewski, 49 Yankee Road, Rowe MA 01367, USA.
* National Grid Interconnector Holdings Limited owns 284,500,000 €0.20 C Ordinary shares and one £1.00 Ordinary A share.
** National Grid Gas plc owns all £1.00 A Ordinary shares.
† National Grid Electricity Transmission plc owns 50 £1.00 A Ordinary shares.
‡ In administration.
Our interests and activities are held or operated through the subsidiaries, joint arrangements or associates as disclosed above. These interests and activities (and their branches) are established in – and subject to the laws and regulations of – these jurisdictions.
The following UK subsidiaries will take advantage of the audit exemption set out within section 479A of the Companies Act 2006 supported by guarantees issued by National Grid plc over their liabilities for the year ended 31 March 2022:
| | | | | |
| Company name | Company number |
| NatGrid One Limited | 5521240 |
| Natgrid TW1 Limited | 7579324 |
| National Grid Holdings Limited | 3096772 |
| National Grid International Limited | 2537092 |
| National Grid Twelve Limited | 4355616 |
| National Grid Twenty Three Limited | 6999009 |
| National Grid (US) Holdings Limited | 2630496 |
| National Grid (US) Investments 2 Limited | 3784528 |
| National Grid (US) Investments 4 Limited | 3867128 |
| National Grid (US) Partner 1 Limited | 4314432 |
National Grid plc Annual Report and Accounts 2021/22 229
Notes to the consolidated financial statements continued
35. Sensitivities
| | |
| In order to give a clearer picture of the impact on our results or financial position of potential changes in significant estimates and assumptions, the following sensitivities are presented. These sensitivities are based on assumptions and conditions prevailing at the year end and should be used with caution. The effects provided are not necessarily indicative of the actual effects that would be experienced because our actual exposures are constantly changing. |
The sensitivities in the tables below show the potential impact in the income statement (and consequential impact on net assets) for a reasonably possible range of different variables each of which have been considered in isolation (i.e. with all other variables remaining constant). There are a number of these sensitivities which are mutually exclusive, and therefore if one were to happen, another would not, meaning a total showing how sensitive our results are to these external factors is not meaningful.
The sensitivities included in the tables below broadly have an equal and opposite effect if the sensitivity increases or decreases by the same amount unless otherwise stated.
(a) Sensitivities on areas of estimation uncertainty
The table below sets out the sensitivity analysis for certain areas of estimation uncertainty set out in note 1F. These estimates are those that have a significant risk of resulting in a material adjustment to the carrying values of assets and liabilities in the next year. Note that the sensitivity analysis for the useful economic lives of our gas network assets is included in note 13.
| | | | | | | | | | | | | | | | | |
| 2022 | | 2021 |
| Income
statement
£m | Net
assets
£m | | Income statement £m | Net assets £m |
| Pensions and other post-retirement benefit liabilities (pre-tax)¹: | | | | | |
UK discount rate change of 0.5%² | 12 | | 1,002 | | | 4 | | 952 | |
US discount rate change of 0.5%² | 16 | | 650 | | | 17 | | 730 | |
UK RPI rate change of 0.5%³ | 11 | | 733 | | | 3 | | 723 | |
UK long-term rate of increase in salaries change of 0.5% | 4 | | 88 | | | 1 | | 42 | |
US long-term rate of increase in salaries change of 0.5% | 3 | | 41 | | | 3 | | 42 | |
UK change of one year to life expectancy at age 654 | 4 | | 635 | | | 1 | | 612 | |
US change of one year to life expectancy at age 65 | 3 | | 444 | | | 4 | | 429 | |
Assumed US healthcare cost trend rates change of 1% | 24 | | 414 | | | 26 | | 437 | |
| | | | | |
| | | | | |
| | | | | |
| | | | | |
| | | | | |
| | | | | |
| Environmental provision: | | | | | |
10% change in estimated future cash flows | 188 | | 188 | | | 170 | | 170 | |
1. The changes shown are a change in the annual pension and other post-retirement benefit service charge and change in the defined benefit obligations.
2. A change in the discount rate is likely to occur as a result of changes in bond yields and as such would be expected to be offset to a significant degree by a change in the value of the bond assets held by the plans. In the UK, there would also be a £164 million (2021: £257 million) net assets offset from the buy-in policies, where the accounting value of the buy-in asset is set equal to the associated liabilities.
3. The projected impact resulting from a change in RPI reflects the underlying effect on pensions in payment, pensions in deferment and resultant increases in salary assumptions. The buy-in policies would have a £119 million (2021: £190 million) net assets offset to the above.
4. In the UK, the buy-in policies and the longevity swap entered into would have a £111 million (2021: £183 million) net assets offset to the above.
Pensions and other post-retirement benefits assumptions
Sensitivities have been prepared to show how the defined benefit obligations and annual service costs could potentially be impacted by changes in the relevant actuarial assumption that were reasonably possible as at 31 March 2022. In preparing sensitivities, the potential impact has been calculated by applying the change to each assumption in isolation and assuming all other assumptions remain unchanged. This is with the exception of RPI in the UK where the corresponding change to increases to pensions in payment, increases to pensions in deferment and increases in salary are recognised.
WPD goodwill impairment assessment
Sensitivities have been performed to show the impact of reasonable changes to key assumptions in the WPD goodwill impairment test. Considering an increase in the pre-tax discount rate of 0.5% (to 5.7%) indicates the estimated value-in-use would be £1,033 million lower than WPD’s carrying amount at 31 March 2022, whilst reducing the terminal growth rate to 2% results in the estimated value-in-use equalling WPD’s carrying amount at 31 March 2022.
230 National Grid plc Annual Report and Accounts 2021/22
35. Sensitivities continued
(b) Sensitivities on financial instruments
We are further required to show additional sensitivity analysis under IFRS 7 and these are shown separately in the subsequent table due to the additional assumptions that are made in order to produce meaningful sensitivity disclosures.
Our net debt as presented in note 29 is sensitive to changes in market variables, primarily being UK and US interest rates, the UK RPI and the dollar to sterling exchange rate. These impact the valuation of our borrowings, deposits and derivative financial instruments. The analysis illustrates the sensitivity of our financial instruments to reasonably possible changes in these market variables.
The following main assumptions were made in calculating the sensitivity analysis for continuing operations:
• the amount of net debt, the ratio of fixed to floating interest rates of the debt and derivatives portfolio, and the proportion of financial instruments in foreign currencies are all constant and on the basis of the hedge designations in place at 31 March 2022 and 2021 respectively;
• the statement of financial position sensitivity to interest rates relates to items presented at their fair values: derivative financial instruments; our investments measured at FVTPL and FVOCI; and our liability measured at FVTPL. Further debt and other deposits are carried at amortised cost and so their carrying value does not change as interest rates move;
• the sensitivity of interest to movements in interest rates is calculated on net floating rate exposures on debt, deposits and derivative instruments;
• changes in the carrying value of derivatives from movements in interest rates of designated cash flow hedges are assumed to be recorded fully within equity; and
• changes in the carrying value of derivative financial instruments designated as net investment hedges from movements in interest rates are presented in equity as costs of hedging, with a one-year release to the income statement. The impact of movements in the dollar to sterling exchange rate are recorded directly in equity.
| | | | | | | | | | | | | | | | | |
| 2022 | | 2021 |
| Income
statement
£m | Other equity
reserves
£m | | Income statement £m | Other equity reserves £m |
| Financial risk (post-tax): | | | | | |
UK RPI change of 0.5%¹ | 18 | | — | | | 25 | | — | |
UK interest rates change of 0.5% | 41 | | 134 | | | 12 | | 98 | |
US interest rates change of 0.5% | 4 | | 8 | | | 6 | | 22 | |
US dollar exchange rate change of 10%² | 43 | | 397 | | | 44 | | 285 | |
1. Excludes sensitivities to LPI curve. Further details on sensitivities are provided in note 32(g).
2. The other equity reserves impact does not reflect the exchange translation in our US subsidiaries’ net assets. It is estimated this would change by £1,670 million (2021: £1,425 million) in the opposite direction if the dollar exchange rate changed by 10%.
Our commodity contract derivatives are sensitive to price risk. Additional sensitivities in respect to commodity price risk and to our derivative fair values are as follows:
| | | | | | | | | | | | | | | | | |
| 2022 | | 2021 |
| Income
statement
£m | Net
assets
£m | | Income statement £m | Net assets £m |
Commodity price risk (post-tax): | | | | | |
10% increase in commodity prices | 53 | | 53 | | | 20 | | 20 | |
10% decrease in commodity prices | (54) | | (54) | | | (21) | | (21) | |
| | | | | |
| Assets and liabilities carried at fair value (post-tax): | | | | | |
10% fair value change in derivative financial instruments¹ | (55) | | (55) | | | 14 | | 14 | |
10% fair value change in commodity contract derivative liabilities | 20 | | 20 | | | 6 | | 6 | |
1. The effect of a 10% change in fair value assumes no hedge accounting.
National Grid plc Annual Report and Accounts 2021/22 231
Notes to the consolidated financial statements continued
36. Additional disclosures in respect of guaranteed securities
| | |
| Niagara Mohawk Power Corporation, a wholly owned subsidiary of the Group, has issued preferred shares that are listed on a US national securities exchange and are guaranteed by National Grid plc. This guarantor commits to honour any liabilities should the company issuing the debt have any financial difficulties. In order to provide debt holders with information on the financial stability of the company providing the guarantee, we are required to disclose individual financial information for this company. We have chosen to include this information in the Group financial statements rather than submitting separate stand-alone financial statements. |
The following summarised financial information is given in respect of Niagara Mohawk Power Corporation as a result of National Grid plc’s guarantee, dated 29 October 2007, of Niagara Mohawk Power Corporation’s 3.6% and 3.9% issued preferred shares, which amount to £29 million. National Grid plc’s guarantee of Niagara Mohawk Power Corporation’s preferred shares is full and unconditional. There are no restrictions on the payment of dividends by Niagara Mohawk Power Corporation or limitations on National Grid plc’s guarantee of the preferred shares, and there are no factors that may affect payments to holders of the guaranteed securities.
The following summarised financial information for National Grid plc and Niagara Mohawk Power Corporation is presented on a combined basis and is intended to provide investors with meaningful and comparable financial information, and is provided pursuant to the early adoption of Rule 13-01 of Regulation S-X in lieu of the separate financial statements of Niagara Mohawk Power Corporation.
Summarised financial information is presented, on a combined basis, as at 31 March 2022. The combined amounts are presented under IFRS measurement principles. Intercompany transactions have been eliminated. Investments in other non-issuer and non-guarantor subsidiaries are included at cost, subject to impairment.
Summarised financial information for the year ended 31 March 2022 – IFRS
| | | | | |
| National Grid plc and Niagara Mohawk Power Corporation combined £m |
|
| Combined statement of financial position | |
| Non-current loans to other subsidiaries | — | |
| Non-current assets | 10,068 | |
| Current loans to other subsidiaries | 28,525 | |
| Current assets | 2,431 | |
| Current loans from other subsidiaries | (14,512) | |
| Current liabilities | (10,276) | |
| Non-current loans from other subsidiaries | (2,050) | |
| Non-current liabilities | (8,294) | |
Net assets¹ | 5,892 | |
| Equity | 5,892 | |
| |
| Combined income statement – continuing operations | |
| Revenue | 2,987 | |
| Operating costs | (2,358) | |
| Operating profit | 629 | |
Other income from other subsidiaries | 2,500 | |
| Other income and costs, including taxation | (360) | |
| Profit after tax | 2,769 | |
1. Excluded from net assets above are investments in other consolidated subsidiaries with a carrying value of £14,440 million.
232 National Grid plc Annual Report and Accounts 2021/22
37. Acquisitions
| | |
Business combinations are accounted for using the acquisition method. The identifiable assets acquired and liabilities assumed are recognised at their fair values at the acquisition date. Goodwill is initially measured as the excess of the aggregate of the consideration transferred, the amount recognised for any non-controlling interest and the acquisition-date fair values of any previously held interest in the acquiree over the fair value of the identifiable assets acquired and liabilities assumed at the acquisition date. Acquisition-related costs are expensed as incurred and included within Other operating income and costs. |
Acquisition of WPD
On 14 June 2021, National Grid plc acquired 100% of the share capital of PPL WPD Investments Limited (WPD), the holding company of Western Power Distribution plc, which is the UK’s largest electricity distribution network operator. The acquisition, along with the two planned disposals disclosed in note 10, strategically pivots National Grid’s UK portfolio towards electricity, in order to significantly enhance National Grid’s role in the delivery of the UK’s net zero targets, given that electricity distribution is expected to see a high level of asset growth as a result of the ongoing energy transition.
The total cash consideration for the transaction was £7.9 billion, all of which was paid upfront, with no further contingent or deferred consideration payable. As a result of the acquisition, one of WPD’s existing borrowing facilities became repayable immediately due to a change in control clause within the original borrowing agreement. The borrowing facility was immediately replaced with an intercompany loan of £350 million from National Grid plc. National Grid funded the transaction price and the new intercompany loan by taking out a bridge financing facility (see note 33), that it will commence repaying with the proceeds of the planned disposals.
The fair values of the assets and liabilities following the finalisation of the purchase price allocation are set out below:
| | | | | | | | | | | |
| IFRS book value at acquisition
£m | Fair value adjustments
£m | Fair value
£m |
| Non-current assets | | | |
| Property, plant and equipment | 14,077 | | (4,026) | | 10,051 | |
| Other intangible assets | 49 | | 1,714 | | 1,763 | |
| Pension assets | 402 | | 164 | | 566 | |
| Other non-current assets | 27 | | — | | 27 | |
| Total non-current assets | 14,555 | | (2,148) | | 12,407 | |
| | | |
| Current assets | | | |
| Trade and other receivables | 268 | | — | | 268 | |
| Financial and other investments | 69 | | — | | 69 | |
| Cash | 44 | | — | | 44 | |
| Other current assets | 42 | | — | | 42 | |
| Total current assets | 423 | | — | | 423 | |
| Total assets | 14,978 | | (2,148) | | 12,830 | |
| | | |
| Current liabilities | | | |
| Borrowings | (730) | | — | | (730) | |
| Trade and other payables | (531) | | 48 | | (483) | |
| Other current liabilities | (35) | | — | | (35) | |
| Total current liabilities | (1,296) | | 48 | | (1,248) | |
| Non-current liabilities | | | |
| Borrowings | (5,967) | | (1,589) | | (7,556) | |
| Deferred tax | (1,013) | | 224 | | (789) | |
| Contract liabilities | (2,706) | | 2,706 | | — | |
| Other non-current liabilities | (56) | | (21) | | (77) | |
| Total non-current liabilities | (9,742) | | 1,320 | | (8,422) | |
| Total liabilities | (11,038) | | 1,368 | | (9,670) | |
| | | |
| Total identifiable net assets | 3,940 | | (780) | | 3,160 | |
| Goodwill | 1,254 | | 3,467 | | 4,721 | |
| Total consideration transferred | 5,194 | | 2,687 | | 7,881 | |
| | | |
| Satisfied by: | | | |
| Cash consideration | | | 7,881 | |
| Total consideration transferred | | | 7,881 | |
National Grid plc Annual Report and Accounts 2021/22 233
Notes to the consolidated financial statements continued
37. Acquisitions continued
The goodwill arising from the acquisition represents the future expected growth in the WPD business, the benefits that are expected to be achieved as a result of the combination of the two businesses and the expertise of the management team acquired. No component of goodwill qualifies for recognition as a separate tangible or intangible asset. The goodwill is not deductible for tax purposes and at the acquisition date, there were no material contingent liabilities.
The fair value of trade and other receivables of £270 million includes trade receivables with a fair value of £86 million. The gross contractual amount for trade receivables due is £103 million, of which £17 million was expected to be uncollectible.
Total acquisition-related costs of £110 million were recognised within Other operating income and costs, of which £15 million was recognised in the year ended 31 March 2021 and £95 million in the year ended 31 March 2022.
WPD generated revenues of £1,468 million and profit before tax of £781 million for the period from 14 June 2021 to 31 March 2022. If the acquisition had occurred on 1 April 2021, the Group’s consolidated revenue and consolidated profit before tax from continuing operations for the 12 months ended 31 March 2022 would have been £18,806 million and £3,600 million respectively.
38. Post balance sheet events
On 6 April 2022, the UK government announced that the entirety of ESO will become part of an independent system operator public body, following the Future System Operator (FSO) consultation. The FSO, which is subject to legislative approval, will take on a number of key roles in electricity and gas in Great Britain. The Group is working closely with BEIS and Ofgem to plan and prepare for the implementation of the changes required to create the FSO.
On 11 May 2022, Ofgem approved the Group’s request to return £200 million of interconnector revenue subject to the cap and floor regime to consumers ahead of schedule (see note 26). This return will take place over the next two years. The Group is now working through the formal steps outlined under the regulatory framework which will result in the finalisation of the mechanism by which the revenues will be returned.
234 National Grid plc Annual Report and Accounts 2021/22
Company accounting policies
| | |
We are required to include the stand-alone balance sheet of our ultimate Parent Company, National Grid plc, under the Companies Act 2006. This is because the publicly traded shares are actually those of National Grid plc (the ‘Company’) and the following disclosures provide additional information to shareholders. |
A. Basis of preparation
National Grid plc is the Parent Company of the National Grid Group, which is engaged in the transmission and distribution of electricity and gas in Great Britain and northeastern US. The Company is a public limited company, limited by shares. The Company is incorporated and domiciled in England, with its registered office at 1–3 Strand, London, WC2N 5EH.
The financial statements of National Grid plc for the year ended 31 March 2022 were approved by the Board of Directors on 18 May 2022. The Company meets the definition of a qualifying entity under Financial Reporting Standard 100 (FRS 100) issued by the Financial Reporting Council. Accordingly, these individual financial statements of the Company have been prepared in accordance with Financial Reporting Standard 101 ‘Reduced Disclosure Framework’ (FRS 101). In preparing these financial statements the Company applies the recognition and measurement requirements of International Financial Reporting Standards (IFRS) as adopted by the UK, but makes amendments where necessary in order to comply with the provisions of the Companies Act 2006 and sets out below where advantage of the FRS 101 disclosure exemptions has been taken.
These individual financial statements have been prepared on a historical cost basis, except for the revaluation of financial instruments, and are presented in pounds sterling, which is the currency of the primary economic environment in which the Company operates. The comparative financial information has also been prepared on this basis.
These individual financial statements have been prepared on a going concern basis, which presumes that the Company has adequate resources to remain in operation, and that the Directors intend it to do so, for at least one year from the date the financial statements are signed. As the Company is part of a larger group it participates in the Group’s centralised treasury arrangements and so shares banking arrangements with its subsidiaries. The Company is expected to generate positive cash flows or be in a position to obtain finance via intercompany loans to continue to operate for the foreseeable future.
In accordance with the exemption permitted by section 408 of the Companies Act 2006, the Company has not presented its own profit and loss account or statement of comprehensive income.
The following exemptions from the requirements of IFRS have been applied in the preparation of these financial statements of the Company in accordance with FRS 101:
• a cash flow statement and related notes;
• disclosures in respect of transactions with wholly owned subsidiaries;
• disclosures in respect of capital management; and
• the effects of new but not yet effective IFRS standards.
The exemption from disclosing key management personnel compensation has not been taken as there are no costs borne by the Company in respect of employees, and no related costs are recharged to the Company.
As the consolidated financial statements of National Grid plc, which are available from the registered office, include the equivalent disclosures, the Company has also taken the exemptions under FRS 101 in respect of certain disclosures required by IFRS 13 ‘Fair Value Measurement’ and the disclosures required by IFRS 7 ‘Financial Instruments: Disclosures’.
There are no areas of judgement or key sources of estimation uncertainty that are considered to have a significant effect on the amounts recognised in the financial statements.
The balance sheet has been prepared in accordance with the Company’s accounting policies approved by the Board and described below.
B. Fixed asset investments
Investments held as fixed assets are stated at cost less any provisions for impairment. Investments are reviewed for impairment if events or changes in circumstances indicate that the carrying amount may not be recoverable. Impairments are calculated such that the carrying value of the fixed asset investment is the lower of its cost or recoverable amount. Recoverable amount is the higher of its fair value less costs of disposal and its value-in-use. The Company accounts for common control transactions at cost.
C. Tax
Current tax for the current and prior periods is provided at the amount expected to be paid or recovered using the tax rates and tax laws that have been enacted or substantively enacted by the balance sheet date.
Deferred tax is provided in full on temporary differences which result in an obligation at the balance sheet date to pay more tax, or the right to pay less tax, at a future date, at tax rates expected to apply when the temporary differences reverse based on tax rates and tax laws that have been enacted or substantively enacted by the balance sheet date. Deferred tax is provided for using the balance sheet liability method and is recognised on temporary differences between the carrying amount of assets and liabilities in the financial statements and the corresponding tax bases used in the computation of taxable profit.
Deferred tax assets are recognised to the extent that it is regarded as more likely than not that they will be recovered. Deferred tax assets and liabilities are not discounted.
D. Foreign currencies
Transactions in currencies other than the functional currency of the Company are recorded at the rates of exchange prevailing on the dates of the transactions. At each balance sheet date, monetary assets and liabilities that are denominated in foreign currencies are retranslated at closing exchange rates. Gains and losses arising on retranslation of monetary assets and liabilities are included in the profit and loss account.
E. Financial instruments
The Company’s accounting policies are the same as the Group’s accounting policies under IFRS, namely IAS 32 ‘Financial Instruments: Presentation’, IFRS 9 ‘Financial Instruments’ and IFRS 7 ‘Financial Instruments: Disclosures’. The Company applies these policies only in respect of the financial instruments that it has, namely investments, derivative financial instruments, debtors, cash at bank and in hand, borrowings and creditors.
The policies are set out in notes 15, 17, 19, 20, 21 and 22 to the consolidated financial statements. The Company is taking the exemption for financial instruments disclosures, because IFRS 7 disclosures are given in notes 32 and 35 to the consolidated financial statements.
F. Hedge accounting
The Company applies the same accounting policy as the Group in respect of fair value hedges and cash flow hedges. This policy is set out in note 32 to the consolidated financial statements.
G. Parent Company guarantees
The Company has guaranteed the repayment of the principal sum, any associated premium and interest on specific loans due by certain subsidiary undertakings primarily to third parties. Such guarantees are accounted for by the Company as insurance contracts. In the event of default or non-performance by the subsidiary, a liability is recorded in accordance with IAS 37.
National Grid plc Annual Report and Accounts 2021/22 235
Company accounting policies continued
H. Share awards to employees of subsidiary undertakings
The issuance by the Company to employees of its subsidiaries of a grant over the Company’s options represents additional capital contributions by the Company to its subsidiaries. An additional investment in subsidiaries results in a corresponding increase in shareholders’ equity. The additional capital contribution is based on the fair value of the option at the date of grant, allocated over the underlying grant’s vesting period. Where payments are subsequently received from subsidiaries, these are accounted for as a return of a capital contribution and credited against the Company’s investments in subsidiaries. The Company has no employees except for the Group’s Non-executive Directors (refer to the Directors’ Remuneration Report on page 121).
I. Dividends
Interim dividends are recognised when they are paid to the Company’s shareholders. Final dividends are recognised when they are approved by shareholders.
J. Directors’ remuneration
Full details of Directors’ remuneration are disclosed on pages 108 – 131.
236 National Grid plc Annual Report and Accounts 2021/22
Company balance sheet
as at 31 March
| | | | | | | | | | | | | | |
| | | 2022 | 2021 |
| Notes | | £m | £m |
| Fixed assets | | | | |
| Investments | 1 | | 14,432 | | 14,389 | |
| | | | |
| Current assets | | | | |
| Debtors (amounts falling due within one year) | 2 | | 28,375 | | 20,699 | |
| Debtors (amounts falling due after more than one year) | 2 | | 87 | | 143 | |
| Investments | 5 | | 1,368 | | 784 | |
| Cash at bank and in hand | | | 45 | | 40 | |
| Total current assets | | | 29,875 | | 21,666 | |
| | | | |
| Creditors (amounts falling due within one year) | 3 | | (23,721) | | (18,312) | |
| Net current assets | | | 6,154 | | 3,354 | |
| Total assets less current liabilities | | | 20,586 | | 17,743 | |
| | | | |
| Creditors (amounts falling due after more than one year) | 3 | | (4,407) | | (3,085) | |
| Net assets | | | 16,179 | | 14,658 | |
| | | | |
| Equity | | | | |
| Share capital | 7 | | 485 | | 474 | |
| Share premium account | | | 1,300 | | 1,296 | |
| Cash flow hedge reserve | | | (15) | | (3) | |
| Cost of hedging reserve | | | (3) | | (15) | |
| Other equity reserves | | | 469 | | 426 | |
| Profit and loss account | 8 | | 13,943 | | 12,480 | |
| Total shareholders’ equity | | | 16,179 | | 14,658 | |
The Company’s profit after tax for the year was £2,371 million (2021: £5,107 million profit). Profits available for distribution by the Company to shareholders were £12.2 billion at 31 March 2022. The financial statements of the Company on pages 235 – 241 were approved by the Board of Directors on 18 May 2022 and were signed on its behalf by:
Paula Rosput Reynolds Chair
Andy Agg Chief Financial Officer
National Grid plc
Registered number: 4031152
National Grid plc Annual Report and Accounts 2021/22 237
Company statement of changes in equity
for the years ended 31 March
| | | | | | | | | | | | | | | | | | | | | | | |
| Share
capital £m | Share
premium account £m | Cash flow
hedge
reserve £m | Cost of hedging reserve £m | Other
equity
reserves £m | Profit
and loss account £m | Total shareholders’ equity £m |
| At 1 April 2020 | 470 | | 1,301 | | (28) | | (6) | | 399 | | 6,349 | | 8,485 | |
| Profit for the year¹ | — | | — | | — | | — | | — | | 5,107 | | 5,107 | |
| Other comprehensive profit/(loss) for the year | | | | | | | |
| Transferred to/(from) equity (net of tax) | — | | — | | 25 | | (9) | | — | | — | | 16 | |
| Dividends in specie (note 1) | — | | — | | — | | — | | — | | 2,422 | | 2,422 | |
| Total comprehensive profit/(loss) for the year | — | | — | | 25 | | (9) | | — | | 7,529 | | 7,545 | |
| Other equity movements | | | | | | | |
| Scrip dividend-related share issue² | 4 | | (5) | | — | | — | | — | | — | | (1) | |
| Issue of treasury shares | — | | — | | — | | — | | — | | 17 | | 17 | |
| Purchase of own shares | — | | — | | — | | — | | — | | (2) | | (2) | |
| Share awards to employees of subsidiary undertakings | — | | — | | — | | — | | 27 | | — | | 27 | |
| Equity dividends | — | | — | | — | | — | | — | | (1,413) | | (1,413) | |
| At 31 March 2021 | 474 | | 1,296 | | (3) | | (15) | | 426 | | 12,480 | | 14,658 | |
| Profit for the year¹ | — | | — | | — | | — | | — | | 2,371 | | 2,371 | |
| Other comprehensive profit/(loss) for the year | | | | | | | |
| Transferred (from)/to equity (net of tax) | — | | — | | (12) | | 12 | | — | | — | | — | |
| Total comprehensive (loss)/profit for the year | — | | — | | (12) | | 12 | | — | | 2,371 | | 2,371 | |
| Other equity movements | | | | | | | |
| Scrip dividend-related share issue² | 11 | | (12) | | — | | — | | — | | — | | (1) | |
| Issue of treasury shares | — | | — | | — | | — | | — | | 17 | | 17 | |
| Transactions in own shares | — | | 16 | | — | | — | | — | | (3) | | 13 | |
| Share awards to employees of subsidiary undertakings | — | | — | | — | | — | | 43 | | — | | 43 | |
| Equity dividends | — | | — | | — | | — | | — | | (922) | | (922) | |
| At 31 March 2022 | 485 | | 1,300 | | (15) | | (3) | | 469 | | 13,943 | | 16,179 | |
1. Included within profit for the year is dividend income from subsidiaries of £2,500 million (2021: £7,556 million).
2. Included within the share premium account are costs associated with scrip dividends.
238 National Grid plc Annual Report and Accounts 2021/22
Notes to the Company financial statements
1. Fixed asset investments
| | | | | |
| Shares in subsidiary undertakings £m |
| Cost at 1 April 2020 | 14,362 | |
| Additions | 2,447 | |
| |
| Cost at 31 March 2021 | 16,809 | |
| Additions | 43 | |
| Cost at 31 March 2022 | 16,852 | |
Provision at 1 April 2020 | — | |
Charge for the year | (2,420) | |
Provision at 1 April 2021 | (2,420) | |
| Charge for the year | — | |
| Provision at 31 March 2022 | (2,420) | |
| Net book value at 31 March 2022 | 14,432 | |
| Net book value at 31 March 2021 | 14,389 | |
During the year, there was a capital contribution of £43 million (2021: £27 million) which represents the fair value of equity instruments granted to subsidiaries’ employees arising from equity-settled employee share schemes.
In the year ended 31 March 2021 the Company acquired 100% investments in National Grid (US) Investments 2 Limited and National Grid Hong Kong Limited from its subsidiary undertaking, National Grid Luxembourg SARL, for a total consideration of £2,420 million in the form of a dividend in specie. Then, as part of a wider Group restructuring project, National Grid (US) Investments 2 Limited was identified as a subsidiary no longer required and hence a number of accounting steps were implemented to reduce the net assets of that company to a nominal value. These steps included a capital reduction and the payment of dividends to the Company of £2,422 million. Following the receipt of these dividends, the carrying value of the investment was reviewed and an impairment charge was made to the profit and loss account of £2,420 million. It is anticipated that National Grid (US) Investments 2 Limited will be placed into voluntary liquidation in the next financial year.
The Company’s direct subsidiary undertakings as at 31 March 2022 were as follows: National Grid (US) Holdings Limited, National Grid (US) Investments 2 Limited, National Grid Hong Kong Limited, National Grid Luxembourg SARL and NGG Finance plc. The names of indirect subsidiary undertakings, joint ventures and associates are included in note 34 to the consolidated financial statements.
The Directors believe that the carrying value of the investments is supported by the fair value of their underlying net assets.
2. Debtors
| | | | | | | | |
| 2022 | 2021 |
| £m | £m |
| Amounts falling due within one year | | |
| Derivative financial instruments (note 4) | 65 | | 86 | |
| Amounts owed by subsidiary undertakings | 28,299 | | 20,613 | |
| Other debtors | 11 | | — | |
| | |
| 28,375 | | 20,699 | |
| Amounts falling due after more than one year | | |
| Derivative financial instruments (note 4) | 81 | | 139 | |
| Deferred tax | 6 | | 4 | |
| 87 | | 143 | |
The carrying values stated above are considered to represent the fair values of the assets. For the purposes of the impairment assessment, loans to subsidiary undertakings are considered low credit risk as the subsidiaries are solvent and are covered by the Group’s liquidity arrangements.
A reconciliation of the movement in deferred tax in the year is shown below:
| | | | | |
| Deferred tax £m |
| At 1 April 2020 | 8 | |
| Charged to equity | (4) | |
| At 31 March 2021 | 4 | |
| Credited to equity | 2 | |
| At 31 March 2022 | 6 | |
National Grid plc Annual Report and Accounts 2021/22 239
Notes to the Company financial statements continued
3. Creditors
| | | | | | | | |
| 2022 | 2021 |
| £m | £m |
| Amounts falling due within one year | | |
| Borrowings (note 6) | 9,029 | | 635 | |
| Derivative financial instruments (note 4) | 129 | | 34 | |
| Amounts owed to subsidiary undertakings | 14,512 | | 17,589 | |
| Other creditors | 51 | | 54 | |
| 23,721 | | 18,312 | |
| Amounts falling due after more than one year | | |
| Borrowings (note 6) | 2,091 | | 823 | |
| Derivative financial instruments (note 4) | 266 | | 203 | |
| Amounts owed to subsidiary undertakings | 2,050 | | 2,059 | |
| 4,407 | | 3,085 | |
| Amounts owed to subsidiary undertakings falling due after more than one year are repayable as follows: | | |
| In 1 to 2 years | — | | — | |
| In 2 to 3 years | 421 | | — | |
| In 3 to 4 years | 998 | | 425 | |
| In 4 to 5 years | — | | 997 | |
| More than 5 years | 631 | | 637 | |
| 2,050 | | 2,059 | |
The carrying values stated above are considered to represent the fair values of the liabilities.
4. Derivative financial instruments
The fair values of derivative financial instruments are:
| | | | | | | | | | | | | | | | | | | | | | | |
| 2022 | | 2021 |
| Assets £m | Liabilities £m | Total £m | | Assets £m | Liabilities £m | Total £m |
| Amounts falling due within one year | 65 | | (129) | | (64) | | | 86 | | (34) | | 52 | |
| Amounts falling due after more than one year | 81 | | (266) | | (185) | | | 139 | | (203) | | (64) | |
| 146 | | (395) | | (249) | | | 225 | | (237) | | (12) | |
For each class of derivative, the notional contract1 amounts are as follows:
| | | | | | | | |
| 2022 | 2021 |
| £m | £m |
| | |
| Cross-currency interest rate swaps | (5,034) | | (3,604) | |
| Foreign exchange forward contracts | (12,322) | | (9,517) | |
| (17,356) | | (13,121) | |
1. The notional contract amounts of derivatives indicate the gross nominal value of transactions outstanding at the balance sheet date.
5. Investments
| | | | | | | | |
| 2022 | 2021 |
| £m | £m |
| Investments in short-term money funds | 1,164 | | 697 | |
| Restricted balances – collateral | 204 | | 87 | |
| 1,368 | | 784 | |
240 National Grid plc Annual Report and Accounts 2021/22
6. Borrowings
The following table analyses the Company’s total borrowings:
| | | | | | | | |
| 2022 | 2021 |
| £m | £m |
| Amounts falling due within one year | | |
| Bank loans | 8,206 | | 8 | |
| Bonds | 4 | | 362 | |
| Commercial paper | 819 | | 265 | |
| 9,029 | | 635 | |
| Amounts falling due after more than one year | | |
| Bonds | 2,091 | | 823 | |
| 11,120 | | 1,458 | |
The maturity of total borrowings is as follows:
| | | | | | | | |
| 2022 | 2021 |
| £m | £m |
| Total borrowings are repayable as follows: | | |
| Less than 1 year | 9,029 | | 635 | |
| In 1 to 2 years | — | | — | |
| In 2 to 3 years | — | | — | |
| In 3 to 4 years | — | | — | |
| In 4 to 5 years | — | | — | |
| More than 5 years | 2,091 | | 823 | |
| 11,120 | | 1,458 | |
The notional amount of borrowings outstanding as at 31 March 2022 was £11,215 million (2021: £1,480 million).
7. Share capital
The called-up share capital amounting to £485 million (2021: £474 million) consists of 3,904,074,348 ordinary shares of 12204/473 pence each (2021: 3,814,951,606 ordinary shares of 12204/473 pence each). For further information on share capital, refer to note 27 of the consolidated financial statements.
8. Shareholders’ equity and reserves
At 31 March 2022, the profit and loss account reserve stood at £13,943 million (2021: £12,480 million) of which profits available for distribution by the Company to shareholders were £12.2 billion (2021: £9.9 billion).
For further details of dividends paid and payable to shareholders, refer to note 9 of the consolidated financial statements.
9. Parent Company guarantees
The Company has guaranteed the repayment of the principal sum, any associated premium and interest on specific loans due by certain subsidiary undertakings primarily to third parties. At 31 March 2022, the sterling equivalent amounted to £2,084 million (2021: £2,108 million). The guarantees are for varying terms from less than one year to open-ended.
In addition, as part of the sectionalisation of the National Grid UK Pension Scheme on 1 January 2017, a guarantee of £1 billion has been provided to Section A. This payment is contingent on insolvency or on failure to pay pensions obligations to Section A and can be claimed against National Grid plc, National Grid Holdings One plc or Lattice Group Limited (up to £1 billion in total). Refer to note 25 of the consolidated financial statements.
10. Audit fees
The audit fee in respect of the Parent Company was £31,000 (2021: £28,000). Fees payable to Deloitte for non-audit services to the Company are not required to be disclosed as they are included within note 4 to the consolidated financial statements.
National Grid plc Annual Report and Accounts 2021/22 241

The business in detail 244 – 252 Where we operate 244 UK regulation 245 US regulation 248 Internal control and risk factors 253 – 256 Disclosure controls 253 Internal control over financial reporting 253 Risk factors 253 – 256 Shareholder information 257 – 261 Articles of Association 257 – 258 Depositary payments to the Company 258 Description of securities other than equity securities: depositary fees and charges 258 Documents on display 258 Events after the reporting period 258 Exchange controls 258 Share information 258 Material interests in shares 259 Share capital 259 Shareholder analysis 260 Taxation 260 – 261 Other disclosures 262 – 267 All-employee share plans 262 Change of control provisions 262 Code of Ethics 262 Conflicts of interest 262 Corporate governance practices: differences from New York Stock Exchange (NYSE) listing standards 262 Directors’ indemnity 262 Employees 263 Human rights 263 Unresolved SEC staff comments 263 Property, plant and equipment 263 Listing Rule 9.8.4 R cross-reference table 263 Political donations and expenditure 264 Material contracts 264 Research, development and innovation activity 264 – 267 Other unaudited financial statements 268 Commentary on consolidated financial information 280 – 281 Five-year summary financial information 282 Definitions and glossary of terms 283 – 286 Want more information or help? 287 Cautionary statement 288 Doing Right Now Digitalisation We are transforming how we connect our rapidly changing customer base to connect customers quicker and at a lower cost by digitalising our processes and standardising our designs. National Grid plc Annual Report and Accounts 2021/22242 29_Additional_info_Where_we_operate_Business_in_detail_p242_252_v87.indd 242 27/05/2022 17:40

Additional Information A d d itio nal Info rm atio n 243National Grid plc Annual Report and Accounts 2021/22 National Grid listed on the London Stock Exchange 1995 2017 2021 2022 National Grid sells a 61% equity interest in the remaining UK Gas Distribution business National Grid buys WPD and, following the WPD Acquisition and certain regulatory approvals, agrees to sell NECO, its Rhode Island gas and electricity business National Grid sells a majority equity interest in the UK GT business and our UK metering business 29_Additional_info_Where_we_operate_Business_in_detail_p242_252_v87.indd 243 27/05/2022 17:41

to/from Ireland to/from Northern Ireland to/from France to/from France to/from Belgium BritNed to/from the Netherlands from the Netherlands to/from Belgium to Dublin to Ballylumford to/from Norway Teesside St Fergus Easington Theddlethorpe Bacton Barrow Burton Point South Hook Herbrandston Dragon Grain LNG UK Transmission1 English and Welsh electricity transmission system Approximately 4,496 miles (7,236 kilometres) of overhead line, 1,744 miles (2,806 kilometres) of the underground cable and 350 substations. Gas transmission system Terminal LNG terminal Electricity interconnector Gas interconnector Approximately 4,740 miles (7,627 kilometres) of high-pressure pipe and 23 compressor stations connecting to eight distribution networks and third-party independent systems. Principal offices Owned office space: Bristol, Plymouth, Warwick and Wokingham Leased office space: Cardiff, Castle Donington, Solihull and London Scottish electricity transmission system LNG terminal owned by National Grid Leased office space totalling 105,771 square feet (9,827 square metres) with remaining terms two to five years. Connecticut Maine Massachusetts New Hampshire New Jersey New York Pennsylvania Rhode Island VermontCanada UK Electricity Distribution (WPD) Approximately 55,533 miles (89,372 kilometres) of overhead line, 85,728 miles (137,966 kilometres) of underground cable and 189,644 transformers. UK Transmission1 Scottish electricity transmission system English and Welsh electricity transmission system Approximately 4,484 miles (7,216 kilometres) of overhead line, 1,585 miles (2,551 kilometres) of the underground cable and 347 substations. Ga transmission system Approximately 4,740 miles (7,628 kilometres) of high-pressure pipe and 23 compressor stations connecting to eight distribution networks and third-party independent systems. Terminal LNG terminal owned by National Grid LNG terminal Electricity interconnector Gas interconnector Principal offices Owned office space: Bristol, Cardiff, Castle Donington, Plymouth, Warwick and Wokingham Leased office space: Solihull and London US Regulated1 Electricity transmission network Gas distribution operating area Electricity distribution area Gas and electricity distribution area overlap An electricity transmission network of approximately 8,831 miles (14,212 kilometres) of overhead line, 109 miles (175 kilometres) of underground cable and 399 transmission substations. We own and operate approximately 279 miles (449 kilometres) of high- voltage electric interconnectors in New England. An electricity distribution network of approximately 69,291 circuit miles (111,513 kilometres) and 718 distribution substations in New England and upstate New York. A network of approximately 36,756 miles (59,153 kilometres) of gas pipeline. Our gas pipeline network includes approximately 953 miles (1,534 kilometres) of gas transmission pipe, as defined by the US Department of Transportation. Generation Principal offices Owned office space: Syracuse, New York Leased office space: Brooklyn, New York and Waltham, Massachusetts At present, environmental issues are not preventing our UK and US businesses from utilising any material operating assets in the course of their operations. 1. Access to electricity and gas transmission assets on property owned by others is controlled through various agreements. 244 National Grid plc Annual Report and Accounts 2021/22 Where we operate Our UK network Our US network 29_Additional_info_Where_we_operate_Business_in_detail_p242_252_v87.indd 244 27/05/2022 17:41

UK regulation Our licences to participate in transmission, distribution and interconnection activities are established under the Gas Act 1986 and the Electricity Act 1989, as amended (the ‘Acts’). These require us to develop, maintain and operate economic and efficient networks and to facilitate competition in the supply of gas and electricity in Great Britain (GB). They also give us statutory powers, including the right to bury our pipes or cables under public highways and the ability to use compulsory powers to purchase land so we can conduct our business. Our licensed activities are regulated by Ofgem, which has a statutory duty under the Acts to protect the interests of consumers. To protect consumers from the ability of companies to set unduly high prices, Ofgem has established price controls that limit the amount of revenue such regulated businesses can earn. In setting price controls, Ofgem must have regard to the need to secure that licence holders are able to finance their obligations under the Acts. This should give us a level of revenue for the duration of the price control that is sufficient to meet our statutory duties and licence obligations with a reasonable return on our investments. Licensees and other affected parties can appeal price controls or within period licence modifications which have errors, including in respect of financeability. The transmission and distribution businesses follow the RIIO (revenue = incentives + innovation + outputs) framework established by Ofgem. There are multiple price controls under this framework, including: • RIIO-T1 (transmission, April 2013 – March 2021); • RIIO-T2 (transmission, April 2021 – March 2026); • RIIO-ED1 (electricity distribution, April 2015 – March 2023); and • RIIO-ED2 (electricity distribution, April 2023 – March 2028). While the RIIO-T1 period has finished, and confirmation of the delivered outputs and performance levels was reported through the annual reporting process in July 2021, there is a close-out process ongoing to finalise adjustments to allowed revenues in respect of a few licence condition obligations for the RIIO-T1 period; this is expected to conclude in November 2022. Our UK gas and electricity transmission, electricity distribution (WPD) and system operator businesses operate under four separate price controls, which cover our roles as Transmission Owner (TO) and System Operator (SO) in both gas and electricity, and our electricity distribution activities. National Grid Gas Transmission (NGG) fulfils SO and TO functions for gas, National Grid Electricity Transmission fulfils the TO function for electricity, the Electricity System Operator (ESO) fulfils the SO function for electricity, and WPD fulfils electricity distribution activities. In addition to these four regulated network price controls, there is also a tariff cap price control applied to certain elements of domestic-sized metering activities carried out by National Grid adjustment to allowed revenues in future years. This sharing factor provides an incentive for us to provide the outputs efficiently, as we are able to keep a portion of savings we make, with the remainder benefitting our customers. Likewise, it provides a level of protection for us if we need to spend more than allowances. Alongside this, there are several specific areas where companies can submit further claims for new allowances within the period, for instance to enable net zero. Allowed revenue to fund totex costs is split between RIIO ‘fast’ and ‘slow’ money categories using specified ratios that are fixed for the duration of the price control. Fast money represents the amount of totex we are able to recover in the year of expenditure. Slow money is added to our Regulatory Asset Value (RAV) – effectively the regulatory IOU. For more details on the sharing factors under RIIO for our transmission businesses, please see the tables overleaf. In addition to fast money, each year we are allowed to recover regulatory depreciation, i.e. a portion of the RAV, and a return on the outstanding RAV balance. The RAV is also indexed to a measure of inflation, using CPIH in RIIO-T2. For RIIO-T2, regulatory depreciation for ET continues on a straight-line depreciation methodology over 45 years, while Gas Transmission (GT) moves from straight-line to sum-of-digit depreciation (so that depreciation is front loaded but then lower in the later years of the life of the asset). We are also allowed to collect additional revenues related to non- controllable costs and incentives. In addition to totex sharing, RIIO incentive mechanisms can increase or decrease our allowed revenue to reflect our performance against various other measures related to our outputs. For example, in RIIO-T2 there are rewards and penalties for performance against incentives. These incentive payments are a function of allowed revenue and could result in potential upsides for electricity transmission (ET) of up to £15 million and downsides in the region of £47 million, therefore incentivising us to deliver the agreed outputs. For gas transmission (GT) the upside is £15.1 million of allowed revenue with a downside of £14 million. Ofgem will consult on the maximum range of potential upside and downside for RIIO-ED2 as part of its July 2022 publication, and finalise the position in the winter 2022 Final Determination, covering the period from April 2023 to March 2028. The RIIO-ED1 price control From 1 April 2015, Ofgem set an eight-year electricity price control (known as RIIO-ED1). WPD submitted an outputs-based Business Plan for the RIIO-ED1 period (2015 – 2023), which was accepted by Ofgem as ‘well justified’ and could therefore ‘fast-track’ all four WPD licensed areas; the only DNO group to be fast-tracked. WPD’s modified licences took effect from 1 April 2015. Our 76 commitments within the RIIO-ED1 Business Plan fall within the following six categories: safety, reliability, environment, connections, customer satisfaction and social obligations. Metering and regulation of our electricity interconnector interests. Since 1 April 2019, the ESO has been a legally separate business within the National Grid Group. This means it operates under its own licence and has a separate set of regulatory arrangements, along with strict ringfences for information. WPD operates under one regulatory framework, the RIIO-ED model. Distribution network operators (DNOs) in the UK are natural monopolies and to ensure value for money for consumers WPD is regulated by Ofgem. The operations are regulated under the distribution licence which sets the requirements that WPD needs to deliver for its customers. In addition to the base level of revenue which the DNOs are allowed to earn, there are incentives to innovate and deliver various outputs relating to customer service, network performance, the environment, connections and efficiency. The achievement or not of targets in relation to these activities can result in rewards or penalties. More information on the regulation of the ESO, WPD and interconnectors is given in separate sections below. RIIO price controls The building blocks of the RIIO price control are broadly similar to the price controls historically used in the UK. There are, however, some significant differences in the mechanics of the calculations. Under RIIO, the outputs we deliver are explicitly articulated and our allowed revenues are linked to their delivery, although some outputs and deliverables have only a reputational impact or are linked to legislation. These outputs reflect what our stakeholders have told us they want us to deliver and were determined through an extensive consultation process, which gave stakeholders a greater opportunity to influence the decisions. Using information we have submitted, along with independent assessments, including for RIIO-T2 an independent user group report, Ofgem determines the efficient level of expected costs necessary for these deliverables to be achieved. Under RIIO this is known as ‘totex’, which is a component of total allowable expenditure and is broadly the sum of what was defined in previous price controls as operating expenditure (opex) and capital expenditure (capex). A number of assumptions are necessary in setting allowances for the outputs that we will deliver, including the volumes of work that will be needed and the price of the various external inputs required to achieve them. Consequently, there are a number of uncertainty mechanisms within the RIIO framework designed to protect consumers and network
companies by avoiding the need to set allowances when future needs and costs are uncertain. Where we under- or over-spend the allowed totex for reasons that are not covered by uncertainty mechanisms, there is a ‘sharing’ factor. This means we share the under- or over-spend with customers through an 245 A d d itio nal Info rm atio n National Grid plc Annual Report and Accounts 2021/22 The business in detail 29_Additional_info_Where_we_operate_Business_in_detail_p242_252_v87.indd 245 27/05/2022 17:41

These price controls include a number of mechanisms designed to help achieve their objectives. These include financial incentives that encourage us to: • efficiently deliver, through investment and maintenance, the network outputs that customers and stakeholders require, including reliable supplies, new connections and infrastructure capacity; and • innovate so we can continuously improve the services we provide to our customers, stakeholders and communities. More information on RIIO-T2 In December 2019 we submitted our Business Plans to Ofgem for the RIIO-T2 period, setting out the proposed activities and expenditure to meet the needs of our customers and stakeholders in the period 1 April 2021 – 31 March 2026. These plans were developed through extensive, enhanced stakeholder engagement to improve the quality and ensure they delivered what our stakeholders need. To support this process, independent user groups were set up in July 2018, one for GT and one for ET (the ‘IUGs’). Their responsibility was to ensure that the companies were putting stakeholders at the heart of their decision- making processes so as to produce a Business Plan that was fully reflective of customers’, consumers’ and other stakeholders’ requirements. They summarised their views in an independent report to Ofgem on the companies’ RIIO-T2 Business Plans in December 2019. The IUGs represent a cross-section of the energy industry and represent the interests of consumers, environmental and public interest groups, as well as large-scale and small-scale customers and distribution networks. The IUGs have now taken on an enduring role through RIIO-T2. There are three key focus areas, which are to: • scrutinise and challenge the periodic Business Plans; • monitor, interrogate and help the business to enhance transparency of performance against commitments; and • act as a ‘critical friend’ for strategy, culture and processes in key areas such as stakeholder engagement, innovation, customers, consumers and responsible business. Ofgem published its Final Determinations in December 2020, followed by the RIIO-T2 licences and Regulatory Instructions and Guidance in February 2021. The RIIO-T2 price controls started on 1 April 2021. On 2 March 2021, National Grid announced that it was broadly accepting most of the RIIO-T2 package for its ET and GT businesses, but had decided to submit a technical appeal to the Competition and Markets Authority (CMA) in relation to ET and GT focused on Ofgem’s proposed cost of equity and ‘outperformance wedge’ (a downward adjustment to allowed returns in expectation of future outperformance). Key parameters from Ofgem’s RIIO-T2 Determinations for GT and ET Gas Transmission Electricity Transmission Allowed Return on Equity1 4.55% (real, relative to CPIH) 4.25% (real, relative to CPIH), at 55% gearing (which is broadly equivalent to 4.55% at 60% gearing) Allowed debt funding Calculated and updated each year using an extending ‘trombone-like’ trailing average of iBoxx Utilities 10+ year index (increases from 10 years for 2021/22 to 14 years for 2025/26), plus 25 bps additional borrowing costs. Depreciation of RAV 45-year sum-of-digit regulatory depreciation applied to RIIO-T2 additions and retrospectively to 2002 – 2021 additions. No change in policy: straight line over 45 years for post-2021 RAV additions, with pre-2021 RAV additions as per RIIO-T1. Notional gearing 60% 55% Split between fast/slow money Fast: TO baseline 35%; SO baseline 66%; TO uncertainty mechanisms 25% Fast: TO baseline 22%; TO uncertainty mechanisms 15% Slow: TO baseline 65%; SO baseline 34%; TO uncertainty mechanisms 75% Slow: TO baseline 78%; TO uncertainty mechanisms 85% Sharing factor 39% 33% Core baseline totex in 2018/19 prices (cumulative for the five years of RIIO-T2) £2.1 billion £5.8 billion 1. The cost of equity in RIIO-T2 is subject to annual adjustments that are calculated using the Capital Asset Pricing Model, through indexation of the ‘risk-free rate’ parameter. The 4.55% and 4.25% figures shown in this row are Ofgem’s estimates of the average allowed Return on Equity over the five years of RIIO-T2, as given in the RIIO-T2 Price Control Financial Model published in November 2021. In October 2021, the CMA found in favour of the technical arguments we put forward in respect of the ‘outperformance wedge’ but not on the cost of equity. RIIO-T2 builds on the framework established for RIIO-T1. For example, it introduces a range of new mechanisms to facilitate the transition to net zero, and it increases support for innovation, for example by allowing the regulator to direct additional funding in gas transportation for hydrogen innovation, in recognition of the uncertainty around the extent networks may have a role in transporting hydrogen. Competition in onshore transmission Ofgem stated in its final decision on the RIIO-T1 price control that it would consider holding a competition to appoint the constructor and owner of suitably large new electricity transmission projects, rather than including these new outputs and allowances in existing transmission licensee price controls. Ofgem reiterated this view in the RIIO-T2 Determination, extending it now to gas transmission and gas distribution. In the absence, thus far, of the legislation needed to support a competition, Ofgem has developed a number of models which it has indicated it would consider using to deliver benefits of competition, the primary one of these being called the ‘Competition Proxy Model’, but so far this has not been used for any projects or implemented into licences. The December 2020 BEIS energy white paper reiterated the government’s ambition to introduce greater competition to support the delivery of net zero targets but also explained that the introduction of legislation to support full third-party competition would be subject to available parliamentary time. Regulation of the Electricity System Operator A primary goal of the ESO legal separation in April 2019 was to increase transparency of our activities and help minimise any perceived conflicts of interest as we take on the challenge of driving forward the energy transformation. There are clear signals from Ofgem and the broader regulatory context that the ESO will play a crucial role in the changing energy environment. As an asset-light and service- based entity, the ESO is also fundamentally different from other regulated network companies. The RIIO-2 price control therefore implemented a bespoke framework for the ESO, recognising that it is different from other regulated businesses. As part of the RIIO-2 process, the ESO published a five-year Business Plan in December 2019, followed by a detailed two-year delivery schedule in October 2020 (covering the two-year Business Plan 1 (BP1) period). These documents, which were developed following extensive stakeholder engagement, set out the ESO’s planned activities and how they fit with its high-level ambitions. However, as the ESO’s funding uses a pass-through mechanism (where all efficiently incurred costs can be recovered through regulated revenues), the ESO has the flexibility to deviate from its published plans, delivering additional activities where there is an opportunity to benefit consumers. The ESO’s recent work on an Early Competition Plan and supporting the Offshore Transmission Network Review are examples of such activities. 246 National Grid plc Annual Report and Accounts 2021/22 The business in detail continued 29_Additional_info_Where_we_operate_Business_in_detail_p242_252_v87.indd 246 27/05/2022 17:41
The RIIO-2 regulatory framework includes a return on RAV but also provides additional non-RAV funding for roles and risks that are not linked to an asset base. There is no totex incentive mechanism for the ESO in RIIO-2, which means that the ESO has greater flexibility to adjust spending in order to deliver its ambitious Business Plan and maximise consumer benefit. ESO performance in RIIO-2 will continue to be assessed via an evaluative incentive approach, through a two-year incentive scheme with a total maximum reward of £30 million and maximum penalty of £12 million for the two-year period. As part of this incentive scheme, a Performance Panel (the ‘Panel’) of industry stakeholders scores the ESO on its performance, taking into account the delivery of its plans, numerical metrics such as balancing costs, stakeholder interactions, the benefit the ESO has delivered for consumers and the extent to which the ESO’s activities have delivered value for money. The Panel scores performance and gives feedback on a six-monthly basis, with the final set of scores in summer 2023 informing the reward or penalty awarded by Ofgem at the end of the two-year BP1 period. On 29 April 2022 the ESO published its draft plan for the Business Plan 2 (BP2) period, which runs from April 2023 to March 2025. Following engagement with industry the ESO will publish a final BP2 in August 2022. Ofgem is expected to publish its Draft Determinations on ESO’s BP2 in November 2022, with Final Determinations in March 2023. The challenge of net zero, the required speed of decarbonisation and the level of industry and societal change mean that structures and roles across the energy industry will need to evolve. In summer 2021, Ofgem and BEIS jointly consulted on the future of energy system operation. The consultation proposed that the creation of a future system operator, built on the existing capability of the ESO, is a key next step to accelerate the transition to net zero. BEIS and Ofgem have now made their final decision to proceed with the creation of a future system operator that is independent of National Grid. This decision means that, in time, the entirety of the ESO will become part of a new organisation, as well as certain long-term strategic activities for gas. The announcement does not include the operational functions of the Gas System Operator (GSO), which will remain part of NGG. We will continue to collaborate with BEIS, Ofgem and the wider industry following the outcome of this consultation. Interconnectors regulation Interconnectors derive their revenues from sales of capacity to users who wish to move power between market areas with different prices. Up until 31 December 2020, this was governed under European legislation and these capacity sales are classified as ‘congestion revenues’. This is because the market price differences result from congestion on the established interconnector capacity which limits full price convergence. European legislation governed how congestion revenues may be used and how interconnection capacity is allocated. It requires all interconnection capacity to be allocated to the market through auctions. From 1 January 2021, interconnectors to the UK are no longer governed by European legislation, and the operation of these interconnectors is governed by individual sets of access rules which are agreed by regulators at each end of the link. This does not affect the fundamental business model for interconnectors. Under UK legislation, interconnection businesses must be separate from transmission businesses. There is a range of different regulatory models available for interconnector projects. These involve various levels of regulatory intervention, ranging from fully merchant (where the project is fully reliant on sales of interconnector capacity) to cap and floor. The cap and floor regime is now the regulated route for interconnector investment in GB and may be sought by project developers who do not qualify for, or do not wish to apply for, exemptions from UK and European legislation which would facilitate a merchant development. Regulation of WPD Looking to the future, RIIO-ED2 covering the period 1 April 2023 – 31 March 2028, is the second electricity distribution price control to be set under the RIIO model. The first draft of our RIIO-ED2 Business Plan was submitted to Ofgem’s Challenge Group on 1 July 2021 and the final submission was made on 1 December 2021. Ofgem’s Draft Determinations are expected in July 2022 with Final Determinations due by winter 2022. Following the government’s recent legislation for net zero carbon by 2050, DNOs will be at the forefront of its delivery, enabling the transition to a smart, flexible, low-cost and low-carbon energy system for all consumers and network users. Our RIIO-ED2 Business Plan has been co- created with our stakeholders, following an enhanced and extensive approach to stakeholder engagement with over 25,000 stakeholders being consulted. We provided our stakeholders an opportunity to review our Business Plan three times before the final submission to Ofgem. Our Business Plan has evolved based of the feedback from our stakeholders, the Customer Engagement Groups (CEG) and Ofgem’s Challenge Group. Most notable changes have been a reduction of core commitments that demonstrate that they are all well justified, an increase to the ex-ante load-related expenditure to reflect our best view of low-carbon technology (LCT) take-up and additional strategies including the Business Innovation and Efficiency strategy, which clearly demonstrate how WPD will offer best value for our customers. The core commitments, as included in our Business Plan, fall within three key headings driven by Ofgem. These focus on meeting the needs of consumers and network users, maintaining a safe and resilient network, and delivering an environmentally sustainable service. Every core commitment in our draft Business Plan is in response to an area of focus identified as a priority by stakeholders. Some of the key commitments include: Sustainability: Leading the drive to net zero as early as possible • Facilitating regions achieving net zero carbon by as early as 2028 in line with local authority ambitions. • WPD to be net zero by 2028 for our own business carbon footprint (excluding network losses). Connectability: Customers can connect their electric vehicles and heat pumps when they want to • Ready for an additional 1.5 million electric vehicles and 600,000 heat pumps to be connected during RIIO-ED2, providing affordable, LCT connections without delays. • An online tool for same day self-assessment for the connection of LCTs to our network. Vulnerability: First class vulnerable customer support programme where everyone benefits in a smart future • 600,000 smart energy plans offered to customers in vulnerable situations each year. • £60 million saved by 113,000 fuel poor customers as a result of our ED2 support schemes. Affordability: Maintain excellent customer service, safety and network performance, and transform the energy grid for future generations, whilst maintaining affordability for our customers • Targeting 93%+ on customer satisfaction in ED2. • Lowest ever levels of power cuts. 247 A d d itio nal Info rm atio n National Grid plc Annual Report and Accounts 2021/22 29_Additional_info_Where_we_operate_Business_in_detail_p242_252_v87.indd 247 27/05/2022 17:41

US regulation Regulators In the US, public utilities’ retail transactions are regulated by state utility commissions which serve as economic regulators, approving cost recovery and authorised rates of return. The state commissions establish the retail rates to recover the cost of transmission and distribution services within their jurisdictions. They also serve the public interest by making sure utilities provide safe and reliable services at just and reasonable prices. The commissions establish service standards and approve public utility mergers and acquisitions. State commissions are also asked to approve a variety of programmes and costs related to state energy and climate goals. The Federal Energy Regulatory Commission (FERC) regulates wholesale transactions for utilities, such as interstate transmission and wholesale electricity sales, including rates for these services, at the federal level. FERC also regulates public utility holding companies and centralised service companies, including those of our US businesses. Regulatory process The US regulatory regime is premised on allowing the utility the opportunity to recover its cost of service and earn a reasonable return on its investments as determined by each commission. Utilities submit formal rate filings (rate cases) to the relevant state regulator when additional revenues are necessary to provide safe, reliable service to customers. Additionally, utilities can be compelled to file a rate case, either due to complaints filed with the commission or at the commission’s own discretion. The rate case is typically litigated with parties representing customers and other interests. The utility is required to prove that the requested rate change is just and reasonable, and the requested rate plan can span multiple years. In the states where we operate, it can typically take 9 – 13 months for the commission to render a final decision, although, in some instances, rules allow for longer negotiation periods which may extend the length of the rate case proceeding. Unlike the state processes, FERC, as the federal regulator, has no specified timeline for adjudicating a rate case; typically it makes a final decision retroactively when the case is completed. Gas and electricity rates are established from a revenue requirement, or cost of service, equal to the utility’s total cost of providing distribution or delivery service to its customers, as approved by the commission in the rate case. This revenue requirement includes operating expenses, depreciation, taxes, and a fair and reasonable return on shareholder capital invested in certain components of the utility’s regulated asset base or ‘rate base’. The final revenue requirement and rates for service are approved in the rate case decision. The revenue requirement is derived from a comprehensive study of the utility’s total costs during a representative 12-month period, referred to as a test year. Each commission has its own rules and standards for adjustments to the test year. These may include forecast capital investments and operating costs. US regulatory revenue requirement A B C D E F G H I J Capex and RoE Cost of service A Rate base B Debt C Equity D Return E Controllable costs F Non-controllable costs G Depreciation H Taxes I Lagged recoveries J Allowed revenue X allowed RoE X cost of debt RoE Interest Our rate plans Each operating company has a set of rates for service. We have three electric distribution operations (upstate New York, Massachusetts and Rhode Island) and five gas distribution networks (upstate New York, New York City, Long Island, Massachusetts and Rhode Island). Our distribution operating companies have revenue-decoupling mechanisms that delink their revenues from the quantity of energy delivered and billed to customers. These mechanisms remove the natural disincentive utility companies have for promoting and encouraging customer participation in energy- efficiency programmes that lower energy end use and distribution volumes. We bill our customers for their use of electricity and gas services. Customer bills typically cover the cost of the commodity (electricity or gas delivered), and charges covering our delivery service. With the exception of residential gas customers in Rhode Island, our customers are allowed to select an unregulated competitive supplier for the commodity component of electricity and gas utility services. A substantial proportion of our costs, in particular electricity and gas commodity purchases, are ‘pass-through’ costs, fully recoverable from our customers. We recover ‘pass-through’ costs through making separate charges to customers, designed to recover those costs with no profit. We adjust the charges from time to time, often annually to make sure that any over- or under-recovery of these costs is returned to, or recovered from, our customers. Our rate plans are designed to a specific allowed Return on Equity (RoE), by reference to an allowed operating expense level and rate base. Some rate plans include earnings-sharing mechanisms that allow us to retain a proportion of the earnings above our allowed RoE, achieved through improving efficiency, with the balance benefitting customers. In addition, our performance under certain rate plans is subject to service performance targets. We may be subject to monetary penalties in cases where we do not meet those targets. Our FERC-regulated transmission companies use formula rates (instead of periodic stated rate cases) to set rates annually that recover their cost of service. Through the use of annual true-ups, formula rates recover our actual costs incurred and the allowed RoE based on the actual transmission rate base each year. We must make annual formula rate filings documenting the revenue requirement that customers can review and challenge. Revenue for our wholesale transmission businesses in New England and New York is collected from wholesale transmission customers. These are typically other utilities and include our own New England electricity distribution businesses. With the exception of upstate New York, which continues to combine retail transmission and distribution rates to end-use customers, these wholesale transmission costs are generally incurred by distribution utilities on behalf of their customers. They are fully recovered as a pass-through from end-use customers, as approved by each state commission. Our Long Island generation plants sell capacity to the Long Island Power Authority (LIPA) under 15-year and 25-year power supply agreements and within wholesale tariffs approved by FERC. Through the use of cost-based formula rates, these long-term contracts provide a similar economic effect to cost-of-service rate regulation. One measure used to monitor the performance of our regulated businesses is a comparison of achieved RoE to allowed RoE. However, this measure cannot be used in isolation, as several factors may prevent us from achieving the allowed RoE. These include financial market conditions, regulatory lag (e.g. the time period after a rate or expense is approved for recovery but before we collect the same from customers) 248 National Grid plc Annual Report and Accounts 2021/22 The business in detail continued 29_Additional_info_Where_we_operate_Business_in_detail_p242_252_v87.indd 248 27/05/2022 17:41
and decisions by the regulator preventing cost recovery in rates from customers. We work to increase achieved RoE through: • productivity improvements; • positive performance against incentives or earned savings mechanisms, such as available energy-efficiency programmes; and • filing a new rate case when achieved returns are lower than those the Company could reasonably expect to attain through a new rate case. US regulatory filings The objectives of our rate case filings are to make sure we have the right cost of service and are able to earn a fair and reasonable rate of return, while providing a safe, reliable and economical service. To achieve these objectives and reduce regulatory lag, we have been successful in many cases in obtaining relief, such as: • revenue decoupling mechanisms; • capital trackers; • commodity-related bad debt true-ups; • pension and other post-employment benefit true-ups, separately from base rates; and • performance-based frameworks such as incentives and multi-year plans. We explain these terms in the table on page 252. Below, we summarise significant, recent developments in rate filings and the regulatory environment. A joint proposal setting forth a three-year rate plan for KEDNY and KEDLI was approved by the New York State Public Service Commission (NYPSC) in August 2021. A joint proposal, setting forth a three-year rate plan for Niagara Mohawk, was approved by the NYPSC in January 2022. An amended settlement agreement setting forth a three-year rate plan for The Narragansett Electric Company was approved by the Rhode Island Public Utilities Commission (RIPUC) in August 2018. The multi-year rate plan includes an interim fourth year, effective 1 September 2021. In November 2018, we made a full rate case filing for Massachusetts Electric which resulted in a five-year performance-based ratemaking plan in September 2019. In November 2020, we made a full rate case filing for Boston Gas resulting in a five-year performance-based ratemaking plan in September 2021. Massachusetts Massachusetts Electric and Nantucket Electric rate cases We filed a rate case for Massachusetts Electric and Nantucket Electric with the MADPU on 15 November 2018 with new rates effective on 1 October 2019. The Massachusetts Electric rate case was the first for Massachusetts Electric and Nantucket Electric since the case was filed in 2015. It updated the electric companies’ rates to more closely align revenues with the cost of service and bring their earned RoEs closer to the allowed RoE. New rates were approved with an allowed RoE of 9.6% on an equity ratio of 53.5%. The MADPU approved a five-year performance- based ratemaking plan, which adjusts distribution rates annually based on a predetermined formula. As part of its decision, the MADPU required a management audit addressing the Company’s strategic planning processes, staffing decisions and its relationship to National Grid USA Service Company, among other items. Boston Gas Company rate case On 30 September 2021, the MADPU issued an order in Boston Gas Company’s most recent rate case. The MADPU decision: (1) allowed an increase in base revenues of $144.86 million, as compared with the request for $220.74 million; (2) authorised a RoE of 9.70%, raised from the previous RoE of 9.5%; (3) authorised a capital structure of 53.44% equity and 46.56% debt; and (4) allowed for recovery of the costs of 133 new, incremental full-time employees. The decision also approved the Company’s proposed five-year performance-based ratemaking plan which adjusts distribution rates annually based on a predetermined formula. Boston Gas had also presented its Future of Heat proposals to address Massachusetts’ ambitious greenhouse gas emissions reduction goals. These proposals are innovative programmes and demonstration projects that the Company has developed to reduce emissions, promote gas demand response, and encourage the development of sustainable heating options and new technologies to advance low-carbon heating solutions. Ultimately, the MADPU elected to remove our Future of Heat proposals from the rate case without prejudice for their consideration as part of other proceedings. Subsequently, on 15 December 2021, the MADPU approved the Company’s geothermal district energy demonstration programme for five years with a budget of $15.6 million. Electric vehicles (EV) To support Massachusetts’ zero emission vehicle targets, in July 2021 the Company filed its Phase III EV charging programme with the MADPU, building on the success of two prior programmes and representing the second- largest such proposal in the US. The proposal requests MADPU approval for $278 million in spending to enable 7,500 public and workplace ports, 24,000 residential ports, and 600 fleet charging ports, as well to support electric school bus conversions in environmental justice communities, and expansion of the Company’s off-peak charging rebate programme. Investigation into role of gas distribution companies in achieving climate change goals On 29 October 2020, the MADPU issued an order opening an investigation into the role of gas distribution companies in achieving Massachusetts’ 2050 climate goals. On or before 18 March 2022, each company was required to submit a proposal to the MADPU that includes its recommendations and plans for helping Massachusetts achieve its 2050 climate goals, supported by an independent consultant’s report, that incorporates feedback and advice obtained through a stakeholder process. Supported by the consultant’s analysis, National Grid’s proposal envisions meeting the state’s 2050 climate goals by utilising a decarbonised and integrated gas and electric system that: • increases investment in and adoption of energy-efficiency measures; • eliminates fossil fuels from our gas supply by pursuing delivery of fossil-free gas such as renewable natural gas and renewable hydrogen through our network to all our customers; • enables customer use of hybrid heating by supporting customer adoption of heating technologies best suited to their needs; and • utilises targeted electrification, including new solutions such as networked geothermal where safe and cost-effective. Management audit On 30 September 2019, in its decision regarding Massachusetts Electric Company and Nantucket Electric Company’s most recent request for a change in base distribution rates, the MADPU required a comprehensive independent management audit of the Company, including a review of its relationship to the NGSC. The final audit report was issued on 29 March 2021. On 30 April 2021, the Company filed a proposal for implementation of the audit’s recommendations. The DPU issued a final order on 24 November 2021, directing Massachusetts Electric Company and Nantucket Electric Company to implement the recommendations contained in the Final Report and file a comprehensive update regarding implementation of the recommendations at or around the time of its next base rate proceeding. The MADPU inquiry regarding COVID-19 customer assistance and ratemaking matters Starting with the First Set of Orders on 24 March 2020, the Chairman of the MADPU issued a series of orders in response to the Governor’s declaration of a state of emergency due to the COVID-19 pandemic. In the First Set of Orders, the MADPU prohibited the utilities from terminating service to any customer (including residential, commercial and industrial customers) for non-payment of utility bills until the state of emergency is lifted. The state extended the moratorium for residential customers several times, with the last extension until 1 July 2021, while the moratorium for commercial and industrial (C&I) expired in autumn 2020. Effective 1 July 2021, the Company resumed normal collection activities, which includes issuing notices of amounts in arrears and alerting customers that their service is subject to disconnection for non-payment. On 31 December 2020, the MADPU approved the consensus implementation issues related to the ratemaking treatment of the COVID-19 customer assistance programmes and determined that the remaining contested issues, including the extent to which the companies will be allowed to recover their COVID-19 costs, should be fully adjudicated in a new proceeding which is currently pending before the MADPU. 249 A d d itio nal Info rm atio n National Grid plc Annual Report and
Accounts 2021/22 29_Additional_info_Where_we_operate_Business_in_detail_p242_252_v87.indd 249 27/05/2022 17:41

Grid Modernisation Plan (GMP) On 19 August 2015, the Company, together with Nantucket Electric, filed its first proposed GMP with the MADPU. On 10 May 2018, the MADPU issued an order in this proceeding. The order approved $82 million in grid-facing investments over three years in: (1) conservation voltage reduction and volt/volt-amps reactive optimisation; (2) advanced distribution automation; (3) feeder monitors; (4) communications and information/operational technologies; and (5) advanced distribution management/distribution supervisory control and data acquisition. The MADPU allowed recovery of both operation and maintenance expenses and capital costs through a reconciling mechanism. The MADPU did not approve any customer-facing (i.e. advanced metering infrastructure (AMI)) investments; the DPU said it would address these in a further investigation to see if there are ways to achieve cost-effective deployment of these investments. The Company has filed annual reports and cost recovery filings with the MADPU for its GMP in 2019, 2020 and 2021. The Company filed its next proposed four-year GMP (for calendar years 2022 – 2025) on 1 July 2021, which includes proposals to continue the previously-approved investments (designated as ‘Track 1’ in the proceeding), invest in a distributed energy resource management system (DERMS), conduct two demonstration projects, and deploy AMI (designated as Track 2 in the proceeding). Proceedings on Track 1 have concluded, and on 30 December 2021, the MADPU issued an interim order allowing investments in Track 1 to continue pending the MADPU’s final order on Track 1. The MADPU’s investigation of Track 2 is ongoing, with orders expected sometime in 2022. New York Downstate New York 2019 rate cases In August 2021, the NYSPSC approved a three-year rate plan for our downstate New York gas businesses, commencing retroactively from 1 April 2020 through to 31 March 2023. The rate plan includes: an 8.8% RoE and 48% equity ratio; gas revenue decreases of $4.7 million for KEDNY and $22.8 million for KEDLI in 2020/21, gas revenue increases of $47 million for KEDNY and $28.9 million for KEDLI in 2021/22, and gas revenue increases of $73.3 million for KEDNY and $26.2 million for KEDLI in 2022/23; funding for a three-year capital plan of approximately $2 billion for KEDNY and $1.3 billion for KEDLI; annual reconciliation mechanisms for certain non- controllable costs (e.g. property taxes, pension/ OPEBs, and site investigation remediation costs); a gas safety and reliability surcharge to recover the costs of incremental leak-prone pipe replacement; and a number of incentive mechanisms, including earnings adjustment mechanisms (EAMs), which provide a potential incentive of approximately $3.9 million and $2.5 million annually for KEDNY and KEDLI respectively. There is an option to extend the plan for a fourth rate year with a net plant capital tracker. The rate plan agreement includes a commitment by the Company to evaluate the impact of New York’s climate laws on its gas business and infrastructure, including the depreciation of its gas assets. NMPC rate case In January 2022, the NYPSC approved a three-year rate settlement for NMPC’s electric and gas business commencing retroactively from 1 July 2021 and continuing through 30 June 2024. The rate plan provides for electric revenue increases of $49 million for the rate year ending 30 June 2022, $96 million for the rate year ending 30 June 2023 and $110 million for the rate year ending 30 June 2024, and gas revenue increases of $13 million for the rate year ending 30 June 2022, $29 million for the rate year ending 30 June 2023, and $33 million for the rate year ending 30 June 2024. The rate plan includes: a 9.0% RoE and 48% equity ratio; funding for a three-year capital plan of approximately $2.5 billion for electric and $0.8 billion for gas; annual reconciliation mechanisms for certain non-controllable costs (e.g. property taxes, pension/OPEBs, and site investigation remediation costs); a gas safety and reliability surcharge to recover the costs of incremental leak-prone pipe replacement; and a number of incentive mechanisms, including EAMs, which provide a potential incentive of approximately $106 million and $8 million annually for electric and gas, respectively. The settlement also provides funding for NMPC’s advanced metering infrastructure deployment in its upstate New York service territory. There is an option to extend the rate plan to 31 March 2025 and the agreement includes a commitment by the Company to evaluate the impact of New York’s climate laws on its gas business and infrastructure, including the depreciation of its gas assets. Downstate gas supply constraints In November 2019, the Company entered into a settlement agreement with the state of New York that resolved all claims relating to KEDNY and KEDLI’s imposition of restrictions on service connections implemented in 2019. A total of $36 million in customer assistance, gas conservation measures and clean energy investments was committed by the companies, along with the appointment of an external monitor and the requirement to deliver a plan to address service to customers through winter 2020/21. In the interest of promoting transparency and to assure the public of the Company’s commitment to identifying long-term solutions for the region’s energy challenges, we extended the engagement of the external monitor through September 2021. The settlement agreement also provided a framework for identifying longer-term solutions to address the supply constraints in downstate New York. We developed a range of options to address the natural gas constraints facing the region, which were presented at a series of public meetings in the downstate New York service territory. KEDNY and KEDLI are now working with regulators, stakeholders and customers to implement long-term solutions to the gas supply constraints in the region. In February 2021, the NYPSC approved an amendment to the Settlement Agreement, which repurposed $20 million of shareholder funding to offset the costs of KEDNY and KEDLI’s energy efficiency and demand response programmes. In September 2021, the monitor issued a closing report that summarised our performance under the settlement over the course of the 18-month term of the monitorship, described our efforts to implement the monitor’s various recommendations, and offered new recommendations related to the ongoing efforts to meet gas demand in downstate New York. COVID-19 response New York The New York State Legislature, in response to the financial impacts of COVID-19 on utility customers, enacted a moratorium on service terminations for non-payment of any overdue charges for the duration of the COVID-19 state of emergency. Further, for customers who attest to a change in financial circumstances due to the COVID-19 pandemic, these protections were extended to 21 December 2021, an additional 180 days following the end of the declared state of emergency. Fraud investigation On 17 June 2021, five former National Grid employees in the downstate New York facilities department were arrested on federal charges alleging conspiracy and bribery. National Grid has been identified as a victim of the alleged crimes and will continue to cooperate with the government’s investigation. The NYPSC is reviewing the matter and the MADPU and the RIPUC have each issued requests for information related to the alleged criminal conduct. At this time, it is not possible to predict the outcome of the regulatory review or determine the amount, if any, of any potential liabilities that may be incurred by the Company related to this matter. However, we do not expect this matter will have a material adverse effect on the Company’s results of operations, financial position or cash flows. Other important regulatory updates On 12 February 2021, the Department of Public Service Staff issued white papers on gas system planning that propose: • a process for modernising the long-term gas planning process in New York; and • procedures for managing future moratoria on new gas service connections resulting from supply constraints. ‘The Gas Planning Paper’ proposes significant changes to the reporting and regulatory oversight for gas supply planning, including that the NYPSC direct New York’s distribution companies to begin filing long-term supply plans every three years. These supply plans would be similar in many respects to our long-term report for downstate New York, in
terms of identifying and analysing various supply options to address different demand scenarios. The NYPSC proposes potential financial incentive mechanisms for developing non-pipeline alternatives, including potential incentives for sourcing renewable natural gas and promoting electrification. ‘The Moratorium Paper’ proposes a roadmap for managing future moratoria, including requirements for stakeholder notifications, communications plans and applicant management. An NYPSC decision in this proceeding is pending. 250 National Grid plc Annual Report and Accounts 2021/22 The business in detail continued 29_Additional_info_Where_we_operate_Business_in_detail_p242_252_v87.indd 250 27/05/2022 17:41

In September 2021, the NYPSC approved Niagara Mohawk’s petition seeking approval to dispatch and market the output from a Company-owned energy storage facility into the wholesale markets administered by the New York Independent System Operator, Inc. (NYISO). The facility consists of a single 2MW/3MWh energy storage unit that was installed to mitigate a potential thermal overload of a substation transformer but is only needed for local reliability support during the summer months of June to September. The NYPSC authorised the Company to bid the energy, capacity and/or ancillary services available from the facility into the NYISO-administered wholesale markets when not needed for local reliability support with the financial gains from any such market transactions accruing entirely to the benefit of Niagara Mohawk’s customers. This authorisation for dual participation will provide financial benefits to the Company’s customers that funded the facility and will provide valuable learning opportunities in advance of managing the third-party-owned bulk energy storage projects being procured through competitive requests for proposals pursuant to NYPSC orders. In addition, in October 2021, KEDNY and KEDLI filed to secure approval for a demand-side management programme that would deploy unprecedented levels of non-infrastructure solutions (e.g. the energy efficiency and demand response programme) to meet customers’ energy needs and address a looming gas capacity shortfall on the Company’s systems in a manner that supports New York’s aggressive climate goals. A NYPSC decision is pending. Rhode Island Rhode Island combined gas and electric rate case On 24 August 2018, the RIPUC approved the terms of an Amended Settlement Agreement (ASA), which took effect on 1 September 2018. We are currently in year four of the Company’s multi-year rate plan. On 30 June 2021, the Division consented to an extension of the term of the rate plan such that the Company is not required to file its next rate case so that new rates take effect no later than 1 September 2022. The ASA will remain in effect and the Company will continue to operate under the current rate plan until a new rate plan is approved by the RIPUC. The Company filed a copy of the Division consent letter with the RIPUC on 15 July 2021. Base distribution rates will remain at the Rate Year 3 levels until the next base rate case. The ASA includes an Electric Transportation Initiative (ET Initiative) to facilitate the growth of EV options and scaling of the market for EV charging equipment to advance Rhode Island’s zero emission vehicles and greenhouse gas emissions policy goals. The ET Initiative includes the following five components: • off-Peak Charging Rebate Pilot; • charging Station Demonstration Programme; • discount Pilot for Direct Current Fast Charging (DCFC) Station Accounts; • fleet Advisory Services; and • electric Transportation Initiative Evaluation. Infrastructure, Safety and Reliability Plans FY 2023 Gas and Electric ISR Plans were filed on 17 and 20 December 2021 respectively for effect 1 April 2022. The Electric ISR Plan proposed capital spending of $104.8 million, plus $13.2 million for total operation and maintenance expenses. The Gas ISR Plan proposed total capital spending of $175.66 million. The RIPUC approved the Gas and Electric ISR Plans on 29 March 2022. There will be a further hearing for the Gas ISR Plan on one issue on 1 June 2022. The RIPUC’s ruling on the Electric ISR Plan required the Company to review all distributed generation (DG) projects for which the CIAC did not cover the full cost of the project, reasons why, impact on rate base and associated revenue requirement. The Company is required to file a report on this by 1 August 2022. COVID-19 response in Rhode Island In response to the COVID-19 emergency, effective on 16 March 2020, the RIPUC ordered all electric and natural gas utilities to immediately cease certain collection activities, including termination of service for non-payment. On 13 July 2020, the RIPUC, after finding that an emergency still existed for customers eligible for the low-income rate, extended the moratorium on utility shut-offs until 1 November 2020 for customers qualifying for a low-income discount and until 30 September 2020 for remaining residential customers of National Grid. All COVID-19-related moratoria have now expired, and the Company has resumed collection activities. Federal Energy Regulatory Commission Complaints on New England transmission allowed RoE In September 2011, December 2012, July 2014 and April 2016, a series of four complaints were filed with FERC against certain transmission owners, including our New England electricity transmission business. These complaints aimed to lower the base RoE, which FERC had authorised at 11.14% prior to the first complaint. FERC issued orders resolving only the first complaint, with the last order in March 2015, lowering the base RoE to 10.57%. A number of parties, including the Company, appealed FERC’s order on the first complaint to the US federal court. On 14 April 2017, the court vacated FERC’s order and remanded the first complaint back to FERC. This required FERC to reconsider the methodology it adopted in its order. On 5 June 2017, the New England Transmission Owners (NETOs), including the Company, submitted a filing to FERC to document the reinstatement of their transmission rates that had been in effect on 15 October 2014. FERC denied this filing and stated that, until further notice, the base RoE in New England must remain at the filed rate of 10.57%. On 6 November 2017, the NETOs, including the Company, sought rehearing of the FERC order denying the filing to reinstate their transmission rates that previously had been in effect. As of the end of Rate Year 2, the Charging Station Demonstration Programme achieved 72% of ET Initiative targets for Level 2 ports and 7% of the target for DCFC ports. The ASA also includes two energy storage demonstration projects because storage is critical for achieving Rhode Island’s clean energy future, as it provides the ability to optimise system performance over time and allows intermittent renewable resources to make a larger contribution to the State’s overall energy supply mix. Rhode Island Aquidneck Island gas service interruption On 21 January 2019, we suffered a significant loss of gas supply to the distribution system that serves our customers on Aquidneck Island in Rhode Island. As a result, we made the decision to interrupt the gas service to the Aquidneck Island system to protect the safety of our customers and the public. Overall, approximately 7,500 customers lost their gas service. On 23 September 2020, we published a long-term capacity study for energy solutions for Aquidneck Island for stakeholder feedback. The Company has since gathered extensive stakeholder feedback regarding a long-term solution for Aquidneck Island and has identified the solution, which it shared with stakeholders in October 2021. Power Sector Transformation/Advanced Metering Functionality and Grid Modernisation Plan On 27 November 2017, we filed a Power Sector Transformation (PST) Vision and Implementation Plan (PST Plan) in conjunction with our combined gas and electric rate case. The PST Plan proposed a suite of investments, including the full deployment of Advanced Metering Functionality (AMF) and grid modernisation investments. On 21 January 2021, following more than two years of extensive collaboration with regulators and key stakeholders, we filed an Updated AMF Business Case and GMP with the RIPUC. The Updated AMF Business Case provides a detailed plan to provide customers with greater control, choice and convenience in their energy consumption through the full-scale deployment of approximately 525,000 electric AMF meters, 277,000 gas modules and the associated communications network. GMP presents a 5-year implementation plan, and a 10-year roadmap of investments necessary to manage the electric distribution grid more granularly considering a range of Distributed Energy Resource (DER) adoption levels through 2030, as well as a comprehensive cost benefit analysis. Cost recovery for the specific projects and programmes in the GMP will be separately requested as part of future Infrastructure, Safety and Reliability (ISR Plans) or rate cases. Pursuant to written order issued on 14 July 2021, the RIPUC stayed the AMF and GMP proceedings pending further
consideration following the issuance of a final order by the Division on the PPL Transaction. The RIPUC did not rule on whether or not to consolidate the matters. 251 A d d itio nal Info rm atio n National Grid plc Annual Report and Accounts 2021/22 29_Additional_info_Where_we_operate_Business_in_detail_p242_252_v87.indd 251 27/05/2022 17:41

2019. FERC is under no deadline to act on the briefs and it is too early to determine when or how FERC will come to a decision. On 21 November 2019, FERC issued an order addressing customer complaints involving the transmission RoE for the transmission owners in the Midcontinent Independent System Operator region (MISO TOs). FERC issued an order on rehearing addressing the initial order on 21 May 2020. On 19 November 2020, FERC issued a further order on rehearing reaching the same result as the 21 May 2020 order. In those orders, FERC adopted a revised methodology for determining base RoEs for the MISO TOs. This differed significantly from the methodology and framework set forth in its 16 October 2018 Preliminary Order, which proposed a new RoE methodology in the dockets covering the four RoE complaints against the NETOs. On 23 December 2019, the NETOs filed On 28 August 2020, after determining that this rehearing request had been deemed denied, the NETOs, including the Company, appealed to a US federal court FERC’s order denying the filing to reinstate their transmission rates that previously had been in effect. On 2 October 2020, in response to an unopposed motion by FERC, the US federal court held this appeal in abeyance for four months. On 16 October 2018, FERC issued a Preliminary Order Directing Brief on our four New England RoE complaints. In this order, FERC proposed a new methodology for determining whether an existing RoE remains just and reasonable and also for determining a new RoE where an existing RoE is found to be unjust and unreasonable. FERC also proposed to set the base RoE in New England at 10.41% with a 13.08% cap on incentives. Briefs were due in January 2019 and responses to the briefs were filed on 8 March Summary of US price controls and rate plans 20 18 20 19 20 20 20 21 20 22 20 23 20 24 R at e ba se (3 1 M ar 2 02 2) E q ui ty -t o- d eb t ra tio A llo w ed R et ur n on E q ui ty A ch ie ve d R et ur n on E q ui ty (3 1 M ar 2 02 2) R ev en ue d ec ou p lin g† C ap ita l t ra ck er ‡ C om m od ity - re la te d ba d d eb t tr ue -u p§ P en si on /O P E B tr ue -u p◊ New York Public Service Commission Niagara Mohawk1 (upstate, electricity) $6,603m 48:52 9.0% 8.5% P P Niagara Mohawk (upstate, gas) $1,584m 48:52 9.0% 8.1% P P KEDNY (downstate)2 $5,429m 48:52 8.8% 8.1% P P P KEDLI (downstate)3 $3,369m 48:52 8.8% 11.0% P P P Massachusetts Department of Public Utilities Massachusetts Electric/Nantucket Electric $3,049m 53:47 9.6% 7.1% P Massachusetts Gas $3,820m 53:47 9.7% 6.9% P Rhode Island Public Utilities Commission Narragansett Electric $983m 51:49 9.3% 8.4% P Narragansett Gas $1,218m 51:49 9.3% 8.4% P Federal Energy Regulatory Commission Narragansett $788m 50:50 10.6% 12.5% n/a n/a Canadian Interconnector/Other 4 $46m 65:35 11.1% 11.1% n/a n/a New England Power $2,260m 63:37 10.6% 10.9% n/a n/a Long Island Generation $426m 48:52 9.9% 14.1% n/a n/a 1. Both transmission and distribution, excluding stranded costs. 2. KeySpan Energy Delivery New York (the Brooklyn Union Gas Company). 3. KeySpan Energy Delivery Long Island (KeySpan Gas East Corporation). 4. Equity ratio and Return on Equity values are for the Canadian Interconnector only. Rate filing made New rates effective Rate plan ends Rates continue indefinitely Multi-year rate plan Feature in place P Feature partially in place †Revenue decoupling A mechanism that removes the link between a utility’s revenue and sales volume so that the utility is indifferent to changes in usage. Revenues are reconciled to a revenue target, with differences billed or credited to customers. This allows the utility to support energy efficiency. ‡Capital tracker A mechanism that allows the recovery of the revenue requirement of incremental capital investment above that embedded in base rates, including depreciation, property taxes and a return on the incremental investment. §Commodity-related bad debt true-up A mechanism that allows a utility to reconcile commodity-related bad debt either to actual commodity-related bad debt or to a specified commodity-related bad debt write-off percentage. For electricity utilities, this mechanism also includes working capital. ◊Pension/OPEB true-up A mechanism that reconciles the actual non-capitalised costs of pension and OPEB and the actual amount recovered in base rates. The difference may be amortised and recovered over a period or deferred for a future rate case. a Supplemental Paper Hearing Brief and a Motion to Supplement the Record in the NETOs’ RoE dockets to respond to the new methodology adopted in the November 2019 MISO TOs’ order, as there is uncertainty as to whether the outcome in that proceeding may be applied to the NETOs’ cases. Further changes to the FERC RoE methodology applicable to the Company are possible as a result of the orders in the MISO TOs’ proceeding and the issues raised in pending pleadings in the NETOs’ proceedings. Given the significant uncertainty relating to FERC’s methodology, the Company is unable to predict the potential effect of the 21 November 2019, 21 May 2020 and 19 November 2020 MISO TO orders on the NETOs’ RoE dockets or the outcome of the four complaints. Further, the Company cannot reasonably estimate a range of gain or loss for any of the four complaint proceedings. 252 National Grid plc Annual Report and Accounts 2021/22 The business in detail continued 29_Additional_info_Where_we_operate_Business_in_detail_p242_252_v87.indd 252 27/05/2022 17:41

Disclosure controls Our management, including the Chief Executive and Chief Financial Officer, have evaluated the effectiveness of the design and operation of our disclosure controls and procedures as at 31 March 2022. Our disclosure controls and procedures are designed to provide reasonable assurance of achieving their objectives; however, their effectiveness has limitations, including the possibility of human error and the circumvention or overriding of the controls and procedures. Even effective disclosure controls and procedures provide only reasonable assurance of achieving their objectives. Based on the evaluation, the Chief Executive and Chief Financial Officer concluded that the disclosure controls and procedures are effective to provide reasonable assurance that information required for disclosure in the reports that we file and submit under the Exchange Act is recorded, processed, summarised and reported as and when required and that such information is accumulated and communicated to our management, including the Chief Executive and Chief Financial Officer, as appropriate, to allow timely decisions regarding disclosure. Internal control over financial reporting Our management, including the Chief Executive and Chief Financial Officer, have carried out an evaluation of our internal control over financial reporting pursuant to the Disclosure Guidance and Transparency Rules sourcebook and Section 404 of the Sarbanes-Oxley Act 2002. As required by Section 404, management is responsible for establishing and maintaining an adequate system of internal control over financial reporting (as defined in Rules 13(a)-5(f) and 15(d)-15(f) under the Exchange Act). Our internal control over financial reporting is designed to provide reasonable assurance regarding the reliability of financial reporting and the preparation of financial statements for external purposes, in accordance with generally accepted accounting principles. Because of its inherent limitations, internal control over financial reporting may not prevent or detect misstatements. Also, projections of any evaluation of effectiveness to future periods are subject to the risk that controls may become inadequate because of changes in conditions, or that the degree of compliance with the policies or procedures may deteriorate. Management’s evaluation of the effectiveness of the Company’s internal control over financial reporting was based on the revised Internal Control-Integrated Framework 2013 issued by the Committee of Sponsoring Organizations of the Treadway Commission. Using this evaluation, management concluded that our internal control over financial reporting was effective as at 31 March 2022. Deloitte LLP, which has audited our consolidated financial statements for the year ended 31 March 2022, has also audited the effectiveness of our internal control over financial reporting. During the year, we implemented a new enterprise resource planning (ERP) and general ledger system in the UK for ET and GT, resulting in changes to our reporting system; subject to that, there were no changes in our internal control over financial reporting that have materially affected, or are reasonably likely to materially affect, our internal control over financial reporting. Risk factors Management of our risks is an important part of our internal control environment, as we describe on pages 28 – 32. In addition to the principal risks listed, we face a number of inherent risks that could have a material adverse effect on our business, financial condition, results of operations and reputation, as well as the value and liquidity of our securities. Any investment decision regarding our securities and any forward-looking statements made by us should be considered in the light of these risk factors and the cautionary statement set out on page 288. An overview of the key inherent risks we face is provided below. Risk factors Law, regulation and political and economic uncertainty Changes in law or regulation, or decisions by governmental bodies or regulators and increased political and economic uncertainty, could materially adversely affect us. Most of our businesses are utilities or networks subject to regulation by governments and other authorities. Changes in law or regulation or regulatory policy and precedent (including changes arising as a result of the UK’s exit from the European Union), as well as legislation introduced to facilitate the attainment of net zero emissions targets, and decisions of governmental bodies or regulators in the countries or states in which we operate could materially adversely affect us. We may fail to deliver any one of our customer, investor and wider stakeholder propositions due to increased political and economic uncertainty. If we fail to respond to or meet our own commitments as a leader in relation to climate change and the energy transition, we may be unable to influence future energy policy and deliver our strategy. Decisions or rulings concerning the following (as examples) could have a material adverse impact on our results of operations, cash flows, the financial condition of our businesses and the ability to develop those businesses in the future: • the determination and implementation of the RIIO-T2 and RIIO-ED2 price controls; whether licences, approvals or agreements to operate or supply are granted, amended or renewed; whether consents for construction projects are granted in a timely manner; or whether there has been any breach of the terms of a licence, approval or regulatory requirement; and • timely recovery of incurred expenditure or obligations; the ability to pass through commodity costs; a decoupling of energy usage and revenue, and other decisions relating to the impact of general economic conditions on us, our markets and customers; implications of climate change and of advancing energy technologies; whether aspects of our activities are contestable; and the level of permitted revenues and dividend distributions for our businesses and in relation to proposed business development activities. For further information, see pages 245– 252, which explain our regulatory environment in detail. 253 A d d itio nal Info rm atio n National Grid plc Annual Report and Accounts 2021/22 Internal control and risk factors 30_Internal_control_and_risk_factors_p253_256_v31.indd 253 27/05/2022 17:42

Potentially harmful activities Aspects of the work we do could potentially harm employees, contractors, members of the public or the environment. Potentially hazardous activities that arise in connection with our business include: the generation, transmission and distribution of electricity; and the storage, transmission and distribution of gas. Electricity and gas utilities also typically use and generate hazardous and potentially hazardous products and by-products. In addition, there may be other aspects of our operations that are not currently regarded or proved to have adverse effects but could become so, such as the effects of electric and magnetic fields. A significant safety or environmental incident, or the failure of our safety processes or of our occupational health plans, as well as the breach of our regulatory or contractual obligations or our climate change targets, could materially adversely affect our results of operations and our reputation. Safety is a fundamental priority for us, and we commit significant resources and expenditure to ensuring process safety; to monitoring personal safety, occupational health and environmental performance; and to meeting our obligations under negotiated settlements. We are subject to laws and regulations in the UK and US governing health and safety matters to protect the public and our employees and contractors, who could potentially be harmed by these activities, as well as laws and regulations relating to pollution, the protection of the environment, and the use and disposal of hazardous substances and waste materials. These expose us to costs and liabilities relating to our operations and properties, including those inherited from predecessor bodies, whether currently or formerly owned by us, and sites used for the disposal of our waste. The cost of future environmental remediation obligations is often inherently difficult to estimate, and uncertainties can include the extent of contamination, the appropriate corrective actions and our share of the liability. We are increasingly subject to regulation in relation to climate change and are affected by requirements to reduce our own carbon emissions (including our own commitment to reduce our greenhouse gas emissions to net zero by 2050) as well as to enable reduction in energy use by our customers. If more onerous requirements are imposed or our ability to recover these costs under regulatory frameworks changes, this could have a material adverse impact on our business, reputation, results of operations and financial position. Infrastructure and IT systems We may suffer a major network failure or interruption, or may not be able to carry out critical operations due to the failure of infrastructure, data or technology or a lack of supply. Operational performance could be materially adversely affected by: a failure to maintain the health of our assets or networks; inadequate forecasting of demand and inadequate record keeping or control of data or failure of information systems and supporting technology. This, in turn, could cause us to fail to meet agreed standards of service, incentive and reliability targets, or be in breach of a licence, approval, regulatory requirement or contractual obligation. Even incidents that do not amount to a breach could result in adverse regulatory and financial consequences, as well as harming our reputation. Where demand for electricity or gas exceeds supply, including where we do not adequately forecast and respond to disruptions in energy supplies, and our balancing mechanisms are not able to mitigate this fully, a lack of supply to consumers may damage our reputation. In addition to these risks, we may be affected by other potential events that are largely outside our control, weather (including as a result of climate change and major storms), unlawful or unintentional acts of third parties, insufficient or unreliable supply, or force majeure. Weather conditions can affect financial performance, and severe weather that causes outages or damages infrastructure, together with our actual or perceived response, could materially adversely affect operational and potentially business performance and our reputation. Malicious attack, sabotage or other intentional acts, including breaches of our cyber security, may also damage our assets (which include critical national infrastructure) or otherwise significantly affect corporate activities and, as a consequence, have a material adverse impact on our reputation, business, results of operations and financial condition. Unauthorised access to, or deliberate breaches of, our IT systems may also lead to manipulation of our proprietary business data or customer information. Unauthorised access to private customer information may make us liable for a violation of data privacy regulations. Even where we establish business continuity controls and security against threats to our systems, these may not be sufficient. Pandemics We face risks related to health epidemics and other outbreaks. As seen in the context of COVID-19, pandemics and their associated counter-measures may affect countries, communities, supply chains and markets, including the UK and our service territory in the US. The spread of such pandemics could have adverse effects on our workforce, which could affect our ability to maintain our networks and provide service. In addition, disruption of supply chains could adversely affect our systems or networks. Pandemics such as COVID-19 can also result in extraordinary economic circumstances in our markets which could negatively affect our customers’ ability to pay our invoices in the US or the charges payable to the system operators for transmission services in the UK. Measures such as the suspension of debt collection and customer termination activities across our service area in response to such pandemics are likely to result in near-term lower customer collections, and could result in increasing levels of bad debt and associated provisions. The extent to which pandemics such as COVID-19 may affect our liquidity, business, financial condition, results of operations and reputation will depend on future developments, which are highly uncertain and cannot be predicted, and will depend on the severity of the relevant pandemic, the scope, duration, cost to National Grid and overall economic impact of actions taken to contain it or treat its effects. Business performance Current and future business performance may not meet our expectations or those of our regulators and shareholders. Earnings maintenance and growth from our regulated gas and electricity businesses will be affected by our ability to meet or exceed efficiency targets and service quality standards set by, or agreed with, our regulators. If we do not meet these targets and standards, or if we are not able to deliver our rate plans strategy successfully, we may not achieve the expected benefits, our business may be materially adversely affected and our performance, results of operations and reputation may be materially harmed and we may be in breach of regulatory or contractual obligations. 254 National Grid plc Annual Report and Accounts 2021/22 Internal control and risk factors continued 30_Internal_control_and_risk_factors_p253_256_v31.indd 254 27/05/2022 17:42

Growth and business development activity Failure to respond to external market developments and execute our growth strategy may negatively affect our performance. Conversely, new businesses or activities that we undertake alone or with partners may not deliver target outcomes and may expose us to additional operational and financial risk. Failure to grow our core business sufficiently and have viable options for new future business over the longer term, or failure to respond to the threats and opportunities presented by emerging technology or innovation (including for the purposes of adapting our networks to meet the challenges of increasing distributed energy resources), could negatively affect the Group’s credibility and reputation and jeopardise the achievement of intended financial returns. Our business development activities, including the WPD Acquisition, the NECO Sale, the NGGT Sale and the delivery of our growth ambition, involve acquisitions, disposals, joint ventures, partnering and organic investment opportunities, such as development activities relating to changes to the energy mix and the integration of distributed energy resources and other advanced technologies. These are subject to a wide range of both external uncertainties (including the availability of potential investment targets and attractive financing and the impact of competition for onshore transmission in both the UK and US) and internal uncertainties (including actual performance of our existing operating companies and our business planning model assumptions and ability to integrate acquired businesses effectively). As a result, we may suffer unanticipated costs and liabilities and other unanticipated effects. We may also be liable for the past acts, omissions or liabilities of companies or businesses we have acquired, which may be unforeseen or greater than anticipated. In the case of joint ventures, we may have limited control over operations and our joint venture partners may have interests that diverge from our own. The occurrence of any of these events could have a material adverse impact on our results of operations or financial condition, and could also impact our ability to enter into other transactions. Financing and liquidity An inability to access capital markets at commercially acceptable interest rates could affect how we maintain and grow our businesses. Our businesses are financed through cash generated from our ongoing operations, bank lending facilities and the capital markets, particularly the long-term debt capital markets. Some of the debt we issue is rated by credit rating agencies, and changes to these ratings may affect both our borrowing capacity and borrowing costs. In addition, restrictions imposed by regulators may also limit how we service the financial requirements of our current businesses or the financing of newly acquired or developing businesses. Financial markets can be subject to periods of volatility and shortages of liquidity, for example, as a result of unexpected political or economic events or the COVID-19 pandemic. If we were unable to access the capital markets or other sources of finance at commercially acceptable rates for a prolonged period, our cost of financing may increase, the discretionary and uncommitted elements of our proposed capital investment programme may need to be reconsidered, and the manner in which we implement our strategy may need to be reassessed. Such events could have a material adverse impact on our business, results of operations and prospects. Some of our regulatory agreements impose lower limits for the long-term unsecured debt credit ratings that certain companies within the Group must hold or the amount of equity within their capital structures, including a limit requiring National Grid plc to hold an investment-grade long-term senior unsecured debt credit rating. In addition, some of our regulatory arrangements impose restrictions on the way we can operate. These include regulatory requirements for us to maintain adequate financial resources within certain parts of our operating businesses and may restrict the ability of National Grid plc and some of our subsidiaries to engage in certain transactions, including paying dividends, lending cash and levying charges. The inability to meet such requirements, or the occurrence of any such restrictions, may have a material adverse impact on our business and financial condition. Our debt agreements and banking facilities contain covenants, including those relating to the periodic and timely provision of financial information by the issuing entity, restrictions on disposals and financial covenants, such as restrictions on the level of subsidiary indebtedness. Failure to comply with these covenants, or to obtain waivers of those requirements, could in some cases trigger a right, at the lender’s discretion, to require repayment of some of our debt and may restrict our ability to draw upon our facilities or access the capital markets. Exchange rates, interest rates and commodity price indices Changes in foreign currency rates, interest rates or commodity prices could materially impact earnings or our financial condition. We have significant operations in the US and are therefore subject to the exchange rate risks normally associated with non-UK operations including the need to translate US assets, liabilities, income and expenses into sterling (our reporting currency). In addition, our results of operations and net debt position may be affected because a significant proportion of our borrowings, derivative financial instruments and commodity contracts are affected by changes in interest rates, commodity price indices and exchange rates, in particular the dollar-to-sterling exchange rate. Furthermore, our cash flow may be materially affected as a result of settling hedging arrangements entered into to manage our exchange rate, interest rate and commodity price exposure, or by cash collateral movements relating to derivative market values, which also depend on the sterling exchange rate into the euro and other currencies. 255 A d d itio nal Info rm atio n National Grid plc Annual Report and Accounts 2021/22 30_Internal_control_and_risk_factors_p253_256_v31.indd 255 27/05/2022 17:42
Post-retirement benefits We may be required to make significant contributions to fund pension and other post-retirement benefits. We participate in a number of pension schemes that together cover substantially all our employees. In both the UK and US, such schemes include various large defined benefit schemes where the scheme assets are held independently of our own financial resources. In the US, we also have other post-retirement benefit schemes. Estimates of the amount and timing of future funding for the UK and US schemes are based on actuarial assumptions and other factors, including: the actual and projected market performance of the scheme assets; future long-term bond yields; average life expectancies; and relevant legal requirements. Actual performance of scheme assets may be affected by volatility in debt and equity markets. Changes in these assumptions or other factors may require us to make additional contributions to these pension schemes which, to the extent they are not recoverable under our price controls or state rate plans, could materially adversely affect the results of our operations and financial condition. Customers and counterparties Customers and counterparties may not perform their obligations. Our operations are exposed to the risk that customers, suppliers, banks and other financial institutions, and others with whom we do business, will not satisfy their obligations, which could materially adversely affect our financial position. This risk is significant where our subsidiaries have concentrations of receivables from gas and electricity utilities and their affiliates, as well as industrial customers and other purchasers, and may also arise where customers are unable to pay us as a result of increasing commodity prices or adverse economic conditions. To the extent that counterparties are contracted with for physical commodities (gas and electricity) and they experience events that impact their own ability to deliver, we may suffer supply interruption as described in Infrastructure and IT systems on page 254. There is also a risk to us where we invest excess cash or enter into derivatives and other financial contracts with banks or other financial institutions. Banks who provide us with credit facilities may also fail to perform under those contracts. Employees and others We may fail to attract, develop and retain employees with the competencies (including leadership and business capabilities), values and behaviours required to deliver our strategy and vision and ensure they are engaged to act in our best interests. Our ability to implement our strategy depends on the capabilities and performance of our employees and leadership at all levels of the business. Our ability to implement our strategy and vision may be negatively affected by the loss of key personnel or an inability to attract, integrate, engage and retain appropriately qualified personnel (including people with the skills to help us deliver on our net zero commitments) or if significant disputes arise with our employees. As a result, there may be a material adverse effect on our business, financial condition, results of operations and prospects. There is a risk that an employee or someone acting on our behalf may breach our internal controls or internal governance framework, or may contravene applicable laws and regulations. This could have an impact on the results of our operations, our reputation and our relationship with our regulators and other stakeholders. Index to Directors’ Report and other disclosures AGM 258 Articles of Association 257 Audit information 135 – 146 Board of Directors 88 – 89 Business model 4 – 7 Change of control provisions 262 Code of Ethics 262 Conflicts of interest 262 Directors’ indemnity 262 Directors’ service contracts and letters of appointment 127 Directors’ share interests 118 Diversity 65 – 66 Dividends 9, 11, 49 and 287 Events after the reporting period 49, 234 and 258 Financial instruments 187 Future developments 20 – 21 Greenhouse gas emissions 26 Human rights 263 Important events affecting the Company during the year 15 – 21 Internal control 28 – 32 Internal control over financial reporting 253 Listing Rule 9.8.4 R cross-reference table 263 Material interests in shares 259 Colleagues 65 – 66 Political donations and expenditure 264 Research, development and innovation activity 22 – 23 and 264 – 267 Risk management 28 – 32 Share capital 259 256 National Grid plc Annual Report and Accounts 2021/22 Internal control and risk factors continued 30_Internal_control_and_risk_factors_p253_256_v31.indd 256 27/05/2022 17:42

Articles of Association The following description is a summary of the material terms of our Articles of Association (Articles) and applicable English law. It is a summary only and is qualified in its entirety by reference to the Articles. At the 2021 AGM, the Company’s shareholders approved updated Articles which now take account of recent changes to company law and market changes, including in particular the flexibility for the Company to hold general meetings by allowing combined physical and electronic general meetings (also known as ‘hybrid’ meetings). Summary The Articles set out the Company’s internal regulations. Copies are available on our website and upon request. Amendments to the Articles have to be approved by at least 75% of those voting at a general meeting of the Company. Subject to company law and the Articles, the Directors may exercise all the powers of the Company. They may delegate authorities to committees and day-to-day management and decision making to individual Executive Directors. We set out the committee structure on page 91. General The Company is incorporated under the name National Grid plc and is registered in England and Wales with registered number 4031152. Under the Companies Act 2006, the Company’s objects are unrestricted. Directors Under the Articles, a Director must disclose any personal interest in a matter and may not vote in respect of that matter, subject to certain limited exceptions. As permitted under the Companies Act 2006, the Articles allow non-conflicted Directors to authorise a conflict or potential conflict for a particular matter. In doing so, the non-conflicted Directors must act in a way they consider, in good faith, will be most likely to promote the success of the Company for the benefit of the shareholders as a whole. The Directors (other than a Director acting in an executive capacity) are paid fees for their services. In total, these fees must not exceed £2,000,000 per year or any higher sum decided by an ordinary resolution at a general meeting of shareholders. In addition, special pay may be awarded to a Director who acts in an executive capacity, serves on a committee, performs services which the Directors consider to extend beyond the ordinary duties of a Director, devotes special attention to the business of National Grid, or goes or lives abroad on the Company’s behalf. Directors may also receive reimbursement for expenses properly incurred, and may be awarded pensions and other benefits. The compensation awarded to the Executive Directors is determined by the Remuneration Committee. Further details of Directors’ remuneration are set out in the Directors’ Remuneration Report (see pages 108 – 131. The Directors may exercise all the powers of National Grid to borrow money. However, the aggregate principal amount of all the Group’s borrowings outstanding at any time must not exceed £55 billion or any other amount approved by shareholders by an ordinary resolution at a general meeting. Directors can be appointed or removed by the Board or shareholders at a general meeting. Directors must stand for election at the first AGM following their appointment to the Board and the Articles provide, in line with market practice, that they must be recommended by the Board or the Company must have received written confirmation of their willingness to act as Director. Each Director must retire at least every three years, although they will be eligible for re-election. In accordance with best practice introduced by the UK Corporate Governance Code, all Directors wishing to continue in office currently offer themselves for re-election annually. No person is disqualified from being a Director or is required to vacate that office by reason of attaining a maximum age. A Director is not required to hold shares in National Grid plc in order to qualify as a Director. Rights, preferences and restrictions (i) Dividend rights National Grid may not pay any dividend otherwise than out of profits available for distribution under the Companies Act 2006 and other applicable provisions of English law. In addition, as a public company, National Grid may only make a distribution if, at the time of the distribution, the amount of its net assets is not less than the aggregate of its called-up share capital and undistributable reserves (as defined in the Companies Act 2006), and to the extent that the distribution does not reduce the amount of those assets to less than that aggregate. Ordinary shareholders and American Depositary Share (ADS) holders receive dividends. Subject to these points, shareholders may, by ordinary resolution, declare dividends in accordance with the respective rights of the shareholders, but not exceeding the amount recommended by the Board. The Board may pay interim dividends if it considers that National Grid’s financial position justifies the payment. Any dividend or interest unclaimed for 12 years from the date when it was declared or became due for payment will be forfeited and revert to National Grid, and the Articles clarify that the Company may use such unclaimed dividends for the Company’s benefit as the Directors may think fit. (ii) Voting rights Subject to any rights or restrictions attached to any shares and to any other provisions of the Articles, at any general meeting on a show of hands, every shareholder who is present in person will have one vote and, on a poll, every shareholder will have one vote for every share they hold. On a show of hands or poll, shareholders may cast votes either personally or by proxy. A proxy need not be a shareholder. Under the Articles, all substantive resolutions at a general meeting must be decided on a poll and the Articles further provide that voting on resolutions at a general meeting that is held at least in part using an electronic platform must be decided on a poll. Ordinary shareholders and ADS holders can vote at general meetings. (iii) Liquidation rights In a winding up, a liquidator may (in each case with the sanction of a special resolution passed by the shareholders and any other sanction required under English law): (a) divide among the shareholders the whole or any part of National Grid’s assets (whether the assets are of the same kind or not); the liquidator may, for this purpose, value any assets and determine how the division should be carried out as between shareholders or different classes of shareholders, or (b) transfer any part of the assets to Trustees on trust for the benefit of the shareholders as the liquidator determines. In neither case will a shareholder be compelled to accept assets upon which there is a liability. (iv) Restrictions There are no restrictions on the transfer or sale of ordinary shares. Some of the Company’s employee share plans, details of which are contained in the Directors’ Remuneration Report, include restrictions on the transfer of ordinary shares while the ordinary shares are subject to the plan. Where, under an employee share plan operated by the Company, participants are the beneficial owners of the ordinary shares but not the registered owner, the voting rights may be exercised by the registered owner at the direction of the participant. Treasury shares do not attract a vote or dividends. (v) Variation of rights Subject to applicable provisions of English law, the rights attached to any class of shares of National Grid may be varied or cancelled. This must be with the written consent of the holders of three quarters in nominal value of the issued shares of that class, or with the sanction of a special resolution passed at a separate meeting of the holders of the shares of that class. 257 A d d itio nal Info rm atio n National Grid plc Annual Report and Accounts 2021/22 Shareholder information 31_Shareholder_information_p257_261_v34.indd 257 27/05/2022 17:43
dividend cheques, the electronic filing of US federal tax information, mailing required tax forms, stationery, postage, facsimiles and telephone calls. It also reimburses the Company for certain investor relationship programmes or special investor relations promotional activities. There are limits on the amount of expenses for which the Depositary will reimburse the Company, but the amount of reimbursement is not necessarily tied to the amount of fees the Depositary collects from investors. For the period 19 May 2021 to 18 May 2022, the Company received a total of $1,862,578.41 in reimbursements from the Depositary consisting of $323,055.00, $1,017,402.60 and $522,120.81 received in June 2021, October 2021 and January 2022 respectively. Fees that are charged on cash dividends will be apportioned between the Depositary and the Company. Any questions from ADS holders should be directed to the Depositary at the contact details on page 287. Documents on display National Grid is subject to the US Securities and Exchange Commission (SEC) reporting requirements for foreign companies. The Company’s Form 20-F and other filings can be viewed on the National Grid website as well as the SEC website at sec.gov. Events after the reporting period There were no events after the reporting period. Exchange controls There are currently no UK laws, decrees or regulations that restrict the export or import of capital, including, but not limited to, foreign exchange control restrictions, or that affect the remittance of dividends, interest or other payments to non-UK resident holders of ordinary shares except as otherwise set out in Taxation on pages 260 and 261 and except in respect of the governments of and/or certain citizens, residents or bodies of certain countries (described in applicable Bank of England Notices or European Union Council Regulations in force as at the date of this document). Share information National Grid ordinary shares are listed on the London Stock Exchange under the symbol NG. The ADSs are listed on the New York Stock Exchange under the symbol NGG. General meetings AGMs must be convened each year within six months of the Company’s accounting reference date upon 21 clear days’ advance written notice. Under the Articles, any other general meeting may be convened provided at least 14 clear days’ written notice is given, subject to annual approval of shareholders. In certain limited circumstances, the Company can convene a general meeting by shorter notice. The notice must specify, among other things, the nature of the business to be transacted, the place, the date and the time of the meeting. The 2022 AGM will be held as a hybrid meeting. Please ensure you continue to monitor our website at nationalgrid.com/investors for any updates to the arrangements for the AGM. Rights of non-residents There are no restrictions under the Articles that would limit the rights of persons not resident in the UK to vote in relation to ordinary shares. Disclosure of interests Under the Companies Act 2006, National Grid may, by written notice, require a person whom it has reasonable cause to believe to be or to have been, in the last three years, interested in its shares to provide additional information relating to that interest. Under the Articles, failure to provide such information may result in a shareholder losing their rights to attend, vote or exercise any other right in relation to shareholders’ meetings. Under the UK Disclosure Guidance and Transparency Rules (DTR) sourcebook, there is also an obligation on a person who acquires or ceases to have a notifiable interest in shares in National Grid to notify the Company of that fact. The disclosure threshold is 3% and disclosure is required each time the person’s direct and indirect holdings reach, exceed or fall below each 1% threshold thereafter. The UK City Code on Takeovers and Mergers imposes strict disclosure requirements regarding dealings in the securities of an offeror or offeree company, and also on their respective associates, during the course of an offer period. Other regulators in the UK, US and elsewhere may have, or assert, notification or approval rights over acquisitions or transfers of shares. Depositary payments to the Company The Bank of New York Mellon (the ‘Depositary’) reimburses the Company for certain expenses it incurs in relation to the ADS programme. The Depositary also pays the standard out-of-pocket maintenance costs for the ADSs, which consist of the expenses for the mailing of annual and interim financial reports, printing and distributing Description of securities other than equity securities: depositary fees and charges The Depositary collects fees by deducting them from the amounts distributed or by selling a portion of distributable property for: • delivery and surrender of ADSs directly from investors depositing shares or surrendering ADSs for the purpose of withdrawal or from intermediaries acting for them; and • making distributions to investors (including, it is expected, cash dividends). The Depositary may generally refuse to provide fee-attracting services until its fees for those services are paid. The Company’s Deposit agreement under which the ADSs are issued allows a fee of up to $0.05 per ADS to be charged for any cash distribution made to ADS holders, including cash dividends. ADS holders who receive cash in relation to the 2021/22 final dividend will be charged a fee of $0.02 per ADS by the Depositary prior to distribution of the cash dividend. Persons depositing or withdrawing shares must pay: For: $5.00 per 100 ADSs (or portion of 100 ADSs) Issuance of ADSs, including issuances resulting from a distribution of shares or rights or other property; cancellation of ADSs for the purpose of withdrawal, including if the Deposit agreement terminates; and distribution of securities distributed to holders of deposited securities that are distributed by the Depositary to ADS holders. Registration or transfer fees Transfer and registration of shares on our share register to or from the name of the Depositary or its agent when they deposit or withdraw shares. Expenses of the Depositary Cable, telex and facsimile transmissions (when expressly provided in the Deposit agreement); and converting foreign currency to dollars. Taxes and other governmental charges the Depositary or the Custodian has to pay on any ADS or share underlying an ADS, for example stock transfer taxes, stamp duty or withholding taxes As necessary. 258 National Grid plc Annual Report and Accounts 2021/22 Shareholder information continued 31_Shareholder_information_p257_261_v34.indd 258 27/05/2022 17:43

Share capital As at 18 May 2022, the share capital of the Company consists of ordinary shares of 12204/473 pence nominal value each and ADSs, which represent five ordinary shares each. Authority to purchase shares Shareholder approval was given at the 2021 AGM to purchase up to 10% of the Company’s share capital (being 355,533,053 ordinary shares). The Directors intend to seek shareholder approval to renew this authority at the 2022 AGM. In some circumstances, the Company may find it advantageous to have the authority to purchase its own shares in the market, where the Directors believe this would be in the interests of shareholders generally. The Directors believe that it is an important part of the financial management of the Company to have the flexibility to repurchase issued shares to manage its capital base, including actively managing share issuances from the operation of the scrip dividend scheme. It is expected that repurchases to manage share issuances under the scrip dividend scheme will not exceed 2.5% of the issued share capital (excluding treasury shares) per annum. When purchasing shares, the Company has taken, and will continue to take, into account market conditions prevailing at the time, other investment and financing opportunities, and the overall financial position of the Company. At the 2021 AGM, the Company sought authority to purchase ordinary shares in the capital of the Company as part of the management of the dilutive effect of share issuances under the scrip dividend scheme. During the year, the Company did not purchase any of its own shares. Authority to allot shares Shareholder approval was given at the 2021 AGM to allot shares of up to one third of the Company’s share capital. The Directors are seeking this same level of authority this year. The Directors consider that the Company will have sufficient flexibility with this level of authority to respond to market developments and that this authority is in line with investor guidelines. The Directors currently have no intention of issuing new shares or of granting rights to subscribe for or convert any security into shares. This is except in relation to, or in connection with, the operation and management of the Company’s scrip dividend scheme and the exercise of options under the Company’s share plans. No issue of shares will be made that would effectively alter control of the Company without the sanction of shareholders in a general meeting. The Company expects to actively manage the dilutive effect of share issuance arising from the operation of the scrip dividend scheme. In some circumstances, additional shares may be allotted to the market for this purpose under the authority provided by this resolution. Under these circumstances, it is expected that the associated allotment of new shares (or rights to subscribe for or convert any security into shares) will not exceed 1% of the issued share capital (excluding treasury shares) per annum. Dividend waivers The Trustee of the National Grid Employee Share Trust, which is independent of the Company, waived the right to dividends paid during the year. They have also agreed to waive the right to future dividends, in relation to the ordinary shares and ADSs held by the trust. Under the Company’s ADS programme, the right to dividends in relation to the ordinary shares underlying the ADSs was waived during the year, under an arrangement whereby the Company pays the monies to satisfy any dividends separately to the Depositary for distribution to ADS holders entitled to the dividend. This arrangement is expected to continue for future dividends. Material interests in shares As at 31 March 2022, National Grid had been notified of the following holdings in voting rights of 3% or more in the issued share capital of the Company: Number of ordinary shares % of voting rights1 Date of last notification of interest BlackRock, Inc. 255,529,542 7.04 6 December 2021 The Capital Group Companies, Inc. 184,152,007 5.05 26 January 2022 1. This number is calculated in relation to the issued share capital at the time the holding was disclosed. As at 18 May 2022, no further notifications have been received. The rights attached to ordinary shares are detailed on page 257. All ordinary shares and all major shareholders have the same voting rights. The Company is not, to the best of its knowledge, directly or indirectly controlled. Number of shares Total nominal value % of called up share capital Shares held in Treasury purchased in prior years1 265,759,757 £33,037,365.14² 6.97¹ Shares purchased and held in Treasury during the year – – – Shares transferred from Treasury during the year (to employees under employee share plans) 6,628,537 £824,012.632 0.173 Maximum number of shares held in Treasury during the year 265,759,757 £33,037,365.14² 6.813 1. Called-up share capital: 3,814,951,606 ordinary shares as at 31 March 2021. 2. Nominal value: 12204/473 pence per ordinary share. 3. Called-up share capital: 3,904,074,348 ordinary shares as at the date of this report. As at the date of this report, the Company held 257,369,050 ordinary shares as treasury shares. This represented 6.59% of the Company’s called-up share capital. 259 A d d itio nal Info rm atio n National Grid plc Annual Report and Accounts 2021/22 31_Shareholder_information_p257_261_v34.indd 259 27/05/2022 17:43

Taxation This section provides information about certain US federal income tax and UK tax consequences for US Holders (defined below) of owning ADSs and ordinary shares. A US Holder is the beneficial owner of ADSs or ordinary shares who: • is for US federal income tax purposes (i) an individual citizen or resident of the US; (ii) a corporation created or organised under the laws of the US, any state thereof or the District of Columbia; (iii) an estate, the income of which is subject to US federal income tax without regard to its source; or (iv) a trust, if a court within the US is able to exercise primary supervision over the administration of the trust and one or more US persons have the authority to control all substantial decisions of the trust, or the trust has elected to be treated as a domestic trust for US federal income tax purposes; • is not resident in the UK for UK tax purposes; and • does not hold ADSs or ordinary shares in connection with the conduct of a business or the performance of services in the UK or otherwise in connection with a branch, agency or permanent establishment in the UK. This section is not a comprehensive description of all the US federal income tax and UK tax considerations that may be relevant to any particular investor (including consequences under the US alternative minimum tax or net investment income tax). Neither does it address state, local or other tax laws. National Grid has assumed that shareholders, including US Holders, are familiar with the tax rules applicable to investments in securities generally and with any special rules to which they may be subject. This discussion deals only with US Holders who hold ADSs or ordinary shares as capital assets. It does not address the tax treatment of investors who are subject to special rules. Such investors may include: • financial institutions; • insurance companies; • dealers in securities or currencies; • investors who elect mark-to-market treatment; • entities treated as partnerships or other pass-through entities and their partners; • individual retirement accounts and other tax-deferred accounts; • tax-exempt organisations; • investors who own (directly or indirectly) 10% or more of our shares (by vote or value); • investors who hold ADSs or ordinary shares as a position in a straddle, hedging transaction or conversion transaction; • individual investors who have ceased to be resident in the UK for a period of five years or less; • persons that have ceased to be US citizens or lawful permanent residents of the US; and • US Holders whose functional currency is not the US dollar. The statements regarding US and UK tax laws and administrative practices set forth below are based on laws, treaties, judicial decisions and regulatory interpretations that were in effect on the date of this document. These laws and practices are subject to change without notice, potentially with retroactive effect. In addition, the statements set forth below are based on the representations of the Depositary and assume that each party to the Deposit agreement will perform its obligations thereunder in accordance with its terms. US Holders of ADSs generally will be treated as the owners of the ordinary shares represented by those ADSs for US federal income tax purposes. For the purposes of the Tax Convention, the Estate Tax Convention and UK tax considerations, this discussion assumes that a US Holder of ADSs will be treated as the owner of the ordinary shares represented by those ADSs. HMRC has stated that it will continue to apply its long-standing practice of treating a holder of ADSs as holding the beneficial interest in the ordinary shares represented by the ADSs; however, we note that this is an area of some uncertainty and may be subject to change. US Holders should consult their own advisors regarding the tax consequences of buying, owning and disposing of ADSs or ordinary shares depending on their particular circumstances, including the effect of any state, local or other tax laws. Taxation of dividends The UK does not currently impose a withholding tax on dividends paid to US Holders. US Holders should assume that any cash distribution paid by us with respect to ADSs or ordinary shares will be reported as dividend income for US federal income tax purposes. While dividend income received from non-US corporations is generally taxable to a non- corporate US Holder as ordinary income for US federal income tax purposes, dividend income received by a non-corporate US Holder from us generally will be taxable at the same favourable rates applicable to long-term capital gains provided (i) either: (a) we are eligible for the benefits of the Tax Convention or (b) ADSs or ordinary shares are treated as ‘readily tradable’ on an established securities market in the US; and (ii) we are not, for our taxable year during which the dividend is paid or the prior year, a passive foreign investment company for US federal income tax purposes (a PFIC), and certain other requirements are met. We expect that our shares will be treated as ‘readily tradable’ on an established securities market in the US as a result of the trading of ADSs on the New York Stock Exchange. We also believe we are eligible for the benefits of the Tax Convention. Based on our audited financial statements and the nature of our business activities, we believe that we were not treated as a PFIC for US federal income tax purposes with respect to our taxable year ended 31 March 2022. In addition, based on our current expectations regarding the value and nature of our assets, the sources and nature of our income and the nature of our business activities, we do not anticipate becoming a PFIC in the foreseeable future. Dividends received by corporate US Holders with respect to ADSs or ordinary shares will not be eligible for the dividends-received deduction that is generally allowed to corporations. Taxation of capital gains Subject to specific rules relating to assets that derive at least 75% of their value from UK land, US Holders will not be subject to UK taxation on any capital gain realised on the sale or other disposition of ADSs or ordinary shares. Provided that we are not a PFIC for any taxable year during which a US Holder holds their ADSs or ordinary shares, upon a sale or other disposition of ADSs or ordinary shares, a US Holder generally will recognise a capital gain or loss for US federal income tax purposes that is equal to the difference between the US dollar value of the amount realised on the sale or other disposition and the US Holder’s adjusted tax basis in the ADSs or ordinary shares. Such capital gain or loss generally will be long-term Shareholder analysis The following table includes a brief analysis of shareholder numbers and shareholdings as at 31 March 2022: Number of shareholders % of shareholders¹ Number of shares % of shares1 1 – 50 141,757 19.96 4,410,988 0.11 51 – 100 177,985 25.06 12,528,070 0.32 101 – 500 302,501 42.59 63,621,498 1.63 501 – 1,000 43,615 6.14 30,360,976 0.78 1,001 – 10,000 41,714 5.87 101,954,170 2.61 10,001 – 50,000 1,678 0.24 30,965,205 0.79 50,001 – 100,000 236 0.03 17,223,477 0.44 100,001 – 500,000 424 0.06 101,578,492 2.60 500,001 – 1,000,000 132 0.02 94,228,626 2.41 1,000,001+ 294 0.04 3,447,202,846 88.30 Total 710,336 100 3,904,074,348 100 1. Percentages have been rounded to two decimal places. 260 National Grid plc Annual Report and Accounts 2021/22 Shareholder information continued 31_Shareholder_information_p257_261_v34.indd 260 27/05/2022 17:43

capital gain or loss if the ADSs or ordinary shares were held for more than one year. For non- corporate US Holders, long-term capital gain is generally taxed at a lower rate than ordinary income. A US Holder’s ability to deduct capital losses is subject to significant limitations. US information reporting and backup withholding tax Dividend payments made to US Holders and proceeds paid from the sale, exchange, redemption or disposal of ADSs or ordinary shares to US Holders may be subject to information reporting to the US Internal Revenue Service (IRS). Such payments may be subject to backup withholding taxes if the US Holder fails to provide an accurate taxpayer identification number or certification of exempt status or fails to comply with applicable certification requirements. US Holders should consult their tax advisors about these rules and any other reporting obligations that may apply to the ownership or disposition of ADSs or ordinary shares. Such obligations include reporting requirements related to the holding of certain foreign financial assets. UK stamp duty and stamp duty reserve tax (SDRT) Transfers of ordinary shares SDRT at the rate of 0.5% of the amount or value of the consideration will generally be payable on any agreement to transfer ordinary shares that is not completed using a duly stamped instrument of transfer (such as a stock transfer form). The SDRT liability will be cancelled where an instrument of transfer is executed and duly stamped before the expiry of the six-year period beginning with the date on which the agreement is made. If a claim is made within the specified period, any SDRT which has been paid will be refunded. SDRT is due whether or not the agreement or transfer is made or carried out in the UK and whether or not any party to that agreement or transfer is a UK resident. Purchases of ordinary shares completed using a stock transfer form will generally result in a UK stamp duty liability at the rate of 0.5% (rounded up to the nearest £5) of the amount or value of the consideration. Paperless transfers under the CREST paperless settlement system will generally be liable to SDRT at the rate of 0.5%, and not stamp duty. SDRT is generally the liability of the purchaser, and UK stamp duty is usually paid by the purchaser or transferee. Transfers of ADSs No UK stamp duty will be payable on the acquisition or transfer of existing ADSs or beneficial ownership of ADSs (in each case in the form of American Depositary Receipts), provided that any instrument of transfer or written agreement to transfer is executed outside the UK and remains at all times outside the UK. An agreement for the transfer of ADSs in the form of American Depositary Receipts will not result in an SDRT liability. A charge to stamp duty or SDRT may arise on the transfer of ordinary shares to the Depositary or The Bank of New York Mellon as agent of the Depositary (the ‘Custodian’). The rate of stamp duty or SDRT will generally be 1.5% of the value of the consideration or, in some circumstances, the value of the ordinary shares concerned. However, there is no 1.5% SDRT charge on the issue of ordinary shares (or, where it is integral to the raising of new capital, the transfer of ordinary shares) to the Depositary or the Custodian. The Depositary will generally be liable for the stamp duty or SDRT. Under the terms of the Deposit agreement, the Depositary will charge any tax payable by the Depositary or the Custodian (or their nominees) on the deposit of ordinary shares to the party to whom the ADSs are delivered against such deposits. If the stamp duty is not a multiple of £5, the duty will be rounded up to the nearest multiple of £5. UK inheritance tax An individual who is domiciled in the US for the purposes of the Estate Tax Convention and who is not a UK national for the purposes of the Estate Tax Convention will generally not be subject to UK inheritance tax in respect of (i) the ADSs or ordinary shares on the individual’s death or (ii) a gift of the ADSs or ordinary shares during the individual’s lifetime. This is not the case where the ADSs or ordinary shares are part of the business property of the individual’s permanent establishment in the UK or relate to a fixed base in the UK of an individual who performs independent personal services. Special rules apply to ADSs or ordinary shares held in trust. In the exceptional case where the ADSs or shares are subject both to UK inheritance tax and to US federal gift or estate tax, the Estate Tax Convention generally provides for the tax paid in the UK to be credited against tax paid in the US or vice versa. Capital gains tax (CGT) for UK resident shareholders You can find CGT information relating to National Grid shares for UK resident shareholders on the Investors section of our website. Share prices on specific dates are also available on our website. 261 A d d itio nal Info rm atio n National Grid plc Annual Report and Accounts 2021/22 31_Shareholder_information_p257_261_v34.indd 261 27/05/2022 17:43

All-employee share plans The Company has a number of all-employee share plans as described below, which operated during the year. These allow UK- or US-based employees to participate in tax-advantaged plans and to become shareholders in National Grid. Sharesave UK employees are eligible to participate in the Sharesave plan. Under this plan, participants may contribute between £5 and £500 each month, for a fixed period of three years, five years or both. Contributions are taken from net salary. At the end of the fixed period, participants may use their savings to purchase ordinary shares in National Grid at a 20% discounted option price, which is set at the time of each annual Sharesave launch. Share Incentive Plan (SIP) UK employees are eligible to participate in the SIP. Contributions up to £150 per month are deducted from participants’ gross salary and used to purchase National Grid ordinary shares each month. The shares are placed in a UK resident trust and are available to the individual with tax advantages after a five-year period. US Incentive Thrift Plan The Thrift Plan is open to all US employees of participating National Grid companies; this is a tax-advantaged savings plan (commonly referred to as a 401k plan). This is a defined contribution (DC) pension plan that gives participants the opportunity to invest up to applicable federal salary limits. The federal limits for calendar year 2021 were: for pre-tax contributions, a maximum of 50% of salary limited to $19,500 for those under the age of 50 and $26,000 for those aged 50 and above; and for post-tax contributions, up to 15% of salary. The total amount of employee contributions (pre-tax and post-tax) could not exceed 50% of compensation, and was further subject to the combined federal annual contribution limit of $58,000. For the calendar year 2022, participants may invest up to the applicable federal salary limits: for pre-tax contributions, this is a maximum of 50% of salary limited to $20,500 for those under the age of 50 and $27,000 for those aged 50 and above; for post-tax contributions, this is up to 15% of salary. The total amount of employee contributions (pre-tax and post-tax) may not exceed 50% of compensation, and is further subject to the combined federal annual contribution limit of $61,000. US Employee Stock Purchase Plan (ESPP) Employees of National Grid’s participating US companies are eligible to participate in the ESPP (commonly referred to as a 423b plan). Eligible employees have the opportunity to purchase ADSs in National Grid on a monthly basis at a 15% discounted price. Under the plan, employees may contribute up to 20% of base pay each year, up to a maximum annual contribution of $25,000, to purchase ADSs. Change of control provisions No compensation would be paid for loss of office of Directors on a change of control of the Company. As at 31 March 2022, the Company had borrowing facilities of £4.7 billion available to it with a number of banks, which, on a change of control of the Company following a takeover bid, may alter or terminate; however, the Company is currently not drawing on any of such borrowing facilities. All of the Company’s share plans contain provisions relating to a change of control. Outstanding awards and options would normally vest and become exercisable on a change of control, subject to the satisfaction of any performance conditions at that time. In the event of a change of control of the Company, a number of governmental and regulatory consents or approvals are likely to be required, arising from laws or regulations of the UK or the US. Such consents or approvals may also be required for acquisitions of equity securities that do not amount to a change of control. No other agreements that take effect, alter or terminate upon a change of control of the Company following a takeover bid are considered to be significant in terms of their potential impact on the business as a whole. Code of Ethics In accordance with US legal requirements, the Board has adopted a Code of Ethics for senior financial professionals. This Code is available on our website (where any amendments or waivers will also be posted). There were no amendments to, or waivers of, our Code of Ethics during the year. Conflicts of interest In accordance with the Companies Act 2006, the Board has a policy and procedure in place for the disclosure and authorisation (if appropriate) of actual and potential conflicts of interest. The Board continues to monitor and note possible conflicts of interest that each Director may have, including a review on appointment. The Directors are regularly reminded of their continuing obligations in relation to conflicts, and are required to review and confirm their external interests annually. During the year ended 31 March 2022, no new actual or potential conflicts of interest were identified that required approval by the Board. The Board has considered and noted a number of situations in relation to which no actual conflict of interest was identified. Corporate governance practices: differences from New York Stock Exchange (NYSE) listing standards The Company is listed on the NYSE and is therefore required to disclose differences in its corporate governance practices adopted as a UK listed company, compared with those of a US company. The corporate governance practices of the Company are primarily based on the requirements of the Corporate Governance Code 2018 but substantially conform to those required of US companies listed on the NYSE. The following is a summary of the significant ways in which the Company’s corporate governance practices differ from those followed by US companies under Section 303A Corporate Governance Standards of the NYSE. The NYSE rules and the Code apply different tests for the independence of Board members. The NYSE rules require a separate nominating/ corporate governance committee composed entirely of independent directors. There is no requirement for a separate corporate governance committee in the UK. Under the Company’s corporate governance policies, all Directors on the Board discuss and decide upon governance issues, and the People & Governance Committee makes recommendations to the Board with regard to certain responsibilities of a corporate governance committee. The NYSE rules require listed companies to adopt and disclose corporate governance guidelines. While the Company reports compliance with the Code in each Annual Report and Accounts, the UK requirements do not require the Company to adopt and disclose separate corporate governance guidelines. The NYSE rules require a separate audit committee composed of at least three independent members. While the Company’s Audit & Risk Committee exceeds the NYSE’s minimum independent Non-executive Director membership requirements, it should be noted that the quorum for a meeting of the Audit & Risk Committee, of two independent Non- executive Directors, is less than the minimum membership requirements under the NYSE rules. The NYSE rules require a compensation committee composed entirely of independent directors, and prescribe criteria to evaluate the independence of the committee’s members and its ability to engage external compensation advisors. While the Code prescribes different independence criteria, the Non-executive Directors on the Company’s Remuneration Committee have each been deemed independent by the Board under the NYSE rules. Although the evaluation criteria for appointment of external advisors differ under the Code, the Remuneration Committee is solely responsible for the appointment, retention and termination of such advisors. Directors’ indemnity The Company has arranged, in accordance with the Companies Act 2006 and the Articles, qualifying third-party indemnities against financial exposure that Directors may incur in the course of their professional duties. Equivalent qualifying third-party indemnities were, and remain, in force for the benefit of those Directors who stood down from the Board in prior financial years for matters arising when they were Directors of the Company. Alongside these indemnities, the Company places Directors’ and Officers’ liability insurance cover for each Director. To the extent appropriate and required, similar indemnities have also been given to directors of subsidiary and other associated companies, who also benefit from Directors’ and Officers’ liability insurance cover. 262 National Grid plc Annual
Report and Accounts 2021/22 Other disclosures 32_Other_disclosures_p262_267_v53.indd 262 27/05/2022 17:43

Employees We negotiate with recognised unions. It is our policy to maintain well developed communications and consultation programmes and there have been no material disruptions to our operations from labour disputes during the past three years. National Grid believes that it can conduct its relationships with trade unions and employees in a satisfactory manner. Further details on the Company’s colleagues can be found on pages 65 and 66. Human rights We launched our Responsible Business Charter in October 2020 focusing on five key areas. One of the areas is our people and our commitment to ensuring all our people are treated fairly and given the opportunity to thrive at work. As a responsible, purpose-led company, the way in which we conduct ourselves allows us to build trust with the people we work with by doing things in the right way, building our reputation as a responsible and ethical company that our stakeholders want to do business with and our employees want to work for. Our employees are at the heart of what we do, which is why we’re proud to be one of 173 companies and one of 50 FTSE 100 companies who participated in the 2022 Workforce Disclosure Initiative which encourages transparency from companies on how they manage workers with the goal of improving the quality of jobs in company operations and supply chains. This year we improved our Scorecard rating to 86% overall, from 82% last year, and received a special mention in the supply chain data category. National Grid does not have direct operations in countries of high concern with respect to human rights, therefore we do not have a specific policy relating to human rights. However, respect for human rights is incorporated into our employment practices and our values. We treat everyone fairly and equally, without discrimination. Respecting others and valuing DEI are integral to our Code of Ethics and we provide unconscious bias training to all our people to build awareness of cultural differences and the importance of diversity, and the necessity of achieving equity and inclusion. Our Global Supplier Diversity Policy outlines our commitments and expectation that DEI is embedded in all aspects of business in our supply chain. We acknowledge that there may be potential risks in our wider supply chain, and we recognise that the relationship we have with our suppliers can influence how they support our commitment to acting responsibly. We produce an annual Modern Slavery Statement which outlines the actions we take to assess potential risk in our wider operations and take actions to address this. This includes working collaboratively in the sector through a number of membership organisations to build awareness and capability in the supply chain. In the last Business and Human Rights Resource Centre Report assessing FTSE 100 modern slavery statements, we were recognised as one of a small cluster of leaders standing out. We publish our Statement on the Home Office modern slavery registry and encourage our suppliers to publish a statement on modern slavery regardless of whether this is a legal obligation to do so. We are signatories to the UK Construction Protocol, which is a joint agreement with many of the largest firms in the UK construction sector focused on eradicating modern slavery and exploitation in the building industry. We are also founding signatory members of the People Matter Charter which was created to help organisations up and down the supply chain to bring challenges related to decent work together into one workforce strategy. The Charter has eight commitments that can apply to any organisation, of any size including aspects supporting human rights. We are members of the UNGC Modern Slavery Working Group and take part in a peer review of our Modern Slavery Statement to share best practice and identify areas for improvement. We are actively involved in Utilities Against Slavery, which is a collaborative initiative aimed at working together to eradicate slavery and exploitation in the UK utilities sector and its supply chains. Through this we worked with the Supply Chain Sustainability School to deliver a series of six training session over six months to our shared network of suppliers. We aim to maintain fairness across the organisation for pay and make sure our pay practices do not show bias. In the US, we pay all our employees at least the minimum wage or above the minimum wage requirements. In the UK, we are accredited Living Wage Foundation employers. Our commitment to our direct employees extends to our contractors and the work they do on behalf of National Grid and is actively promoted through our supply chain and embedded in our contract terms and conditions and contract management discussions. We believe that everyone should be appropriately rewarded for their time and effort. We also go above the Living Wage Foundation accreditation requirements and voluntarily pay our trainees/ apprentices the real living wage. We undertake a real living wage review and produce a report to the Living Wage Foundation each year to ensure continued alignment. This includes an increase to individual internal salaries as required and annual communication of the new real living wage rates to our supply chain. We include a review of implementation of the real living wage in supply chain contracts where low wages could be a risk, including our catering, cleaning, waste management and main construction contracts. Our Supplier Code of Conduct is updated and communicated to our suppliers annually and clearly sets out our expectations to share our commitment to respecting, protecting and promoting human rights. This includes alignment to the UN Guiding Principles, the 10 Principles of the United Nations Global Compact (UNGC), the International Labour Organization (ILO) minimum standards, the Ethical Trading Initiative (ETI) Base Code, the UK Modern Slavery Act 2015, the US Victims of Trafficking and Violence Protection Act 2000, the US Department of State Principles Combatting Human Trafficking and, for our UK suppliers, the requirements of the Living Wage Foundation. Unresolved SEC staff comments There are no unresolved SEC staff comments required to be reported. Property, plant and equipment This information can be found in Note 13 Property, plant and equipment on pages 180 – 182, Note 21 Borrowings on pages 192 – 194 and Where we operate on page 244. Listing Rule 9.8.4 R cross-reference table Information required to be disclosed by LR 9.8.4 R (starting on page indicated): Interest capitalised Page 167 Publication of unaudited financial information Not applicable Details of long-term incentive schemes Pages 114, 128 and 130 Waiver of emoluments by a director Not applicable Waiver of future emoluments by a director Not applicable Non-pre-emptive issues of equity for cash Not applicable Item (7) in relation to major subsidiary undertakings None Parent participation in a placing by a listed subsidiary Not applicable Contracts of significance Page 264 Provision of services by a controlling shareholder Not applicable Shareholder waivers of dividends Page 259 Shareholder waivers of future dividends Page 259 Agreements with controlling shareholders Not applicable 263 A d d itio nal Info rm atio n National Grid plc Annual Report and Accounts 2021/22 32_Other_disclosures_p262_267_v53.indd 263 27/05/2022 17:43

Political donations and expenditure At this year’s AGM, the Directors will again seek authority from shareholders, on a precautionary basis, for the Company and its subsidiaries to make donations to registered political parties and other political organisations and/or incur political expenditure as such terms are defined in the Companies Act 2006. In each case, donations will be in amounts not exceeding £125,000 in aggregate. The definitions of these terms in the Companies Act 2006 are very wide. As a result, this can cover bodies such as those concerned with policy review, law reform and the representation of the business community (for example trade organisations). It could include special interest groups, such as those involved with the environment, which the Company and its subsidiaries might wish to support, even though these activities are not designed to support or influence support for a particular party. The Companies Act 2006 states that all-party parliamentary groups are not political organisations for these purposes, meaning the authority to be sought from shareholders is not relevant to interactions with such groups. The Company has no intention of changing its current practice of not making political donations or incurring political expenditure within the ordinary meaning of those words. This authority is, therefore, being sought to ensure that none of the Company’s activities inadvertently infringe these rules. National Grid made no political donations and did not incur any political expenditure during the year, as such terms are defined for the purposes of the Companies Act 2006 and the Political Parties, Elections and Referendums Act 2000. National Grid USA’s affiliated New York and federal political action committees (PAC) made political donations in the US totalling $79,375 (£58,796) during the year. National Grid USA’s affiliated New York PAC (NYPAC) was funded partly by contributions from National Grid USA and certain of its subsidiaries and partly by voluntary employee contributions. National Grid USA’s affiliated federal PAC was funded wholly by voluntary employee contributions. The NYPAC did not receive any corporate contribution during the past fiscal year. Material contracts On 17 March 2021, we agreed to buy WPD from PPL, and, conditional upon the completion of the WPD Acquisition and certain regulatory approvals, agreed to sell NECO to PPL. The share purchase agreements for the WPD Acquisition and the NECO sale, together with the sponsor agreement between the Company and Barclays Bank plc (Barclays) dated 31 March 2021 (pursuant to which the Company appointed Barclays as sponsor in connection with the WPD Acquisition and the publication of its shareholder circular for approval of the WPD Acquisition), as well as the acquisition facility dated 17 March 2021 required for the WPD Acquisition, comprising a £8.25 billion term loan facility and a £1.105 billion revolving loan facility term between the Company, Barclays and Goldman Sachs as lenders and lead arrangers, constitute material contracts for the Company. On 27 March 2022, we also announced the sale of a 60% stake in our UK Gas Transmission (which owns and operates the gas transmission network across Great Britain) and UK metering business. We also entered into an option for the potential sale of the remaining 40% stake with the purchasing consortium. The acquisition agreement and the option agreement in connection with this transaction constitute material contracts for the Company. In addition, each of our Executive Directors has a Service Agreement and each Non-executive Director has a Letter of Appointment. Apart from these, no contract (other than contracts entered into in the ordinary course of business) has been entered into by the Group within the two years immediately preceding the date of this report that is, or may be, material; or which contains any provision under which any member of the Group has any obligation or entitlement which is material to the Group at the date of this report. Research, development and innovation activity Investment in research and development during the year for the Group is outlined in Note 4 on page 162. We only disclose directly incurred expenditure, and not those amounts our partners contribute to joint or collaborative projects. Collaborating across the industry has played a crucial role in our ability to develop new programmes and deliver value to our stakeholders throughout 2021/22. UK Electricity Electricity Transmission innovation has increased focus on meeting the UK’s net zero 2050 targets. As a result, our project portfolio has been developed around the themes of delivering cleaner and cheaper energy. As the pace of climate change and its effects increase, we can expect the technology evolution and delivery of the energy transition to accelerate. Responding to this challenge will mean having to think very broadly about the art of the possible and engaging with other sectors; during 2021/22 we have identified five whole-system approach projects. Collaboration is a crucial part of the way we innovate in Electricity Transmission. Sharing and being open to new ideas from across industries and academia allows us to develop projects to transform energy systems and bring the greatest possible benefits to our customers, stakeholders and end consumers. For us, that involves finding the right specialist partners to work with us on the right challenges, while giving stakeholders plenty of time and opportunity to contribute and influence our decision making. We have therefore set up a new framework for a wider range of UK universities to work with us on delivering the energy transition and addressing consumer vulnerabilities. We are partnered with the Energy Innovation Centre (EIC), which provides us with a forum to work together with other networks on common challenges that centre on SF6, vulnerable customers and net zero substations. Together with EIC, SPEN and SEE, we launched Call for Innovation 2021 for suppliers to showcase their ideas for managing the existing SF6 inventory. Responses were received from several suppliers addressing improved leak detection, leak sealing and SF6 capture. Additionally, we have continued engaging with innovative organisations through our membership of the Infrastructure Industry Innovation Partnership (i3P). Its large network of experts and innovators is helping drive transformation within the infrastructure and construction industry to deliver infrastructure for the future. We have been granted the Strategic Innovation Funding for a total of £400,000, to deliver the discovery phase of three projects to support network innovation that contributes to the achievement of net zero, while delivering real net benefits to network consumers. Ofgem approved our business model for our Deeside Centre for Innovation in October 2021 and progress has been made with the construction of the OHL and substation area. Over the past 12 months, our innovation programme at the centre has included trialling three new innovative projects to cut harmful environmental emissions. From reducing SF6 from its pipework, to trialling a cement-free concrete, to capturing waste heat from electricity transformers to generate hot water and space heating for homes and businesses, these projects are another step forward on the journey to meet net zero targets by 2050. We are aiming to open the facility for wider industry use in October 2022. We continue to progress innovative ideas into our business as usual practices particularly as the resilience requirements of electricity networks will need to evolve with a changing energy landscape as society adapts how it uses energy to meet the 2050 net zero decarbonisation target and national infrastructure sectors become increasingly interdependent. The outputs of our projects help to plan for future resilience requirements and effectively ensure the UK has a prepared robust transmission network. WPD WPD’s innovation project portfolio has been expanded to new areas, enabling it to work with industries it has never worked with before. Driven by the Group ambition to meet net zero and recognising that this cannot be delivered if there is no collaboration with other key industries, WPD has focused on increasing collaboration with crucial sectors that need to decarbonise to enable the UK meet its net zero targets. WPD has created and is delivering Network Innovation Allowance (NIA) projects in collaboration with water utilities, environmental management experts and leaders in climate change adaptation. WPD is proud to have started its largest NIA
project focusing on consumer vulnerability, called Vulnerability and Energy Networks, Identification and Consumption Evaluation (VENICE). VENICE is developing ways to predict consumer vulnerability, measuring the impact the pandemic had on the networks and using a community 264 National Grid plc Annual Report and Accounts 2021/22 Other disclosures continued 32_Other_disclosures_p262_267_v53.indd 264 27/05/2022 17:43

energy scheme to find the right approaches needed to engage with the fuel poor in the energy transition. WPD continued leading our work on EVs and Vehicle to Grid (V2G) by delivering the Electric Nation Powered Up project, which is trialling V2G and strengthening our relationship with the transport industry. The work on the electrification of heat is now increasing significantly in scale through our Network Innovation Competition (NIC) project, Equinox. Equinox’s focus is to make heat flexibility accessible to DNOs and beneficial to customers by running the UK’s largest heat flexibility trial. Values of decarbonisation, excellence and value for money continue to shape WPD’s innovation strategy which sets priority areas and commitments. WPD’s projects focus on decarbonisation and net zero, heat, transport, data and communities/consumer vulnerability. Stakeholder engagement through webinars, innovation events and innovation themed weeks has enabled us to ensure WPD’s innovation strategy reflects stakeholders’ needs and priorities. WPD’s strategy has also been developed further to include our RIIO-ED2 strategic aims and plans which were created through extensive engagement with customers and stakeholders as part of the RIIO-ED2 Business Plan consultation process. Electricity System Operator The ESO has used the first year of RIIO-2 to ramp up its innovation activities. The ESO was awarded an initial £23 million NIA funding from Ofgem, now accessible as a flexible amount across the five-year regulatory period (previously an annual allowance in RIIO-1). This has allowed the ESO to increase the size and number of innovation projects in our pipeline, helping to address priority challenges or opportunities across all the ESO roles. For 2021/22, the ESO has spent £4.43 million on innovation projects; the pipeline of approved projects continues to increase significantly as we continue into 2022/23. The Virtual Energy System (VirtualES) will be a cornerstone of ESO innovation going forward; this programme aims to establish an interconnected network of digital twins for individual components of the energy system, eventually creating a digital replica of the whole energy system. This would unlock greater insights and drive better decisions required for GB to achieve net zero targets, more quickly and efficiently. We have started initial projects to develop a common framework for the VirtualES. In parallel, new innovation projects are currently developing the specific tools and use-cases of the VirtualES to highlight the potential and shared benefits from this future industry-led resource. UK Gas In our first year of RIIO-T2, Gas Transmission innovation has developed its portfolio of energy transition projects to meet the UK’s net zero 2050 targets. Alongside this energy transitional innovation, asset innovation has developed a focused team to deploy innovations from RIIO-T1 and drive ‘business as usual’ innovation. The key highlights of 2021/22 include the following: • The portfolio of NIA projects has sanctioned 25 projects with several further projects under development for 2022/23. • Development of 11 collaborative SIF Discovery project applications, with 10 being successfully funded for March – April 2022. • Further development of the Hydrogen in the National Transmission System (HyNTS) programme aligned to future hydrogen investments: HyNTS deblending continued for demonstration later in RIIO-T2 allowing for the separation of hydrogen in a natural gas mix and HyNTS compression exploring the capability of NTS compression systems to both be fuelled and compressed hydrogen methane blends. • Successful kick-off of the £12.7 million HyNTS FutureGrid NIC project at DNV’s Spadeadam Test and Research Centre. Progress includes decommissioned assets delivered to site and remedial works undertaken, groundworks completed ready for construction and standalone hydrogen testing commencing. The project will demonstrate that the National Transmission System (NTS) can transport hydrogen ready for Project Union (the UK hydrogen backbone). • Reduction of methane emissions through the CH4RGE project that looks at reducing methane emissions from rotating gas equipment and has successfully attained first stage funding for demonstration of the systems and capabilities. • Deployment of the valve remediation techniques under the Valve Care Toolbox project to provide a suite of solutions that allow for repair rather than replacement of valves. US research and development Research and development (R&D) work in the US focused on the advancement of products, processes, systems technologies and work methods that may be new to National Grid. This is accomplished by working with internal departments to identify where strategic R&D investment is needed and is likely to prove beneficial. To achieve these goals, we work in collaboration with technical organisations, academia and vendors in the energy sector that align with our goals and objectives to provide a safe, reliable, efficient and clean service. We continue to focus our R&D on increasing public safety, supporting the integration of renewable resource, protecting our workforce and reducing the cost of the work we perform. Research efforts are designed with the focus on shared learnings across jurisdictions to help reduce cost and allow for a faster pace of technology adoption. In 2021/22, we continued to invest and participate in several significant pilot projects with the intention of obtaining operational knowledge and experience of technology-driven system impacts. US Electricity New England – Distribution • In January 2022, we reached a milestone of connecting more than 3 GW of renewable distributed generation across our network – enough to power approximately 600,000 homes. National Grid is ranked as the second utility in the nation for non-residential solar installations and seventh for residential solar installations. • We are implementing grid modernisation technologies such as Fault Location, Isolation and Service Restoration (FLISR) to improve resilience. FLISR helps optimise system performance by reducing customer outage duration. The programme reduces the minutes of interruption experienced by customers by automatically rerouting power in a way that the electric system previously was not capable of. As an example, in the midst of the 2021 nor’easter, the FLISR scheme was active on feeders from West Salem and Saugus in the North Shore District in New England. A tree limb created a mainline fault condition between the West Salem substation circuit breaker and the first downstream pole-top recloser on the line. FLISR logic was activated and quickly restored service to 1,531 customers in 16 seconds. The remaining 2,356 customers experiencing the outage had their service restored in 141 minutes after the repairs to the feeder were completed. Had this FLISR scheme not been implemented, all 3,887 customers would have experienced the full outage. Another example occurred in February 2021, when a storm in East Boxford, Massachusetts knocked out power to approximately 1,000 customers. FLISR enabled the restoration of power to 400 of the customers almost immediately and minimised restoration time for the remaining 600. These events demonstrated the self-healing capabilities provided by the Advanced Data Analytics/FLISR investments. New England – Transmission • National Grid successfully deployed the dynamic line ratings technologies on two transmission lines in New England. This technology allows maximum utilisation of the existing transmission line capacity and supports the Company’s net zero emissions goal. • National Grid successfully deployed the dynamic transformer ratings technologies on two substation transformers. This technology allows maximum utilisation of the existing transformer capacity and supports the Company’s net zero emissions goal. New York – Transmission • In New York, we have a joint development agreement with the New York Power Authority (NYPA) for co-investment in the Smart Path Connect transmission project to enable the delivery of approximately 1 GW of large-scale renewable generation. Expected to be in service by the end of 2025, this project will deliver 1,000 MWs of renewable energy across New York. 265 A d d itio nal Info rm atio n National Grid plc Annual Report and Accounts 2021/22
32_Other_disclosures_p262_267_v53.indd 265 27/05/2022 17:43

New York – Distribution • We are working to procure a battery storage non-wire alternative project known as Old Forge, which is a 20 MW and 40 MWh battery designed to operate as a Microgrid, increasing reliability and resiliency of the local grid for 7,565 customers for two hours during peak load periods. In addition, this battery will be providing wholesale market value during Blue-sky days by bidding into the NYISO wholesale electric market, returning any money earned to customers. • In New York, we are helping grow participation in community distributed generation through a novel customer billing solution we developed and proposed to our regulators. We also recently received approval for Solar for All, a programme to increase solar access for 175,000 of our income-eligible customers. We have proposed a similar programme called MA Community Shared Solar. • In downstate New York, we launched a portfolio of Weatherisation Programmes aimed to reduce natural gas peak demand, save our customers energy and provide them with a more comfortable and resilient home. Every home weatherised is equivalent to carbon sequestered by an entire acre of US forests a year. Calibration across multiple jurisdictions • We are moving from interconnecting to integrating of DERs so we can better utilise them for the system needs. We are implementing Advanced Distribution Management Systems (ADMS) that will support distribution control room operations by providing greater visibility, situation awareness, and optimisation of the distribution system and have created digital products for implementing our DERMS solution so we can streamline DER interconnections and reduce costs for customers. • One of the big initiatives we’re looking to do is implement an AMI installation programme, which is foundational to a lot of other initiatives that rely on that near-real-time customer data. • AMI will provide more granular energy usage data to enable customers to better understand and choose between DER offerings (i.e. distributed generation, storage, EV, demand response and energy-efficiency solutions) to better manage their energy usage and costs. Hydrogen pilots • We are researching how hydrogen will perform in our existing gas infrastructure through our membership with a US Department of Energy funded consortium called Hyblend and through work with the New York State Energy Research Development Authority (NYSERDA) and Stony Brook University. • We are also partnering with Standard Hydrogen Corporation to develop the nation’s first multi-use, renewable hydrogen-based energy storage and delivery system in New York, which is pending regulatory approval. The system will have the ability to power fuel cell vehicles, shift energy peaking, provide backup power and blend hydrogen into the gas network – all from one system and site. • We have partnered with the town of Hempstead on Long Island, NY to use hydrogen to heat 800 homes and fuel a fleet of municipal vehicles, which will be active by 2024. Electric vehicles • National Grid has helped our customers to deploy almost 4,411 EV chargers, with 46% located in environmental or disadvantaged communities. • We partnered with the city of Beverly on an electric school bus project where the bus delivers stored energy back to the grid to help meet peak energy demand. Not only does this approach reduce local emissions and strengthen the grid, but participants receive a financial incentive. This past summer the Beverly bus discharged nearly 3 MWh of electricity stored in its battery system to the regional electric grid over the course of 30 events. • Internally, we have light-duty EVs in our fleet. We also are one of the first utilities to introduce an electric backhoe into our fleet and we are testing Ford’s first E-Transit vans in downstate New York and Massachusetts. Digital strategy We are adopting an agile product methodology and digital approach to implement our business strategy for fast delivery of customer outcomes. We are moving ahead with the following projects: • Active Resource Integration: An integrated platform that will dynamically manage distributed generation power export for short duration constraints to avoid costly electric system upgrades. It will help optimise DER network utilisation through curtailment management, offering flexible interconnection service at an economic cost and timeframe to developers/customers. • Vegetation Management Optimisation (VMO): A risk-based vegetation management planning tool using satellite imagery and artificial intelligence to optimise when we prune vegetation and manage hazardous trees on our system. Efficiencies identified are being reinvested to improve reliability and storms costs. We worked with AiDash, a National Grid Partner, and were the first in our industry to implement at a system level. • Digital product for totex optimisation of Electric workplans. At its core, FutureNow leverages data-driven value models and an optimisation engine to drive equal or better distribution and transmission workplan outcomes at significantly reduced cost. Every project is evaluated along common value drivers (i.e. reliability, capacity, safety and risk) and the overall workplan is resource-balanced in a semi-automated fashion that will save the business hundreds of hours of manual labor annually. FutureNow also drives organisational efficiencies by integrating workplan information from multiple systems into one unified platform, and is envisioned to unlock additional value by applying predictive analytics to improve electric workplan adherence and on-time/on-budget execution. • On My Way: a digital work dispatch and completion tool. An integrated digital solution focused on better supporting field operations, particularly line crews and trouble workers, by putting in place digital work packages and allowing for more efficient job coordination, assignment and execution. The goal is to move from paper-based work dispatch to digitalised work packages and real-time job dispatch/update/close from any location, thereby generating full time equivalent capacity for reallocation and reductions in fuel and paper costs. US Gas New York • While partnering with a robotics company and another utility, we have been developing and testing new technology to locate inadvertent sewer cross-bores created when using some trenchless technology. This technology is deployed in our gas main immediately after installation, prior to the introduction of natural gas. It differs from the current process, which requires us to gain access to the municipal sewer system. Deployment will reduce the risk and cost associated with sewer cross-bores. We constructed a functional sewer system covering five hectares at one of our facilities to test the accuracy of the technology. We purposefully created cross-bores in the system at several points to determine if the technology could locate them. The technology found all the cross-bores with no false negatives. After achieving positive results deploying this technology in a controlled test bed at one of our NY facilities, the next step was to test this process in the field. This technology was tested after new pipe installation via trenchless methods as well as in validation runs where sewer cross-bores were identified in the field through the existing process. In all cases, the technology was able to verify the locations of the cross-bores accurately. In 2021, we performed 13 inspections with the acoustic cross-bore detector and covered over 18,000 feet of main, 10,000 feet of which was newly installed main, via horizontal directional drilling. We also started knowledge sharing sessions with a California utility which is using the same technology on services to identify any potential cross-bores. The goal is to further validate the technology statistically in 2022. • National Grid is working on the development of an integrated safety solution, known as ‘Grid of Things’, comprising various Internet of Things (IoT) connected devices aimed at preventing gas-related incidents at customer locations. The concept of the integrated safety solution comprises a smart metering device, smart methane detector and devices with the ability to cut off gas flow to the customer. The solution will monitor various hazardous 266 National Grid plc Annual Report and Accounts 2021/22 Other disclosures continued 32_Other_disclosures_p262_267_v53.indd 266 27/05/2022 17:43

scenarios such as flooding, fire, gas leaks and abnormal pressure conditions (over-pressure/ under-pressure), among others, and can communicate alarm conditions to the utility, customers or both over wireless protocols. The primary goal of this safety solution is to mitigate hazards that can lead to gas-related safety incidents within a customer location, as well as notify the customers and respond to such events in a quicker manner if they were to occur. Another key focus of this initiative is to determine a solution that will work in gas only territories where AMI solutions are not currently available. We’ve worked with various end device manufacturers to develop prototype solutions that communicate on long-range wide area network (LoRaWAN) communications and have performed a successful pilot demonstration in 2021. Through this pilot, we confirmed that these devices can achieve carrier grade communications while achieving greater than 20-year expected battery lifetimes. The next step is to integrate AMI or cellular communications into these devices and test their performance over different communication networks. • We have partnered with another NY utility and a company in California on the development of an advanced residential methane detector (RMD) which is focused on early detection of gas leaks. This technology is focused on improving the detection of leaks to maximise response time to real hazards. The RMD is in its third prototype phase of development and has shown to be capable of precise and accurate detection of methane at the parts per million level. Several of these prototypes have been deployed at a test facility that is undergoing various methane dispersion tests to mimic typical household leak scenarios. Dispersion testing results showed that the advanced RMD was able to detect gas faster than traditional sensors across a broader range of leak scenarios. • National Grid is actively supporting research into the ability to provide green hydrogen in its gas distribution systems with the intention of decarbonising gas service in order to provide our customers an effective option to meet the goals of NY’s Climate Leadership and Community Protection Act (CLCPA). We are investing in and/or formally collaborating in several targeted R&D projects with various other organisations. The development of hydrogen energy systems is one of the key components of the Low Carbon Resources Initiative (LCRI), which has Technical Support Committees to guide R&D relevant to hydrogen, including renewable fuels, electrolysis and end use. The Company also supports the development of R&D projects in the Operations Technology Development (OTD), Utilization Technology Development and NYSEARCH programmes that primarily support investigations of pipeline integrity with increasing use of hydrogen blending as well as understanding and minimising the impact on end-use equipment. The Company is also a founding member of the Institute for Gas Innovation and Technology (I-GIT) at Stony Brook University that is funded separately and includes R&D into power-to-gas concepts. I-GIT is also leading a two-year NYSERDA project into the impacts of hydrogen blending in NY’s gas distribution systems including non-destructive examination of used piping exposed to hydrogen, for which the Company’s cost-share was approved in Cases 19-G-0309 and 19-G-0310. I-GIT is also the academic lead for the national $14 million HyBlend Collaborative Research and Development Agreement (CRADA). This HyBlend programme is sponsored by the US Department of Energy’s Hydrogen and Fuel Cell Technologies Office in the Office of Energy Efficiency and Renewable Energy and 22 industry and academic participants, which will identify and evaluate the technical and safety requirements for introducing hydrogen blending into US gas distribution systems. The HyBlend CRADA is being led by the National Renewable Energy Laboratory (NREL) and implemented by six other national laboratories. The project kicked off in August 2021 and will take about two years. The Company is pursuing the above R&D efforts to drive innovations that will improve safety, reliability and operational efficiency of our gas business operations. 267 A d d itio nal Info rm atio n National Grid plc Annual Report and Accounts 2021/22 32_Other_disclosures_p262_267_v53.indd 267 27/05/2022 17:43

Alternative performance measures/non-IFRS reconciliations Within the Annual Report, a number of financial measures are presented. These measures have been categorised as alternative performance measures (APMs), as per the European Securities and Markets Authority (ESMA) guidelines and the Securities and Exchange Commission (SEC) conditions for use of non-GAAP financial measures. An APM is a financial measure of historical or future financial performance, financial position, or cash flows, other than a financial measure defined under IFRS. The Group uses a range of these measures to provide a better understanding of its underlying performance. APMs are reconciled to the most directly comparable IFRS financial measure where practicable. The Group has defined the following financial measures as APMs derived from IFRS: net revenue, the various adjusted operating profit, earnings and earnings per share metrics detailed in the ‘adjusted profit measures’ section below, net debt, capital investment, funds from operations (FFO), FFO interest cover and retained cash flow (RCF)/adjusted net debt. For each of these we present a reconciliation to the most directly comparable IFRS measure. We present ‘constant currency’ comparative period performance and capital investment by applying the current year average exchange rate to the relevant US dollar amounts in the comparative periods presented, to remove the year-on-year impact of foreign exchange translation. We also have a number of APMs derived from regulatory measures which have no basis under IFRS; we call these Regulatory Performance Measures (RPMs). They comprise: Group RoE, operating company RoE, regulated asset base, regulated financial performance, regulatory gearing, Asset Growth, Value Added, including Value Added per share and Value Growth. These measures include the inputs used by utility regulators to set the allowed revenues for many of our businesses. We use RPMs to monitor progress against our regulatory agreements and certain aspects of our strategic objectives. Further, targets for certain of these performance measures are included in the Company’s Annual Performance Plan (APP) and Long-Term Performance Plan (LTPP) and contribute to how we reward our employees. As such, we believe that they provide close correlation to the economic value we generate for our shareholders and are therefore important supplemental measures for our shareholders to understand the performance of the business and to ensure a complete understanding of Group performance. As the starting point for our RPMs is not IFRS, and these measures are not governed by IFRS, we are unable to provide meaningful reconciliations to any directly comparable IFRS measures, as differences between IFRS and the regulatory recognition rules applied have built up over many years. Instead, for each of these we present an explanation of how the measure has been determined and why it is important, and an overview as to why it would not be meaningful to provide a reconciliation to IFRS. Alternative performance measures Net revenue Net revenue is revenue less pass-through costs, such as UK system balancing costs, gas and electricity commodity costs in the US. Pass-through costs are fully recoverable from our customers and are recovered through separate charges that are designed to recover those costs with no profit. Where revenue received or receivable exceeds the maximum amount permitted by our regulatory agreement, adjustments will be made to future prices to reflect this over-recovery. No liability is recognised, as such an adjustment to future prices relates to the provision of future services. Similarly, no asset is recognised where a regulatory agreement permits adjustments to be made to future prices in respect of an under-recovery. 2022 2021 2020 Gross revenue1 £m Pass- through costs £m Net revenue £m Gross revenue £m Pass- through costs £m Net revenue £m Gross revenue £m Pass- through costs £m Net revenue £m UK Electricity Transmission 2,035 (152) 1,883 1,974 (151) 1,823 1,986 (177) 1,809 UK Electricity Distribution 1,482 (125) 1,357 — — — — — — UK Electricity System Operator 3,455 (3,215) 240 2,018 (1,911) 107 1,716 (1,351) 365 New England 4,550 (2,050) 2,500 4,214 (1,784) 2,430 4,235 (1,997) 2,238 New York 5,561 (2,161) 3,400 4,605 (1,469) 3,136 4,601 (1,463) 3,138 NGV and Other 1,216 — 1,216 864 — 864 834 — 834 Sales between segments (39) — (39) (10) — (10) (12) — (12) Total – continuing operations 18,260 (7,703) 10,557 13,665 (5,315) 8,350 13,360 (4,988) 8,372 Discontinued operations 1,362 (397) 965 1,114 (233) 881 1,180 (242) 938 Total 19,622 (8,100) 11,522 14,779 (5,548) 9,231 14,540 (5,230) 9,310 1. Excluding exceptional income. Adjusted profit measures In considering the financial performance of our business and segments, we use various adjusted profit measures in order to aid comparability of results year-on-year. The various measures are presented on pages 37 – 49 and reconciled below. Adjusted results – these exclude the impact of exceptional items and remeasurements that are treated as discrete transactions under IFRS and can accordingly be classified as such. This is a measure used by management that is used to derive part of the incentive target set annually for remunerating certain Executive Directors, and further details of these items are included in note 5 to the financial statements. Underlying results – further adapts our adjusted results for continuing operations to take account of volumetric and other revenue timing differences arising due to the in-year difference between allowed and collected revenues, including revenue incentives, as governed by our rate plans in the US or regulatory price controls in the UK (but excluding totex-related allowances and adjustments or allowances for pension deficit contributions). For 2021/22, as highlighted on page 269, our underlying results exclude £16 million (2020/21: £111 million) of timing differences as well as £163 million (2020/21: £150 million) of major storm costs (as costs exceeded our $100 million threshold in both 2021/22 and 2020/21). We expect to recover major storm costs incurred through regulatory mechanisms in the US. Constant currency – the adjusted profit measures are also shown on a constant currency basis to show the year-on-year comparisons excluding any impact of foreign currency translation movements. Other unaudited financial information 268 National Grid plc Annual Report and Accounts 2021/22

Reconciliation of statutory, adjusted and underlying profits and earnings – at actual exchange rates – continuing operations Year ended 31 March 2022 Statutory £m Exceptionals and remeasurements £m Adjusted £m Timing £m Major storm costs £m Underlying £m UK Electricity Transmission 1,055 12 1,067 85 — 1,152 UK Electricity Distribution 909 — 909 (22) — 887 UK Electricity System Operator 5 2 7 47 — 54 New England 764 (21) 743 32 111 886 New York 1,095 (315) 780 (126) 52 706 NGV and Other 543 (236) 307 — — 307 Total operating profit 4,371 (558) 3,813 16 163 3,992 Net finance costs (1,022) (59) (1,081) — — (1,081) Share of post-tax results of joint ventures and associates 92 56 148 — — 148 Profit before tax 3,441 (561) 2,880 16 163 3,059 Tax (1,258) 589 (669) 3 (42) (708) Profit after tax 2,183 28 2,211 19 121 2,351 Year ended 31 March 2021 Statutory £m Exceptionals and remeasurements £m Adjusted £m Timing £m Major storm costs £m Underlying £m UK Electricity Transmission 1,080 14 1,094 (42) — 1,052 UK Electricity Distribution — — — — — — UK Electricity System Operator (53) (7) (60) 130 — 70 New England 614 (3) 611 11 105 727 New York 695 (30) 665 12 45 722 NGV and Other 65 52 117 — — 117 Total operating profit 2,401 26 2,427 111 150 2,688 Net finance costs (795) (70) (865) — — (865) Share of post-tax results of joint ventures and associates 58 8 66 — — 66 Profit before tax 1,664 (36) 1,628 111 150 1,889 Tax (360) 26 (334) (23) (39) (396) Profit after tax 1,304 (10) 1,294 88 111 1,493 Year ended 31 March 2020 Statutory £m Exceptionals and remeasurements £m Adjusted £m Timing £m Major storm costs £m Underlying £m UK Electricity Transmission 1,104 5 1,109 (85) — 1,024 UK Electricity Distribution — — — — — — UK Electricity System Operator 212 (1) 211 (61) — 150 New England 470 53 523 157 — 680 New York 370 465 835 82 — 917 NGV and Other 123 3 126 — — 126 Total operating profit 2,279 525 2,804 93 — 2,897 Net finance costs (966) 37 (929) — — (929) Share of post-tax results of joint ventures and associates 87 1 88 — — 88 Profit before tax 1,400 563 1,963 93 — 2,056 Tax (370) 8 (362) (35) — (397) Profit after tax 1,030 571 1,601 58 — 1,659 Reconciliation of adjusted and underlying profits from continuing operations – at constant currency At constant currency Adjusted at actual exchange rate £m Constant currency adjustment £m Adjusted £m Timing £m Major storm costs £m Underlying £mYear ended 31 March 2021 UK Electricity Transmission 1,094 — 1,094 (42) — 1,052 UK Electricity Distribution — — — — — — UK Electricity System Operator (60) — (60) 130 — 70 New England 611 (3) 608 11 104 723 New York 665 (4) 661 12 45 718 NGV and Other 117 — 117 — — 117 Total operating profit 2,427 (7) 2,420 111 149 2,680 Net finance costs (865) 4 (861) — — (861) Share of post-tax results of joint ventures and associates 66 — 66 — — 66 Profit before tax 1,628 (3) 1,625 111 149 1,885 National Grid plc Annual Report and Accounts 2021/22 269

Reconciliation of adjusted and underlying profits from continuing operations – at constant currency continued At constant currency Adjusted at actual exchange rate £m Constant currency adjustment £m Adjusted £m Timing £m Major storm costs £m Underlying £mYear ended 31 March 2020 UK Electricity Transmission 1,109 — 1,109 (85) — 1,024 UK Electricity Distribution — — — — — — UK Electricity System Operator 211 — 211 (61) — 150 New England 523 (24) 499 149 — 648 New York 835 (38) 797 79 — 876 NGV and Other 126 — 126 — — 126 Total operating profit 2,804 (62) 2,742 82 — 2,824 Net finance costs (929) 27 (902) — — (902) Share of post-tax results of joint ventures and associates 88 (1) 87 — — 87 Profit before tax 1,963 (36) 1,927 82 — 2,009 Earnings per share calculations from continuing operations – at actual exchange rates The table below reconciles the profit after tax from continuing operations as per the previous tables back to the earnings per share from continuing operations for each of the adjusted profit measures. Earnings per share is only presented for those adjusted profit measures that are at actual exchange rates, and not for those at constant currency. Profit after tax £m Non- controlling interest £m Profit after tax attributable to shareholders £m Weighted average number of shares millions Earnings per share penceYear ended 31 March 2022 Statutory 2,183 (1) 2,182 3,599 60.6 Adjusted 2,211 (1) 2,210 3,599 61.4 Underlying 2,351 (1) 2,350 3,599 65.3 Profit after tax £m Non- controlling interest £m Profit after tax attributable to shareholders £m Weighted average number of shares millions Earnings per share penceYear ended 31 March 2021 Statutory 1,304 (1) 1,303 3,523 37.0 Adjusted 1,294 (1) 1,293 3,523 36.7 Underlying 1,493 (1) 1,492 3,523 42.4 Profit after tax £m Non- controlling interest £m Profit after tax attributable to shareholders £m Weighted average number of shares millions Earnings per share penceYear ended 31 March 2020 Statutory 1,030 (1) 1,029 3,461 29.7 Adjusted 1,601 (1) 1,600 3,461 46.2 Underlying 1,659 (1) 1,658 3,461 47.9 Reconciliation of adjusted EPS to statutory earnings (including and excluding the impact of timing and major storm costs) Year ended 31 March Including timing and major storm costs Excluding timing and major storm costs 2022 2021 2020 2022 2021 2020 pence pence pence pence pence pence Adjusted EPS from continuing operations 61.4 36.7 46.2 65.3 42.4 47.9 Exceptional items and remeasurements after tax from continuing operations (0.8) 0.3 (16.5) (0.8) 0.3 (16.5) EPS from continuing operations 60.6 37.0 29.7 64.5 42.7 31.4 Adjusted EPS from discontinued operations 9.6 9.7 9.2 11.4 11.8 10.4 Exceptional items and remeasurements after tax from discontinued operations (4.8) (0.1) (2.4) (4.8) (0.1) (2.4) EPS from discontinued operations 4.8 9.6 6.8 6.6 11.7 8.0 Total adjusted EPS from continuing and discontinued operations 71.0 46.4 55.4 76.7 54.2 58.3 Total exceptional items and remeasurements after tax from continuing and discontinued operations (5.6) 0.2 (18.9) (5.6) 0.2 (18.9) Total Group EPS from continuing and discontinued operations 65.4 46.6 36.5 71.1 54.4 39.4 Other unaudited financial information continued 270 National Grid plc Annual Report and Accounts 2021/22

Reconciliation of total Group statutory operating profit to ‘adjusted earnings excluding timing and major storm costs’ Year ended 31 March Including timing and major storm costs Excluding timing and major storm costs 2022 2021 2020 2022 2021 2020 £m £m £m £m £m £m Continuing operations Adjusted operating profit 3,813 2,427 2,804 3,992 2,688 2,897 Adjusted net finance costs (1,081) (865) (929) (1,081) (865) (929) Share of post-tax results of joint ventures and associates 148 66 88 148 66 88 Adjusted profit before tax 2,880 1,628 1,963 3,059 1,889 2,056 Adjusted tax (669) (334) (362) (708) (396) (397) Adjusted profit after tax 2,211 1,294 1,601 2,351 1,493 1,659 Attributable to non-controlling interests (1) (1) (1) (1) (1) (1) Adjusted earnings from continuing operations 2,210 1,293 1,600 2,350 1,492 1,658 Exceptional items after tax (320) (52) (445) (320) (52) (445) Remeasurements after tax 292 62 (126) 292 62 (126) Earnings from continuing operations 2,182 1,303 1,029 2,322 1,502 1,087 Discontinued operations Adjusted operating profit 654 499 503 734 595 557 Adjusted net finance costs (218) (77) (114) (218) (77) (114) Share of post-tax results of joint ventures and associates — — — — — — Adjusted profit before tax 436 422 389 516 518 443 Adjusted tax (92) (82) (72) (107) (100) (82) Adjusted profit after tax 344 340 317 409 418 361 Attributable to non-controlling interests — — — — — — Adjusted earnings from discontinued operations 344 340 317 409 418 361 Exceptional items after tax (163) (5) (60) (163) (5) (60) Remeasurements after tax (10) 2 (22) (10) 2 (22) Earnings from discontinued operations 171 337 235 236 415 279 Total Group (continuing and discontinued operations) Adjusted operating profit 4,467 2,926 3,307 4,726 3,283 3,454 Adjusted net finance costs (1,299) (942) (1,043) (1,299) (942) (1,043) Share of post-tax results of joint ventures and associates 148 66 88 148 66 88 Adjusted profit before tax 3,316 2,050 2,352 3,575 2,407 2,499 Adjusted tax (761) (416) (434) (815) (496) (479) Adjusted profit after tax 2,555 1,634 1,918 2,760 1,911 2,020 Attributable to non-controlling interests (1) (1) (1) (1) (1) (1) Adjusted earnings from continuing and discontinued operations 2,554 1,633 1,917 2,759 1,910 2,019 Exceptional items after tax (483) (57) (505) (483) (57) (505) Remeasurements after tax 282 64 (148) 282 64 (148) Total Group earnings from continuing and discontinued operations 2,353 1,640 1,264 2,558 1,917 1,366 Timing and regulated revenue adjustments As described on pages 245 – 252, our allowed revenues are set in accordance with our regulatory price controls or rate plans. We calculate the tariffs we charge our customers based on the estimated volume of energy we expect will be delivered during the coming period. The actual volumes delivered will differ from the estimate. Therefore, our total actual revenue will be different from our total allowed revenue. These differences are commonly referred to as timing differences. If we collect more than the allowed revenue, adjustments will be made to future prices to reflect this over-recovery, and if we collect less than the allowed level of revenue, adjustments will be made to future prices to reflect the under-recovery. In the US, a substantial portion of our costs are pass-through costs (including commodity and energy-efficiency costs) and are fully recoverable from our customers. Timing differences between costs of this type being incurred and their recovery through revenue are also included in timing. The amounts calculated as timing differences are estimates and subject to change until the variables that determine allowed revenue are final. Our continuing operating profit for the year includes a total estimated in-year under-collection of £16 million (2020/21: £111 million under-collection). For continuing operations, our closing balance at 31 March 2022 was £53 million over-recovered. Excluding discontinued operations, there was a cumulative under-recovery of £190 million at 31 March 2022 (2021: under-recovery of £70 million) in the UK. In the US, cumulative timing over-recoveries at 31 March 2022 were £293 million (2021: £198 million over-recovery). The total estimated in-year over- or under-collection excludes opening balance adjustments related to estimates or finalisation of balances as part of regulatory submissions. In addition to the timing adjustments described above, as part of the RIIO price controls in the UK, outperformance against allowances as a result of the totex incentive mechanism, together with changes in output-related allowances included in the original price control, will almost always be adjusted in future revenue recoveries, typically starting in two years’ time. We also receive revenues in relation to certain costs incurred or expected to be incurred (for example pension deficit contributions), with differences between revenues received and cost incurred adjusted in future revenue recoveries, e.g. after a triennial actuarial pension funding valuation has been concluded. Our current IFRS revenues and earnings include these amounts that relate to certain costs incurred in prior years or that will need to be repaid or recovered in future periods. Such adjustments will form an important part of the continuing difference between reported IFRS results and underlying economic performance based on our regulatory obligations. National Grid plc Annual Report and Accounts 2021/22 271

Timing and regulated revenue adjustments continued For our UK regulated businesses as a whole (including discontinued operations), timing and regulated revenue adjustments totalled a return of £190 million in the year (2020/21: £184 million return). In the US, accumulated regulatory entitlements cover a range of different areas, with the most significant being environmental remediation and pension assets, as well as deferred storm costs. All regulatory entitlements are recoverable (or repayable) over different periods, which are agreed with the regulators to match the expected payment profile for the liabilities. UK Electricity Transmission £m UK Electricity Distribution £m UK Electricity System Operator £m New England £m New York £m Continuing £m Discontinued £m Total £m 1 April 2021 opening balance¹ — — (80) (266) 465 119 (76) 43 Over/(under)-recovery (85) 22 (47) (32) 126 (16) (80) (96) 31 March 2022 closing balance to (recover)/return² (85) 22 (127) (298) 591 103 (156) (53) UK Electricity Transmission £m UK Electricity Distribution £m UK Electricity System Operator £m New England £m New York £m Continuing £m Discontinued £m Total £m 1 April 2020 opening balance¹ (52) — 70 (254) 479 243 16 259 Over/(under)-recovery 42 — (130) (11) (12) (111) (96) (207) 31 March 2021 closing balance to (recover)/return2,3 (10) — (60) (265) 467 132 (80) 52 UK Electricity Transmission £m UK Electricity Distribution £m UK Electricity System Operator £m New England £m New York £m Continuing £m Discontinued £m Total £m 1 April 2019 opening balance¹ (141) — 14 (108) 558 323 59 382 Over/(under)-recovery 85 — 61 (149) (79) (82) (54) (136) 31 March 2020 closing balance to (recover)/return2,3 (56) — 75 (257) 479 241 5 246 1. Opening balances have been restated to reflect the finalisation of calculated over/(under)-recoveries in the UK and the US. 2. The closing balance (including discontinued operations) at 31 March 2022 was £45 million under-recovered (translated at the closing rate of $1.31:£1). 31 March 2021 was £48 million over-recovered (translated at the closing rate of $1.38:£1). 31 March 2020 was £264 million over-recovered (translated at the closing rate of $1.24:£1). 3. New England and New York in-year over/(under)-recovery and all New England and New York balances have been translated using the average exchange rate of $1.35 for the year ended 31 March 2022. Capital investment ‘Capital investment’ or ‘investment’ refer to additions to property, plant and equipment and intangible assets, and contributions to joint ventures and associates, other than the St William Homes LLP joint venture during the period. We also include the Group’s investments by National Grid Partners during the period, which are classified for IFRS purposes as non-current financial assets in the Group’s consolidated statement of financial position. Investments made to our St William Homes LLP arrangement are excluded based on the nature of this joint venture arrangement. We typically contributed property assets to the joint venture in exchange for cash and accordingly did not consider these transactions to be in the nature of capital investment. Year ended 31 March At actual exchange rates At constant currency 2022 2021 % change 2022 2021 % change£m £m £m £m UK Electricity Transmission 1,195 984 21 1,195 984 21 UK Electricity Distribution 899 — n/a 899 — n/a UK Electricity System Operator 108 88 23 108 88 23 New England 1,561 1,437 9 1,561 1,429 9 New York 1,960 1,738 13 1,960 1,729 13 NGV and Other 462 480 (4) 462 480 (4) Group capital expenditure – continuing 6,185 4,727 31 6,185 4,710 31 Equity investment, funding contributions and loans to joint ventures and associates¹ 461 81 469 461 81 469 Investments in financial assets (National Grid Partners) 93 35 166 93 35 166 Group capital investment – continuing 6,739 4,843 39 6,739 4,826 40 Discontinued operations 261 204 28 261 204 28 Group capital expenditure – total 7,000 5,047 39 7,000 5,030 39 1. Excludes £25 million (2021: £nil) equity contribution to the St William Homes LLP joint venture. Net debt See note 29 on page 208 for the definition and reconciliation of net debt. Other unaudited financial information continued 272 National Grid plc Annual Report and Accounts 2021/22

Cash flow statement used in credit metric calculation below The table below re-analyses our IFRS operating cash flows for the purposes of facilitating calculation of certain measures of credit worthiness – being RCF/adjusted net debt and FFO/adjusted net debt as described further below. The differences between this table and the consolidated cash flow statement relate to the disaggregation of cash flows relating to items considered ‘exceptional’ as described in note 5, as explained within the footnotes below: 2021 2020 2019 Notes £m £m £m Cash flows from operating activities Total operating profit from continuing operations 2(b) 4,371 2,401 2,279 Adjustments for: Exceptional items and remeasurements 5 (558) 26 525 Other fair value movements (65) (22) — Depreciation, amortisation and impairment 1,830 1,485 1,435 Share-based payments 38 23 16 Changes in working capital 361 279 217 Changes in provisions 140 (167) (138) Changes in pensions and other post-retirement benefit obligations (76) (16) (58) Cash flows relating to exceptional items (253) (42) (36) Cash generated from operations – continuing operations 5,788 3,967 4,240 Tax paid (298) (91) (92) Net cash inflow from operating activities – continuing operations 5,490 3,876 4,148 Net cash inflow from operating activities – discontinued operations 782 585 470 Funds from operations and interest cover FFO is the cash flows generated by the operations of the Group. Credit rating metrics, including FFO, are used as indicators of balance sheet strength. 2022 2021¹ 2020¹ Year ended 31 March £m £m £m Interest expense (income statement) 1,146 977 1,119 Hybrid interest reclassified as dividend (38) (38) (39) Capitalised interest 152 131 122 Pensions interest adjustment 11 (16) 16 Unwinding of discount on provisions (73) (78) (77) Interest charge (discontinued operations) 218 — — Adjusted interest expense 1,416 976 1,141 Net cash inflow from operating activities 5,490 4,461 4,715 Interest received on financial instruments 40 16 73 Interest paid on financial instruments (1,053) (835) (957) Dividends received 166 80 75 Working capital adjustment (361) (312) (269) Excess employer pension contributions 99 116 176 Hybrid interest reclassified as dividend 38 38 39 Add back accretions 241 — — Difference in net interest expense in income statement to cash flow (177) (138) (187) Difference in current tax in income statement to cash flow 72 (67) 67 Current tax related to prior periods (35) 8 (45) Cash flow from discontinued operations 668 — (97) Other fair value adjustments — 22 — Funds from operations (FFO) 5,188 3,389 3,590 FFO interest cover ((FFO + adjusted interest expense)/adjusted interest expense) 4.7x 4.5x 4.1x 1. Numbers for 2021 and 2020 reflect the calculations for the total Group as based on the published accounts for the respective years. National Grid plc Annual Report and Accounts 2021/22 273
Retained cash flow/adjusted net debt RCF/adjusted net debt is one of two credit metrics that we monitor in order to ensure the Group is generating sufficient cash to service its debts, consistent with maintaining a strong investment-grade credit rating. We calculated RCF/adjusted net debt applying the methodology used by Moody’s, as this is one of the most constrained calculations of credit worthiness. The net debt denominator includes adjustments to take account of the equity component of hybrid debt. 2022 20211 2020 Year ended 31 March £m £m £m Funds from operations (FFO) 5,188 3,389 3,590 Hybrid interest reclassified as dividend (38) (38) (39) Ordinary dividends paid to shareholders (922) (1,413) (892) RCF 4,228 1,938 2,659 Borrowings2 45,465 32,339 30,794 Less: 50% hybrid debt (1,027) (1,032) (1,054) Cash and cash equivalents (190) (157) (73) Financial and other investments (2,292) (1,768) (1,278) Underfunded pension obligations 326 467 1,442 Borrowings in held for sale 5,234 — — Derivative balances removed from debt3 — — (116) Currency swaps3 — — 203 Nuclear decommissioning liabilities reclassified as debt3 — — 6 Collateral – cash received under collateral agreements — (582) (785) Accrued interest removed from short-term debt3 — — (246) Adjusted net debt (includes pension deficit) 47,516 29,267 28,893 RCF/adjusted net debt 8.9 % 6.6 % 9.2 % 1. Numbers for 2021 reflect the calculations for the total Group as based on the published accounts for that year. 2. Including borrowings in NECO and UK Gas Transmission classified as held for sale. 3. Below agency threshold, prior year not restated. Regulatory Performance Measures Regulated financial performance – UK Regulatory financial performance is a pre-interest and tax measure, starting at segmental operating profit and making adjustments (such as the elimination of all pass-through items included in revenue allowances and timing) to approximate regulatory profit for the UK regulated activities. This measure provides a bridge for investors between a well-understood and comparable IFRS starting point and through the key adjustments required to approximate regulatory profit. This measure also provides the foundation to calculate Group RoE. For the reasons noted above, the table below shows the principal differences between the IFRS operating profit and the regulated financial performance, but is not a formal reconciliation to an equivalent IFRS measure. UK Electricity Transmission 2022 2021 2020 Year ended 31 March £m £m £m Adjusted operating profit 1,067 1,094 1,109 Movement in regulatory ‘IOUs’ 82 59 21 Deferred taxation adjustment 26 53 60 RAV indexation – 2% CPIH (2020 & 2021: 3% RPI) long-run inflation 287 418 401 Regulatory vs IFRS depreciation difference (433) (434) (448) Fast money/other (44) 57 70 Pensions (42) (41) (40) Performance RAV created 75 110 122 Regulated financial performance 1,018 1,316 1,295 Other unaudited financial information continued 274 National Grid plc Annual Report and Accounts 2021/22

UK Electricity Distribution 2022 2021 2020 9.5 months ended 31 March £m £m £m Adjusted operating profit 909 n/a n/a Movement in regulatory ‘IOUs’ (42) n/a n/a Deferred taxation adjustment 28 n/a n/a RAV indexation – 3% RPI long-run inflation 198 n/a n/a Regulatory vs IFRS depreciation difference (358) n/a n/a Fast money/other (34) n/a n/a Pensions (111) n/a n/a Performance RAV created 9 n/a n/a Regulated financial performance 599 n/a n/a UK Electricity System Operator 2022 2021 2020 Year ended 31 March £m £m £m Adjusted operating profit 7 (60) 211 Movement in regulatory ‘IOUs’ 31 129 (120) Deferred taxation adjustment (4) 7 3 RAV indexation – 2% CPIH (2020 & 2021: 3% RPI) long-run inflation 5 6 5 Regulatory vs IFRS depreciation difference 27 (5) (11) Fast money/other (24) (29) (44) Pensions (10) (13) (12) Performance RAV created — 1 (3) Regulated financial performance 32 36 29 UK Gas Transmission 2022 2021 2020 Year ended 31 March £m £m £m Adjusted operating profit 654 499 503 Less non-regulated profits (150) (157) (155) Movement in regulatory ‘IOUs’ 72 34 67 Deferred taxation adjustment 13 12 25 RAV indexation – 2% CPIH (2020 & 2021: 3% RPI) long-run inflation 126 189 185 Regulatory vs IFRS depreciation difference (281) (88) (77) Fast money/other (4) 25 (17) Pensions — (34) (34) Performance RAV created 3 (23) (24) Regulated financial performance 433 457 473 Regulated financial performance – US New England 2022 2021 2020 Year ended 31 March £m £m £m Adjusted operating profit 743 611 523 Provision for bad and doubtful debts (COVID-19), net of recoveries1 — (7) 63 Major storm costs 111 105 — Timing 32 11 157 Depreciation adjustment2 (67) — — US GAAP pension adjustment 11 2 (2) Regulated financial performance 830 722 741 1. New England financial performance includes an adjustment reflecting our expectation for future recovery of COVID-19-related provision for bad and doubtful debts. 2. The depreciation adjustment relates to the impact of the cessation of depreciation for NECO under IFRS following reclassification as held for sale. New York 2022 2021 2020 Year ended 31 March £m £m £m Adjusted operating profit 780 665 835 Provision for bad and doubtful debts (COVID-19), net of recoveries¹ — 127 54 Major storm costs 52 45 — Timing (126) 12 82 US GAAP pension adjustment 66 1 (2) Regulated financial performance 772 850 969 1. New York financial performance includes an adjustment reflecting our expectation for future recovery of COVID-19-related provision for bad and doubtful debts. National Grid plc Annual Report and Accounts 2021/22 275

Total regulated financial performance 2022 2021 2020 Year ended 31 March £m £m £m UK Electricity Transmission 1,018 1,316 1,295 UK Electricity Distribution 599 n/a n/a UK Electricity System Operator 32 36 29 UK Gas Transmission 433 457 473 New England 830 722 741 New York 772 850 969 Total regulated financial performance 3,684 3,381 3,507 New England and New York timing, major storms costs and movement in UK regulatory ‘IOUs’ – Revenue related to performance in one year may be recovered in later years. Where revenue received or receivable exceeds the maximum amount permitted by our regulatory agreement, adjustments will be made to future prices to reflect this over-recovery. No liability is recognised under IFRS, as such an adjustment to future prices relates to the provision of future services. Similarly, no asset is recognised under IFRS where a regulatory agreement permits adjustments to be made to future prices in respect of an under-recovery. In the UK, this is calculated as the movement in other regulated assets and liabilities. Performance RAV – UK performance efficiencies are in part remunerated by the creation of additional RAV which is expected to result in future earnings under regulatory arrangements. This is calculated as in-year totex outperformance multiplied by the appropriate regulatory capitalisation ratio and multiplied by the retained company incentive sharing ratio. Pension adjustment – Cash payments against pension deficits in the UK are recoverable under regulatory contracts. In US Regulated operations, US GAAP pension charges are generally recoverable through rates. Revenue recoveries are recognised under IFRS but payments are not charged against IFRS operating profits in the year. In the UK, this is calculated as cash payments against the regulatory proportion of pension deficits in the UK regulated business, whereas in the US, it is the difference between IFRS and US GAAP pension charges. 2% CPIH and 3% RPI RAV indexation – Future UK revenues are expected to be set using an asset base adjusted for inflation. This is calculated as UK RAV multiplied by 2% long-run CPIH inflation assumption under RIIO-2 and a 3% long-run RPI inflation assumption under RIIO-1. UK deferred taxation adjustment – Future UK revenues are expected to recover cash taxation cost including the unwinding of deferred taxation balances created in the current year. This is the difference between: (a) IFRS underlying EBITDA less other regulatory adjustments; and (b) IFRS underlying EBITDA less other regulatory adjustments less current taxation (adjusted for interest tax shield) then grossed up at full UK statutory tax rate. Regulatory depreciation – US and UK regulated revenues include allowance for a return of regulatory capital in accordance with regulatory assumed asset lives. This return does not form part of regulatory profit. Fast/slow money adjustment – The regulatory remuneration of costs incurred is split between in-year revenue allowances and the creation of additional RAV. This does not align with the classification of costs as operating costs and fixed asset additions under IFRS accounting principles. This is calculated as the difference between IFRS classification of costs as operating costs or fixed asset additions and the regulatory classification. Regulated asset base The regulated asset base is a regulatory construct, based on predetermined principles not based on IFRS. It effectively represents the invested capital on which we are authorised to earn a cash return. By investing efficiently in our networks, we add to our regulated asset base over the long term, and this in turn contributes to delivering shareholder value. Our regulated asset base comprises of our regulatory asset value in the UK, plus our rate base in the US. Maintaining efficient investment in our regulated asset base ensures we are well positioned to provide consistently high levels of service to our customers and increases our revenue allowances in future years. While we have no specific target, our overall aim is to achieve between 6% and 8% growth in regulated asset base each year through continued investment in our networks in both the UK and US. In the UK, the way in which our transactions impact RAV is driven by principles set out by Ofgem. In a number of key areas these principles differ from the requirements of IFRS, including areas such as additions and the basis for depreciation. Further, our UK RAV is adjusted annually for inflation. RAV in each of our retained UK businesses has evolved over the period since privatisation in 1990, and as a result, historical differences between the initial determination of RAV and balances reported under UK GAAP at that time still persist. In the case of WPD, differences arise as the result of acquisition fair value adjustments (where PP&E at acquisition has been valued above RAV). Due to the above, substantial differences exist in the measurement bases between RAV and an IFRS balance metric, and therefore, it is not possible to provide a meaningful reconciliation between the two. In the US, rate base is a regulatory measure determined for each of our main US operating companies. It represents the value of property and other assets or liabilities on which we are permitted to earn a rate of return, as set out by the regulatory authorities for each jurisdiction. The calculations are based on the applicable regulatory agreements for each jurisdiction and include the allowable elements of assets and liabilities from our US companies. For this reason, it is not practical to provide a meaningful reconciliation from the US rate base to an equivalent IFRS measure. However, we include the calculation below. ‘Total regulated and other balances’ for our UK regulated businesses include the under or over-recovery of allowances that those businesses target to collect in any year, which are based on the regulator’s forecasts for that year. Under the UK price control arrangements, revenues will be adjusted in future years to take account of actual levels of collected revenue, costs and outputs delivered when they differ from those regulatory forecasts. In the US, other regulatory assets and liabilities include regulatory assets and liabilities which are not included in the definition of rate base, including working capital where appropriate. ‘Total regulated and other balances’ for NGV and Other businesses includes assets and liabilities as measured under IFRS, but excludes certain assets and liabilities such as pensions, tax, net debt and goodwill. This also includes a £101 million deferred balance for separation and transaction costs already incurred related to the sale of NECO and UK Gas Transmission, which is expected to be offset against the proceeds received on disposal of these businesses in 2022/23. Other unaudited financial information continued 276 National Grid plc Annual Report and Accounts 2021/22

Year ended 31 March (£m at constant currency) RAV, rate base or other business assets Total regulated and other balances 2022 2021¹ 20222,3 20211,2,3 £m £m £m £m UK Electricity Transmission 15,486 14,328 15,274 14,050 UK Electricity Distribution 9,250 — 9,307 — UK Electricity System Operator 296 240 439 351 UK Gas Transmission (excluding metering) 6,561 6,308 6,657 6,335 New England 9,255 8,673 11,052 10,154 New York 12,923 12,014 13,747 12,528 Total regulated 53,771 41,563 56,476 43,418 NGV and Other businesses (including discontinued metering business) 5,226 4,920 4,348 4,584 Total Group regulated and other balances 58,997 46,483 60,824 48,002 1. Figures relating to prior periods have, where appropriate, been re-presented at constant currency, for segmental reorganisation, opening balance adjustments following the completion of the UK regulatory reporting pack process and finalisation of US balances. 2. Includes totex-related regulatory IOUs of £271 million (2021: £293 million), over-recovered timing balances of £346 million (2021: £153 million under-recovered) and under- recovered legacy balances related to previous price controls of £9 million (2021: £nil). 3. Includes assets for construction work-in-progress of £2,139 million (2021: £1,671 million), other regulatory assets related to timing and other cost deferrals of £759 million (2021: £714 million) and net working capital liabilities of £277 million (2021: £390 million). New England and New York rate base and other total regulated and other balances for 31 March 2021 have been re-presented in the table above at constant currency. At actual currency the values were £9.7 billion and £11.9 billion respectively. Group RoE Group RoE provides investors with a view of the performance of the Group as a whole compared with the amounts invested by the Group in assets attributable to equity shareholders. It is the ratio of our regulatory financial performance to our measure of equity investment in assets. It therefore reflects the regulated activities as well as the contribution from our non-regulated businesses together with joint ventures and non-controlling interests. We use Group RoE to measure our performance in generating value for our shareholders, and targets for Group RoE are included in the incentive mechanisms for executive remuneration within both the APP and LTPP schemes. Group RoE is underpinned by our regulated asset base. For the reasons noted above, no reconciliation to IFRS has been presented, as we do not believe it would be practical. However, we do include the calculations below. Calculation: Regulatory financial performance including a long-run inflation assumption (3% RPI for RIIO-1; 2% CPIH for RIIO-2), less adjusted interest and adjusted taxation divided by equity investment in assets: • adjusted interest removes interest on pensions, capitalised interest in regulated operations and unwind of discount rate on provisions; • adjusted taxation adjusts the Group taxation charge for differences between IFRS profit before tax and regulated financial performance less adjusted interest; and • equity investment in assets is calculated as the total opening UK regulatory asset value, the total opening US rate base plus goodwill plus opening net book value of National Grid Ventures and Other activities (excluding certain amounts such as pensions, tax and commodities) and our share of joint ventures and associates, minus opening net debt as reported under IFRS restated to the weighted average £/$ exchange rate for the year. Year ended 31 March 2022 2021 2020 £m £m £m Regulated financial performance 3,684 3,381 3,507 Operating profit of other activities – continuing operations 330 144 153 Operating profit of other activities – discontinued operations 150 157 155 Group financial performance 4,164 3,682 3,815 Share of post-tax results of joint ventures and associates 148 66 88 Non-controlling interests (1) (1) (1) Adjusted total Group interest charge (including discontinued) (1,191) (882) (1,069) Total Group tax charge (including discontinued) (761) (416) (433) Tax on adjustments 43 (175) (117) Total Group financial performance after interest and tax 2,402 2,274 2,283 Opening rate base/RAV 41,043 39,552 37,459 Opening other balances 4,864 3,984 3,304 Opening goodwill 5,266 5,295 5,435 Opening capital employed 51,173 48,831 46,198 Opening net debt (30,072) (27,398) (27,194) Opening equity 21,101 21,433 19,004 Return on Equity1 11.4 % 10.6 % 12.0 % 1. Group RoE methodology amended in 2021/22 to calculate accretion charge on inflation-linked debt at long-run inflation rates. This provides alignment to treatment of RAV indexation in the metric. Prior year comparatives have not been restated. National Grid plc Annual Report and Accounts 2021/22 277

UK and US regulated RoE Year ended 31 March Regulatory Debt: Equity assumption Achieved Return on Equity Base or Allowed Return on Equity 2022 2021 2022 2021 % % % % UK Electricity Transmission 55/45 (2021: 60/40) 7.7 13.8 6.3 10.2 UK Electricity Distribution 65/35 13.6 — 9.6 — UK Gas Transmission 60/40 (2021: 62.5/37.5) 7.8 9.6 6.6 10.0 New England Avg. 46/54 8.3 7.5 9.8 9.8 New York Avg. 52/48 8.8 6.7 8.9 9.0 UK businesses’ regulated RoEs UK regulated businesses’ RoEs are a measure of how the businesses are performing against the assumptions used by our UK regulator. These returns are calculated using the assumption that the businesses are financed in line with the regulatory adjudicated capital structure, at the cost of debt assumed by the regulator, and that inflation is equal to a long-run assumption of 3% RPI under RIIO-1 and 2% CPIH under RIIO-2. They are calculated by dividing elements of out/under-performance versus the regulatory contract (i.e. regulated financial performance disclosed above) by the average equity RAV in line with the regulatory assumed capital structure and adding to the base allowed RoE. These are important measures of UK regulated businesses’ performance, and our operational strategy continues to focus on these metrics. These measures can be used to determine how we are performing under the RIIO framework and also helps investors to compare our performance with similarly regulated UK entities. Reflecting the importance of these metrics, they are also key components of the APP scheme. The respective businesses’ UK RoEs are underpinned by their RAVs. For the reasons noted above, no reconciliation to IFRS has been presented, as we do not believe it would be practical. US businesses’ regulated RoEs US regulated businesses’ RoEs are a measure of how the businesses are performing against the assumptions used by the US regulators. This US operational return measure is calculated using the assumption that the businesses are financed in line with the regulatory adjudicated capital structure and allowed cost of debt. The returns are divided by the average rate base (or where a reported rate base is not available, an estimate based on rate base calculations used in previous rate filings) multiplied by the adjudicated equity portion in the regulatory adjudicated capital structure. These are important measures of our New England and New York regulated businesses’ performance, and our operational strategy continues to focus on these metrics. This measure can be used to determine how we are performing and also helps investors compare our performance with similarly regulated US entities. Reflecting the importance of these metrics, they are also key components of the APP scheme. The New England and New York businesses’ returns are based on a calculation which gives proportionately more weighting to those businesses which have a greater rate base. For the reasons noted above, no reconciliations to IFRS for the RoE measures have been presented, as we do not believe it would be practical to reconcile our IFRS balance sheet to the equity base. The table below shows the principal differences between the IFRS result of the New England and New York segments, and the ‘returns’ used to derive their respective US jurisdictional RoEs. In outlining these differences, we also include the aggregated business results under US GAAP for New England and New York jurisdictions. In respect of 2020/21 and 2019/20, this measure is the aggregate operating profit of our US OpCo entities’ publicly available financial statements prepared under US GAAP for the New England and New York jurisdictions respectively. For 2021/22, this measure represents our current estimate, since local financial statements have yet to be prepared. 2022 2021 2020 £m £m £m Underlying IFRS operating profit for New England segment 886 727 680 Underlying IFRS operating profit for New York segment 706 722 917 Weighted average £/$ exchange rate $1.348 $1.341 $1.287 Other unaudited financial information continued 278 National Grid plc Annual Report and Accounts 2021/22

New England New York 2022 2021 2020 2022 2021 2020 $m $m $m $m $m $m Underlying IFRS operating profit for US segments 1,194 974 874 951 969 1,181 Adjustments to convert to US GAAP as applied in our US OpCo entities Adjustment in respect of customer contributions (35) (28) (24) (30) (31) (25) Pension accounting differences¹ 14 8 43 88 (2) (51) Environmental charges recorded under US GAAP 3 (14) 2 42 (94) (95) Storm costs and recoveries recorded under US GAAP (75) (86) (43) (8) (27) 34 Other regulatory deferrals, amortisation and other items (253) 58 (5) 46 43 1 Results for US regulated OpCo entities, aggregated under US GAAP² 848 912 847 1,089 858 1,045 Adjustments to determine regulatory operating profit used in US RoE Levelisation revenue adjustment — — — — — (122) Adjustment for COVID-19-related provision for bad and doubtful debts³ — (44) 84 — 171 66 Net other 71 (14) (13) 85 (16) 74 Regulatory operating profit 919 854 918 1,174 1,013 1,063 Pensions¹ 7 (31) (4) 107 (13) 21 Regulatory interest charge (227) (221) (200) (316) (314) (285) Regulatory tax charge (179) (155) (183) (263) (185) (216) Regulatory earnings used to determine US RoE 520 447 531 702 501 583 1. Following a change in US GAAP accounting rules, an element of the pensions charge is reported outside operating profit with effect from 2019. 2. Based on US GAAP accounting policies as applied by our US regulated OpCo entities. 3. US RoE includes an adjustment reflecting our expectation for future recovery of COVID-19-related bad and doubtful debt costs. New England New York 2022 2021 2020 2022 2021 2020 $m $m $m $m $m $m US equity base (average for the year) 6,253 5,960 5,422 7,946 7,452 6,721 US jurisdiction RoE 8.3 % 7.5 % 9.8 % 8.8 % 6.7 % 8.7 % Value Added and Value Added per share and Value Growth Value Added is a measure that reflects the value to shareholders of our cash dividend and the growth in National Grid’s regulated and non-regulated assets (as measured in our regulated asset base, for regulated entities), and corresponding growth in net debt. It is a key metric used to measure our performance and underpins our approach to sustainable decision making and long-term management incentive arrangements. Value Added is derived using our regulated asset base and, as such, it is not practical to provide a meaningful reconciliation from this measure to an equivalent IFRS measure due to the reasons set out for our regulated asset base. However, the calculation is set out in the Financial review. Value Added per share is calculated by dividing Value Added by the weighted average number of shares (3,599 million) set out in note 8. Value Growth of 12.8% (2021: 9.4%) is derived from Value Added by adjusting Value Added to normalise for our estimate of the long-run inflation rate (3% RPI for RIIO-1 and our RPI-linked net debt; 2% CPIH for RIIO-2). In 2021, the numerator for Value Growth was £2,730 million (2021: £1,995 million). The denominator is Group equity as used in the Group RoE calculation, adjusted for foreign exchange movements. Asset growth Asset growth is the annual percentage increase in our RAV and rate base and other business balances (including the assets of NGV and NGP) calculated at constant currency. Regulatory gearing Regulatory gearing is a measure of how much of our investment in RAV and rate base and other elements of our invested capital (including our investments in NGV, UK property and other assets and US other assets) is funded through debt. Comparative amounts as at 31 March 2021 are presented at historical exchange rates and have not been restated for opening balance adjustments. 2022 2021 As at 31 March £m £m UK RAV 31,593 20,872 US rate base 22,178 20,041 Other invested capital included in gearing calculation 5,226 4,458 Total assets included in gearing calculation 58,997 45,371 Net debt (including 100% of hybrid debt and held for sale) (48,043) (29,665) change Group gearing (based on 100% of net debt including held for sale) 81 % 65 % 16% pts Group gearing (excluding 50% of hybrid debt from net debt) including held for sale 80 % 63 % 17% pts National Grid plc Annual Report and Accounts 2021/22 279

In compliance with SEC rules, we present a summarised analysis of movements in the income statement and an analysis of movements in adjusted operating profit (for the continuing Group) by operating segment. This should be read in conjunction with the 31 March 2022 Financial review included on pages 36 – 49. Analysis of the income statement for the year ended 31 March 2021 Revenue Revenue from continuing operations for the year ended 31 March 2021 increased by £305 million to £13,665 million. Revenues were driven by a £302 million increase in UK Electricity System Operator (mainly as a result of higher balancing service pass-through costs, offset by year-on-year timing under-recoveries). Rate increases in both New England and New York were more than offset by lower revenues for commodity pass-through costs. Revenue from NGV and Other increased by £34 million, related to our US renewables business and Partners gains, partly offset by lower Property sales. Operating costs Operating costs from continuing activities for the year ended 31 March 2021 of £10,939 million were £92 million higher than prior year. This increase in costs was offset by a £499 million reduction in exceptional items and remeasurements income compared to 2019/20, principally related to the US environmental provision booked in 2019/20 and year- on-year movements in commodity contract remeasurements. In addition, higher operating costs were driven by higher UK BSIS pass-through costs, higher workforce costs and higher depreciation as a result of continued asset investment. This was partially offset by the impact of lower costs in respect of purchases of gas and electricity and the impact of movement in foreign exchange. In addition to the operating costs of £10,939 million above, provisions for bad and doubtful debts of £325 million were recorded, £91 million higher than the year ended 31 March 2020, principally as a result of the continued impact of COVID-19 on the Group’s operations. Net finance costs For the year ended 31 March 2021, net finance costs from continuing operations before exceptional items and remeasurements were £64 million lower than the year ended 31 March 2020 at £865 million driven by the impact of lower inflation on our RPI-linked debt, new debt issued at lower rates, a higher net debt as a result of asset growth, termination fees incurred in the prior year and favourable foreign exchange movements, partly offset by higher interest on pension and OPEB liabilities and a higher benefit from interest on tax settlements in 2019/20. Tax The tax charge on profits before exceptional items and remeasurements of £334 million was £28 million lower than the year ended 31 March 2020. This was mainly related to a lower level of profit before tax in the year ended 31 March 2021 compared to the year ended 31 March 2020. Exceptional items and remeasurements In the year ended 31 March 2021, exceptional items included a £50 million charge in relation to our new operating model implementation costs alongside a £24 million charge in relation to transaction and separation costs (principally in relation to the acquisition of WPD). A £14 million credit was also recognised relating to the release of environmental provisions for one of our Superfund sites for the which the original provision was treated as an exceptional item. In the prior year, exceptional items included a £400 million charge associated with changes in our environmental provisions and an additional deferred tax charge of £148 million reflecting the impact of the remeasurement of the Group’s deferred tax liabilities as a result of a change in the substantively enacted UK corporation tax rate. Remeasurement gains of £34 million were recognised on commodity contracts in the year ended 31 March 2021 compared with losses of £125 million in the year ended 31 March 2020. Finance costs for the year ended 31 March 2021 included a net gain of £70 million on financial remeasurements of derivative financial instruments and financial assets at fair value through profit or loss, compared to a net loss of £37 million on financial remeasurements in the year ended 31 March 2020. Share of post-tax results of joint ventures and associates before exceptional items for the year ended 31 March 2021 were £66 million compared to £88 million in the year ended 31 March 2020, principally due to reduced profits in St William, our Property joint venture. Profit after tax from discontinued operations Profit after tax from discontinued operations increased by £102 million to £337 million. This included exceptional costs and remeasurements of £3 million in 2020/21 compared to £82 million in 2019/20. Excluding exceptional items and remeasurements, adjusted operating profit was broadly flat compared to the year ended 31 March 2020. There was an overall reduction of £37 million in the net financing costs attributable to discontinued operations mostly driven by the impact of RPI on our inflation-linked debt. Tax for discontinued operations was £82 million in the year ended 31 March 2021, a £10 million higher tax charge than the prior year driven by higher levels of profit. Adjusted earnings and EPS from continuing operations Adjusted earnings and EPS, which exclude exceptional items and remeasurements, are provided to reflect the Group’s results on an ‘adjusted profit’ basis, described further in note 5. See page 270 for a reconciliation of adjusted basic EPS to EPS. The above earnings performance translated into adjusted EPS in the year ended 31 March 2021 of 36.7p, compared to 46.2p in the year ended 31 March 2020. Including discontinued operations, adjusted EPS in the year ended 31 March 2021 of 46.4p, compared to 55.4p in the year ended 31 March 2020. Exchange rates Our financial results are reported in sterling. Transactions for our US operations are denominated in dollars, so the related amounts that are reported in sterling depend on the dollar to sterling exchange rate. The table below shows the average and closing exchange rates of sterling to US dollars. 2020/21 2019/20 % change Weighted average (income statement) 1.34 1.29 4 % Year end (statement of financial position) 1.38 1.24 11 % The movement in foreign exchange during the year ended 31 March 2021 has resulted in a £374 million decrease in revenue, a £55 million decrease in adjusted operating profit and a £65 million decrease in underlying operating profit. Commentary on consolidated financial statements for the year ended 31 March 2021 280 National Grid plc Annual Report and Accounts 2021/22

Analysis of the adjusted operating profit by segment for the year ended 31 March 2021 UK Electricity Transmission For the year ended 31 March 2021, revenue in the UK Electricity Transmission segment decreased by £12 million to £1,974 million, and adjusted operating profit increased by £15 million to £1,094 million. Revenue was lower principally as the result of lower pass-through costs and lower incentives. Excluding pass-through costs, net revenue was £14 million higher, as a result of income from legal settlements, the result of RAV indexation from inflation, offset by adverse MOD adjustments, lower base revenues and lower timing over-recoveries (incentives and lower collection of prior period under-recoveries). Regulated controllable costs were £16 million lower, reflecting inflation and higher IT costs, but these were more than offset by efficiency savings. Depreciation and amortisation was £29 million higher due to prior year impairment, a full year of Western Link and provision releases in the year ended 31 March 2021. Other costs were £21 million higher, principally the result of credits related to diversions arising in the prior year. Capital expenditure increased by £33 million compared with the year ended 31 March 2020 to £984 million reflecting increased activity on Hinkley Seabank, London Power Tunnels 2 and higher capex on the Dorset Visual Impact Provision project in the year ended 31 March 2021. UK Electricity System Operator For the year ended 31 March 2021, revenue in the UK Electricity System Operator segment increased by £302 million to £2,018 million but this was principally as the result of higher pass-through costs, which increased from £1,351 million in 2019/20 to £1,911 million in 2020/21 (principally reflecting higher balancing service costs due to reduced demand as a result of COVID-19 and higher intervention costs required to balance the grid). Excluding pass-through costs, net revenue was £271 million lower, as the result of £130 million timing under-recoveries in 2020/21 compared to £60 million over-recoveries in 2019/20 (mainly lower volumes and the impact of the BSUoS deferral scheme). Regulated controllable costs were broadly flat, with inflation and higher IT costs being offset by efficiency savings. Depreciation and amortisation was £9 million higher due to higher asset commissioning. Capital expenditure decreased by £4 million compared with the year ended 31 March 2020. New England Revenue in the New England segment decreased by £21 million to £4,214 million and adjusted operating profit increased by £88 million to £611 million. The weaker US dollar decreased revenue and operating profit in the year ended 31 March 2021. Excluding the impact of foreign exchange rate movements, revenue increased by £137 million. Of this increase, £134 million was due to decrease in commodity pass-through costs charged on to customers, and £139 million was due to year-on-year timing movements as a result of under-collection of revenues compared to our regulatory allowances in the year ended 31 March 2020. Excluding pass-through costs and timing swings, net revenue increased by £410 million at constant currency, principally reflecting increased revenue allowances under rate plans. Regulated controllable costs increased by £76 million (excluding the impact of foreign exchange) as a result of increased IT costs and inflation partly offset by efficiency savings. Capital expenditure increased by £127 million (excluding the impact of foreign exchange movements) to £1,437 million, mainly related to increased investment in wholesale networks (including line and cable relocation in NECO, higher LNG spend and also asset refurbishment in New England Power. New York Revenue in our New York segment increased by £4 million to £4,605 million, but adjusted operating profit decreased by £170 million to £665 million. The weaker US dollar decreased revenue and operating profit in the year ended 31 March 2021. Excluding the impact of foreign exchange rate movements, revenue increased by £176 million. Of this increase, £64 million was due to increases in commodity pass-through costs charged on to customers, and £67 million was due to year-on-year timing movements as a result of under-collection of revenues compared to our regulatory allowances in the year ended 31 March 2020. Excluding pass- through costs and timing swings, net revenue increased by £179 million at constant currency, principally reflecting increased revenue allowances under rate plans. Excluding the impact of foreign exchange movements, regulated controllable costs increased by £24 million as a result of increased IT costs and inflation offset by cost efficiencies. Bad debt expense increased by £132 million at constant currency, driven by additional provisions for receivables related to the impact of COVID-19. Depreciation and amortisation increased by £34 million year-on-year (excluding foreign exchange adjustments) to £453 million due to ongoing investment in our networks. Capital expenditure decreased by £16 million (excluding the impact of foreign exchange) to £1,738 million, mainly the consequence of reduced investment in downstate New York (gas pipeline and mandated gas works) which were impacted by disruptions due to COVID-19, mostly offset by damage repair (driven by storm activity in Niagara Mohawk) and accelerated spend in REV (New York’s ‘Reforming the Energy Vision’ programme) and Grid Modernisation, higher IT spend and lease additions. NGV and Other For the year ended 31 March 2021, revenue in the NGV and Other segment increased by £30 million to £864 million and adjusted operating profit decreased by £9 million to £117 million. This reflected higher revenues in our US renewables business, partly offset by lower site sales in our commercial property business and reduced income from support services supplied to Cadent compared to the prior year. Capital investment was significantly lower at £480 million in 2020/21, representing a decrease of £82 million year-on-year. This was principally due to the £209 million acquisition of Geronimo in 2019/20, lower investment in IFA2 which became operational in 2020/21, reduced cable converter spend on North Sea Link, but increased investment in Viking Link and higher investments in NG Partners. Discontinued operations – UK Gas Transmission (and metering) For the year ended 31 March 2021, revenue in the UK Gas Transmission segment decreased by £66 million to £1,114 million and adjusted operating profit decreased by £4 million to £499 million. Revenue was impacted by lower pass-through costs, adverse year-on-year timing under-recoveries. Net revenue (adjusted for timing) was higher, reflecting the impact of prior year return of Fleetwood allowances and the RPI uplift, partly offset by re-opener allowances in 2019/20 for cyber and data centres and reduced meter population (as these are replaced by smart meters). Regulated controllable costs were £5 million lower principally driven by efficiency savings. Depreciation and amortisation was lower mainly due to reduction in meter population. Capital expenditure reduced by £84 million to £204 million, mainly related to the completion of the Feeder 9 gas pipeline replacement project and Peterborough and Huntingdon compressor stations. National Grid plc Annual Report and Accounts 2021/22 281

Financial summary (unaudited) The financial summary set out below has been derived from the audited consolidated financial statements of National Grid for the five financial years ended 31 March 2022. It should be read in conjunction with the consolidated financial statements and related notes, together with the Strategic Report. The information presented below is adjusted for the matters described in the footnotes below for the years ended 31 March 2022, 2021, 2020, 2019 and 2018 where relevant and has been prepared under IFRS as issued by the IASB and as adopted by the UK. Summary income statement (£m) 2022 2021¹ 2020¹ 2019¹ 2018¹ Continuing operations Revenue 18,449 13,665 13,360 13,730 13,836 Operating profit Before exceptional items, remeasurements 3,813 2,427 2,804 2,963 2,809 Exceptional items, remeasurements 558 (26) (525) (536) 19 Profit before tax Before exceptional items, remeasurements 2,880 1,628 1,963 2,156 2,058 Exceptional items, remeasurements 561 36 (563) (595) 119 Profit after tax from continuing operations Before exceptional items, remeasurements 2,211 1,294 1,601 1,736 1,562 Exceptional items, remeasurements (28) 10 (571) (456) 1,600 Profit/(loss) after tax from discontinued operations Before exceptional items, remeasurements 344 340 317 322 499 Exceptional items, remeasurements (173) (3) (82) (88) (110) Gain on disposal of UK Gas Distribution after tax — — — — — Total profit for the year 2,354 1,641 1,265 1,514 3,551 Profit for the year attributable to equity shareholders Before exceptional items, remeasurements 2,554 1,633 1,917 2,055 2,060 Exceptional items, remeasurements (201) 7 (653) (544) 1,490 Gain on disposal of UK Gas Distribution after tax — — — — — Total 2,353 1,640 1,264 1,511 3,550 Earnings per share Basic – continuing operations (pence) 60.6 37.0 29.7 44.3 102.5 Diluted – continuing operations (pence) 60.3 36.8 29.6 44.1 102.1 Basic – total (pence) 65.4 46.6 36.5 44.6 102.6 Diluted – total (pence) 65.0 46.3 36.3 44.4 102.1 Weighted average number of shares – basic (millions) 3,599 3,523 3,461 3,386 3,461 Weighted average number of shares – diluted (millions) 3,616 3,540 3,478 3,401 3,476 Dividends per ordinary share Paid during the year (pence) 49.37 49.00 47.83 46.52 128.97 Approved or proposed during the year (pence) 50.97 49.16 48.57 47.34 45.93 Paid during the year ($) 0.628 0.628 0.615 0.607 1.751 Approved or proposed during the year ($) 0.682 0.682 0.625 0.618 0.624 1. Items previously reported have been re-presented to reflect the classification of the UK Gas Transmission business as a discontinued operation in 2022. Items previously reported for 2018 have been re-presented to reflect our investment in Quadgas HoldCo Limited being presented as a discontinued operation in 2019. Summary statement of net assets (£m) 2022 2021 2020 2019 2018 Non-current assets 76,897 57,278 61,759 55,466 52,106 Current assets 17,963 9,938 5,801 7,946 6,681 Total assets 94,860 67,216 67,560 63,412 58,787 Current liabilities (24,770) (9,368) (8,564) (9,129) (8,697) Non-current liabilities (46,234) (37,988) (39,203) (34,715) (31,242) Total liabilities (71,004) (47,356) (47,767) (43,844) (39,939) Net assets 23,856 19,860 19,793 19,568 18,848 Total shareholders’ equity 23,833 19,839 19,771 19,548 18,832 Five-year summary financial information 282 National Grid plc Annual Report and Accounts 2021/22

Our aim is to use plain English in this Annual Report and Accounts. However, where necessary, we do use a number of technical terms and abbreviations. We summarise the principal ones below, together with an explanation of their meanings. The descriptions below are not formal legal definitions. Alternative and Regulatory Performance Measures are defined on pages 268 – 279. A Adjusted interest A measure of the interest charge of the Group, calculated by making adjustments to the Group reported interest charge. Adjusted net debt A measure of the indebtedness of the Group, calculated by making adjustments to the Group reported borrowings, including adjustments made to include elements of pension deficits and exclude elements of hybrid debt financing. Adjusted results (also referred to as headline results) Financial results excluding the impact of exceptional items and remeasurements that are treated as discrete transactions under IFRS and can accordingly be classified as such. This is a measure used by National Grid management that forms part of the incentive target set annually for remunerating certain Executive Directors, and further details of these items are included in note 5 to the financial statements. American Depositary Shares (ADSs) Securities of National Grid listed on the New York Stock Exchange, each of which represents five ordinary shares. They are evidenced by American Depositary Receipts or ADRs. Annual General Meeting (AGM) Meeting of shareholders of the Company held each year to consider ordinary and special business as provided in the Notice of AGM. B BEIS The Department for Business, Energy and Industrial Strategy, the UK government department responsible for business, industrial strategy, and science and innovation with energy and climate change policy. bps Basis point (bp, bps) is a unit that is equal to 1/100th of 1% and is typically used to denote the movement in a percentage-based metric such as interest rates or RoE. A 0.1% change in a percentage represents 10 basis points. Board The Board of Directors of the Company (for more information, see pages 88 and 89). BritNed BritNed Development Limited, a joint venture company in which National Grid and TenneT, the Dutch national transmission system operator, each hold 50% of the shares. C Called-up share capital Shares (common stock) that have been issued and have been fully paid for. Capital tracker In the context of our US rate plans, this is a mechanism that allows the recovery of the revenue requirement of incremental capital investment above that embedded in base rates, including depreciation, property taxes and a return on the incremental investment. Carbon capture usage and storage (CCUS) The process of capturing carbon dioxide (CO2) for the purpose of recycling it for further usage and/or determining safe and permanent storage options for it. Carrying value The amount at which an asset or a liability is recorded in the Group’s statement of financial position and the Company’s balance sheet. Child risk A management team or directorate level owned or managed risk that has a supportive or contributing relationship to a GPR or other risk at a higher escalation level. The Company, the Group, National Grid, we, our or us We use these terms to refer to either National Grid plc itself or to National Grid plc and/or all or certain of its subsidiaries, depending on context. Consolidated financial statements Financial statements that include the results and financial position of the Company and its subsidiaries together as if they were a single entity. Constant currency ‘Constant currency basis’ refers to the reporting of the actual results against the results for the same period last year, which, in respect of any US$ currency denominated activity, have been translated using the average US$ exchange rate for the year ended 31 March 2022, which was $1.3483 to £1. The average rate for the year ended 31 March 2021 was $1.34 to £1, and for the year ended 31 March 2020 was $1.29 to £1. Assets and liabilities as at 31 March 2021 have been retranslated at the closing rate at 31 March 2022 of $1.3144 to £1. The closing rate for the balance sheet date 31 March 2021 was $1.38 to £1. Contingent liabilities Possible obligations or potential liabilities arising from past events for which no provision has been recorded, but for which disclosure in the financial statements is made. COP26 The 26th UN Climate Change Conference of the Parties which the UK hosted at the Scottish Event Campus in Glasgow from 1 to 12 November 2021. The climate talks brought together heads of state, climate experts and campaigners to agree coordinated action to tackle climate change. The Company was a principal partner of COP26. COVID-19 COVID-19 or coronavirus disease 2019 is an infectious disease caused by severe acute respiratory syndrome. CPIH The UK Consumer Prices Index including Owner Occupiers’ Housing Costs as published by the Office for National Statistics. D DB Defined benefit, relating to our UK or US (as the context requires) final salary pension schemes. DC Defined contribution, relating to our UK or US (as the context requires) pension schemes to which National Grid, as an employer, pays contributions based on a percentage of employees’ salaries. Deferred tax For most assets and liabilities, deferred tax is the amount of tax that will be payable or receivable in respect of that asset or liability in future tax returns as a result of a difference between the carrying value for accounting purposes in the statement of financial position or balance sheet and the value for tax purposes of the same asset or liability. Deposit agreement The amended and restated deposit agreement entered into between National Grid plc, the Depositary and all the registered holders from time to time of ADRs, pursuant to which ADSs have been issued, dated 23 May 2013, and any related agreement. Depositary The Bank of New York Mellon acting as ADS depositary. Derivative A financial instrument or other contract where the value is linked to an underlying index, such as exchange rates, interest rates or commodity prices. In most cases, we exclude contracts for the sale or purchase of commodities that are used to supply customers or for our own needs from this definition. Directors/Executive Directors/ Non-executive Directors The Directors/Executive Directors and Non- executive Directors of the Company, whose names are set out on pages 88 and 89 of this document. Distributed energy resources (DER) Decentralised assets, generally located behind the meter, covering a range of technologies including solar, storage, electric vehicle charging, district heating, smart street lighting and combined heat and power. 283 A d d itio nal Info rm atio n National Grid plc Annual Report and Accounts 2021/22 Definitions and glossary of terms 35_Definitions_Glossary_p283_288_v56.indd 283 27/05/2022 17:44
Diversity, equity and inclusion (DEI) National Grid is committed to creating a work environment where people are treated fairly and where everyone feels respected, valued and empowered to reach their full potential. Our mission is to build a business that represents, reflects and celebrates the cultures and communities we serve. Dollars or $ Except as otherwise noted, all references to dollars or $ in this Annual Report and Accounts relate to the US currency. Dth Decatherm, being an amount of energy equal to 1 million British thermal units (BTUs), equivalent to approximately 293 kWh. E Earnings per share (EPS) Profit for the year attributable to equity shareholders of the Company allocated to each ordinary share. Electricity System Operator (ESO) The party responsible for the long-term strategy, planning and real-time operation (balancing supply and demand) of the electricity system in Great Britain. Electricity Transmission (ET) National Grid’s UK electricity transmission business. Employee engagement A key performance indicator (KPI), based on the percentage of favourable responses to certain indicator questions repeated in each employee survey. It is used to measure how employees think, feel and act in relation to National Grid. Research shows that a highly engaged workforce leads to increased productivity and employee retention. We use employee engagement as a measure of organisational health in relation to business performance. Employee resource group (ERG) A group of employees who join together in their workplace based on shared characteristics or life experiences. Estate Tax Convention The convention between the US and the UK for the avoidance of double taxation with respect to estate and gift taxes. EU The European Union (EU) is the economic and political union of 27 member states located in Europe. The UK left the European Union on 31 January 2020. Exchange Act The US Securities Exchange Act 1934, as amended. F FERC The US Federal Energy Regulatory Commission. Finance lease A lease where the asset is treated as if it was owned for the period of the lease, and the obligation to pay future rentals is treated as if they were borrowings. Also known as a capital lease. Financial year For National Grid this is an accounting year ending on 31 March. Also known as a fiscal year. FRS A UK Financial Reporting Standard as issued by the UK Financial Reporting Council (FRC). It applies to the Company’s individual financial statements on pages 235 – 241, which are prepared in accordance with FRS 101. Funds from Operations (FFO) A measure used by the credit rating agencies of the operating cash flows of the Group after interest and tax but before capital investment. G Gas Transmission (GT) National Grid’s UK gas transmission business. Grain LNG National Grid Grain LNG Limited. Great Britain (GB) England, Wales and Scotland. Green capital investment (green capex) Capital expenditure invested in decarbonisation of energy systems and considered to be aligned with the principles of the EU Taxonomy legislation at the date of reporting. Group Principal Risk (GPR) A principal risk faced by the Company as monitored and assessed by the Board, details of which are set out on pages 28 – 32. Group Value Growth Group Value Growth is Group-wide Value Added expressed as a proportion of Group equity. See page 43 for an explanation of Value Added. Groupwide value added Normalised for assumed long run inflation expressed as a proportion of group equity. GW Gigawatt, an amount of power equal to 1 billion watts (109 watts). GWh Gigawatt hours, an amount of energy equivalent to delivering 1 billion watts (109 watts) of power for a period of one hour. H HMRC HM Revenue & Customs. The UK tax authority. HVDC High-voltage, direct-current electric power transmission that uses direct current for the bulk transmission of electrical power, in contrast to the more common alternating current systems. I IAS or IFRS An International Accounting Standard (IAS) or International Financial Reporting Standard (IFRS), as issued by the International Accounting Standards Board (IASB). IFRS is also used as the term to describe international generally accepted accounting principles as a whole. Individual financial statements Financial statements of a company on its own, not including its subsidiaries or joint ventures and associates. Interest cover A measure used by the credit rating agencies, calculated as FFO plus adjusted interest divided by adjusted interest. J Joint venture (JV) A company or other entity that is controlled jointly with other parties. K KEDLI KeySpan Gas East Corporation, also known as KeySpan Energy Delivery Long Island. KEDNY The Brooklyn Union Gas Company, also known as KeySpan Energy Delivery New York. KPI Key performance indicator. kW Kilowatt, an amount of power equal to 1,000 watts. L LIPA The Long Island Power Authority. LNG Liquefied natural gas is natural gas that has been condensed into a liquid form, typically at temperatures at or below -161°C (-258°F). Lost time injury (LTI) An incident arising out of National Grid’s operations that leads to an injury where the employee or contractor normally has time off for the following day or shift following the incident. It relates to one specific (acute) identifiable incident which arises as a result of National Grid’s premises, plant or activities, and was reported to the supervisor at the time and was subject to appropriate investigation. Lost time injury frequency rate (LTIFR) The number of lost time injuries (LTIs) per 100,000 hours worked in a 12-month period. M MADPU The Massachusetts Department of Public Utilities. MW Megawatt, an amount of power equal to 1 million watts (106 watts). MWh Megawatt hours, an amount of energy equivalent to delivering 1 million watts (106 watts) of power for a period of one hour. 284 National Grid plc Annual Report and Accounts 2021/22 Definitions and glossary of terms continued 35_Definitions_Glossary_p283_288_v56.indd 284 27/05/2022 17:44

N National Grid Metering Limited (NGM) The Company’s UK regulated metering business. National Grid Partners (NGP) The Company’s venture investment and innovation business established in November 2018. National Grid Renewables (NGR) This business, which includes the renewables development company formerly known as Geronimo, is a leading developer of wind and solar generation based in Minneapolis in the US. National Grid acquired Geronimo in July 2019. National Grid Ventures (NGV) The Company’s division that operates outside its core UK and US Regulated businesses, comprising a broad range of activities in the UK and US, including National Grid Renewables, electricity interconnectors, the Grain LNG terminal and energy metering, as well as being tasked with investment in adjacent businesses and distributed energy opportunities. National Transmission System (NTS) The gas National Transmission System in Great Britain. NECO The Narragansett Electric Company, National Grid’s electricity transmission and distribution service provider to, as well as a natural gas distribution company in, Rhode Island. NECO Sale The agreed sale by National Grid to PPL of NECO, conditional upon completion of the WPD Acquisition and receipt of certain regulatory approvals, which is expected to complete by the end of Q1 2022/23. Nemo Link Nemo Link Limited, a joint venture company in which National Grid and Elia, the Belgian national transmission system operator, each hold 50% of the shares. Net Promoter Score (NPS) A commonly used tool to measure customer experience to gauge the loyalty of a company’s customer relationships. It is an index ranging from -100 to +100. Net zero Net zero means that a person, legal entity (such as a company), country or other body’s own emissions of greenhouse gases are either zero or that its remaining greenhouse gas emissions are balanced by schemes to offset, through the removal of an equivalent amount of greenhouse gases from the atmosphere, such as planting trees or using technology like carbon capture and storage. New England The term refers to a region within the northeastern US that includes the states of Connecticut, Maine, Massachusetts, New Hampshire, Rhode Island and Vermont. National Grid’s New England operations are primarily in the states of Massachusetts and Rhode Island. NGGT Sale The sale, agreed by the Company and announced on 27 March 2022, of a 60% equity stake in its UK Gas Transmission and legacy metering businesses to a consortium comprising Macquarie Asset Management and British Columbia Investment Management Corporation. The sale is subject to certain antitrust and regulatory conditions and is expected to close in the second half of 2022. The consortium also has an option on the remaining 40%, on broadly similar terms which can be exercised through the first half of 2023. Northeastern US The northeastern region of the US, comprising the states of Connecticut, Maine, Massachusetts, New Hampshire, New Jersey, New York, Pennsylvania, Rhode Island and Vermont. NYPSC The New York Public Service Commission. O Ofgem The UK Office of Gas and Electricity Markets is part of the UK Gas and Electricity Markets Authority (GEMA), which regulates the energy markets in the UK. OPEB Other post-employment benefits. Ordinary shares Voting shares entitling the holder to part ownership of a company. Also known as common stock. National Grid’s ordinary shares have a nominal value of 12204∕473 pence following the share consolidation approved at the General Meeting of the Company held on 19 May 2017. P Paris Agreement The agreement, also known as the Paris Climate Accord, within the United Nations Framework Convention on Climate Change dealing with greenhouse gas emissions mitigation, adaptation and finance starting in the year 2020, and adopted by consensus on 12 December 2015. PPL PPL Corporation, a US energy company headquartered in Pennsylvania. Price control The mechanism by which Ofgem sets restrictions on the amounts of revenue we are allowed to collect from customers in our UK businesses. The allowed revenues are intended to cover efficiently incurred operational expenditure, capital expenditure and financing costs, including a Return on Equity invested. R Rate base The base investment on which the utility is authorised to earn a cash return. It includes the original cost of facilities, minus depreciation, an allowance for working capital and other accounts. Rate plan The term given to the mechanism by which a US utility regulator sets terms and conditions for utility service, including, in particular, tariffs and rate schedules. The term can mean a multi-year plan that is approved for a specified period, or an order approving tariffs and rate schedules that remain in effect until changed as a result of future regulatory proceedings. Such proceedings can be commenced through a filing by the utility or on the regulator’s own initiative. Regulated controllable costs Total operating costs under IFRS less depreciation and certain regulatory costs where, under our regulatory agreements, mechanisms are in place to recover such costs in current or future periods. Regulatory asset value (RAV) The value ascribed by Ofgem to the capital employed in the relevant licensed business. It is an estimate of the initial market value of the regulated asset base at privatisation, plus subsequent allowed additions at historical cost, less the deduction of annual regulatory depreciation. Deductions are also made to reflect the value realised from the disposal of certain assets that formed part of the regulatory asset base. It is also indexed to the RPI to allow for the effects of inflation. Regulatory IOUs Net under/over-recoveries of revenue from output-related allowance changes, the totex incentive mechanism, legacy price control cost true-up and differences between allowed and collected revenues. Retained cash flow (RCF) A measure of the cash flows of the Group used by the credit rating agencies. It is calculated as funds from operations less dividends paid and costs of repurchasing scrip shares. Revenue decoupling Revenue decoupling is the term given to the elimination of the dependency of a utility’s revenue on the volume of gas or electricity transported. The purpose of decoupling is to encourage energy-efficiency programmes by eliminating the disincentive a utility otherwise has to such programmes. RIIO Revenue = Incentives + Innovation + Outputs, the regulatory framework for energy networks issued by Ofgem. RIIO-T1 The regulatory framework for transmission networks that was implemented in the eight-year price controls started on 1 April 2013. RIIO-T2 The regulatory framework for transmission networks issued by Ofgem which started on 1 April 2021. RIIO-ED1 The regulatory framework for electricity distribution networks issued by Ofgem which started on 1 April 2014. RIIO-ED2 The regulatory framework for electricity distribution networks expected to be issued by Ofgem to start on 1 April 2023. 285 A d d itio nal Info rm atio n National Grid plc Annual Report and Accounts 2021/22 35_Definitions_Glossary_p283_288_v56.indd 285 27/05/2022 17:44

RIPUC The Rhode Island Public Utilities Commission. RPI The UK retail price index as published by the Office for National Statistics. S Scope 1 greenhouse gas emissions Scope 1 emissions are direct greenhouse gas emissions that occur from sources that are owned or controlled by the Company. Examples include emissions from combustion in owned or controlled boilers, furnaces, vehicles, etc. Scope 2 greenhouse gas emissions Scope 2 emissions are greenhouse gas emissions from the generation of purchased electricity consumed by the Company. Purchased electricity is defined as electricity, heat, steam or cooling that is purchased or otherwise brought into the organisational boundary of the Company. Scope 2 emissions physically occur at the facility where electricity is generated. Scope 3 greenhouse gas emissions Scope 3 emissions are indirect greenhouse gas emissions as a consequence of the operations of the Company, but are not owned or controlled by the Company, such as emissions from third-party logistics providers, waste management suppliers, travel suppliers, employee commuting, and combustion of sold gas by customers. SEC The US Securities and Exchange Commission, the financial regulator for companies with registered securities in the US, including National Grid and certain of its subsidiaries. SF6 Sulphur hexafluoride is an inorganic, colourless, odourless and non-flammable greenhouse gas. SF6 is used in the electricity industry as a gaseous dielectric medium for high-voltage circuit breakers, switchgear and other electrical equipment. The Kyoto Protocol estimated that the global warming potential over 100 years of SF6 is 23,900 times more potent than that of CO2. Share premium The difference between the amount shares are issued for and the nominal value of those shares. Subsidiary A company or other entity that is controlled by National Grid. Swaption A swaption gives the buyer, in exchange for an option premium, the right, but not the obligation, to enter into an interest-rate swap at some specified date in the future. The terms of the swap are specified on the trade date of the swaption. T Task Force on Climate-related Financial Disclosures (TCFD) A body, established in 2015 comprising 31 members from across the G20, whose role is to develop recommendations for more informed investment and enable stakeholders to better understand the concentrations of carbon-related assets in the financial sector and the financial system’s exposures to climate-related risk. Tax Convention The income tax convention between the US and the UK. Taxes borne Those taxes that represent a cost to the Company and are reflected in our results. Taxes collected Those taxes that are generated by our operations but do not affect our results. We generate the commercial activity giving rise to these taxes and then collect and administer them on behalf of tax authorities. TCFD recommendations or recommended disclosures The 11 recommended disclosures set out in the June 2017 TCFD report entitled ‘Recommendations of the Task Force on Climate-related Financial Disclosures’. Tonne A unit of mass equal to 1,000 kilogrammes, equivalent to approximately 2,205 pounds. Tonnes carbon dioxide equivalent (tCO2e) A measure of greenhouse gas emissions in terms of the equivalent amount of carbon dioxide. Total Societal Impact (TSI) TSI is a methodology that attempts to calculate the total benefit to society from a company’s products, services, operations, core capabilities and activities. Totex Total expenditure, comprising capital and operating expenditure. Treasury shares Shares that have been repurchased but not cancelled. These shares can then be allotted to meet obligations under the Company’s employee share schemes. U UK The United Kingdom, comprising England, Wales, Scotland and Northern Ireland. UK Corporate Governance Code (the ‘Code’) Guidance, issued by the Financial Reporting Council in 2018, on how companies should be governed, applicable to UK listed companies, including National Grid, in respect of reporting periods starting on or after 1 January 2019. UK GAAP Generally accepted accounting practices in the UK. These differ from IFRS and from US GAAP. Underlying EPS Underlying results for the year attributable to equity shareholders of the Company allocated to each ordinary share. Underlying results The financial results of the Company, adjusted to exclude the impact of exceptional items and remeasurements that are treated as discrete transactions under IFRS and can accordingly be classified as such, and to take account of volumetric and other revenue timing differences arising due to the in-year difference between allowed and collected revenues as well as major storm costs (where these are above $100 million threshold in a given year). US The United States of America, its territories and possessions; any state of the United States and the District of Columbia. US GAAP Generally accepted accounting principles in the US. These differ from IFRS and from UK GAAP. US state regulators (state utility commissions) In the US, public utilities’ retail transactions are regulated by state utility commissions, including the New York Public Service Commission (NYPSC), the Massachusetts Department of Public Utilities (MADPU) and the Rhode Island Public Utilities Commission (RIPUC). V Value Added Value Added is a measure to capture the value created through investment attributable to equity holders, being the change in total regulated and non-regulated assets including goodwill (both at constant currency) plus the cash dividend paid in the year plus share repurchase costs less the growth in net debt (at constant currency). This is then presented on an absolute and a per share basis. Value Growth Value Growth is the Value Added, adjusted to normalise for a 3% long-run RPI inflation rate, expressed as a proportion of Group equity. See page 279. W WPD National Grid’s UK electricity distribution business, comprising Western Power Distribution Holding Company Limited and its subsidiaries. The group is the UK’s largest electricity distribution business and includes four distribution network operators. WPD Acquisition The acquisition by National Grid of WPD, which completed on 14 June 2021. 286 National Grid plc Annual Report and Accounts 2021/22 Definitions and glossary of terms continued 35_Definitions_Glossary_p283_288_v56.indd 286 27/05/2022 17:44

Equiniti For queries about ordinary shares: 0800 169 7775 This is a Freephone number from landlines within the UK; mobile costs may vary. Lines are open 8.30am to 5.30pm, Monday to Friday, excluding public holidays. If calling from outside the UK: +44 (0) 800 169 7775. Calls from outside the UK will be charged at the applicable international rate. Visit help.shareview.co.uk for information regarding your shareholding (from here you will also be able to email a query securely). National Grid Share Register Equiniti Aspect House Spencer Road, Lancing West Sussex BN99 6DA The Bank of New York Mellon For queries about American Depositary Shares: 1-800-466-7215 If calling from outside the US: +1-201-680-6825 adrbnymellon.com Email: shrrelations@cpushareownerservices.com BNY Mellon – ADR PO Box 505000 Louisville, KY 40233-5000 Further information about National Grid, including share price and interactive tools, can be found on our website: nationalgrid.com/investors Beware of share fraud Investment scams are often sophisticated and difficult to spot. Shareholders are advised to be wary of any unsolicited advice or offers, whether over the telephone, through the post or by email. If you receive any unsolicited communication, please check that the company or person contacting you is properly authorised by the Financial Conduct Authority (FCA) before getting involved. Be ScamSmart and visit fca.org.uk/scamsmart. You can report calls from unauthorised firms to the FCA by calling 0800 111 6768. Financial calendar The following dates have been announced or are indicative: 19 May 2022 2021/22 full-year results 1 June 2022 Ordinary shares go ex-dividend for 2021/22 final dividend 3 June 2022 ADRs go ex-dividend for 2021/22 final dividend 6 June 2022 Record date for 2021/22 final dividend 10 June 2022 Scrip reference price announced 11 July 2022 2022 AGM 20 July 2022 (5.00pm London time) Scrip election date 17 August 2022 2021/22 final dividend paid to qualifying shareholders 10 November 2022 2022/23 half-year results 23 November 2022 ADRs go ex-dividend for 2022/23 interim dividend 24 November 2022 Ordinary shares go ex-dividend for 2022/23 interim dividend 25 November 2022 Record date for 2022/23 interim dividend 1 December 2022 Scrip reference price announced 12 December 2022 (5.00pm London time) Scrip election date for 2022/23 interim dividend 11 January 2023 2022/23 interim dividend paid to qualifying shareholders Dividends The Directors are recommending a final dividend of 33.76 pence per ordinary share ($2.0929 per ADS) to be paid on 17 August 2022 to shareholders on the register as at 6 June 2022. Further details on dividend payments can be found on page 49. If you live outside the UK, you may be able to request that your dividend payments are converted into your local currency. Under the Deposit agreement, a fee of up to $0.05 per ADS can be charged for any cash distribution made to ADS holders, including cash dividends. ADS holders who receive cash in relation to the 2021/22 final dividend will be charged a fee of $0.02 per ADS by the Depositary prior to the distribution of the cash dividend. From August 2022, all National Grid dividends will be paid directly into bank or building society accounts for ordinary shareholders. Please make sure you have completed and returned a bank mandate form. Benefits include the following: • Your dividend reaches your account on the payment day. • It helps the environment by saving over 500,000 A4 pieces of paper annually. • It is more secure – cheques sometimes get lost in the post. • No more trips to the bank. Elect to receive your dividends as additional shares: Join our scrip dividend scheme; no stamp duty or commission to pay. Electronic communications Please register at shareview.co.uk. It only takes a few minutes to register – just have your 11-digit Shareholder Reference Number to hand. You will be sent an Activation Code to complete registration. Once you have registered, you can elect to receive your shareholder communications electronically. Registered office National Grid plc was incorporated on 11 July 2000. The Company is registered in England and Wales No. 4031152, with its registered office at 1–3 Strand, London WC2N 5EH. Share dealing Postal share dealing: Equiniti offers our European Economic Area resident shareholders a share dealing service by post. This service is available to private shareholders resident within the European Economic Area, the Channel Islands or the Isle of Man. If you hold your shares in CREST, you are not eligible to use this service. For more information and to obtain a form, please visit shareview.co.uk or call Equiniti on 0800 169 7775. Internet and telephone share dealing: Equiniti also offers telephone and online share dealing at live prices. For full details, together with terms and conditions, please visit shareview.co.uk. You can call Equiniti on 0345 603 7037 for further details, or to arrange a trade. Lines are open Monday to Friday, 8.00am to 4.30pm for dealing, and until 6.00pm for enquiries. ShareGift: If you only have a small number of shares that would cost more for you to sell than they are worth, you may wish to consider donating them to ShareGift. ShareGift is a registered charity (No. 1052686) which specialises in accepting such shares as donations. For more information, visit sharegift.org or contact Equiniti. Individual Savings Accounts (ISAs): ISAs for National Grid shares are available from Equiniti. For more information, call Equiniti on 0345 0700 720 or visit eqi.co.uk. 287 A d d itio nal Info rm atio n National Grid plc Annual Report and Accounts 2021/22 Want more information or help? 35_Definitions_Glossary_p283_288_v56.indd 287 27/05/2022 17:44

This document comprises the Annual Report and Accounts for the year ended 31 March 2022 for National Grid plc and its subsidiaries. It contains the Directors’ Report and Financial Statements, together with the independent auditor’s report thereon, as required by the Companies Act 2006. The Directors’ Report, comprising pages 1 – 131 and 242 – 288 has been drawn up in accordance with the requirements of English law, and liability in respect thereof is also governed by English law. In particular, the liability of the Directors for these reports is solely to National Grid. This document contains certain statements that are neither reported financial results nor other historical information. These statements are forward-looking statements within the meaning of section 27A of the Securities Act of 1933, as amended, and section 21E of the Securities Exchange Act of 1934, as amended. These statements include information with respect to our financial condition, our results of operations and businesses, strategy, plans and objectives. Words such as ‘aims’, ‘anticipates’, ‘expects’, ‘should’, ‘intends’, ‘plans’, ‘believes’, ‘outlook’, ‘seeks’, ‘estimates’, ‘targets’, ‘may’, ‘will’, ‘continue’, ‘project’ and similar expressions, as well as statements in the future tense, identify forward-looking statements. This document also references climate-related targets and climate- related risks which differ from conventional financial risks in that they are complex, novel and tend to involve projection over long-term scenarios which are subject to significant uncertainty and change. These forward-looking statements and targets are not guarantees of our future performance and are subject to assumptions, risks and uncertainties that could cause actual future results to differ materially from those expressed in or implied by such forward-looking statements and targets. Many of these assumptions, risks and uncertainties relate to factors that are beyond our ability to control or estimate precisely, such as changes in laws or regulations, including any arising as a result of the United Kingdom’s exit from the European Union; announcements from and decisions by governmental bodies or regulators, including those relating to the RIIO-T2 and RIIO-ED2 price controls and proposals for the future of system operation in the United Kingdom; the timing of construction and delivery by third parties of new generation projects requiring connection; breaches of, or changes in, environmental, climate change, and health and safety laws or regulations, including breaches or other incidents arising from the potentially harmful nature of our activities; network failure or interruption, the inability to carry out critical non-network operations, and damage to infrastructure, due to adverse weather conditions, including the impact of major storms as well as the results of climate change, due to counterparties being unable to deliver physical commodities, or due to the failure of or unauthorised access to or deliberate breaches of our IT systems and supporting technology; failure to adequately forecast and respond to disruptions in energy supply; performance against regulatory targets and standards and against our peers with the aim of delivering stakeholder expectations regarding costs and efficiency savings, as well as against targets and standards designed to deliver net zero; and customers and counterparties (including financial institutions) failing to perform their obligations to the Company. Other factors that could cause actual results to differ materially from those described in this document include fluctuations in exchange rates, interest rates and commodity price indices; restrictions and conditions (including filing requirements) in our borrowing and debt arrangements, funding costs and access to financing; regulatory requirements for us to maintain financial resources in certain parts of our business and restrictions on some subsidiaries’ transactions, such as paying dividends, lending or levying charges; the delayed timing of recoveries and payments in our regulated businesses and whether aspects of our activities are contestable; the funding requirements and performance of our pension schemes and other post-retirement benefit schemes; the failure to attract, develop and retain employees with the necessary competencies, including leadership and business capabilities, and any significant disputes arising with our employees or breaches of laws or regulations by our employees; the failure to respond to market developments, including competition for onshore transmission; the threats and opportunities presented by emerging technology; the failure by the Company to respond to, or meet its own commitments as a leader in relation to, climate change development activities relating to energy transition, including the integration of distributed energy resources; and the need to grow our business to deliver our strategy, as well as incorrect or unforeseen assumptions or conclusions (including unanticipated costs and liabilities) relating to business development activity, including the integration of WPD, the sale of the Company’s Rhode Island gas and electricity business and the sale of a 60% stake in the Group’s UK Gas Transmission business, and joint ventures. For further details regarding these and other assumptions, risks and uncertainties that may affect National Grid, please read the Strategic Report and the risk factors on pages 253 – 256 of this document. In addition, new factors emerge from time to time and we cannot assess the potential impact of any such factor on our activities or the extent to which any factor, or combination of factors, may cause actual future results to differ materially from those contained in any forward-looking statement. Except as may be required by law or regulation, the Company undertakes no obligation to update any of its forward-looking statements, which speak only as of the date of this document. The contents of any website references in this document do not form part of this document. 288 National Grid plc Annual Report and Accounts 2021/22 Cautionary statement 35_Definitions_Glossary_p283_288_v56.indd 288 27/05/2022 17:44

This report is printed on Arena White Smooth which is made of FSC® certified and other controlled material. Printed sustainably in the UK by Pureprint, a CarbonNeutral® company with FSC® chain of custody and an ISO 14001 certified environmental management system recycling over 99% of all dry waste. If you have finished with this document and no longer wish to retain it, please pass it on to other interested readers or dispose of it in your recycled waste. Thank you. The paper used in this report has been Carbon Balanced with the World Land Trust, an international conservation charity, which offsets carbon emissions through the purchase and preservation of high conservation value land. Through protecting standing forests, under threat of clearance, carbon is locked in that would otherwise be released. These protected forests are then able to continue absorbing carbon from the atmosphere, referred to as REDD (Reduced Emissions from Deforestation and forest Degradation). This is now recognised as one of the most cost-effective and swiftest ways to arrest the rise in atmospheric CO2 and global warming effects. Additional to the carbon benefits is the flora and fauna this land preserves, including a number of species identified as at risk of extinction on the IUCN Red List of Threatened Species. Designed and produced by A d d itio nal Info rm atio n

National Grid plc 1–3 Strand London WC2N 5EH United Kingdom nationalgrid.com
Further Information
Share ownership
At 1 June 2022, the latest practicable date, none of the directors had an individual beneficial interest amounting to greater than 1% of the Company’s shares.
Material interests in shares
The following summarizes the significant changes in the percentage ownership held by our major shareholders during the past three years:
BlackRock, Inc. has held 7.29% of our outstanding share capital as at 31 March 2020., which percentage decreased to 7.16% as at 31 May 2021. As noted on page 259 of the 2021/2022 Annual Report and Accounts, we have been notified that BlackRock, Inc. held 7.04% of our outstanding share capital as at 31 March 2022, and such holdings remained the same as at 1 June 2022.
The Capital Group Companies, Inc. held 3.88% of our outstanding share capital as at each of 31 March 2020 and 31 March 2021, and such holdings increased to 5.05% as at 31 March 2022 and such holdings remained the same as at 1 June 2022.
Since 31 March 2021, we have not been notified of any other subsequent significant change in the percentage of shares held by the shareholders listed on page 259 of the 2021/2022 Annual Report and Accounts.
Material interest in American Depositary Shares
As at 1 June 2022, we had 11.743 registered holders of our American Depositary Shares (ADSs) representing ownership of 8.02% of our issued and outstanding share capital, excluding ordinary shares held in treasury. As at 1 June 2022, based on information available to us, we believe that approximately 8.03% of our issued and outstanding share capital (whether in the form of shares or ADSs), excluding shares held in treasury, was held beneficially in the United States.
Subsequent Events
Other than National Grid plc’s sale of The Narragansett Electric Company to PPL Rhode Island Holdings LLC that was completed on 25 May 2022, there are no further subsequent events to disclose.
Representations and Warranties in the Exhibits
Pursuant to the rules and regulations of the SEC, National Grid has filed certain agreements as exhibits to this Annual Report on Form 20-F. These agreements may contain representations and warranties by the parties to them. These representations and warranties have been made solely for the benefit of the other party or parties to such agreement and (i) may be intended not as statements of fact, but rather as a way of allocating the risk to one of the parties to such agreements if those statements turn out to be inaccurate, (ii) may have been qualified by disclosures that were made to such other party or parties and that either have been reflected in the company’s filings or are not required to be disclosed in those filings, (iii) may apply materiality standards different from what may be viewed as material to investors and (iv) were made only as of the date of such agreements or such other date or dates as may be specified in such agreements.
In accordance with the instructions to Item 2(b)(i) of the Instructions to Exhibits to the Form 20-F, National Grid agrees to furnish to the SEC, upon request, a copy of any instrument relating to long-term debt that does not exceed 10 percent of the total assets of National Grid and its subsidiaries on a consolidated basis.
Reports of Independent Registered Public Accounting Firms—Audit opinions for Form 20-F
In addition to the financial information set forth on the pages referenced under Item 18 in the Form 20-F Cross Reference Table on page vii, the reports of Deloitte LLP (PCAOB ID 1147), Independent Registered Public Accounting Firm, are presented below:
REPORT OF INDEPENDENT REGISTERED PUBLIC ACCOUNTING FIRM
To the shareholders and the Board of Directors of National Grid plc.
Opinion on the Financial Statements
We have audited the accompanying consolidated statements of financial position of National Grid plc. (the “Company”) and subsidiaries (together the "Group") as at 31 March, 2022, and 2021, the related consolidated statements of income, comprehensive income, changes in equity, and cash flows, for each of the three years in the period ended 31 March 2022, and the related notes (collectively referred to as the "financial statements"). In our opinion, the financial statements present fairly, in all material respects, the financial position of the Group as at 31 March 2022, and 2021, and the results of its operations and its cash flows for each of the three years in the period ended 31 March 2022, in conformity with International Financial Reporting Standards (“IFRS”) as issued by the International Accounting Standards Board.
We have also audited, in accordance with the standards of the Public Company Accounting Oversight Board (United States) (PCAOB), the Group's internal control over financial reporting as at 31 March 2022, based on criteria established in Internal Control — Integrated Framework (2013) issued by the Committee of Sponsoring Organizations of the Treadway Commission and our report dated 18 May 2022, expressed an unqualified opinion on the Group's internal control over financial reporting.
Basis for Opinion
These financial statements are the responsibility of the Group's management. Our responsibility is to express an opinion on the Group's financial statements based on our audits. We are a public accounting firm registered with the PCAOB and are required to be independent with respect to the Group in accordance with the U.S. federal securities laws and the applicable rules and regulations of the Securities and Exchange Commission and the PCAOB.
We conducted our audits in accordance with the standards of the PCAOB. Those standards require that we plan and perform the audit to obtain reasonable assurance about whether the financial statements are free of material misstatement, whether due to error or fraud. Our audits included performing procedures to assess the risks of material misstatement of the financial statements, whether due to error or fraud, and performing procedures that respond to those risks. Such procedures included examining, on a test basis, evidence regarding the amounts and disclosures in the financial statements. Our audits also included evaluating the accounting principles used and significant estimates made by management, as well as evaluating the overall presentation of the financial statements. We believe that our audits provide a reasonable basis for our opinion.
Critical Audit Matters
The critical audit matters communicated below are matters arising from the current-period audit of the financial statements that were communicated or required to be communicated to the audit committee and that (1) relate to accounts or disclosures that are material to the financial statements and (2) involved our especially challenging, subjective, or complex judgments. The communication of critical audit matters does not alter in any way our opinion on the financial statements, taken as a whole, and we are not, by communicating the critical audit matters below, providing a separate opinion on the critical audit matter or on the accounts or disclosures to which they relate.
Acquisition of Western Power Distribution (“WPD”) and Impairment Testing of the related WPD goodwill - Refer to notes 1F, 11 and 37 to the financial statements
Critical Audit Matter Description
Acquisition of WPD (referred to as UK Electricity Distribution)
The acquisition of WPD completed on 14 June 2021. The Competition and Markets Authority (‘CMA’) issued an Initial Enforcement Order (‘IEO’) which required the WPD group to continue to be run independently from National Grid until it had completed its reviews. The CMA reviews were completed on 1 September 2021, at which point the restrictions put in place by the IEO were removed. The IEO restrictions meant there was judgement regarding the point at which National Grid assumed control of WPD. Management concluded that, based on the evaluated evidence, they assumed control from 14 June 2021 and consolidated WPD from that date.
Management, with support from third party experts, performed an exercise to fair value the assets and liabilities acquired at the date of acquisition. The key balance sheet items fair valued included:
•property, plant and equipment (‘PPE’) valued at £10,051 million, which implied a step-down of £4,026 million relative to the book value acquired. This represents a combination of an accounting adjustment to remove deferred customer contributions) and a fair value step down;
•licence intangible assets of £1,714 million, attributed to the licences to operate for each of the distribution network operators (‘DNOs’) acquired; and
•non-current borrowings of £7,556 million; an increase of £1,589 million on pre-acquisition book value.
The difference between the consideration paid (£7,881 million) and the net fair values of the identified assets and liabilities acquired (£3,160 million) is recorded as goodwill of £4,721 million. Management concluded this represents the future expected growth of the WPD business, expected synergies from combining the business with National Grid and the expertise of the management team acquired.
The most significant judgements related to the allocation of value between PPE, the acquired licence intangibles and the residual goodwill recorded.
The fair value of the PPE assets was determined based on cash flows related to the existing asset base, including estimates regarding future expected outperformance, maintenance and replacement expenditure and regulatory returns. Given there is no future cash inflow related to assets which were funded by customer contributions, this resulted in an accounting adjustment of £2,754 million.
The fair value of the licence intangible assets was determined based on discounting the incremental cash flows relating to the licence. These cashflows were calculated by subtracting the cashflows attributable to PPE and goodwill from the cashflows for the business as a whole. The licence cashflows are dependent on multiple key assumptions including future expected outperformance, synergies, capital expenditure and regulatory returns, which are subject to a high degree of uncertainty.
In determining these fair values, management is required to make significant estimates and judgments including those relating to the forecasts of future cash flows, terminal value and selection of the discount rate. Performing audit procedures to evaluate the appropriateness of management’s determination of the acquisition date and the reasonableness of these estimates and assumptions required a high degree of auditor judgment and an increased extent of effort, including the need to involve our fair value specialists.
WPD Goodwill impairment
Following the finalisation of the purchase price allocation (‘PPA’), the WPD goodwill balance of £4,721 million was tested for impairment in line with the requirement in IAS 36 to perform an impairment review annually, starting in the year of acquisition. Due to volatility caused by macroeconomic events in the last three months of this financial year management tested goodwill as at 31 March 2022 but will revert to 31 December in future periods.
As set out in note 11 to the financial statements, management prepared a discounted cash flow model to estimate the value-in-use and compared this to the carrying value; this indicated there was headroom and accordingly no impairment was recognised. The value-in-use was measured at the group of cash-generating units (‘CGUs’) level and the calculation was derived from multiple inputs to the model, including:
•Totex forecasts – The model used for the impairment test leverages the cashflow forecasts from the fair value allocation exercise and extends to 2050. Management forecast negative cashflows for a number of years due to the level of investment required to reinforce the networks to meet expected electricity demand in order to achieve the company’s and the UK’s target to become net zero by 2050. The future forecast expenditure is therefore dependent on the increased demand for low-carbon technologies (‘LCTs’) including electric vehicles (‘EVs’) and heat pumps which will require more connections on the distribution network. Given there are a number of potential pathways for the energy transition to 2050, including the extent of electrification, there is uncertainty in the level of future totex required.
•Discount rate – Management utilised a pre-tax discount rate of 5.2%. The discount rate should reflect the return required by the market and the risks inherent in the cash flows being discounted and accordingly should be independent of the actual capital structure of the business being assessed and the way in which the acquisition of the business was financed. There is a risk that management did not apply a reasonable discount rate, leading to a material misstatement of goodwill.
•Terminal value – In order to calculate the value of the business at the end of the forecast period in 2050, management have assumed an ‘exit multiple’ of Regulatory Asset Value (‘RAV’) at that date. This is the equivalent of a nominal growth rate in perpetuity of 2.5%.
Changes in these assumptions could have a significant impact on the fair value and the amount of any impairment charge.
The impairment test of WPD goodwill involved significant assumptions including those used in the selection of Totex forecasts, the discount rate and the terminal value. Auditing these assumptions required a high degree of auditor judgment and increased extent of effort, including the need to involve more senior members of the team and our fair value specialists.
How the Critical Audit Matter was Addressed in the Audit
Acquisition of WPD
We have tested the controls over the accounting for the acquisition of WPD. This has included testing the review controls over the valuations and management’s challenge of the estimates made.
We challenged the reasonableness of management’s judgement regarding the date from when they assumed control, including reading correspondence with the regulators and the terms of the IEO, as well as searching for any contradictory evidence.
In respect of the overall acquired balance sheet, we:
•evaluated the appropriateness of the methodology applied in valuing the acquired assets and liabilities;
•determined the reasonableness of the values attributed to acquired assets and liabilities, with input from our valuations, tax, treasury and pension specialists;
•read the share purchase agreement; and
•vouched the consideration paid to bank statements.
In challenging management’s judgements and estimates relating to the fair value allocations to PPE, intangible assets and goodwill, we:
•evaluated the fair value methodology used by management’s expert, with input from our valuation specialists;
•assessed the competence and objectivity of management’s experts;
•tested the integrity of the model used in determining the fair values; and
•compared significant assumptions to externally sourced information including from the regulator, and other government bodies.
We also evaluated the appropriateness of the disclosures in the financial statements.
WPD Goodwill Impairment
We tested the controls over management’s impairment review performed for the WPD business. In addition, we conducted the following substantive procedures.
Totex forecasts
•We understood the key totex assumptions in the model and challenged the basis of these by benchmarking the assumptions against third-party and relevant industry publications to inform our assessment of the nature, timing and extent of expected electrification in the UK.
•We evaluated the competence and objectivity of the third-party experts used by management to develop the totex forecasts.
Discount rate
•We engaged our valuation specialists to develop an independent range for a reasonable discount rate using relevant third-party market and peer data for the WPD business. We compared management’s calculated rate to our reasonable range.
Terminal value
•We independently developed a reasonable range of RAV based exit multiples
using external data obtained for historical market transaction values.
•We independently recalculated the equivalent long-term nominal growth rate to assess the reasonableness of the rate compared to long-term growth forecasts for the UK economy.
Other
•We assessed whether the impairment methodology applied by management was acceptable under IFRS and tested the integrity and mechanical accuracy of the impairment model.
•We evaluated all key inputs, assumptions and datasets used in the model by benchmarking information to different industry and third-party publications.
•We assessed the accuracy of management’s short-term forecasts by comparing to the latest historical financial information for WPD.
•We assessed whether management’s impairment forecasts are consistent with other forecasts used by management, including the RIIO-ED2 business plan submitted to Ofgem.
•We evaluated all changes to key assumptions between the model used for the PPA exercise and the goodwill impairment test.
•We challenged management’s disclosures in notes 1F, 11, 35 and 37 including in relation to the sensitivity of discount rate and terminal value disclosures.
The impact of climate change on PPE – Refer to notes 1F and 13 to the financial statements
Critical Audit Matter Description
Certain US states in which the Group operates have enacted legislation and established targets in respect of net zero carbon emissions by 2050. Accordingly climate change represents a strategic challenge for the Group, which has also set targets for reducing greenhouse gas emissions by the same date.
Natural gas, when burned, emits carbon dioxide and is considered a greenhouse gas. Therefore, the strategic challenge relates to the potential future use of the Group’s gas assets, which are used to facilitate gas distribution services in the US in the period approaching 2050 and beyond. Therefore, our focus has been on the useful economic life of the Group’s gas assets in the US, which is up to 80 years, extending well beyond the 2050 “net zero” commitment date.
As the continued use of natural gas as a primary energy source beyond 2050 appears to be in conflict with net zero targets and the impact of shortening the useful lives of the gas assets to 2050 has a material impact on annual depreciation, there is an audit risk that management judgements taken to determine the useful lives of US gas assets in the context of net zero commitments are not reasonable.
As described in note 13 to the financial statements, the impact of changing the useful economic lives of the gas assets in the US, such that they would be fully depreciated by 2050, would be an increase in the annual depreciation expense of £180 million.
The Group announced in April 2022 that it is planning to eliminate fossil fuels from its gas and electric systems in New York state and Massachusetts by 2050, by decarbonising the gas network through the use of renewable natural gas (‘RNG’) and green hydrogen. This commitment to eliminate entirely fossil fuels from the gas network by 2050, includes clear and measurable internal milestones in the period up to 2050.
Both New York and Massachusetts, the largest states in which the Group operates, announced climate action plans proposing that nearly all households change their heating systems to electricity by 2050. Management’s vision, which will require legislative and regulatory support to implement, proposes a hybrid approach that believe will enable customers to have more affordable energy solutions and allow customers to retain choice in how to achieve net zero.
Although there are challenges and uncertainties around the sufficiency of RNG supply, as well as around the cost effectiveness and production of green hydrogen as they are early stage technologies, management is of the view that a hybrid electric-gas heating system approach will be a practical and achievable pathway to meet the state and regional decarbonisation goals as well as the most affordable, reliable, and practical solution to reduce emissions. This hybrid approach would mean there would be a need for the majority of the Group’s US gas assets in the long term and hence there will be no need to shorten their useful economic lives.
Management operated a control to assess the accounting impacts associated with climate change, including on the useful lives of the Group’s US gas assets, to ensure these are considered and reflected appropriately in the financial statements.
Management determined that disclosure of a key judgement in relation to the potential future use of the US gas assets post-2050 and disclosure of the gas asset lives as a key estimate (note 1F to the financial statements), with sensitivity analysis (note 13 to the financial statements), was appropriate.
We have identified the estimated useful lives of the Company’s gas distribution assets in the US as a critical audit matter due to the significance of the judgement involved.
How the Critical Audit Matter was Addressed in the Audit
We tested management’s internal control over the accounting for and disclosure of the potential impacts associated with the energy transition and climate change.
With the assistance of our sustainability specialists, we challenged management’s judgement that it is probable the useful lives of the US gas assets will extend beyond 2050 in light of the different goals, commitments and legislation relating to net zero in the US states in which the Group operates by:
•understanding potential strategic pathways to achieve net zero targets;
•obtaining and reading government plans in the US for achieving net zero, which we compared to the potential strategic pathways;
•challenging the technical feasibility of management’s plans by considering the readiness for hydrogen blending with other gases across both transmission and distribution networks;
•evaluating information from the Group’s regulators, including rate cases in the US, to consider whether they presented any contradictory evidence;
•performing an assessment of the likelihood of occurrence of alternative scenarios for achieving net zero targets;
•considering the potential for re-purposing the Group’s gas networks for alternative uses, and in particular management’s plans to decarbonise the natural gas system with renewable natural gas and hydrogen; and
•reading a number of external reports, the key ones being:
◦The Sixth Carbon Budget, produced by the Climate Change Committee;
◦National Grid’s ‘Clean energy vision report’;
◦The ‘DPU 20-80 Notice of Filing and Public Hearing’;
◦‘Ramping Up Heat Pump Adoption in New York State’;
◦‘E3’s Technical Analysis of Decarbonization Pathways report’ for Massachusetts;
◦‘The Pathways to Carbon-Neutral NYC: Modernize, Reimagine, Reach’, produced by the New York City Mayor’s Office of Sustainability;
and searching for contradictory evidence in respect of management’s judgements.
We also held discussions with Deloitte specialists in other countries regarding the suitability of existing gas infrastructure for transporting hydrogen across both transmission and distribution gas assets as well as the potential cost effectiveness of green hydrogen.
We assessed the disclosures set out in note 1 to the financial statements and the sensitivity analysis set out in note 13 to the financial statements regarding the useful economic lives of the Group’s gas assets.
/s/ Deloitte LLP
London, United Kingdom
18 May 2022
The first accounting period we audited was 31 March 2018. In 2017, we began preparing for audit firm transition.
REPORT OF INDEPENDENT REGISTERED PUBLIC ACCOUNTING FIRM
To the shareholders and the Board of Directors of National Grid plc
Opinion on Internal Control over Financial Reporting
We have audited the internal control over financial reporting of National Grid plc (the “Company”) and subsidiaries (the “Group”) as of 31 March 2022, based on criteria established in Internal Control — Integrated Framework (2013) issued by the Committee of Sponsoring Organizations of the Treadway Commission (COSO). In our opinion, the Company maintained, in all material respects, effective internal control over financial reporting as of 31 March 2022, based on criteria established in Internal Control — Integrated Framework (2013) issued by COSO.
We have also audited, in accordance with the standards of the Public Company Accounting Oversight Board (United States) (PCAOB), the consolidated financial statements as of and for the year ended 31 March 2022, of the Group and our report dated 18 May 2022, expressed an unqualified opinion on those financial statements.
Basis for Opinion
The Group’s management is responsible for maintaining effective internal control over financial reporting and for its assessment of the effectiveness of internal control over financial reporting, included in the accompanying Internal control over financial reporting section appearing on page 253 of the Additional Information section. Our responsibility is to express an opinion on the Group’s internal control over financial reporting based on our audit. We are a public accounting firm registered with the PCAOB and are required to be independent with respect to the Group in accordance with the U.S. federal securities laws and the applicable rules and regulations of the Securities and Exchange Commission and the PCAOB.
We conducted our audit in accordance with the standards of the PCAOB. Those standards require that we plan and perform the audit to obtain reasonable assurance about whether effective internal control over financial reporting was maintained in all material respects. Our audit included obtaining an understanding of internal control over financial reporting, assessing the risk that a material weakness exists, testing and evaluating the design and operating effectiveness of internal control based on the assessed risk, and performing such other procedures as we considered necessary in the circumstances. We believe that our audit provides a reasonable basis for our opinion.
Definition and Limitations of Internal Control over Financial Reporting
A company’s internal control over financial reporting is a process designed to provide reasonable assurance regarding the reliability of financial reporting and the preparation of financial statements for external purposes in accordance with generally accepted accounting principles. A company’s internal control over financial reporting includes those policies and procedures that (1) pertain to the maintenance of records that, in reasonable detail, accurately and fairly reflect the transactions and dispositions of the assets of the company; (2) provide reasonable assurance that transactions are recorded as necessary to permit preparation of financial statements in accordance with generally accepted accounting principles, and that receipts and expenditures of the company are being made only in accordance with authorizations of management and directors of the company; and (3) provide reasonable assurance regarding prevention or timely detection of unauthorized acquisition, use, or disposition of the company’s assets that could have a material effect on the financial statements.
Because of its inherent limitations, internal control over financial reporting may not prevent or detect misstatements. Also, projections of any evaluation of effectiveness to future periods are subject to the risk that controls may become inadequate because of changes in conditions, or that the degree of compliance with the policies or procedures may deteriorate.
/s/ Deloitte LLP
London, United Kingdom
18 May 2022
| | | | | | | | | | | |
| Description | | |
| |
| Filed herewith |
| |
|
|
| |
| Incorporated by reference |
| | | |
| |
| Incorporated by reference |
| |
|
|
| |
| Incorporated by reference |
| |
|
|
| |
| Incorporated by reference |
| |
|
|
| |
| Incorporated by reference |
| |
|
|
| |
| Incorporated by reference |
| |
|
|
| |
| Incorporated by reference |
| |
|
|
| |
| Incorporated by reference |
| |
|
|
| |
| Incorporated by reference |
| |
|
|
| |
| Incorporated by reference |
| | | | | | | | | | | |
| |
|
|
| |
| Incorporated by reference |
| |
|
|
| |
| Incorporated by reference |
| | | |
| | | Incorporated by reference |
| | | |
| | | Incorporated by reference |
| | | |
| | | Filed herewith |
| | | |
| | | Filed herewith |
| | | |
| |
| Incorporated by reference |
| |
|
|
| | | Filed herewith |
| | | |
| |
| Incorporated by reference |
| |
|
|
| |
| Incorporated by reference |
| |
|
|
| |
| Incorporated by reference |
| |
|
|
| |
| Incorporated by reference |
| |
|
|
| | | | | | | | | | | |
| |
| Incorporated by reference |
| |
|
|
| |
| Incorporated by reference |
| |
|
|
| |
| Incorporated by reference |
| |
|
|
| |
| Incorporated by reference |
| |
|
|
| |
| Incorporated by reference |
| |
|
|
| |
| Incorporated by reference |
| |
|
|
| |
| Incorporated by reference |
| |
|
|
| |
| Incorporated by reference |
| |
|
|
| |
| Incorporated by reference |
| |
|
|
| |
| Incorporated by reference |
| |
|
|
| |
| Incorporated by reference |
| | | |
| |
| Incorporated by Reference |
| |
|
|
| |
| Filed herewith |
| |
|
|
| |
| Filed herewith |
| |
|
|
| |
| Filed herewith |
| |
|
|
| |
| Filed herewith |
| |
|
|
| |
| Incorporated by reference |
| |
|
|
| |
| Incorporated by reference |
| |
|
|
| | | Incorporated by reference |
| | | | | | | | | | | |
| | | |
| |
| Incorporated by reference |
| |
|
|
| |
| Incorporated by reference |
| |
|
|
| |
| Incorporated by reference |
| |
|
|
| |
| Incorporated by reference |
| |
|
|
| 8 | List of subsidiaries - The list of the Company’s significant subsidiaries as of 31 March 2022 is incorporated by reference to “Financial Statements—Notes to the consolidated financial statements—34. Subsidiary undertakings, joint venture and associates—Subsidiary undertakings” on pages 225-229 included in the Annual Report on Form 20-F for the financial year ended 31 March 2022. This list excludes subsidiaries that do not, in aggregate, constitute a “significant subsidiary” as defined in Rule 1-02(w) of Regulation S-X as at 31 March 2022. |
| Filed herewith |
| | | |
| |
| Filed herewith |
| |
|
|
| |
| Filed herewith |
| |
|
|
| |
| Filed herewith |
| |
|
|
| |
| Filed herewith |
| | | |
| | | Incorporated by reference |
* Portions of this exhibit have been redacted in compliance with Regulation S-K Item 601(b)(10). | | |
| |
|
|
The registrant hereby certifies that it meets all of the requirements for filing on Form 20-F and that it has duly caused and authorised the undersigned to sign this annual report on its behalf.
NATIONAL GRID PLC
By: /s/ Andrew Agg
Andrew Agg
Chief Financial Officer
London, England
7 June 2022