Table of Contents
SECURITIES AND EXCHANGE COMMISSION
WASHINGTON, D.C. 20549
FORM 6-K
Report of Foreign Private Issuer
Pursuant to Rule 13a-16 or 15d-16
of the Securities Exchange Act of 1934
For the month of December, 2015
Commission File Number 33-99720
ARAUCO AND CONSTITUTION PULP INC.
(Translation of registrant’s name into English)
El Golf 150
Fourteenth Floor
Santiago, Chile
(Address of principal executive offices)
Indicate by check mark whether the registrant files or will file annual reports under cover Form 20-F or Form 40-F.
Form 20-F x Form 40-F ¨
Indicate by check mark if the registrant is submitting the Form 6-K in paper as permitted by Regulation S-T Rule 101(b)(1): ¨
Indicate by check mark if the registrant is submitting the Form 6-K in paper as permitted by Regulation S-T Rule 101(b)(7): ¨
Indicate by check mark whether the registrant by furnishing the information contained in this Form is also thereby furnishing the information to the Commission pursuant to Rule 12g3-2(b) under the Securities Exchange Act of 1934.
Yes ¨ No x
If “Yes” is marked, indicate below the file number assigned to the registrant in connection with Rule 12g3-2(b): 82-
Table of Contents
Signature
Pursuant to the requirements of the Securities Exchange Act of 1934, the registrant has duly caused this report to be signed on its behalf by the undersigned, thereunto duly authorized.
| Celulosa Arauco y Constitución, S.A. | ||||||
| (Registrant) | ||||||
| Date: April 21, 2016 | By: | /s/ Matías Domeyko Cassel | ||||
| Name: | Matías Domeyko Cassel | |||||
| Title: | Chief Executive Officer | |||||
Table of Contents
ARAUCO AND CONSTITUTION PULP INC
| Item | Page | |||
| 1 | ||||
| 7 | ||||
| 9 | ||||
| 4. Unaudited Consolidated Statement of Changes in Net Equity |
11 | |||
| 12 | ||||
| 13 | ||||
Table of Contents
CELULOSA ARAUCO Y CONSTITUCION S.A.
AND SUBSIDIARIES
Ratio Analysis of the Consolidated Financial Statements
December 31, 2015
Amounts in thousands of U.S. dollars, except as indicated
1. ANALYSIS OF FINANCIAL POSITION
a) Statement of Financial Position
The principal components of assets and liabilities at each period, as follows:
| Assets |
12-31-2015 ThU.S.$ |
12-31-2014 ThU.S.$ |
||||||
| Current assets |
2,651,920 | 3,140,715 | ||||||
| Non-current assets |
11,154,987 | 11,607,182 | ||||||
|
|
|
|
|
|||||
| Total assets |
13,806,907 | 14,747,897 | ||||||
|
|
|
|
|
|||||
| Liabilities |
12-31-2015 ThU.S.$ |
12-31-2014 ThU.S.$ |
||||||
| Current liabilities |
1,034,251 | 1,547,086 | ||||||
| Non-current liabilities |
6,126,211 | 6,386,075 | ||||||
| Non–parent participation |
37,735 | 47,606 | ||||||
| Net equity attributable to parent company |
6,608,710 | 6,767,130 | ||||||
|
|
|
|
|
|||||
| Total net equity and liabilities |
13,806,907 | 14,747,897 | ||||||
|
|
|
|
|
|||||
As of December 31, 2015, total assets decreased by 6.38% or U.S.$941 million compared to December 31, 2014. This deviation was driven mainly by decreases in the balance of cash and cash equivalents, properties, plant and equipment, accounts receivable with related entities and biological assets.
Total liabilities, in turn, decreased by U.S.$773 million mainly attributable to a decrease in financial liabilities.
Set forth below are our main financial and operating indicators as of the dates and for the periods indicated:
| Liquidity ratios |
12-31-2015 | 12-31-2014 | ||||||
| Current Liquidity (current assets / current liabilities ) |
2.56 | 2.03 | ||||||
| Acid ratio (( current assets-inventories, biological assets) / current liabilities ) |
1.42 | 1.25 | ||||||
| Debt indicators |
12-31-2015 | 12-31-2014 | ||||||
| Debt to equity ratio (total liabilities / equity) |
1.08 | 1.16 | ||||||
| Short-term debt to total debt (current liabilities / total liabilities) |
0.14 | 0.19 | ||||||
| Long-term debt to total debt (non-current liabilities / total liabilities) |
0.86 | 0.81 | ||||||
| 12-31-2015 | 31-12-2014 | |||||||
| Financial expenses coverage ratio (earnings before taxes + interest expense / interest expense) |
2.89 | 3.41 | ||||||
1
Table of Contents
CELULOSA ARAUCO Y CONSTITUCION S.A.
AND SUBSIDIARIES
Ratio Analysis of the Consolidated Financial Statements
December 31, 2015
Amounts in thousands of U.S. dollars, except as indicated
| Activity ratio |
12-31-2015 | 12-31-2014 | ||||||
| Inventory turnover-time (cost of sales / inventories + current biological assets) |
2.95 | 3.10 | ||||||
| Inventory turnover-time (excluding biological assets) (Cost of sales /inventory) |
3.89 | 4.07 | ||||||
| Inventory permanence-days ((inventories + biological assets) /cost of sales) |
122.16 | 116.19 | ||||||
| Inventory permanence-days (excluding biological assets) (inventory / cost of sales) |
92.45 | 88.38 | ||||||
As of December 31, 2015 the short-term debt represented 14% of total liabilities (20% as of December 31, 2014).
Our financial expenses coverage ratio decreased from 3.41 to 2.89 as of December 31, 2014, mainly due to the higher earnings before taxes for 2014, compared to 2015.
b) Statements of income
Income before income tax
Income before income tax registered a profit of U.S.$497 million compared to a profit of U.S.$593 million in 2014. The negative variation of U.S.$95 million is explained by the factors described in the following table:
| Item |
MU.S.$ | |||
| Gross margin |
(53 | ) | ||
| Distribution and Administrative Expenses |
27 | |||
| Other income/ expenses by function |
(41 | ) | ||
| Financial income/expenses |
3 | |||
| Exchange differences |
(31 | ) | ||
|
|
|
|||
| Net change in income before income tax |
(95 | ) | ||
|
|
|
|||
The main indicators related to result accounts and the details of revenues and operation costs are as follows:
| Revenues |
12-31-2015 ThU.S.$ |
12-31-2014 ThU.S.$ |
||||||
| Pulp |
2,363,973 | 2,343,020 | ||||||
| Sawn timber |
785,939 | 873,493 | ||||||
| Panels |
1,847,272 | 1,943,711 | ||||||
| Forestry |
116,368 | 148,517 | ||||||
| Other |
33,188 | 33,902 | ||||||
|
|
|
|
|
|||||
| Total revenues |
5,146,740 | 5,342,643 | ||||||
|
|
|
|
|
|||||
2
Table of Contents
CELULOSA ARAUCO Y CONSTITUCION S.A.
AND SUBSIDIARIES
Ratio Analysis of the Consolidated Financial Statements
December 31, 2015
Amounts in thousands of U.S. dollars, except as indicated
| Sales costs |
12-31-2015 ThU.S.$ |
12-31-2014 ThU.S.$ |
||||||
| Wood |
641,821 | 808,991 | ||||||
| Forestry work |
636,100 | 655,257 | ||||||
| Depreciation and amortization |
371,851 | 323,306 | ||||||
| Other costs |
1,861,653 | 1,866,592 | ||||||
|
|
|
|
|
|||||
| Total sales costs |
3,511,425 | 3,654,146 | ||||||
|
|
|
|
|
|||||
| Profitability index |
12-31-2015 | 12-31-2014 | ||||||
| Profitability on equity |
5.46 | 6.30 | ||||||
| Profitability on assets |
2.58 | 2.99 | ||||||
| Return on operating assets |
4.13 | 4.24 | ||||||
| Profitability ratios |
12-31-2015 | 12-31-2014 | ||||||
| Income per share (U.S.$) (1) |
3.21 | 3.82 | ||||||
| Income after tax (ThU.S.$) (2) |
367,711 | 436,890 | ||||||
| Gross margin (ThU.S.$) |
1,635,315 | 1,688,497 | ||||||
| Financial costs (ThU.S.$) |
(262,962 | ) | (246,473 | ) | ||||
| (1) | Earnings per share refer to the profit to net equity to parent company. |
| (2) | Includes interest. |
| EBITDA |
12-31-2015 MU.S.$ |
12-31-2014 MU.S.$ |
||||||
| Gain (loss) |
367.7 | 436.9 | ||||||
| Finance costs |
263.0 | 246.5 | ||||||
| Financial income |
(50.3 | ) | (30.8 | ) | ||||
| Expenses for income tax |
129.7 | 155.9 | ||||||
| EBIT |
710.1 | 808.5 | ||||||
| Depreciation and amortization |
400.1 | 353.4 | ||||||
| EBITDA |
1,110.2 | 1,162.0 | ||||||
| Cost at fair value of the harvest |
306.7 | 353.3 | ||||||
| Gain from changes in fair value of biological assets |
(210.5 | ) | (284.5 | ) | ||||
| Exchange difference |
41.2 | 10.0 | ||||||
| Others* |
34.9 | 31.5 | ||||||
| Adjusted EBITDA |
1,282.4 | 1,272.2 | ||||||
| * | 2015: Forest loss provision MU.S.$34.9; 2014: Forest roads amortization MU.S.$31.5. |
2. MAIN SOURCES OF FINANCING
Arauco’s financing needs are mainly covered through the capital markets, with bond issuances and credits obtained from banks and financial institutions serving as the main sources of financing. For short-term borrowing, Arauco follows a liquidity policy which indicates the amounts and institutions from which it can borrow according to several conditions defined in the policy. In the case of long-term debt, corporate bond issuances in the local market and also in international markets are used as sources of new resources. Another source of long-term financing corresponds to borrowings from banks and financial institutions around the world.
3
Table of Contents
CELULOSA ARAUCO Y CONSTITUCION S.A.
AND SUBSIDIARIES
Ratio Analysis of the Consolidated Financial Statements
December 31, 2015
Amounts in thousands of U.S. dollars, except as indicated
3. DIFFERENCE BETWEEN ECONOMIC VALUES AND BOOK ASSETS
Assets and liabilities are presented in the Financial Statements according to International Financial Reporting Standards and instructions issued by the Chilean Securities Commission.
We believe that there are no material differences between the economic value of our assets and the value reflected in these Financial Statements.
4. MARKET SITUATION
Pulp Division
The last quarter of 2015 experienced a drop in prices, due to changes in demand and supply. Uncertainty and economic instability in China - an important driver in the pulp market—and other countries gave way to less active demand. On the supply side, new pulp mills coming into operation this quarter as well as last quarter led to fairly oversupplied markets. Inventory levels were relatively stable compared to the third quarter, with long fiber inventories decreasing by one day to 29 days and flat inventories for short fiber stocks at 39 days.
Long and short fiber prices fell gradually throughout the quarter in Asia, shrinking approximately US$ 50 and US$ 65 per ton respectively, which translates into an 8% and 10% decrease. China´s weakening economy and higher volatility has affected the paper industry in general, even reaching higher inventory levels despite declining production. Paper producers fix prices in dollars that are sometimes paid 90 to 120 days later; therefore, the devaluation of the Yuan has been a critical factor during this quarter. Other Asian countries have had a similar development; their markets are decisively smaller and therefore are practically price-takers.
European markets also saw negative price adjustments, although more moderate than in Asia. Prices for both fibers decreased approximately US$ 35, which translates into a 6% decline for long fiber and 4% decline for short fiber. Active demand has been offset by oversupply. The paper market has recovered and producers have been ordering at pertinent levels, weeks and even months in advance. With this in mind, there are possibilities that the price will increase in some paper markets, but will not in turn affect pulp prices. This is due to high inventory levels as well as heightened production. Competition is fairly local, with European producers using more timely and competitive logistics than other producers in the long fiber market.
In the Middle East, markets remain active and buyers are benefiting from Europe’s oversupply and China’s instability and diminishing demand to lower prices. Long fiber decreased about 3% during the quarter, while short fiber decreased about 6%.
Demand in Latin America remains stable, with the exception of Brazil, whose paper demand has deteriorated. Arauco´s pulp mill located in Argentina only produces long fiber pulp, which has the advantage of mainly competing with imports from the United States.
It is important to note that freight expenses fell during this quarter, especially in container shipments. This decrease affected the last quarter of 2015 and should be seen well into the first quarter of 2016, since there are many medium term contracts with buyers. Lower freight expenses means more possibilities to reach other destinations and be more competitive in markets too far away from Chile.
4
Table of Contents
CELULOSA ARAUCO Y CONSTITUCION S.A.
AND SUBSIDIARIES
Ratio Analysis of the Consolidated Financial Statements
December 31, 2015
Amounts in thousands of U.S. dollars, except as indicated
Programmed annual maintenances in the Nueva Aldea Plant and Valdivia Plant suffered no setbacks and went according to plan during this quarter
Sawn Timber Division
Sawn timber markets continue to decline during the fourth quarter of 2015, showing lower sales in volume and revenues in comparison to the third quarter of 2015. More supply has been coming from different producers that have taken advantage of their devalued currencies and started to compete in many of our principal markets.
In North America, our moldings continue to thrive as the constructions and renovations market maintains its momentum. However, higher export volumes from Brazil have put pressure on prices, especially during this fourth quarter.
The rest of Latin America continues to show a stable level of demand, which has enabled us to increase our market share and commercialize the desired product mix.
Panels Division
Sales have experienced a decline during the last quarter of 2015 when compared to the same quarter of the year before; sales decreased 2.4% in total during the year 2015 when compared to 2014. This is due to two principal factors: the continuous deceleration of MDF demand in the Brazilian market, and a higher supply of plywood from Chile and Brazil which has started to compete in our traditional markets, thus decreasing prices.
MDP sales from the Teno Mill have risen throughout 2015, explained by more demand as well as a better sales mix.
Particleboard sales in North America kept strengthening thanks to our value added products, and demand remained stable. However, sales declined due to some production problems in some of our mills.
The MDF market has been slower in North America, due to lower demand and more competition from Canadian and Brazilian producers that have taken advantage of their currency depreciation to export more of their products. This effect has translated in lower price for MDF panels and moldings.
The devaluation of the Real in Brazil, along with a lower demand in local markets and higher supply levels have put pressure in domestic prices throughout the year. This made export volumes increase and at very competitive prices. The ability to export MDF and particleboards from Argentina remained hindered, which meant that practically everything produced within this country was sold locally.
5
Table of Contents
CELULOSA ARAUCO Y CONSTITUCION S.A.
AND SUBSIDIARIES
Ratio Analysis of the Consolidated Financial Statements
December 31, 2015
Amounts in thousands of U.S. dollars, except as indicated
5. ANALYSIS OF CASH FLOW
The main components of net cash flow in each period are as follows:
| 12-31-2015 ThU.S.$ |
12-31-2014 ThU.S.$ |
|||||||
| Positive (negative) Cash flow |
||||||||
| Cash flow from operating activities |
853,650 | 985,175 | ||||||
| Cash flow from (used in) financing activities: |
||||||||
| Loan and bond payments |
(668,320 | ) | 135,006 | |||||
| Dividend payments |
(143,003 | ) | (141,089 | ) | ||||
| Others |
(853 | ) | (1,802 | ) | ||||
| Cash flow from (used in) investment activities: |
||||||||
| Loans to related companies |
(23,628 | ) | (158,797 | ) | ||||
| Incorporation and sale of property, plant and equipment |
(315,525 | ) | (396,304 | ) | ||||
| Incorporation and sale of biological assets |
(125,626 | ) | (101,881 | ) | ||||
| Acquisition of subsidiaries |
(10,090 | ) | ||||||
| Dividend received |
6,350 | 12,073 | ||||||
| Others |
(9,261 | ) | (10,249 | ) | ||||
|
|
|
|
|
|||||
| Positive Net cash flow (negative) |
(436,306 | ) | 322,132 | |||||
|
|
|
|
|
|||||
The financing cash flow has a negative balance of U.S.$812 million in the current period with variations on the previous period (negative balance of U.S.$8 million) mainly as a result of increased payment of financial liabilities.
In relation to the flow of investment at the end of the current period, there was a negative balance of U.S.$478 million (U.S.$655 million in 2014), mainly due to lower disbursements from the acquisition of properties, plant, equipment, minors loans to related entities in 2015.
6. MARKET RISK ANALYSIS
In respect of the economic risks resulting from interest rate variations, the Company maintains, as of December 31, 2015, a ratio of fixed rate debt to total consolidated debt of approximately 85.7%, which it believes is consistent with industry standards. The Company does not participate in futures trading as to maintain one of the lowest cost structures in the industry, the risks for price fluctuations are bounded.
The Company and most of its subsidiaries maintain their accounting records and prepare their financial statements in U.S. dollars. Both the accounts receivable and most financial liabilities are denominated in U.S. dollars or are covered by an exchange rate swap, as well as most of their revenues. As a result, exposure to changes in the exchange rate has decreased significantly.
In the report to the Consolidated Financial Statements as of December 31, 2015, a detailed analysis of the risks associated with the business of Arauco is available (See Note 23).
6
Table of Contents
CELULOSA ARAUCO Y CONSTITUCION S.A.
AND SUBSIDIARIES
Unaudited Consolidated Financial Statements
December 31, 2015
Amounts in thousands of U.S. dollars, except as indicated
CONSOLIDATED STATEMENTS OF FINANCIAL POSITION
| Note | 12-31-2015 ThU.S.$ |
12-31-2014 ThU.S.$ |
||||||||||
| Assets |
||||||||||||
| Current Assets |
||||||||||||
| Cash and cash equivalents |
5 | 500,025 | 971,152 | |||||||||
| Other current financial assets |
23 | 32,195 | 7,633 | |||||||||
| Other current non-financial assets |
25 | 133,956 | 177,728 | |||||||||
| Trade and other current receivables |
23 | 733,322 | 731,908 | |||||||||
| Accounts receivable from related companies |
13 | 3,124 | 4,705 | |||||||||
| Current Inventories |
4 | 909,988 | 893,573 | |||||||||
| Current biological assets |
20 | 272,037 | 307,551 | |||||||||
| Current tax assets |
64,079 | 38,477 | ||||||||||
| Total Current Assets other than assets or disposal groups classified as held for sale |
2,648,726 | 3,132,727 | ||||||||||
| Non-Current Assets or disposal groups classified as held for sale |
22 | 3,194 | 7,988 | |||||||||
| Non-Current Assets or disposal groups classified as held for sale or as held for distribution to owners |
3,194 | 7,988 | ||||||||||
| Total Current Assets |
2,651,920 | 3,140,715 | ||||||||||
| Non-Current Assets |
23 | |||||||||||
| Other non-current financial assets |
25 | 595 | 5,024 | |||||||||
| Other non-current non-financial assets |
23 | 125,516 | 101,094 | |||||||||
| Trade and other non-current receivables |
15,270 | 31,001 | ||||||||||
| Related party receivables, non current |
13 | 0 | 151,519 | |||||||||
| Investments accounted for using equity method |
15 | 264,812 | 326,045 | |||||||||
| Intangible assets other than goodwill |
19 | 88,112 | 93,258 | |||||||||
| Goodwill |
17 | 69,475 | 82,573 | |||||||||
| Property, plant and equipment |
7 | 6,896,396 | 7,119,583 | |||||||||
| Non-current biological assets |
20 | 3,554,560 | 3,538,802 | |||||||||
| Deferred tax assets |
140,251 | 158,283 | ||||||||||
| Total non-Current Assets |
11,154,987 | 11,607,182 | ||||||||||
| Total Assets |
13,806,907 | 14,747,897 | ||||||||||
|
|
|
|
|
|||||||||
The accompanying notes are an integral part of these consolidated financial statements.
7
Table of Contents
CELULOSA ARAUCO Y CONSTITUCION S.A.
AND SUBSIDIARIES
Unaudited Consolidated Financial Statements
December 31, 2015
Amounts in thousands of U.S. dollars, except as indicated
CONSOLIDATED STATEMENTS OF FINANCIAL POSITION (continued)
| Note | 12-31-2015 ThU.S.$ |
12-31-2014 ThU.S.$ |
||||||||||
| Equity and liabilities |
||||||||||||
| Liabilities |
||||||||||||
| Current Liabilities |
||||||||||||
| Other current financial liabilities |
23 | 296,038 | 742,343 | |||||||||
| Trade and other current payables |
23 | 583,018 | 630,406 | |||||||||
| Accounts payable to related companies |
13 | 7,141 | 6,036 | |||||||||
| Other current provisions |
18 | 858 | 2,535 | |||||||||
| Current tax liabilities |
10,976 | 25,860 | ||||||||||
| Current provisions for employee benefits |
10 | 4,497 | 3,590 | |||||||||
| Other current non-financial liabilities |
25 | 131,723 | 136,316 | |||||||||
| Total current liabilities other than assets included in disposal groups classified as held for sale |
1,034,251 | 1,547,086 | ||||||||||
| Total Current Liabilities |
1,034,251 | 1,547,086 | ||||||||||
| Non-Current Liabilities |
||||||||||||
| Other non-current financial liabilities |
23 | 4,236,965 | 4,453,819 | |||||||||
| Other non-current provisions |
18 | 34,541 | 64,529 | |||||||||
| Deferred tax liabilities |
6 | 1,755,528 | 1,757,149 | |||||||||
| Non-current provisions for employee benefits |
10 | 51,936 | 48,582 | |||||||||
| Other non-current non-financial liabilities |
25 | 47,241 | 61,996 | |||||||||
| Total non - current liabilities |
6,126,211 | 6,386,075 | ||||||||||
| Total liabilities |
7,160,462 | 7,933,161 | ||||||||||
| Equity |
||||||||||||
| Issued capital |
353,618 | 353,618 | ||||||||||
| Retained earnings |
7,204,452 | 6,984,564 | ||||||||||
| Other reserves |
(949,360 | ) | (571,052 | ) | ||||||||
| Equity attributable to parent company |
6,608,710 | 6,767,130 | ||||||||||
| Non-controlling interests |
37,735 | 47,606 | ||||||||||
| Total equity |
6,646,445 | 6,814,736 | ||||||||||
| Total equity and liabilities |
13,806,907 | 14,747,897 | ||||||||||
|
|
|
|
|
|||||||||
The accompanying notes are an integral part of these consolidated financial statements.
8
Table of Contents
CELULOSA ARAUCO Y CONSTITUCION S.A.
AND SUBSIDIARIES
Unaudited Consolidated Financial Statements
December 31, 2015
Amounts in thousands of U.S. dollars, except as indicated
CONSOLIDATED STATEMENTS OF PROFIT OR LOSS
| January-December | ||||||||||||
| Note | 2015 ThU.S.$ |
2014 ThU.S.$ |
||||||||||
| Income Statement |
||||||||||||
| Revenue |
9 | 5,146,740 | 5,342,643 | |||||||||
| Cost of sales |
3 | (3,511,425 | ) | (3,654,146 | ) | |||||||
| Gross profit |
1,635,315 | 1,688,497 | ||||||||||
| Other income |
3 | 273,026 | 368,924 | |||||||||
| Distribution costs |
3 | (528,470 | ) | (556,837 | ) | |||||||
| Administrative expenses |
3 | (551,977 | ) | (550,809 | ) | |||||||
| Other expense |
3 | (83,388 | ) | (138,769 | ) | |||||||
| Profit (loss) from operating activities |
744,506 | 811,006 | ||||||||||
| Finance income |
3 | 50,284 | 30,772 | |||||||||
| Finance costs |
3 | (262,962 | ) | (246,473 | ) | |||||||
| Share of profit (loss) of associates and joint ventures accounted for using equity method |
15 | 6,748 | 7,481 | |||||||||
| Exchange rate differences |
(41,171 | ) | (9,961 | ) | ||||||||
| Income before income tax |
497,405 | 592,825 | ||||||||||
| Income Tax |
6 | (129,694 | ) | (155,935 | ) | |||||||
| Net Income |
367,711 | 436,890 | ||||||||||
|
|
|
|
|
|||||||||
| Net income attributable to |
||||||||||||
| Net income attributable to parent company |
362,689 | 431,958 | ||||||||||
| Income attributable to non-controlling interests |
5,022 | 4,932 | ||||||||||
| Profit (loss) |
367,711 | 436,890 | ||||||||||
|
|
|
|
|
|||||||||
| Basic earnings per share |
||||||||||||
| Basic earnings per share from continuing operations |
0.0032051 | 0.0038172 | ||||||||||
|
|
|
|
|
|||||||||
| Basic earnings per share |
0.0032051 | 0.0038172 | ||||||||||
|
|
|
|
|
|||||||||
| Earnings per diluted shares |
||||||||||||
| Earnings per diluted share from continuing operations |
0.0032051 | 0.0038172 | ||||||||||
|
|
|
|
|
|||||||||
| Earnings per diluted share |
0.0032051 | 0.0038172 | ||||||||||
|
|
|
|
|
|||||||||
The accompanying notes are an integral part of these consolidated financial statements.
9
Table of Contents
CELULOSA ARAUCO Y CONSTITUCION S.A.
AND SUBSIDIARIES
Unaudited Consolidated Financial Statements
December 31, 2015
Amounts in thousands of U.S. dollars, except as indicated
CONSOLIDATED STATEMENTS OF COMPREHENSIVE INCOME
| January-December | ||||||||||||
| Note | 2015 ThU.S.$ |
2014 ThU.S.$ |
||||||||||
| Profit (loss) |
367,711 | 436,890 | ||||||||||
| Components of other comprehensive income that will not be reclassified to profit or loss before tax: |
||||||||||||
| Other comprehensive income before tax actuarial gains losses on defined Benefit plans |
(1,530 | ) | (12,829 | ) | ||||||||
| Share of other comprehensive income of associates and joint ventures accounted for using equity method that will not be reclassified to profit or loss before tax |
(781 | ) | (4,781 | ) | ||||||||
| Other Comprehensive Income that will not be reclassified to profit or loss before tax |
(2,311 | ) | (17,610 | ) | ||||||||
| Components of other comprehensive income that will be reclassified to profit or loss before tax: |
||||||||||||
| Exchange differences on translation |
||||||||||||
| Gains (losses) on exchange differences on translation, before tax |
11 | (385,109 | ) | (163,844 | ) | |||||||
| Other Comprehensive Income before tax exchange differences on translation |
(385,109 | ) | (163,844 | ) | ||||||||
| Cash flow hedges |
||||||||||||
| Gains (losses) on cash flow hedges, before tax |
11,859 | (43,228 | ) | |||||||||
| Recycle of cash flow hedges to profit or loss before tax |
(16,122 | ) | 949 | |||||||||
| Other Comprehensive Income before tax Cash flow hedges |
(4,263 | ) | (42,279 | ) | ||||||||
| Other Comprehensive income that will be reclassified to profit or loss before tax |
(389,372 | ) | (206,123 | ) | ||||||||
| Income tax relating to components of other comprehensive Income that will not be reclassified to profit or loss before tax |
||||||||||||
| Income tax relating to defined benefit plans of other comprehensive income |
649 | 3,404 | ||||||||||
| Income tax relating to components of other comprehensive Income that will be reclassified to profit or loss before tax |
||||||||||||
| Income tax relating to cash flow hedges of other comprehensive income |
6 | 1,889 | 10,764 | |||||||||
| Other comprehensive income |
(389,145 | ) | (209,565 | ) | ||||||||
| Comprehensive income |
(21,434 | ) | 227,325 | |||||||||
|
|
|
|
|
|||||||||
| Comprehensive Income attributable to |
||||||||||||
| Comprehensive income, attributable to owners of parent company |
(15,619 | ) | 226,866 | |||||||||
| Comprehensive income, attributable to non-controlling interests |
(5,815 | ) | 459 | |||||||||
| Total comprehensive income |
(21,434 | ) | 227,325 | |||||||||
|
|
|
|
|
|||||||||
The accompanying notes are an integral part of these consolidated financial statements.
10
Table of Contents
CELULOSA ARAUCO Y CONSTITUCION S.A.
AND SUBSIDIARIES
Unaudited Consolidated Financial Statements
December 31, 2015
Amounts in thousands of U.S. dollars, except as indicated
CONSOLIDATED STATEMENTS OF CHANGES IN EQUITY
| 12-31-2015 |
Issue Capital ThU.S.$ |
Reserve of exchange differences on translation ThU.S.$ |
Reserve of cash flow hedges ThU.S.$ |
Reserve of actuarial gains or losses on defined benefit plans ThU.S.$ |
Several Other Reserves ThU.S.$ |
Other Reserves ThU.S.$ |
Retained Earnings ThU.S.$ |
Equity attributable to owners of parent T.hU.S.$ |
Non - controlling interests ThU.S.$ |
Total Equity ThU.S.$ |
||||||||||||||||||||||||||||||
| Opening balance at 01/01/2015 |
353,618 | (498,495 | ) | (53,022 | ) | (15,790 | ) | (3,745 | ) | (571,052 | ) | 6,984,564 | 6,767,130 | 47,606 | 6,814,736 | |||||||||||||||||||||||||
| Changes in Equity: |
||||||||||||||||||||||||||||||||||||||||
| Comprehensive income |
||||||||||||||||||||||||||||||||||||||||
| Net income |
362,689 | 362,689 | 5,022 | 367,711 | ||||||||||||||||||||||||||||||||||||
| Other comprehensive income, net of tax |
(374,275 | ) | (2,374 | ) | (878 | ) | (781 | ) | (378,308 | ) | (378,308 | ) | (10,837 | ) | (389,145 | ) | ||||||||||||||||||||||||
| Comprehensive income |
0 | (374,275 | ) | (2,374 | ) | (878 | ) | (781 | ) | (378,308 | ) | 362,689 | (15,619 | ) | (5,815 | ) | (21,434 | ) | ||||||||||||||||||||||
| Dividends |
(142,801 | ) | (142,801 | ) | (3,228 | ) | (146,029 | ) | ||||||||||||||||||||||||||||||||
| Increase (decrease) through for transfers and other changes equity |
0 | 0 | (828 | ) | (828 | ) | ||||||||||||||||||||||||||||||||||
| Changes in equity |
0 | (374,275 | ) | (2,374 | ) | (878 | ) | (781 | ) | (378,308 | ) | 219,888 | (158,420 | ) | (9,871 | ) | (168,291 | ) | ||||||||||||||||||||||
| Closing balance at 12/31/2015 |
353,618 | (872,770 | ) | (55,396 | ) | (16,668 | ) | (4,526 | ) | (949,360 | ) | 7,204,452 | 6,608,710 | 37,735 | 6,646,445 | |||||||||||||||||||||||||
|
|
|
|
|
|
|
|
|
|
|
|
|
|
|
|
|
|
|
|
|
|||||||||||||||||||||
| 12-31-2014 |
Issue Capital ThU.S.$ |
Reserve of exchange differences on translation ThU.S.$ |
Reserve of cash flow hedges ThU.S.$ |
Reserve of actuarial gains or losses on defined benefit plans ThU.S.$ |
Several Other Reserves ThU.S.$ |
Other Reserves ThU.S.$ |
Retained Earnings ThU.S.$ |
Equity attributable to owners of parent T.hU.S.$ |
Non - controlling interests ThU.S.$ |
Total Equity ThU.S.$ |
||||||||||||||||||||||||||||||
| Opening balance at 01/01/2014 |
353,618 | (339,105 | ) | (21,507 | ) | (6,384 | ) | 1,036 | (365,960 | ) | 7,004,640 | 6,992,298 | 52,242 | 7,044,540 | ||||||||||||||||||||||||||
| Changes in Equity: |
||||||||||||||||||||||||||||||||||||||||
| Comprehensive income |
||||||||||||||||||||||||||||||||||||||||
| Net income |
431,958 | 431,958 | 4,932 | 436,890 | ||||||||||||||||||||||||||||||||||||
| Other comprehensive income, net of tax |
(159,390 | ) | (31,515 | ) | (9,406 | ) | (4,781 | ) | (205,092 | ) | (205,092 | ) | (4,473 | ) | (209,565 | ) | ||||||||||||||||||||||||
| Comprehensive income |
0 | (159,390 | ) | (31,515 | ) | (9,406 | ) | (4,781 | ) | (205,092 | ) | 431,958 | 226,866 | 459 | 227,325 | |||||||||||||||||||||||||
| Dividends |
(159,879 | ) | (159,879 | ) | (4,533 | ) | (164,412 | ) | ||||||||||||||||||||||||||||||||
| Increase (decrease) for transfer and other changes |
(292,155 | ) | (292,155 | ) | (562 | ) | (292,717 | ) | ||||||||||||||||||||||||||||||||
| Changes in equity |
0 | (159,390 | ) | (31,515 | ) | (9,406 | ) | (4,781 | ) | (205,092 | ) | (20,076 | ) | (225,168 | ) | (4,636 | ) | (229,804 | ) | |||||||||||||||||||||
| Closing balance at 12/31/2014 |
353,618 | (498,495 | ) | (53,022 | ) | (15,790 | ) | (3,745 | ) | (571,052 | ) | 6,984,564 | 6,767,130 | 47,606 | 6,814,736 | |||||||||||||||||||||||||
|
|
|
|
|
|
|
|
|
|
|
|
|
|
|
|
|
|
|
|
|
|||||||||||||||||||||
The accompanying notes are an integral part of these consolidated financial statements.
11
Table of Contents
CELULOSA ARAUCO Y CONSTITUCION S.A.
AND SUBSIDIARIES
Unaudited Consolidated Financial Statements
December 31, 2015
Amounts in thousands of U.S. dollars, except as indicated
CONSOLIDATED STATEMENTS OF CASH FLOWS
| For the periods ended December 31, | ||||||||
| 2015 ThU.S.$ |
2014 ThU.S.$ |
|||||||
| STATEMENTS OF CASH FLOWS |
||||||||
| Cash Flows from (used in) Operating Activities |
||||||||
| Classes of cash receipts from operating activities |
||||||||
| Receipts from sales of goods and rendering of services |
5,733,693 | 5,629,175 | ||||||
| Receipts from collections from insurance claims, annuities and other policy benefits |
4,715 | 5,100 | ||||||
| Other cash receipts from operating activities |
332,981 | 359,539 | ||||||
| Classes of cash payments |
||||||||
| Payments to suppliers for goods and services |
(4,260,587 | ) | (4,190,295 | ) | ||||
| Payments to and on behalf of employees |
(490,723 | ) | (499,370 | ) | ||||
| Other cash payments from operating activities |
(169,237 | ) | (122,027 | ) | ||||
| Interest paid |
(229,894 | ) | (204,915 | ) | ||||
| Interest received |
17,720 | 46,658 | ||||||
| Income taxes refund (paid) |
(87,784 | ) | (37,285 | ) | ||||
| Other (outflows) inflows of cash, net |
2,766 | (1,405 | ) | |||||
| Net Cash flows from Operating Activities |
853,650 | 985,175 | ||||||
|
|
|
|
|
|||||
| Cash flows (used in) investing activities |
||||||||
| Cash flow used in obtaining control of subsidiaries or other businesses |
(10,090 | ) | 0 | |||||
| Cash flow used in the purchase of non-controlling interests |
(814 | ) | 0 | |||||
| Other payments to purchase associates and joint ventures |
0 | (1,882 | ) | |||||
| Loans to related parties |
(23,628 | ) | (158,797 | ) | ||||
| Proceeds from sale of property, plant and equipment |
5,860 | 63,492 | ||||||
| Purchase of property, plant and equipment |
(321,385 | ) | (459,796 | ) | ||||
| Proceeds from sales of intangible assets |
99 | 0 | ||||||
| Purchase of intangible assets |
(10,395 | ) | (10,101 | ) | ||||
| Proceeds from other long-term assets |
506 | 40,257 | ||||||
| Purchase of other non-current assets |
(126,132 | ) | (142,138 | ) | ||||
| Dividends received |
6,350 | 12,073 | ||||||
| Other outflows of cash, net |
1,849 | 1,734 | ||||||
| Cash flows used in Investing Activities |
(477,780 | ) | (655,158 | ) | ||||
|
|
|
|
|
|||||
| Cash flows from (used in) Financing Activities |
||||||||
| Total loans obtained |
280,863 | 1,035,601 | ||||||
| Loans obtained in long term |
890 | 829,348 | ||||||
| Proceeds from short-term borrowings |
279,973 | 206,253 | ||||||
| Repayments of borrowings |
(949,183 | ) | (900,595 | ) | ||||
| Dividends paid by subsidiaries |
(143,003 | ) | (141,089 | ) | ||||
| Other inflows of cash, net |
(853 | ) | (1,802 | ) | ||||
| Cash flows from (used in) Financing Activities |
(812,176 | ) | (7,885 | ) | ||||
|
|
|
|
|
|||||
| Net increase (decrease) in Cash and Cash Equivalents before effect of exchange rate changes |
(436,306 | ) | 322,132 | |||||
| Effect of exchange rate changes on cash and cash equivalents |
(34,821 | ) | (18,192 | ) | ||||
|
|
|
|
|
|||||
| Net increase (decrease) of Cash and Cash equivalents |
(471,127) | 303,940 | ||||||
| Cash and cash equivalents, at the beginning of the period |
971,152 | 667,212 | ||||||
| Cash and cash equivalents, at the end of the period |
500,025 | 971,152 | ||||||
|
|
|
|
|
|||||
The accompanying notes are an integral part of these consolidated financial statements.
12
Table of Contents
CELULOSA ARAUCO Y CONSTITUCION S.A.
AND SUBSIDIARIES
Unaudited Consolidated Financial Statements
December 31, 2015
Amounts in thousands of U.S. dollars, except as indicated
NOTES TO CONSOLIDATED FINANCIAL STATEMENTS AS OF DECEMBER 31, 2015 AND 2014
NOTE 1. PRESENTATION OF CONSOLIDATED FINANCIAL STATEMENTS
Entity Information
Celulosa Arauco y Constitución S.A. and subsidiaries, (hereafter “Arauco” or the “Company”), tax identification number 93,458,000-1, is a closely held corporation, that was registered in the Securities Registry (the “Registry”) of the Superintendency of Securities and Insurance (the “SVS”) as No. 042 on June 14, 1982. Additionally, the Company is registered as a non-accelerated filer with the Securities and Exchange Commission (SEC) of the United States of America.
Forestal Cholguán S.A., subsidiary of Arauco, is also registered in the Securities Registry as No. 030.
The Company’s head office address is El Golf Avenue 150, floor 14th, Las Condes, Santiago, Chile.
Arauco is principally engaged in the production and sale of forestry and timber products. Its main operations are focused on the following business areas: Pulp, Plywood and Fiberboard Panels, Sawn Timber and Forestry.
Arauco is controlled by Empresas Copec S.A., which owns 99.9780% of Arauco, and is registered in the Securities Registry as No. 0028. Each of the above mentioned companies is subject to the oversight of the SVS.
The ultimate shareholders of Arauco are Mrs. Maria Noseda Zambra de Angelini, Mr. Roberto Angelini Rossi and Mrs. Patricia Angelini Rossi through the entity Inversiones Angelini y Cia. Ltda., which owns 63.4015% of the shares of AntarChile S.A., the controlling shareholder of our parent company Empresas Copec S.A.
Arauco’s Consolidated Financial Statements were prepared on a going concern basis.
Presentation of Consolidated Financial Statements
The Financial Statements presented by Arauco are comprised by the following:
| • | Consolidated Statements of Financial Position as of December 31, 2015 and 2014. |
| • | Consolidated Statements of Profit or Loss by function for the years ended December 31, 2015 and 2014. |
| • | Statements of Other Consolidated Comprehensive Income for the years ended December 31, 2015 and 2014. |
| • | Consolidated Statements of Changes in Equity for the years ended December 31, 2015 and 2014. |
| • | Consolidated Statements of Cash Flows for the years ended December 31, 2015 and 2014. |
| • | Explanatory disclosures (notes) |
13
Table of Contents
CELULOSA ARAUCO Y CONSTITUCION S.A.
AND SUBSIDIARIES
Unaudited Consolidated Financial Statements
December 31, 2015
Amounts in thousands of U.S. dollars, except as indicated
Period Covered by the Consolidated Financial Statements
As of December 31, 2015 and 2014 and for the periods between January 1 and December 31, 2015 and 2014
Date of Approval of Consolidated Financial Statements
These consolidated financial statements were approved by the Board of Directors of the Company (the “Board”) at the Extraordinary Session N° 544 held on March 9, 2016 for the year ended December 31, 2015.
Abbreviations used in this report:
IFRS - International Financial Reporting Standards
IASB - International Accounting Standards Board
IAS - International Accounting Standards
IFRIC - International Financial Reporting Standards Interpretations Committee
MU.S.$ - Millions of U.S. dollars
ThU.S.$ - Thousands of U.S. dollars
U.F. - Inflation index-linked units of account
EBITDA - Earnings Before Interest, Taxes, Depreciation, and Amortization
ICMS - Tax movement of inventories and services (Brazil)
Functional and Presentation Currency
Arauco and most of its subsidiaries determined the United States (“U.S.”) Dollar as its functional currency since the majority of its revenues from sales of its products are derived from exports denominated in U.S. Dollars, while their costs of sales are to a large extent related or indexed to the U.S. Dollar.
In relation to the cost of sales, although labor and services costs are generally billed and paid in local currency, these costs are not as significant as the costs of raw materials, which are driven mainly by global markets and therefore, influenced mostly by the U.S. Dollar.
For the pulp operating segment, most of the sales are exports denominated in U.S. Dollars and costs are mainly related to plantation costs which are settled in U.S. Dollars.
For the sawn timber, panel and forestry operating segments, although total sales include a mix of domestic and exports sales, prices of the products are established in U.S. Dollars, which is also the case for the cost structure of the related raw materials.
The presentation currency of the consolidated financial statements is the U.S. Dollar.Figures on these consolidated financial statements are presented in thousands of U.S. Dollar (ThU.S.$).
14
Table of Contents
CELULOSA ARAUCO Y CONSTITUCION S.A.
AND SUBSIDIARIES
Unaudited Consolidated Financial Statements
December 31, 2015
Amounts in thousands of U.S. dollars, except as indicated
Summary of significant accounting policies
a) Basis for preparation of consolidated financial statements
The consolidated Financial Statements of Arauco for the period ended December 31, 2015 and 2014 present in all material respects its financial position, its results of operations and its cash flows in accordance with the standards of the Superintendency of Securities and Insurance ( SVS ) that consider the IFRS, except as instructed in the Official Circular Letter No 856 of the Superintendency of Securities and Insurance which provides in an exceptional form of accounting of changes in assets and liabilities for deferred tax caused by Law No. 20,780, published in the Official Journal on September 29, 2014 (See Note 6).
The consolidated financial statements have been prepared on the historical cost basis, except for biological assets and certain derivative financial instruments which are measured at revalued amounts or fair value at the end of each period as explained in the following significant accounting policies.
b) Critical accounting estimates and judgments
The preparation of these consolidated financial statements, in accordance with Superintendency of Securities and Insurance (SVS), requires management to make estimates and assumptions that affect the carrying amounts reported. These estimates are based on historical experience and various other assumptions that are considered to be reasonable. Actual results may differ from these estimates. Management believes that the accounting policies below are the critical judgments that have the most significant effect on the amounts recognized in the consolidated financial statements.
-Biological Assets
The recovery of forest plantations is based on discounted cash flow models which means that the fair value of biological assets is calculated using cash flows from continuing operations on a discounted basis, based on our sustainable forest management plans and the estimated growth of forests.
These discounted cash flows require estimates in growth, harvest, sales prices and costs; therefore it is important that management make appropriate estimates of future levels and trends for sales and costs, as well as conduct regular surveys of the forests to establish the volumes of wood available for harvesting and their current growth rates. The main considerations used to measure forest plantations are presented in Note 20, including a sensitivity analysis.
-Goodwill
Goodwill represents the excess of the acquisition cost over the fair value of the Group’s holding in the identifiable net assets of the acquired subsidiary at the date of acquisition. Said fair value is determined whether based on assessments and/or the discounted future flow method using hypotheses in their determination, such as sales prices and industry indexes, among others. See Note 17.
15
Table of Contents
CELULOSA ARAUCO Y CONSTITUCION S.A.
AND SUBSIDIARIES
Unaudited Consolidated Financial Statements
December 31, 2015
Amounts in thousands of U.S. dollars, except as indicated
-Litigation and Contingencies
Arauco and its subsidiaries are subject to certain litigation proceedings. Future impact on Arauco’s financial condition derived from such litigations is estimated by management, in collaboration with its legal advisors. Arauco applies judgment when interpreting the reports of its legal advisors who provide updated estimates of the legal contingencies at each reporting period and/or at each time a modification is determined to be necessary. For a description of current litigations see Note 18.
c) Consolidation
The consolidated financial statements include all entities over which Arauco has the power to direct the relevant financial and operating activities. Subsidiaries (including special purpose entities) are consolidated from the date on which control is obtained and up to the date that control ceases.
Specifically, a company controls an investee or subsidiary if, and only if, they have all of the following:
(a) power over the investee, i.e. the investor has existing rights which give it the ability to direct the relevant activities (the activities that significantly affect the investee’s returns)
(b) exposure or rights to variable returns from involvement with the investee; and
(c) the ability to use power over the investee to affect the amount of the investor’s returns.
When Arauco holds less than the majority of voting rights in a company in which it participates, it nonetheless has the power over said company - when these voting rights are enough - to grant it in practice the ability to unilaterally direct said company’s relevant activities. Arauco takes into account all facts and circumstances in order to assess if the voting rights in a company in which it participates are enough for granting it nthe power, including:
a) the size of the investor’s holding of voting rights relative to the size and dispersion of holdings of the other vote holders;
b) potential voting rights held by the investor, other vote holders or other parties;
c) rights arising from other contractual arrangements; and
d) any additional facts and circumstances that indicate the investor has, or does not have, the current ability to direct the relevant activities at the time that decisions need to be made, including voting patterns at previous shareholders’ meetings.
The Company will reevaluate whether or not it holds control of a company in which participates if the facts and circumstances indicate that changes have occurred in one or more of the three elements of control mentioned above.
Consolidation of an investee shall begin from the date the investor obtains control of the investee and cease when the investor loses control of the investee. An entity includes the income and expenses of an acquired or sold subsidiary in the consolidated financial statements from the date it gains control until the date when the entity ceases to control the subsidiary.
16
Table of Contents
CELULOSA ARAUCO Y CONSTITUCION S.A.
AND SUBSIDIARIES
Unaudited Consolidated Financial Statements
December 31, 2015
Amounts in thousands of U.S. dollars, except as indicated
The profit or loss of each component of other comprehensive income is attributed to owners of the parent company and the non-controlling interest, as appropriate. Total comprehensive income is attributed to the owners of the parent company and non-controlling interests even if the results of the non-controlling interest have a deficit balance.
If a subsidiary uses accounting policies other than those adopted in the consolidated financial statements for transactions and other events in similar circumstances, appropriate adjustments are made to the financial statements of subsidiaries in order to ensure compliance with Arauco’s accounting policies.
All intercompany transactions and unrealized gains and losses from subsidiaries have been fully eliminated from consolidated financial statements and non-controlling interest is presented in the consolidated statement of financial position within equity, separately from the equity of the owners of the parent company.
The consolidated financial statements at the end of this period include the assets, liabilities, income and expenses of the subsidiaries shown in Note 13.
Certain consolidated subsidiaries have Brazilian Real and Chilean Pesos as their functional currencies. For consolidation purposes, the financial statements of those subsidiaries have been prepared in accordance with IFRS and translated into the presentation currency as indicated in Note 1 (e) (ii).
d) Segments
Arauco has defined its operating segments according to its business areas, based on the products and services sold to its customers. This definition is consistent with the management, resource allocation and performance assessment made by key personnel responsible for making relevant decisions related to the Company’s operation. The Chief Operating Decision Maker (CODM) is the Chief Executive Officer who is responsible for making these decisions and it is supported by the Corporate Managing Directors of each segment.
Based on the aforementioned process, the Company has established operating segments according to the following business units:
| • | Pulp |
| • | Panels |
| • | Sawn Timber |
| • | Forestry |
Refer to Note 24 for detailed financial information by operating segment.
17
Table of Contents
CELULOSA ARAUCO Y CONSTITUCION S.A.
AND SUBSIDIARIES
Unaudited Consolidated Financial Statements
December 31, 2015
Amounts in thousands of U.S. dollars, except as indicated
e) Functional currency
(i) Functional currency
All items in the financial statements of Arauco and each of its subsidiaries, associates and jointly controlled entities are measured using the currency of the primary economic environment in which each entity operates (the functional currency). The consolidated financial statements are presented in U.S. dollars, which is Arauco’s functional and presentation currency.
(ii) Translation to the presentation currency of Arauco
For the purposes of presenting consolidated financial statements, assets and liabilities of Arauco’s operations in a functional currency different from Arauco´s are translated into U.S. dollars using exchange rates prevailing at the end of each reporting period. Income and expense items are translated at the average exchange rates for the period, unless exchange rates fluctuate significantly during that period, in which case the exchange rates at the dates of the transactions are used. Exchange rate differences are recognized in other comprehensive income and accumulated in “Other reserves” within–equity.
(iii) Foreign Currency Transactions
Transactions in currencies other than the functional currency are recognized at the exchange rates prevailing at the dates of the transactions. Profit or loss on transactions in currencies other than the functional currency resulting from the settlement of such transactions and from the translation at year-end exchange rates of monetary assets and liabilities denominated in foreign currencies, are recognized in the statement of income, except those which are recorded in other comprehensive income and accumulated in equity such as cash flows hedging derivatives.
f) Cash and cash equivalents
Cash and cash equivalents include cash-in-hand, deposits held on demand at banks and other short term highly liquid investments with an original maturity of three months or less and which are subject to an insignificant risk of changes in value.
g) Financial Instruments
Financial assets
Financial assets are classified into the following specified categories: ‘loans and receivables’ and “derivative financial instruments”. The classification depends on the nature and purpose of the financial assets and is determined at the time of initial recognition. All purchases and sales of financial assets are recognized and derecognized on the trade date, which require delivery of assets within the same time frame established by regulation or convention in the marketplace.
Loans and receivables are non-derivative financial assets with fixed or determinable payments that are not quoted in an active market. Loans and receivables are classified as current assets, except for those with maturities more than 12 months after the
18
Table of Contents
CELULOSA ARAUCO Y CONSTITUCION S.A.
AND SUBSIDIARIES
Unaudited Consolidated Financial Statements
December 31, 2015
Amounts in thousands of U.S. dollars, except as indicated
reporting period, which are classified as non-current assets. Loans and receivables include trade and other receivables.
Loans and receivables are initially recognized at fair value plus transaction costs that are directly attributable to the acquisition and are subsequently measured at amortized cost using the effective interest rate method, less any impairment.
Derivative financial instruments are explained in Note 1 h)
Financial liabilities
Financial liabilities (including borrowings and trade and other payables) are subsequently measured at amortized cost using the effective interest method.
The effective interest method is a method of calculating the amortized cost of a financial liability and of allocating interest expense over the relevant period. The effective interest rate is the rate that discounts estimated future cash payments (including all fees and amounts paid or received that form an integral part of the effective interest rate, transaction costs and other premiums or discounts) through the expected life of the financial liability, or (where appropriate) a shorter period, to the net carrying amount on initial recognition.
Financial obligations are classified as current liabilities, unless Arauco holds an unconditional right to defer their settlement during at least 12 months after the balance sheet’s date.
The estimate of the fair value of obligations with banks is determined using valuation techniques that include discounted cash flow analyses applying rates of similar loans. Bonds are appraised at market value.
h) Derivative financial instruments
(i) Derivative Financial Instruments - The Company enters into a variety of derivative financial instruments to manage its exposure to interest rate and foreign exchange rate risks, including foreign exchange forward contracts, interest rate swaps, currency swaps and zero cost collar contracts. The company’s policy is that derivative contracts are entered into for economic hedging purposes and that there be no instruments for speculation purposes.
Derivatives are initially recognized at fair value at the date the derivative contracts are entered into and are subsequently re-measured at fair value at the end of each reporting period. The resulting gain or loss is recognized in profit or loss unless the derivative is designated as a hedging instrument and complies with hedge accounting requirements of IAS 39, in which event the timing of the recognition in profit or loss depends on the nature of the hedge relationship.
(ii) Embedded derivatives - The Company assesses the existence of embedded derivatives in financial instrument contracts. Derivatives embedded in non-derivative host contracts are treated as separate derivatives when they meet the definition of a derivative, their risks and characteristics are not closely related to those of the host contracts and the contracts are not measured at FVTPL as a whole. Arauco has determined that no embedded derivatives currently exist.
19
Table of Contents
CELULOSA ARAUCO Y CONSTITUCION S.A.
AND SUBSIDIARIES
Unaudited Consolidated Financial Statements
December 31, 2015
Amounts in thousands of U.S. dollars, except as indicated
(iii) Hedge accounting - The Company designates certain hedging instruments as either fair value hedges or cash flow hedges.
At the inception of the hedge relationship, the entity documents the relationship between the hedging instrument and the hedged item, along with its risk management objectives and its strategy for undertaking various hedge transactions. Furthermore, at the inception of the hedge and on an ongoing basis, Arauco documents whether the hedging instrument is highly effective in offsetting changes in fair values or cash flows of the hedged item attributable to the hedged risk.
-Fair Value Hedges under IAS 39- Changes in the fair value of derivatives that are designated and qualify as fair value hedges are recognized in profit or loss immediately, together with any changes in the fair value of the hedged asset or liability that are attributable to the hedged risk. The change in the fair value of the hedging instrument and the change in the hedged item attributable to the hedged risk are recognized in profit or loss in the line item relating to the hedged item.
-Cash flow hedges under IAS 39 - The effective portion of changes in the fair value of derivatives that are designated and qualify as cash flow hedges is recognized in other comprehensive income and accumulated under the heading of cash flow hedging reserve. The gain or loss relating to the ineffective portion is recognized immediately in profit or loss, and is included in the Finance costs line item in the consolidated statement of profit or loss. Amounts previously recognized in other comprehensive income are reclassified to profit or loss in the periods when the hedged item affects profit or loss, in the same line as the recognized hedged item.
Hedge accounting is discontinued when the Group revokes the hedging relationship, when the hedging instrument expires or is sold, terminated, or exercised, or when it no longer qualifies for hedge accounting. Any gain or loss recognized in other comprehensive income and accumulated in equity at that time remains in equity and is recognized when the forecasted transaction is ultimately recognized in profit or loss. When a forecasted transaction is no longer expected to occur, the gain or loss accumulated in equity is recognized immediately in profit or loss.
i) Inventories
Inventories are stated at the lower of cost and net realizable value. Cost is determined using the weighted average cost method.
The cost of finished and in process products includes the cost of raw materials, direct labor, other direct costs and manufacturing overhead expenses.
Initial costs of harvested wood are determined at fair value less cost of sale at the point of harvest.
Biological assets are transferred to inventories when forests are harvested.
Net realizable value is the estimated selling price in the ordinary course of business less the estimated costs of completion and the estimated costs necessary to make the sale.
20
Table of Contents
CELULOSA ARAUCO Y CONSTITUCION S.A.
AND SUBSIDIARIES
Unaudited Consolidated Financial Statements
December 31, 2015
Amounts in thousands of U.S. dollars, except as indicated
When market conditions result in the production costs of a product exceeding its net realizable value, the inventories are written-down to their net realizable value. This write-down also includes obsolescence amounts resulting from slow moving inventories and technical obsolescence.
Spare parts that will be consumed in a period of less than twelve months are presented in inventories and recognized as an expense when they are consumed.
j) Non-current assets held for sale
The Group classifies certain property, plant and equipment, intangible assets, investments in associates and disposal groups (groups of assets to be sold together with their directly associated liabilities) as non-current assets held for sale which as of the date of the statement of financial position are the subject of active sale efforts which are estimated to be highly probable. Non-current assets held for sale are presented separately from the other assets in the balance sheet.
These assets or disposal groups are measured at the lower of the carrying amount or the fair value less the costs to sell, and are no longer depreciated or amortized from the time they are classified as non-current assets held for sale.
k) Business Combinations
Arauco applies the acquisition method to account for a business combination. This method requires the identification of the acquirer, determination of the acquisition date, recognition and measurement of the identifiable assets acquired, the liabilities assumed and any non-controlling interest in the acquiree; and recognition and measurement of goodwill or a gain from a bargain purchase. Identifiable assets acquired and liabilities assumed and any contingent liabilities in a business combination are initially measured at fair value at the acquisition date, except:
-deferred tax assets or liabilities, and assets or liabilities related to employee benefit arrangements are recognized and measured in accordance with IAS 12 Income Taxes and IAS 19 respectively;
-liabilities or equity instruments related to share-based payment arrangements of the acquire or share-based payment arrangements of the Group entered into to replace share-based payment arrangements of the acquire are measured in accordance with IFRS 3 at the acquisition date; and
-assets (or disposal groups) that are classified as held for sale in accordance with IFRS 5 Non-current Assets Held for Sale and Discontinued Operations are measured in accordance with such standard.
Acquisition-related costs are accounted for as expenses when they are incurred, except for costs to issue debt or equity securities which are recognized in accordance with IAS 32 and IAS 39.
A parent will present non-controlling interests in the consolidated statement of financial position within equity, separately from the equity of the owners of the parent company.
21
Table of Contents
CELULOSA ARAUCO Y CONSTITUCION S.A.
AND SUBSIDIARIES
Unaudited Consolidated Financial Statements
December 31, 2015
Amounts in thousands of U.S. dollars, except as indicated
Changes in the ownership interest of a parent in its subsidiary that do not result in a loss of control are treated as equity transactions. Any difference between the amount by which non-controlling interests are adjusted and the fair value of the consideration paid or received is recognized directly in equity and attributed to owners of the parent company. No adjustment is made to the carrying amount of goodwill, neither gains nor losses are recognized in the statement of profit or loss.
Non-controlling interests that are present ownership interests and entitle their holders to a proportionate share of the entity’s net assets in the event of liquidation may initially be measured either at fair value or at the present ownership instruments’ proportionate share of non-controlling interests, in the recognized amounts of the acquiree’s identifiable net assets. The choice is made on a transaction-by-transaction basis.
Arauco measures the fair value of the acquired company in the business combination achieved in stage (“step acquisition”), recognizing the effects of remeasurement of previously held equity interest in the acquiree in the statements of income.
If the initial accounting for a business combination is not completed by the end of the reporting period in which the combination occurs, Arauco reports preliminary amounts for the items for which the accounting is incomplete. During the measurement period (no more than one year), these preliminary amounts are retrospectively adjusted, or additional assets or liabilities are recognized to reflect new information about facts and circumstances that existed at the acquisition date, if known, would have affected the amounts recognized at that date.
Business combinations that are under common control transactions are accounted using as a reference the pooling of interest. Under this method, assets and liabilities related to the transaction carry over the previous carrying values. Any difference between assets and liabilities included in the consolidation and the consideration transferred, is accounted in equity.
l) Investments in associates and joint arrangements
Associates are entities over which Arauco exercises significant influence, but not control. Significant influence is the power to participate in the financial and operating policy decisions of the investee but is not control or joint control over those policies.
Joint arrangement is defined as an entity over which there is joint control, which exists only when the decisions about strategic of activities, both financial and operational, require the unanimous consent of the parties sharing control.
Investments in joint arrangements are classified as a joint venture or as a joint operation. A joint operation is a joint arrangement in which the parties that have joint control of the arrangement (i.e. joint operators) have rights to the assets and obligations for the liabilities, relating to the arrangement. A joint venture is a joint arrangement in which the parties that have joint control of the arrangement (i.e., participants in a joint venture) have rights to the net assets of the arrangement.
Investments in associates and joint ventures are accounted for using the equity method and are initially recognized at cost. Their carrying amount is increased or decreased to recognize Arauco’s share of the profit or loss and other comprehensive income. Dividends received are recognized by deducting the amount received from the carrying amount of
22
Table of Contents
CELULOSA ARAUCO Y CONSTITUCION S.A.
AND SUBSIDIARIES
Unaudited Consolidated Financial Statements
December 31, 2015
Amounts in thousands of U.S. dollars, except as indicated
the investment. Arauco’s investment in associates includes goodwill (both net of any accumulated impairment loss).
The investments in joint operations are recognized through consolidation of assets, liabilities and results of operations in relation to Arauco’s ownership percentage.
Investments in associates and joint ventures are presented in the consolidated statement of financial position in the line item “Investments accounted for using equity method”.
If Arauco’s share of losses of an associate or joint venture equals or exceeds its interest in the associate or joint venture, Arauco discontinues recognizing its share of further losses. After Arauco’s carrying value in the investee is reduced to zero, additional losses are provided for, and a liability is recognized, only to the extent that Arauco has incurred legal or constructive obligations or made payments on behalf of the associate or joint venture. If the associate or joint venture subsequently reports profits, Arauco resumes recognizing its share of those profits only after its share of the profits equals the share of losses not recognized.
m) Intangible assets other than goodwill
After initial recognition, intangible assets with finite useful lives are carried at cost less any accumulated amortization and impairment losses.
Amortization of an intangible asset with a finite useful life is allocated over the asset’s useful life. Amortization begins when the asset is available for use, i.e., when it is in the location and condition necessary for it to be capable of operating in the manner intended by management.
| (i) | Computer Software |
Computer software licenses are capitalized in terms of the costs incurred to acquire and make them compatible with existing software. These costs are amortized over the estimated useful lives of the software.
| (ii) | Water Rights, Easements and Other Rights |
This item includes water rights, easements and other acquired rights recognized at historical cost which have indefinite useful lives as there is no foreseeable limit to the period over which these assets are expected to generate future cash flows. These rights are not amortized, but are tested for impairment at least annually, or when there is any indication that the assets might be impaired.
| (iii) | Customers and trade relations with customers |
Correspond to the valuation over the time of the established relationship with customers, from the sale of products and services through its sales team. These relations will materialize in sales orders, which generate revenue and cost of sales. The useful life has been determined to be 15 years.
n) Goodwill
Goodwill is measured as the excess of the sum of the consideration transferred, the amount of any non-controlling interest in the acquiree, and the fair value of the acquirer’s previously held equity interest in the acquiree (if any) over the net of the acquisition-date amounts of the identifiable assets acquired and the liabilities assumed. If
23
Table of Contents
CELULOSA ARAUCO Y CONSTITUCION S.A.
AND SUBSIDIARIES
Unaudited Consolidated Financial Statements
December 31, 2015
Amounts in thousands of U.S. dollars, except as indicated
the total of consideration transferred, non-controlling interest recognized and previously held interest measured is less than the fair value of the net assets of the subsidiary acquired in the case of a bargain purchase, the difference is recognized directly in the statement of income.
Goodwill is not amortized but tested for impairment on annual basis.
After initial recognition, goodwill is measured at cost less any accumulated impairment losses. For purposes of impairment testing, goodwill in a business combination is allocated as of the acquisition date to the cash generating unit or a group of cash generating units expected to benefit from the synergies of the combination irrespective of whether other assets or liabilities of the acquiree are allocated to those units or group of units.
The goodwill generated on acquisitions of foreign companies, is expressed in the functional currency of such foreign company.
Goodwill recognized for the acquisition of the subsidiary Arauco do Brasil S.A. whose functional currency is the Brazilian Real, is translated into U.S. Dollars at the closing exchange rate. At the date of these consolidated financial statements, the change in the carrying amount of goodwill in Brazil is only related to the net exchange rate differences on translation.
o) Property, Plant and Equipment
Property, plant and equipment are measured at cost less accumulated depreciation and accumulated impairment. The cost includes expenditures that are directly attributable to the acquisition of the assets.
Subsequent costs, such as improvements and replacement of components, are included in the asset’s carrying amount or recognized as a separate asset, as appropriate, only when it is probable that future economic benefits associated with the item will flow to Arauco and the cost of the item can be measured reliably. The carrying amount of the replaced part is derecognized from property, plant and equipment. All other repairs and maintenance costs are expensed in the period in which they are incurred.
Arauco capitalizes borrowing costs that are directly attributable to the acquisition, construction or production of qualifying assets as part of the cost of those assets, until the assets are ready for their intended use (See Note 12).
Depreciation is calculated by components using the straight-line method.
The useful lives of the items of property, plant and equipment is estimated according to the expected use of the assets.
The residual values and useful lives of assets are reviewed and adjusted, if appropriate, annually.
24
Table of Contents
CELULOSA ARAUCO Y CONSTITUCION S.A.
AND SUBSIDIARIES
Unaudited Consolidated Financial Statements
December 31, 2015
Amounts in thousands of U.S. dollars, except as indicated
p) Leases
Arauco applies IFRIC 4 to assess whether an arrangement is, or contains, a lease. Leases of assets in which Arauco substantially holds all the risks and rewards of ownership are classified as finance leases. All other leases are classified as operating leases.
Finance leases are initially recognized at the lower of the fair value at the inception of the lease of the leased property and the present value of the minimum lease payments.
When assets are leased under a finance lease, the present value of lease payments are recognized as financial account receivables. Finance income, which is the difference between the gross receivable and the present value of such amount, is recognized as the interest rate of return.
Leases in which substantially all risks and rewards are not transferred to the lessee are classified as operating leases. Payments under operating leases (net of any incentives received from the lessor) are recognized as an expense on a straight-line basis over the lease term.
Arauco evaluates the economic nature of the contracts that grant the right to use certain assets, for the purposes of determining the existence of implied leases. In these cases, the Company separates - at the beginning of the contract, and based on relative reasonable values - payments and considerations associated with the lease, from the rest of the elements incorporated to the contract.
q) Biological Assets
IAS 41 requires that biological assets, such as standing trees, are measured at fair value less cost to sell in the statement of financial position. Forestry plantations are accounted for at fair value less costs to sell, based on the presumption that fair values of these assets can be measured reliably.
The measurement of forestry plantations is based on discounted cash flow models whereby the fair value of the biological assets is determined using estimated future cash flows from continuing operations calculated using our sustainable forest management plans and including the estimated growth of the forests. This valuation is performed on the basis of each identifiable farm block and for each type of tree.
The measurement of new forestry plantations made during the current year is made at cost, which corresponds to the fair value at that date. After twelve months, the valuation methodology used is that explained in the preceding paragraph.
Biological assets shown as current assets correspond to those forestry plantations that will be harvested in the short term.
Biological growth and changes in fair value of forestry plantations are recognized in the line item “Other income” in the consolidated statement of profit or loss.
25
Table of Contents
CELULOSA ARAUCO Y CONSTITUCION S.A.
AND SUBSIDIARIES
Unaudited Consolidated Financial Statements
December 31, 2015
Amounts in thousands of U.S. dollars, except as indicated
r) Income tax expense and deferred income tax assets and liabilities.
The tax liabilities are recognized in the consolidated financial statements based on the determination of taxable income for the year and calculated using the tax rates in force in the countries where Arauco operates.
Deferred income tax is recognized using liability method, on the temporary differences arising between the tax bases of assets and liabilities and their carrying amounts in the consolidated annual accounts. Deferred income tax is determined using tax rates contained in laws adopted as of the date of the financial statements and that are expected to be applicable when the related deferred tax asset is realized or the deferred income tax liability is settled.
Deferred income taxes are registered according to rules established in IAS12 “Income Taxes”, except for the application in 2014 of the Official Circular Letter No. 856 issued on October 17, 2014 by the SVS, which instructed auditees to register in the respective fiscal year against equity on a one-time basis, differences in assets and liabilities for deferred taxes occurred as a direct effect of the increase in the first category tax rate introduced by Law No. 20,780.
This statement differs from that established by the IFRS, which requires that the effect be recorded against income.
This instruction issued by the SVS meant in the consolidated financial statements as of December 31, 2014, a change in the framework of preparation and presentation of financial information adopted by that date, since the previous frame (IFRS) requires to be adopted in a comprehensive, explicit and unreserved manner.
The effect of this change in accounting bases meant in year 2014 a charge to retained earnings amounting to ThU.S.$292,155, which according to IFRS should have been presented under results of the year ended December 31, 2014.
The goodwill arising on business combinations does not give rise to deferred tax.
The deferred tax assets and tax credits are generally recognized for all deductible temporary differences to the extent that it is probable that future taxable profit will be available against which those deductible temporary differences can be utilized.
s) Provisions
Provisions are recognized when the Company has a present obligation, legal or constructive, as a result of past events; it is probable that an outflow of resources will be required to settle the obligation; and a reliable estimate can be made of the amount of the obligation. The amount recognized as a provision is the best estimate of the consideration required to settle the present obligation at the end of the reporting period.
t) Revenue recognition
Revenues are recognized when Arauco has transferred the risks and rewards of ownership to the buyer and Arauco has no right to dispose of the assets, nor effective control of such good.
26
Table of Contents
CELULOSA ARAUCO Y CONSTITUCION S.A.
AND SUBSIDIARIES
Unaudited Consolidated Financial Statements
December 31, 2015
Amounts in thousands of U.S. dollars, except as indicated
(i) Revenue recognition from the Sale of Goods
Revenue from the sale of goods is recognized when Arauco has transferred to the buyer the significant risks and rewards of ownership of the goods, when the amount of revenue can be reliably measured, when Arauco does not retain any managerial involvement over the goods sold and when it is probable that the economic benefits associated with the transaction will flow to Arauco and the costs incurred in respect of the transaction can be measured reliably.
Sales are recognized in terms of the price agreed to in the sales contract, less any volume discounts and estimated product returns at the date of the sale. Volume discounts are evaluated in terms of estimated annual purchases. There is no significant financing component given that receivables from sales are collected within a short period, which is in line with market practices.
The structure for recognizing revenue from export sales is based on the 2010 Incoterms, which are the official rules for the interpretation of commercial terms issued by the International Chamber of Commerce.
The main Incoterms used by Arauco are the following:
“CFR (Cost and freight)”, where the company bears all costs including main transportation, until the products arrives at its port of destination. The risk is transferred to the purchaser once the products have been loaded onto the vessel, in the country of origin.
“CIF (Cost Insurance & Freight)”, where the Company organizes and pays for external freight services and some other expenses. Arauco is no longer responsible for the products once they have been delivered to the ocean carrier company. The point of sale is the delivery of the products to the carrier chartered by the seller.
(ii) Revenue recognition from Rendering of Services
When the outcome of a transaction involving the rendering of services can be reliably estimated, revenue is recognized by reference to the stage of completion of the transaction at the date of the reporting period, and when it is probable that the economic benefits associated with the transaction will flow to the Arauco.
Arauco mainly provides power supply services which are transacted principally in the spot market of the Sistema Interconectado Central (“Central Interconnected System”). According to current regulations, the prices on that market called “Marginal Costs” are calculated by the Centro de Despacho Económico de Carga del Sistema Interconectado Central (CDEC–SIC) (“Economic Load Dispatch Center of the Central Interconnected System”) and are generally recognized in the period in which the services are rendered.
Electrical power is generated as a by-product of the pulp and wood process and is a complementary business to it, which is initially supplied to the group’s subsidiaries and any surplus is sold to the CDEC-SIC.
27
Table of Contents
CELULOSA ARAUCO Y CONSTITUCION S.A.
AND SUBSIDIARIES
Unaudited Consolidated Financial Statements
December 31, 2015
Amounts in thousands of U.S. dollars, except as indicated
Arauco provides other non-core services such as port services and pest control whose revenues are derived from fixed price service contracts, generally recognized during the period of the service contract on a straight-line basis over the term of the contract.
Revenues from operating segments mentioned in Note 24 are measured in accordance with the policies indicated in the preceding paragraphs.
Revenues from inter-segment sales (which are made at market prices) are eliminated in the consolidated financial statements.
u) Minimum dividend
Article No. 79 of the Chilean Corporations Law states that, unless otherwise unanimously agreed by the shareholders, corporations must distribute annually at least 30% of net income for the current year as cash dividend to shareholders determined in proportion to their shares or in the proportion established in the by-laws for preferred shares, if any, except where necessary to absorb accumulated losses from prior years.
The General Shareholders’ Meeting of Arauco agreed to distribute annual dividends at 40% of net distributable income, including an interim dividend to be distributed at year end. Dividends payable are recognized as a liability in the financial statements in the period when they are declared and approved by the Arauco’s shareholders or when arises the corresponding present obligation based on existing legislation or distribution policies established by the Shareholders’ Meeting.
The dividends payable provision is registered for 40% of the liquid distributable profit and against a lower equity, based on the yearly resolution of the Shareholders’ Meeting.
Dividends payable are presented in the line item “Other current non-financial liabilities” in the consolidated statement of financial position.
v) Earning per share
Basic earnings per share are calculated by dividing the net profit for the period attributable to the parent company by the weighted average number of ordinary shares outstanding during the period, excluding the average number of shares in the Company held by a subsidiary, if such circumstance exists. Arauco has not performed any type of transaction with a potential dilutive effect that would cause diluted earnings per share to be different from basic earnings per share.
w) Impairment
Non-financial Assets
The recoverable amount of property, plant and equipment and other assets with finite useful lives are measured whenever there are any circumstances indicating that the assets have to recognize an impairment loss. Among the circumstances to consider as evidence of impairment are significant declines in the assets’ market value, significant adverse changes in the technological environment, obsolescence or physical damages of assets and changes in the manner in which the asset is used or expected to be used). Arauco evaluates at the end of each reporting period whether there is any evidence of the indications above mentioned.
28
Table of Contents
CELULOSA ARAUCO Y CONSTITUCION S.A.
AND SUBSIDIARIES
Unaudited Consolidated Financial Statements
December 31, 2015
Amounts in thousands of U.S. dollars, except as indicated
A previously recognized impairment loss is reversed if there has been a change in the estimates used to determine the recoverable amount, however the reversal is limited to the amount recognized in previous years.
For the purposes of assessing impairment losses, assets are grouped at the lowest level for which there is identifiable cash flows separately for each cash-generating unit. Non-financial assets, other than goodwill, which had recognized an impairment loss, are reviewed at the end of each reporting period whether there are any circumstances indicating that an impairment loss previously recognized may no longer exists or has decreased.
“Cash-generating units” are the smallest identifiable groups of those cash inflows that are largely independent of the cash inflow from other assets or groups of assets.
Goodwill
Goodwill and intangible assets with indefinite useful life are tested annually for impairment or whenever circumstances indicate it. The recoverable amount of an intangible asset is the higher of its fair value less costs to sell and its value in use. An impairment loss is recognized whenever the carrying amount exceeds the recoverable amount.
Goodwill is allocated to cash-generating units for impairment testing purposes. The allocation is made between cash-generating units or groups of cash generating units expected to benefit from the synergies of the combination.
A cash-generating unit, for which goodwill has been allocated, is tested for impairment annually or more frequently when there are circumstances indicating that the unit may be impaired. If the recoverable amount of the cash-generating unit is less than its carrying amount, the impairment loss is allocated first to reduce the carrying amount of any goodwill allocated to the unit and then to other assets pro rata based on the carrying amount of each asset in the unit. Any impairment loss of goodwill is recognized directly in profit or loss. An impairment loss recognized for goodwill is not reversed in subsequent periods.
Financial Assets
At the end of each reporting period, an assessment is performed in order to identify whether there is any objective evidence that a financial asset or a group of financial assets may have been impaired. Financial assets are impaired only when there is objective evidence that, as a result of one or more loss events that occurred after the initial recognition of a financial asset, the estimated future cash flows of the financial asset have been affected. Impairment losses are recognized in the consolidated statement of profit or loss.
An allowance for doubtful accounts is established based on an analysis of the maturity of the portfolio and considering the insurance coverage on accounts receivable. Other conditions are assessed, for example, when there is objective evidence of default or delinquency in payments under the original sale terms and when the customer enters into bankruptcy or financial reorganization, and is written-off when Arauco has exhausted all levels of recovery of the receivable in a reasonable time.
The allowance for doubtful accounts is measured as the difference between the carrying amount of receivables and the present value of estimated future cash flows. The carrying
29
Table of Contents
CELULOSA ARAUCO Y CONSTITUCION S.A.
AND SUBSIDIARIES
Unaudited Consolidated Financial Statements
December 31, 2015
Amounts in thousands of U.S. dollars, except as indicated
amount of the receivable is reduced through the use of the allowance. If the impairment loss decreases in later periods, it is reversed either directly or by adjusting the provision for doubtful accounts, with effect in profit or loss.
x) Employee Benefits
Arauco constitutes labor obligations for severance payable in all circumstances for certain of its employees with at least 5 years of work in the Company, based on the terms of the staff’s collective and individual bargaining agreements.
The related provision is an estimate of the years of service to be recognized as a future labor obligation liability, in accordance with contracts between Arauco and its employees and pursuant to actuarial valuation criteria for this type of liability. This post-employment benefit is considered a defined benefit plan.
The main factors considered for calculating the actuarial value of severance obligation for years of service are employee turnover, salary increases and life expectancy of the workers included in this benefit.
Actuarial gains and losses are recognized in other comprehensive income in the year they are incurred.
y) Employee Vacations
Arauco recognizes the expense for employee vacation according to labor legislation in each country on an accrual basis.
This obligation is presented in the line item “Trade and Other current payables” and “Trade and Other non-current payables” depending on their respective maturities in the consolidated statement of financial position.
z) Recent accounting pronouncements
The following new standards and interpretations have been adopted in these consolidated financial statements:
| Amendments and improvements |
Contents |
Mandatory application for annual periods beginning on or after | ||
| IAS 19 |
Employee Benefits Clarifies the requirements related to the way in which contributions from employees or others which are linked to the service must be attributed to periods of service. |
January 1, 2014 | ||
| Annual improvements 2010-2012-Amendments to IFRS 6 | IFRS 2, IFRS 3, IFRS 8, IFRS 13, IAS 16, IAS 24 | January 1, 2014 | ||
| Annual Improvement 2011-2013 – Amendments to IFRS 4 | IFRS 1, IFRS 3, IFRS 13, IAS 40 | January 1, 2014 | ||
30
Table of Contents
CELULOSA ARAUCO Y CONSTITUCION S.A.
AND SUBSIDIARIES
Unaudited Consolidated Financial Statements
December 31, 2015
Amounts in thousands of U.S. dollars, except as indicated
The adoption of the standards, amendments and interpretations outlined above, did not have a significant impact on Arauco´s consolidated financial statements.
As of the date of issue of these consolidated financial statements, the following accounting statements have been issued by the IAS, which have not been subject to early adoption.
| Standards and interpretations |
Contents |
Mandatory application for annual periods beginning on or after | ||
| IFRS 9 | Financial Instruments The complete version of IFRS 9 replaces most of the guidance in IAS 39. IFRS 9 retains but simplifies the mixed measurement model and establishes three primary measurement categories for financial assets. There is now a new expected credit losses model that replaces the incurred loss impairment model used in IAS 39. |
January 1, 2018 | ||
| IFRS 15 | This standard defines a new model to recognized revenue from contracts with costumers. | January 1, 2018 | ||
| IFRS 16 | Leases Specifies guidelines to recognise, measure, present and disclose leases. The standard provides a single lessee accounting model, requiring lessees to recognise assets and liabilities for all leases unless the lease term is 12 months or less or the underlying asset has a low value. |
January 1, 2019 | ||
| Amendments and improvements |
Contents |
Mandatory application for annual periods beginning on or after | ||
| IFRS 11-Amendments | Establishes how to account for the acquisition of an interest in a joint venture operation that qualifies as a business. | January 1, 2016 | ||
| IAS 16 and IAS 38 – Amendments | This amendment clarifies that the use of revenue-based methods to calculate the depreciation of an asset is not appropiate. It also clarifies that revenue is generally presumed to be an inappropiate basis for measuring the consumption of the economic benefits embodied in an intangible asset. | January 1, 2016 | ||
| IAS 16 and IAS 41 – Amendments | These amendments change the reporting for bearer plants, which should be accounted for in the same way as property, plant and equipment. The amendments include them in the scope of IAS 16 rather tan IAS 41. | January 1, 2016 | ||
| IAS 27-Amendments | Allows entities to use the equity method to account for investments in subsidiaries, join ventures and associates in their separate financial statements. | January 1, 2016 | ||
| IFRS 10 and IAS 28- Amendments | These amendmets address an inconsistency between IFRS 10 and IAS 28 regarding the contribution of assets between an investor and its associate or join venture. The amendments aim at clarifying IAS 1 to address perceived impediments to preparers exercising their judgement in presenting their financial reports |
January 1, 2016 | ||
| IFRS 10, and IAS 28-Amendments | Amendments address issues that have arisen in the context of applying the consolidation exception for investment entities. | January 1, 2016 | ||
| IAS 1-Amendments | The amendments aim at clarifying IAS 1 to address perceived | January 1, 2016 | ||
31
Table of Contents
CELULOSA ARAUCO Y CONSTITUCION S.A.
AND SUBSIDIARIES
Unaudited Consolidated Financial Statements
December 31, 2015
Amounts in thousands of U.S. dollars, except as indicated
| Annual Improvements 2012-2014 Cycle | impediments to preparers exercising their judgement in presenting their financial reports. | January 1, 2016 | ||
| Amendment to IFRS 5 “ Non-current Assets Held for Sale and Discontinued Operations” | Adds specific guidance in IFRS 5 for cases in which an entity reclassifies an asset from held for sale to held for distribution or vice versa and cases in which held-for-distribution accounting is discontinued. | January 1, 2016 | ||
| Improvements to IFRS 7 “Financial Instruments: Disclosures” |
Adds additional guidance to clarify whether a servicing contract is continuing involvement in a transferred asset for the purpose of determining the disclosures required. Clarifies the applicability of the amendments to IFRS 7 on offsetting disclosures to condensed interim financial statements. | January 1, 2016 | ||
| Improvements to IAS 19, “Employee Benefits” | Clarifies that the high quality corporate bonds used in estimating the discount rate for post-employment benefits should be denominated in the same currency as the benefits to be paid. | January 1, 2016 | ||
| Improvements to IAS 34, “Interim Financial Reporting” |
Clarifies the meaning of ‘elsewhere in the interim report’ and requires a cross-reference | January 1, 2016 | ||
Arauco is in the process of evaluating the impacts on the financial statements as a result of the adoption of IFRS 9, IFRS 15 and IFRS 16. Arauco estimates that the adoption of the other amendments and interpretations will not have a substantial impact on the Company’s Consolidated Financial Statements during their period of their initial application.
NOTE 2. CHANGES IN POLICIES AND ACCOUNTING ESTIMATES
There have been no changes in the treatment of estimates, amendments and accounting policies with respect to last year.
NOTE 3. DISCLOSURE OF OTHER INFORMATION
a) Disclosure of Information on Issued Capital
At the date of these consolidated financial statements the share capital of Arauco is ThU.S.$353,618.
100% of Capital corresponds to ordinary shares
| 12-31-2015 | 12-31-2014 | |||
| Description of Ordinary Capital Share Types |
100% of Capital corresponds to ordinary shares | |||
| Number of Authorized Shares by Type of Capital in Ordinary Shares |
113,159,655 | |||
| Nominal Value of Shares by Type of Capital in Ordinary Shares |
ThU.S.$0.0031210 per share | |||
| Amount of Capital in Shares by Type of Ordinary Shares that Constitute Capital |
ThU.S.$353,618 | |||
| 12-31-2015 | 12-31-2014 | |||
| Number of Shares Issued and Fully Paid by Type of Capital in Ordinary Shares |
113,159,655 | |||
32
Table of Contents
CELULOSA ARAUCO Y CONSTITUCION S.A.
AND SUBSIDIARIES
Unaudited Consolidated Financial Statements
December 31, 2015
Amounts in thousands of U.S. dollars, except as indicated
b) Dividends paid
The interim dividend paid in the year was equivalent to 15% of the distributable net income calculated as of the end of September 2015 and was considered as a decrease in the statement of changes in equity.
The final dividend paid each year corresponds to the difference between the 40% of the prior year distributable net profit and the amount of the interim dividend paid.
The ThU.S.$142,801 (ThU.S.$159,879 as of December 31, 2014) presented in the statement of changes in equity correspond to the minimum dividend provision recorded for the period 2015 (period 2014).
In the Cash Flow Statement, in the line item “Dividends paid” an amount of ThU.S.$143,003 is presented for the year ended December 31, 2015 (ThU.S.$141,089 for the year ended December 31, 2014) which ThU.S.$141,652 (ThU.S.$137,232 for the year ended December 31, 2014) correspond to the payment of dividends to the parent company.
The following are the dividends paid and per share amounts during the period 2015 and 2014:
| Detail of Dividend Paid, Ordinary Shares |
||
| Dividend Paid |
Interim Dividend | |
| Type of Shares for which there is a Dividend Paid |
Ordinary Shares | |
| Date of Dividend Paid |
12-16-2015 | |
| Amount of Dividend |
ThU.S.$43,580 | |
| Number of Shares for which Dividends are Paid |
113,159,655 | |
| Dividend per Share, Ordinary Shares |
U.S.$0.38512 |
| Detail of Dividend Paid, Ordinary Shares |
||
| Dividend Paid |
Final Dividend | |
| Type of Shares for which there is a Dividend Paid |
Ordinary Shares | |
| Date of Dividend Paid |
05-12-2015 | |
| Amount of Dividend |
ThU.S.$98,072 | |
| Number of Shares for which Dividends are Paid |
113,159,655 | |
| Dividend per Share |
U.S.$0.86667 |
| Detail of Dividend Paid, Ordinary Shares |
||
| Dividend Paid |
Interim Dividend | |
| Type of Shares for which there is a Dividend Paid |
Ordinary Shares | |
| Date of Dividend Paid |
12-09-2014 | |
| Amount of Dividend |
ThU.S.$61,808 | |
| Number of Shares for which Dividends are Paid |
113,159,655 | |
| Dividend per Share |
U.S.$0.54620 |
33
Table of Contents
CELULOSA ARAUCO Y CONSTITUCION S.A.
AND SUBSIDIARIES
Unaudited Consolidated Financial Statements
December 31, 2015
Amounts in thousands of U.S. dollars, except as indicated
| Detail of Dividend Paid, Ordinary Shares |
||
| Dividend Paid |
Final Dividend | |
| Type of Shares for which there is a Dividend Paid |
Ordinary Shares | |
| Date of Dividend Paid |
05-09-2014 | |
| Amount of Dividend |
ThU.S.$75,424 | |
| Number of Shares for which Dividends are Paid |
113,159,655 | |
| Dividend per Share |
U.S.$0.66653 |
c) Disclosure of Information on Reserves
Other reserves comprise reserves of exchange differences on translation, reserves of cash flow hedges and other reserves. Arauco does not have any restrictions associated with these reserves.
Reserves of exchange differences on translation
Reserves of exchange differences on translation correspond to exchange differences relating to the translation of the results and net assets of Arauco’s subsidiaries whose functional currency is other than Arauco’s presentation currency.
Reserves of cash flow hedges
Reserves of cash flow hedges correspond to the portion of net gain or loss of derivative financial instruments that complies with the requirements of hedge accounting at the end of each period.
Reserve of Actuarial Losses in Defined Benefit Plans
This corresponds to changes in the present value of the obligation for defined benefits resulting from experience adjustments (the effect of the differences between the previous actuarial assumptions and the events that occurred within the context of the plan) and the effects of the changes in the actuarial assumptions.
Other reserves
This mainly corresponds to the share of other comprehensive income of investments in associates and joint ventures.
34
Table of Contents
CELULOSA ARAUCO Y CONSTITUCION S.A.
AND SUBSIDIARIES
Unaudited Consolidated Financial Statements
December 31, 2015
Amounts in thousands of U.S. dollars, except as indicated
d) Other items in the Statement of Income
Other income, other expenses, finance income, finance costs and share profit (loss) of associates and joint ventures for the years ended December 31, 2015 and 2014 are as follows:
| January - December | ||||||||
| 2015 ThU.S.$ |
2014 ThU.S.$ |
|||||||
| Classes of Other Income |
||||||||
| Other Income, Total |
273,026 | 368,924 | ||||||
| Gain from changes in fair value of biological assets (See note 20) |
210,479 | 284,497 | ||||||
| Net income from insurance compensation |
1,522 | 2,264 | ||||||
| Revenue from export promotion |
2,692 | 4,032 | ||||||
| Leases received |
2,654 | 2,708 | ||||||
| Gain on sales of assets |
11,849 | 57,653 | ||||||
| Gain on sales of assets classified as held for sale |
— | 244 | ||||||
| Gain on business combination achieved in stages |
8,744 | — | ||||||
| Access easement |
8,160 | 5,158 | ||||||
| Recovery of tax credits |
8,081 | — | ||||||
| Other operating results (sale materials and waste, rent of easements, income tax recovery) |
18,845 | 12,368 | ||||||
| Classes of Other Expenses by activity |
||||||||
| Total of other expenses by activity |
(83,388 | ) | (138,769 | ) | ||||
| Depreciation |
(1,407 | ) | (2,084 | ) | ||||
| Legal expenses |
(3,334 | ) | (4,806 | ) | ||||
| Impairment provision properties, plants and equipment and others |
(12,321 | ) | (11,929 | ) | ||||
| Plants stoppage operating expenses |
(3,917 | ) | (5,102 | ) | ||||
| Expenses projects |
(532 | ) | (7,447 | ) | ||||
| Expenses start-up |
— | (9,591 | ) | |||||
| Loss of forest due to fires |
(34,850 | ) | (31,512 | ) | ||||
| Other Taxes |
(8,981 | ) | (7,540 | ) | ||||
| Research and development expenses |
(2,604 | ) | (3,105 | ) | ||||
| Compensation and eviction |
(1,748 | ) | (8,256 | ) | ||||
| Fines, readjustments and interest |
(1,139 | ) | (3,749 | ) | ||||
| Other expenses (donations, repayments insurance ) |
(12,555 | ) | (43,648 | ) | ||||
| Classes of financing income |
||||||||
| Financing income, total |
50,284 | 30,772 | ||||||
| Financial income from mutual funds—deposits |
15,128 | 13,786 | ||||||
| Financial income resulting from swap—forward |
4,439 | 4,673 | ||||||
| Financial income resulting from loans with related companies |
17,629 | 6,570 | ||||||
| Other financial income |
13,088 | 5,743 | ||||||
| Classes of financing costs |
||||||||
| Financing costs, Total |
(262,962 | ) | (246,473 | ) | ||||
| Interest expense, Banks loans |
(40,690 | ) | (32,978 | ) | ||||
| Interest expense, Bonds |
(189,526 | ) | (186,186 | ) | ||||
| Interest expense, financial instruments |
(7,260 | ) | (8,612 | ) | ||||
| Other financial costs |
(25,486 | ) | (18,697 | ) | ||||
| Share of profit (loss) of associates and joint ventures accounted for using equity method |
||||||||
| Total |
6,748 | 7,481 | ||||||
| Investments in associates |
5,573 | 6,958 | ||||||
| Joint ventures |
1,175 | 523 | ||||||
|
|
|
|
|
|||||
35
Table of Contents
CELULOSA ARAUCO Y CONSTITUCION S.A.
AND SUBSIDIARIES
Unaudited Consolidated Financial Statements
December 31, 2015
Amounts in thousands of U.S. dollars, except as indicated
The analysis of expenses by nature contained in these consolidated financial statements is presented below:
| Cost of sales | January - December | |||||||
| 2015 ThU.S.$ |
2014 ThU.S.$ |
|||||||
| Timber |
641,821 | 808,991 | ||||||
| Forestry labor costs |
636,100 | 655,257 | ||||||
| Depreciation and amortization |
371,851 | 323,306 | ||||||
| Maintenance costs |
305,701 | 278,280 | ||||||
| Chemical costs |
539,856 | 541,327 | ||||||
| Sawmill Services |
128,801 | 129,052 | ||||||
| Others Raw Materials |
226,342 | 184,836 | ||||||
| Others Indirect costs |
138,900 | 126,129 | ||||||
| Energy and fuel |
172,077 | 231,120 | ||||||
| Cost of electricity |
41,674 | 78,760 | ||||||
| Wage and salaries |
308,302 | 297,088 | ||||||
| Total |
3,511,425 | 3,654,146 | ||||||
|
|
|
|
|
|||||
| Distribution cost | January - December | |||||||
| 2015 ThU.S.$ |
2014 ThU.S.$ |
|||||||
| Selling costs |
48,160 | 48,656 | ||||||
| Commissions |
15,801 | 16,201 | ||||||
| Insurance |
4,601 | 5,330 | ||||||
| Provision for doubtful accounts receivable |
3,137 | 2,497 | ||||||
| Other selling costs |
24,621 | 24,628 | ||||||
| Shipping and freight costs |
480,310 | 508,181 | ||||||
| Port services |
26,216 | 28,906 | ||||||
| Freights |
387,081 | 402,386 | ||||||
| Other shipping and freight costs |
67,013 | 76,889 | ||||||
| Total |
528,470 | 556,837 | ||||||
|
|
|
|
|
|||||
| Administrative expenses | January - December | |||||||
| 2015 ThU.S.$ |
2014 ThU.S.$ |
|||||||
| Wage and salaries |
227,407 | 215,662 | ||||||
| Marketing, advertising, promotion and publications expenses |
10,422 | 11,343 | ||||||
| Insurance |
28,216 | 32,367 | ||||||
| Depreciation and amortization |
24,587 | 25,686 | ||||||
| Computer services |
31,897 | 25,136 | ||||||
| Lease rentals (offices, storage of supplies and data archiving and vehicles) |
13,527 | 10,209 | ||||||
| Donations, contributions, scholarships |
11,172 | 10,407 | ||||||
| Fees (legal and technical advisories) |
49,556 | 51,301 | ||||||
| Property taxes, patents and municipality rights |
19,196 | 20,790 | ||||||
| Other administration expenses (travel within and outside the country, cleaning services, security, basic services) |
135,997 | 147,908 | ||||||
| Total |
551,977 | 550,809 | ||||||
|
|
|
|
|
|||||
36
Table of Contents
CELULOSA ARAUCO Y CONSTITUCION S.A.
AND SUBSIDIARIES
Unaudited Consolidated Financial Statements
December 31, 2015
Amounts in thousands of U.S. dollars, except as indicated
| January-December | ||||||||||||
| Expenses for |
Note | 2015 ThU.S.$ |
2014 ThU.S.$ |
|||||||||
| Depreciations |
7 | 388,192 | 340,959 | |||||||||
| Employee benefits |
10 | 537,629 | 525,220 | |||||||||
| Amortization |
19 | 11,953 | 12,475 | |||||||||
|
|
|
|
|
|
|
|||||||
e) Auditor Fees and Number of Employees (Not audited)
At the end of this period, the auditor’s fees and number of employees are as follows:
| 12-31-2015 | ||||||
| Auditors fees |
ThU.S.$ | |||||
| Audit services |
2,397 | |||||
| Other services |
||||||
| Tax services | 742 | |||||
| Others | 468 | |||||
| TOTAL |
3,607 | |||||
|
|
|
|||||
| Number of employees |
No. | |||||
| 15,171 | ||||||
|
|
|
|||||
NOTE 4. INVENTORIES
| 12-31-2015 | 12-31-2014 | |||||||
| Components of Inventory |
ThU.S.$ | ThU.S.$ | ||||||
| Raw materials |
85,999 | 98,242 | ||||||
| Production supplies |
97,755 | 107,067 | ||||||
| Products in progress |
62,475 | 66,635 | ||||||
| Finished goods |
503,059 | 469,561 | ||||||
| Spare Parts |
160,700 | 152,068 | ||||||
| Total Inventories |
909,988 | 893,573 | ||||||
|
|
|
|
|
|||||
Inventories recognized as cost of sales at December 31, 2015 were ThU.S.$3,411,774 (ThU.S.$3,569,213 at December 31, 2014).
In order to have the inventories recorded at net realizable value at December 31, 2015, a net decrease of inventories was recognized associated with a greater provision of obsolescence of ThU.S.$6,909 (greater provision of ThU.S.$2,967 at December 31, 2014). As of December 31, 2015, the amount of obsolescence provision is ThU.S.$18,577 (ThU.S.$11,668 at December 31, 2014).
At December 31, 2015 there were inventory write-offs of ThU.S.$4,215 (ThU.S.$548 at December 31, 2014)
The inventory obsolescence provision is calculated based on the sales conditions of products and age of inventory (inventory turnover).
As of the date of these consolidated financial statements, there are no inventories pledged as security to report.
37
Table of Contents
CELULOSA ARAUCO Y CONSTITUCION S.A.
AND SUBSIDIARIES
Unaudited Consolidated Financial Statements
December 31, 2015
Amounts in thousands of U.S. dollars, except as indicated
Agricultural Products
Agricultural Products are mainly forestry products that are intended for sale in the normal course of our operations and are measured at fair value less costs to sell at the point of harvest at the end of each reporting period Agricultural products are classified as raw materials within the line item inventories.
NOTE 5. CASH AND CASH EQUIVALENTS
Cash and cash equivalents include cash on hand, bank checking account balances, time deposits, repurchase agreements and mutual funds. These are short-term highly liquid investments that are readily convertible to known amounts of cash, and are subject to an insignificant risk of changes in value.
The investment objective of time deposits and repurchase agreements is to maximize the amounts of cash surpluses in the short-term. These instruments are permitted under Arauco’s Investment Policy which allows investing in fixed income securities. These instruments have a maturity of less than three months from the date of acquisition.
Arauco invests in local and international mutual funds in order to maximize the returns of cash surpluses denominated in Chilean Pesos or in foreign currencies such as U.S. Dollars or Euros. These instruments are permitted under Arauco’s Investment Policy.
As of the date of these consolidated financial statements, there are no amounts of cash and cash equivalents with restrictions on use.
| 31-12-2015 | 31-12-2014 | |||||||
| Components of Cash and Cash Equivalents |
ThU.S.$ | ThU.S.$ | ||||||
| Cash on hand |
201 | 391 | ||||||
| Bank checking account balances |
143,123 | 157,611 | ||||||
| Time deposits |
159,912 | 669,545 | ||||||
| Mutual funds |
196,789 | 128,985 | ||||||
| Other cash and cash equivalents (*) |
0 | 14,620 | ||||||
| Total |
500,025 | 971,152 | ||||||
|
|
|
|
|
|||||
| (*) | Applies to purchase contracts subject to resale covenants |
The risk classification of the mutual funds in effect as of December 31, 2015 and 2014 is shown bellow.
| December 2015 ThU.S.$ |
December 2014 ThU.S.$ |
|||||||
| AAAfm |
196,749 | 128,833 | ||||||
| AAfm |
40 | 152 | ||||||
| Total Mutual Funds |
196,789 | 128,985 | ||||||
|
|
|
|
|
|||||
38
Table of Contents
CELULOSA ARAUCO Y CONSTITUCION S.A.
AND SUBSIDIARIES
Unaudited Consolidated Financial Statements
December 31, 2015
Amounts in thousands of U.S. dollars, except as indicated
NOTE 6. INCOME TAXES
The tax rates applicable in the countries in which Arauco operates are 22.5% in Chile, 35% in Argentina, 34% in Brazil, 25% in Uruguay and 34% in the United States (federal tax).
On September 29, 2014, the Official Gazette published Law No. 20,780, which introduced various amendments to the current income tax system, as well as to other taxes. The main amendment was the establishment of an option between two tax regimes: attributed income system and the partially integrated system. One of the effects of the regime selection is that it attaches a progressive increase in the First Category Tax for the fiscal years of 2014, 2015, 2016 and 2017 onwards, increasing to 21%, 22,5%, 24% y 25%, respectively, if the Company chooses the application of an attributed income system, or an increase to 21%, 22.5%, 24%, 25.5% y 27% for the fiscal years 2014, 2015, 2016 and 2017, if the Company chooses the application of the partially integrated system.
Subsequently, on February 29, 2016, the Official Gazette publishes Law No. 20,899, which introduced amendments to Law No. 20,780. Among the main amendments is the incorporation of certain limitations for applying to the attributed income system, and therefore Arauco’s Chilean companies must apply the general rule, that is, the partially integrated system.
On October 17, 2014, the SVS issued the Official Circular Letter No. 856, which established that the difference in assets and liabilities for deferred taxes resulting from the increase of the aforementioned tax rate, should be accounted for by charging it against equity. Therefore, Arauco has recognized a charge to equity of ThU.S.$292,155 resulting from a deferred effect of the new tax rate as of December 31, 2014.
Deferred Tax Assets
The following table sets forth the deferred tax assets as of the dates indicated:
| 12-31-2015 | 12-31-2014 | |||||||
| Deferred Tax Assets |
ThU.S.$ | ThU.S.$ | ||||||
| Deferred tax Assets relating to Provisions |
13,498 | 14,923 | ||||||
| Deferred tax Assets relating to Accrued Liabilities |
8,535 | 11,120 | ||||||
| Deferred tax Assets relating to Post-Employment benefits |
15,480 | 13,859 | ||||||
| Deferred tax Assets relating to Property, Plant and equipment |
7,730 | 11,199 | ||||||
| Deferred tax Assets relating to Financial Instruments |
21,805 | 14,129 | ||||||
| Deferred tax Assets relating to Tax Losses Carryforwards |
35,751 | 44,832 | ||||||
| Deferred tax Assets relating to Inventories |
4,240 | 3,157 | ||||||
| Deferred tax Assets relating to Provisions for Income |
3,997 | 5,827 | ||||||
| Deferred tax Assets relating to Allowance for Doubful Accounts |
4,572 | 3,855 | ||||||
| Intangible revaluation differences |
56 | 1,080 | ||||||
| Deferred tax Assets relating to Other Deductible Temporary Differences |
24,587 | 34,302 | ||||||
| Total Deferred Tax Assets |
140,251 | 158,283 | ||||||
|
|
|
|
|
|||||
Certain subsidiaries of Arauco, as of the date of these consolidated financial statements, present tax losses for which we estimate that, given the projection of future profits, will allow the recovery of these assets. The total amount of these tax losses is ThU.S.$112,383 (ThU.S.$132,292 at December 31, 2014), which are mainly originated by operational and financial losses.
39
Table of Contents
CELULOSA ARAUCO Y CONSTITUCION S.A.
AND SUBSIDIARIES
Unaudited Consolidated Financial Statements
December 31, 2015
Amounts in thousands of U.S. dollars, except as indicated
In addition, as of the date of these consolidated financial statements there are ThU.S.$114,507 (ThU.S.$92,809 at December 31, 2014) of non-recoverable tax losses from Inversiones Arauco Internacional and entities classified as joint operation based on the participation of Arauco, for which deferred tax assets have not been recognized. The estimated recovery period exceeds the expiry date of such tax losses.
Deferred Tax Liabilities
The following table sets forth the deferred tax liabilities as of the dates indicated:
| 12-31-2015 | 12-31-2014 | |||||||
| Deferred Tax Liabilities |
ThU.S.$ | ThU.S.$ | ||||||
| Deferred tax Liabilities relating to Property, plant and equipment |
930,608 | 941,666 | ||||||
| Deferred tax Liabilities relating to Financial Instruments |
6,376 | 4,906 | ||||||
| Deferred tax Liabilities relating to Biological Assets |
693,103 | 681,505 | ||||||
| Deferred tax Liabilities relating to Inventory |
31,912 | 25,688 | ||||||
| Deferred tax Liabilities due to Prepaid Expenses |
40,907 | 40,888 | ||||||
| Deferred tax Liabilities due to Intangible |
26,419 | 32,990 | ||||||
| Deferred tax Liabilities relating to Other Taxable Temporary Differences |
26,203 | 29,506 | ||||||
| Total Deferred Tax Liabilities |
1,755,528 | 1,757,149 | ||||||
|
|
|
|
|
|||||
The effect of changes in current and deferred tax liabilities related to cash flow hedges corresponds to a credit of ThU.S.$1,889 for the year ended December 31, 2015 (compared to a credit of ThU.S.$10,764 for the December 31, 2014), which is presented in consolidated statements of other comprehensive income and accumulated in Reserves for cash flow hedges in the consolidated statement of changes in equity.
Arauco does not offset deferred tax assets and deferred tax liabilities since there is no legal enforceable right to offset amounts that relate to different tax jurisdictions.
40
Table of Contents
CELULOSA ARAUCO Y CONSTITUCION S.A.
AND SUBSIDIARIES
Unaudited Consolidated Financial Statements
December 31, 2015
Amounts in thousands of U.S. dollars, except as indicated
Reconciliation of deferred tax assets and liabilities
| Deferred Tax Assets |
Opening Balance 01-01-2015 ThU.S.$ |
Deferred tax Expenses (Income) ThU.S.$ |
Deferred tax of items charged to other comprehensive income ThU.S.$ |
Increase (decrease) from business combination ThU.S.$ |
Increase (decrease) Net exchange differences ThU.S.$ |
Closing balance 12/31/2015 ThU.S.$ |
||||||||||||||||||
| Deferred tax Assets relating to Provisions |
14,923 | (813 | ) | — | — | (612 | ) | 13,498 | ||||||||||||||||
| Deferred tax Assets relating to accrued liabilities |
11,120 | (2,561 | ) | — | — | (24 | ) | 8,535 | ||||||||||||||||
| Deferred tax Assets relating to Post-Employment benefits |
13,859 | 971 | 692 | — | (42 | ) | 15,480 | |||||||||||||||||
| Deferred tax Assets relating to Property, Plant and equipment |
11,199 | (3,469 | ) | — | — | — | 7,730 | |||||||||||||||||
| Deferred tax Assets relating to Financial Instruments |
14,129 | 23 | 7,653 | — | — | 21,805 | ||||||||||||||||||
| Deferred tax Assets relating to tax losses carryforwards |
44,832 | (959 | ) | — | — | (8,122 | ) | 35,751 | ||||||||||||||||
| Deferred tax assets relating to provisions for income |
3,157 | 1,487 | — | — | (404 | ) | 4,240 | |||||||||||||||||
| Deferred tax assets relating to provisions for income |
5,827 | (1,825 | ) | — | — | (5 | ) | 3,997 | ||||||||||||||||
| Deferred tax assets relating to provision for doubful accounts |
3,855 | 797 | — | — | (80 | ) | 4,572 | |||||||||||||||||
| Intangible revaluation differences |
1,080 | (1,024 | ) | — | — | — | 56 | |||||||||||||||||
| Deferred tax assets relating to other deductible temporary differences |
34,302 | (8,892 | ) | — | — | (823 | ) | 24,587 | ||||||||||||||||
| Total deferred tax assets |
158,283 | (16,265 | ) | 8,345 | — | (10,112 | ) | 140,251 | ||||||||||||||||
|
|
|
|
|
|
|
|
|
|
|
|
|
|||||||||||||
| Deferred Tax Liabilities |
Opening Balance 01-01-2015 ThU.S.$ |
Deferred tax Expenses (Income) ThU.S.$ |
Deferred tax of items charged to other comprehensive income ThU.S.$ |
Increase (decrease) from business combination ThU.S.$ |
Increase (decrease) Net exchange differences ThU.S.$ |
Closing balance 12/31/2015 ThU.S.$ |
||||||||||||||||||
| Deferred tax liabilities relating to property, plant and equipment |
941,666 | 5,221 | — | — | (16,279 | ) | 930,608 | |||||||||||||||||
| Deferred tax liabilities relating to financial instruments |
4,906 | 1,470 | — | — | 0 | 6,376 | ||||||||||||||||||
| Deferred tax liabilities relating to biological assets |
681,505 | 18,823 | — | 16,051 | (23,276 | ) | 693,103 | |||||||||||||||||
| Deferred tax liabilities relating to inventory |
25,688 | 6,224 | — | — | — | 31,912 | ||||||||||||||||||
| Deferred tax liabilities due to prepaid expenses |
40,888 | (184 | ) | — | — | 203 | 40,907 | |||||||||||||||||
| Deferred tax liabilities due to intangible |
32,990 | 2,666 | — | — | (9,237 | ) | 26,419 | |||||||||||||||||
| Deferred tax liabilities relating to other taxable temporary differences |
29,506 | (7,961 | ) | — | — | 4,658 | 26,203 | |||||||||||||||||
| Total deferred tax liabilities |
1,757,149 | 26,259 | — | 16,051 | (43,931 | ) | 1,755,528 | |||||||||||||||||
|
|
|
|
|
|
|
|
|
|
|
|
|
|||||||||||||
41
Table of Contents
CELULOSA ARAUCO Y CONSTITUCION S.A.
AND SUBSIDIARIES
Unaudited Consolidated Financial Statements
December 31, 2015
Amounts in thousands of U.S. dollars, except as indicated
| Deferred Tax Assets |
Opening Balance 01-01-2014 ThU.S.$ |
Deferred tax Expenses (Income) ThU.S.$ |
Deferred tax of items charged to other comprehensive income ThU.S.$ |
Increase (decrease) Net exchange differences ThU.S.$ |
Closing balance 12-31-2014 ThU.S.$ |
|||||||||||||||
| Deferred tax Assets relating to Provisions |
12,016 | 843 | 2,367 | (303 | ) | 14,923 | ||||||||||||||
| Deferred tax Assets relating to accrued liabilities |
10,118 | (242 | ) | 1,265 | (21 | ) | 11,120 | |||||||||||||
| Deferred tax Assets relating to Post-Employment benefits |
9,012 | (1,095 | ) | 6,036 | (94 | ) | 13,859 | |||||||||||||
| Deferred tax Assets relating to Property, Plant and equipment |
8,842 | 1,617 | 787 | (47 | ) | 11,199 | ||||||||||||||
| Deferred tax Assets relating to Financial Instruments |
343 | 355 | 13,431 | — | 14,129 | |||||||||||||||
| Deferred tax Assets relating to tax losses carryforwards |
56,333 | (9,427 | ) | 419 | (2,493 | ) | 44,832 | |||||||||||||
| Deferred tax assets relating to biological assets |
73 | (73 | ) | — | — | 0 | ||||||||||||||
| Deferred tax assets relating to provisions for income |
4,910 | (1,706 | ) | 82 | (129 | ) | 3,157 | |||||||||||||
| Deferred tax assets relating to provisions for income |
3,678 | 1,624 | 525 | — | 5,827 | |||||||||||||||
| Deferred tax assets relating to provision for doubful accounts |
3,104 | 574 | 218 | (41 | ) | 3,855 | ||||||||||||||
| Intangible revaluation differences |
— | 1,080 | 0 | — | 1,080 | |||||||||||||||
| Defferred tax assets relating to other deductible temporary differences |
52,169 | (20,064 | ) | 2,427 | (230 | ) | 34,302 | |||||||||||||
| Total deferred tax assets |
160,598 | (26,514 | ) | 27,557 | (3,358 | ) | 158,283 | |||||||||||||
|
|
|
|
|
|
|
|
|
|
|
|||||||||||
| Deferred Tax Liabilities |
Opening Balance 01-01-2014 ThU.S.$ |
Deferred tax Expenses (Income) ThU.S.$ |
Deferred tax of items charged to other comprehensive income ThU.S.$ |
Increase (decrease) Net exchange differences ThU.S.$ |
Closing balance 12-31-2014 ThU.S.$ |
|||||||||||||||
| Deferred tax liabilities relating to property, Plant and equipment |
781,777 | 8,393 | 158,106 | (6,610 | ) | 941,666 | ||||||||||||||
| Deferred tax liabilities relating to financial instruments |
10,060 | 677 | (5,831 | ) | — | 4,906 | ||||||||||||||
| Deferred tax liabilities relating to biological assets |
534,161 | 21,626 | 134,467 | (8,749 | ) | 681,505 | ||||||||||||||
| Deferred tax liabilities relating to inventory |
15,422 | 8,618 | 1,648 | — | 25,688 | |||||||||||||||
| Deferred tax liabilities due to prepaid expenses |
56,558 | (21,363 | ) | 5,693 | — | 40,888 | ||||||||||||||
| Deferred tax liabilities due to intangible |
34,188 | (1,533 | ) | 335 | — | 32,990 | ||||||||||||||
| Deferred tax liabilities relating to other taxable temporary differences |
30,129 | (2,752 | ) | 3,648 | (1,519 | ) | 29,506 | |||||||||||||
| Total deferred tax liabilities |
1,462,295 | 13,666 | 298,066 | (16,878 | ) | 1,757,149 | ||||||||||||||
|
|
|
|
|
|
|
|
|
|
|
|||||||||||
42
Table of Contents
CELULOSA ARAUCO Y CONSTITUCION S.A.
AND SUBSIDIARIES
Unaudited Consolidated Financial Statements
December 31, 2015
Amounts in thousands of U.S. dollars, except as indicated
Temporary Differences
The following tables summarize the deductible and taxable temporary differences:
| 12-31-2015 | 12-31-2014 | |||||||||||||||
| Deductible | Taxable | Deductible | Taxable | |||||||||||||
| Detail of classes of Deferred Tax Temporary Differences |
Difference ThU.S.$ |
Difference ThU.S.$ |
Difference ThU.S.$ |
Difference ThU.S.$ |
||||||||||||
| Deferred Tax Assets |
104,500 | 113,451 | ||||||||||||||
| Deferred Tax Assets—Tax losses |
35,751 | 44,832 | ||||||||||||||
| Deferred Tax Liabilities |
1,755,528 | 1,757,149 | ||||||||||||||
| Total |
140,251 | 1,755,528 | 158,283 | 1,757,149 | ||||||||||||
|
|
|
|
|
|
|
|
|
|||||||||
| January - December | ||||||||
| Detail of Temporary Difference Income and Loss Amounts |
2015 ThU.S.$ |
2014 ThU.S.$ |
||||||
| Deferred Tax Assets |
(15,306 | ) | (17,530 | ) | ||||
| Deferred Tax Assets—Tax losses |
(959 | ) | (9,427 | ) | ||||
| Deferred Tax Liabilities |
(26,259 | ) | (13,223 | ) | ||||
| Total |
(42,524 | ) | (40,180 | ) | ||||
|
|
|
|
|
|||||
Income Tax Expense
Income tax expense consists of the following:
| January - December | ||||||||
| Income Tax composition |
2015 ThU.S.$ |
2014 ThU.S.$ |
||||||
| Current income tax expense |
(87,908 | ) | (127,057 | ) | ||||
| Previous period current income tax adjustments |
4,033 | 2,555 | ||||||
| Other current tax expenses |
(3,295 | ) | 8,747 | |||||
| Current Tax Expense, Net |
(87,170 | ) | (115,755 | ) | ||||
| Deferred tax income (expense) relating to origination and reversal of temporary differences |
(41,565 | ) | (30,753 | ) | ||||
| Tax benefit arising from previously unrecognized tax assets used to reduce deferred expense from taxes |
(959 | ) | (9,427 | ) | ||||
| Total deferred Tax Expense, Net |
(42,524 | ) | (40,180 | ) | ||||
| Income Tax Expense, Total |
(129,694 | ) | (155,935 | ) | ||||
|
|
|
|
|
|||||
43
Table of Contents
CELULOSA ARAUCO Y CONSTITUCION S.A.
AND SUBSIDIARIES
Unaudited Consolidated Financial Statements
December 31, 2015
Amounts in thousands of U.S. dollars, except as indicated
The following table sets for the current income tax expense detailed by foreign and domestic companies at December 31, 2015 and 2014:
| January - December | ||||||||
| 2015 ThU.S.$ |
2014 ThU.S.$ |
|||||||
| Foreign current income tax expense |
(33,129 | ) | (30,458 | ) | ||||
| Domestic current income tax expense |
(54,041 | ) | (85,297 | ) | ||||
| Total current income tax expense |
(87,170 | ) | (115,755 | ) | ||||
| Foreign deferred tax expense |
(17,240 | ) | (25,806 | ) | ||||
| Domestic deferred tax expense |
(25,284 | ) | (14,374 | ) | ||||
| Total deferred tax expense |
(42,524 | ) | (40,180 | ) | ||||
| Total tax income (expense) |
(129,694 | ) | (155,935 | ) | ||||
|
|
|
|
|
|||||
Reconciliation of income tax expense from statutory tax rate to the effective tax rate.
The reconciliation of income tax expense is as follows:
| January - December | ||||||||
| 2015 | 2014 | |||||||
| Reconciliation of Income tax from Statutory Rate to Effective Tax Rate |
ThU.S.$ | ThU.S.$ | ||||||
| Tax Expense at applicable tax rate |
(111,916 | ) | (124,493 | ) | ||||
| Tax effect of foreign tax rates |
(16,099 | ) | (23,170 | ) | ||||
| Tax effect of revenues exempt from taxation |
41,268 | 9,832 | ||||||
| Tax effect of expense not deductible in determining taxable profit (tax loss) |
(40,866 | ) | (19,203 | ) | ||||
| Tax rate effect of tax losses not previously recognized |
14 | (515 | ) | |||||
| Tax rate effect from change in tax rate (opening balances) |
(3,445 | ) | (1,839 | ) | ||||
| Tax rate effect of adjustments for current tax of prior periods |
4,033 | 2,555 | ||||||
| Other tax rate effects |
(2,683 | ) | 898 | |||||
| Total adjustments to tax expense at applicable tax rate |
(17,778 | ) | (31,442 | ) | ||||
| Tax expense at effective tax rate |
(129,694 | ) | (155,935 | ) | ||||
|
|
|
|
|
|||||
44
Table of Contents
CELULOSA ARAUCO Y CONSTITUCION S.A.
AND SUBSIDIARIES
Unaudited Consolidated Financial Statements
December 31, 2015
Amounts in thousands of U.S. dollars, except as indicated
NOTE 7. PROPERTY, PLANT AND EQUIPMENT
| 12-31-2015 | 12-31-2014 | |||||||
| Property, Plant and Equipment, Net |
ThU.S.$ | ThU.S.$ | ||||||
| Construction in progress |
251,519 | 265,440 | ||||||
| Land |
951,638 | 949,531 | ||||||
| Buildings |
2,182,643 | 2,172,177 | ||||||
| Plant and equipment |
3,346,675 | 3,565,502 | ||||||
| Information technology equipment |
26,210 | 28,521 | ||||||
| Fixtures and fittings |
11,860 | 11,654 | ||||||
| Motor vehicles |
16,721 | 17,346 | ||||||
| Other property, plant and equipment |
109,130 | 109,412 | ||||||
| Total Net |
6,896,396 | 7,119,583 | ||||||
|
|
|
|
|
|||||
| Property, Plant and Equipment, Gross |
||||||||
| Construction in progress |
251,519 | 265,440 | ||||||
| Land |
951,638 | 949,531 | ||||||
| Buildings |
3,698,351 | 3,593,306 | ||||||
| Plant and equipment |
5,927,789 | 5,944,394 | ||||||
| Information technology equipment |
73,573 | 71,838 | ||||||
| Fixtures and fittings |
35,283 | 37,382 | ||||||
| Motor vehicles |
45,503 | 46,293 | ||||||
| Other property, plant and equipment |
131,894 | 128,012 | ||||||
| Total Gross |
11,115,550 | 11,036,196 | ||||||
|
|
|
|
|
|||||
| Accumulated depreciation and impairment |
||||||||
| Buildings |
(1,515,708 | ) | (1,421,129 | ) | ||||
| Plant and equipment |
(2,581,114 | ) | (2,378,892 | ) | ||||
| Information technology equipment |
(47,363 | ) | (43,317 | ) | ||||
| Fixtures and fittings |
(23,423 | ) | (25,728 | ) | ||||
| Motor vehicles |
(28,782 | ) | (28,947 | ) | ||||
| Other property, plant and equipment |
(22,764 | ) | (18,600 | ) | ||||
| Total |
(4,219,154 | ) | (3,916,613 | ) | ||||
|
|
|
|
|
|||||
Description of Property, Plant and Equipment Pledged as Security for Liabilities
To date there are no significant assets pledged as collateral for these consolidated financial statements.
45
Table of Contents
CELULOSA ARAUCO Y CONSTITUCION S.A.
AND SUBSIDIARIES
Unaudited Consolidated Financial Statements
December 31, 2015
Amounts in thousands of U.S. dollars, except as indicated
Commitments for project disbursements or for the acquisition of property, plant and equipment.
| 12-31-2015 ThU.S.$ |
12-31-2014 ThU.S.$ |
|||||||
| Amount committed for the acquisition of property, plant and equipment |
109,713 | 139,927 | ||||||
| 12-31-2015 | 12-31-2014 | |||||||
| ThU.S.$ | ThU.S.$ | |||||||
| Disbursements for property, plant and equipment under construction |
215,035 | 371,286 | ||||||
46
Table of Contents
CELULOSA ARAUCO Y CONSTITUCION S.A.
AND SUBSIDIARIES
Unaudited Consolidated Financial Statements
December 31, 2015
Amounts in thousands of U.S. dollars, except as indicated
Movement on Property, Plant and Equipment
The following tables set forth the reconciliation of the carrying amount of property, plant and equipment as of December 31, 2015 and 2014:
| Movement of Property, Plant and Equipment |
Construction in progress ThU.S.$ |
Land ThU.S.$ |
Buildings ThU.S.$ |
Plant and equipments ThU.S.$ |
IT Equipment ThU.S.$ |
Fixtures and fittings ThU.S.$ |
Motor vehicles ThU.S.$ |
Other Property, Plant and Equipment ThU.S.$ |
TOTAL ThU.S.$ |
|||||||||||||||||||||||||||
| Opening Balance 01-01-2015 |
265,440 | 949,531 | 2,172,177 | 3,565,502 | 28,521 | 11,654 | 17,346 | 109,412 | 7,119,583 | |||||||||||||||||||||||||||
| Changes |
||||||||||||||||||||||||||||||||||||
| Additions |
215,035 | 50,504 | 17,360 | 139,749 | 2,178 | 2,234 | 1,829 | 9,774 | 438,663 | |||||||||||||||||||||||||||
| Acquisitions through business combinations |
— | — | 1,474 | 7 | — | 15 | — | — | 1,496 | |||||||||||||||||||||||||||
| Disposals |
(20 | ) | (591 | ) | (456 | ) | (583 | ) | (78 | ) | (5 | ) | (432 | ) | (10 | ) | (2,175 | ) | ||||||||||||||||||
| Retirements |
(4,596 | ) | (44 | ) | (1,389 | ) | (1,942 | ) | (5 | ) | (7 | ) | (101 | ) | (481 | ) | (8,565 | ) | ||||||||||||||||||
| Depreciation |
— | — | (117,337 | ) | (320,135 | ) | (5,302 | ) | (2,980 | ) | (4,110 | ) | (5,915 | ) | (455,779 | ) | ||||||||||||||||||||
| Impairment loss recognized in profit or loss |
— | — | — | (4,065 | ) | — | — | 0 | — | (4,065 | ) | |||||||||||||||||||||||||
| Increase (decrease) through net exchange differences |
(4,432 | ) | (52,284 | ) | (30,258 | ) | (103,972 | ) | (290 | ) | (519 | ) | (300 | ) | (6,025 | ) | (198,080 | ) | ||||||||||||||||||
| Reclassification of assets held for sale |
— | 2,759 | 2,676 | (117 | ) | — | — | — | — | 5,318 | ||||||||||||||||||||||||||
| Increase (decrease) through transfers from construction in progress |
(219,908 | ) | 1,763 | 138,396 | 72,231 | 1,186 | 1,468 | 2,489 | 2,375 | — | ||||||||||||||||||||||||||
| Total changes |
(13,921 | ) | 2,107 | 10,466 | (218,827 | ) | (2,311 | ) | 206 | (625 | ) | (282 | ) | (223,187 | ) | |||||||||||||||||||||
| Closing balance 12-31-2015 |
251,519 | 951,638 | 2,182,643 | 3,346,675 | 26,210 | 11,860 | 16,721 | 109,130 | 6,896,396 | |||||||||||||||||||||||||||
|
|
|
|
|
|
|
|
|
|
|
|
|
|
|
|
|
|
|
|||||||||||||||||||
| Movement of Property, Plant and Equipment |
Construction in progress ThU.S.$ |
Land ThU.S.$ |
Buildings ThU.S.$ |
Plant and equipments ThU.S.$ |
IT Equipment ThU.S.$ |
Fixtures and fittings ThU.S.$ |
Motor vehicles ThU.S.$ |
Other Property, Plant and Equipment ThU.S.$ |
TOTAL ThU.S.$ |
|||||||||||||||||||||||||||
| Opening Balance 01-01-2014 |
1,542,739 | 975,617 | 1,694,924 | 2,774,551 | 25,575 | 7,627 | 13,597 | 102,837 | 7,137,467 | |||||||||||||||||||||||||||
| Changes |
||||||||||||||||||||||||||||||||||||
| Additions |
371,286 | 1,215 | 17,438 | 54,011 | 2,605 | 1,195 | 4,608 | 18,828 | 471,186 | |||||||||||||||||||||||||||
| Disposals |
(2,969 | ) | (5,596 | ) | (513 | ) | (1,715 | ) | (59 | ) | (515 | ) | (458 | ) | (776 | ) | (12,601 | ) | ||||||||||||||||||
| Retirements |
(6,278 | ) | (41 | ) | (17,369 | ) | (23,026 | ) | (12 | ) | (6 | ) | (247 | ) | (5,670 | ) | (52,649 | ) | ||||||||||||||||||
| Depreciation |
— | — | (102,068 | ) | (222,232 | ) | (4,944 | ) | (2,084 | ) | (4,241 | ) | (4,018 | ) | (339,587 | ) | ||||||||||||||||||||
| Impairment loss recognized in profit or loss |
— | — | — | — | — | — | (636 | ) | — | (636 | ) | |||||||||||||||||||||||||
| Increase (decrease) through net exchange differences |
310 | (21,664 | ) | (30,620 | ) | (26,928 | ) | (269 | ) | (175 | ) | (123 | ) | (2,198 | ) | (81,667 | ) | |||||||||||||||||||
| Reclassification of assets held for sale |
(1,930 | ) | — | — | — | — | — | — | — | (1,930 | ) | |||||||||||||||||||||||||
| Increase (decrease) through transfers from construction in progress |
(1,637,718 | ) | — | 610,385 | 1,010,841 | 5,625 | 5,612 | 4,846 | 409 | — | ||||||||||||||||||||||||||
| Total changes |
(1,277,299 | ) | (26,086 | ) | 477,253 | 790,951 | 2,946 | 4,027 | 3,749 | 6,575 | (17,884 | ) | ||||||||||||||||||||||||
| Closing balance 12-31-2014 |
265,440 | 949,531 | 2,172,177 | 3,565,502 | 28,521 | 11,654 | 17,346 | 109,412 | 7,119,583 | |||||||||||||||||||||||||||
|
|
|
|
|
|
|
|
|
|
|
|
|
|
|
|
|
|
|
|||||||||||||||||||
47
Table of Contents
CELULOSA ARAUCO Y CONSTITUCION S.A.
AND SUBSIDIARIES
Unaudited Consolidated Financial Statements
December 31, 2015
Amounts in thousands of U.S. dollars, except as indicated
The depreciation expense for the period ending December 31, 2015 and 2014 is as follows:
| January-December | ||||||||
| 2015 | 2014 | |||||||
| Depreciation for the year |
ThU.S.$ | ThU.S.$ | ||||||
| Cost of sales |
365,401 | 316,607 | ||||||
| Administrative expenses |
19,084 | 19,910 | ||||||
| Other expenses |
3,707 | 4,442 | ||||||
| Total |
388,192 | 340,959 | ||||||
|
|
|
|
|
|||||
The useful lives of property, plant and equipment are estimated based on the expected use of the assets. The average useful lives by asset class are as follows:
| Useful Life (Average) |
||||
| Buildings |
58 | |||
| Plant and equipment |
30 | |||
| Information technology equipment |
18 | |||
| Fixtures and fittings |
28 | |||
| Motor vehicles |
11 | |||
| Other property, plant and equipment |
14 | |||
See Note 12 for details of capitalized borrowing costs.
48
Table of Contents
CELULOSA ARAUCO Y CONSTITUCION S.A.
AND SUBSIDIARIES
Unaudited Consolidated Financial Statements
December 31, 2015
Amounts in thousands of U.S. dollars, except as indicated
NOTE 8. LEASES
Arauco acting as lessee
| 12-31-2015 | 12-31-2014 | |||||||
| ThU.S.$ | ThU.S.$ | |||||||
| Property, Plant and Equipment under finance leases |
132,836 | 94,996 | ||||||
| Plant and equipment |
132,836 | 94,996 | ||||||
|
|
|
|
|
|||||
Reconciliation of Financial Lease Minimum Payments:
| 12-31-2015 | ||||
| Present Value | ||||
| Periods |
ThU.S.$ | |||
| Less than one year |
36,862 | |||
| Between one and five years |
90,697 | |||
| More than five years |
— | |||
| Total |
127,559 | |||
|
|
|
|||
| 12-31-2014 | ||||
| Present Value | ||||
| Periods |
ThU.S.$ | |||
| Less than one year |
31,706 | |||
| Between one and five years |
65,289 | |||
| More than five years |
— | |||
| Total |
96,995 | |||
|
|
|
|||
Lease obligations are presented in the consolidated statement of financial position in line items “Other current financial liabilities” and “Other non-current financial liabilities” depending on their respective maturities as stated above.
49
Table of Contents
CELULOSA ARAUCO Y CONSTITUCION S.A.
AND SUBSIDIARIES
Unaudited Consolidated Financial Statements
December 31, 2015
Amounts in thousands of U.S. dollars, except as indicated
Arauco acting as lessor
Reconciliation of Financial Lease Minimum Payments:
| 12-31-2015 | ||||||||||||
| Gross | Interest | Present Value | ||||||||||
| Periods |
ThU.S.$ | ThU.S.$ | ThU.S.$ | |||||||||
| Less than one year |
10 | 1 | 9 | |||||||||
| Between one and five years |
6 | 0 | 6 | |||||||||
| More than five years |
— | — | — | |||||||||
| Total |
16 | 1 | 15 | |||||||||
|
|
|
|
|
|
|
|||||||
| 12-31-2014 | ||||||||||||
| Gross | Interest | Present Value | ||||||||||
| Periods |
ThU.S.$ | ThU.S.$ | ThU.S.$ | |||||||||
| Less than one year |
141 | 5 | 136 | |||||||||
| Between one and five years |
20 | 3 | 17 | |||||||||
| More than five years |
— | — | — | |||||||||
| Total |
161 | 8 | 153 | |||||||||
|
|
|
|
|
|
|
|||||||
Finance lease receivables are presented in the consolidated statement of financial position in line items “Trade and other current receivable” and “Trade and other non-current receivable” depending on their maturities stated above.
Arauco accounts for its lease contracts as finance leases. These lease contracts are for a term of less than five-years at market interest rates and leased assets are forestry machinery and equipment. They also include an early termination option, under general and special conditions stipulated in each contract.
Arauco holds leases as lessee and lessor, described in the previous tables, for which there are no impairment contingent payments or restrictions to report.
NOTE 9. REVENUE
| January - December | ||||||||
| Classes of revenue |
2015 ThU.S.$ |
2014 ThU.S.$ |
||||||
| Revenue from sales of goods |
5,018,138 | 5,174,936 | ||||||
| Revenue from rendering of services |
128,602 | 167,707 | ||||||
| Total |
5,146,740 | 5,342,643 | ||||||
|
|
|
|
|
|||||
50
Table of Contents
CELULOSA ARAUCO Y CONSTITUCION S.A.
AND SUBSIDIARIES
Unaudited Consolidated Financial Statements
December 31, 2015
Amounts in thousands of U.S. dollars, except as indicated
NOTE 10. EMPLOYEE BENEFITS
Classes of Benefits and Expenses by Employee
| 2015 | 2014 | |||||||
| ThU.S.$ | ThU.S.$ | |||||||
| Employee expenses |
537,629 | 525,220 | ||||||
| Wages and salaries |
519,066 | 514,826 | ||||||
| Severance indemnities |
18,563 | 10,394 | ||||||
| 2015 | 2014 | |||
| Discount rate |
4.91% | 4.61% | ||
| Inflation |
2.95% | 2.97% | ||
| Annual rate of wage growth |
5.22% | 5.79% | ||
| Mortality rate |
RV-2009 | RV-2009 |
| sensitivities to assumptions | Th.U.S.$ | |||
| Discount rate |
||||
| Increase in 100 bps |
(3,943 | ) | ||
| Decrease in 100 bps |
4,608 | |||
|
|
|
|||
| Wage growth rates |
||||
| Increase in 100 bps |
4,546 | |||
| Decrease in 100 bps |
(3,967 | ) | ||
|
|
|
|||
The following tables set forth the balances and the reconciliation of the present value of severance indemnities obligations as of December 31, 2015 and 2014:
| 12-31-2015 | 12-31-2014 | |||||||
| ThU.S.$ | ThU.S.$ | |||||||
| Current |
4,497 | 3,590 | ||||||
| Non-current |
51,936 | 48,582 | ||||||
| Total |
56,433 | 52,172 | ||||||
|
|
|
|
|
|||||
| 12-31-2015 | 12-31-2014 | |||||||
| Reconciliation of the present value of severance indemnities obligations |
ThU.S.$ | ThU.S.$ | ||||||
| Opening balance |
52,172 | 45,984 | ||||||
| Current service cost |
13,032 | 1,938 | ||||||
| Interest cost |
2,257 | 2,977 | ||||||
| Gains or losses from changes in actuarial assumptions |
(5,723 | ) | 8,640 | |||||
| Actuarial gains and losses arising from experience |
6,980 | 4,189 | ||||||
| Benefits paid |
(3,482 | ) | (5,388 | ) | ||||
| Increase (decrease) for foreign currency exchange rates changes |
(8,803 | ) | (6,168 | ) | ||||
| Closing balance |
56,433 | 52,172 | ||||||
|
|
|
|
|
|||||
51
Table of Contents
CELULOSA ARAUCO Y CONSTITUCION S.A.
AND SUBSIDIARIES
Unaudited Consolidated Financial Statements
December 31, 2015
Amounts in thousands of U.S. dollars, except as indicated
NOTE 11. BALANCES IN FOREIGN CURRENCY AND FOREIGN CURRENCY EXCHANGE RATE IMPACT IN PROFIT OR LOSS.
| 12-31-2015 | 12-31-2014 | |||||||
| ThU.S.$ | ThU.S.$ | |||||||
| Total Current Assets |
2,651,920 | 3,140,715 | ||||||
| Cash and Cash Equivalents |
500,025 | 971,152 | ||||||
| U.S Dollar |
388,818 | 877,418 | ||||||
| Euro |
2,501 | 8,114 | ||||||
| Brazilian Real |
21,676 | 43,604 | ||||||
| Argentine Pesos |
40,573 | 15,794 | ||||||
| Other currencies |
2,979 | 2,983 | ||||||
| Chilean Pesos |
43,478 | 23,239 | ||||||
| Other current financial assets |
32,195 | 7,633 | ||||||
| U.S Dollar |
29,367 | 7,632 | ||||||
| Argentine Pesos |
2,828 | — | ||||||
| Chilean Pesos |
— | 1 | ||||||
| Other current non-financial assets |
133,956 | 177,728 | ||||||
| U.S Dollar |
55,365 | 103,689 | ||||||
| Euros |
82 | 45 | ||||||
| Brazilian Real |
16,505 | 11,489 | ||||||
| Argentine Pesos |
3,705 | 13,711 | ||||||
| Other currencies |
4,801 | 6,335 | ||||||
| Chilean Pesos |
53,280 | 42,459 | ||||||
| U.F. |
218 | — | ||||||
| Trade and other current receivables |
733,322 | 731,908 | ||||||
| U.S Dollar |
507,032 | 464,219 | ||||||
| Euro |
27,595 | 72,353 | ||||||
| Brazilian Real |
37,975 | 47,043 | ||||||
| Argentine Pesos |
23,016 | 31,354 | ||||||
| Other currencies |
14,091 | 19,733 | ||||||
| Chilean Pesos |
123,056 | 96,241 | ||||||
| U.F. |
557 | 965 | ||||||
| Accounts receivable from related companies |
3,124 | 4,705 | ||||||
| U.S Dollar |
21 | — | ||||||
| Brazilian Real |
995 | 1,998 | ||||||
| Chilean Pesos |
2,108 | 2,707 | ||||||
| Current Inventories |
909,988 | 893,573 | ||||||
| U.S Dollar |
871,629 | 829,830 | ||||||
| Brazilian Real |
38,359 | 48,046 | ||||||
| Chilean Pesos |
— | 15,697 | ||||||
| Current biological assets |
272,037 | 307,551 | ||||||
| U.S Dollar |
272,037 | 307,551 | ||||||
| Current tax assets |
64,079 | 38,477 | ||||||
| U.S Dollar |
5,464 | 2,358 | ||||||
| Euros |
— | 81 | ||||||
| Brazilian Real |
5,243 | 2,691 | ||||||
| Argentine Pesos |
2,000 | 1,464 | ||||||
| Other currencies |
850 | 3,653 | ||||||
| Chilean Pesos |
50,522 | 28,230 | ||||||
52
Table of Contents
CELULOSA ARAUCO Y CONSTITUCION S.A.
AND SUBSIDIARIES
Unaudited Consolidated Financial Statements
December 31, 2015
Amounts in thousands of U.S. dollars, except as indicated
| Non-current assets or disposal groups classified as held for sale or as held for distribution to owners |
3,194 | 7,988 | ||||||
| U.S Dollar |
3,194 | 7,988 |
53
Table of Contents
CELULOSA ARAUCO Y CONSTITUCION S.A.
AND SUBSIDIARIES
Unaudited Consolidated Financial Statements
December 31, 2015
Amounts in thousands of U.S. dollars, except as indicated
| 12-31-2015 | 12-31-2014 | |||||||
| ThU.S.$ | ThU.S.$ | |||||||
| Total Non Current Assets |
11,154,987 | 11,607,182 | ||||||
| Other non-current financial assets |
595 | 5,024 | ||||||
| U.S Dollar |
212 | 4,439 | ||||||
| Argentine Pesos |
383 | 585 | ||||||
| Other non-current non-financial assets |
125,516 | 101,094 | ||||||
| U.S Dollar |
114,164 | 92,437 | ||||||
| Brazilian Real |
2,987 | 5,705 | ||||||
| Argentine Pesos |
7,138 | 563 | ||||||
| Other currencies |
706 | 885 | ||||||
| Chilean Pesos |
521 | 1,504 | ||||||
| Trade and other non-current receivables |
15,270 | 31,001 | ||||||
| U.S Dollar |
9,976 | 26,773 | ||||||
| Other currencies |
729 | — | ||||||
| Chilean Pesos |
3,145 | 3,591 | ||||||
| U.F. |
1,420 | 637 | ||||||
| Related party receivables, non current |
— | 151,519 | ||||||
| Brazilian Reales |
— | 151,519 | ||||||
| Investments accounted for using equity method |
264,812 | 326,045 | ||||||
| U.S Dollar |
122,483 | 119,405 | ||||||
| Brazilian Real |
142,329 | 206,640 | ||||||
| Intangible assets other than goodwill |
88,112 | 93,258 | ||||||
| U.S Dollar |
87,154 | 91,408 | ||||||
| Brazilian Real |
876 | 1,771 | ||||||
| Chilean Pesos |
82 | 79 | ||||||
| Goodwill |
69,475 | 82,573 | ||||||
| U.S Dollar |
42,445 | 42,838 | ||||||
| Brazilian Real |
27,030 | 39,735 | ||||||
| Property, plant and equipment |
6,896,396 | 7,119,583 | ||||||
| U.S Dollar |
6,448,616 | 6,527,093 | ||||||
| Brazilian Real |
442,959 | 586,398 | ||||||
| Chilean Pesos |
4,821 | 6,092 | ||||||
| Non-current biological assets |
3,554,560 | 3,538,802 | ||||||
| U.S Dollar |
3,297,710 | 3,188,043 | ||||||
| Brazilian Real |
256,850 | 350,759 | ||||||
| Deferred tax assets |
140,251 | 158,283 | ||||||
| U.S Dollar |
122,374 | 129,119 | ||||||
| Brazilian Real |
17,538 | 28,345 | ||||||
| Other currencies |
— | 67 | ||||||
| Chilean Pesos |
339 | 752 | ||||||
54
Table of Contents
CELULOSA ARAUCO Y CONSTITUCION S.A.
AND SUBSIDIARIES
Unaudited Consolidated Financial Statements
December 31, 2015
Amounts in thousands of U.S. dollars, except as indicated
| Up to 90 days | 12-31-2015 From 91 days |
Total | Up to 90 days | 12-31-2014 From 91 days |
Total | |||||||||||||||||||
| ThU.S.$ | ThU.S.$ | ThU.S.$ | ThU.S.$ | ThU.S.$ | ThU.S.$ | |||||||||||||||||||
| Total Liabilities, current |
910,436 | 123,815 | 1,034,251 | 1,002,859 | 544,227 | 1,547,086 | ||||||||||||||||||
| Other current financial liabilities |
189,693 | 106,345 | 296,038 | 203,170 | 539,173 | 742,343 | ||||||||||||||||||
| U.S Dollar |
153,361 | 71,330 | 224,691 | 173,579 | 484,254 | 657,833 | ||||||||||||||||||
| Brazilian Real |
25,092 | 2,266 | 27,358 | 17,145 | 27,507 | 44,652 | ||||||||||||||||||
| Argentine Pesos |
— | 356 | 356 | — | 544 | 544 | ||||||||||||||||||
| Chilean Pesos |
902 | 2,622 | 3,524 | 288 | 809 | 1,097 | ||||||||||||||||||
| U.F. |
10,338 | 29,771 | 40,109 | 12,158 | 26,059 | 38,217 | ||||||||||||||||||
| Bank Loans |
126,795 | 72,948 | 199,743 | 139,916 | 133,554 | 273,470 | ||||||||||||||||||
| U.S Dollar |
101,703 | 70,326 | 172,029 | 122,771 | 105,503 | 228,274 | ||||||||||||||||||
| Brazilian Real |
25,092 | 2,266 | 27,358 | 17,145 | 27,507 | 44,652 | ||||||||||||||||||
| Argentine Pesos |
— | 356 | 356 | — | 544 | 544 | ||||||||||||||||||
| Financial Leases |
9,301 | 27,561 | 36,862 | 7,851 | 23,855 | 31,706 | ||||||||||||||||||
| U.S Dollar |
— | — | — | — | 6 | 6 | ||||||||||||||||||
| Chilean Pesos |
902 | 2,622 | 3,524 | 288 | 809 | 1,097 | ||||||||||||||||||
| U.F. |
8,399 | 24,939 | 33,338 | 7,563 | 23,040 | 30,603 | ||||||||||||||||||
| Other Loans |
53,597 | 5,836 | 59,433 | 55,403 | 381,764 | 437,167 | ||||||||||||||||||
| U.S Dollar |
51,658 | 1,004 | 52,662 | 50,808 | 378,745 | 429,553 | ||||||||||||||||||
| U.F. |
1,939 | 4,832 | 6,771 | 4,595 | 3,019 | 7,614 | ||||||||||||||||||
| Trade and other current payables |
583,018 | — | 583,018 | 627,972 | 2,434 | 630,406 | ||||||||||||||||||
| U.S Dollar |
174,469 | — | 174,469 | 180,164 | — | 180,164 | ||||||||||||||||||
| Euros |
8,808 | — | 8,808 | 44,887 | — | 44,887 | ||||||||||||||||||
| Brazilian Real |
25,616 | — | 25,616 | 22,662 | 2,434 | 25,096 | ||||||||||||||||||
| Argentine Pesos |
27,068 | — | 27,068 | 34,879 | — | 34,879 | ||||||||||||||||||
| Other currencies |
17,619 | — | 17,619 | 2,187 | — | 2,187 | ||||||||||||||||||
| Chilean Pesos |
324,361 | — | 324,361 | 340,858 | — | 340,858 | ||||||||||||||||||
| U.F. |
5,077 | — | 5,077 | 2,335 | — | 2,335 | ||||||||||||||||||
| Accounts payable to related companies |
7,141 | — | 7,141 | 6,036 | — | 6,036 | ||||||||||||||||||
| U.S Dollar |
962 | — | 962 | 1,612 | — | 1,612 | ||||||||||||||||||
| Chilean Pesos |
6,179 | — | 6,179 | 4,424 | — | 4,424 | ||||||||||||||||||
| Other current provisions |
858 | — | 858 | 2,535 | — | 2,535 | ||||||||||||||||||
| U.S Dollar |
858 | — | 858 | 2,535 | — | 2,535 | ||||||||||||||||||
| Current tax liabilities |
10,030 | 946 | 10,976 | 25,860 | — | 25,860 | ||||||||||||||||||
| U.S Dollar |
6,380 | — | 6,380 | 782 | — | 782 | ||||||||||||||||||
| Euros |
1,093 | — | 1,093 | — | — | — | ||||||||||||||||||
| Brazilian Real |
530 | — | 530 | 1,921 | — | 1,921 | ||||||||||||||||||
| Argentine Pesos |
24 | — | 24 | 6,063 | — | 6,063 | ||||||||||||||||||
| Other currencies |
1,716 | — | 1,716 | — | — | — | ||||||||||||||||||
| Chilean Pesos |
287 | 946 | 1,233 | 17,094 | — | 17,094 | ||||||||||||||||||
| Current provisions for employee benefits |
1,751 | 2,746 | 4,497 | 1,211 | 2,379 | 3,590 | ||||||||||||||||||
| Chilean Pesos |
1,751 | 2,746 | 4,497 | 1,211 | 2,379 | 3,590 | ||||||||||||||||||
| Other current non-financial liabilities |
117,945 | 13,778 | 131,723 | 136,075 | 241 | 136,316 | ||||||||||||||||||
| U.S Dollar |
79,673 | 13,633 | 93,306 | 100,904 | — | 100,904 | ||||||||||||||||||
| Euros |
44 | — | 44 | — | — | — | ||||||||||||||||||
| Brazilian Real |
22,251 | — | 22,251 | 19,041 | — | 19,041 | ||||||||||||||||||
| Argentine Pesos |
4,428 | 139 | 4,567 | 6,143 | 184 | 6,327 | ||||||||||||||||||
| Other currencies |
3,704 | — | 3,704 | 4,307 | — | 4,307 | ||||||||||||||||||
| Chilean Pesos |
7,823 | 6 | 7,829 | 5,575 | 57 | 5,632 | ||||||||||||||||||
| U.F. |
22 | — | 22 | 105 | — | 105 | ||||||||||||||||||
55
Table of Contents
CELULOSA ARAUCO Y CONSTITUCION S.A.
AND SUBSIDIARIES
Unaudited Consolidated Financial Statements
December 31, 2015
Amounts in thousands of U.S. dollars, except as indicated
| From 13 months to 5 years |
12-31-2015 More than |
Total | From 13 months to 5 years |
12-31-2014 More than |
Total | |||||||||||||||||||
| ThU.S.$ | ThU.S.$ | ThU.S.$ | ThU.S.$ | ThU.S.$ | ThU.S.$ | |||||||||||||||||||
| Total non-current liabilities |
3,868,722 | 2,257,489 | 6,126,211 | 3,412,073 | 2,974,002 | 6,386,075 | ||||||||||||||||||
| Other non-current financial liabilities |
2,141,600 | 2,095,365 | 4,236,965 | 1,943,952 | 2,509,867 | 4,453,819 | ||||||||||||||||||
| U.S Dollar |
1,748,723 | 1,525,269 | 3,273,992 | 1,767,326 | 1,603,825 | 3,371,151 | ||||||||||||||||||
| Brazilian Real |
13,953 | 1,929 | 15,882 | 34,612 | 18,434 | 53,046 | ||||||||||||||||||
| Argentine Pesos |
48 | — | 48 | 614 | — | 614 | ||||||||||||||||||
| Chilean Pesos |
10,455 | — | 10,455 | 2,352 | — | 2,352 | ||||||||||||||||||
| U.F. |
368,421 | 568,167 | 936,588 | 139,048 | 887,608 | 1,026,656 | ||||||||||||||||||
| Bank Loans |
648,017 | 149,782 | 797,799 | 797,628 | 248,117 | 1,045,745 | ||||||||||||||||||
| U.S Dollar |
634,016 | 147,853 | 781,869 | 762,402 | 229,683 | 992,085 | ||||||||||||||||||
| Brazilian Real |
13,953 | 1,929 | 15,882 | 34,612 | 18,434 | 53,046 | ||||||||||||||||||
| Argentine Pesos |
48 | — | 48 | 614 | — | 614 | ||||||||||||||||||
| Financial Leases |
90,697 | — | 90,697 | 65,289 | — | 65,289 | ||||||||||||||||||
| Chilean Pesos |
10,455 | — | 10,455 | 2,352 | — | 2,352 | ||||||||||||||||||
| U.F. |
80,242 | — | 80,242 | 62,937 | — | 62,937 | ||||||||||||||||||
| Other Loans |
1,402,886 | 1,945,583 | 3,348,469 | 1,081,035 | 2,261,750 | 3,342,785 | ||||||||||||||||||
| U.S Dollar |
1,114,707 | 1,377,416 | 2,492,123 | 1,004,924 | 1,374,142 | 2,379,066 | ||||||||||||||||||
| U.F. |
288,179 | 568,167 | 856,346 | 76,111 | 887,608 | 963,719 | ||||||||||||||||||
| Other non-current provisions |
34,541 | — | 34,541 | 64,529 | — | 64,529 | ||||||||||||||||||
| U.S Dollar |
4 | — | 4 | 4 | — | 4 | ||||||||||||||||||
| Brazilian Real |
4,410 | — | 4,410 | 31,374 | — | 31,374 | ||||||||||||||||||
| Argentine Pesos |
30,127 | — | 30,127 | 30,301 | — | 30,301 | ||||||||||||||||||
| Chileans $ |
— | — | — | 2,850 | — | 2,850 | ||||||||||||||||||
| Deferred tax liabilities |
1,593,404 | 162,124 | 1,755,528 | 1,299,714 | 457,435 | 1,757,149 | ||||||||||||||||||
| U.S Dollar |
1,508,250 | 162,124 | 1,670,374 | 1,159,805 | 457,435 | 1,617,240 | ||||||||||||||||||
| Euros |
— | — | — | 4,044 | — | 4,044 | ||||||||||||||||||
| Brazilian Real |
84,976 | — | 84,976 | 135,600 | — | 135,600 | ||||||||||||||||||
| Chilean Pesos |
178 | — | 178 | 265 | — | 265 | ||||||||||||||||||
| Non-current provisions for employee benefits |
51,936 | — | 51,936 | 41,882 | 6,700 | 48,582 | ||||||||||||||||||
| Other currencies |
149 | — | 149 | 172 | — | 172 | ||||||||||||||||||
| Chilean Pesos |
51,787 | — | 51,787 | 41,710 | 6,700 | 48,410 | ||||||||||||||||||
| Other non-current non-financial liabilities |
47,241 | — | 47,241 | 61,996 | — | 61,996 | ||||||||||||||||||
| U.S Dollar |
392 | — | 392 | 1,043 | — | 1,043 | ||||||||||||||||||
| Brazilian Real |
46,043 | — | 46,043 | 59,497 | — | 59,497 | ||||||||||||||||||
| Argentine Pesos |
608 | — | 608 | 1,206 | — | 1,206 | ||||||||||||||||||
| Chilean Pesos |
195 | — | 195 | 246 | — | 246 | ||||||||||||||||||
| U.F. |
3 | — | 3 | 4 | — | 4 | ||||||||||||||||||
56
Table of Contents
CELULOSA ARAUCO Y CONSTITUCION S.A.
AND SUBSIDIARIES
Unaudited Consolidated Financial Statements
December 31, 2015
Amounts in thousands of U.S. dollars, except as indicated
The table below sets forth the subsidiaries that have determined a functional currency other than the U.S. Dollar as follows:
| Subsidiary |
Country |
Functional Currency | ||
| Arauco do Brasil S.A. |
Brazil | Brazilian Real | ||
| Arauco Forest Brasil S.A. |
Brazil | Brazilian Real | ||
| Arauco Florestal Arapoti S.A. |
Brazil | Brazilian Real | ||
| Empreendimentos Florestais Santa Cruz Ltda. |
Brazil | Brazilian Real | ||
| Mahal Empreendimentos e Participacoes S.A. |
Brazil | Brazilian Real | ||
| Investigaciones Forestales Bioforest S.A. |
Chile | Chilean Pesos | ||
| Consorcio Protección Fitosanitaria Forestal S.A. (Ex-Controladora de Plagas Forestales S.A.) |
Chile | Chilean Pesos | ||
| Flakeboard Company Limited |
Canada | Canadian Dollar |
The table below shows a detail per company of the effect in the period of the Reserve for Exchange Differences on translation:
| January - December | ||||||||
| 2015 | 2014 | |||||||
| ThU.S.$ | ThU.S.$ | |||||||
| Arauco Do Brasil S.A. |
(155,390 | ) | (66,222 | ) | ||||
| Arauco Forest Brasil S.A. |
(140,992 | ) | (57,515 | ) | ||||
| Arauco Florestal Arapoti S.A. |
(43,189 | ) | (17,640 | ) | ||||
| Arauco Distribución S.A. |
(4,180 | ) | (3,793 | ) | ||||
| Arauco Argentina S.A. |
(13,308 | ) | (5,765 | ) | ||||
| Flakeboard Company Limited |
(16,915 | ) | (8,049 | ) | ||||
| Others |
(301 | ) | (406 | ) | ||||
|
|
|
|
|
|||||
| Total reserve of exchange differences on translation |
(374,275 | ) | (159,390 | ) | ||||
|
|
|
|
|
|||||
Effect of foreign exchange rates changes
| January-December | ||||||||
| 2015 | 2014 | |||||||
| ThU.S.$ | ThU.S.$ | |||||||
| Exchange differences recognized in profit or loss, except for those arising on financial instruments measured at fair value through profit or loss |
(40,827 | ) | (7,763 | ) | ||||
| Reserve of exchange differences on translation (with Non-controlling interests) |
(385,109 | ) | (163,844 | ) | ||||
57
Table of Contents
CELULOSA ARAUCO Y CONSTITUCION S.A.
AND SUBSIDIARIES
Unaudited Consolidated Financial Statements
December 31, 2015
Amounts in thousands of U.S. dollars, except as indicated
NOTE 12. BORROWING COSTS
Arauco estimates the average rate of borrowings to finance its current investment projects. At the end of the previous period, the balance corresponded principally to the accumulated amount that was capitalized until the end of construction of pulp production plant in Uruguay. The average rate loans to finance these investment projects were calculated to record the capitalization.
| January - December | ||||||||
| 2015 | 2014 | |||||||
| ThU.S.$ | ThU.S.$ | |||||||
| Property, plant and equipment capitalized cost |
||||||||
| Property, plant and equipment capitalized interest cost rate |
4.87 | % | 4.7 | % | ||||
| Amount of the capitalized interest cost, property, plant and equipment |
1,893 | 19,586 | ||||||
NOTE 13. RELATED PARTIES
Related Party Disclosures
Related parties are those entities defined in IAS 24 and under the rules of the Chilean SVS and the Chilean Corporations Law.
The receivable and payable amounts among related parties at the end of each period correspond to commercial and financing transactions denominated in Chilean Pesos, U.S. dollars and Brazilian Real, where collection or payment deadlines are shown in the following tables and in general do not bear interest, except for financing transactions.
As of the date of these consolidated financial statements, the main transactions with related parties are related to fuel purchases with Compañía de Petróleos de Chile S.A., sodium chlorate purchases at EKA Chile S.A., chips sales to Forestal del Sur S.A.
As of the date of these consolidated financial statements, there are neither provisions for doubtful accounts nor any guarantees granted or received related to the balances with related parties.
Name of Group’s Main Shareholders
The ultimate shareholders of Arauco are Mrs. Maria Noseda Zambra de Angelini, Mr. Roberto Angelini Rossi and Mrs. Patricia Angelini Rossi through Inversiones Angelini y Cia. Ltda.
Name of the Intermediate Controlling Entity that Produces Consolidated Financial Statements for Public Use
Empresas Copec S.A.
58
Table of Contents
CELULOSA ARAUCO Y CONSTITUCION S.A.
AND SUBSIDIARIES
Unaudited Consolidated Financial Statements
December 31, 2015
Amounts in thousands of U.S. dollars, except as indicated
Compensation to Key Management Personnel
Compensation to key management personnel, including directors, managers and deputy managers, consist of a fixed monthly salary and an annual bonus subject to the results of the Company and the fulfillment of goals of the business as well as individual performance.
Pricing Strategy Terms and Conditions Corresponding to Transactions with Related Parties
Related party transactions were made on terms of those prevailing under market conditions, with mutual independence of the parties.
The table below sets forth information about the Relationship between the Parent Company and its Subsidiaries
| ID N° |
Company Name |
Country | Functional Currency |
% Ownership interest 12-31-2015 |
% Ownership interest 12-31-2014 |
|||||||||||||||||||||||||||||
| Direct | Indirect | Total | Direct | Indirect | Total | |||||||||||||||||||||||||||||
| — |
Agenciamiento y Servicios Profesionales S.A. | Mexico | U.S. Dollar | 0.0020 | 99.9970 | 99.9990 | 0.0020 | 99.9970 | 99.9990 | |||||||||||||||||||||||||
| — |
Arauco Argentina S.A. (Ex-Alto Paraná S.A.) | Argentina | U.S. Dollar | 9.9753 | 90.0048 | 99.9801 | 9.9753 | 90.0048 | 99.9801 | |||||||||||||||||||||||||
| — |
Arauco Australia Pty Ltd. | Australia | U.S. Dollar | — | 99.9990 | 99.9990 | — | 99.9990 | 99.9990 | |||||||||||||||||||||||||
| 96547510-9 |
Arauco Bioenergía S.A. | Chile | U.S. Dollar | 98.0000 | 1.9999 | 99.9999 | 98.0000 | 1.9999 | 99.9999 | |||||||||||||||||||||||||
| — |
Arauco Colombia S.A. | Colombia | U.S. Dollar | 1.4778 | 98.5204 | 99.9982 | 1.5000 | 98.4983 | 99.9983 | |||||||||||||||||||||||||
| 96765270-9 |
Arauco Distribución S.A. | Chile | Chilean Pesos | — | — | — | — | 99.9996 | 99.9996 | |||||||||||||||||||||||||
| — |
Arauco do Brasil S.A. | Brazil | Brazilian Real | 1.2485 | 98.7505 | 99.9990 | 1.3418 | 98.6572 | 99.9990 | |||||||||||||||||||||||||
| — |
Arauco Europe Cooperatief U.A. (Ex-Arauco Holanda Cooperatief U.A.) | Holland | U.S. Dollar | 0.4843 | 99.5147 | 99.9990 | 0.5389 | 99.4601 | 99.9990 | |||||||||||||||||||||||||
| — |
Arauco Florestal Arapoti S.A. | Brazil | Brazilian Real | — | 79.9992 | 79.9992 | — | 79.9992 | 79.9992 | |||||||||||||||||||||||||
| — |
Arauco Forest Brasil S.A. | Brazil | Brazilian Real | 10.1297 | 89.8694 | 99.9991 | 11.1520 | 88.8470 | 99.9990 | |||||||||||||||||||||||||
| — |
Arauco Forest Products B.V. | Holland | U.S. Dollar | — | — | — | — | 99.9990 | 99.9990 | |||||||||||||||||||||||||
| — |
Arauco Middle East DMCC | Dubai | U.S. Dollar | — | 99.9990 | 99.9990 | — | — | — | |||||||||||||||||||||||||
| — |
Arauco Panels USA, LLC | USA | U.S. Dollar | — | 99.9990 | 99.9990 | — | 99.9990 | 99.9990 | |||||||||||||||||||||||||
| — |
Arauco Perú S.A. | Peru | U.S. Dollar | 0.0013 | 99.9977 | 99.9990 | 0.0013 | 99.9977 | 99.9990 | |||||||||||||||||||||||||
| — |
Arauco Wood Products, Inc. | USA | U.S. Dollar | 0.0004 | 99.9986 | 99.9990 | 0.0004 | 99.9986 | 99.9990 | |||||||||||||||||||||||||
| — |
Araucomex S.A. de C.V. | Mexico | U.S. Dollar | 0.0005 | 99.9985 | 99.9990 | 0.0005 | 99.9985 | 99.9990 | |||||||||||||||||||||||||
| 96565750-9 |
Aserraderos Arauco S.A. | Chile | U.S. Dollar | — | — | — | 99.0000 | 0.9995 | 99.9995 | |||||||||||||||||||||||||
| 96657900-5 |
Consorcio Protección Fitosanitaria Forestal S.A. | Chile | Chilean Pesos | — | 57.5404 | 57.5404 | — | 57.7503 | 57.7503 | |||||||||||||||||||||||||
| — |
Empreendimentos Florestais Santa Cruz Ltda. | Brazil | Brazilian Real | — | 99.9789 | 99.9789 | — | 99.9789 | 99.9789 | |||||||||||||||||||||||||
| — |
Flakeboard America Limited | USA | U.S. Dollar | — | 99.9990 | 99.9990 | — | 99.9990 | 99.9990 | |||||||||||||||||||||||||
| — |
Flakeboard Company Ltd. | Canada | Canadian Dollar | — | 99.9990 | 99.9990 | — | 99.9990 | 99.9990 | |||||||||||||||||||||||||
| 85805200-9 |
Forestal Arauco S.A. | Chile | U.S. Dollar | 99.9484 | — | 99.9484 | 99.9484 | — | 99.9484 | |||||||||||||||||||||||||
| 93838000-7 |
Forestal Cholguán S.A. | Chile | U.S. Dollar | — | 98.4478 | 98.4478 | — | 98.1796 | 98.1796 | |||||||||||||||||||||||||
| — |
Forestal Concepción S.A. | Panama | U.S. Dollar | 0.0050 | 99.9940 | 99.9990 | 0.0050 | 99.9940 | 99.9990 | |||||||||||||||||||||||||
| 78049140-K |
Forestal Los Lagos S.A. | Chile | U.S. Dollar | — | 79.9587 | 79.9587 | — | 79.9587 | 79.9587 | |||||||||||||||||||||||||
| — |
Forestal Nuestra Señora del Carmen S.A. | Argentina | U.S. Dollar | — | 99.9805 | 99.9805 | — | 99.9805 | 99.9805 | |||||||||||||||||||||||||
| — |
Forestal Talavera S.A. | Argentina | U.S. Dollar | — | 99.9942 | 99.9942 | — | 99.9942 | 99.9942 | |||||||||||||||||||||||||
| — |
Greenagro S.A. | Argentina | U.S. Dollar | — | 97.9805 | 97.9805 | — | 97.9805 | 97.9805 | |||||||||||||||||||||||||
| 96563550-5 |
Inversiones Arauco Internacional Ltda. | Chile | U.S. Dollar | 98.0186 | 1.9804 | 99.9990 | 98.0186 | 1.9804 | 99.9990 | |||||||||||||||||||||||||
| 79990550-7 |
Investigaciones Forestales Bioforest S.A. | Chile | Chilean Pesos | 1.0000 | 98.9489 | 99.9489 | 1.0000 | 98.9489 | 99.9489 | |||||||||||||||||||||||||
| — |
Leasing Forestal S.A. | Argentina | U.S. Dollar | — | 99.9801 | 99.9801 | — | 99.9801 | 99.9801 | |||||||||||||||||||||||||
| — |
Mahal Empreendimentos e Participacoes S.A. | Brazil | Brazilian Real | — | 99.9934 | 99.9934 | — | 99.9934 | 99.9934 | |||||||||||||||||||||||||
| — |
Novo Oeste Gestao de Ativos Florestais S.A. | Brazil | Brazilian Real | — | 99.9990 | 99.9990 | — | — | — | |||||||||||||||||||||||||
| 96510970-6 |
Paneles Arauco S.A. | Chile | U.S. Dollar | 99.0000 | 0.9995 | 99.9995 | 99.0000 | 0.9995 | 99.9995 | |||||||||||||||||||||||||
| — |
Savitar S.A. | Argentina | U.S. Dollar | — | 99.9841 | 99.9841 | — | 99.9841 | 99.9841 | |||||||||||||||||||||||||
| 76375371-9 |
Servicios Aéreos Forestales Ltda. | Chile | U.S. Dollar | 0.0100 | 99.9890 | 99.9990 | 0.0100 | 99.9890 | 99.9990 | |||||||||||||||||||||||||
| 76375371-9 |
Servicios Aéreos Forestales Ltda. | Chile | U.S. Dollar | 45.0000 | 54.9997 | 99.9997 | 45.0000 | 54.9997 | 99.9997 | |||||||||||||||||||||||||
59
Table of Contents
CELULOSA ARAUCO Y CONSTITUCION S.A.
AND SUBSIDIARIES
Unaudited Consolidated Financial Statements
December 31, 2015
Amounts in thousands of U.S. dollars, except as indicated
The companies in the table below are classified as joint operations in accordance with IFRS 11. The assets, liabilities, income and expenses are recorded in relation to the Company’s ownership percentage in accordance with accounting standards applicable in each case.
| ID N° |
Company Name |
Country | Functional Currency |
|||||||
| - |
Euforest S.A. | Uruguay | U.S. Dollar | |||||||
| - |
Celulosa y Energía Punta Pereira S.A. | Uruguay | U.S. Dollar | |||||||
| - |
Zona Franca Punta Pereira S.A. | Uruguay | U.S. Dollar | |||||||
| - |
Forestal Cono Sur S.A. | Uruguay | U.S. Dollar | |||||||
| - |
Stora Enso Uruguay S.A. | Uruguay | U.S. Dollar | |||||||
| - |
El Esparragal Asociación Agraria de R.L. | Uruguay | U.S. Dollar | |||||||
| - |
Ongar S.A. | Uruguay | U.S. Dollar | |||||||
| - |
Terminal Logística e Industrial M’Bopicua S.A. | Uruguay | U.S. Dollar | |||||||
There are no significant restrictions on the ability of subsidiaries to transfer funds to Arauco, in the form of cash dividends or repayment of loans and/or advances.
Employee Benefits for Key Management Personnel
| January - December | ||||||||
| 2015 | 2014 | |||||||
| ThU.S.$ | ThU.S.$ | |||||||
| Salaries and bonuses |
65,760 | 63,159 | ||||||
| Per diem compensation to members of the Board of Directors |
1,097 | 1,397 | ||||||
| Termination benefits |
2,250 | 4,073 | ||||||
| Total |
69,107 | 68,629 | ||||||
|
|
|
|
|
|||||
Related Party Receivables, Current
| Name of Related Party |
Tax ID No. | Nature of Relationship |
Country | Currency | Maturity | 12-31-2015 ThU.S.$ |
12-31-2014 ThU.S.$ |
|||||||||||||||||||
| Forestal Mininco S.A |
91.440.000-7 | Common director | Chile | Chilean pesos | 30 days | 44 | 19 | |||||||||||||||||||
| Eka Chile S.A |
99.500.140-3 | Joint Venture | Chile | Chilean pesos | 30 days | 1,646 | 2,083 | |||||||||||||||||||
| Forestal del Sur S.A |
79.825.060-4 | Common director | Chile | Chilean pesos | — | 584 | ||||||||||||||||||||
| Stora Enso Arapoti Industria del Papel S.A |
— | Associate | Brazil | Brazilian Real | 30 days | 472 | 588 | |||||||||||||||||||
| Unilin Arauco Pisos Ltda. |
— | Joint Venture | Brazil | Brazilian Real | 30 days | 523 | 1,389 | |||||||||||||||||||
| Abastible S.A. |
91.806.000-6 | Common director | Chile | Chilean pesos | 30 days | 142 | — | |||||||||||||||||||
| Novo Oeste Gestao de Ativo Florestais S.A. |
— | Subsidiary | (1) | Brazil | Brazilian Real | — | 21 | |||||||||||||||||||
| Fundación Educacional Arauco |
71.625.000-8 | Common director | Chile | Chilean pesos | 30 days | 276 | — | |||||||||||||||||||
| CMPC Celulosa S.A. |
96.532.330-9 | Common director | Chile | Chilean pesos | — | 1 | ||||||||||||||||||||
| Corpesca S.A |
96.893.820-7 | Common director | Chile | Chilean pesos | — | 20 | ||||||||||||||||||||
| Fundación Acerca Redes |
65.097.218-K | Common director | Chile | U.S. Dollar | 30 days | 21 | — | |||||||||||||||||||
| TOTAL |
3,124 | 4,705 | ||||||||||||||||||||||||
|
|
|
|
|
|||||||||||||||||||||||
| (1) | Since October 2015, the company is a subsidiary of Arauco, therefore, the transactions presented in this note are those made with this company until that month (see Note 14). |
60
Table of Contents
CELULOSA ARAUCO Y CONSTITUCION S.A.
AND SUBSIDIARIES
Unaudited Consolidated Financial Statements
December 31, 2015
Amounts in thousands of U.S. dollars, except as indicated
Related Party Receivables, Non-Current
| Name of Related Party |
Tax ID No. | Nature of Relationship |
Country | Currency | Maturity | 12-31-2015 ThU.S.$ |
12-31-2014 ThU.S.$ |
|||||||||||||||||||
| Novo Oeste Gestao de Ativo Florestais S.A.(*) |
— | Subsidiary | (1) | Brazil | Brazilian Real | — | 151,519 | |||||||||||||||||||
| TOTAL |
— | 151,519 | ||||||||||||||||||||||||
|
|
|
|
|
|||||||||||||||||||||||
| (*) | Accrued an annual CDI interest (interbank rate) + 2.3%. The debt was capitalized and the company has been a subsidiary since October of year 2015. |
| (1) | Since October 2015, the company is a subsidiary of Arauco, therefore, the transactions presented in this note are those made with this company until that month (see Note 14). |
Related Party Payables, Current
| Name of Related party |
Tax ID No. | Nature of Relationship |
Country | Currency | Maturity | 12-31-2015 ThU.S.$ |
12-31-2014 ThU.S.$ |
|||||||||||||||
| Compañía de Petróleos de Chile S.A. |
99.520.000-7 | Controlling Parent’s Subsidiary |
Chile | Chilean pesos | 30 days | 6,057 | 4,073 | |||||||||||||||
| Abastible S.A. |
91.806.000-6 | Controlling Parent’s Subsidiary |
Chile | Chilean pesos | — | 302 | ||||||||||||||||
| Fundación Educacional Arauco |
71.625.000-8 | Common director | Chile | Chilean pesos | — | 29 | ||||||||||||||||
| Sigma S.A. |
86.370.800-1 | Common director | Chile | Chilean pesos | — | 8 | ||||||||||||||||
| Portaluppi, Guzman y Bezanilla Abogados |
78.096.080-9 | Common director | Chile | Chilean pesos | 30 days | 98 | — | |||||||||||||||
| Puerto Lirquén S.A. |
96.959.030-1 | Associate | Chile | U.S. Dollar | 30 days | 851 | 987 | |||||||||||||||
| Compañía Puerto de Coronel S.A. |
79.895.330-3 | Associate | Chile | U.S. Dollar | 30 days | 111 | 122 | |||||||||||||||
| Colbún Transmisión S.A. |
76.218.856-2 | Common director | Chile | Chilean pesos | — | 8 | ||||||||||||||||
| Empresa de Residuos Resiter Ltda |
89.696.400-3 | Common director | Chile | Chilean pesos | — | 4 | ||||||||||||||||
| Resiter Uruguay S.A |
— | Common director | Uruguay | U.S. Dollar | — | 503 | ||||||||||||||||
| Empresas Copec S.A. |
90.690.000-9 | Common director | Chile | Chilean pesos | 30 days | 24 | — | |||||||||||||||
| TOTAL |
7,141 | 6,036 | ||||||||||||||||||||
|
|
|
|
|
|||||||||||||||||||
61
Table of Contents
CELULOSA ARAUCO Y CONSTITUCION S.A.
AND SUBSIDIARIES
Unaudited Consolidated Financial Statements
December 31, 2015
Amounts in thousands of U.S. dollars, except as indicated
Related Party Transactions
Purchases
| Name of Related Party |
Tax ID No. | Nature of Relationship |
Country | Currency | Transaction Descriptions |
12-31-2015 ThU.S.$ |
12-31-2014 ThU.S.$ |
|||||||||||||
| Abastible S.A. |
91.806.000-6 | Controlling Parent’s Subsidiary |
Chile | Chilean pesos | Fuel | 2,503 | 3,676 | |||||||||||||
| Empresas Copec S.A |
90.690.000-9 | Controlling Parent |
Chile | Chilean pesos | Management service |
233 | 277 | |||||||||||||
| Compañía de Petróleos de Chile S.A. |
99.520.000-7 | Controlling Parent’s Subsidiary |
Chile | Chilean pesos | Fuel and other |
61,245 | 96,497 | |||||||||||||
| Compañía Puerto de Coronel S.A. |
79.895.330-3 | Associate | Chile | U.S. Dollar | Transport and stowage |
10,917 | 9,458 | |||||||||||||
| Puerto Lirquén S.A. |
96.959.030-1 | Associate | Chile | U.S. Dollar | Port services | 7,694 | 9,937 | |||||||||||||
| EKA Chile S.A. |
99.500.140-3 | Joint Venture | Chile | Chilean pesos | Sodium chlorate |
39,362 | 48,696 | |||||||||||||
| Forestal del Sur S.A. |
79.825.060-4 | Common director | Chile | Chilean pesos | Wood and ships |
2,018 | — | |||||||||||||
| Portaluppi, Guzman y Bezanilla Abogados |
78.096.080-9 | Common director | Chile | Chilean pesos | Legal services |
1,312 | 1,761 | |||||||||||||
| Empresa Nacional de Telecomunicaciones S.A. |
92.580.000-7 | Common director | Chile | Chilean pesos | Telephone services |
552 | 474 | |||||||||||||
| CMPC Maderas S.A. |
95.304.000-K | Common director | Chile | Chilean pesos | Wood and logs |
267 | 489 | |||||||||||||
| Forestal Mininco S.A. |
91.440.000-7 | Common director | Chile | Chilean pesos | Wood and logs |
204 | 204 | |||||||||||||
| Empresa de Residuos Resiter Ltda |
89.696.400-3 | Common director | Chile | Chilean pesos | Industrial Cleaning Services |
(285 | ) | 4,157 | ||||||||||||
| Empresas de Residuos Industriales Resiter Ltda |
76.329.072-7 | Common director | Chile | Chilean pesos | Industrial Cleaning Services |
5,027 | 1,432 | |||||||||||||
| Resiter Uruguay S.A |
— | Common director | Uruguay | U.S. Dollar | Service to collect solid waste |
774 | 1,167 | |||||||||||||
| Colbún Transmisión S.A. |
76.218.856-2 | Common director | Chile | Chilean pesos | Electrical Power |
447 | 330 | |||||||||||||
| CMPC Celulosa S.A. |
96.532.330-9 | Common director | Chile | Chilean pesos | Others purchases |
2,217 | 1,023 | |||||||||||||
Sales
| Name of Related Party |
Tax ID No. | Nature of Relationship |
Country | Currency | Transaction Descriptions |
12-31-2015 ThU.S.$ |
12-31-2014 ThU.S.$ |
|||||||||||||
| Colbún S.A. |
96.505.760-9 | Common director | Chile | Chilean pesos |
Electrical Power |
1,083 | 3,284 | |||||||||||||
| EKA Chile S.A. |
99.500.140-3 | Joint venture | Chile | Chilean pesos |
Electrical Power |
17,543 | 27,361 | |||||||||||||
| Stora Enso Arapoti Industria de Papel S.A. |
— | Associate | Brasil | Brazilian Real |
Wood | 5,617 | 8,349 | |||||||||||||
| Forestal del Sur S.A. |
79.825.060-4 | Common director | Chile | Chilean pesos |
Wood and chips |
18,506 | 19,311 | |||||||||||||
| Forestal del Sur S.A. |
79.825.060-4 | Common director | Chile | Chilean pesos |
Harvesting services |
822 | — | |||||||||||||
| CMPC Celulosa S.A. |
96.532.330-9 | Common director | Chile | Chilean pesos |
Wood | 130 | 246 | |||||||||||||
| Cartulinas CMPC S.A. |
96.731.890-6 | Common director | Chile | Chilean pesos |
Cellulose | — | 679 | |||||||||||||
| Empresa Eléctrica Guacolda S.A. |
96.635.700-2 | Associate | Chile | Chilean pesos |
Electrical Power |
— | 1,264 | |||||||||||||
| Forestal Mininco S.A. |
91.440.000-7 | Common director | Chile | Chilean pesos |
Wood and chips |
311 | — | |||||||||||||
| Unilin Arauco Pisos Ltda. |
— | Joint venture | Brasil | Brazilian Real |
Wood | 2,666 | 11,887 | |||||||||||||
Other Transactions
| Name of Related Party |
Tax ID No. | Nature of Relationship |
Country | Currency | Transaction Descriptions |
12-31-2015 ThU.S.$ |
12-31-2014 ThU.S.$ |
|||||||||||||
| Novo Oeste Gestao de Ativo Florestais S.A. |
Subsidiary | (1) | Brazilian Real | Loans (Capital and interest) |
41,091 | 151,519 | ||||||||||||||
| (1) | Since October 2015, the company is a subsidiary of Arauco, therefore, the transactions presented in this note are those made with this company until that month (see Note 14). |
62
Table of Contents
CELULOSA ARAUCO Y CONSTITUCION S.A.
AND SUBSIDIARIES
Unaudited Consolidated Financial Statements
December 31, 2015
Amounts in thousands of U.S. dollars, except as indicated
NOTE 14. CONSOLIDATED FINANCIAL STATEMENTS
Company mergers
On December 1, 2015 there was a merger among the affiliates Paneles Arauco S.A. (successor), Aserraderos Arauco S.A. and Arauco Distribución S.A. This transaction had no effect on results and was performed with a view to generate greater synergies, share best practices and achieve better results for our clients. There will be a progressive integration of the activities of sawmills, remanufacturing, plywood, panels and distribution under the same view, with products oriented to the furniture, construction, fitting and packaging industries.
Investments in Subsidiaries
In October 2015, the company acquired the remaining 51% of the interest ownership in Novo Oeste Gestao de Ativos Florestais S.A., in which it held, on December 31, 2015, a stake of 100% through Arauco’s subsidiaries in Brazil. Tables below show the acquired assets and liabilities at fair value, consideration paid and effects generated through the transaction.
| Novo Oeste Gestao de Ativos Florestais |
10-27-2015 Th.U.S.$ |
|||
| Cash and cash equivalents |
427 | |||
| Inventories |
3,747 | |||
| Accounts receivable from related companies, Current |
39,917 | |||
| Other Assets, Current |
154 | |||
| Current Assets, Total |
44,245 | |||
| Accounts receivable from related companies, Non-current |
12,439 | |||
| Other Assets, Non Current |
— | |||
| Property, plant and equipment |
1,496 | |||
| Biological assets, Non-current |
87,580 | |||
| Non Current Assets, Total |
101,515 | |||
| Assets, Total |
145,760 | |||
| Trade and other current payables, Current |
238 | |||
| Current tax liabilities |
3,449 | |||
| Accounts payable to related companies, current |
10 | |||
| Current Liabilities, Total |
3,697 | |||
| Accounts payable to related companies, Non-current |
137,193 | |||
| Deferred tax liabilities |
16,051 | |||
| Non Current Libilities, Total |
153,244 | |||
| Liabilities, Total |
156,941 | |||
|
|
|
|||
The interest previously held by Novo Oeste Gestao de Ativos Florestais S.A. was measured at fair value, resulting in a total of ThU.S.$ (5,479), recognizing a gain in the other income line of ThU.S.$15,268. The price paid for the 51% interest was ThU.S.$995, generating a goodwill of ThU.S.$6,697, for which Arauco decided to recognize in the results because of the Company’s accumulated losses. The impairment loss is presented net from the abovementioned gain.
63
Table of Contents
CELULOSA ARAUCO Y CONSTITUCION S.A.
AND SUBSIDIARIES
Unaudited Consolidated Financial Statements
December 31, 2015
Amounts in thousands of U.S. dollars, except as indicated
| Novo Oeste |
US$ | |||
| negative investment before business combination |
(20,746 | ) | ||
| Net fair value of 49% of assets and libilities |
(5,479 | ) | ||
| Profit (Loss) |
15,268 | |||
| Purchase value 51% stake |
995 | |||
| Net fair value of 51% of assets and libilities |
(5,702 | ) | ||
| Goodwill |
(6,697 | ) | ||
| Net income staged Business Combination |
8,571 | |||
|
|
|
|||
On August 13, 2015, the company Arauco Middle East DMCC was incorporated with a single contribution from Inversiones Arauco Internacional Limitada of 3,673,000 Dirham (ThU.S.$1,000). The corporate purpose of this company is the promotion of products and the management of Arauco’s customer relations in the Middle East.
On January 26, 2015 Arauco, through its subsidiaries in North America, acquired a melamine-based paper treatment plant located in Biscoe, North Carolina. The price paid was ThU.S.$9,522. The attached table displays the acquired assets at fair value and the price paid under the transaction:
| Th.U.S$ | ||||
| Inventories |
372 | |||
| Lands |
597 | |||
| Buildings |
1,723 | |||
| Plant and equipment |
6,830 | |||
| Value Paid, Total |
9,522 | |||
|
|
|
|||
On March 27, 2014, the company Servicios Aereos Forestales Ltda was established with contributions from Inversiones Arauco Internacional Ltda ThU.S.$25,997 and Celulosa Arauco y Constitución S.A. ThU.S.$2.6. The Company’s main objective is the provision of air transportation services for passengers and cargo, forest patrol, photography, advertising, magnetic survey, using its own as well as third-party equipment and perform maintenance service on aircrafts.
The details of the subsidiaries included in the consolidation of Arauco are disclosed in Note 13.
64
Table of Contents
CELULOSA ARAUCO Y CONSTITUCION S.A.
AND SUBSIDIARIES
Unaudited Consolidated Financial Statements
December 31, 2015
Amounts in thousands of U.S. dollars, except as indicated
NOTE 15. INVESTMENTS IN ASSOCIATES
At December 31, 2015 and 2014 there are no new investments in associates to report.
The following tables set forth information about Investments in associates.
| Name | Puertos y Logística S.A. | |||
| Country | Chile | |||
| Functional Currency | U.S. Dollar | |||
| Corporate purpose | Docking and warehousing operations for proprietary and third party use, cargo of all classes of goods, as well, as warehousing and transport operations. | |||
| Ownership interest (%) | 20.2767% | |||
| 12-31-2015 | 12-31-2014 | |||
| Carrying amount | ThU.S.$58,922 | ThU.S.$60,081 | ||
| Name | Inversiones Puerto Coronel S.A. | |||
| Country | Chile | |||
| Functional Currency | U.S. Dollar | |||
| Corporate purpose | Investments in movables and real estate, acquisition of companies, securities and investment instruments, investment management and development and/or participation in all kind of businesses and companies related to industrial, shipping, forestry and commercial activities. | |||
| Ownership interest (%) | 50.0000% | |||
| 12-31-2015 | 12-31-2014 | |||
| Carrying amount | ThU.S.$43,200 | ThU.S.$40,088 | ||
| Name | Servicios Corporativos Sercor S.A. | |||
| Country | Chile | |||
| Functional Currency | Chilean Pesos | |||
| Corporate purpose | Consulting services related to business management to Boards of Directors and Senior Management of all Arauco’s entities. | |||
| Ownership interest (%) | 20.0000% | |||
| 12-31-2015 | 12-31-2014 | |||
| Carrying amount | ThU.S.$ 179 | ThU.S.$(2,850) (*) | ||
| (*) | As of December 31, 2014 the Company recognized a loss generated by punishment of obsolescence of its subsidiary Olidata Chile S.A. |
| Name | Stora Enso Arapoti Industria de Papel S.A. | |||
| Country | Brazil | |||
| Functional Currency | Brazilian Real | |||
| Corporate purpose | Industrialization and commercialization of paper and cellulose, raw materials and by-products | |||
| Ownership interest (%) | 20.0000% | |||
| 12-31-2015 | 12-31-2014 | |||
| Carrying amount | ThU.S.$17,397 | ThU.S.$26,029 | ||
65
Table of Contents
CELULOSA ARAUCO Y CONSTITUCION S.A.
AND SUBSIDIARIES
Unaudited Consolidated Financial Statements
December 31, 2015
Amounts in thousands of U.S. dollars, except as indicated
| Name | Genómica Forestal S.A. | |||
| Country | Chile | |||
| Functional Currency | Chilean Pesos | |||
| Corporate purpose | Developing forestry genomics, through the use of biotechnological, molecular and bioinformatics tools with the purpose of strengthening genetic programs so as to improve the competitive position of the Chilean forestry industry for priority tree species. | |||
| Ownership interest (%) | 25.0000% | |||
| 12-31-2015 | 12-31-2014 | |||
| Carrying amount | ThU.S.$16 | ThU.S.$48 | ||
| Name | Consorcio Tecnológico Bioenercel S.A. | |||
| Country | Chile | |||
| Functional Currency | Chilean Pesos | |||
| Corporate purpose | Developing of technologies which will promote the development of a biofuels industry in Chile, obtained from lingo-cellulosic materials. The future execution of this sustainable project is financed by the Innova Chile Committee. | |||
| Ownership interest (%) | 20.0000% | |||
| 12-31-2015 | 12-31-2014 | |||
| Carrying amount | ThU.S.$67 | ThU.S.$214 | ||
| Name | Novo Oeste Gestao de Ativos Florestais S.A. | |||
| Country | Brazil | |||
| Functional Currency | Real | |||
| Corporate purpose | Management of forestry activities and commercialization of wood and other products. | |||
| Ownership interest (%) | Subsidiary | 48.9912% | ||
| 12-31-2015 | 12-31-2014 | |||
| Carrying amount | ThU.S.$ - | ThU.S.$(25,290) | ||
| Name | Vale do Corisco S.A. | |||
| Country | Brazil | |||
| Functional Currency | Brazilian Real | |||
| Corporate purpose | Management of forestry activities. | |||
| Ownership interest (%) | 49.0000% | |||
| 12-31-2015 | 12-31-2014 | |||
| Carrying amount | ThU.S.$120,649 | ThU.S.$174,782 | ||
66
Table of Contents
CELULOSA ARAUCO Y CONSTITUCION S.A.
AND SUBSIDIARIES
Unaudited Consolidated Financial Statements
December 31, 2015
Amounts in thousands of U.S. dollars, except as indicated
Summarized Financial Information of Associates
| 12-31-2015 |
Puertos y Logística S.A. ThU.S.$ |
Inversiones Puerto Coronel S.A. ThU.S.$ |
Serv.Corporativos Sercor S.A. ThU.S.$ |
Stora Enso Arapoti Ind.de Papel S.A. ThU.S.$ |
Assets Novo Oeste Gestao de Ativos Florestais S.A. ThU.S.$ |
Vale do Corisco S.A. ThU.S.$ |
Consorcio Tecnológico Bioenercel S.A. ThU.S.$ |
Genómica Forestal S.A. ThU.S.$ |
Total ThU.S.$ |
|||||||||||||||||||||||||||
| Current |
90,896 | 29 | 4,174 | 59,594 | 0 | 14,736 | 1 | 44 | 169,474 | |||||||||||||||||||||||||||
| Non-current |
472,638 | 86,453 | 664 | 33,284 | 0 | 322,598 | 345 | 146 | 916,128 | |||||||||||||||||||||||||||
| Total |
563,534 | 86,482 | 4,838 | 92,878 | 0 | 337,334 | 346 | 190 | 1,085,602 | |||||||||||||||||||||||||||
|
|
|
|
|
|
|
|
|
|
|
|
|
|
|
|
|
|
|
|||||||||||||||||||
| Puertos y Logística S.A. ThU.S.$ |
Inversiones Puerto Coronel S.A. ThU.S.$ |
Serv.Corporativos Sercor S.A. ThU.S.$ |
Stora Enso Arapoti Ind.de Papel S.A. ThU.S.$ |
Liabilities Novo Oeste Gestao de Ativos Florestais S.A. ThU.S.$ |
Vale do Corisco S.A. ThU.S.$ |
Consorcio Tecnológico Bioenercel S.A. ThU.S.$ |
Genómica Forestal S.A. ThU.S.$ |
Total ThU.S.$ |
||||||||||||||||||||||||||||
| Current |
41,784 | 82 | 3,136 | 13,648 | 0 | 9,098 | 7 | 7 | 67,762 | |||||||||||||||||||||||||||
| Non-current |
231,160 | 0 | 808 | 7,094 | 0 | 80,563 | 5 | 118 | 319,748 | |||||||||||||||||||||||||||
| Equity |
290,590 | 86,400 | 894 | 72,136 | 0 | 247,673 | 334 | 65 | 698,092 | |||||||||||||||||||||||||||
| Total |
563,534 | 86,482 | 4,838 | 92,878 | 0 | 337,334 | 346 | 190 | 1,085,602 | |||||||||||||||||||||||||||
| Revenues |
88,689 | 4,629 | 16,007 | 9,574 | 0 | 36,270 | 983 | 121 | 156,273 | |||||||||||||||||||||||||||
| Expenses |
(89,719 | ) | 0 | (5,163 | ) | (3,579 | ) | 0 | (19,674 | ) | (105 | ) | (1,229 | ) | (119,469 | ) | ||||||||||||||||||||
| Profit or loss |
(1,030 | ) | 4,629 | 10,844 | 5,995 | 0 | 16,596 | 878 | (1,108 | ) | 36,804 | |||||||||||||||||||||||||
| 12-31-2014 |
Puertos y Logística S.A. ThU.S.$ |
Inversiones Puerto Coronel S.A. ThU.S.$ |
Serv.Corporativos Sercor S.A. ThU.S.$ |
Stora Enso Arapoti Ind.de Papel S.A. ThU.S.$ |
Assets Novo Oeste Gestao de Ativos Florestais S.A. ThU.S.$ |
Vale do Corisco S.A. ThU.S.$ |
Consorcio Tecnológico Bioenercel S.A. ThU.S.$ |
Genómica Forestal S.A. ThU.S.$ |
Total ThU.S.$ |
|||||||||||||||||||||||||||
| Current |
70,923 | 17 | 6,582 | 46,579 | 6,356 | 24,067 | 1,533 | 193 | 156,250 | |||||||||||||||||||||||||||
| Non-current |
363,444 | 80,243 | 272 | 84,451 | 119,137 | 460,554 | 2,097 | 253 | 1,110,451 | |||||||||||||||||||||||||||
| Total |
434,367 | 80,260 | 6,854 | 131,030 | 125,493 | 484,621 | 3,630 | 446 | 1,266,701 | |||||||||||||||||||||||||||
|
|
|
|
|
|
|
|
|
|
|
|
|
|
|
|
|
|
|
|||||||||||||||||||
| Puertos y Logística S.A. ThU.S.$ |
Inversiones Puerto Coronel S.A. ThU.S.$ |
Serv.Corporativos Sercor S.A. ThU.S.$ |
Stora Enso Arapoti Ind.de Papel S.A. ThU.S.$ |
Liabilities Novo Oeste Gestao de Ativos Florestais S.A. ThU.S.$ |
Vale do Corisco S.A. ThU.S.$ |
Consorcio Tecnológico Bioenercel S.A. ThU.S.$ |
Genómica Forestal S.A. ThU.S.$ |
Total ThU.S.$ |
||||||||||||||||||||||||||||
| Current |
19,447 | 83 | 20,355 | 16,791 | 177,106 | 17,773 | 1,937 | 13 | 253,505 | |||||||||||||||||||||||||||
| Non-current |
118,616 | 0 | 751 | 5,923 | 0 | 108,206 | 621 | 243 | 234,360 | |||||||||||||||||||||||||||
| Equity |
296,304 | 80,177 | (14,252 | ) | 108,316 | (51,613 | ) | 358,642 | 1,072 | 190 | 778,836 | |||||||||||||||||||||||||
| Total |
434,367 | 80,260 | 6,854 | 131,030 | 125,493 | 484,621 | 3,630 | 446 | 1,266,701 | |||||||||||||||||||||||||||
| 12-31-2014 |
||||||||||||||||||||||||||||||||||||
| Revenues |
83,318 | 3,331 | 4,047 | 125,746 | 171 | 47,800 | 135 | 65 | 264,613 | |||||||||||||||||||||||||||
| Expenses |
(79,973 | ) | 0 | (16,854 | ) | (122,967 | ) | (27,032 | ) | (7,237 | ) | (571 | ) | (97 | ) | (254,731 | ) | |||||||||||||||||||
| Profit or loss |
3,345 | 3,331 | (12,807 | ) | 2,779 | (26,861 | ) | 40,563 | (436 | ) | (32 | ) | 9,882 | |||||||||||||||||||||||
67
Table of Contents
CELULOSA ARAUCO Y CONSTITUCION S.A.
AND SUBSIDIARIES
Unaudited Consolidated Financial Statements
December 31, 2015
Amounts in thousands of U.S. dollars, except as indicated
Reconciliation of Investment in Associates and Joint Ventures
| 12-31-2015 ThU.S.$ |
12-31-2014 ThU.S.$ |
|||||||
| Opening balance as of January 1 |
326,045 | 349,412 | ||||||
| Changes |
||||||||
| Investments in associates, Additions |
1,808 | 0 | ||||||
| Disposals, Investments in associates |
0 | (3,400 | ) | |||||
| Share of profit (loss) in investment in associates |
5,573 | 6,958 | ||||||
| Share of profit (loss) in investment in joint ventures |
1,175 | 523 | ||||||
| Dividends Received |
(18,396 | ) | (11,696 | ) | ||||
| Increase (Decrease) in foreign exchange currency |
(55,207 | ) | (27,717 | ) | ||||
| Other increase (decrease) |
3,814 | 11,965 | ||||||
| Total changes |
(61,233 | ) | (23,367 | ) | ||||
| Ending balance |
264,812 | 326,045 | ||||||
|
|
|
|
|
|||||
| 12-31-2015 ThU.S.$ |
12-31-2014 ThU.S.$ |
|||||||
| Carrying amount of associates accounted for using equity method |
241,140 | 301,242 | ||||||
| Carrying amount of joint ventures accounted for using equity method |
23,672 | 24,803 | ||||||
| Total investment accounted for using equity method |
264,812 | 326,045 | ||||||
|
|
|
|
|
|||||
NOTE 16. INTERESTS IN JOINT ARRANGEMENTS
Investments and contributions made
As of December 31, 2015, Arauco, through its subsidiary Arauco Holanda Cooperatief U.A, has made capital contributions for a total of ThU.S.$82,943 (ThU.S.$398,545 as of December 31, 2014) to two Uruguayan joint operation entities in order to maintain its 50% of ownership in Celulosa y Energía Punta Pereira S.A. and Zona Franca Punta Pereira S.A.
The aforementioned contributions were invested in the construction of a state-of-the-art cellulose production plant, with a guaranteed annual capacity of 1.3 million tons, a port and an energy generation unit based on renewable resources, which is located in the town of Puerto Pereira, Province of Colonia, Uruguay.
The investments in Uruguay qualify as a joint operation. In relation to “other rights and contractual conditions”, the joint operation has the primary objective of providing the parties an output. As established in the “Pulp Supply Agreement”, both Arauco and its partner have the obligation to acquire 100% of the yearly pulp produced by the joint operation. Arauco has recognized the assets, liabilities, income and expenses associated with its interest ownership, as of January 1, 2013, pursuant to IFRS 11.
Furthermore, Arauco holds a 50% ownership interest in Unilin Arauco Pisos Laminados Ltda., a Brazilian company, and in Eka Chile S.A. (“Eka”), a company that sells sodium chlorate to cellulose plants in Chile. There is a contractual agreement with Eka whereby Arauco has engaged in an economic activity subject to common control, which is classified as a joint venture.
68
Table of Contents
CELULOSA ARAUCO Y CONSTITUCION S.A.
AND SUBSIDIARIES
Unaudited Consolidated Financial Statements
December 31, 2015
Amounts in thousands of U.S. dollars, except as indicated
The following tables set forth summarized financial information of the more significant interests in joint arrangements, which qualify as joint operations:
| Celulosa y Energía Punta Pereira S.A. (Uruguay) |
12-31-2015 | 12-31-2014 | ||||||||||||||
| Assets ThU.S.$ |
Liabilities ThU.S.$ |
Assets ThU.S.$ |
Liabilities ThU.S.$ |
|||||||||||||
| Current |
173,499 | 167,067 | 82,708 | 248,825 | ||||||||||||
| Non-current |
2,192,148 | 885,723 | 2,219,108 | 1,008,556 | ||||||||||||
| Equity |
1,312,857 | 1,044,435 | ||||||||||||||
| Total Joint Arrangement |
2,365,647 | 2,365,647 | 2,301,816 | 2,301,816 | ||||||||||||
| Investment |
656,429 | 522,218 | ||||||||||||||
|
|
|
|
|
|||||||||||||
| 12-31-2015 ThU.S.$ |
12-31-2014 ThU.S.$ |
|||||||
| Income |
720,499 | 260,934 | ||||||
| Expenses |
(612,101 | ) | (314,251 | ) | ||||
| Joint Arrangement Net Income (Loss) |
108,398 | (53,317 | ) | |||||
|
|
|
|
|
|||||
| Forestal Cono Sur S.A.(consolidated) |
12-31-2015 | 12-31-2014 | ||||||||||||||
| Assets ThU.S.$ |
Liabilities ThU.S.$ |
Assets ThU.S.$ |
Liabilities ThU.S.$ |
|||||||||||||
| Current |
23,267 | 21,495 | 26,034 | 21,790 | ||||||||||||
| Non-current |
176,876 | 4,654 | 171,630 | 700 | ||||||||||||
| Equity |
173,994 | 175,174 | ||||||||||||||
| Total Joint Arrangement |
200,143 | 200,143 | 197,664 | 197,664 | ||||||||||||
|
|
|
|
|
|
|
|
|
|||||||||
| Investment |
86,997 | 87,587 | ||||||||||||||
|
|
|
|
|
|||||||||||||
| 12-31-2015 ThU.S.$ |
12-31-2014 ThU.S.$ |
|||||||
| Income |
10,821 | 9,200 | ||||||
| Expenses |
(12,000 | ) | (4,844 | ) | ||||
| Joint Arrangement Net Income (Loss) |
(1,179 | ) | 4,356 | |||||
|
|
|
|
|
|||||
| Eufores S.A.(consolidated) |
12-31-2015 | 12-31-2014 | ||||||||||||||
| Assets ThU.S.$ |
Liabilities ThU.S.$ |
Assets ThU.S.$ |
Liabilities ThU.S.$ |
|||||||||||||
| Current |
158,735 | 187,311 | 132,001 | 193,615 | ||||||||||||
| Non-current |
611,500 | 39,994 | 641,668 | 32,368 | ||||||||||||
| Equity |
542,930 | 547,686 | ||||||||||||||
| Total Joint Arrangement |
770,235 | 770,235 | 773,669 | 773,669 | ||||||||||||
|
|
|
|
|
|
|
|
|
|||||||||
| Investment |
271,465 | 273,843 | ||||||||||||||
|
|
|
|
|
|||||||||||||
| 12-31-2015 ThU.S.$ |
12-31-2014 ThU.S.$ |
|||||||
| Income |
292,534 | 202,814 | ||||||
| Expenses |
(297,291 | ) | (222,853 | ) | ||||
| Joint Arrangement Net Income (Loss) |
(4,757 | ) | (20,039 | ) | ||||
|
|
|
|
|
|||||
| Zona Franca Punta Pereira S.A. (Uruguay) |
12-31-2015 | 12-31-2014 | ||||||||||||||
| Assets ThU.S.$ |
Liabilities ThU.S.$ |
Assets ThU.S.$ |
Liabilities ThU.S.$ |
|||||||||||||
| Current |
11,582 | 71,202 | 4,971 | 28,093 | ||||||||||||
| Non-current |
494,585 | 88,182 | 474,871 | 85,057 | ||||||||||||
| Equity |
346,783 | 366,692 | ||||||||||||||
| Total Joint Arrangement |
506,167 | 506,167 | 479,842 | 479,842 | ||||||||||||
|
|
|
|
|
|
|
|
|
|||||||||
| Investment |
173,392 | 183,346 | ||||||||||||||
|
|
|
|
|
|||||||||||||
| 12-31-2015 ThU.S.$ |
12-31-2014 ThU.S.$ |
|||||||
| Income |
19,079 | 20,885 | ||||||
| Expenses |
(41,988 | ) | (22,762 | ) | ||||
| Joint Arrangement Net Income (Loss) |
(22,909 | ) | (1,877 | ) | ||||
|
|
|
|
|
|||||
69
Table of Contents
CELULOSA ARAUCO Y CONSTITUCION S.A.
AND SUBSIDIARIES
Unaudited Consolidated Financial Statements
December 31, 2015
Amounts in thousands of U.S. dollars, except as indicated
The following tables set forth summarized financial information of the more significant interests in joint ventures:
| Unilin Arauco Pisos Ltda. |
12-31-2015 | 12-31-2014 | ||||||||||||||
| Assets ThU.S.$ |
Liabilities ThU.S.$ |
Assets ThU.S.$ |
Liabilities ThU.S.$ |
|||||||||||||
| Current |
5,943 | 2,304 | 9,933 | 6,917 | ||||||||||||
| Non-current |
3,544 | 37 | 4,942 | 63 | ||||||||||||
| Equity |
7,146 | 7,894 | ||||||||||||||
| Total Joint Arrangement |
9,487 | 9,487 | 14,875 | 14,875 | ||||||||||||
|
|
|
|
|
|
|
|
|
|||||||||
| Investment |
3,573 | 5,829 | ||||||||||||||
|
|
|
|
|
|||||||||||||
| 12-31-2015 ThU.S.$ |
12-31-2014 ThU.S.$ |
|||||||
| Income |
112 | 6,385 | ||||||
| Expenses |
(2,462 | ) | (6,378 | ) | ||||
| Joint Arrangement Net Income (Loss) |
(2,350 | ) | 7 | |||||
|
|
|
|
|
|||||
| Eka Chile S.A. |
12-31-2015 | 12-31-2014 | ||||||||||||||
| Assets ThU.S.$ |
Liabilities ThU.S.$ |
Assets ThU.S.$ |
Liabilities ThU.S.$ |
|||||||||||||
| Current |
23,457 | 8,365 | 18,378 | 3,951 | ||||||||||||
| Non-current |
30,203 | 5,097 | 28,792 | 5,272 | ||||||||||||
| Equity |
40,198 | 37,947 | ||||||||||||||
| Total Joint Arrangement |
53,660 | 53,660 | 47,170 | 47,170 | ||||||||||||
|
|
|
|
|
|
|
|
|
|||||||||
| Investment |
20,099 | 18,974 | ||||||||||||||
|
|
|
|
|
|||||||||||||
| 12-31-2015 ThU.S.$ |
12-31-2014 ThU.S.$ |
|||||||
| Income |
39,646 | 49,570 | ||||||
| Expenses |
(36,355 | ) | (48,530 | ) | ||||
| Joint Arrangement Net Income (Loss) |
3,291 | 1,040 | ||||||
|
|
|
|
|
|||||
70
Table of Contents
CELULOSA ARAUCO Y CONSTITUCION S.A.
AND SUBSIDIARIES
Unaudited Consolidated Financial Statements
December 31, 2015
Amounts in thousands of U.S. dollars, except as indicated
NOTE 17. IMPAIRMENT OF ASSETS
In 2015, a provision for the deterioration of the Arapoti Sawmill in an amount of ThU.S.$2,428, was registered reducing the recoverable value for these assets to zero.
Disclosure of Impairment Losses of Assets
Provisions for impairment of property, plant and equipment due to technical obsolescence have been recorded as of December 31, 2015 and 2014 respectively, as shown below:
| Disclosure of Asset Impairment |
||||||||
| Principal classes of Assets affected by Impairment and Reversal of Losses |
Machinery and Equipment | |||||||
| Principal Facts and Circumstances that lead to Recognizing Impairment and Reversal of losses |
Technical Obsolescence and Claim | |||||||
| 12-31-2015 | 12-31-2014 | |||||||
| Information relevant to the sum of all impairment |
ThU.S.$4,658 | ThU.S.$4,938 | ||||||
This impairment provision is being analyzed to determine the definitive write-off corresponding to the related assets. In addition, the Company recognized an impairment derived from the purchase of the 51% ownership in Novo Oeste Gestao de Ativos Florestais S.A. See Note 14 – acquisition of subsidiaries.
Goodwill
Goodwill is allocated to the groups of cash-generating units that are expected to benefit from the synergies of the combination.
At the date of these consolidated financial statements, the balance of goodwill is ThU.S.$69,475 (ThU.S.$82,573, at December 31, 2014)
Of the total of goodwill, ThU.S.$39,631 (ThU.S.$40,023 as of December 31, 2014) are generated by the acquisition of “Flakeboard”, a company that, directly and/or through its subsidiaries, possesses and operates 7 panel plants, for which Arauco acquired and paid, on September 24, 2012, the price of ThU.S.$242,502 for the 100% interest ownerhip.
The recoverable amount for Flakeboard’s cash generating unit was determined based on the calculations of its value in use, and this calculation was made using cash flow projections covering a 5-year term, applying a discount rate of 7.8% which reflects current market assessments for the Panels segment in North America.
The investment in the panel plant in Pien, Brazil generated a goodwill of ThU.S.$27,030 (ThU.S.$39,735 as of December 31, 2014).
The recoverable amount for the Pien plant’s cash generating unit was determined based on the calculations of its value in use, and this calculation was made using cash flow projections based on the operational plan approved by the Administration, covering a 5-year term, applying a 9% discount rate that reflects current evaluations for the panel segment in Brazil.
As a result of the annual impairment test, the carrying value of the goodwill does not exceed their recoverable value, and therefore there is no need to recognize impairment losses.
71
Table of Contents
CELULOSA ARAUCO Y CONSTITUCION S.A.
AND SUBSIDIARIES
Unaudited Consolidated Financial Statements
December 31, 2015
Amounts in thousands of U.S. dollars, except as indicated
Between December 31 2015 and 2014, the variation of the balance in goodwill is only due to the translation adjustments as explained in the accounting policies.
NOTE 18. PROVISIONS, CONTINGENT ASSETS AND CONTINGENT LIABILITIES
The contingent liabilities for outstanding litigations are as follows:
Celulosa Arauco y Constitución S.A.
1. On August 25, 2005, the Chilean Servicio de Impuestos Internos (the “Chilean IRS”) issued tax resolutions No. 184 and No. 185 of 2005, objecting to certain income tax returns made by Arauco on April 16, 2001 and October 31, 2001, and furthermore, requested reimbursement from the Company for the tax returnes made in respect of certain claimed tax losses as well as the modification of the tax balance of retained earnings. On November 7, 2005, the Company requested a Review of the Supervision Action (Revisión de la Actuación Fiscalizadora, or “RAF”), which is an administrative review of the tax action brought by the Chilean IRS, and filed a claim disputing the abovementioned tax resolutions No. 184 and 185 of 2005. The RAF was resolved on January 9, 2009 by the Chilean IRS, which resolution only partially sustained the Company’s request. In response, the Company filed an additional complaint with regard to the portion of the RAF that was not granted by the administrative review. On February 19, 2010, the Court acknowledged receipt of the Company’s request. Subsequently, the tax authority issued a report and the Company commented on such report.
On September 26, 2014, Arauco requested the submission of this claim to the competent jurisdiction of the new Tax and Customs Courts. On October 10, 2014, Arauco’s request was granted. Currently the action is being considered by these new Courts under the Docket No. RUC 14-9-0002087-3. On March 20, 2015, the SII responded to the allegations submitted by Arauco against Liquidations No. 184 and 185 of 2005. As the date of these financial statements, this case is pending.
2. In conecction with Licancel Plant, on June 22, 2011, the Company was notified of a civil claim for compensation of prejudice for an alleged tort liability, filed by twelve fishermen of the Mataquito River before the Court of First Instance, Guarantee and Family of Licantén under Docket number 73-2011. The case arose out of dead fish allegedly found in the Mataquito River on June 5, 2007 caused by the Licancel Plant. The plaintiffs seek to be compensated for alleged damages that they had from the aforementioned event, including loss of profits, pain and suffering and an alleged contractual liability.
On October 21, 2015 the Court issued a definitive first instance decision partially admitting the claim, sentencing Celulosa Arauco y Constitución S.A. to pay each claimant – as non-monetary damages – the sum of $5,000,000 plus adjustments, as per the variation of the CPI, calculated as from May 2007 until the month of the actual payment. On November 16, 2015, the defendant challenged the definitive decision through the submission of a cassation appeal based on formal aspects and an ordinary appeal. Pending. (Court of Appeals Docket No. 60-2016).
3. Through Res. Ex. N° 1 issued by the Superintendence of the Environment (“SMA”) on January 8, 2016, notified on January 14, 2016, the SMA formulated 11 charges against the Company, due to alleged breaches of certain Environmental Qualification Resolutions for the Valdivia Plant and of DS No. 90/2000. The 11 charges were classified as follows by the SMA: 1 critical, 5 severe, 5 minor.
72
Table of Contents
CELULOSA ARAUCO Y CONSTITUCION S.A.
AND SUBSIDIARIES
Unaudited Consolidated Financial Statements
December 31, 2015
Amounts in thousands of U.S. dollars, except as indicated
On February 12, 2016, the Company submitted its defenses. The SMA shall analyze and rule on the defenses, and it may request new information or open a term for providing evidence. Once these proceedings have been discharged, the SMA will issue a resolution that either absolves or sanctions the Company. The resolutions issued by the SMA may be appealed before the Environmental Court.
4. Through Res. Ex. N° 1 of the SMA, dated February 17, 2016 notified on February 23, 2016, the SMA formulated 8 charges against the company due to alleged breaches of certain Environmental Qualification Resolutions for the Nueva Aldea Plant. The 8 charges were qualified by the SMA as follows: 7 severe and 1 minor.
As of this date, the Company is within the time period granted to raise defenses, or alternatively, to propose a compliance program that, if approved and satisfactorily executed, would allow the termination of the proceedings without the imposition of sanctions. Should defenses be raised, the SMA will issue a resolution that either absolves or sanctions the Company. The SMA’s rulings may be challenged before the Environmental Court.
Arauco Argentina S.A. (Ex -Alto Paraná S.A.)
1. (i) On October 8, 2007, the Federal Administration of Internal Revenue (Administración Federal de Ingresos Públicos) (AFIP) initiated an ex oficio proceeding against our Argentine affiliate Arauco Argentina S.A. challenging its deduction from its income tax liability of certain expenses, interest payments and exchange rate differences generated by Private Negotiable Obligations which were issued by such company in 2001 and paid in 2007.
On November 20, 2007, Arauco Argentina S.A. submitted a counterclaim completely rejecting all of AFIP’s allegations and asserting legal arguments that justify its actions in the determination of its income tax.
On December 14, 2007, AFIP notified Arauco Argentina S.A. that its counterclaim had been dismissed, thus issuing an ex oficio ruling and ordering the payment, within 15 working days, of the calculated income tax difference for the 2002, 2003 and 2004 fiscal years of Argentine Pesos $417,908,207 (ThU.S.$ 32,048 at December 31, 2015), compensatory interest, and fines for omission. On February 11, 2008, Arauco Argentina S.A. appealed the aforementioned ruling before the National Tax Court (“Tribunal Fiscal de la Nación”) (TFN).
On February 8, 2010, Arauco Argentina S.A. was notified of TFN’s ruling, which confirmed the ruling issued by AFIP, with court expenses, based on arguments different from those that justified AFIP’s ex oficio decision. This decision by the TFN extinguished the administrative process. As a result, the company’s only remaining option was to pursue a remedy before the Contentious Administrative Matters Federal Appeals Court (“Cámara de Apelaciones en lo Contencioso Administrativo Federal”) (CACAF) and, subsequently, the National Supreme Court of Justice (“Corte Suprema de Justicia de la Nación”).
On February 15, 2010, Arauco Argentina S.A. appealed before the CACAF, making all necessary submissions with the purpose of attaining a revocation of the contested decision. Arauco Argentina S.A. paid litigation fees (tasa de justicia) in the amount of Argentine Pesos 5,886,053 (ThU.S.$451 at December 31, 2015).
73
Table of Contents
CELULOSA ARAUCO Y CONSTITUCION S.A.
AND SUBSIDIARIES
Unaudited Consolidated Financial Statements
December 31, 2015
Amounts in thousands of U.S. dollars, except as indicated
On March 18, 2010, the CACAF issued a court decree in which it ordered the AFIP to refrain from requesting the blocking of preventive interim relief measures, administratively demanding payment, issuing debt invoices, or initiating judicial collection actions, including seizure of property and other enforcement measures, against Arauco Argentina S.A. until CACAF reaches a decision on APSA’s request for an injunction.
On May 13, 2010, the CACAF decided to grant the injunction requested by Arauco Argentina S.A., ordering to suspend the enforcement of the AFIP resolution until the final decision on this matter. This injunction was granted by the CACAF subject to the granting of a corresponding bond. On May 19, 2010, Arauco Argentina S.A. filed with the Appeal Court a surety policy issued by Zurich Argentina Cía. de Seguros S.A. On May 20, 2010, the CACAF asked Arauco Argentina S.A. to specify the areas covered by the surety insurance. On May 28, 2010 Arauco Argentina S.A. complied with this request and attached Endorsement No. 1 of the surety policy in favor of the CACAF – Trial Chamber I – in the amount of Argentine Pesos 633,616,741 (equivalent to ThU.S.$48,590 as of December 31, 2015), which includes initial capital, plus adjustments and interests to the date of the bond. On June 2, 2010 the CACAF accepted this surety filed by Arauco Argentina S.A. and sent notice to AFIP of the injunction granted. On June 4, 2010 the AFIP was notified of the ruling dated May 13, 2010, which is final since June 22, 2010.
On February 1, 2013, Arauco Argentina S.A. received notice of the decision dated December 28, 2012, whereby the First Chamber of Appeals rejected the appeal lodged by the company, confirming the ex officio determination of the AFIP, and imposed the judicial fees for both instances as per their generation, since there was contradictory case law. The company appealed this decision before the National Supreme Court of Justice via the various legal procedural remedies available. On February 4, 2013, the company filed an ordinary appeal against the Chamber’s decision and on February 19, 2013, it also filed an extraordinary appeal against the same judgment, both before the National Supreme Court of Justice. On May 6, 2013, Arauco Argentina S.A. was notified of the decision of the Court of Appeals that, as of April 23, 2013, granted the ordinary appeal to the National Supreme Court of Justice and was present, to her chance the Extraordinary Appeal field. On May 27, 2013, the file was forwarded to the Supreme Court of Justice of the Country. On June 3, 2013, Arauco Argentina S.A. was notified of the procedural ruling issued by the High Court on May 29, 2013, declaring that the Ordinary Appeal had been duly received. On June 17, 2013, Arauco Argentina S.A. submitted a duly founded presentation in connection with the Appeal, which the Court subsequently ordered to be transferred to AFIP, a circumstance of which the company was notified on June 28, 2013.
The reasoning of the Chamber of Appeals’ decision did not modify the opinion of our external counsel in that the company acted in accordance with law when deducting the interest, expenses and exchange differences in the indebtedness challenged by the State, and they still hold that there are good possibilities for the decision to be quashed, rendering without effect AFIP’s ex officio determination.
(ii) Within the course of these case’s proceedings, and particularly regarding payment of the litigation fees (tasa de justicia) before the TFN, on July 18, 2008, the Examining Officer ordered Arauco Argentina S.A. to pay Argentine Pesos 10,447,705 (ThU.S.$801 at December 31, 2015) as payment of Tasa de Actuación (Litigation Fee) before the TFN. On August 14, 2008, Arauco Argentina S.A filed a petition with the court requesting that this order be reconsidered, or alternatively, rejected on the grounds that the requested amount was unreasonable. Arauco Argentina S.A provided evidence that it had paid Argentine Pesos 1,634,914 (ThU.S.$125 at December 31, 2015), considering that this was the actual
74
Table of Contents
CELULOSA ARAUCO Y CONSTITUCION S.A.
AND SUBSIDIARIES
Unaudited Consolidated Financial Statements
December 31, 2015
Amounts in thousands of U.S. dollars, except as indicated
amount due, pursuant to Law, for the Tasa de Actuación (Litigation Fee). On April 13, 2010, the First Chamber of the CACAF denied Arauco Argentina S.A.’s appeal. On April 26, 2010, Arauco Argentina S.A. filed an ordinary appeal against the latter decree before the National Supreme Court of Justice, which was granted on February, 3, 2011. On June 23, 2011, the brief with the ordinary appeal was filed before the Supreme Court. On July, 14, 2011, AFIP answered the petition of this brief. On May 8, 2012, the Supreme Court ruled that the ordinary remedy was wrongly admitted, since the appealed sentence was not a final ruling. The case file was returned to First Chamber of the National Appeals Court of Contentious Administrative Matters. On June 15, 2012, Arauco Argentina S.A. requested that the case be suspended until the substantial issues of the case were resolved, a request which was rejected by the CACAF on June 25, 2012. On July 2, 2012, Arauco Argentina S.A. filed a motion to reconsider, requesting that such ruling be rendered ineffective and the extraordinary proceeding be suspended until the substantial issues of the case were ruled on, also expressing that it still maintained its interest in the extraordinary remedy that was submitted. On August 21, 2012, Arauco Argentina S.A. filed a presentation which expressed its interest to maintain the extraordinary appeal. On February 19, 2013, Arauco Argentina S.A. requested the Extraordinary Remedy to be dealt with, and that copy of the judgment passed in the main suit be attached thereto. On the same date Arauco Argentina S.A. lodged a Federal Extraordinary remedy on grounds that the judgment relating to the procedural tax discussed in this ancillary suit ought to be analyzed in consistency with that of the main suit. On April 8, 2013, the Chamber conferred upon AFIP a period to respond to Arauco Argentina S.A.’s Extraordinary Remedy. On November 26, 2013, Arauco Argentina S.A. was served with a ruling dated October 8, 2013 whereby the 1st Chamber of the Appeals Department decided to deny Arauco Argentina S.A.’s May 6, 2010 Extraordinary Remedy, imposing upon Arauco Argentina S.A. the obligation to bear the court costs and fees. On November 18, 2014, the 1st Chamber of the Appeals Department decided to dismiss Arauco Argentina S.A.’s second extraordinary remedy.
2. By way of Resolutions Nos. 952/2000 and 83/03, and within the context of the provisions of Law No. 25,080, the former Secretary for Agriculture, Ranching, Fishing and Foods approved the projects submitted by Arauco Argentina S.A. to build an MDF plant (boards) and a sawmill, along with the forestation of several hectares for supplying said industries.
In March of 2005, by way of Note No. 145/05, issued by the Undersecretary for Agriculture, Ranching and Forestation, the exemption to pay exportation duties granted to Arauco Argentina S.A. was suspended, as were the exemptions granted to all other companies benefited by this system under Law No. 25,080, a suspension which was implemented as a preventive measure, invoking the need to review the proceedings conducted in the respective case files. After the exhaustion of the administrative procedures, the measure is being argued by the company before the courts. In said context, on November 8, 2006, the V Chamber of the National Appeals Court for Adversarial Administrative and Federal Matters issued a ruling ordering that Arauco Argentina S.A. to continue to enjoy an exemption from paying the exportation duties, provided that it guarantee said duties by taking out warranty insurance. The judicial measure became effective beginning on March of 2007 by collateralization through the granting of bond (caución) policies for each shipment permits exempted from payment of export duty. Notwithstanding this ruling, the issuance of the ruling on the substantial issues of the matter is still pending. The company maintains an assignment of funds equivalent to ThU.S.$ 23,541 in connection to the aforementioned export duties, which is shown under not current provisions.
The export duties paid by the company while the benefit was suspended were allocated to the results of each financial year. As of this date, the company has submitted a claim
75
Table of Contents
CELULOSA ARAUCO Y CONSTITUCION S.A.
AND SUBSIDIARIES
Unaudited Consolidated Financial Statements
December 31, 2015
Amounts in thousands of U.S. dollars, except as indicated
against the National Government demanding the return of ThU.S.$6,555, plus interest accrued as from the serving of process of said claim, amount which corresponds to the Export Duties paid between March of 2005 and March of 2007 as a result of the benefit’s suspension.
In turn, during April of year 2005, the Secretary for Agriculture, Ranching, Fishing and Foods issued Resolution No. 260/2005, requiring that holders of any firms that had received the fiscal benefits granted under Law No. 25,080 should establish guarantees to cover the total amount of any such benefits, considering for such purposes all benefits that had been enjoyed until the date of their establishment. Arauco Argentina S.A. then proceeded to establish the required guarantees, which - as of the date of these financial statements - amount to Argentine Pesos 172,602,362 (equivalent to ThU.S.$13,296 at December 31, 2015).
Arauco Argentina S.A. believes that it has complied with all of the obligations imposed upon it by the system set forth under Law No. 25,080.
3. On December 6, 2013, Arauco Argentina S.A. was served upon Resolution 803 issued by the Central Bank of the Republic of Argentina (BCRA) on November 22, 2013. By means of such resolution, the BCRA initiated Investigation No. 5581, whereby it is sought to determine the absence of currency inflow and liquidation, and the delayed inflow of currency arising from export operations.
On March 6, 2014, the BCRA notified Arauco Argentina S.A. that it had received the APSA’s response and was beginning the trial period. On June 18, 2014 the BCRA notified the company of the closure of the trial period. On June 26, 2014 APSA presented its answer. On October 6, 2014, the company was served with the ruling dated September 30, 2014, issued by the National Criminal and Economic Court No. 8, Secretary No. 16, through which it was notified that the court would analyze the case under Case File No. 1330/2014.
As of the date of issuance of these financial statements, in the opinion of the company´s legal advisors, the likelihood of obtaining a favorable outcome (that is to say, no fines being imposed) is high, given the solid defense arguments raised by Arauco Argentina S.A. and the precedents relating to infractions of a similar nature.
Arauco do Brasil S.A.
On November 8, 2012, the Brazilian tax authorities issued an Infringement Notice against one of our Brazilian subsidiaries, Arauco do Brasil S.A., for allegedly unpaid taxed owed by said company during the period from 2006 to 2010. Specifically, the tax authorities (i) objected to the deductibility of certain payments made, and expenses incurred (including the amortization of premiums, interest and litigation costs) by Arauco do Brasil between 2005 and 2010, and, (ii) argued that Arauco do Brasil made certain insufficient payments regarding the Brazilian Corporate Tax (“IRPJ”) and the Corporate Contribution over Net Profits (“CSLL”) during 2010.
On July 20, 2015, Arauco do Brasil was notified of the first-level administrative ruling which partially upheld the Infringement. Against this ruling, a Voluntary Appeal was filed seeking to revoke the Infringement Notice before the Brazilian Administrative Tax Council (Conselho Administrativo de Recursos Fiscais de Brasil or “CARF”), which is the second administrative level. As of the date of this report, the trial pertaining to this objection is still pending. The company believes that its challenge against the Infringement Notice is based on sound legal
76
Table of Contents
CELULOSA ARAUCO Y CONSTITUCION S.A.
AND SUBSIDIARIES
Unaudited Consolidated Financial Statements
December 31, 2015
Amounts in thousands of U.S. dollars, except as indicated
grounds and that a reasonable possibility exists that this matter will be resolved in favor of the company. However, if a favorable ruling is not obtained, it is possible that an obligation is generated in the aforementioned sums, plus interest and fines, up to the date on which the respective payment is made.
Forestal Arauco S.A. (ex Forestal Celco S.A.)
1. On October 26, 2012, Forestal Valdivia S.A., now Forestal Arauco S.A., was notified of a restitution suit filed by Mr. Nelson Vera Moraga, Attorney representing the estate of Mrs. Julia Figueroa Oliveiro, which occurred over 60 years ago. That application was lodged with the Civil Court of Loncoche, Docket Number 79-2012, and the lawsuit demanded the recovery and restitution of two estates, with their products and improvements, arguing that the aforementioned estate is the sole and exclusive owner of two real estate properties whose total surface amounts to 1,210 hectares and are allegedly occupied by Forestal Valdivia S.A. On March 13, 2014, the Court issued a first instance ruling rejecting the claim. On March 31, 2014, the plaintiff appealed the first instance ruling through the submittal of a cassation appeal with regards to procedural aspects to the Court of Appeals of Temuco. On August 10, 2015, the Court of Appeals of Temuco issued a decision confirming the first instance decision with litigation costs.
On August 28, 2015, the plaintiff filed a cassation appeal based on substantial and procedural grounds against the judgment of the Court of Appeals. On September 4, 2015, the Court of Appeals set an outcome guaranty deposit (fianza de resultas) of 50 million Chilean pesos. On September 10, 2015, the defendant requested that the guaranty deposit be set aside, or alternatively reduced to the amount of 300,000 Chilean Pesos. On September 16, 2015, the Court of Appeals decided to keep the guaranty deposit in the amount of 50 million Chilean pesos. On October 21, 2015, the cassation appeal was processed by the Supreme Court. On October 23, 2015, the petitioner formally became a party to the cassation proceedings. On November 3, 2015, the respondent formally became a party to the cassation proceedings. On November 6, 2015, Forestal Arauco S.A. filed a motion for the declaration of inadmissibility of the cassation appeal. On December 30, 2015, the Supreme Court summoned the parties to a hearing to be held on a date yet to be defined. Ongoing proceedings (Case Docket Supreme Court 595-2014).
2. On October 8, 2013, Bosques Arauco S.A., now Forestal Arauco S.A. was notified of a civil claim filed by Mr. Manuel Antonio Fren Casanova, requesting the court to declare the properties known as Cuyinco and Cuyinco Alto as two different properties and, therefore, to order the cancellation of the ownership registration in the name of Bosques Arauco S.A. found on N° 290 of page 266 of the Registry of Property kept by the Real Estate Registrar of Cuyinco Alto, on the grounds that, Bosques Arauco S.A. erroneously understood that its property, Cuyinco Alto of 4,600 hectares, would also encompass the land known as Cuyinco, which allegedly belongs to the claimant.
The claim was filed before the Civil Court of Lebu (Case File No. C-269-2013). On October 27, 2015, the Court passed a first instance definitive judgment, dismissing the claim in its entirety. On November 16, 2015, the plaintiff challenged the first instance judgment by means of a cassation appeal based on substantial and procedural grounds. Currently the case file is pending at the Court of Appeals, which shall proceed to entertain and decide upon such remedy. (Case Docket Court of Appeals No. 1956-2015).
3. Maquinarias y Equipos Klenner Limitada filed a civil damages claim before the First Civil Court of Valdivia, Case File number C-375-2015, against Forestal Arauco S.A. The claim
77
Table of Contents
CELULOSA ARAUCO Y CONSTITUCION S.A.
AND SUBSIDIARIES
Unaudited Consolidated Financial Statements
December 31, 2015
Amounts in thousands of U.S. dollars, except as indicated
seeks compensation for alleged damages brought as a result of the termination of a service provision contract that took place on February 9, 2010
On February 6, 2015, the claim was served on Mr. Cristián Durán Silva, on behalf of Forestal Arauco S.A. On February 12, 2015, the company appeared submitting a motion to void the service of process, since Mr. Cristian Durán Silva was not the legal representative of Forestal Arauco S.A., and because the requirements of article 44 of the Code of Civil Procedure had not been fulfilled in this service of process.
The Court granted the plaintiff the legal term to submit its arguments in this regard, issuing a resolution dated February 17 of 2015. Moreover, the company required that proceedings be suspended while this matter was pending decision. The Court gave the floor to the plaintiff with regard to this request. In view of the foregoing, on February 24, 2015, the company raised dilatory defenses, In view of the above, on February 24, 2015, the company filed dilatory defenses, which were dismissed by the Court on August 20, 2015. The decision whereby the defenses were dismissed was appealed by the defendant, and such appeal was ultimately dismissed by the Court of Appeals of Valdivia. On September 2, 2015, Forestal Arauco S.A. answered the claim. Subsequently, the plaintiff filed a reply, and the defendant filed the rejoinder. On October 1, 2015, a settlement hearing took place without any results. Currently, the parties are awaiting the decision whereby the period for the submission of evidence will commence. Ongoing lawsuit.
4. On April 28, 2015, the company was notified of and answered the action for recovery submitted in ordinary proceedings by Mr. Rodrigo Huanquimilla Arcos and Mr. Mario Andrades Rojas, attorneys at law, on behalf of 24 members of the Arcos succession, who claiming to be owners of the estate that they identify as Hacienda Quivolgo, of 5,202 hectares, request that Forestal Celco S.A., currently Forestal Arauco S.A., be sentenced to return the abovementioned real property plus civil and natural fruits or revenues as well as any estates adhered to it, along with any damages that the real property may have suffered, with litigation costs. The company proceeded to answer the claim requesting that it be completely rejected, arguing that Forestal Celco S.A., currently Forestal Arauco S.A., is the sole and legitimate owner of the real property. The discussion phase concluded and the settlement hearing took place, without any results. Case file C-334-2014 of the Civil Court of Constitución.
5. On April 6, 2015, the company was notified through a rogatory letter regarding the claim submitted by Mr. Gustavo Andrés Ochagavía Urrutia, attorney at law, acting on behalf of 23 members of the Arcos succession, who claim to be the owners of the estate that they identify as Hacienda Quivolgo, of 5,202 hectares, requesting that Forestal Celco S.A., currently Forestal Arauco S.A., be ordered to return the abovementioned real property plus civil and natural fruits or revenues as well as any estates adhered to it, along with any damages that the real property may have suffered, with litigation costs. They base their claim in that Forestal Celco S.A., currently Forestal Arauco S.A., is allegedly in possession but does not own the real property in question. On April 28, 2014, the company proceeded to answer the claim requesting that it be completely rejected, arguing that Forestal Celco S.A., currently Forestal Arauco S.A., is the sole and legitimate owner of the real property.
On January 6, 2016, the plaintiff was notified of the ruling which commences the trial period. On January 8, 2016, the defendant requested a consolidation of the proceedings with Case file 334-2014, as well as the suspension of the proceedings until this request is decided upon. On January 12, 2016, the Court served the plaintiff in respect of the
78
Table of Contents
CELULOSA ARAUCO Y CONSTITUCION S.A.
AND SUBSIDIARIES
Unaudited Consolidated Financial Statements
December 31, 2015
Amounts in thousands of U.S. dollars, except as indicated
consolidation request, suspending the proceeding in the meantime. Case file C-54-2015 of the Civil Court of Constitución.
No provisions have been recognized from the aforementioned contingences. At the end of each reporting period there are no other contingencies that might significantly affect the Company’s financial, position or results of operations.
Provisions recorded as of December 31, 2015 and 2014 are as follows:
| 12-31-2015 | 12-31-2014 | |||||||
| Classes of Provisions |
ThU.S.$ | ThU.S.$ | ||||||
| Provisions, Current |
858 | 2,535 | ||||||
| Provisions for litigations |
404 | 1,765 | ||||||
| Other provisions |
454 | 770 | ||||||
| Provisions, non-Current |
34,541 | 64,529 | ||||||
| Provisions for litigations |
10,996 | 14,273 | ||||||
| Other provisions |
23,545 | 50,256 | ||||||
|
|
|
|
|
|||||
| Total Provisions |
35,399 | 67,064 | ||||||
|
|
|
|
|
|||||
Provisions for litigations are related to labor and tax claims whose payment period is uncertain. Other provisions mainly include the recognition of a liability related to investments in associates and joint ventures accounted under the equity method with net asset deficiency at the end of the reporting period.
| 12-31-2015 | ||||||||||||
| Other | ||||||||||||
| Movements in Provisions |
Litigations ThU.S.$(*) |
Provisions ThU.S.$(**) |
Total ThU.S.$ |
|||||||||
| Opening balance |
16,038 | 51,026 | 67,064 | |||||||||
| Changes in provisions |
||||||||||||
| Increase in existing provisions |
2,555 | 1,429 | 3,984 | |||||||||
| Payments |
(2,990 | ) | 0 | (2,990 | ) | |||||||
| Decrease in foreign currency exchange |
(5,163 | ) | 0 | (5,163 | ) | |||||||
| Other Increases (Decreases) |
960 | (28,456 | ) | (27,496 | ) | |||||||
| Total Changes |
(4,638 | ) | (27,027 | ) | (31,665 | ) | ||||||
| Closing balance |
11,400 | 23,999 | 35,399 | |||||||||
|
|
|
|
|
|
|
|||||||
| (*) | The increase in legal claims is composed mainly of Th.U.S.S$1,558 from Brazilian subsidiaries in connection with civil and labor lawsuits, being the latter the most important. In addition there are ThU.S$840 from Arauco Argentina in connection with labor lawsuits. |
| (**) | The increase of Other Provisions comprises mainly an increase of Th.U.S$1,429 from Arauco Argentina for export duties. While in the Other Increases (Decreases) line item, the reverse of Negative Equity to Arauco Forest Brasil over Novo Oeste by Th.U.S.$ 25,290 and Forestal Cholguán over Sercor is reflected by Th.U.S.$2,850. |
| 12-31-2014 | ||||||||||||
| Other | ||||||||||||
| Movements in Provisions |
Litigations ThU.S.$(*) |
Provisions ThU.S.$(**) |
Total ThU.S.$ |
|||||||||
| Opening balance |
18,406 | 15,457 | 33,863 | |||||||||
| Changes in provisions |
||||||||||||
| Increase in existing provisions |
9,585 | 16,782 | 26,367 | |||||||||
| Payments |
(8,951 | ) | — | (8,951 | ) | |||||||
| Decrease in foreign currency exchange |
(818 | ) | (3,324 | ) | (4,142 | ) | ||||||
| Other Increases (Decreases) |
(2,184 | ) | 22,111 | 19,927 | ||||||||
| Total Changes |
(2,368 | ) | 35,569 | 33,201 | ||||||||
| Closing balance |
16,038 | 51,026 | 67,064 | |||||||||
|
|
|
|
|
|
|
|||||||
| (*) | In the increase of legal claims US$3.3 million are included that correspond to 50 % of trial provision with the supplier in the construction of the pulp mill in Uruguay SACEEM Zona Franca S.A. (joint agreement). |
| (**) | The increase in Other Provisions, is comprised mainly of an increase of Th.U.S.$2,850 from the provision of Negative Equity of Forestal Cholguan over Sercor and Th.U.S.$ 13,162 of Arauco Forest Brasil over Novo Oeste. |
Another increase in Other Provisions corresponds to the Th.U.S$ 21,549 for the provision of export duties.
79
Table of Contents
CELULOSA ARAUCO Y CONSTITUCION S.A.
AND SUBSIDIARIES
Unaudited Consolidated Financial Statements
December 31, 2015
Amounts in thousands of U.S. dollars, except as indicated
NOTE 19. INTANGIBLE ASSETS
| 12-31-2015 | 12-31-2014 | |||||||
| Classes of Intangible Assets, Net |
ThU.S.$ | ThU.S.$ | ||||||
| Intangible assets, net |
88,112 | 93,258 | ||||||
| Computer software |
21,251 | 18,224 | ||||||
| Water rights |
5,485 | 5,442 | ||||||
| Customer |
55,265 | 63,164 | ||||||
| Other identifiable intangible assets |
6,111 | 6,428 | ||||||
|
|
|
|
|
|||||
| Classes of intangible Assets, Gross |
142,704 | 137,041 | ||||||
| Computer software |
58,275 | 49,109 | ||||||
| Water rights |
5,485 | 5,442 | ||||||
| Customer |
70,676 | 74,432 | ||||||
| Other identifiable intangible assets |
8,268 | 8,058 | ||||||
|
|
|
|
|
|||||
| Classes of accumulated amortization and impairment |
||||||||
| Total accumulated amortization and impairment |
(54,592 | ) | (43,783 | ) | ||||
| Accumulated amortization and impairment, intangible assets |
(54,592 | ) | (43,783 | ) | ||||
| Computer software |
(37,024 | ) | (30,885 | ) | ||||
| Customer |
(15,411 | ) | (11,268 | ) | ||||
| Other identifiable intangible assets |
(2,157 | ) | (1,630 | ) | ||||
|
|
|
|
|
|||||
Reconciliation of the carrying amount of intangible assets at the beginning and end of each reporting period balances
| 12-31-2015 | ||||||||||||||||||||
| Reconciliation of intangible assets |
Computer Software ThU.S.$ |
Water Rights ThU.S.$ |
Customer ThU.S.$ |
Others ThU.S.$ |
TOTAL ThU.S.$ |
|||||||||||||||
| Opening Balance |
18,224 | 5,442 | 63,164 | 6,428 | 93,258 | |||||||||||||||
| Changes |
||||||||||||||||||||
| Additions |
9,638 | 66 | — | 690 | 10,394 | |||||||||||||||
| Disposals |
(73 | ) | — | — | (70 | ) | (143 | ) | ||||||||||||
| Amortization |
(6,448 | ) | (2 | ) | (4,819 | ) | (684 | ) | (11,953 | ) | ||||||||||
| Increase (decrease) in foreign currency conversion |
(84 | ) | (21 | ) | (3,080 | ) | (253 | ) | (3,438 | ) | ||||||||||
| Others Increases (Decreases) |
(6 | ) | — | — | — | (6 | ) | |||||||||||||
| Changes Total |
3,027 | 43 | (7,899 | ) | (317 | ) | (5,146 | ) | ||||||||||||
| Closing Balance |
21,251 | 5,485 | 55,265 | 6,111 | 88,112 | |||||||||||||||
|
|
|
|
|
|
|
|
|
|
|
|||||||||||
| 12-31-2014 | ||||||||||||||||||||
| Reconciliation of intangible assets |
Computer Software ThU.S.$ |
Water Rights ThU.S.$ |
Customer ThU.S.$ |
Others ThU.S.$ |
TOTAL ThU.S.$ |
|||||||||||||||
| Opening Balance |
17,004 | 5,422 | 70,054 | 7,171 | 99,651 | |||||||||||||||
| Changes |
||||||||||||||||||||
| Additions |
9,956 | — | — | 145 | 10,101 | |||||||||||||||
| Amortization |
(6,699 | ) | — | (5,040 | ) | (736 | ) | (12,475 | ) | |||||||||||
| Increase (decrease) in foreign currency conversion |
(2,037 | ) | 20 | (1,850 | ) | (152 | ) | (4,019 | ) | |||||||||||
| Changes Total |
1,220 | 20 | (6,890 | ) | (743 | ) | (6,393 | ) | ||||||||||||
| Closing Balance |
18,224 | 5,442 | 63,164 | 6,428 | 93,258 | |||||||||||||||
|
|
|
|
|
|
|
|
|
|
|
|||||||||||
| Average | ||||||||
| Computer Software |
Years | 5 | ||||||
The amortization of customer and computer software is presented in the Consolidated Statements of profit or loss under the Administrative Expenses line item.
80
Table of Contents
CELULOSA ARAUCO Y CONSTITUCION S.A.
AND SUBSIDIARIES
Unaudited Consolidated Financial Statements
December 31, 2015
Amounts in thousands of U.S. dollars, except as indicated
NOTE 20. BIOLOGICAL ASSETS
Biological assets comprise forestry plantations, mainly radiata and taeda pine, and to a lesser extent eucalyptus. The plantations are located in Chile, Argentina, Brazil and Uruguay, with a total surface of 1.7 million hectares, out of which 1 million hectares are used for forestry planting, 406 thousand hectares are native forest, 186 thousand hectares are used for other purposes and 55 thousand hectares not yet planted.
As of December 31, 2015, the production volume of logs totaled 19.4 million cubic meters (19.9 million cubic meters as of December 31, 2014).
Measurements of fair value of Arauco’s biological assets are classified as Level 3, due to the fact that inputs are not observable. However, this information reflects the assumptions that market participants would use in pricing the asset, including assumptions about risk.
These unobservable inputs were developed using the best information available and includes internal data from Arauco. These unobservable inputs can be adjusted if the available information indicates that other market participants would use different information or there is something specific in Arauco that is not available to other market participants.
The main considerations in determining the fair value of biological assets include the following:
| • | Arauco uses discounted expected future cash flows of its forest plantations, which are based on a harvest projection date for all existing plantations. |
| • | Current forestry plantations are projected based on a net volume that will not decrease, with a minimum growth equivalent to the current supply demand. |
| • | Future plantations are not considered. |
| • | The harvest of forestry plantations supplies raw materials for all other products that Arauco produces and trades. By directly controlling the development of forests that will be processed, Arauco ensures high quality timber for each of its products. |
| • | Expected cash flows are determined in terms of harvest and expected sale of forestry products, associated with the demand from the Company’s own industrial centers and sales to third parties at market prices. Sales margin of the different products that are harvested in the forest is also considered in the valuation. The changes in the value of the plantations pursuant to the criteria defined above are accounted for in the results for the fiscal year, as established in IAS 41. These changes are presented in the Statement of profit or loss under the line item Other income per function, which as of December 31, 2015 amounted to ThU.S.$210,479 (ThU.S.$284,497 and ThU.S.$269,671 as of December 31, 2014 and 2013). The appraisal of biological assets resulted in a greater cost of the lumber sold in comparison to the real incurred cost, which is presented in the cost of sales which as of December 31, 2015 amounted to ThU.S.$185,737 (ThU.S.$220,950 and ThU.S.$221.874 as of December 31, 2014 and 2013 ). |
| • | Forestry plantations are harvested according to the needs of Arauco’s production plants. |
| • | The discount rates used are 8% for Chile, Brazil and Uruguay, and 12% in Argentina. |
| • | It is expected that prices of harvested timber are constant in real terms based on market prices. |
| • | Cost expectations with respect to the lifetime of the forests are constant based on estimated costs included in the projections made by Arauco. |
81
Table of Contents
CELULOSA ARAUCO Y CONSTITUCION S.A.
AND SUBSIDIARIES
Unaudited Consolidated Financial Statements
December 31, 2015
Amounts in thousands of U.S. dollars, except as indicated
| • | The average crop age by species and country is: |
| Chile | Argentina | Brazil | Uruguay | |||||||||||||
| Pine |
24 | 15 | 15 | — | ||||||||||||
| Eucalyptus |
12 | 10 | 7 | 10 | ||||||||||||
The following table sets forth changes in fair value of biological assets considering variations in significant assumptions considered in calculating the fair value of the assets:
| ThU.S.$ | ||||||||
| Discount rate |
0,5 | (116,485 | ) | |||||
| -0,5 | 123,707 | |||||||
|
|
|
|
|
|||||
| Margins (%) |
10 | 416,035 | ||||||
| -10 | (416,035 | ) | ||||||
Forestry plantations classified as current Biological assets are those to be harvested and sold within twelve months after the reporting period.
The Company has contracted fire insurance policies for its forestry plantations, which in conjunction with the Company’s resources and efficient protection measures for these forestry assets, allow financial and operational risks to be minimized.
Detail of Biological Assets Pledged as Security
As of December 31, 2015, there are no forestry plantations pledged as security.
Detail of Biological Assets with Restricted Ownership
As of the date of these consolidated financial statements, there are no biological assets with restricted ownership.
No significant government grants have been received.
82
Table of Contents
CELULOSA ARAUCO Y CONSTITUCION S.A.
AND SUBSIDIARIES
Unaudited Consolidated Financial Statements
December 31, 2015
Amounts in thousands of U.S. dollars, except as indicated
Current and Non-Current Biological Assets
As of the date of these consolidated financial statements, the Current and Non-current biological assets are as follows:
| 12-31-2015 | 12-31-2014 | |||||||
| ThU.S.$ | ThU.S.$ | |||||||
| Current |
272,037 | 307,551 | ||||||
| Non-current |
3,554,560 | 3,538,802 | ||||||
| Total |
3,826,597 | 3,846,353 | ||||||
|
|
|
|
|
|||||
Reconciliation of carrying amount of biological assets
| Movement |
12-31-2015 ThU.S.$ |
|||
| Opening Balance |
3,846,353 | |||
| Changes in Biological Assets |
||||
| Additions through acquisition and costs of new plantations |
215,557 | |||
| Sales |
(1,028 | ) | ||
| Harvest |
(299,501 | ) | ||
| Gain (losses) arising from changes in fair value less costs to sale |
210,479 | |||
| Increases (decreases) in Foreign Currency Translation |
(111,502 | ) | ||
| Loss of forest due to fires |
(34,850 | ) | ||
| Other Increases (decreases) |
1,089 | |||
| Total Changes |
(19,756 | ) | ||
| Closing Balance |
3,826,597 | |||
|
|
|
|||
| Movement |
12-31-2014 ThU.S.$ |
|||
| Opening Balance |
3,892,203 | |||
| Changes in Biological Assets |
||||
| Additions through acquisition and costs of new plantations |
132,969 | |||
| Sales |
(39,432 | ) | ||
| Harvest |
(338,440 | ) | ||
| Gain (losses) arising from changes in fair value less costs to sale |
284,497 | |||
| Increases (decreases) in Foreign Currency Translation |
(44,020 | ) | ||
| Loss of forest due to fires |
(31,512 | ) | ||
| Other Increases (decreases) |
(9,912 | ) | ||
| Total Changes |
(45,850 | ) | ||
| Closing Balance |
3,846,353 | |||
|
|
|
|||
As of the date of these consolidated financial statements, there are no disbursements related to the acquisition of biological assets.
83
Table of Contents
CELULOSA ARAUCO Y CONSTITUCION S.A.
AND SUBSIDIARIES
Unaudited Consolidated Financial Statements
December 31, 2015
Amounts in thousands of U.S. dollars, except as indicated
NOTE 21. ENVIRONMENTAL MATTERS
Environment Management
For Arauco, sustainability means management strategy. This strategy incorporates values, commitments and standards, that together with the adoption of best practices as well as the use of the latest available technologies, seek to continuously improve the Company’s environmental management. It is the environmental department and each of its specialists that ensure these guidelines are met and are put in to practice in everyday company operations.
All of Arauco’s production units have certified environmental management systems, which reinforce the Company’s commitment to environmental performance and ensure the traceability of all raw materials used.
Arauco uses several supplies in its productive processes such as wood, chemical products, and water, etc., which in turn produce liquid and gas emissions. As a way to make the Company’s environmental management more efficient, significant progress has been made to reduce consumption and emissions.
Environmental investments have been made related to the control of atmospheric emissions, process improvements, water and waste management, as well as effluent treatment, in order to improve the environmental performance of all of Arauco’s business units.
Detail information of disbursements related to the environment
As of December 31, 2015 and 2014, Arauco has made and / or has committed the following disbursements by major environmental projects:
84
Table of Contents
CELULOSA ARAUCO Y CONSTITUCION S.A.
AND SUBSIDIARIES
Unaudited Consolidated Financial Statements
December 31, 2015
Amounts in thousands of U.S. dollars, except as indicated
| 12/31/2015 | Disbursements undertaken 2015 | Committed Disbursements |
||||||||||||||||||||
| State | Amount | Asset | Asset/expense | Amount | Estimated | |||||||||||||||||
| Company |
Name of project |
of project | ThU.S.$ | Expense | destination item |
ThU.S.$ | date | |||||||||||||||
| Arauco Do Brasil S.A. |
Environmental improvement studies | In process | 32 | Assets | Property, plant and equipment | 220 | 2016 | |||||||||||||||
| Arauco Do Brasil S.A. |
Environmental improvement studies | In process | 220 | Expense | Administration expenses | 699 | 2016 | |||||||||||||||
| Celulosa Arauco Y Constitucion S.A. |
Investment projects for the control and management of gas emissions from industrial process | In process | 2,720 | Assets | Property, plant and equipment | 0 | ||||||||||||||||
| Celulosa Arauco Y Constitucion S.A. |
Environmental improvement studies | In process | 2,688 | Assets | Property, plant and equipment | 1,057 | 2016 | |||||||||||||||
| Celulosa Arauco Y Constitucion S.A. |
Environmental improvement studies | Finished | 4,818 | Assets | Property, plant and equipment | 0 | ||||||||||||||||
| Celulosa Arauco Y Constitucion S.A. |
Investment projects for the control and management of hazardous liquids and water energy optimization of industrial plants | Finished | 244 | Assets | Property, plant and equipment | 0 | ||||||||||||||||
| Celulosa Arauco Y Constitucion S.A. |
Investment projects for the control and management of hazardous liquids and water energy optimization of industrial plants | In process | 6,668 | Assets | Property, plant and equipment | 113,321 | 2017 | |||||||||||||||
| Celulosa Arauco Y Constitucion S.A. |
Environmental improvement studies | Finished | 27,868 | Expense | Operating cost | 0 | ||||||||||||||||
| Celulosa Arauco Y Constitucion S.A. |
Expansion of solid industrial waste dumpsite for management of these in the future | In process | 2,122 | Assets | Property, plant and equipment | 1,420 | 2016 | |||||||||||||||
| Arauco Argentina S.A |
Construction emisario | In process | 0 | Assets | Property, plant and equipment | 805 | 2016 | |||||||||||||||
| Arauco Argentina S.A |
Expansion of solid industrial waste dumpsite for management of these in the future | In process | 165 | Assets | Property, plant and equipment | 3,952 | 2016 | |||||||||||||||
| Arauco Argentina S.A |
Environmental improvement studies | Finished | 117 | Assets | Property, plant and equipment | 0 | ||||||||||||||||
| Arauco Argentina S.A |
Investment projects for the control and management of hazardous liquids and water energy optimization of industrial plants | In process | 38 | Assets | Property, plant and equipment | 6,268 | 2016 | |||||||||||||||
| Paneles Arauco S.A. |
Investment projects for the control and management of hazardous liquids and water energy optimization of industrial plants | In process | 1,627 | Expense | Operating cost | 109 | 2016 | |||||||||||||||
| Paneles Arauco S.A. |
Investment projects for the control and management of hazardous liquids and water energy optimization of industrial plants | In process | 555 | Assets | Property, plant and equipment | 366 | 2016 | |||||||||||||||
| Paneles Arauco S.A. |
Investment projects for the control and management of hazardous liquids and water energy optimization of industrial plants | Finished | 720 | Assets | Property, plant and equipment | 0 | ||||||||||||||||
| Paneles Arauco S.A. |
Expansion of solid industrial waste dumpsite for management of these in the future | In process | 355 | Expense | Administration expenses | 355 | 2016 | |||||||||||||||
| Forestal Arauco S.A. (Ex-Forestal Celco S.A.) |
Environmental improvement studies | In process | 613 | Expense | Administration expenses | 783 | 2016 | |||||||||||||||
| Forestal los Lagos S.A |
Environmental improvement studies | In process | 206 | Expense | Operating cost | 208 | 2016 | |||||||||||||||
|
|
|
|
|
|||||||||||||||||||
| TOTAL | 51,776 | 129,563 | ||||||||||||||||||||
|
|
|
|
|
|||||||||||||||||||
85
Table of Contents
CELULOSA ARAUCO Y CONSTITUCION S.A.
AND SUBSIDIARIES
Unaudited Consolidated Financial Statements
December 31, 2015
Amounts in thousands of U.S. dollars, except as indicated
| 12-31-2014 | Disbursements undertaken 2014 | Committed Disbursements |
||||||||||||||||||
| State | Amount | State | Amount | |||||||||||||||||
| Company |
Name of project |
of project | Company | Name of project | of project | Company | Name of project | |||||||||||||
| Arauco Do Brasil S.A. |
Environmental improvement studies | In process | 1,967 | Assets | Property, plant and equipment |
3,805 | 2015 | |||||||||||||
| Arauco Do Brasil S.A. |
Environmental improvement studies | In process | 1,507 | Expense | Administration expenses |
5,639 | 2015 | |||||||||||||
| Celulosa Arauco y Constitucion S.A. |
Investment projects for the control and management of gas emissions from industrial process | In process | 5,548 | Assets | Property, plant and equipment |
233 | 2015 | |||||||||||||
| Celulosa Arauco y Constitucion S.A. |
Environmental improvement studies | In process | 10,520 | Assets | Property, plant and equipment |
11,805 | 2015 | |||||||||||||
| Celulosa Arauco y Constitucion S.A. |
Environmental improvement studies | Finished | 85 | Assets | Property, plant and equipment |
0 | — | |||||||||||||
| Celulosa Arauco y Constitucion S.A. |
Investment projects for the control and management of hazardous liquids and water energy optimization of industrial plants | In process | 6,474 | Assets | Property, plant and equipment |
3,412 | 2015 | |||||||||||||
| Celulosa Arauco y Constitucion S.A. |
Investment projects for the control and management of hazardous liquids and water energy optimization of industrial plants | Finished | 266 | Assets | Property, plant and equipment |
0 | — | |||||||||||||
| Celulosa Arauco y Constitucion S.A. |
Environmental improvement studies | In process | 37,540 | Expense | Operating cost | 0 | — | |||||||||||||
| Celulosa Arauco y Constitucion S.A. |
Expansion of solid industrial waste dumpsite for management of these in the future | In process | 2,551 | Assets | Property, plant and equipment |
11,712 | 2015 | |||||||||||||
| Alto Paraná S.A. |
Construction emisario | In process | 13 | Assets | Property, plant and equipment |
705 | 2015 | |||||||||||||
| Alto Paraná S.A. |
Expansion of solid industrial waste dumpsite for management of these in the future | In process | 776 | Assets | Property, plant and equipment |
4,148 | 2015 | |||||||||||||
| Alto Paraná S.A. |
Investment projects for the control and management of hazardous liquids and water energy optimization of industrial plants | In process | 3,282 | Assets | Property, plant and equipment |
6,452 | 2015 | |||||||||||||
| Paneles Arauco S.A. |
Environmental improvement studies | In process | 624 | Assets | Property, plant and equipment |
1,882 | 2015 | |||||||||||||
| Paneles Arauco S.A. |
Investment projects for the control and management of hazardous liquids and water energy optimization of industrial plants | In process | 1,471 | Expense | Operating cost | 0 | — | |||||||||||||
| Paneles Arauco S.A. |
Expansion of solid industrial waste dumpsite for management of these in the future | In process | 404 | Expense | Administration expenses |
0 | — | |||||||||||||
| Paneles Arauco S.A. |
Environmental improvement studies | In process | 5,751 | Expense | Administration expenses |
264 | 2015 | |||||||||||||
| Forestal Arauco S.A. |
Environmental improvement studies | In process | 817 | Expense | Administration expenses |
732 | 2015 | |||||||||||||
| Aserraderos Arauco S.A |
Environmental improvement studies | In process | 1,416 | Assets | Property, plant and equipment |
543 | 2015 | |||||||||||||
| Aserraderos Arauco S.A |
Environmental improvement studies | Finished | 84 | Assets | Property, plant and equipment |
0 | — | |||||||||||||
| Celulosa y Energía Punta Pereira S.A. |
Investment projects for the control and management of hazardous liquids and water energy optimization of industrial plants | In process | 463 | Assets | Property, plant and equipment |
600 | 2015 | |||||||||||||
| Forestal los Lagos S.A |
Environmental improvement studies | In process | 208 | Expense | Operating cost | 240 | 2015 | |||||||||||||
|
|
|
|
|
|||||||||||||||||
| TOTAL | 81,767 | 52,172 | ||||||||||||||||||
|
|
|
|
|
|||||||||||||||||
86
Table of Contents
CELULOSA ARAUCO Y CONSTITUCION S.A.
AND SUBSIDIARIES
Unaudited Consolidated Financial Statements
December 31, 2015
Amounts in thousands of U.S. dollars, except as indicated
NOTE 22. NON-CURRENT ASSETS HELD FOR SALE
Arauco decided to sell assets in previous years corresponding mainly to sawmills in Chile and remains committed to its sales plan.
By the end of fiscal year 2015, Paneles Arauco S.A. decided to reclassify to Properties, plant and equipment an amount of ThU.S.$5,429, since the Escuadron, La Araucana and Remanufactura Lomas Coloradas plants were used as warehouses for finished products. These assets consisted of buildings and saw mill equipment, which were shut down in preceding years.
The following table sets forth information on the main types of non-current assets held for sale:
| 12-31-2015 | 12-31-2014 | |||||||
| ThU.S.$ | ThU.S.$ | |||||||
| Land |
217 | 2,976 | ||||||
| Buildings |
1,122 | 3,798 | ||||||
| Property, plant and equipment |
1,855 | 1,214 | ||||||
| Total |
3,194 | 7,988 | ||||||
|
|
|
|
|
|||||
As of December 31, 2015 there was no effect on related to the sale of held assets for sale results. (net loss of ThU.S.$486 at December 31, 2014).
87
Table of Contents
CELULOSA ARAUCO Y CONSTITUCION S.A.
AND SUBSIDIARIES
Unaudited Consolidated Financial Statements
December 31, 2015
Amounts in thousands of U.S. dollars, except as indicated
NOTE 23. FINANCIAL INSTRUMENTS
23.1 Classification
Arauco’s financial instruments as of December 31, 2015 and 2014, are displayed in the table below. Regarding those instruments valued at an amortized cost, as estimation of their reasonable value is displayed for informational purposes.
| December 2015 | December 2014 | |||||||||||||||
| Financial Instruments Thousands of dollars |
Carrying amount |
Fair Value | Carrying amount |
Fair Value | ||||||||||||
| Fair value through profit or loss (held for trading) (1) |
200,034 | 200,034 | 130,500 | 130,500 | ||||||||||||
| Forward |
3,245 | 3,245 | 1,515 | 1,515 | ||||||||||||
| Mutual funds (2) |
196,789 | 196,789 | 128,985 | 128,985 | ||||||||||||
| Loans and Accounts Receivables |
1,054,952 | 1,054,952 | 1,761,300 | 1,761,300 | ||||||||||||
| Cash and cash equivalents |
303,236 | 303,236 | 842,167 | 842,167 | ||||||||||||
| Cash |
143,324 | 143,324 | 158,002 | 158,002 | ||||||||||||
| Time deposits |
159,912 | 159,912 | 669,545 | 669,545 | ||||||||||||
| Agreements |
— | — | 14,620 | 14,620 | ||||||||||||
| Accounts Receivables (net) |
748,592 | 748,592 | 762,909 | 762,909 | ||||||||||||
| Trades and other receivables |
614,655 | 614,655 | 649,924 | 649,924 | ||||||||||||
| Lease receivable |
15 | 15 | 153 | 153 | ||||||||||||
| Other receivables |
133,922 | 133,922 | 112,832 | 112,832 | ||||||||||||
| Accounts receivable from related parties |
3,124 | 3,124 | 156,224 | 156,224 | ||||||||||||
| Other Financial Assets (5) |
29,545 | 29,545 | 11,141 | 11,141 | ||||||||||||
|
|
|
|
|
|
|
|
|
|||||||||
| Financial Liabilities at amortized cost (3) |
4,895,594 | 5,099,467 | 5,714,872 | 6,088,948 | ||||||||||||
| Bonds issued denominated in U.S. dollars |
2,317,216 | 2,409,538 | 2,686,994 | 2,834,364 | ||||||||||||
| Bonds issued denominated in U.F. (4) |
863,118 | 923,775 | 971,333 | 1,038,908 | ||||||||||||
| Bank Loans in Dollars |
953,898 | 1,004,792 | 1,220,359 | 1,373,857 | ||||||||||||
| Bank borrowing denominated in U.S. dollars |
43,644 | 43,644 | 98,856 | 104,489 | ||||||||||||
| Financial Leasing |
127,559 | 127,559 | 96,995 | 96,995 | ||||||||||||
| Government Loans |
0 | 0 | 3,893 | 3,893 | ||||||||||||
| Trades and other Payables |
583,018 | 583,018 | 630,406 | 630,406 | ||||||||||||
| Accounts payable to related parties |
7,141 | 7,141 | 6,036 | 6,036 | ||||||||||||
| Financial liabilities at fair value through profit or loss |
1,429 | 1,429 | 2,677 | 2,677 | ||||||||||||
| Forward |
1,429 | 1,429 | 2,677 | 2,677 | ||||||||||||
| Hedging Liabilities |
226,139 | 226,139 | 115,055 | 115,055 | ||||||||||||
|
|
|
|
|
|
|
|
|
|||||||||
| (1) | Assets measured at fair value through profit or loss other than mutual funds classified as cash equivalents, are presented in the line item “other financial assets” in the consolidated statement of financial position. |
| (2) | Although mutual funds are measured at fair value through profit or loss for purposes of the consolidated statement of financial position mutual funds are classified as “Cash and cash equivalents” due to the are highly liquid short term investment. |
| (3) | Financial liabilities measured at amortized cost, other than “Trade and other payables” and derivatives are presented in the consolidated statement of financial position in the line item “Other financial liabilities” as current and non-current based on their maturity. |
| (4) | The Unidad de Fomento (“UF”) is a unit of account that is linked to, and is adjusted daily to reflect changes in the Chilean consumer price index. |
| (5) | Includes guarantee fund for derivatives which correspond to the collateral under swap agreements. |
88
Table of Contents
CELULOSA ARAUCO Y CONSTITUCION S.A.
AND SUBSIDIARIES
Unaudited Consolidated Financial Statements
December 31, 2015
Amounts in thousands of U.S. dollars, except as indicated
23.2 Fair Value Hierarchy of Financial Assets and Liabilities
The assets and liabilities measured at fair value in the consolidated statements of financial position as of December 31, 2015, have been measured based on the valuation methodologies provided in IAS 39. The methodologies applied for each financial instrument are classified according to their hierarchy as follows:
| - | Level 1: Securities or quoted prices in active markets for identical assets and liabilities |
| - | Level 2: Inputs other than quoted prices included within Level 1 that are observable for the assets or liabilities, either directly (i.e. as prices) or indirectly (i.e. derived from prices); and |
| - | Level 3: Inputs for the assets or liabilities that are not based on observable market data (unobservable inputs). |
| Financial Instruments | Fair Value | |||||||||
| Thousands of dollars |
Level 1 | Level 2 | Level 3 | |||||||
| Fair value through profit or loss (held for trading) |
||||||||||
| Forward |
3,245 | |||||||||
| Mutual funds (2) |
196,789 | |||||||||
| Other Financial Assets |
29,545 | |||||||||
| Financial Liabilities at amortized cost |
||||||||||
| Bonds issued denominated in U.S. dollars |
2,409,538 | |||||||||
| Bonds issued denominated in U.F. (4) |
923,775 | |||||||||
| Bank Loans in Dollars |
1,004,792 | |||||||||
| Bank borrowing denominated in U.S. dollars |
43,644 | |||||||||
| Financial Leasing |
127,559 | |||||||||
| Financial liabilities at fair value through profit or loss |
||||||||||
| Forward |
1,429 | |||||||||
| Hedging Liabilities |
226,139 | |||||||||
89
Table of Contents
CELULOSA ARAUCO Y CONSTITUCION S.A.
AND SUBSIDIARIES
Unaudited Consolidated Financial Statements
December 31, 2015
Amounts in thousands of U.S. dollars, except as indicated
23.3 Explanation of the valuation of Financial Instruments.
Cash and cash equivalent and accounts receivable
The carrying amount of trade and other receivables, trade and others payables, accounts payables related parties, cash and cash equivalents (including mutual funds), and other financial assets and liabilities approximate their fair value due to the short-term nature of such instruments, and, in the case of trade and other receivables, due to the fact that any loss resulting from its recoverability is already reflected in the provision for doubtful accounts.
Derivative financial instruments
Interest rate and currency swaps are valued under the cash flow discount method at the rate applicable according to the transaction’s risk, using an internal methodology based on the information obtained from Bloomberg. In this particular case, given that cross currency swaps correspond to future flows in UF and future flows in Dollars, Arauco calculates the current value of such flows by using 2 discount curves: the UF zero coupon curve and the Dollar zero coupon.
The fair value of the interest rate swap contracts is calculated by reference to the rate differential between the agreed upon rate and the market rate as of the end date of these financial statements.
The fair value of the currency forward contracts is calculated by reference to the current forward exchange rates of contracts with similar maturity profiles.
For the case of zero cost collar, the Bloomberg terminal is used to value Fuel Oil No. 6 and Diesel options.
Financial Liabilities
The fair value of bonds issued was determined with reference to quoted market prices as they have standard terms and conditions.
The fair value of bank borrowings were determined based on discounted cash flow analysis, applying the corresponding discount yield curves to the remaining term to maturity.
Disclosures of the fair value of financial liabilities at amortized cost are determined via the use of discounted cash flows, calculated over variables of the observable markets as of the date of informing the consolidated financial statements, and correspond to Level 2 of the fair value hierarchy.
The following table shows compliance with financial covenants (level of indebtedness, exposed on point 23.11.3) required by domestic bond indentures:
90
Table of Contents
CELULOSA ARAUCO Y CONSTITUCION S.A.
AND SUBSIDIARIES
Unaudited Consolidated Financial Statements
December 31, 2015
Amounts in thousands of U.S. dollars, except as indicated
| December 2015 ThU.S.$ |
December 2014 ThU.S.$ |
|||||||
| Financial debt, current |
291,798 | 739,515 | ||||||
| Financial debt, non-current |
4,013,637 | 4,338,915 | ||||||
| Total financial debt |
4,305,435 | 5,078,430 | ||||||
| Cash and cash equivalent |
(500,025 | ) | (971,152 | ) | ||||
| Net financial debt |
3,805,410 | 4,107,278 | ||||||
| Non-controlling interests |
37,735 | 47,606 | ||||||
| Equity attributable to owners of parent |
6,608,710 | 6,767,130 | ||||||
| Total equity |
6,646,445 | 6,814,736 | ||||||
| Debt to equity ratio |
0.57 | 0.60 | ||||||
|
|
|
|
|
|||||
The following table sets forth a econciliation between the financial liabilities and the statement of financial position as of December 31 2015 and 2014:
| Thousands of dollars |
December 2015 | |||||||||||||||||||||||||||
| Up to 90 days |
From 91 days to 1 year |
Other current financial liabilities, Total |
From 13 months to 5 years |
More than 5 years |
Other non- current financial liabilities, Total |
Total | ||||||||||||||||||||||
| Bonds obligations |
49,357 | 5,836 | 55,193 | 1,179,558 | 1,945,583 | 3,125,141 | 3,180,334 | |||||||||||||||||||||
| Bank borrowing |
126,795 | 72,948 | 199,743 | 648,017 | 149,782 | 797,799 | 997,542 | |||||||||||||||||||||
| Financial Leasing |
9,301 | 27,561 | 36,862 | 90,697 | — | 90,697 | 127,559 | |||||||||||||||||||||
| Government loans |
— | — | — | — | — | — | — | |||||||||||||||||||||
| Swap and Forward |
4,240 | — | 4,240 | 223,328 | — | 223,328 | 227,568 | |||||||||||||||||||||
|
|
|
|
|
|
|
|
|
|
|
|
|
|
|
|||||||||||||||
| Other Financial Liabilities, Total (a) |
189,693 | 106,345 | 296,038 | 2,141,600 | 2,095,365 | 4,236,965 | 4,533,003 | |||||||||||||||||||||
|
|
|
|
|
|
|
|
|
|
|
|
|
|
|
|||||||||||||||
| Thousands of dollars |
December 2015 | |||||||||||||||||||||||||||
| Up to 90 days |
From 91 days to 1 year |
Total Current |
From 13 months to 5 years |
More than 5 years |
Total non- current |
Total | ||||||||||||||||||||||
| Trades and other payables |
583,018 | — | 583,018 | — | — | — | 583,018 | |||||||||||||||||||||
| Related party payables |
7,141 | — | 7,141 | — | — | — | 7,141 | |||||||||||||||||||||
|
|
|
|
|
|
|
|
|
|
|
|
|
|
|
|||||||||||||||
| Accounts Payable, Total (b) |
590,159 | — | 590,159 | — | — | — | 590,159 | |||||||||||||||||||||
|
|
|
|
|
|
|
|
|
|
|
|
|
|
|
|||||||||||||||
| Financial Liabilities, Total (a) + (b) |
779,852 | 106,345 | 886,197 | 2,141,600 | 2,095,365 | 4,236,965 | 5,123,162 | |||||||||||||||||||||
|
|
|
|
|
|
|
|
|
|
|
|
|
|
|
|||||||||||||||
| Thousands of dollars |
December 2014 | |||||||||||||||||||||||||||
| Up to 90 days |
From 91 days to 1 year |
Other current financial liabilities, Total |
From 13 months to 5 years |
More than 5 years |
Other non- current financial liabilities, Total |
Total | ||||||||||||||||||||||
| Bonds obligations |
52,575 | 377,871 | 430,446 | 966,131 | 2,261,750 | 3,227,881 | 3,658,327 | |||||||||||||||||||||
| Bank borrowings |
139,916 | 133,554 | 273,470 | 797,628 | 248,117 | 1,045,745 | 1,319,215 | |||||||||||||||||||||
| Financial leasing |
7,851 | 23,855 | 31,706 | 65,289 | — | 65,289 | 96,995 | |||||||||||||||||||||
| Government loans |
— | 3,893 | 3,893 | — | — | — | 3,893 | |||||||||||||||||||||
| Swap and Forward |
2,828 | — | 2,828 | 114,904 | — | 114,904 | 117,732 | |||||||||||||||||||||
|
|
|
|
|
|
|
|
|
|
|
|
|
|
|
|||||||||||||||
| Other Financial Liabilities, Total (a) |
203,170 | 539,173 | 742,343 | 1,943,952 | 2,509,867 | 4,453,819 | 5,196,162 | |||||||||||||||||||||
|
|
|
|
|
|
|
|
|
|
|
|
|
|
|
|||||||||||||||
| Thousands of dollars |
December 2014 | |||||||||||||||||||||||||||
| Up to 90 days |
From 91 days to 1 year |
Total Current |
From 13 months to 5 years |
More than 5 years |
Total non- current |
Total | ||||||||||||||||||||||
| Trades and other payables |
627,972 | 2,434 | 630,406 | — | — | — | 630,406 | |||||||||||||||||||||
| Related party payables |
6,036 | — | 6,036 | — | — | — | 6,036 | |||||||||||||||||||||
|
|
|
|
|
|
|
|
|
|
|
|
|
|
|
|||||||||||||||
| Accounts Payable, Total (b) |
634,008 | 2,434 | 636,442 | — | — | — | 636,442 | |||||||||||||||||||||
|
|
|
|
|
|
|
|
|
|
|
|
|
|
|
|||||||||||||||
| Financial Liabilities, Total (a) + (b) |
837,178 | 541,607 | 1,378,785 | 1,943,952 | 2,509,867 | 4,453,819 | 5,832,604 | |||||||||||||||||||||
|
|
|
|
|
|
|
|
|
|
|
|
|
|
|
|||||||||||||||
91
Table of Contents
CELULOSA ARAUCO Y CONSTITUCION S.A.
AND SUBSIDIARIES
Unaudited Consolidated Financial Statements
December 31, 2015
Amounts in thousands of U.S. dollars, except as indicated
23.4 Hedging Instruments
Hedging instruments recorded as of December 31, 2015 are cash flow hedges. Arauco uses derivatives for hedging purposes, such as cross currency swaps, currency forwards, interest rate swaps, and options. Depending on the fair value of each instrument, the position could be either an asset or a liability, and they are listed in the Statement of Financial Position under Other Non-current Financial Assets or Other Non-current Financial Liabilities, respectively. The effects for the period are presented under Equity as Other Comprehensive Income, net of differences in exchange rate of the hedged items and the deferred tax.
A summary of the hedging instruments included in the Financial Position Statement as of the end of this fiscal year, is presented below:
| Financial Instruments |
Fair Value ThU.S.$ |
|||
| Assets at fair value through profit or loss (held for trading) |
3,245 | |||
| Forward-Colombia |
238 | |||
| Forward-Argentina |
2,828 | |||
| Forward-Uruguay (1) |
179 | |||
| Financial liabilities at fair value through profit or loss |
(1,429 | ) | ||
| Forward-Colombia |
(21 | ) | ||
| Forward-Uruguay (1) |
(1,408 | ) | ||
| Hedging Liabilities |
(226,139 | ) | ||
| Cross Currency Swaps |
(205,618 | ) | ||
| Forward-Uruguay (1) |
(3,677 | ) | ||
| Zero Cost Collar |
(16,844 | ) | ||
| (1) | Include Swap and Forward from Uruguay tables. |
| (2) | Interest Rate Swap from Uruguay by ThU.S.$211 are in “Other Financial Assets”. |
23.4.1 Chile
23.4.1.1 Cross currency swaps
Arauco is exposed to the risk of variability in cash flows from changes in foreign exchange rates and inflation, mainly due to balances of assets denominated in U.S. Dollars and other currencies differente from the functional currency, which causes mismatches that could affect operating results.
Below are the cross currency swaps that Arauco has as of December 31, 2015 to cover the exposure to the exchange rate risk generated from bonds denominated in UF:
92
Table of Contents
CELULOSA ARAUCO Y CONSTITUCION S.A.
AND SUBSIDIARIES
Unaudited Consolidated Financial Statements
December 31, 2015
Amounts in thousands of U.S. dollars, except as indicated
| Bond |
Institution | Amount U.S.$ | Amount UF | Starting date | Ending date | Market Value U.S.$ | ||||||||||||||||
| F |
Deutsche - England | 43,618,307 | 1,000,000 | 10/30/2011 | 10/30/2021 | (10,314,867.97 | ) | |||||||||||||||
| F |
JP Morgan - N.A. | 43,618,307 | 1,000,000 | 10/30/2011 | 10/30/2021 | (10,171,083.83 | ) | |||||||||||||||
| F |
Deutsche - England | 37,977,065 | 1,000,000 | 04/30/2014 | 04/30/2019 | (2,770,354.44 | ) | |||||||||||||||
| F |
BBVA - Chile | 38,426,435 | 1,000,000 | 10/30/2014 | 04/30/2023 | (5,059,570.76 | ) | |||||||||||||||
| F |
BBVA - Chile | 38,378,440 | 1,000,000 | 10/30/2014 | 04/30/2023 | (4,658,334.28 | ) | |||||||||||||||
| F |
Santander - Chile | 37,977,065 | 1,000,000 | 10/30/2014 | 04/30/2023 | (4,121,806.04 | ) | |||||||||||||||
| F |
BCI - Chile | 37,621,562 | 1,000,000 | 10/30/2014 | 04/30/2023 | (3,570,036.54 | ) | |||||||||||||||
| J |
Corpbanca - Chile | 42,864,859 | 1,000,000 | 09/01/2010 | 09/01/2020 | (11,092,987.02 | ) | |||||||||||||||
| J |
BBVA - Chile | 42,864,859 | 1,000,000 | 09/01/2010 | 09/01/2020 | (11,092,987.02 | ) | |||||||||||||||
| J |
Deutsche - England | 42,864,859 | 1,000,000 | 09/01/2010 | 09/01/2020 | (11,198,926.21 | ) | |||||||||||||||
| J |
Santander - Spain | 42,873,112 | 1,000,000 | 09/01/2010 | 09/01/2020 | (11,039,392.92 | ) | |||||||||||||||
| J |
BBVA - Chile | 42,864,257 | 1,000,000 | 09/01/2010 | 09/01/2020 | (10,860,254.42 | ) | |||||||||||||||
| P |
Corpbanca - Chile | 46,474,122 | 1,000,000 | 05/15/2012 | 11/15/2021 | (11,784,676.29 | ) | |||||||||||||||
| P |
JP Morgan - N.A. | 47,163,640 | 1,000,000 | 11/15/2012 | 11/15/2021 | (11,412,576.23 | ) | |||||||||||||||
| P |
BBVA - Chile | 42,412,852 | 1,000,000 | 11/15/2013 | 11/15/2023 | (7,916,506.13 | ) | |||||||||||||||
| P |
Santander - Chile | 41,752,718 | 1,000,000 | 11/15/2013 | 11/15/2023 | (6,924,675.42 | ) | |||||||||||||||
| P |
Deutsche - England | 41,752,718 | 1,000,000 | 11/15/2013 | 11/15/2023 | (6,894,263.33 | ) | |||||||||||||||
| R |
Santander - Chile | 128,611,183 | 3,000,000 | 10/01/2014 | 04/01/2024 | (29,995,353.91 | ) | |||||||||||||||
| R |
JP Morgan - England | 43,185,224 | 1,000,000 | 10/01/2014 | 04/01/2024 | (9,319,642.37 | ) | |||||||||||||||
| R |
Corpbanca - Chile | 43,277,070 | 1,000,000 | 10/01/2014 | 04/01/2024 | (9,292,352.02 | ) | |||||||||||||||
| Q |
BCI - Chile | 43,185,224 | 1,000,000 | 10/01/2014 | 04/01/2021 | (8,120,853.85 | ) | |||||||||||||||
| Q |
BCI - Chile | 43,196,695 | 1,000,000 | 10/01/2014 | 04/01/2021 | (8,006,612.79 | ) | |||||||||||||||
|
|
|
|||||||||||||||||||||
| (205,618,113.77 | ) | |||||||||||||||||||||
|
|
|
|||||||||||||||||||||
Because Arauco has a high percentage of its assets in U.S. dollars, it needs to minimize the risk of the exchange rate, as it holds debt in pesos, adjustable to reflect inflation. The objective of this position in the swap is to eliminate the uncertainty of the exchange rate, exchanging the flows derived from obligations expressed in adjustable pesos of the bonds described above, with flows in U.S. dollars (Arauco’s functional currency), at a fixed and determined exchange rate as of the agreement’s execution date.
Through an effectiveness test, and pursuant to IFRS 39, we were able to validate that the aforementioned hedging instruments are highly effective within an acceptable range for Arauco, for the purposes of eliminating the uncertainty of the exchange rate in the commitments derived from the hedged object.
93
Table of Contents
CELULOSA ARAUCO Y CONSTITUCION S.A.
AND SUBSIDIARIES
Unaudited Consolidated Financial Statements
December 31, 2015
Amounts in thousands of U.S. dollars, except as indicated
23.5.1.2 Zero Cost Collars
Moreover, our results are exposed to changes the price of certain fuels. To minimize the risk we limited the volatility of future cash flows associated with the purchase of Fuel Oil No. 6 for year 2015 through zero cost collar contracts of this commodity. The Fuel Oil No. 6 is consumed in the process of pulp production.
Furthermore, we have indirect exposure to the price of Diesel due to contracts with forestry industry contractors, whose rates vary according to the price of this commodity, as well as other variables. To minimize this risk, we use financial instruments to cover the risk associated with the volatility of the cost of forestry contractor rates, from June 2015 until May 2016.
Contracts held by Arauco as of December 31, 2015 are presented in the following table:
| Commodity |
Institution | Amount U.S.$ | Unit | Hedge starting date |
Ending date | Market Value U.S.$ | ||||||||||||||||||
| Fuel Oil N°6 |
JP Morgan - U.K. | 674 | Thousands Bbl. | 01/01/2015 | 12/31/2015 | (1,017,120.04 | ) | |||||||||||||||||
| Diesel |
JP Morgan - U.K. | 29,465 | Thousands Gall. | 06/01/2015 | 05/31/2016 | (9,236,461.58 | ) | |||||||||||||||||
| Fuel Oil N°6 |
JP Morgan - U.K. | 337 | Thousands Bbl. | 01/01/2016 | 06/30/2016 | (6,590,670.24 | ) | |||||||||||||||||
|
|
|
|||||||||||||||||||||||
| (16,844,251.86 | ) | |||||||||||||||||||||||
|
|
|
|||||||||||||||||||||||
23.5.2 Colombia
Forward contracts that are in force and effect, executed by Arauco Colombia as of December 31, 2015, are detailed in the following table:
| Exchange rate |
Institution | Amount U.S.$ | Hedge Starting date |
Ending date | Market Value U.S.$ | |||||||||||||||
| USDCOP |
Corpbanca Colombia | 4,000,000 | 11/11/2015 | 02/01/2016 | 237,637.31 | |||||||||||||||
| USDCOP |
BBVA Colombia | 9,000,000 | 12/03/2015 | 03/01/2016 | (20,544.32 | ) | ||||||||||||||
|
|
|
|||||||||||||||||||
| 217,092.99 | ||||||||||||||||||||
|
|
|
|||||||||||||||||||
23.5.3. Argentina
Below, you will find the valuation of the forward contract in force and effect, as of December 31, 2015:
| Exchange rate |
Institution | Amount U.S.$ | Hedge Starting date |
Ending date | Market Value U.S.$ | |||||||||||||||
| USDARG |
BBVA Banco Frances | 8,606,250 | 09/08/2015 | 05/31/2016 | 2,828,315 | |||||||||||||||
|
|
|
|||||||||||||||||||
| 2,828,315 | ||||||||||||||||||||
|
|
|
|||||||||||||||||||
94
Table of Contents
CELULOSA ARAUCO Y CONSTITUCION S.A.
AND SUBSIDIARIES
Unaudited Consolidated Financial Statements
December 31, 2015
Amounts in thousands of U.S. dollars, except as indicated
23.5.4. Uruguay
As of December 31, 2015, Arauco Uruguay maintains the following forward contracts in force and effect, for the purposes of ensuring an exchange rate for the sale of dollars:
| 50% | ||||||||||||
| Entity |
Exchange rate | Institution |
Notional | Market Value U.S.$ | ||||||||
| CEPP |
UYUUSD | Citibank Uruguay | 4,500,000 | (148,407.89 | ) | |||||||
| CEPP |
UYUUSD | Banco Santander Uy | 33,000,000 | (579,064.81 | ) | |||||||
| CEPP |
UYUUSD | JP Morgan Chase Bank, N.A. | 2,000,000 | 3,941.83 | ||||||||
| EUFORES |
UYUUSD | Citibank U.K | 4,410,000 | (43,501.67 | ) | |||||||
| EUFORES |
UYUUSD | HSBC Uruguay | 14,350,000 | (44,824.67 | ) | |||||||
|
|
|
|||||||||||
| (811,857.20 | ) | |||||||||||
|
|
|
|||||||||||
In addition, Arauco Uruguay maintains an Interest Rate Swap in force and effect, a derivative instrument which purpose is to set the interest rate of a variable rate debt in the same currency (USD). The valuation off this instrument as of December 31, 2015, is shown below:
| 50% | ||||||||||||||||
| Entity |
Exchange rate | Institution | Notional | Market Value U.S.$ | ||||||||||||
| CEPP |
USD | DNB Bank ASA | 135,033,619 | 211,320.09 | ||||||||||||
|
|
|
|
|
|||||||||||||
Arauco Uruguay’s profits and losses also face exposure to the price variation of certain fuels, as occurs with Fuel Oil N°6, which is used during the cellulose manufacturing process. In order to minimize this risk, the volatility of future flows associated to the purchase of Fuel Oil No. 6 for years 2015, 2016 and 2017 has been limited, through forwards of this commodity. The agreements that are in force and effect as of December 31, 2015, are detailed below:
| 50% | ||||||||||||||
| Entity |
Exchange rate | Institution |
Notional | Market Value U.S.$ | ||||||||||
| CEPP |
Fuel Oil N | °6 | JPMorgan Chase Bank, N.A. | 13,374,141 | (3,056,747.52 | ) | ||||||||
| CEPP |
Fuel Oil N | °6 | DNB Bank ASA | 5,770,950 | (1,038,320.63 | ) | ||||||||
|
|
|
|||||||||||||
| (4,095,068.15 | ) | |||||||||||||
|
|
|
|||||||||||||
95
Table of Contents
CELULOSA ARAUCO Y CONSTITUCION S.A.
AND SUBSIDIARIES
Unaudited Consolidated Financial Statements
December 31, 2015
Amounts in thousands of U.S. dollars, except as indicated
23.6 Loans and Receivables
Loans and receivables are non-derivative financial assets with fixed or determinable payments that are not quoted in an active market. In the consolidated statements of financial position they are included in line items “Cash and cash equivalents” (certain components of cash and cash equivalents), “Trade and Other Current/Non-Current Receivables” and “Accounts receivable from related parties”.
Loans and receivables are measured at amortized cost using the effective interest method and are tested for impairment. Financial assets that are classified as loans and receivables are: cash and cash-equivalents, time deposits, repurchase agreements, trade and other current/non-current receivables, and account receivables from related parties.
| December 2015 ThU.S.$ |
December 2014 ThU.S.$ |
|||||||
| Loans and Accounts Receivables |
1,054,952 | 1,761,300 | ||||||
| Cash and cash equivalents |
303,236 | 842,167 | ||||||
| Cash |
143,324 | 158,002 | ||||||
| Time Deposits |
159,912 | 669,545 | ||||||
| Agreements |
0 | 14,620 | ||||||
| Trade and other receivables (net) |
751,716 | 919,133 | ||||||
| Trades and Other receivables |
614,670 | 650,077 | ||||||
| Other receivables |
133,922 | 112,832 | ||||||
| Accounts receivable from related parties |
3,124 | 156,224 | ||||||
23.6.1 Cash and Cash Equivalents
Includes cash on hand, bank checking accounts balances and time deposits and other short term highly liquid investments with an original maturity of three months or less. They are short-term, highly liquid investments that are readily convertible to known amounts of cash, and which are subject to an insignificant risk of changes in value.
The composition of cash and cash equivalents (including the balance of mutual funds displayed in this note as valuation, instruments at fair value with profit or loss) at December 31, 2015 and 2014, classified by origin coins is as follow:
| 12-31-2015 | 12-31-2014 | |||||||
| ThU.S.$ | ThU.S.$ | |||||||
| Cash and Cash Equivalents |
500,025 | 971,152 | ||||||
| US Dollar |
388,818 | 877,418 | ||||||
| Euro |
2,501 | 8,114 | ||||||
| Other currencies |
65,228 | 62,381 | ||||||
| Chilean pesos |
43,478 | 23,239 | ||||||
23.6.2 Time Deposits and Repurchase Agreements: The investment objective of time deposits and repurchase agreements is to maximize in the short-term the amounts of cash surpluses. These instruments are authorized by Arauco’s Investment Policy, which allows investing in fixed income securities. These instruments have a maturity of less than three months from the date of acquisition.
96
Table of Contents
CELULOSA ARAUCO Y CONSTITUCION S.A.
AND SUBSIDIARIES
Unaudited Consolidated Financial Statements
December 31, 2015
Amounts in thousands of U.S. dollars, except as indicated
23.6.3 Trades and Other Receivables: These represent enforceable rights for Arauco resulting from the normal course of the business.
23.6.4 Other Receivables: These correspond to receivables from sales, services or loans that are not considered within the normal course of the business.
The provision for doubtful accounts is presented as a deduction of trade and other receivables. The provision for doubtful accounts is established based on an analysis of the age of the portfolio and considering the insurance coverage on accounts receivable. Other conditions are assessed for example when there is objective evidence that Arauco will not receive payments under the original sale terms and when the customer is a party to a bankruptcy court agreement or cessation of payments, and is written-off when Arauco has exhausted all levels of recovery of the receivable in a reasonable time.
23.6.5 Accounts receivable from related parties: Represent enforceable rights for Arauco resulting from the normal course of business, calling normal to the line of business, activity or purpose of explotation and financing, and which Arauco owns a non-controlling ownership of the counterparty.
The following table sets forth trade and other current/non-current receivables classified by currencies as of December 31, 2015 and 2014:
| 12-31-2015 | 12-31-2014 | |||||||
| ThU.S.$ | ThU.S.$ | |||||||
| Trades and other current receivables |
733,322 | 731,908 | ||||||
| US Dollar |
507,032 | 464,219 | ||||||
| Euros |
27,595 | 72,353 | ||||||
| Other currencies |
75,082 | 98,130 | ||||||
| Chilean pesos |
123,056 | 96,241 | ||||||
| U.F. |
557 | 965 | ||||||
| Accounts receivable from related parties, current |
3,124 | 4,705 | ||||||
| US Dollar |
21 | 0 | ||||||
| Other currencies |
995 | 1,998 | ||||||
| Chilean pesos |
2,108 | 2,707 | ||||||
| Trade and other non-current receivables |
15,270 | 31,001 | ||||||
| US Dollar |
9,976 | 26,773 | ||||||
| Chilean pesos |
3,145 | 3,591 | ||||||
| U.F. |
1,420 | 637 | ||||||
| Accounts receivable from related parties, non current |
0 | 151,519 | ||||||
| Others Currencies |
0 | 151,519 | ||||||
97
Table of Contents
CELULOSA ARAUCO Y CONSTITUCION S.A.
AND SUBSIDIARIES
Unaudited Consolidated Financial Statements
December 31, 2015
Amounts in thousands of U.S. dollars, except as indicated
23.7 Total Financial Liabilities
Arauco’s financial liabilities to the date of these consolidated financial statements are as follows :
| Financial Liabilities |
December 2015 ThU.S.$ |
December 2014 ThU.S.$ |
||||||
| Total Financial Liabilities |
5,123,162 | 5,832,604 | ||||||
| Financial liabilities at fair value through profit or loss (held for trading) |
1,429 | 2,677 | ||||||
| Hedging Liabilities |
226,139 | 115,055 | ||||||
| Financial Liabilities Measured at Amortized Cost |
4,895,594 | 5,714,872 | ||||||
The following table sets forth the current portion of the non-current bank borrowings and debt issued as of December 31, 2015 and 2014.
| December 2015 ThU.S.$ |
December 2014 ThU.S.$ |
|||||||
| Bank borrowings - current portion |
85,885 | 53,284 | ||||||
| Bonds issued - current portion |
55,193 | 430,446 | ||||||
| Total |
141,078 | 483,730 | ||||||
|
|
|
|
|
|||||
23.8 Financial Liabilities Measured at Amortized Cost
Financial liabilities correspond to non-derivative financial instruments with contractual cash-flow payments that can be either fixed or variable.
Also, this category includes those non-derivative financial liabilities for services or goods delivered to Arauco at the end of each reporting period that have not yet been paid. These amounts are not insured and are generally paid within thirty days after being recognized.
As the end of each reporting period, Arauco includes in this category bank borrowings, bonds issued denominated in U.S. Dollars and in UF, trade and other payables.
98
Table of Contents
CELULOSA ARAUCO Y CONSTITUCION S.A.
AND SUBSIDIARIES
Unaudited Consolidated Financial Statements
December 31, 2015
Amounts in thousands of U.S. dollars, except as indicated
| 12/31/2015 | 12/31/2014 | 12/31/2015 | 12/31/2014 | |||||||||||||||
| Currency | Amortized Cost ThU.S.$ | Fair Value ThU.S.$ | ||||||||||||||||
| Total Financial Liabilities |
4,895,594 | 5,714,872 | 5,099,467 | 6,088,948 | ||||||||||||||
| Bonds Issued |
U.S. Dollar | 2,317,216 | 2,686,994 | 2,409,538 | 2,834,364 | |||||||||||||
| Bonds Issued |
U.F. | 863,118 | 971,333 | 923,775 | 1,038,908 | |||||||||||||
| Bank borrowings |
U.S. Dollar | 953,898 | 1,220,359 | 1,004,792 | 1,373,857 | |||||||||||||
| Bank borrowings |
Other currencies | 43,644 | 98,856 | 43,644 | 104,489 | |||||||||||||
| Government Loans |
U.S. Dollar | 0 | 3,893 | 0 | 3,893 | |||||||||||||
| Financial Leasing |
Other currencies | 113,580 | 93,540 | 113,580 | 93,540 | |||||||||||||
| Financial Leasing |
Chilean pesos | 13,979 | 3,449 | 13,979 | 3,449 | |||||||||||||
| Financial Leasing |
U.S. Dollar | 0 | 6 | 0 | 6 | |||||||||||||
| Trades and Other Payables |
U.S. Dollar | 174,469 | 180,164 | 174,469 | 180,164 | |||||||||||||
| Trades and Other Payables |
Euro | 8,808 | 44,887 | 8,808 | 44,887 | |||||||||||||
| Trades and Other Payables |
Other currencies | 70,303 | 62,162 | 70,303 | 62,162 | |||||||||||||
| Trades and Other Payables |
Chilean pesos | 324,361 | 340,858 | 324,361 | 340,858 | |||||||||||||
| Trades and Other Payables |
U.F. | 5,077 | 2,335 | 5,077 | 2,335 | |||||||||||||
| Related party payables |
U.S. Dollar | 962 | 1,612 | 962 | 1,612 | |||||||||||||
| Related party payables |
Chilean pesos | 6,179 | 4,424 | 6,179 | 4,424 | |||||||||||||
The financial liabilities at amortized cost presented in the consolidated statements of financial positions as of December 31, 2015 and 2014 are as follows:
| December 2015 | ||||||||||||
| Current ThU.S.$ |
Non Current ThU.S.$ |
Total | ||||||||||
| Other financial liabilities |
291,798 | 4,013,637 | 4,305,435 | |||||||||
| Trade and other payables |
583,018 | — | 583,018 | |||||||||
| Related Party Payables |
7,141 | — | 7,141 | |||||||||
| Total Financial Liabilities Measured at Amortized Cost |
881,957 | 4,013,637 | 4,895,594 | |||||||||
|
|
|
|
|
|
|
|||||||
| December 2014 | ||||||||||||
| Current ThU.S.$ |
Non Current ThU.S.$ |
Total | ||||||||||
| Other financial liabilities |
739,515 | 4,338,915 | 5,078,430 | |||||||||
| Trade and other payables |
630,406 | — | 630,406 | |||||||||
| Related Party Payables |
6,036 | — | 6,036 | |||||||||
| Total Financial Liabilities Measured at Amortized Cost |
1,375,957 | 4,338,915 | 5,714,872 | |||||||||
|
|
|
|
|
|
|
|||||||
99
Table of Contents
CELULOSA ARAUCO Y CONSTITUCION S.A.
AND SUBSIDIARIES
Unaudited Consolidated Financial Statements
December 31, 2015
Amounts in thousands of U.S. dollars, except as indicated
23.9 Cash Flow Hedges Reserve Reconciliation
The following table sets forth the reconciliation balances of cash flow hedges presented in Other Comprehensive Income:
| January - December | ||||||||
| 2015 | 2014 | |||||||
| ThU.S.$ | ThU.S.$ | |||||||
| Opening balance |
(53,022 | ) | (21,507 | ) | ||||
| Fair value gains (losses) arising during the year |
(113,021 | ) | (137,559 | ) | ||||
| Exchange differences of bonds hedged |
107,985 | 80,807 | ||||||
| Finance costs |
16,895 | 13,524 | ||||||
| Settlements during the period |
(16,122 | ) | 949 | |||||
| Deferred taxes |
1,889 | 10,764 | ||||||
| Closing balance |
(55,396 | ) | (53,022 | ) | ||||
23.10 Effect in Profit or Loss
The following table sets forth the net gains/losses and impairment losses recognized in the statement of income on financial instruments:
| Net Gain (loss) | Impairment | |||||||||||||||||
| Assets |
Financial Instrument |
12-31-2015 ThU.S.$ |
12-31-2014 ThU.S.$ |
12-31-2015 ThU.S.$ |
12-31-2014 ThU.S.$ |
|||||||||||||
| Financial assets measure at fair value througth profit or loss |
Swap | 0 | 0 | |||||||||||||||
| Forward |
4,439 | 3,894 | ||||||||||||||||
| Mutual Funds |
5,450 | 3,598 | ||||||||||||||||
| Total | 9,889 | 7,492 | — | — | ||||||||||||||
|
|
|
|
|
|
|
|
|
|||||||||||
| Loans and Receivables |
Fix terms deposits | 14,671 | 10,189 | |||||||||||||||
| Resale agreements |
970 | 1,443 | ||||||||||||||||
| Trades and Other receivables |
— | — | (1,340 | ) | (320 | ) | ||||||||||||
| Total | 15,641 | 11,632 | (1,340 | ) | (320 | ) | ||||||||||||
|
|
|
|
|
|
|
|
|
|||||||||||
| Hedges Instruments |
Cash flow swap | (16,895 | ) | (13,524 | ) | |||||||||||||
| Total | (16,895 | ) | (13,524 | ) | ||||||||||||||
|
|
|
|
|
|||||||||||||||
| Liabilities |
||||||||||||||||||
| At amortized cost |
Bank loans | (40,690 | ) | (33,466 | ) | |||||||||||||
| Bond issued obligations |
(189,526 | ) | (186,335 | ) | ||||||||||||||
| Total | (230,216 | ) | (219,801 | ) | — | — | ||||||||||||
|
|
|
|
|
|
|
|
|
|||||||||||
100
Table of Contents
CELULOSA ARAUCO Y CONSTITUCION S.A.
AND SUBSIDIARIES
Unaudited Consolidated Financial Statements
December 31, 2015
Amounts in thousands of U.S. dollars, except as indicated
23.11 Capital Disclosures
23.11.1 Information on Objectives, Policies and Processes applied by the Company regarding Capital Management
Arauco’s policies on capital management have the objective of:
| a) | Ensuring business continuity and normal operations in the long term; |
| b) | Ensuring funding for new investments to achieve sustainable growth over time; |
| c) | Keeping adequate capital structure considering all economic cycles that impact the business and the nature of the industry; and |
| d) | Maximizing the Company’s value and providing an adequate return to shareholders. |
23.11.2 Qualitative Information on Objectives, Policies and Processes applied by the Company regarding Capital Management
Arauco determines and manages its capital structure based on its carrying amount of equity plus its financial debt (bank borrowings and bonds issued).
23.11.3 Quantitative Information on Capital Management
The following table sets forth the financial covenants that the Company has to comply with as part of the terms of certain of its obligations:
| Instrument | Interest coverage >= 2,0x |
Debt level (1) <= 1,2x | ||||||||||
| 12-31-2015 | 12-31-2014 | |||||||||||
| Th.U.S.$ | Th.U.S.$ | |||||||||||
| Domestic bonds |
863,118 | 971,333 | N/A | ü | ||||||||
| Flakeboard credit with Arauco warranty |
0 | 149,613 | ü | ü | ||||||||
| Syndicate Loan |
298,316 | 298,193 | ü | ü | ||||||||
N/R: Not required for the financial obligation
(1) Debt to equity ratio (financial debt divided by equity plus non-controlling interests)
As of December 31, 2015 and 2014, Arauco has complied with all of its financial covenants.
The following table sets forth the credit ratings of our debt instruments as of December 31, 2015, are as follows:
| Instrument |
Standard & Poor’s |
Fitch Ratings |
Moody’s | Feller Rate | ||||||||||||
| Local bonds |
- | AA - | - | AA - | ||||||||||||
| Foreign bonds |
BBB - | BBB | Baa3 | - | ||||||||||||
Capitalization requirements are established based on the Company’s financial needs and on maintaining an adequate liquidity level and complying with financial covenants established in current debt arrangements. The Company manages its capital structure and makes adjustments based on the prevailing economic conditions in order to mitigate the risks associated with adverse market conditions, and based on opportunities that may arise to improve the Company’s level of liquidity.
101
Table of Contents
CELULOSA ARAUCO Y CONSTITUCION S.A.
AND SUBSIDIARIES
Unaudited Consolidated Financial Statements
December 31, 2015
Amounts in thousands of U.S. dollars, except as indicated
The capitalization of Arauco as of December 31, 2015 and 2014 is as follows:
| Thousands of dollars |
12-31-2015 | 12-31-2014 | ||||||
| Equity |
6,646,445 | 6,814,736 | ||||||
| Bank borrowings |
997,542 | 1,323,108 | ||||||
| Financial leasing |
127,559 | 96,995 | ||||||
| Bonds issued |
3,180,334 | 3,658,327 | ||||||
|
|
|
|
|
|||||
| Capital |
10,951,880 | 11,893,166 | ||||||
|
|
|
|
|
|||||
23.12 Risk Management
Arauco’s financial instruments are exposed to various financial risks: credit risk, liquidity risk and market risk (including exchange rate risks, interest rate risks and price risks).
Arauco’s overall risk management program focuses on uncertainty in financial markets and aims to minimize potential adverse effects on Arauco’s financial profitability.
Arauco’s financial risk management is overseen by the Corporate Finance Department. This department identifies, assesses and hedges financial risks in close collaboration with Arauco’s operational units.
23.12.1 Type of Risk: Credit Risk
Description
Credit risk refers to financial uncertainty at different periods of time relating to the fulfillment of obligations with counterparties, at the time of exercising the contract rights to receive cash or other financial assets on behalf of Arauco.
Explanation of Credit Risk Exposure and How This Risk Arises
Arauco’s exposure to credit risk is directly related to each of its customer’s individual abilities to fulfill their contractual commitments, reflected in trade receivables. Furthermore, credit risk also arises for time deposits, repurchase agreements and mutual funds.
As a policy for its trade receivables, Arauco entered into insurance policies for open account sales. The insurance policies are used to cover export sales from Arauco, Celulosa Arauco y Constitución S.A., Paneles Arauco S.A. (previously Aserraderos Arauco S.A., Paneles Arauco S.A. and Arauco Distribución S.A.) Forestal Arauco S.A., Arauco Argentina S.A. and Arauco do Brasil S.A. as well as domestic sales Arauco México S.A. de C.V., Arauco Wood Inc., Arauco Colombia S.A., Arauco Perú S.A., Arauco Panels USA LLC, Flakeboard Co Ltd., Flakeboard America Ltd., Arauco Argentina S.A., Celulosa Arauco y Constitución S.A, Paneles Arauco S.A (previously Aserraderos Arauco S.A., Paneles Arauco S.A. and Arauco Distribución S.A.) and Arauco do Brasil S.A. Arauco contracts its insurance policies with Continental Credit Insurance Company (rated AA- by credit agencies as Humphreys and Fitch Ratings on April 4, 2012). The insurance policies cover 90% of the amount invoiced with no deductible.
In order to secure a credit line or an advanced payment to a supplier approved by the Credit Committee, Arauco receives several types of guarantees, such as mortgages,
102
Table of Contents
CELULOSA ARAUCO Y CONSTITUCION S.A.
AND SUBSIDIARIES
Unaudited Consolidated Financial Statements
December 31, 2015
Amounts in thousands of U.S. dollars, except as indicated
pledges, standby letters of credit, certificates of deposit, checks, promissory notes, mutual loans or any other guarantee that may be requested pursuant to each country’s legislation.
As of December 31, 2015 the total amount of guarantees given was U.S.$118.5 which is summarized in the following table. The procedure of guarantees is regulated by the Policies of Arauco’s Guarantees which aims to control the accounting, the maturity and the valuation of these.
| Arauco Group Guarantees (ThU.S$) | ||||||||
| Guarantees Debtors (received from clients) |
84,428 | 71 | % | |||||
| Certificate of deposits |
8,871 | 11 | % | |||||
| Standby |
5,427 | 6 | % | |||||
| Promissory notes |
47,990 | 57 | % | |||||
| Finance |
6,483 | 8 | % | |||||
| Mortgage |
8,099 | 10 | % | |||||
| Pledge |
2,158 | 3 | % | |||||
| Promissory notes |
5,400 | 6 | % | |||||
| Guarantees Creditors (received from suppliers) |
34,082 | 29 | % | |||||
| Pledge |
2,887 | 8 | % | |||||
| Certificate of deposits |
3,444 | 10 | % | |||||
| Mutuo |
358 | 1 | % | |||||
| Standby |
1,828 | 5 | % | |||||
| Deposit |
6 | 0 | % | |||||
| Promissory notes |
5,606 | 16 | % | |||||
| Finance |
19,953 | 59 | % | |||||
|
|
|
|
|
|||||
| Total Guarantees |
118,510 | 100 | % | |||||
|
|
|
|
|
|||||
At the end of each reporting period, the Company’s maximum credit risk exposure is limited to the carrying amount of the recognized trade receivables less the amounts receivable insured by credit insurance companies and the guarantees received by Arauco.
As of December 31, 2015, Arauco’s consolidated revenues from sales were ThU.S.$5,146,740 of which 62.99% correspond to credit sales, 29.36% to sales with letters of credit, and 7.65% to other classes of sales.
As of December 31, 2015, of the trade receivables balance of ThU.S.$625,201 that had agreed term of sales, 49.57% corresponded to credit sales, 49.12% to sales with letters of credit and 1.31% to other classes of sales, distributed among 2,277 customers. The customer with the largest open account outstanding did not exceed 4.06% of total.
Arauco has not entered into any refinancing or renegotiations with its customers which involve amendments to the invoice due, and if necessary, any renegotiation of debt with a customer will be analyzed on a case by case basis and approved by the Corporate Finance Department.
The credit sales receivables covered by insurance or collateral were 99.3%. Therefore, Arauco’s credit risk exposure of its portfolio is 0.7%.
| Secured Credit Sales Receivables | ||||||||
| ThU.S.$ | % | |||||||
| Total credit sales receivables |
309,942 | 100.0 | ||||||
| Secured Receivables (*) |
307,773 | 99.3 | ||||||
| Unsecured Receivables |
2,170 | 0.7 | ||||||
| (*) | Secured receivables are defined as the amount of trade receivables that are covered by credit insurance or collateral such as: stand-by letter of credits, mortgage or certificates of deposit, among others. |
103
Table of Contents
CELULOSA ARAUCO Y CONSTITUCION S.A.
AND SUBSIDIARIES
Unaudited Consolidated Financial Statements
December 31, 2015
Amounts in thousands of U.S. dollars, except as indicated
Accounts exposed to this type of risk are: trade receivable, financial lease debtors and other debtors.
Arauco does not have a securitized portfolio.
| December 2015 ThU.S.$ |
December 2014 ThU.S.$ |
|||||||
| Current Receivables |
||||||||
| Trades receivables |
614,623 | 649,892 | ||||||
| Financial lease receivables |
9 | 136 | ||||||
| Other Debtors |
118,690 | 81,880 | ||||||
| Net subtotal |
733,322 | 731,908 | ||||||
| Trades receivables |
625,201 | 660,352 | ||||||
| Financial lease receivables |
125 | 213 | ||||||
| Other Debtors |
127,856 | 89,863 | ||||||
| Gross subtotal |
753,182 | 750,428 | ||||||
| Provision for doubtful trade receivables |
10,578 | 10,460 | ||||||
| Provision for doubtful lease receivables |
116 | 77 | ||||||
| Provision for doubtful other debtors |
9,166 | 7,983 | ||||||
| Subtotal Bad Debt |
19,860 | 18,520 | ||||||
| Non Current Receivables |
||||||||
| Trades receivables |
32 | 32 | ||||||
| Financial lease receivables |
6 | 17 | ||||||
| Other Debtors |
15,232 | 30,952 | ||||||
| Net Subtotal |
15,270 | 31,001 | ||||||
| Trades receivables |
32 | 32 | ||||||
| Financial lease receivables |
6 | 17 | ||||||
| Other Debtors |
15,232 | 30,952 | ||||||
| Gross subtotal |
15,270 | 31,001 | ||||||
| Provision for doubtful trade receivables |
— | — | ||||||
| Provision for doubtful lease receivables |
— | — | ||||||
| Provision for doubtful other debtors |
— | — | ||||||
| Subtotal Bad Debt |
— | — | ||||||
|
|
|
|
|
|||||
104
Table of Contents
CELULOSA ARAUCO Y CONSTITUCION S.A.
AND SUBSIDIARIES
Unaudited Consolidated Financial Statements
December 31, 2015
Amounts in thousands of U.S. dollars, except as indicated
The following table sets forth the reconciliation of changes in the allowance for doubtful accounts as of December 31, 2015 and 2014:
| 12-31-2015 | 12-31-2014 | |||||||
| ThU.S.$ | ThU.S.$ | |||||||
| Opening balance |
18,520 | 8,637 | ||||||
| Increase |
3,072 | 2,940 | ||||||
| Reversal of impairment losses |
(1,732 | ) | (259 | ) | ||||
| Closing balance |
19,860 | 18,520 | ||||||
|
|
|
|
|
|||||
Explanation of Risk Management Objectives, Policies and Processes, and Measurement Methods
The Credit and Collections Department, which reports to the Treasury Department, is responsible for minimizing receivables credit risk and supervising past due accounts. It is also responsible for the approval or rejection of credit limits for all sales. The standards and procedures governing the control and risk management of credit sales are set forth, in the Company’s Credit Policy.
For the approval and/or modification of the clients’ credit facilities, a procedure has been put in place, which must be followed by all of the companies of the Arauco group. The requests for credit facilities are entered into SAP, where all of the available information is analyzed, including the amount of the facility granted by the credit insurance company. Afterwards, the requests are approved or rejected by each of the internal committees of each company of the Arauco group, depending on the maximum amount authorized by the Credit Policy. If the credit facility exceeds such amount, it is then analyzed by the Corporate Committee. Credit facilities are renewed on a yearly basis, following this internal process.
Sales via letters of credit are executed mostly in the markets of Asia and the Middle East. Periodically, a credit assessment is conducted regarding the banks which issue the letters of credit, in order to obtain the risk rating granted by the main risk rating agencies, along with their country and global ranking and financial situation during the last 5 years. Pursuant to this evaluation, a decision is made on whether to approve the issuer bank or to request a confirmation of the letter of credit.
All sales are controlled by a credit verification system that has set parameters to block orders from customers who have accumulated past due amounts of a defined percentage of the debt and/or customers who at the time of product delivery have exceeded their credit limit or whose credit limit has expired.
105
Table of Contents
CELULOSA ARAUCO Y CONSTITUCION S.A.
AND SUBSIDIARIES
Unaudited Consolidated Financial Statements
December 31, 2015
Amounts in thousands of U.S. dollars, except as indicated
December 31, 2015
| Age of trade receivables | ||||||||||||||||||||||||||||||||||||||||||||
| Days |
Non-past due | 1 to 30 | 31 to 60 | 61 to 90 | 91 to 120 | 121 to 150 | 151 to 180 | 181 to 210 | 211 to 250 | More than 250 |
Total | |||||||||||||||||||||||||||||||||
| ThU.S$ |
571,499 | 18,927 | 2,303 | 2,332 | 363 | 168 | 1,102 | 1,413 | 1,444 | 25,650 | 625,201 | |||||||||||||||||||||||||||||||||
| % |
91.41 | % | 3.03 | % | 0.37 | % | 0.37 | % | 0.06 | % | 0.03 | % | 0.18 | % | 0.23 | % | 0.23 | % | 4.10 | % | 100 | % | ||||||||||||||||||||||
| Financial deterioration in sections | ||||||||||||||||||||||||||||||||||||||||||||
| Days |
Non-past due | 1 to 30 | 31 to 60 | 61 to 90 | 91 to 120 | 121 to 150 | 151 to 180 | 181 to 210 | 211 to 250 | More than 250 |
Total | |||||||||||||||||||||||||||||||||
| ThU.S$ |
-622 | -319 | -77 | -23 | -7 | -335 | 16 | -5 | -112 | -9,093 | -10,578 | |||||||||||||||||||||||||||||||||
| % |
5.88 | % | 3.02 | % | 0.73 | % | 0.22 | % | 0.06 | % | 3.17 | % | -0.15 | % | 0.05 | % | 1.06 | % | 85.96 | % | 100 | % | ||||||||||||||||||||||
December 31, 2014
| Age of trade receivables | ||||||||||||||||||||||||||||||||||||||||||||
| Days |
Non-past due | 1 to 30 | 31 to 60 | 61 to 90 | 91 to 120 | 121 to 150 | 151 to 180 | 181 to 210 | 211 to 250 | More than 250 |
Total | |||||||||||||||||||||||||||||||||
| ThU.S.$ |
630,681 | 2,042 | 2,546 | 1,188 | 735 | 168 | 666 | 173 | 298 | 21,856 | 660,352 | |||||||||||||||||||||||||||||||||
| % |
95.51 | % | 0.31 | % | 0.39 | % | 0.18 | % | 0.11 | % | 0.03 | % | 0.10 | % | 0.03 | % | 0.05 | % | 3.31 | % | 100.00 | % | ||||||||||||||||||||||
| Financial deterioration in sections | ||||||||||||||||||||||||||||||||||||||||||||
| Days |
Non-past due | 1 to 30 | 31 to 60 | 61 to 90 | 91 to 120 | 121 to 150 | 151 to 180 | 181 to 210 | 211 to 250 | More than 250 |
Total | |||||||||||||||||||||||||||||||||
| ThU.S.$ |
-26 | 0 | 0 | -40 | 78 | -432 | 0 | -11 | 3 | -10,031 | -10,460 | |||||||||||||||||||||||||||||||||
| % |
0.25 | % | 0.00 | % | 0.00 | % | 0.39 | % | -0.75 | % | 4.13 | % | 0.00 | % | 0.11 | % | -0.03 | % | 95.90 | % | 100.00 | % | ||||||||||||||||||||||
Arauco has recognized provisions for doubtful accounts on trade receivables for a total of ThU.S.$10,698 over the last four years which represents 0.046% of total revenues from sales during the same period.
| Provisions for doubtful accounts of trade receivables as a percentage of total revenues from sales | ||||||||||||||||||||
| 2015 | 2014 | 2013 | 2012 | Last 4 years | ||||||||||||||||
| Percentage of impairment losses |
0.182 | % | -0.009 | % | 0.008 | % | 0.001 | % | 0.046 | % | ||||||||||
The amount recovered through possession of collateral, credit insurance reimbursements or any other credit enhancement during the period amount to ThU.S.$440, which represents 5.48% of the total provisioned assets.
Explanation of any changes to risk exposure or changes in objectives, processes and policies regarding previous years’ risk management.
Arauco has implemented a Guarantee Policy in order to control accounting, valuation and expiration of these and a Corporate Credit Policy.
Currently there is a policy for provisions for doubtful accounts receivable under IFRS for all the Arauco group companies.
106
Table of Contents
CELULOSA ARAUCO Y CONSTITUCION S.A.
AND SUBSIDIARIES
Unaudited Consolidated Financial Statements
December 31, 2015
Amounts in thousands of U.S. dollars, except as indicated
Investment Policy:
Arauco has an Investment Policy which identifies and limits the financial instruments and the entities that Arauco and its subsidiaries are authorized to invest in.
The Company’s Treasury Department is centralized with operations in Chile. The Head Office is responsible for carrying out investments, cash flow surplus investments, and short and long term debt subscriptions. Exceptions to this rule are specific investments made through other companies where authorization is required from the Chief Financial Officer.
For financial instruments, the only permitted investments are fixed income investments with adequate liquidity. Each instrument has defined classifications and limits, depending on duration and type of issuer.
Regarding intermediaries (such as banks, securities brokers and broker/dealers of mutual funds), a scoring methodology is used to determine the relative degree of risk of each intermediary based on their financial position and assign score points that result in a credit risk rating to each intermediary. Arauco uses this scoring system to determine its investment limits for each intermediary.
The required information to evaluate the various criteria are obtained from published financial statements from the banks under evaluation and from the credit risk ratings of short and long term debt securities obtained from rating agencies authorized by the Superintendency of Banks and Financial Institutions (Fitch Ratings Chile, Humphreys and Feller Rate).
The criteria evaluated are: Capital and Reserves, Current Ratio, Return on equity, Net Income to Operating income Ratio, Debt to Equity Ratio and the Credit Risk rating of each entity.
Any necessary exceptions regarding investment limits in each particular instrument or entity must have the authorization from Arauco’s Chief Financial Officer.
107
Table of Contents
CELULOSA ARAUCO Y CONSTITUCION S.A.
AND SUBSIDIARIES
Unaudited Consolidated Financial Statements
December 31, 2015
Amounts in thousands of U.S. dollars, except as indicated
23.12.2 Type of Risk: Liquidity Risk
Description
This risk corresponds to Arauco’s ability to fulfill its financial obligations upon maturity.
Explanation of Liquidity Risk Exposure and How This Risk Arises
Arauco’s exposure to liquidity risk is mainly from its obligations to bondholders, banks and financial institutions, creditors and other payables. Liquidity risk may arise if Arauco is unable to meet the net cash flow requirements, which sustain its operations under both normal and exceptional circumstances.
Explanation of Objectives, Policies and Processes for Risk Management, and Measurement Methods
The Financial Management Department monitors on an ongoing basis the Company’s cash flow forecasts based on short and long term forecasts and available financing alternatives. In order to manage the risk level of financial assets, Arauco follows its investment policy.
The following tables detail Arauco’s liquidity analysis for its financial liabilities as of March 31, 2015 and December 31, 2014. The tables have been drawn up based on the contractual undiscounted cash outflows and their remaining contractual maturities:
108
Table of Contents
CELULOSA ARAUCO Y CONSTITUCION S.A.
AND SUBSIDIARIES
Unaudited Consolidated Financial Statements
December 31, 2015
Amounts in thousands of U.S. dollars, except as indicated
December 31, 2015
| Maturity | Total | |||||||||||||||||||||||||||||||||||||||||||||||
| Tax ID |
Name | Currency | Name-Country Loans with banks |
Up to 3 months ThU.S.$ |
3 to 12 months ThU.S.$ |
1 to 2 years ThU.S.$ |
2 to 3 years ThU.S.$ |
3 to 4 years ThU.S.$ |
4 to 5 years ThU.S.$ |
More than 5 years ThU.S.$ |
Current ThU.S.$ |
Non Current ThU.S.$ |
Effective rate |
Nominal rate | ||||||||||||||||||||||||||||||||||
| 93.458.000-1 |
Celulosa Arauco y Constitución S.A. |
U.S. Dollar | Scotiabank- Chile | — | 25 | 4,638 | 301,770 | — | — | — | 25 | 306,408 | 1.53 | % | Libor +0,70% | |||||||||||||||||||||||||||||||||
| — |
Arauco Argentina S.A. |
Argentine Pesos |
Banco Macro- Argentina |
— | 49 | 48 | — | — | — | — | 49 | 48 | 15.25 | % | 15.25% | |||||||||||||||||||||||||||||||||
| — |
Arauco Argentina S.A. |
Argentine Pesos |
Banco Galicia- Argentina |
— | 307 | — | — | — | — | — | 307 | — | 15.25 | % | 15.25% | |||||||||||||||||||||||||||||||||
| — |
Zona Franca Punta Pereira S.A. |
U.S. Dollar | Interamerican Development Bank |
1,163 | 1,023 | 2,450 | 2,396 | 2,343 | 2,289 | 6,514 | 2,186 | 15,992 | Libor + 2,05 | % | Libor + 2,05% | |||||||||||||||||||||||||||||||||
| — |
Zona Franca Punta Pereira S.A. |
U.S. Dollar | Interamerican Development Bank |
166 | 2,777 | 6,076 | 5,934 | 5,794 | 5,652 | — | 2,943 | 23,456 | Libor + 1,80 | % | Libor + 1,80% | |||||||||||||||||||||||||||||||||
| — |
Zona Franca Punta Pereira S.A. |
U.S. Dollar | Banco Santander | 20,013 | — | — | — | — | — | — | 20,013 | — | Libor + 2,00 | % | Libor + 2,00% | |||||||||||||||||||||||||||||||||
| — |
Celulosa y Energia Punta Pereira S.A. |
U.S. Dollar | Finnish Export Credit |
25,810 | 20,354 | 52,288 | 51,368 | 50,477 | 49,694 | 118,826 | 46,164 | 322,653 | 3.20 | % | 3.20% | |||||||||||||||||||||||||||||||||
| — |
Celulosa y Energia Punta Pereira S.A. |
U.S. Dollar | Interamerican Development bank |
4,706 | 4,126 | 9,900 | 9,680 | 9,460 | 9,242 | 26,298 | 8,832 | 64,580 | Libor + 2,05 | % | Libor + 2,05% | |||||||||||||||||||||||||||||||||
| — |
Celulosa y Energia Punta Pereira S.A. |
U.S. Dollar | Interamerican Development bank |
675 | 11,220 | 24,566 | 23,991 | 23,417 | 22,843 | — | 11,895 | 94,817 | Libor + 1,80 | % | Libor + 1,80% | |||||||||||||||||||||||||||||||||
| — |
Celulosa y Energia Punta Pereira S.A. |
U.S. Dollar | Dnb Nor Bank | — | 245 | — | — | — | — | — | 245 | — | Libor + 2,00 | % | Libor + 2,00% | |||||||||||||||||||||||||||||||||
| — |
Eufores S.A. | U.S. Dollar | Banco BBVA - Uruguay |
16,115 | — | — | — | — | — | — | 16,115 | — | Libor + 2,00 | % | Libor + 2,00% | |||||||||||||||||||||||||||||||||
| — |
Eufores S.A. | U.S. Dollar | Banco Republica Oriental de Uruguay |
16,689 | 18,555 | — | — | — | — | — | 35,244 | — | Libor + 1,75 | % | Libor + 1,75% | |||||||||||||||||||||||||||||||||
| — |
Eufores S.A. | U.S. Dollar | Citibank | — | 2,514 | — | — | — | — | — | 2,514 | — | Libor + 2,00 | % | Libor + 2,00% | |||||||||||||||||||||||||||||||||
| — |
Eufores S.A. | U.S. Dollar | Banco HSBC- Uruguay |
1,201 | — | — | — | — | — | — | 1,201 | — | Libor + 2,00 | % | Libor + 2,00% | |||||||||||||||||||||||||||||||||
| — |
Eufores S.A. | U.S. Dollar | Banco Itau - Uruguay |
5,065 | 5,004 | — | — | — | — | — | 10,069 | — | Libor + 2,00 | % | Libor + 2,00% | |||||||||||||||||||||||||||||||||
| — |
Eufores S.A. | U.S. Dollar | Heritage | 1,357 | — | — | — | — | — | — | 1,357 | — | Libor + 2,00 | % | Libor + 2,00% | |||||||||||||||||||||||||||||||||
| — |
Arauco Do Brasil S.A. |
Brazilian Real |
Banco ABC | 5 | 17 | 20 | — | — | — | — | 22 | 20 | 2.50 | % | 2.50% | |||||||||||||||||||||||||||||||||
| — |
Arauco Do Brasil S.A. |
U.S. Dollar | Banco Bradesco | 831 | — | — | — | — | — | — | 831 | — | 1.80 | % | 1.80% | |||||||||||||||||||||||||||||||||
| — |
Arauco Do Brasil S.A. |
Brazilian Real |
Banco Bradesco | 3,960 | 1,256 | — | — | — | — | — | 5,216 | — | 8.75 | % | 8.75% | |||||||||||||||||||||||||||||||||
| — |
Arauco Do Brasil S.A. |
Brazilian Real |
Banco do Brasil - Brasil |
23 | 72 | — | — | — | — | — | 95 | — | 8.70 | % | 8.70% | |||||||||||||||||||||||||||||||||
| — |
Arauco Do Brasil S.A. |
Brazilian Real |
Banco HSBC- Brasil |
7,779 | — | — | — | — | — | — | 7,779 | — | 8.00 | % | 8.00% | |||||||||||||||||||||||||||||||||
| — |
Arauco Do Brasil S.A. |
Brazilian Real |
Banco Itau -Brasil | 47 | 43 | — | — | — | — | — | 90 | — | 8.43 | % | 8.43% | |||||||||||||||||||||||||||||||||
| — |
Arauco Do Brasil S.A. |
U.S. Dollar | Banco JP Morgan | 7,912 | 4,356 | — | — | — | — | — | 12,268 | — | 1.71 | % | 1.71% | |||||||||||||||||||||||||||||||||
| — |
Arauco Do Brasil S.A. |
Brazilian Real |
Banco Votorantim - Brasil |
19 | 38 | 32 | — | — | — | — | 57 | 32 | 6.30 | % | 6.30% | |||||||||||||||||||||||||||||||||
| — |
Arauco Do Brasil S.A. |
Brazilian Real |
Banco Santander | 12,881 | 3 | 37 | 76 | 75 | 39 | — | 12,884 | 227 | 8.00 | % | 8.00% | |||||||||||||||||||||||||||||||||
| — |
Arauco Do Brasil S.A. |
Brazilian Real |
Fundo de Desenvolvimiento Econom. - Brasil |
7 | 27 | 7 | — | — | — | — | 34 | 7 | 0.00 | % | 0.00% | |||||||||||||||||||||||||||||||||
| — |
Arauco Florestal Arapoti S.A. |
Brazilian Real |
Banco Itau | 3 | 6 | 8 | 1 | — | — | — | 9 | 9 | 2.50 | % | 2.50% | |||||||||||||||||||||||||||||||||
| — |
Arauco Florestal Arapoti S.A. |
Brazilian Real |
Banco Itau | 12 | 31 | 43 | 43 | 3 | — | — | 43 | 89 | 3.50 | % | 3.50% | |||||||||||||||||||||||||||||||||
| — |
Arauco Florestal Arapoti S.A. |
Brazilian Real |
Banco Bradesco | 11 | 27 | 37 | 37 | 31 | — | — | 38 | 105 | 6.00 | % | 6.00% | |||||||||||||||||||||||||||||||||
| — |
Arauco Florestal Arapoti S.A. |
Brazilian Real |
Banco Votorantim |
— | 14 | — | — | — | — | 617 | 14 | 617 | 5.00 | % | 5.00% | |||||||||||||||||||||||||||||||||
| — |
Arauco Florestal Arapoti S.A. |
Brazilian Real |
Banco Safra | 19 | 55 | 73 | 73 | 18 | — | — | 74 | 164 | 6.00 | % | 5.00% | |||||||||||||||||||||||||||||||||
| — |
Arauco Florestal Arapoti S.A. |
Brazilian Real |
Banco Safra | 6 | 17 | 23 | 23 | 23 | 24 | 9 | 23 | 102 | 10.00 | % | 10.00% | |||||||||||||||||||||||||||||||||
| — |
Arauco Florestal Arapoti S.A. |
Brazilian Real |
Banco Santander | 4 | 24 | 27 | 27 | 27 | 13 | — | 28 | 94 | 9.22 | % | 9.22% | |||||||||||||||||||||||||||||||||
| — |
Arauco Forest Brasil S.A. |
Brazilian Real |
Banco Bradesco | — | 66 | — | — | — | 144 | — | 66 | 144 | 7.81 | % | 7.81% | |||||||||||||||||||||||||||||||||
| — |
Arauco Forest Brasil S.A. |
Brazilian Real |
Banco Bradesco | 307 | — | — | — | — | — | — | 307 | — | 12.11 | % | 12.11% | |||||||||||||||||||||||||||||||||
| — |
Arauco Forest Brasil S.A. |
Brazilian Real |
Banco Itau - Brasil |
9 | 13 | — | 86 | 14 | — | — | 22 | 100 | 5.52 | % | 5.52% | |||||||||||||||||||||||||||||||||
| — |
Arauco Forest Brasil S.A. |
Brazilian Real |
Banco Votorantim - Brasil |
— | 285 | — | — | — | 1,474 | 546 | 285 | 2,020 | 9.31 | % | 9.31% | |||||||||||||||||||||||||||||||||
| — |
Arauco Forest Brasil S.A. |
U.S. Dollar | Banco Votorantim - Brasil |
— | 62 | — | — | — | 347 | — | 62 | 347 | 9.00 | % | 9.00% | |||||||||||||||||||||||||||||||||
| — |
Arauco Forest Brasil S.A. |
Brazilian Real |
Bndes | — | 3 | — | — | — | — | 757 | 3 | 757 | 4.61 | % | 4.61% | |||||||||||||||||||||||||||||||||
| — |
Arauco Forest Brasil S.A. |
U.S. Dollar | Bndes | — | 4 | — | — | — | 6 | 289 | 4 | 295 | 10.80 | % | 10.80% | |||||||||||||||||||||||||||||||||
| 0 |
Arauco Forest Brasil S.A. |
Brazilian Real |
Banco Santander | — | 16 | — | — | — | 96 | — | 16 | 96 | 9.50 | % | 9.50% | |||||||||||||||||||||||||||||||||
| — |
Arauco Forest Brasil S.A. |
Brazilian Real |
Banco John Deere | — | 207 | — | — | — | — | — | 207 | — | 6.00 | % | 6.00% | |||||||||||||||||||||||||||||||||
| — |
Mahal Emprendimientos Pat. S.A. |
Brazilian Real |
Bndes Subcrédito E-I |
— | 19 | — | 622 | 2,492 | 1,870 | — | 19 | 4,984 | 9.91 | % | 9.91% | |||||||||||||||||||||||||||||||||
| — |
Mahal Emprendimientos Pat. S.A. |
Brazilian Real |
Bndes Subcrédito F-J |
— | 12 | — | 374 | 1,496 | 1,122 | — | 12 | 2,992 | 10.91 | % | 10.91% | |||||||||||||||||||||||||||||||||
| — |
Mahal Emprendimientos Pat. S.A. |
U.S. Dollar | Bndes Subcrédito G-K |
— | 61 | — | 511 | 2,037 | 1,528 | — | 61 | 4,076 | 6.99 | % | 6.99% | |||||||||||||||||||||||||||||||||
| — |
Mahal Emprendimientos Pat. S.A. |
Brazilian Real |
Bndes Subcrédito H-L |
— | 15 | — | 444 | 1,646 | 1,233 | — | 15 | 3,323 | 12.11 | % | 12.11% | |||||||||||||||||||||||||||||||||
|
|
|
|
|
|
|
|
|
|
|
|
|
|
|
|
|
|
|
|||||||||||||||||||||||||||||||
| Total | 126,795 | 72,948 | 100,273 | 397,456 | 99,353 | 97,616 | 153,856 | 199,743 | 848,554 | |||||||||||||||||||||||||||||||||||||||
|
|
|
|
|
|
|
|
|
|
|
|
|
|
|
|
|
|
|
|||||||||||||||||||||||||||||||
109
Table of Contents
CELULOSA ARAUCO Y CONSTITUCION S.A.
AND SUBSIDIARIES
Unaudited Consolidated Financial Statements
December 31, 2015
Amounts in thousands of U.S. dollars, except as indicated
December 31,2015
| Maturity | Total | |||||||||||||||||||||||||||||||||||||||||||||||||||
| Tax ID |
Name | Currency | Name-Country Bonds |
Up to 3 months ThU.S.$ |
3 to 12 months ThU.S.$ |
1 to 2 years ThU.S.$ |
2 to 3 years ThU.S.$ |
3 to 4 years ThU.S.$ |
4 to 5 years ThU.S.$ |
More than 5 years ThU.S.$ |
Current ThU.S.$ |
Non Current ThU.S.$ |
Effective rate |
Nominal rate |
||||||||||||||||||||||||||||||||||||||
| 93.458.000-1 |
Celulosa Arauco y Constitución S.A. |
UF | Barau-F | — | 1,771 | 10,625 | 10,625 | 32,403 | 31,438 | 239,473 | 1,771 | 324,564 | 4.24 | % | 4.25 | % | ||||||||||||||||||||||||||||||||||||
| 93.458.000-2 |
Celulosa Arauco y Constitución S.A. |
UF | Barau-J | 1,939 | — | 5,818 | 5,818 | 5,818 | 186,141 | — | 1,939 | 203,595 | 3.23 | % | 3.22 | % | ||||||||||||||||||||||||||||||||||||
| 93.458.000-3 |
Celulosa Arauco y Constitución S.A. |
UF | Barau-P | — | 913 | 7,147 | 7,147 | 7,147 | 7,147 | 229,723 | 913 | 258,311 | 3.96 | % | 3.96 | % | ||||||||||||||||||||||||||||||||||||
| 93.458.000-3 |
Celulosa Arauco y Constitución S.A. |
UF | Barau-Q | — | 538 | 11,266 | 19,979 | 19,442 | 18,905 | 9,251 | 538 | 78,843 | 2.96 | % | 2.98 | % | ||||||||||||||||||||||||||||||||||||
| 93.458.000-3 |
Celulosa Arauco y Constitución S.A. |
UF | Barau-R | — | 1,610 | 6,439 | 6,439 | 6,439 | 6,439 | 272,750 | 1,610 | 298,506 | 3.57 | % | 3.57 | % | ||||||||||||||||||||||||||||||||||||
| — |
Arauco Argentina S.A. | U.S. Dollar | Bono 144 A - Argentina | — | 1,004 | 277,869 | — | — | — | — | 1,004 | 277,869 | 6.39 | % | 6.38 | % | ||||||||||||||||||||||||||||||||||||
| 93.458.000-1 |
Celulosa Arauco y Constitución S.A. |
U.S. Dollar | Yankee Bonds 2019 | 15,205 | — | 36,250 | 36,250 | 533,483 | — | — | 15,205 | 605,983 | 7.26 | % | 7.25 | % | ||||||||||||||||||||||||||||||||||||
| 93.458.000-1 |
Celulosa Arauco y Constitución S.A. |
U.S. Dollar | |
Yankee Bonds 2a Emisión |
|
2,734 | — | 134,257 | — | — | — | — | 2,734 | 134,257 | 7.50 | % | 7.50 | % | ||||||||||||||||||||||||||||||||||
| 93.458.000-1 |
Celulosa Arauco y Constitución S.A. |
U.S. Dollar | Yankee 2021 | 8,889 | — | 20,000 | 20,000 | 20,000 | 20,000 | 406,108 | 8,889 | 486,108 | 5.02 | % | 5.00 | % | ||||||||||||||||||||||||||||||||||||
| 93.458.000-1 |
Celulosa Arauco y Constitución S.A. |
U.S. Dollar | Yankee 2022 | 11,215 | — | 23,750 | 23,750 | 23,750 | 23,750 | 527,255 | 11,215 | 622,255 | 4.77 | % | 4.75 | % | ||||||||||||||||||||||||||||||||||||
| 93.458.000-1 |
Celulosa Arauco y Constitución S.A. |
U.S. Dollar | Yankee 2024 | 9,375 | — | 22,500 | 22,500 | 22,500 | 22,500 | 590,928 | 9,375 | 680,928 | 4.52 | % | 4.50 | % | ||||||||||||||||||||||||||||||||||||
|
|
|
|
|
|
|
|
|
|
|
|
|
|
|
|
|
|
|
|
|
|||||||||||||||||||||||||||||||||
| Total | 49,357 | 5,836 | 555,921 | 152,508 | 670,982 | 316,320 | 2,275,488 | 55,193 | 3,971,219 | |||||||||||||||||||||||||||||||||||||||||||
|
|
|
|
|
|
|
|
|
|
|
|
|
|
|
|
|
|
|
|
|
|||||||||||||||||||||||||||||||||
December 31, 2015
| Maturity | Total | |||||||||||||||||||||||||||||||||||||||||||||||||||
| Tax ID |
Name | Currency | Name-Country Lease |
Up to 3 months ThU.S.$ |
3 to 12 months ThU.S.$ |
1 to 2 years ThU.S.$ |
2 to 3 years ThU.S.$ |
3 to 4 years ThU.S.$ |
4 to 5 years ThU.S.$ |
More than 5 years ThU.S.$ |
Current ThU.S.$ |
Non Current ThU.S.$ |
Effective rate |
Nominal rate |
||||||||||||||||||||||||||||||||||||||
| 85.805.200-9 |
Forestal Arauco S.A. | UF | Banco Santander | 338 | 904 | 650 | 650 | 3,362 | — | — | 1,242 | 4,662 | — | — | ||||||||||||||||||||||||||||||||||||||
| 85.805.200-9 |
Forestal Arauco S.A. | UF | Banco Scotiabank | 1,303 | 4,370 | 4,875 | 4,875 | 6,059 | — | — | 5,673 | 15,809 | — | — | ||||||||||||||||||||||||||||||||||||||
| 85.805.200-9 |
Forestal Arauco S.A. | UF | Banco Estado | 361 | 1,160 | 1,471 | 1,471 | 1,957 | — | — | 1,521 | 4,899 | — | — | ||||||||||||||||||||||||||||||||||||||
| 85.805.200-9 |
Forestal Arauco S.A. | UF | Banco de Chile | 4,026 | 11,489 | 11,301 | 11,301 | 12,650 | — | — | 15,515 | 35,252 | — | — | ||||||||||||||||||||||||||||||||||||||
| 85.805.200-9 |
Forestal Arauco S.A. | UF | Banco BBVA | 1,814 | 5,344 | 4,490 | 4,490 | 3,374 | — | — | 7,158 | 12,354 | — | — | ||||||||||||||||||||||||||||||||||||||
| 85.805.200-9 |
Forestal Arauco S.A. | UF | Banco Credito e Inversiones | 557 | 1,672 | 2,129 | 2,129 | 3,008 | — | — | 2,229 | 7,266 | 0.00 | % | 0.00 | % | ||||||||||||||||||||||||||||||||||||
| 85.805.200-9 |
Forestal Arauco S.A. | Chilean Pesos | Banco Santander | 172 | 517 | 575 | 576 | — | — | — | 689 | 1,151 | — | — | ||||||||||||||||||||||||||||||||||||||
| 85.805.200-9 |
Forestal Arauco S.A. | Chilean Pesos | Banco Chile | 262 | 704 | 824 | 824 | 365 | — | — | 966 | 2,013 | — | — | ||||||||||||||||||||||||||||||||||||||
| 85.805.200-9 |
Forestal Arauco S.A. | Chilean Pesos | Banco Credito e Inversiones | 468 | 1,401 | 1,834 | 1,834 | 3,623 | — | — | 1,869 | 7,291 | — | — | ||||||||||||||||||||||||||||||||||||||
|
|
|
|
|
|
|
|
|
|
|
|
|
|
|
|
|
|
|
|
|
|||||||||||||||||||||||||||||||||
| Total | 9,301 | 27,561 | 28,149 | 28,150 | 34,398 | 0 | 0 | 36,862 | 90,697 | |||||||||||||||||||||||||||||||||||||||||||
|
|
|
|
|
|
|
|
|
|
|
|
|
|
|
|
|
|
|
|
|
|||||||||||||||||||||||||||||||||
As part of the policy of Arauco, it considers compliance with all Accounts Payable, whether with related (see Note 13) or third parties , within a period not exceeding 30 days.
110
Table of Contents
CELULOSA ARAUCO Y CONSTITUCION S.A.
AND SUBSIDIARIES
Unaudited Consolidated Financial Statements
December 31, 2015
Amounts in thousands of U.S. dollars, except as indicated
December 31, 2014
| Maturity | Total | |||||||||||||||||||||||||||||||||||||||||||||||
| Tax ID |
Name | Currency | Name-Country Loans with banks |
to 3 months ThU.S.$ |
3 to 12 months ThU.S.$ |
1 to 2 years ThU.S.$ |
2 to 3 years ThU.S.$ |
3 to 4 years ThU.S.$ |
4 to 5 years ThU.S.$ |
More than 5 years ThU.S.$ |
Current ThU.S.$ |
Non Current ThU.S.$ |
Type Amortization |
Effective rate |
Nominal rate | |||||||||||||||||||||||||||||||||
| — | Flakeboard Company Limited |
U.S. Dollar | J.P.Morgan -United States | — | 30,433 | 61,919 | 60,644 | 55 | — | — | 30,433 | 122,618 | Maturity | Libor +1.35% |
Libor +1.35% | |||||||||||||||||||||||||||||||||
| 93.458.000-1 | Celulosa Arauco y Constitución S.A. |
U.S. Dollar | Banco BBVA -United States | 30,105 | — | 15,154 | — | — | — | — | 30,105 | 15,154 | (i) semmiannual; (k) semmiannual from 2011 |
Libor 6 monthly + 0.2% |
Libor 6 monthly + 0.2% | |||||||||||||||||||||||||||||||||
| 93.458.000-1 | Celulosa Arauco y Constitución S.A. |
U.S. Dollar | Bancoestado NY | 9,063 | 9,000 | 9,000 | — | — | — | — | 18,063 | 9,000 | (i) semmiannual; (k) semmiannual from 2011 |
Libor 6 monthly + 0.2% |
Libor 6 monthly + 0.2% | |||||||||||||||||||||||||||||||||
| 93.458.000-1 | Celulosa Arauco y Constitución S.A. |
U.S. Dollar | Scotiabank- Chile | — | 22 | 299,223 | — | — | — | — | 22 | 299,223 | Maturity | 1.42% | 1.42% | |||||||||||||||||||||||||||||||||
| — | Alto Parana S.A. | Argentine Pesos |
Banco Macro- Argentina | — | 75 | — | 146 | — | — | — | 75 | 146 | Maturity | 15.25% | 15.25% | |||||||||||||||||||||||||||||||||
| — | Alto Parana S.A. | Argentine Pesos |
Banco Galicia- Argentina | — | 469 | 468 | — | — | — | — | 469 | 468 | Maturity | 15.25% | 15.25% | |||||||||||||||||||||||||||||||||
| — | Zona Franca Punta Pereira |
U.S. Dollar | Interamerican Development Bank |
128 | — | 6,281 | 7,123 | 7,095 | 7,115 | 6,551 | 128 | 34,164 | Maturity | Libor + 1.80% |
Libor + 1.80% | |||||||||||||||||||||||||||||||||
| — | Zona Franca Punta Pereira |
U.S. Dollar | Interamerican Development Bank |
2,189 | — | 5,096 | 4,866 | 4,637 | 4,407 | 15,324 | 2,189 | 34,330 | Maturity | Libor + 2.05% |
Libor + 2.05% | |||||||||||||||||||||||||||||||||
| — | Celulosa y Energia Punta Pereira |
U.S. Dollar | Finnish Export Credit | 48,487 | — | 70,569 | 67,723 | 64,876 | 62,030 | 194,683 | 48,487 | 459,882 | semmiannual | 3.20% | 3.20% | |||||||||||||||||||||||||||||||||
| — | Celulosa y Energia Punta Pereira |
U.S. Dollar | Interamerican Development bank | 6,267 | — | 10,612 | 10,382 | 10,153 | 9,923 | 37,397 | 6,267 | 78,467 | semmiannual | Libor + 2.05% |
Libor + 2.05% | |||||||||||||||||||||||||||||||||
| — | Celulosa y Energia Punta Pereira |
U.S. Dollar | Interamerican Development bank | 645 | — | 20,273 | 21,115 | 21,087 | 21,107 | 20,545 | 645 | 104,126 | semmiannual | Libor + 1.80% |
Libor + 1.80% | |||||||||||||||||||||||||||||||||
| — | Celulosa y Energia Punta Pereira |
U.S. Dollar | Dnb Nor Bank | 324 | — | — | — | — | — | — | 324 | — | Maturity | Libor + 2.05% |
Libor + 2.05% | |||||||||||||||||||||||||||||||||
| — | Eufores S.A. | U.S. Dollar | Banco BBVA - Uruguay | 9,119 | 3,015 | — | — | — | — | — | 12,134 | — | Maturity | Libor + 2.00% |
Libor + 2.00% | |||||||||||||||||||||||||||||||||
| — | Eufores S.A. | U.S. Dollar | Banco Republica Oriental de Uruguay |
10,110 | 25,088 | — | — | — | — | — | 35,198 | — | Maturity | Libor + 1.75% |
Libor + 1.75% | |||||||||||||||||||||||||||||||||
| — | Eufores S.A. | U.S. Dollar | Citibank | — | 2,505 | — | — | — | — | — | 2,505 | — | Maturity | Libor + 2.00% |
Libor + 2.00% | |||||||||||||||||||||||||||||||||
| — | Eufores S.A. | U.S. Dollar | Banco HSBC- Uruguay | 1,201 | — | — | — | — | — | — | 1,201 | — | Maturity | Libor + 2.00% |
Libor + 2.00% | |||||||||||||||||||||||||||||||||
| — | Eufores S.A. | U.S. Dollar | Banco Itau -Uruguay | 5,062 | 5,003 | — | — | — | — | — | 10,065 | — | Maturity | Libor + 2.00% |
Libor + 2.00% | |||||||||||||||||||||||||||||||||
| — | Eufores S.A. | U.S. Dollar | Heritage | — | 1,356 | — | — | — | — | — | 1,356 | — | Maturity | Libor + 2.00% |
Libor + 2.00% | |||||||||||||||||||||||||||||||||
| — | Eufores S.A. | U.S. Dollar | Banco Santander | — | 20,111 | — | — | — | 20,111 | — | Maturity | Libor + 2.00% |
Libor + 2.00% | |||||||||||||||||||||||||||||||||||
| — | Arauco Do Brasil S.A. |
Real | Banco ABC | 32 | — | 1 | 62 | — | — | — | 32 | 63 | Maturity | 2.50% | 2.50% | |||||||||||||||||||||||||||||||||
| — | Arauco Do Brasil S.A. |
Real | Banco Bradesco | 101 | — | — | — | — | — | — | 101 | — | Maturity | 8.70% | 8.70% | |||||||||||||||||||||||||||||||||
| — | Arauco Do Brasil S.A. |
Real | Banco Bradesco | 2,266 | 3,220 | — | — | — | — | — | 5,486 | — | Maturity | 5.50% | 5.50% | |||||||||||||||||||||||||||||||||
| — | Arauco Do Brasil S.A. |
Real | Banco do Brasil - Brasil | 140 | — | 177 | 17 | 1 | — | — | 140 | 196 | Maturity | 8.70% | 8.70% | |||||||||||||||||||||||||||||||||
| — | Arauco Do Brasil S.A. |
Real | Banco do Brasil - Brasil | — | 6,473 | — | — | — | — | — | 6,473 | — | Maturity | 9.80% | 9.80% | |||||||||||||||||||||||||||||||||
| — | Arauco Do Brasil S.A. |
Real | Banco HSBC- Brasil | 37 | — | — | — | — | — | — | 37 | — | Maturity | 5.50% | 5.50% | |||||||||||||||||||||||||||||||||
| — | Arauco Do Brasil S.A. |
Real | Banco HSBC- Brasil | 136 | — | 11,319 | — | — | — | — | 136 | 11,319 | Maturity | 8.00% | 8.00% | |||||||||||||||||||||||||||||||||
| — | Arauco Do Brasil S.A. |
Real | Banco Itau -Brasil | 28 | — | — | — | — | — | — | 28 | — | Monthly | 4.50% | 4.50% | |||||||||||||||||||||||||||||||||
| — | Arauco Do Brasil S.A. |
Real | Banco Itau -Brasil | 26 | — | 6 | — | — | — | — | 26 | 6 | Maturity | 5.50% | 5.50% | |||||||||||||||||||||||||||||||||
| — | Arauco Do Brasil S.A. |
Real | Banco Itau -Brasil | 253 | — | 183 | 26 | 1 | — | — | 253 | 210 | Maturity | 8.70% | 8.70% | |||||||||||||||||||||||||||||||||
| — | Arauco Do Brasil S.A. |
U.S. Dollar | Banco JP Morgan | — | 8,972 | — | — | — | — | — | 8,972 | — | Maturity | 1.41% | 1.41% | |||||||||||||||||||||||||||||||||
| — | Arauco Do Brasil S.A. |
Real | Banco Santander | 166 | — | 18,865 | — | — | — | — | 166 | 18,865 | Maturity | 8.00% | 8.00% | |||||||||||||||||||||||||||||||||
| — | Arauco Do Brasil S.A. |
Real | Banco Votorantim - Brasil | 50 | — | 32 | 5 | — | — | — | 50 | 37 | Maturity | 8.70% | 8.70% | |||||||||||||||||||||||||||||||||
| — | Arauco Do Brasil S.A. |
Real | Banco Votorantim - Brasil | 62 | — | 14 | 114 | — | — | — | 62 | 128 | Maturity | 5.50% | 5.50% | |||||||||||||||||||||||||||||||||
| — | Arauco Do Brasil S.A. |
Real | Fdo. Desenvolvimiento Econom. - Brasil |
51 | — | — | 62 | — | — | — | 51 | 62 | Monthly | 0.00% | 0.00% | |||||||||||||||||||||||||||||||||
| — | Arauco Florestal Arapoti S.A. |
Real | Banco Itau | 12 | — | 1 | 1 | 26 | — | — | 12 | 28 | Maturity | 2.50% | 2.50% | |||||||||||||||||||||||||||||||||
| — | Arauco Florestal Arapoti S.A. |
Real | Banco Itau | 56 | — | — | — | — | 172 | — | 56 | 172 | Maturity | 3.50% | 3.50% | |||||||||||||||||||||||||||||||||
| — | Arauco Florestal Arapoti S.A. |
Real | Banco Itau | 7 | — | — | — | — | 23 | — | 7 | 23 | Maturity | 3.50% | 3.50% | |||||||||||||||||||||||||||||||||
111
Table of Contents
CELULOSA ARAUCO Y CONSTITUCION S.A.
AND SUBSIDIARIES
Unaudited Consolidated Financial Statements
December 31, 2015
Amounts in thousands of U.S. dollars, except as indicated
| — |
Arauco Florestal Arapoti S.A. |
Real | Banco Bradesco |
11,825 | — | — | — | — | 93 | — | 11,825 | 93 | Maturity | 5.50 | % | 5.50% | ||||||||||||||||||||||||||||||||||
| — |
Arauco Florestal Arapoti S.A. |
Real | Banco Votorantim |
— | 6 | 107 | 78 | 14 | — | 463 | 6 | 662 | Maturity | 0.50 | % | 0.50% | ||||||||||||||||||||||||||||||||||
| — |
Arauco Florestal Arapoti S.A. |
Real | Banco Safra | 109 | — | — | — | — | 350 | — | 109 | 350 | Maturity | 0.60 | % | 0.60% | ||||||||||||||||||||||||||||||||||
| — |
Arauco Forest Brasil S.A. |
Real | Banco Bradesco |
— | 7,430 | — | — | — | — | — | 7,430 | — | Maturity | 5.50 | % | 5.50% | ||||||||||||||||||||||||||||||||||
| — |
Arauco Forest Brasil S.A. |
Real | Banco Bradesco |
— | 10,369 | — | — | — | — | — | 10,369 | — | Maturity | 6.50 | % | 6.50% | ||||||||||||||||||||||||||||||||||
| — |
Arauco Forest Brasil S.A. |
Real | Banco Bradesco |
70 | — | — | 429 | — | 316 | — | 70 | 745 | Maturity | 6.00 | % | 6.00% | ||||||||||||||||||||||||||||||||||
| — |
Arauco Forest Brasil S.A. |
Real | Banco Itau - Brasil |
158 | — | 13 | 41 | — | — | — | 158 | 54 | Maturity | 4.75 | % | 4.75% | ||||||||||||||||||||||||||||||||||
| — |
Arauco Forest Brasil S.A. |
Real | Banco Votorantim - Brasil |
46 | — | 107 | 78 | 14 | 2,508 | — | 46 | 2,707 | Monthly | 8.80 | % | 8.80% | ||||||||||||||||||||||||||||||||||
| — |
Arauco Forest Brasil S.A. |
U.S. Dollar | Banco Votorantim - Brasil |
6 | — | 12 | 5 | — | 403 | — | 6 | 420 | Maturity | 3.30 | % | 3.30% | ||||||||||||||||||||||||||||||||||
| — |
Arauco Forest Brasil S.A. |
Real | Banco Votorantim - Brasil |
— | 6 | 107 | 78 | 14 | — | 311 | 6 | 510 | Maturity | 5.00 | % | 5.00% | ||||||||||||||||||||||||||||||||||
| — |
Arauco Forest Brasil S.A. |
Real | Bndes Subcrédito A |
— | 2 | 276 | 276 | 276 | 276 | 1,318 | 2 | 2,424 | Maturity | 7.91 | % | 7.91% | ||||||||||||||||||||||||||||||||||
| — |
Arauco Forest Brasil S.A. |
Real | Bndes Subcrédito B |
— | 1 | 187 | 187 | 187 | 187 | 853 | 1 | 1,601 | Maturity | 8.91 | % | 8.91% | ||||||||||||||||||||||||||||||||||
| — |
Arauco Forest Brasil S.A. |
U.S. Dollar | Bndes Subcrédito C |
4 | — | 89 | 89 | 89 | 89 | 555 | 4 | 909 | Maturity | 6.55 | % | 6.55% | ||||||||||||||||||||||||||||||||||
| — |
Arauco Forest Brasil S.A. |
Real | Bndes Subcrédito D |
1 | — | 235 | 235 | 235 | 235 | 1,032 | 1 | 1,974 | Maturity | 10.11 | % | 10.11% | ||||||||||||||||||||||||||||||||||
| — |
Arauco Forest Brasil S.A. |
Real | Banco do Brasil - Brasil |
1,145 | — | — | — | — | — | — | 1,145 | — | Maturity | 9.80 | % | 9.80% | ||||||||||||||||||||||||||||||||||
| — |
Arauco Forest Brasil S.A. |
Real | Banco John Deere |
305 | — | — | — | — | — | 305 | — | Maturity | 6.00 | % | 6.00% | |||||||||||||||||||||||||||||||||||
| — |
Mahal Emprendimientos Pat. S.A. |
Real | Bndes Subcrédito E-I |
24 | — | 537 | 537 | 537 | 537 | 8,912 | 24 | 11,058 | Maturity | 7.91 | % | 7.91% | ||||||||||||||||||||||||||||||||||
| — |
Mahal Emprendimientos Pat. S.A. |
Real | Bndes Subcrédito F-J |
17 | — | 363 | 363 | 363 | 363 | 5,469 | 17 | 6,919 | Maturity | 8.91 | % | 8.91% | ||||||||||||||||||||||||||||||||||
| — |
Mahal Emprendimientos Pat. S.A. |
U.S. Dollar | Bndes Subcrédito G-K |
61 | — | 172 | 172 | 172 | 172 | 4,589 | 61 | 5,276 | Maturity | 6.55 | % | 6.55% | ||||||||||||||||||||||||||||||||||
| — |
Mahal Emprendimientos Pat. S.A. |
Real | Bndes Subcrédito H-L |
22 | — | 457 | 457 | 457 | 457 | 6,240 | 22 | 8,069 | Maturity | 10.11 | % | 10.11% | ||||||||||||||||||||||||||||||||||
|
|
|
|
|
|
|
|
|
|
|
|
|
|
|
|
|
|
|
|||||||||||||||||||||||||||||||||
| Total | 139,916 | 133,554 | 531,856 | 175,310 | 110,288 | 110,762 | 304,242 | 273,470 | 1,232,458 | |||||||||||||||||||||||||||||||||||||||||
|
|
|
|
|
|
|
|
|
|
|
|
|
|
|
|
|
|
|
| Maturity | Total | |||||||||||||||||||||||||||||||||||||||||||||||||
| Tax ID |
Name | Currency | Name Country Bonds |
To 3 months ThU.S.$ |
3 to 12 months ThU.S.$ |
1 to 2 Years ThU.S.$ |
2 to 3 Years ThU.S.$ |
3 to 4 Years ThU.S.$ |
4 to 5 Years ThU.S.$ |
More than 5 Years ThU.S.$ |
Current ThU.S.$ |
Non Current ThU.S.$ |
Type Amortization |
Effective Rate |
Nominal Rate | |||||||||||||||||||||||||||||||||||
| 93.458.000-1 |
Celulosa Arauco y Constitución S.A. | UF | Barau-F | — | 1,992 | 11,949 | 11,949 | 11,949 | 36,494 | 305,191 | 1,992 | 377,534 | (i) semmiannual; (k) maturity |
4.24 | % | 4.25% | ||||||||||||||||||||||||||||||||||
| 93.458.000-2 |
Celulosa Arauco y Constitución S.A. | UF | Barau-J | 2,181 | — | 9,160 | 9,160 | 9,160 | 9,160 | 211,959 | 2,181 | 248,599 | (i) semmiannual; (k) maturity |
3.23 | % | 3.22% | ||||||||||||||||||||||||||||||||||
| 93.458.000-3 |
Celulosa Arauco y Constitución S.A. | UF | Barau-P | — | 1,027 | 8,038 | 8,038 | 8,038 | 8,038 | 262,316 | 1,027 | 294,469 | (i) semmiannual; (k) maturity |
3.96 | % | 3.96% | ||||||||||||||||||||||||||||||||||
| 93.458.000-3 |
Celulosa Arauco y Constitución S.A. | UF | Barau-Q | 604 | — | 2,417 | 12,676 | 22,482 | 21,878 | 31,683 | 604 | 91,137 | (i) semmiannual; (k) maturity |
2.98 | % | 2.98% | ||||||||||||||||||||||||||||||||||
| 93.458.000-3 |
Celulosa Arauco y Constitución S.A. | UF | Barau-R | 1,810 | — | 7,241 | 7,241 | 7,241 | 7,241 | 314,074 | 1,810 | 343,039 | (i) semmiannual; (k) maturity |
3.58 | % | 3.57% | ||||||||||||||||||||||||||||||||||
| — |
Alto Paraná S.A. | U.S. Dollar |
Bono 144 A - Argentina |
— | 1,004 | 17,213 | 277,349 | — | — | — | 1,004 | 294,562 | (i) semmiannual; (k) maturity |
6.39 | % | 6.38% | ||||||||||||||||||||||||||||||||||
| 93.458.000-1 |
Celulosa Arauco y Constitución S.A. | U.S. Dollar |
Yankee Bonds 2019 |
15,205 | — | 36,250 | 36,250 | 36,250 | 532,713 | — | 15,205 | 641,463 | (i) semmiannual; (k) maturity |
7.26 | % | 7.25% | ||||||||||||||||||||||||||||||||||
| 93.458.000-1 |
Celulosa Arauco y Constitución S.A. | U.S. Dollar |
Yankee Bonds 2a Emisión |
2,734 | — | 9,375 | 134,189 | — | — | — | 2,734 | 143,564 | (i) semmiannual; (k) maturity |
7.50 | % | 7.50% | ||||||||||||||||||||||||||||||||||
| 93.458.000-1 |
Celulosa Arauco y Constitución S.A. | U.S. Dollar |
Yankee Bonds 6a Emisión |
— | 373,848 | — | — | — | — | — | 373,848 | — | (i) semmiannual; (k) maturity |
5.64 | % | 5.63% | ||||||||||||||||||||||||||||||||||
| 93.458.000-1 |
Celulosa Arauco y Constitución S.A. | U.S. Dollar |
Yankee 2021 | 8,889 | — | 20,000 | 20,000 | 20,000 | 20,000 | 425,291 | 8,889 | 505,291 | (i) semmiannual; (k) maturity |
5.02 | % | 5.00% | ||||||||||||||||||||||||||||||||||
| 93.458.000-1 |
Celulosa Arauco y Constitución S.A. | U.S. Dollar |
Yankee 2022 | 11,215 | — | 23,750 | 23,750 | 23,750 | 23,750 | 549,617 | 11,215 | 644,617 | (i) semmiannual; (k) maturity |
4.77 | % | 4.75% | ||||||||||||||||||||||||||||||||||
| 93.458.000-1 |
Celulosa Arauco y Constitución S.A. | U.S. Dollar |
Yankee 2024 | 9,937 | — | 22,500 | 22,500 | 22,500 | 22,500 | 601,109 | 9,937 | 691,109 | (i) semmiannual; (k) maturity |
4.52 | % | 4.50% | ||||||||||||||||||||||||||||||||||
| 93.458.000-1 |
Celulosa Arauco y Constitución S.A. | UF | Barau-F | — | 1,992 | 11,949 | 11,949 | 11,949 | 36,494 | 305,191 | 1,992 | 377,534 | (i) semmiannual; (k) maturity |
4.24 | % | 4.25% | ||||||||||||||||||||||||||||||||||
|
|
|
|
|
|
|
|
|
|
|
|
|
|
|
|
|
|
|
|||||||||||||||||||||||||||||||||
| Total | 52,575 | 377,871 | 167,894 | 563,104 | 161,371 | 681,774 | 2,701,241 | 430,446 | 4,275,384 | |||||||||||||||||||||||||||||||||||||||||
|
|
|
|
|
|
|
|
|
|
|
|
|
|
|
|
|
|
|
|||||||||||||||||||||||||||||||||
112
Table of Contents
CELULOSA ARAUCO Y CONSTITUCION S.A.
AND SUBSIDIARIES
Unaudited Consolidated Financial Statements
December 31, 2015
Amounts in thousands of U.S. dollars, except as indicated
| Maturity | Total | |||||||||||||||||||||||||||||||||||||||||||||||||||||||
| Tax ID |
Name | Currency | Name Country Other Loans |
To 3 months ThU.S.$ |
3 to 12 months ThU.S.$ |
1 to 2 Years ThU.S.$ |
2 to 3 Years ThU.S.$ |
3 to 4 Years ThU.S.$ |
4 to 5 Years ThU.S.$ |
More than 5 Years ThU.S.$ |
Current ThU.S.$ |
Non Current ThU.S.$ |
Type Amortization |
Effective Rate |
Nominal Rate |
|||||||||||||||||||||||||||||||||||||||||
| — |
Flakeboard Company Limited | U.S. Dollar | Business New Brunswick | — | 3,785 | — | — | — | — | — | 3,785 | — | Maturity | — | 4.30 | % | ||||||||||||||||||||||||||||||||||||||||
| — |
Flakeboard Company Limited | U.S. Dollar | SSM EDC | — | 108 | — | — | — | — | — | 108 | — | Maturity | — | 1.80 | % | ||||||||||||||||||||||||||||||||||||||||
|
|
|
|
|
|
|
|
|
|
|
|
|
|
|
|
|
|
|
|||||||||||||||||||||||||||||||||||||||
| Total | 0 | 3,893 | 0 | 0 | 0 | 0 | 0 | 3,893 | 0 | |||||||||||||||||||||||||||||||||||||||||||||||
|
|
|
|
|
|
|
|
|
|
|
|
|
|
|
|
|
|
|
|||||||||||||||||||||||||||||||||||||||
| Maturity | Total | |||||||||||||||||||||||||||||||||||||||||||||||||||
| Tax ID |
Name | Currency | Name Country Lease |
To 3 months ThU.S.$ |
3 to 12 months ThU.S.$ |
1 to 2 Years ThU.S.$ |
2 to 3 Years ThU.S.$ |
3 to 4 Years ThU.S.$ |
4 to 5 Years ThU.S.$ |
More than 5 Years ThU.S.$ |
Current ThU.S.$ |
Non Current ThU.S.$ |
Type Amortization |
Effective Rate |
Nominal Rate |
|||||||||||||||||||||||||||||||||||||
| 85.805.200-9 |
Forestal Celco S.A. | UF | Banco Santander | 979 | 2,089 | 883 | 883 | 485 | — | — | 3,068 | 2,250 | Monthly | — | — | |||||||||||||||||||||||||||||||||||||
| 85.805.200-9 |
Forestal Celco S.A. | UF | Banco Scotiabank | 982 | 2,945 | 3,897 | 3,897 | 3,108 | — | — | 3,927 | 10,902 | Monthly | — | — | |||||||||||||||||||||||||||||||||||||
| 85.805.200-9 |
Forestal Celco S.A. | UF | Banco Estado | 259 | 777 | 1,024 | 1,024 | 1,789 | — | — | 1,036 | 3,836 | Monthly | — | — | |||||||||||||||||||||||||||||||||||||
| 85.805.200-9 |
Forestal Celco S.A. | UF | Banco de Chile | 3,241 | 9,904 | 9,011 | 9,011 | 7,097 | — | — | 13,145 | 25,119 | Monthly | — | — | |||||||||||||||||||||||||||||||||||||
| 85.805.200-9 |
Forestal Celco S.A. | UF | Banco BBVA | 2,102 | 7,325 | 6,822 | 6,822 | 7,187 | — | — | 9,427 | 20,830 | Monthly | — | — | |||||||||||||||||||||||||||||||||||||
| 85.805.200-9 |
Forestal Celco S.A. | Chilean Pesos | Banco Santander | 222 | 609 | 799 | 799 | 557 | — | — | 831 | 2,154 | Monthly | — | — | |||||||||||||||||||||||||||||||||||||
| 85.805.200-9 |
Forestal Celco S.A. | Chilean Pesos | Banco Chile | 66 | 200 | 88 | 88 | 23 | — | — | 266 | 198 | Monthly | — | — | |||||||||||||||||||||||||||||||||||||
| — |
Arauco Colombia S.A. | U.S. Dollar | Banco BBVA | — | 3 | — | — | — | — | 3 | — | Monthly | — | — | ||||||||||||||||||||||||||||||||||||||
| 85.805.200-9 |
Forestal Celco S.A. | UF | Banco Santander | — | 3 | — | — | — | — | 3 | — | Monthly | — | — | ||||||||||||||||||||||||||||||||||||||
|
|
|
|
|
|
|
|
|
|
|
|
|
|
|
|
|
|
|
|||||||||||||||||||||||||||||||||||
| Total | 7,851 | 23,855 | 22,522 | 22,522 | 20,246 | 0 | 0 | 31,706 | 65,289 | |||||||||||||||||||||||||||||||||||||||||||
|
|
|
|
|
|
|
|
|
|
|
|
|
|
|
|
|
|
|
|||||||||||||||||||||||||||||||||||
113
Table of Contents
CELULOSA ARAUCO Y CONSTITUCION S.A.
AND SUBSIDIARIES
Unaudited Consolidated Financial Statements
December 31, 2015
Amounts in thousands of U.S. dollars, except as indicated
Guarantees
As of the date of these consolidated financial statements, Arauco has financial assets of approximately ThU.S.$49 that have been pledged to third parties (beneficiaries), as direct guarantee. If Arauco does not fulfill its obligations, the guarantors could execute the guarantees.
As of December 31, 2015, the total assets pledged as an indirect guarantee were ThU.S.$853. In contrast to direct guarantees, indirect guarantees are given to secure obligations assumed by a third party.
On September 29, 2011, Arauco entered into a Security Agreement under which it granted a non-joint guarantee limited to 50% of the obligations of the Uruguayan companies (joint ventures) Celulosa y Energía Punta Pereira S.A. and Zona Franca Punta Pereira S.A., under the IDB Facility Agreement in the amount of up to ThU.S.$454,000 and the Finnevera Guaranteed Facility Agreement in the amount of up to ThU.S.$900,000. Both loan agreements were signed with the International Development Bank. Such guarantee is included in the table below, under indirect guarantees.
Direct and indirect guarantees granted by Arauco:
| DIRECT | ||||||||||
| Subsidiary |
Guarantee |
Assets Pledged |
Currency |
ThU.S.$ |
Guarantor | |||||
| Celulosa Arauco y Constitución S.A. |
Guarantee letter | — | Chilean Pesos | 230 | Directorate General of Maritime Territory and Merchant Marine | |||||
| Celulosa Arauco y Constitución S.A. |
Guarantee letter | — | Chilean Pesos | 313 | Directorate General of Maritime Territory and Merchant Marine | |||||
| Celulosa Arauco y Constitución S.A. |
Guarantee letter | — | Chilean Pesos | 114 | Directorate General of Maritime Territory and Merchant Marine | |||||
| Arauco Forest Brasil S.A. |
Equipment | Property plant and equipment | U.S. Dollar | 246 | Banco Itaú BBA S.A. | |||||
| Arauco Forest Brasil S.A. |
Endorsement of ADB + Guarantee Letter AISA | — | U.S. Dollar | 2,306 | Banco Votorantim S.A. | |||||
| Arauco Forest Brasil S.A. |
Endorsement of ADB | — | U.S. Dollar | 768 | Banco Votorantim S.A. | |||||
| Arauco Forest Brasil S.A. |
Mortgage Industrial Plant of Jaguariaíva of Arauco do Brasil | Property plant and equipment | U.S. Dollar | 39,262 | BNDES | |||||
| Arauco Forest Brasil S.A. |
Equipment | Property plant and equipment | U.S. Dollar | 114 | Banco Bradesco S.A. | |||||
| Arauco Forest Brasil S.A. |
Equipment | Property plant and equipment | U.S. Dollar | 617 | Banco John Deere S.A. | |||||
| Arauco Forest Brasil S.A. |
Equipment | Property plant and equipment | U.S. Dollar | 117 | Banco Santander S.A. | |||||
| Arauco Forest Brasil S.A. |
Endorsement of Arauco do Brasil | — | U.S. Dollar | 768 | Banco Votorantim S.A. | |||||
| Arauco do Brasil S.A. |
Equipamiento | Property plant and equipment | U.S. Dollar | 136 | Banco Votorantim S.A. | |||||
| Arauco do Brasil S.A. |
Equipamiento | Property plant and equipment | U.S. Dollar | 853 | Banco Itaú BBA S.A. | |||||
| Arauco do Brasil S.A. |
Equipamiento | Property plant and equipment | U.S. Dollar | 379 | Banco do Brasil S.A. | |||||
| Arauco do Brasil S.A. |
Equipamiento | Property plant and equipment | U.S. Dollar | 168 | Banco Votorantim S.A. | |||||
| Arauco do Brasil S.A. |
Equipamiento | Property plant and equipment | U.S. Dollar | 327 | Banco ABC Brasil S.A. | |||||
| Arauco do Brasil S.A. |
Equipamiento | Property plant and equipment | U.S. Dollar | 177 | Banco Santander S.A. | |||||
| Arauco Florestal Arapoti S.A. |
Equipamiento | Property plant and equipment | U.S. Dollar | 171 | Banco Itaú BBA S.A. | |||||
| Arauco Florestal Arapoti S.A. |
Equipment | Property plant and equipment | U.S. Dollar | 329 | Banco Safra S.A. | |||||
| Arauco Florestal Arapoti S.A. |
Equipment | Property plant and equipment | U.S. Dollar | 768 | Banco Votorantim S.A. | |||||
| Arauco Bioenergía S.A. |
Endorsement of Arauco do Brasil | — | Chilean Pesos | 483 | Minera Escondida Ltda. | |||||
| Arauco Bioenergía S.A. |
Guarantee letter | — | Chilean Pesos | 221 | Minera Spence S.A | |||||
| Arauco Bioenergía S.A. |
Guarantee letter | — | Chilean Pesos | 121 | CODELCO S.A. | |||||
| Total | 48,988 | |||||||||
|
|
||||||||||
| INDIRECT | ||||||||||
| Subsidiary |
Guarantee |
Assets Pledged |
Currency |
ThU.S.$ |
Guarantor | |||||
| Celulosa Arauco y Constitución S.A. |
Suretyship not supportive and cumulative | — | U.S. Dollar | 566,474 | Joint Ventures (Uruguay) | |||||
| Celulosa Arauco y Constitución S.A. |
Full Guarantee | — | U.S. Dollar | 270,000 | Arauco Argentina (bondholders) | |||||
| Celulosa Arauco y Constitución S.A. |
Guarantee Letter | — | Brazilian Real | 16,419 | Arauco Forest Brasil y Mahal (Brasil) | |||||
| Total |
852,893 | |||||||||
|
|
||||||||||
114
Table of Contents
CELULOSA ARAUCO Y CONSTITUCION S.A.
AND SUBSIDIARIES
Unaudited Consolidated Financial Statements
December 31, 2015
Amounts in thousands of U.S. dollars, except as indicated
23.12.3 Type of Risk: Market Risk – Exchange Rate
Description
Market risk arises from the probability of being affected by losses from fluctuations in currencies exchange rates in which assets and liabilities are denominated, in a functional currency other than the functional currency of Arauco.
Explanation of Currency Risk Exposure and How This Risk Arises
Arauco is exposed to the foreign currency risk from currency fluctuations arising from sales, purchases and obligations undertaken in foreign currencies, such as the Chilean Peso, Euro, Brazilian Real or other foreign currencies. In the case of significant exchange rate variations, the Chilean Peso is the currency that represents the main currency risk. See Note 11 for details assets and liabilities classified by currency.
Explanation of Risk Management Objectives, Policies and Processes, and Measurement Methods
Arauco performs sensitivity analyses to measure the currency risk over the EBITDA and Net Income.
Sensitivity analysis considers a variation of +/- 10% of the exchange rate over the Chilean Peso. This fluctuation range is considered possible given current market conditions as of the date of these financial statements. With all other variables at a constant rate, a U.S. Dollar exchange rate variation of +/- 10% in relation to the Chilean Peso would mean a change in the net income after tax +/- 4.09% (equivalent to ThU.S.$ +/- 15,301), and +/- 0.13% of equity (equivalent to ThU.S.$ +/- 9.181).
Additionally, a sensitivity analysis is carried out assuming a variation of +/- 10% in the closing exchange rate on the Brazilian Real, which is considered a possible range of fluctuation given the market conditions as of the date of these financial statements. With all the other variables constant, a variation of +/- 10% in the exchange rate of the dollar on the Brazilian Real would mean a variation on the net income after tax +/- 0.43% (equivalent to ThU.S.$2,087) and a change on the equity of +/- 0.02% (equivalent to ThU.S.$1,252).
23.12.4 Type of Risk: Market Risk – Interest rate risk
Description
Interest rate risk refers to the sensitivity of the value of financial assets and liabilities in terms of interest rate fluctuations.
Explanation of Interest Rate Risk Exposure and How This Risk Arises
Arauco is exposed to risks due to interest rate fluctuations for bonds issued, bank borrowings and financial instruments that bear interest at a variable rate.
115
Table of Contents
CELULOSA ARAUCO Y CONSTITUCION S.A.
AND SUBSIDIARIES
Unaudited Consolidated Financial Statements
December 31, 2015
Amounts in thousands of U.S. dollars, except as indicated
Explanation of Risk Management Objectives, Policies and Processes, and Measurement Methods
Arauco completes its risk analysis by reviewing its exposure to changes in interest rates. As of December 31, 2015, 14.3% of the Company’s bonds and bank loans bear interest at variable rates. A change of +/- 10% in the interest rate is considered a possible range of fluctuation. Such market conditions would affect the income after tax at rate of +/- 0.013% (equivalent to ThU.S.$-/+ 48) and +/- 0.0004% (equivalent to ThU.S.$-/+ 29) on equity.
| Thousands of dollars | December 2015 | Total | ||||||
| Fixed rate |
3,689,719 | 85.7 | % | |||||
| Bonds issued |
3,180,334 | |||||||
| Bank borrowings (*) |
381,826 | |||||||
| Government loans |
0 | |||||||
| Financial leasing |
127,559 | |||||||
| Variable rate |
615,716 | 14.3 | % | |||||
| Bonds issued |
— | |||||||
| Loans with Banks |
615,716 | |||||||
| Total |
4,305,435 | 100.0 | % | |||||
|
|
|
|
|
|||||
| Thousands of dollars | December 2014 | Total | ||||||
| Fixed rate |
4,244,146 | 83.6 | % | |||||
| Bonds issued |
3,658,327 | |||||||
| Bank borrowings (*) |
484,931 | |||||||
| Government Loans |
3,893 | |||||||
| Financial leasing |
96,995 | |||||||
| Variable rate |
834,284 | 16.4 | % | |||||
| Bonds issued |
— | |||||||
| Loans with Banks |
834,284 | |||||||
| Total |
5,078,430 | 100.0 | % | |||||
|
|
|
|
|
|||||
| (*) | Includes variable rate bank borrowings changed by fixed rate swaps. |
116
Table of Contents
CELULOSA ARAUCO Y CONSTITUCION S.A.
AND SUBSIDIARIES
Unaudited Consolidated Financial Statements
December 31, 2015
Amounts in thousands of U.S. dollars, except as indicated
23.12.5 Type of Risk: Market Risk – Price of Pulp Risks
Description
Pulp prices are determined by world and regional market conditions. Prices fluctuate based on demand, production capacity, commercial strategies adopted by large-scale forestry companies, pulp and paper producers and by the availability of substitutes.
Explanation of Price Risk Exposure and How This Risk Arises
Pulp prices are reflected in revenue from sales and directly affect the net income for the period.
As of December 31 2015, revenue due to pulp sales accounted for 44.8% of total sales. Pulp prices are fixed on a monthly basis in accordance with the market. Forward contracts or other financial instruments are not used for pulp sales.
Explanation of Risk Management Objectives, Policies and Processes, and Measurement Methods
This risk is approached in different ways. Arauco has a team of specialists who perform periodic market and competition analyses, providing tools to analyze and evaluate trends and adjust forecasts. Similarly, Arauco performs price financial sensitivity analysis in order to take the necessary safeguards to confront different scenarios in the best possible manner.
Sensitivity analysis considers a variation of +/- 10% in the average pulp price, a possible fluctuation range given current market conditions at the date of the closing balance. With all other variables constant, a variation of +/- 10% in the average pulp price would mean an EBITDA annual variation of 15.72% (equivalent to MU.S.$215), on the income after tax and +/- 32.21% (equivalent to MU.S.$170) and +/- 1.47% (equivalent to MU.S.$102) on equity.
117
Table of Contents
CELULOSA ARAUCO Y CONSTITUCION S.A.
AND SUBSIDIARIES
Unaudited Consolidated Financial Statements
December 31, 2015
Amounts in thousands of U.S. dollars, except as indicated
NOTE 24. OPERATING SEGMENTS
The main products that generate revenue for each operating segment are described as follows:
| • | Pulp: The main products sold by this operating segment are long fiber bleached pulp (BSKP), short fiber bleached pulp (BHKP), long fiber raw pulp (UKP), and pulp fluff. |
| • | Panels: The main products sold by this operating segment are plywood panels, MDF panels (medium density fiberboard), Hardboard Panels, PB Panels (agglomerated) and MDF Moldings. |
| • | Sawn Timber: The range of products sold by this operating segment includes different sizes of sawn wood and remanufactured products such as moldings, precut pieces and finger joints. |
| • | Forestry: This operating segment produces and sells sawn logs, pulpable logs, posts and chips made from owned forests of Radiata and Taeda pine, eucalyptus globulus and nitens forests. Additionally, purchases logs and woodchip from third parties, which it sells to its other operating segment. |
Pulp
The Pulp operating segment uses wood exclusively from pine and eucalyptus plantations for the production of different classes of wood cellulose or pulp. Bleached pulp is mainly used as raw material for producing printing and writing paper, as well as toilet paper and high quality wrapping paper. Unbleached pulp is used to produce packing paper, filters, fiber cement products, dielectric paper and others. On the other hand, fluff pulp is mainly used in the production of diapers and female hygiene products.
Arauco has seven plants, five in Chile, one in Argentina and one in Uruguay and they have a total production capacity of approximately 3.9 million tons per year. Pulp is sold in more than 45 countries, mainly in Asia and Europe.
Panels
The Panels operating segment produces a wide range of panel products and several kinds of moldings aimed at the furniture, decoration and construction industries. It consists of 17 industrial plants: 5 in Chile, 2 in Argentina, 2 in Brazil, and 8 plants around USA and Canada. The Company has a total annual production capacity of 6.6 million cubic meters of PBO, MDF, Hardboards, plywood and moldings.
Sawn Timber
The Sawn Timber operating segment produces a wide range of wood and remanufactured products with different kinds of uses and appearances, which include a wide variety of uses in the furniture, packing, construction and refurbishing industries.
With 9 saw mills in operation (8 in Chile and 1 in Argentina), the Company has a production capacity of 3 million cubic meters of sawn wood.
118
Table of Contents
CELULOSA ARAUCO Y CONSTITUCION S.A.
AND SUBSIDIARIES
Unaudited Consolidated Financial Statements
December 31, 2015
Amounts in thousands of U.S. dollars, except as indicated
Furthermore, the Company has 5 remanufacturing plants, 4 in Chile and 1 in Argentina. These plants reprocess sawn wood and produce high quality remanufactured products, such as finger joint and solid moldings as well as precut pieces.
Forestry
The Forestry operating segment is Arauco’s core business. It provides raw materials for all products manufactured and sold by the Company. By directly controlling the growth of the forests to be processed, Arauco guarantees itself quality wood for each of its products.
Arauco holds forestry assets distributed throughout Chile, Argentina, Brazil and Uruguay, reaching 1.6 million hectares, of which 1 million hectares are used for plantations, 395 thousand hectares for native forests, 183 thousand hectares for other uses and 53 thousand hectares are to be planted.
Arauco’s principal plantations consist of radiata and taeda pine and eucalyptus to a lesser degree. These are species that have fast growth rates and short harvest cycles compared with other long fiber commercial woods.
Arauco has no customers representing 10% or more of its revenues.
Below, please find summarized information concerning the assets, liabilities and profits and losses at the end of each period, by segments. The profit (loss) of each segment informed takes into consideration that taxes and income and financial costs have not been allocated to the various segments, and are shown as part of the Corporate’s segment:
119
Table of Contents
CELULOSA ARAUCO Y CONSTITUCION S.A.
AND SUBSIDIARIES
Unaudited Consolidated Financial Statements
December 31, 2015
Amounts in thousands of U.S. dollars, except as indicated
| Year ended December 31, 2015 |
Pulp ThU.S.$ |
Sawn timber ThU.S.$ |
Forestry ThU.S.$ |
Panels ThU.S.$ |
Others ThU.S.$ |
Corporate ThU.S.$ |
Sub Total ThU.S.$ |
Elimination ThU.S.$ |
Total ThU.S.$ |
|||||||||||||||||||||||||||
| Revenues from external customers |
2,363,973 | 785,939 | 116,368 | 1,847,272 | 33,188 | 0 | 5,146,740 | 0 | 5,146,740 | |||||||||||||||||||||||||||
| Revenues from transactions with other operating segments |
43,414 | 343 | 491,703 | 10,330 | 32,543 | 0 | 578,333 | (578,333) | 0 | |||||||||||||||||||||||||||
|
|
|
|
|
|
|
|
|
|
|
|
|
|
|
|
|
|
|
|||||||||||||||||||
| Finance income |
0 | 0 | 0 | 0 | 0 | 50,284 | 50,284 | 0 | 50,284 | |||||||||||||||||||||||||||
| Finance costs |
0 | 0 | 0 | 0 | 0 | (262,962) | (262,962) | 0 | (262,962) | |||||||||||||||||||||||||||
| Net finance costs |
0 | 0 | 0 | 0 | 0 | (212,678) | (212,678) | 0 | (212,678) | |||||||||||||||||||||||||||
|
|
|
|
|
|
|
|
|
|
|
|
|
|
|
|
|
|
|
|||||||||||||||||||
| Depreciation and amortizations |
231,916 | 30,133 | 18,211 | 109,313 | 3,913 | 6,659 | 400,145 | 0 | 400,145 | |||||||||||||||||||||||||||
| Sum of significant income accounts |
31 | 739 | 220,907 | 4,084 | 0 | 0 | 225,761 | 0 | 225,761 | |||||||||||||||||||||||||||
| Sum of significant expense accounts |
585 | 2,662 | 35,610 | 721 | 35 | 0 | 39,613 | 0 | 39,613 | |||||||||||||||||||||||||||
|
|
|
|
|
|
|
|
|
|
|
|
|
|
|
|
|
|
|
|||||||||||||||||||
| Profit (loss) of each reportable segment |
455,190 | 89,156 | 137,829 | 175,317 | 1,815 | (491,596) | 367,711 | 0 | 367,711 | |||||||||||||||||||||||||||
|
|
|
|
|
|
|
|
|
|
|
|
|
|
|
|
|
|
|
|||||||||||||||||||
| Share of profit (loss) of associates and joint ventures accounted for using equity method |
||||||||||||||||||||||||||||||||||||
| Associates |
0 | 0 | 0 | 0 | 0 | 5,572 | 5,572 | 0 | 5,572 | |||||||||||||||||||||||||||
| Joint ventures |
0 | 0 | 0 | (470) | 0 | 1,646 | 1,176 | 0 | 1,176 | |||||||||||||||||||||||||||
|
|
|
|
|
|
|
|
|
|
|
|
|
|
|
|
|
|
|
|||||||||||||||||||
| Income tax expense |
0 | 0 | 0 | 0 | 0 | (129,694) | (129,694) | 0 | (129,694) | |||||||||||||||||||||||||||
|
|
|
|
|
|
|
|
|
|
|
|
|
|
|
|
|
|
|
|||||||||||||||||||
| Geographical information on revenues |
||||||||||||||||||||||||||||||||||||
| Revenue – Chilean entities |
1,913,303 | 724,705 | 68,986 | 601,280 | 597 | 0 | 3,308,871 | 0 | 3,308,871 | |||||||||||||||||||||||||||
| Revenue – Foreign entities |
450,670 | 61,234 | 47,382 | 1,245,992 | 32,591 | 0 | 1,837,869 | 0 | 1,837,869 | |||||||||||||||||||||||||||
| Total Ordinary Income |
2,363,973 | 785,939 | 116,368 | 1,847,272 | 33,188 | 0 | 5,146,740 | 0 | 5,146,740 | |||||||||||||||||||||||||||
|
|
|
|
|
|
|
|
|
|
|
|
|
|
|
|
|
|
|
|||||||||||||||||||
120
Table of Contents
CELULOSA ARAUCO Y CONSTITUCION S.A.
AND SUBSIDIARIES
Unaudited Consolidated Financial Statements
December 31, 2015
Amounts in thousands of U.S. dollars, except as indicated
| Year ended December 31, 2015 |
Pulp ThU.S.$ |
Sawn timber ThU.S.$ |
Forestry ThU.S.$ |
Panels ThU.S.$ |
Others ThU.S.$ |
Corporate ThU.S.$ |
Sub Total ThU.S.$ |
Elimination ThU.S.$ |
Total ThU.S.$ |
|||||||||||||||||||||||||||
| Amounts of additions to non-current assets (*) |
||||||||||||||||||||||||||||||||||||
| Acquisition of property,plant and equipment and biological assets |
199,094 | 14,059 | 155,872 | 80,132 | 1,754 | 7,001 | 457,912 | 0 | 457,912 | |||||||||||||||||||||||||||
| Acquisition and contribution of investments in associates and joint venture |
0 | 0 | 814 | 0 | 0 | 0 | 814 | 0 | 814 | |||||||||||||||||||||||||||
|
|
|
|
|
|
|
|
|
|
|
|
|
|
|
|
|
|
|
|||||||||||||||||||
| Year ended December 31, 2015 |
Pulp ThU.S.$ |
Sawn timber ThU.S.$ |
Forestry ThU.S.$ |
Panels ThU.S.$ |
Others ThU.S.$ |
Corporate ThU.S.$ |
Sub Total ThU.S.$ |
Elimination ThU.S.$ |
Total ThU.S.$ |
|||||||||||||||||||||||||||
| Segment assets |
5,172,095 | 125,446 | 5,471,322 | 2,248,688 | 31,679 | 806,219 | 13,855,449 | (48,542) | 13,806,907 | |||||||||||||||||||||||||||
| Segments assets (excluding deferred tax assets) |
5,172,095 | 125,446 | 5,471,322 | 2,248,688 | 31,679 | 665,968 | 13,715,198 | (48,542) | 13,666,656 | |||||||||||||||||||||||||||
| Deferred tax assets |
0 | 0 | 0 | 0 | 0 | 140,251 | 140,251 | 0 | 140,251 | |||||||||||||||||||||||||||
| Investments accounted through equity method |
||||||||||||||||||||||||||||||||||||
| Associates |
0 | 0 | 121,359 | 0 | 0 | 119,781 | 241,140 | 0 | 241,140 | |||||||||||||||||||||||||||
| Joint Ventures |
0 | 0 | 0 | 3,573 | 0 | 20,099 | 23,672 | 0 | 23,672 | |||||||||||||||||||||||||||
| Segment liabilities |
318,880 | 25,334 | 147,432 | 244,629 | 11,526 | 6,412,661 | 7,160,462 | 0 | 7,160,462 | |||||||||||||||||||||||||||
| Segments liabilities (excluding deferred tax liabilities) |
0 | 0 | 0 | 0 | 0 | 4,657,133 | 5,657,133 | 0 | 4,657,133 | |||||||||||||||||||||||||||
| Deferred tax liabilities |
0 | 0 | 0 | 0 | 0 | 1,755,528 | 1,755,528 | 0 | 1,755,528 | |||||||||||||||||||||||||||
|
|
|
|
|
|
|
|
|
|
|
|
|
|
|
|
|
|
|
|||||||||||||||||||
| Geographical information on non-current assets (**) |
||||||||||||||||||||||||||||||||||||
| Chile |
2,565,307 | 945 | 3,536,372 | 757,991 | 30 | 207,280 | 7,067,925 | (2,955) | 7,064,970 | |||||||||||||||||||||||||||
| Foreign countries |
1,782,286 | 14,902 | 1,348,177 | 721,022 | 23,406 | 200,224 | 4,090,017 | 0 | 4,090,017 | |||||||||||||||||||||||||||
| Non-current assets, Total |
4,347,593 | 15,847 | 4,884,549 | 1,479,013 | 23,436 | 407,504 | 11,157,942 | (2,955) | 11,154,987 | |||||||||||||||||||||||||||
|
|
|
|
|
|
|
|
|
|
|
|
|
|
|
|
|
|
|
|||||||||||||||||||
121
Table of Contents
CELULOSA ARAUCO Y CONSTITUCION S.A.
AND SUBSIDIARIES
Unaudited Consolidated Financial Statements
December 31, 2015
Amounts in thousands of U.S. dollars, except as indicated
| Year ended December 31, 2014 |
Pulp ThU.S.$ |
Sawn timber ThU.S.$ |
Forestry ThU.S.$ |
Panels ThU.S.$ |
Others ThU.S.$ |
Corporate ThU.S.$ |
Sub Total ThU.S.$ |
Elimination ThU.S.$ |
Total ThU.S.$ |
|||||||||||||||||||||||||||
| Revenues from external customers |
2,343,020 | 873,493 | 148,517 | 1,943,711 | 33,902 | 0 | 5,342,643 | 0 | 5,342,643 | |||||||||||||||||||||||||||
| Revenues from transactions with other operating segments |
50,015 | 3 | 457,527 | 10,065 | 34,327 | 0 | 551,937 | (551,937) | 0 | |||||||||||||||||||||||||||
|
|
|
|
|
|
|
|
|
|
|
|
|
|
|
|
|
|
|
|||||||||||||||||||
| Finance income |
0 | 0 | 0 | 0 | 0 | 30,772 | 30,772 | 0 | 30,772 | |||||||||||||||||||||||||||
| Finance costs |
0 | 0 | 0 | 0 | 0 | (246,473) | (246,473) | 0 | (246,473) | |||||||||||||||||||||||||||
| Net finance costs |
0 | 0 | 0 | 0 | 0 | (215,701) | (215,701) | 0 | (215,701) | |||||||||||||||||||||||||||
|
|
|
|
|
|
|
|
|
|
|
|
|
|
|
|
|
|
|
|||||||||||||||||||
| Depreciation and amortizations |
185,121 | 31,842 | 14,145 | 109,745 | 3,901 | 8,680 | 353,434 | 0 | 353,434 | |||||||||||||||||||||||||||
| Sum of significant income accounts |
5,442 | 161 | 321,971 | 882 | 0 | 0 | 328,456 | 0 | 328,456 | |||||||||||||||||||||||||||
| Sum of significant expense accounts |
0 | 0 | 31,513 | 0 | 0 | 0 | 31,513 | 0 | 31,513 | |||||||||||||||||||||||||||
|
|
|
|
|
|
|
|
|
|
|
|
|
|
|
|
|
|
|
|||||||||||||||||||
| Profit (loss) of each reportable segment |
440,367 | 154,525 | 177,974 | 150,323 | 13,885 | (500,184) | 436,890 | 0 | 436,890 | |||||||||||||||||||||||||||
|
|
|
|
|
|
|
|
|
|
|
|
|
|
|
|
|
|
|
|||||||||||||||||||
| Share of profit (loss) of associates and joint ventures accounted for using equity method |
||||||||||||||||||||||||||||||||||||
| Associates |
0 | 0 | 0 | 0 | 0 | 6,958 | 6,958 | 0 | 6,958 | |||||||||||||||||||||||||||
| Joint ventures |
0 | 0 | 0 | 3 | 0 | 520 | 523 | 0 | 523 | |||||||||||||||||||||||||||
|
|
|
|
|
|
|
|
|
|
|
|
|
|
|
|
|
|
|
|||||||||||||||||||
| Income tax expense |
0 | 0 | 0 | 0 | 0 | (155,935) | (155,935) | 0 | (155,935) | |||||||||||||||||||||||||||
|
|
|
|
|
|
|
|
|
|
|
|
|
|
|
|
|
|
|
|||||||||||||||||||
| Geographical information on revenues |
||||||||||||||||||||||||||||||||||||
| Revenue – Chilean entities |
2,025,811 | 802,675 | 83,823 | 666,790 | 1,538 | 0 | 3,580,637 | 0 | 3,580,637 | |||||||||||||||||||||||||||
| Revenue – Foreign entities |
317,209 | 70,818 | 64,694 | 1,276,921 | 32,364 | 0 | 1,762,006 | 0 | 1,762,006 | |||||||||||||||||||||||||||
| Total Ordinary Income |
2,343,020 | 873,493 | 148,517 | 1,943,711 | 33,902 | 0 | 5,342,643 | 0 | 5,342,643 | |||||||||||||||||||||||||||
|
|
|
|
|
|
|
|
|
|
|
|
|
|
|
|
|
|
|
|||||||||||||||||||
| Year ended December 31, 2014 |
Pulp ThU.S.$ |
Sawn timber ThU.S.$ |
Forestry ThU.S.$ |
Panels ThU.S.$ |
Others ThU.S.$ |
Corporate ThU.S.$ |
Sub Total ThU.S.$ |
Elimination ThU.S.$ |
Total ThU.S.$ |
|||||||||||||||||||||||||||
| Amounts of additions to non-current assets |
||||||||||||||||||||||||||||||||||||
| Acquisition of property,plant and equipment and biological assets |
303,918 | 14,388 | 178,748 | 112,365 | 1,489 | 1,127 | 612,035 | 0 | 612,035 | |||||||||||||||||||||||||||
| Acquisition and contribution of investments in associates and joint venture |
0 | 0 | 0 | 1,882 | 0 | 0 | 1,882 | 0 | 1,882 | |||||||||||||||||||||||||||
122
Table of Contents
CELULOSA ARAUCO Y CONSTITUCION S.A.
AND SUBSIDIARIES
Unaudited Consolidated Financial Statements
December 31, 2015
Amounts in thousands of U.S. dollars, except as indicated
| Year ended December 31, 2014 |
Pulp ThU.S.$ |
Sawn timber ThU.S.$ |
Forestry ThU.S.$ |
Panels ThU.S.$ |
Others ThU.S.$ |
Corporate ThU.S.$ |
Sub Total ThU.S.$ |
Elimination ThU.S.$ |
Total ThU.S.$ |
|||||||||||||||||||||||||||
| Segment assets |
5,206,856 | 597,204 | 5,436,050 | 2,151,687 | 34,344 | 1,362,947 | 14,789,088 | (41,191) | 14,747,897 | |||||||||||||||||||||||||||
| Segments assets (excluding deferred tax assets) |
0 | 0 | 0 | 0 | 0 | 0 | 14,630,805 | (41,191) | 14,589,614 | |||||||||||||||||||||||||||
| Deferred tax assets |
0 | 0 | 0 | 0 | 0 | 0 | 158,283 | 0 | 158,283 | |||||||||||||||||||||||||||
| Investments accounted through equity method |
||||||||||||||||||||||||||||||||||||
| Associates |
0 | 0 | 174,782 | 5,830 | 0 | 126,460 | 307,072 | 0 | 307,072 | |||||||||||||||||||||||||||
| Joint Ventures |
0 | 0 | 0 | 0 | 0 | 18,973 | 18,973 | 0 | 18,973 | |||||||||||||||||||||||||||
| Segment liabilities |
341,498 | 69,491 | 171,951 | 233,063 | 13,385 | 7,103,773 | 7,933,161 | 0 | 7,933,161 | |||||||||||||||||||||||||||
| Segments liabilities (excluding deferred tax liabilities) |
0 | 0 | 0 | 0 | 0 | 0 | 6,176,012 | 0 | 6,176,012 | |||||||||||||||||||||||||||
| Deferred tax liabilities |
0 | 0 | 0 | 0 | 0 | 0 | 1,757,149 | 0 | 1,757,149 | |||||||||||||||||||||||||||
|
|
|
|
|
|
|
|
|
|
|
|
|
|
|
|
|
|
|
|||||||||||||||||||
| Geographical information on non-current assets (**) |
||||||||||||||||||||||||||||||||||||
| Chile |
2,633,773 | 294,317 | 3,480,005 | 598,526 | 80 | 205,774 | 7,212,475 | 74 | 7,212,549 | |||||||||||||||||||||||||||
| Foreign countries |
1,796,802 | 16,433 | 1,288,915 | 842,288 | 25,535 | 424,660 | 4,394,633 | 0 | 4,394,633 | |||||||||||||||||||||||||||
| Non-current assets, Total |
4,430,575 | 310,750 | 4,768,920 | 1,440,814 | 25,615 | 630,434 | 11,607,108 | 74 | 11,607,182 | |||||||||||||||||||||||||||
|
|
|
|
|
|
|
|
|
|
|
|
|
|
|
|
|
|
|
|||||||||||||||||||
123
Table of Contents
CELULOSA ARAUCO Y CONSTITUCION S.A.
AND SUBSIDIARIES
Unaudited Consolidated Financial Statements
December 31, 2015
Amounts in thousands of U.S. dollars, except as indicated
Below, please find data regarding the cash flows per segment, which data is presented in a supplemental manner, as follow-up pursuant to local requirements:
| Year ended December 31, 2015 |
Pulp ThU.S.$ |
Sawn timber ThU.S.$ |
Forestry ThU.S.$ |
Panels ThU.S.$ |
Others ThU.S.$ |
Corporate ThU.S.$ |
Sub Total ThU.S.$ |
Elimination ThU.S.$ |
Total ThU.S.$ |
|||||||||||||||||||||||||||
| Segment Cash Flows |
||||||||||||||||||||||||||||||||||||
| Cash Flows from (used in) Operating Activities |
605,756 | 135,322 | 252,702 | 255,262 | 2,722 | (398,114) | 853,650 | 0 | 853,650 | |||||||||||||||||||||||||||
| Cash flows (used in) investing activities |
(202,473) | (12,645) | (142,879) | (84,671) | (1,790) | (33,322) | (477,780) | 0 | (477,780) | |||||||||||||||||||||||||||
| Cash flows from (used in) Financing Activities |
(60,395) | 0 | (2,003) | (151,395) | 0 | (598,383) | (812,176) | 0 | (812,176) | |||||||||||||||||||||||||||
| Net increase (decrease) in Cash and Cash Equivalents |
342,888 | 122,677 | 107,820 | 19,196 | 932 | (1,029,819) | (436,306) | 0 | (436,306) | |||||||||||||||||||||||||||
|
|
|
|
|
|
|
|
|
|
|
|
|
|
|
|
|
|
|
|||||||||||||||||||
| Year ended December 31, 2014 |
Pulp ThU.S.$ |
Sawn timber ThU.S.$ |
Forestry ThU.S.$ |
Panels ThU.S.$ |
Others ThU.S.$ |
Corporate ThU.S.$ |
Sub Total ThU.S.$ |
Elimination ThU.S.$ |
Total ThU.S.$ |
|||||||||||||||||||||||||||
| Segment Cash Flows |
||||||||||||||||||||||||||||||||||||
| Cash Flows from (used in) Operating Activities |
588,293 | 185,276 | 296,349 | 211,018 | 6,527 | (302,288) | 985,175 | 0 | 985,175 | |||||||||||||||||||||||||||
| Cash flows (used in) investing activities |
(310,125) | (4,997) | (78,409) | (113,321) | (1,489) | (146,817) | (655,158) | 0 | (655,158) | |||||||||||||||||||||||||||
| Cash flows from (used in) Financing Activities |
(52,631) | 0 | 83,975 | 11,623 | 0 | (50,852) | (7,885) | 0 | (7,885) | |||||||||||||||||||||||||||
| Net increase (decrease) in Cash and Cash Equivalents |
225,537 | 180,279 | 301,915 | 109,320 | 5,038 | (499,957) | 322,132 | 0 | 322,132 | |||||||||||||||||||||||||||
|
|
|
|
|
|
|
|
|
|
|
|
|
|
|
|
|
|
|
|||||||||||||||||||
124
Table of Contents
CELULOSA ARAUCO Y CONSTITUCION S.A.
AND SUBSIDIARIES
Unaudited Consolidated Financial Statements
December 31, 2015
Amounts in thousands of U.S. dollars, except as indicated
Information required by geographic area:
| Geographical area | ||||||||||||||||||||||||
| 2015 | Local country |
Foreign country | ||||||||||||||||||||||
| Chile | Argentina | Brazil | USA/ Canada |
Uruguay | Total | |||||||||||||||||||
| Disclosure of geographical areas |
ThU.S.$ | ThU.S.$ | ThU.S.$ | ThU.S.$ | ThU.S.$ | ThU.S.$ | ||||||||||||||||||
| Revenues |
3,308,870 | 481,881 | 378,719 | 787,037 | 190,233 | 5,146,740 | ||||||||||||||||||
| Revenues quarter October-December 2015 |
760,259 | 134,715 | 68,643 | 183,506 | 59,666 | 1,206,789 | ||||||||||||||||||
| Non-current Assets at 12-31-2015 other than tax deferred |
6,986,237 | 978,285 | 872,378 | 364,889 | 1,812,948 | 11,014,737 | ||||||||||||||||||
| Geographical area | ||||||||||||||||||||||||
| 2014 | Local country |
Foreign country | ||||||||||||||||||||||
| Chile | Argentina | Brazil | USA/ Canada |
Uruguay | Total | |||||||||||||||||||
| Disclosure of geographical areas |
ThU.S.$ | ThU.S.$ | ThU.S.$ | ThU.S.$ | ThU.S.$ | ThU.S.$ | ||||||||||||||||||
| Revenues |
3,580,637 | 436,524 | 481,275 | 774,805 | 69,402 | 5,342,643 | ||||||||||||||||||
| Revenues quarter October-December 2014 |
918,978 | 108,846 | 118,440 | 178,306 | 59,704 | 1,384,274 | ||||||||||||||||||
| Non-current Assets at 12-31-2014 other than tax deferred |
7,133,974 | 977,784 | 1,245,162 | 352,862 | 1,739,117 | 11,448,899 | ||||||||||||||||||
125
Table of Contents
CELULOSA ARAUCO Y CONSTITUCION S.A.
AND SUBSIDIARIES
Unaudited Consolidated Financial Statements
December 31, 2015
Amounts in thousands of U.S. dollars, except as indicated
NOTE 25. OTHER NON-FINANCIAL ASSETS AND NON-FINANCIAL LIABILITIES
| 12-31-2015 | 12-31-2014 | |||||||
| Current non-financial assets |
ThU.S.$ | ThU.S.$ | ||||||
| Roads to amortize current |
47,731 | 77,359 | ||||||
| Prepayment to amortize (insurance + others) |
20,398 | 23,407 | ||||||
| Recoverable taxes (Relating to purchases) |
62,468 | 71,834 | ||||||
| Other current non-financial assets |
3,359 | 5,128 | ||||||
| Total |
133,956 | 177,728 | ||||||
|
|
|
|
|
|||||
| Non current non-financial assets |
12-31-2015 ThU.S.$ |
12-31-2014 ThU.S.$ |
||||||
| Roads to amortize, non current |
111,319 | 91,871 | ||||||
| Guarantee values |
2,635 | 3,489 | ||||||
| Recoverable taxes |
7,767 | 3,102 | ||||||
| Other non current non-financial assets |
3,795 | 2,632 | ||||||
| Total |
125,516 | 101,094 | ||||||
|
|
|
|
|
|||||
| Current non-financial liabilities |
12-31-2015 ThU.S.$ |
12-31-2014 ThU.S.$ |
||||||
| Provision of minimum dividend (1) |
102,305 | 99,160 | ||||||
| ICMS tax payable |
6,172 | 19,020 | ||||||
| Other tax payable |
19,442 | 15,297 | ||||||
| Other Current non-financial liablilities |
3,804 | 2,839 | ||||||
| Total |
131,723 | 136,316 | ||||||
|
|
|
|
|
|||||
| (1) | Provision includes a minimum dividend of subsidiary minority. |
| Non current non-financial liabilities |
12-31-2015 ThU.S.$ |
12-31-2014 ThU.S.$ |
||||||
| ICMS tax payable |
45,365 | 56,815 | ||||||
| Other non-current non financial liablilities |
1,876 | 5,181 | ||||||
| Total |
47,241 | 61,996 | ||||||
|
|
|
|
|
|||||
126
Table of Contents
CELULOSA ARAUCO Y CONSTITUCION S.A.
AND SUBSIDIARIES
Unaudited Consolidated Financial Statements
December 31, 2015
Amounts in thousands of U.S. dollars, except as indicated
NOTE 26. DISTRIBUTABLE NET INCOME AND EARNINGS PER SHARE
Distributable net income
As a general policy, the Board of Directors of Arauco agreed that the net income to be distributed as dividend is determined based on realized net gains/(losses) of any relevant variations in the value of unrealized assets and liabilities, which are excluded from the calculation of net income during the period such changes are made.
As a result of the foregoing, for purposes of determining the distributable net income of the Company, which is the same considered for calculating the minimum dividend required and additional dividend, the following unrealized gains/losses are excluded from the net income for the year:
| 1) | Unrealized gains/losses relating to the fair value recorded for forestry assets under IAS 41, adding them back to distributable net income when they are realized through sale or disposed of by other means. |
| 2) | Those generated through the acquisition of entities. These results will be added back to net income when they are realized through sale. |
The deferred taxes associated with the amounts described in 1) and 2) above are also excluded.
The following table details the adjustments made for the determination of distributable net income as December 31, 2015 and 2014 in order to determine the provision of 40% of the distributable net income for each year:
| Distributable Net Income ThU.S.$ |
||||
| Net income attributable to owners of parent at |
362,689 | |||
| Adjustments: |
||||
| Biological Assets |
||||
| Unrealized gains/losses |
(205,527 | ) | ||
| Realized gains/losses |
203,730 | |||
| Deferred income taxes |
(3,889 | ) | ||
| Total adjustments |
(5,686 | ) | ||
| Distributable Net Income at 12-31-2015 |
357,003 | |||
|
|
|
|||
| Distributable Net Profit ThU.S.$ |
||||
| Net income attributable to owners of parent at |
431,958 | |||
| Adjustments |
||||
| Biological Assets |
||||
| Unrealized |
(278,884 | ) | ||
| Realized |
237,272 | |||
| Deferred income taxes |
9,354 | |||
| Total adjustments |
(32,258 | ) | ||
| Distributable Net Income at 12-31-2014 |
399,700 | |||
|
|
|
|||
The Company expects to maintain its policy of distributing 40% of its net distributable income as dividends for all future fiscal years, but will also consider the alternative of distributing a provisional dividend at year end.
127
Table of Contents
CELULOSA ARAUCO Y CONSTITUCION S.A.
AND SUBSIDIARIES
Unaudited Consolidated Financial Statements
December 31, 2015
Amounts in thousands of U.S. dollars, except as indicated
As of December 31, 2015, in the Classified Statement of Financial Position, under the line item Other Ordinary Non-Financial Liabilities, for an amount of ThU.S.$131,723, there are a total of ThU.S.$99,211 which correspond to a provision for the minimum dividend for the parent company for the 2015 period, after discounting the distribution of a provisional dividend of ThU.S.$43,580, paid to shareholders in December 2015.
Basic and diluted earnings per share
Basic earnings per share are calculated by dividing the profit or loss attributable to ordinary equity holders of parent by the weighted average number of ordinary shares outstanding. Arauco does not have any shares with potential dilutive effect.
| January-December | ||||||||
| 2015 | 2014 | |||||||
| ThU.S.$ | ThU.S.$ | |||||||
| Profit or loss attributable to ordinary equity holder of parent |
362,689 | 431,958 | ||||||
| Weighted average of number of shares |
113,159,655 | 113,159,655 | ||||||
| Basic earnings per share (in U.S.$ per share) |
3.21 | 3.82 | ||||||
NOTE 27. SUBSEQUENT EVENTS
The authorization for the issuance and publication of these consolidated financial statements for the period ended December 31, 2015 was approved by the Board of Directors of Arauco at the Extraordinary Session No. 544 held on March 9, 2016.
Subsequent to December 31, 2015 and until the date of issuance of these consolidated financial statements, there have been no events, other than those discussed above, that could materially affect the presentation of these financial statements.
128
Table of Contents

Interim Review Fourth Quarter 2015 Results March 11th, 2016 Celulosa Arauco y Constitución S.A. Fourth Quarter 2015 Results March 11, 2016
Table of Contents

Interim Review Fourth Quarter 2015 Results March 11th, 2016 3 Highlights 4 Income statement analysis 9 Review by business segment 11 Balance sheet analysis 13 Financial ratios 14 4th quarter and subsequent events and news 15 Financial statements ARAUCO aims to be a global leader in the production and management of renewable forestry resources and to develop products that improve the quality of life of millions of people around the world. CONFERENCE CALL Tuesday, Mar 22nd, 2016 10:30 Santiago time 09:30 Eastern time (New York) Please Dial: +1 (844) 839 2184 from USA +1 (412) 317 2505 from other countries Password: Arauco
Table of Contents
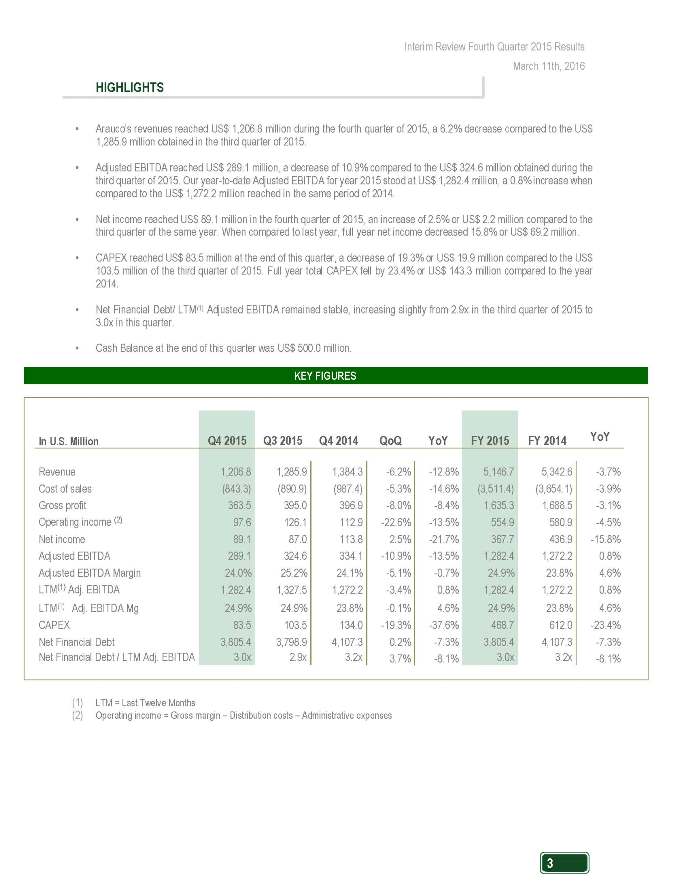
Interim Review Fourth Quarter 2015 Results March 11th, 2016 HIGHLIGHTS • Arauco’s revenues reached US$ 1,206.8 million during the fourth quarter of 2015, a 6.2% decrease compared to the US$ 1,285.9 million obtained in the third quarter of 2015. • Adjusted EBITDA reached US$ 289.1 million, a decrease of 10.9% compared to the US$ 324.6 million obtained during the third quarter of 2015. Our year-to-date Adjusted EBITDA for year 2015 stood at US$ 1,282.4 million, a 0.8% increase when compared to the US$ 1,272.2 million reached in the same period of 2014. • Net income reached US$ 89.1 million in the fourth quarter of 2015, an increase of 2.5% or US$ 2.2 million compared to the third quarter of the same year. When compared to last year, full year net income decreased 15.8% or US$ 69.2 million. • CAPEX reached US$ 83.5 million at the end of this quarter, a decrease of 19.3% or US$ 19.9 million compared to the US$ 103.5 million of the third quarter of 2015. Full year total CAPEX fell by 23.4% or US$ 143.3 million compared to the year 2014. • Net Financial Debt/ LTM(1) Adjusted EBITDA remained stable, increasing slightly from 2.9x in the third quarter of 2015 to 3.0x in this quarter. • Cash Balance at the end of this quarter was US$ 500.0 million. KEY FIGURES In U.S. Million Q4 2015 Q3 2015 Q4 2014 QoQ YoY FY 2015 FY 2014 YoY Revenue 1,206.8 1,285.9 1,384.3 -6.2% -12.8% 5,146.7 5,342.6 -3.7% Cost of sales (843.3) (890.9) (987.4) -5.3% -14.6% (3,511.4) (3,654.1) -3.9% Gross profit 363.5 395.0 396.9 -8.0% -8.4% 1,635.3 1,688.5 -3.1% Operating income (2) 97.6 126.1 112.9 -22.6% -13.5% 554.9 580.9 -4.5% Net income 89.1 87.0 113.8 2.5% -21.7% 367.7 436.9 -15.8% Adjusted EBITDA 289.1 324.6 334.1 -10.9% -13.5% 1,282.4 1,272.2 0.8% Adjusted EBITDA Margin 24.0% 25.2% 24.1% -5.1% -0.7% 24.9% 23.8% 4.6% LTM(1) Adj. EBITDA 1,282.4 1,327.5 1,272.2 -3.4% 0.8% 1,282.4 1,272.2 0.8% LTM(1) Adj. EBITDA Mg 24.9% 24.9% 23.8% -0.1% 4.6% 24.9% 23.8% 4.6% CAPEX 83.5 103.5 134.0 -19.3% -37.6% 468.7 612.0 -23.4% Net Financial Debt 3,805.4 3,798.9 4,107.3 0.2% -7.3% 3,805.4 4,107.3 -7.3% Net Financial Debt / LTM Adj. EBITDA 3.0x 2.9x 3.2x 3.7% -8.1% 3.0x 3.2x -8.1% (1) LTM = Last Twelve Months (2) Operating income = Gross margin – Distribution costs – Administrative expenses
Table of Contents

Interim Review Fourth Quarter 2015 Results March 11th, 2016 INCOME STATEMENT ANALYSIS Revenues Arauco’s revenues for the fourth quarter of 2015 reached US$ 1,206.8 million, 6.2% lower than the US$ 1,285.9 million obtained during the third quarter of 2015. The main downturn driver was a decrease in sales volume from our panels and sawn timber businesses, influenced mainly by a relative oversupply in the markets. Sawn timber decreased its volume sales in Asia and the Middle East, offset by an increase of its sales in North America. In our pulp business, volume sales increased as prices fell. In the last few months, China has negatively affected pulp markets because of its weakening economy, a sharp devaluation of the Yuan during the third quarter, and less paper demand. A new pulp mill entering the market added new supply to the market, further weakening short fiber prices. Compared to the US$ 1,384.3 million obtained in the fourth quarter of 2014, consolidated sales were 12.8% lower, mainly explained by an 8.5%, 12.0%, and 23.3% decrease in our pulp, panels, and sawn timber businesses, respectively. Revenues by Business Segment Q4 2015 In US$ million Q4 2015 Q3 2015 Q4 2014 Pulp(*) 569.9 47.2% 587.6 45.7% 623.0 45.0% Panels(*) 429.1 35.6% 461.9 35.9% 487.7 35.2% Sawn Timber(*) 172.4 14.3% 204.6 15.9% 224.8 16.2% Forestry 28.0 2.3% 24.3 1.9% 40.3 2.9% Others 7.3 0.6% 7.6 0.6% 8.5 0.6% Total 1,206.8 100.0% 1,285.9 100.0% 1,384.3 100.0% (*) Pulp, Panels and Sawn Timber division sales include energy The main variances by business segment during this quarter were: QoQ Net Sales Price Volume Pulp -3.0% -5.8% 3.2% Panels -7.1% -2.9% -4.5% Sawn Timber -15.7% -5.2% -10.8% (*) Pulp, Panels and Sawn Timber division sales include energy
Table of Contents

Interim Review Fourth Quarter 2015 Results March 11th, 2016 Cost of Sales For the fourth quarter of the year, cost of sales reached US$ 843.3 million, US$ 47.6 million or 5.3% lower than the US$ 890.9 million obtained in the third quarter of 2015. This is partially explained by the decrease of sales volume in our panels and sawn timber business segments. In terms of cost by concept, compared with the third quarter of 2015, our main decrease was other raw materials and indirect costs by 28.9%, as well as chemical costs by 18.5%.The price drop in oil has also positively affected our fuel and energy costs, decreasing 21.7% compared to the third quarter. These cutbacks were partially offset by higher maintenance expenses and wages. Unitary costs for bleached softwood pulp increased 0.7%, while unbleached softwood pulp decreased 2.6% during this quarter. Hardwood pulp costs increased by 1.3% from last quarter, although Montes del Plata continues reaching higher cost efficiency. The increase of pulp costs is mainly due to maintenance stoppages in the Nueva Aldea Mill and Valdivia Mill. Other Relevant Items: ? Distribution Costs and Administrative Expenses: Administrative expenses overall increased by 10.7% (US$ 13.7 million), as a result of an increase in counsel fees, other administrative costs and computational services. On the other hand, distribution costs decreased 16.3% (US$20.6 million), due to lower freight costs. As a percentage of revenues, both items combined were 22.0%, showing an upward trend compared to the 21.4% in the previous quarter, and the 20.7% in the quarter before that. ? Foreign Exchange Difference: This item showed a loss of US$ 13.3 million, mainly explained by a 39.7% depreciation of the Argentine peso during this quarter, which affected in US Dollar terms our cash and cash equivalents and receivables from our Argentine subsidiary held in local currency. The Brazilian Real kept its downward trend from last quarter although suffering a shorter downfall, depreciating 9.9% during this quarter compared to the 28.1% depreciation the quarter before.
Table of Contents

Interim Review Fourth Quarter 2015 Results March 11th, 2016 Net Income Net income for the fourth quarter of 2015 was US$ 89.1 million, an increase of 2.5% or US$ 2.1 million compared to the US$ 87.0 million obtained in the third quarter of this year. Operating income was US$ 28.5 million or 22.6% lower, mainly due to lower revenues this quarter. On the other hand, non-operating income rose US$ 30.5 million. Arauco acquired the remaining 51.0% of Novo Oeste in Brazil, which explains US$ 8.7 million of the variation. Other major items include an increase in gain from changes in fair value of biological assets. Compared to the same quarter in 2014, net income in the fourth quarter of 2015 was 21.7% or US$ 24.7 million lower. Net Income Variation by Item 3Q15 – 4Q15 (In US$ million)
Table of Contents

Interim Review Fourth Quarter 2015 Results March 11th, 2016 Production During the fourth quarter of 2015, our pulp production was 900 thousand Adt, a 2.9% increase compared to the 875 thousand Adt produced in the previous quarter. Although the Nueva Aldea Mill and Valdivia Mill had maintenance stoppages during this quarter, this was offset by the continuing improvement in production from our Montes del Plata Mill. Production volume in our panels division was 1,282 thousand m3, 4.1% or 54 thousand m3 lower than the previous quarter. Production volume from our Sawn Timber division decreased 3.6% or 25 thousand m3, compared to the 700 thousand m3 in the previous quarter. Compared to the fourth quarter of 2014, production volume increased 5.8% in our pulp division, our panel’s production decreased 1.5% and our sawn timber production decreased 7.4%. Production by Business Segment
Table of Contents

Interim Review Fourth Quarter 2015 Results March 11th, 2016 Adjusted EBITDA Adjusted EBITDA for the fourth quarter of 2015 was US$ 289.1 million, 10.9% or US$ 35.5 million lower than the US$ 324.6 million reached during the previous quarter. Pulp, panels, and sawn timber business segments saw a decline in their EBITDA, by US$ 14.7 million, US$18.4 million and US$ 1.4 million respectively. Price was a big factor in the pulp business. The fall of adjusted EBITDA in the panels and sawn timber businesses is due to increasing competition from countries with depreciated currencies. Brazil had a weakening demand of MDF that affected our sales. Adjusted EBITDA for the fourth quarter of 2015 was lower by 13.5% or US$ 45.0 million when compared with the US$ 334.1 million reached in the same period of 2014. Adjusted EBITDA In US$ million Q4 2015 Q3 2015 Q4 2014 QoQ YoY FY 2015 FY 2014 YoY Net Income 89.1 87.0 113.8 2.5% -21.7% 367.7 436.9 -15.8% Financial costs 69.2 62.6 69.0 10.4% 0.3% 263.0 246.5 6.7% Financial income -15.2 -15.8 -14.7 -3.7% 3.4% -50.3 -30.8 63.4% Income tax 26.1 26.3 40.5 -0.7% -35.4% 129.7 155.9 -16.8% EBIT 169.2 160.1 208.6 5.7% -18.9% 710.1 808.5 -12.2% Depreciation & amortization 101.3 102.1 111.1 -0.8% -8.9% 400.1 353.4 13.2% EBITDA 270.5 262.2 319.6 3.1% -15.4% 1,110.2 1,162.0 -4.5% Fair value cost of timber harvested 75.2 81.3 93.3 -7.6% -19.4% 306.7 353.3 -13.2% Gain from changes in fair value of biological assets -69.8 -46.6 -84.0 49.7% -16.9% -210.5 -284.5 -26.0% Exchange rate differences 13.3 22.6 7.0 -40.8% 90.5% 41.2 10.0 313.3% Others (*) -0.1 5.1 -1.8 -102.3% -93.4% 34.9 31.5 10.6% Adjusted EBITDA 289.1 324.6 334.1 -10.9% -13.5% 1,282.4 1,272.2 0.8% (*) Includes provision for forestry fire losses. Adjusted EBITDA Variation by Business Segment 3Q15—4Q15 (In US$ million)
Table of Contents

Interim Review Fourth Quarter 2015 Results March 11th, 2016 REVIEW BY BUSINESS SEGMENT 1- Pulp Division The last quarter of 2015 experienced a drop in prices, due to changes in demand and supply. Uncertainty and economic instability in China—an important driver in the pulp market—and other countries gave way to less active demand. On the supply side, new pulp mills coming into operation this quarter as well as last quarter led to fairly oversupplied markets. Inventory levels were relatively stable compared to the third quarter, with long fiber inventories decreasing by one day to 29 days and flat inventories for short fiber stocks at 39 days. Long and short fiber prices fell gradually throughout the quarter in Asia, shrinking approximately US$ 50 and US$ 65 per ton respectively, which translates into an 8% and 10% decrease. China´s weakening economy and higher volatility has affected the paper industry in general, even reaching higher inventory levels despite declining production. Paper producers fix prices in dollars that are sometimes paid 90 to 120 days later; therefore, the devaluation of the Yuan has been a critical factor during this quarter. Other Asian countries have had a similar development; their markets are decisively smaller and therefore are practically price-takers. European markets also saw negative price adjustments, although more moderate than in Asia. Both fibers decreased approximately US$ 35, which translates into a 6% decline for long fiber and 4% decline for short fiber. Active demand has been offset by oversupply. The paper market has recovered and producers have been ordering at pertinent levels, weeks and even months in advance. With this in mind, there are possibilities that the price will increase in some paper markets, but will not in turn affect pulp prices. This is due to high inventory levels as well as heightened production. Competition is fairly local, with European producers using more timely and competitive logistics than other producers in the long fiber market. In the Middle East, markets remain active and buyers are benefiting from Europe’s oversupply and China’s instability and diminishing demand to lower prices. Long fiber decreased about 3% during the quarter, while short fiber decreased about 6%. Demand in Latin America remains stable, with the exception of Brazil, whose paper demand has deteriorated. Arauco´s pulp mill located in Argentina only produces long fiber pulp, which has the advantage of mainly competing with imports from the United States. It is important to note that freight expenses fell during this quarter, especially in container shipments. This decrease affected the last quarter of 2015 and should be seen well into the first quarter of 2016, since there are many medium term contracts with buyers. Lower freight expenses means more possibilities to reach other destinations and be more competitive in markets too far away from Chile. Programmed annual maintenances in the Nueva Aldea Plant and Valdivia Plant suffered no setbacks and went according to plan during this quarter.
Table of Contents

Interim Review Fourth Quarter 2015 Results March 11th, 2016 2- Sawn Timber Division Sawn timber markets continue to decline during the fourth quarter of 2015, showing lower sales in volume and revenues in comparison to the third quarter of 2015. More supply has been coming from different producers that have taken advantage of their devalued currencies and started to compete in many of our principal markets. In North America, our moldings continue to thrive as the constructions and renovations market maintains its momentum. However, higher export volumes from Brazil have put pressure on prices, especially during this fourth quarter. The rest of Latin America continues to show a stable level of demand, which has enabled us to increase our market share and commercialize the desired product mix. 3- Panels Division Sales have experienced a decline during the last quarter of 2015 when compared to the same quarter of the year before; sales decreased 2.4% in total during the year 2015 when compared to 2014. This is due to two principal factors: the continuous deceleration of MDF demand in the Brazilian market, and a higher supply of plywood from Chile and Brazil which has started to compete in our traditional markets, thus decreasing prices. MDP sales from the Teno Mill have risen throughout 2015, explained by more demand as well as a better sales mix. Particleboard sales in North America kept strengthening thanks to our value added products, and demand remained stable. However, sales declined due to some production problems in some of our mills. The MDF market has been slower in North America, due to lower demand and more competition from Canadian and Brazilian producers that have taken advantage of their currency depreciation to export more of their products. This effect has translated in lower price for MDF panels and moldings. The devaluation of the Real in Brazil, along with a lower demand in local markets and higher supply levels have put pressure in domestic prices throughout the year. This made export volumes increase and at very competitive prices. The ability to export MDF and particleboards from Argentina remained hindered, which meant that practically everything produced within this country was sold locally.
Table of Contents

Interim Review Fourth Quarter 2015 Results March 11th, 2016 BALANCE SHEET ANALYSIS Cash Our cash position was US$ 500.0 million at the end of the fourth quarter, which is US$ 528.9 million or 5.5% lower when compared to the end of the third quarter. During this quarter, we had a negative cash flow of US$ 13.7 million. Cash provided by operating activities fell US$ 72.6 million compared to last quarter, mainly due to the decrease in collection of accounts receivable. Cash used by investment activities decreased by US$ 14.0 million compared to the previous quarter, mainly due to lower CAPEX. In addition, cash used in financing activities fell to an outflow of US$ 98.7 million from an outflow of US$ 106.6 million in the third quarter. Payment of borrowings was lower, although it was partially offset by the advanced dividend payment of US$ 43.9 million in December. Financial Debt Arauco’s consolidated financial debt as of December 31, 2015 reached US$ 4,305.4 million, a decrease of 0.5% or US$ 22.3 million when compared to September 2015. Our consolidated net financial debt increased 0.2% or US$ 6.5 million when compared with September 2015. Compared to December 2014 our total consolidated financial debt declined 15.2% or US$ 773.0 million. This decrease mainly includes US$ 370 million due to the payment of a Yankee bond and $ 150 million due to the payment of an Arauco North America loan. Our leverage, measured as Net Financial Debt/ LTM Adjusted EBITDA, varied slightly compared to the third quarter, reaching 3.0 times, as an effect of a lower adjusted EBITDA during this quarter. Compared to December 2014, our leverage decreased from 3.2 times. FINANCIAL DEBT December September December In US$ million 2015 2015 2014 Short term financial debt 291.8 319.7 739.5 Long term financial debt 4,013.6 4,008.1 4,338.9 TOTAL FINANCIAL DEBT 4,305.4 4,327.7 5,078.4 Cash and cash equivalents 500.0 528.9 971.2 NET FINANCIAL DEBT 3,805.4 3,798.9 4,107.3
Table of Contents

Interim Review Fourth Quarter 2015 Results March 11th, 2016 (*) UF is a Chilean monetary unit indexed to inflation. This portion does not consider the effect of debt in UF swapped to US Dollars Financial Debt Profile For the year 2016, bank amortizations sum up a total of US$ 237 million, which include the following maturities: US$ 159 million in loans of Montes del Plata, US$ 41 million in our Brazilian subsidiaries, and US$ 37 million in leasing from Chile. The amount in bonds refers to interest payments throughout this year. The remaining years have not undergone any major changes in financial obligations during this quarter. Financial Obligation by Year (In US$ Million) *Short term debt includes accrued interest
Table of Contents

Interim Review Fourth Quarter 2015 Results March 11th, 2016 FINANCIAL RATIOS FINANCIAL RATIOS Q4 2015 Q3 2015 Q4 2014 FY 2015 FY 2014 Profitability Gross margin 30.1% 30.7% 28.7% 31.8% 31.6% Operating margin 8.1% 9.8% 8.2% 10.8% 10.9% LTM(1) Adjusted EBITDA margin 24.9% 24.9% 23.8% 24.9% 23.8% ROA (EBIT / Total Assets) 4.9% 4.6% 5.6% 5.1% 5.4% ROE (Net Income / Equity) 5.4% 5.2% 6.7% 5.6% 6.4% Leverage LTM Interest Coverage Ratio (Adj. EBITDA / Financial Costs) 4.9x 5.1x 5.2x 4.9x 5.2x Net Financial Debt / LTM Adjusted EBITDA 3.0x 2.9x 3.2x 3.0x 3.2x Total Financial Debt / Total Capitalization(2) 39.3% 39.7% 42.7% 39.3% 42.7% Net Financial Debt / Total Capitalization 34.7% 34.8% 34.5% 34.7% 34.5% Total Financial Debt / Shareholders’ Equity 65.1% 66.2% 75.0% 65.1% 75.0% Net Financial Debt / Shareholders’ Equity 57.6% 58.1% 60.7% 57.6% 60.7% (1) LTM = Last Twelve Months (2) Capitalization = Total financial debt + Equity
Table of Contents

Interim Review Fourth Quarter 2015 Results March 11th, 2016 FOURTH QUARTER AND SUBSEQUENT EVENTS AND NEWS Arauco announces purchase of 50% of Spanish company Tafisa In November 2015, Arauco announced a US$ 150 million dollar investment for the subscription of 50% of the Spanish company Tafisa, an affiliate of Sonae Industria. With this purchase, Arauco will have participation in mills distributed in Spain, Portugal, Germany and South Africa with combined production capacity of 4.2 million m3 of panels. The new company will be called Sonae-Arauco, and will produce MDF, PB and OSB panels, as well as sawn timber. Mills are distributed as follows: two panel mills and one saw mill in Spain; two panel mills and one resin facility in Portugal; four panel mills in Germany and two in South Africa. Production capacity will be about 460,000 m3 of OSB, 1.45 million m3 of MDF, 2.27 million m3 of PB and 100,000 m3 of sawn timber. This joint venture enables Arauco to become the second largest producer of composite panels in the world, reaching an annual production capacity of approximately 9 million m3. Purchase is subject to completion of conditions precedent customary to these types of transactions. Three of Arauco’s companies merge to form a single sawn timber – panels business On December 1, 2015, Aserraderos Arauco S.A., Arauco Distribución S.A. and Paneles Arauco S.A. merged to create a single legal entity for Arauco’s offer in the sawn timber and panel production business in Chile. The remaining legal continuer is Paneles Arauco S.A. This merger enables Arauco to streamline processes, and therefore provide a better service to our clients and suppliers.
Table of Contents

Interim Review Fourth Quarter 2015 Results March 11th, 2016 FINANCIAL STATEMENTS INCOME STATEMENT US$ Million Q4 2015 Q3 2015 Q4 2014 FY 2015 FY 2014 Revenue 1,206.8 1,285.9 1,384.3 5,146.7 5,342.6 Cost of sales (843.3) (890.9) (987.4) (3,511.4) (3,654.1) Gross Profit 363.5 395.0 396.9 1,635.3 1,688.5 Other income 90.5 72.3 137.1 273.0 368.9 Distribution costs (124.2) (141.0) (148.4) (528.5) (556.8) Administrative expenses (141.7) (127.9) (135.5) (552.0) (550.8) Other expenses (11.1) (18.0) (35.3) (83.4) (138.8) Financial income 15.2 15.8 14.7 50.3 30.8 Financial costs (69.2) (62.6) (69.0) (263.0) (246.5) Participation in (loss) profit in associates and joint 5.5 2.2 0.9 6.7 7.5 ventures accounted through equity method Exchange rate differences (13.3) (22.6) (7.0) (41.2) (10.0) Income before income tax 115.3 113.3 154.3 497.4 592.8 Income tax (26.1) (26.3) (40.5) (129.7) (155.9) Net Income 89.1 87.0 113.8 367.7 436.9 Profit attributable to parent company 86.6 86.2 112.5 362.7 432.0 Profit attributable to non-parent company 2.5 0.8 1.3 5.0 4.9
Table of Contents

Interim Review Fourth Quarter 2015 Results March 11th, 2016 BALANCE SHEET US$ Million Q4 2015 Q3 2015 Q4 2014 Cash and cash equivalents 500.0 528.9 971.2 Other financial current assets 32.2 46.0 7.6 Other current non-financial assets 134.0 196.9 177.7 Trade and other receivables-net 733.3 736.2 731.9 Related party receivables 3.1 3.6 4.7 Inventories 910.0 896.2 893.6 Biological assets, current 272.0 249.0 307.6 Tax assets 64.1 34.2 38.5 Non-Current Assets classified as held for sale 3.2 8.1 8.0 Total Current Assets 2,651.9 2,699.1 3,140.7 Other non-current financial assets 0.6 0.0 5.0 Other non-current and non-financial assets 125.5 99.8 101.1 Non-current receivables 15.3 157.1 182.5 Investments accounted through equity method 264.8 262.0 326.0 Intangible assets 88.1 83.9 93.3 Goodwill 69.5 69.1 82.6 Property, plant and equipment 6,896.4 6,850.8 7,119.6 Biological assets, non-current 3,554.6 3,454.6 3,538.8 Deferred tax assets 140.3 148.0 158.3 Total Non-Current Assets 11,155.0 11,125.4 11,607.2 TOTAL ASSETS 13,806.9 13,824.5 14,747.9 Other financial liabilities, current 296.0 324.5 742.3 Trade and other payables 583.0 621.9 630.4 Related party payables 7.1 8.9 6.0 Other provisions, current 0.9 0.5 2.5 Tax liabilities 11.0 15.5 25.9 Current provision for employee benefits 4.5 4.2 3.6 Other non-financial liabilities, current 131.7 168.6 136.3 Total Current Liabilities 1,034.3 1,144.0 1,547.1 Other non-current financial liabilities 4,237.0 4,233.9 4,453.8 Trade and Other payables non-current 0.0 0.0 0.0 Other provisions, non-current 34.5 59.8 64.5 Deferred tax liabilities 1,755.5 1,718.2 1,757.1 Non-current provision for employee benefits 51.9 49.2 48.6 Other non-financial liabilities, non-current 47.2 43.6 62.0 Total Non-Current Liabilities 6,126.2 6,104.7 6,386.1 Non-parent participation 37.7 37.4 47.6 Net equity attributable to parent company 6,608.7 6,538.5 6,767.1 TOTAL LIABILITIES AND EQUITY 13,806.9 13,824.5 14,747.9
Table of Contents

Interim Review Fourth Quarter 2015 Results March 11th, 2016 STATEMENT OF CASH FLOWS US$ Million Q4 2015 Q3 2015 Q4 2014 FY 2015 FY 2014 Collection of accounts receivables 1,362.8 1,492.3 1,523.3 5,733.7 5,629.2 Collection from insurance claims 0.0 1.7 5.1 4.7 5.1 Other cash receipts (payments) 83.1 35.6 94.1 333.0 359.5 Payments of suppliers and personnel (less) (1,224.9) (1,210.0) (1,357.7) (4,920.5) (4,811.7) Interest paid and received (29.0) (69.2) (11.3) (212.2) (158.3) Income tax paid (23.8) (15.1) (16.6) (87.8) (37.3) Other (outflows) inflows of cash, net (2.6) 4.2 (2.6) 2.8 (1.4) Net Cash Provided by (Used in) Operating Activities 165.6 239.4 234.3 853.7 985.2 Capital Expenditures (83.5) (103.5) (134.0) (468.7) (612.0) Other investment cash flows 2.3 7.7 73.5 (9.1) (43.1) Net Cash Provided by (Used in) Investing Activities (81.2) (95.8) (60.4) (477.8) (655.2) Proceeds from borrowings 31.9 47.8 56.8 280.9 1,035.6 Repayments of borrowings (86.7) (153.9) (159.2) (949.2) (900.6) Dividends paid (43.9) (0.4) (62.9) (143.0) (141.1) Other inflows of cash, net 0.1 (0.1) (0.1) (0.9) (1.8) Net Cash Provided by (Used in) Financing Activities (98.7) (106.6) (165.4) (812.2) (7.9) Total Cash Inflow (Outflow) of the Period (14.2) 37.0 8.4 (436.3) 322.1 Effect of exchange rate changes on cash and cash equivalents (14.6) (20.0) (9.5) (34.8) (18.2) Cash and Cash equivalents at beginning of the period 528.9 511.9 972.2 971.2 667.2 Cash and Cash Equivalents at end of the Period 500.0 528.9 971.2 500.0 971.2 For more details on Arauco’s financial statements please refer to www.svs.cl or www.arauco.cl DISCLAIMER This news release may contain forward-looking statements concerning Arauco’s future performance and should be considered as good faith estimates by Arauco. These forward looking statements reflect management’s expectations and are based upon currently available data. Actual results are subject to future events and uncertainties, many of which are outside Arauco’s control and could materially impact Arauco’s performance. Readers are referred to the documents filed by Arauco with the United States Securities and Exchange Commission, specifically the most recent filing on Form 20-F which identifies important risk factors that could cause actual results to differ from those contained in the forward-looking statements. All forward-looking statements are based on information available to Arauco on the date hereof and Arauco assumes no obligation to update such statements. References herein to “US$” are to United States dollars. Discrepancies in any table between totals and the sums of the amounts listed are due to rounding. This report is unaudited. For further information please contact: José Luis Rosso jose.rosso@arauco.cl Phone: (56-2) 2461 7221 Fernanda Paz Vásquez fernanda.vasquez@arauco.cl Phone: (56-2) 2461 7494