Exhibit 99.1
Impax Reports First Quarter 2016 Financial Results
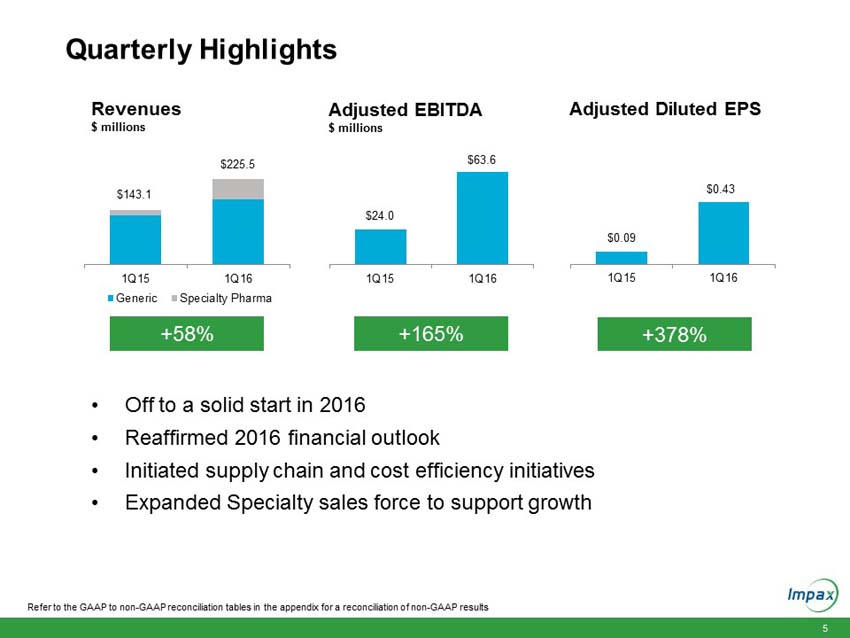
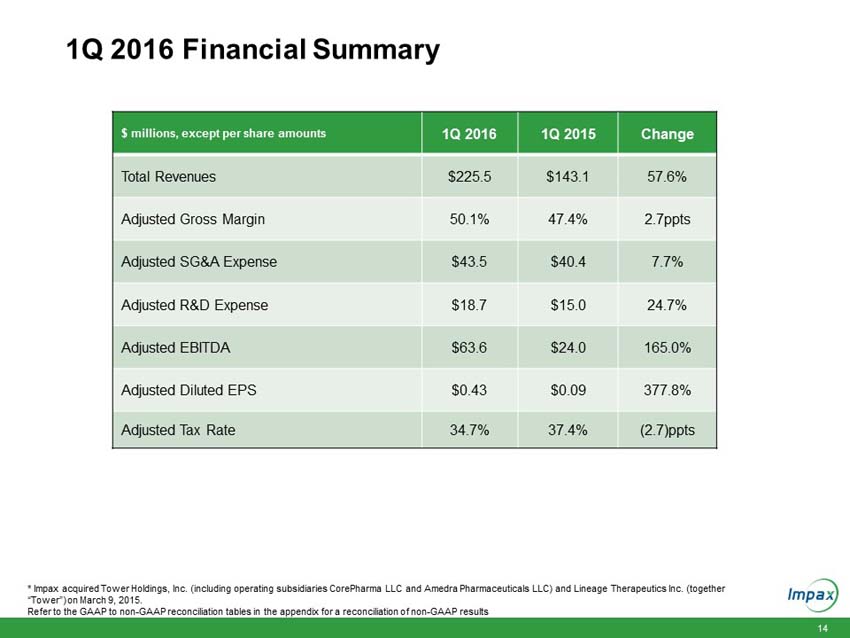
— First Quarter 2016 Revenues Increased 58% to $226 Million —
— First Quarter 2016 Adjusted Diluted EPS Increased 378% to $0.43; GAAP Loss Per Share of $0.15 —
— Adjusted EBITDA Increased 165% to $64 million —
— Company Reaffirms Full Year 2016 Financial Guidance —
HAYWARD, Calif., May 10, 2016 – Impax Laboratories, Inc. (NASDAQ: IPXL), a specialty pharmaceutical company, today reported first quarter 2016 financial results for the quarter ended March 31, 2016.
|
● |
First quarter 2016 total revenues of $225.5 million compared to $143.1 million in the prior year period. |
|
● |
Adjusted diluted earnings per share (Adjusted EPS) for the first quarter 2016 of $0.43 compared to Adjusted EPS of $0.09 in the prior year period. On a GAAP basis, the Company recorded a per share loss of $0.15, compared to a loss of $0.09 per share in the prior year period. |
|
● |
Adjusted earnings before interest, taxes, depreciation and amortization (Adjusted EBITDA) for the first quarter 2016 of $63.6 million compared to $24.0 million in the prior year period. |
|
● |
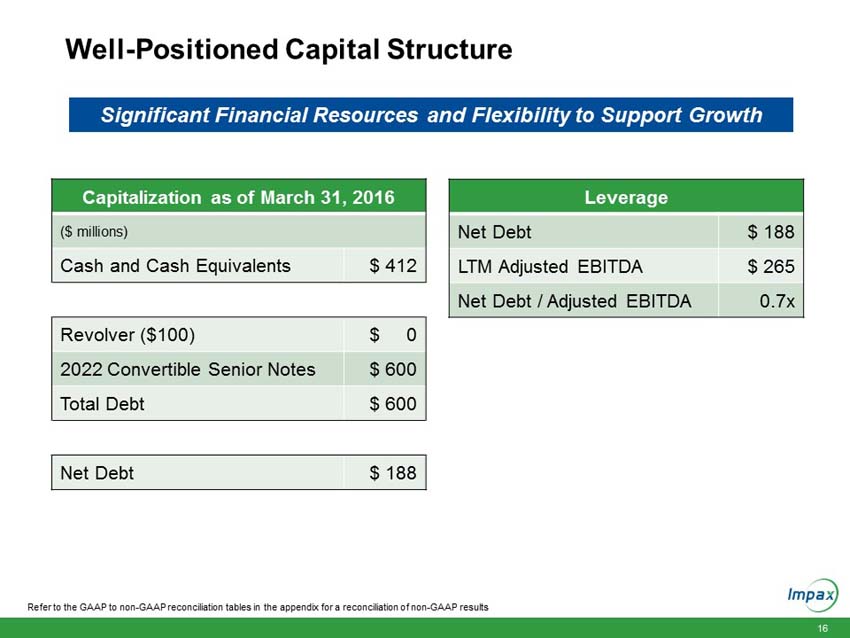
Cash and cash equivalents increased $71.8 million to $412.2 million as of March 31, 2016, compared to $340.4 million as of December 31, 2015. |
“We reported solid financial results for the first quarter and made progress towards achieving a number of our 2016 strategic priorities,” said Fred Wilkinson, President and Chief Executive Officer of Impax. “Our generic and specialty pharma business segments delivered double digit revenue and operating income growth. This positive performance was driven by last year’s acquisition of Tower Holdings, Inc., from the addition of more than a dozen generic and specialty products launched over the prior twelve months and from continued growth of our specialty pharma products.”
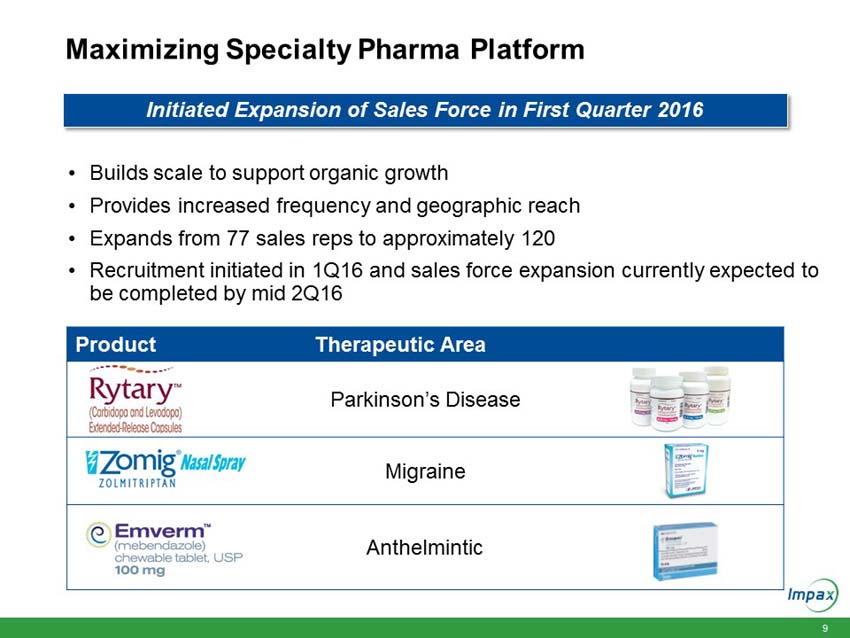
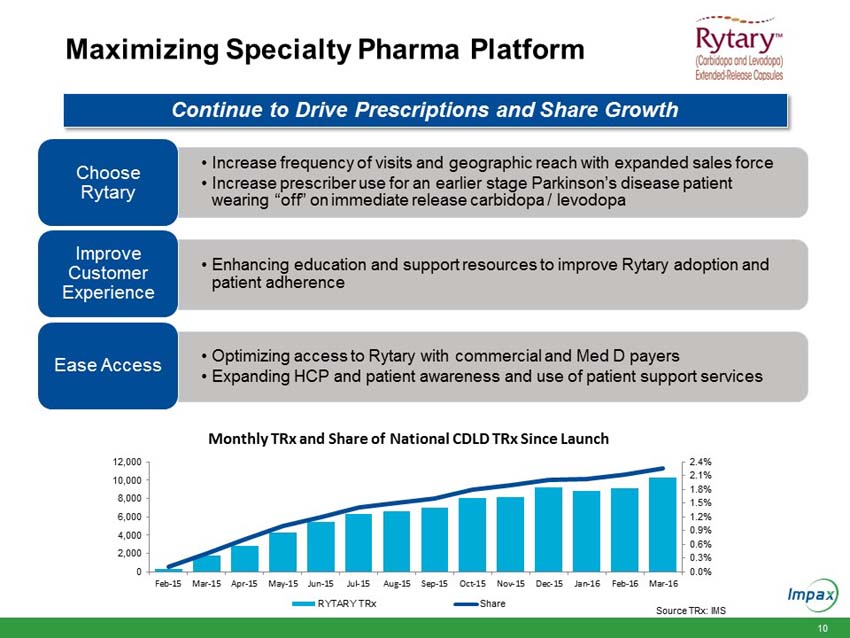
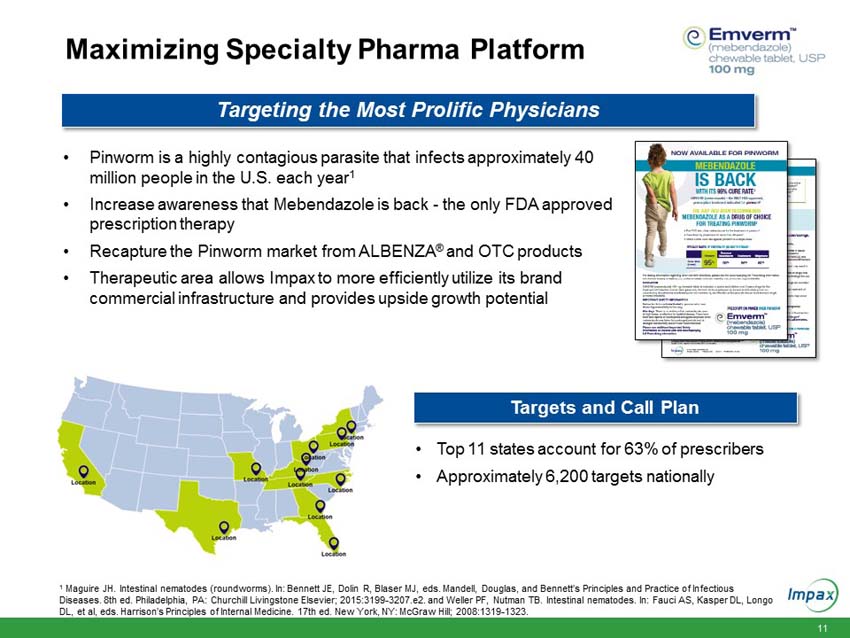
“During the quarter, we initiated the expansion of our Specialty Pharma sales force in order to support the continued growth of Rytary® and Zomig® nasal spray, while also supporting the recent launch of EMVERMTM. We also announced a restructuring plan to close one of our manufacturing and packaging facilities in order to reduce costs, improve our operating efficiencies and enhance Impax’s long term competitive position. The plan is currently expected to achieve annualized cost savings of between $23 million to $27 million, beginning in 2017. By creating a more favorable and sustainable cost structure over the next several years, we will have additional capital to invest in the most promising R&D and business development projects.”
“We continue to remain confident in our financial outlook for 2016. The combination of new product launches and increased sales from several of our existing generic and specialty pharma products are expected to drive growth in 2016.”
The first quarter 2016 GAAP loss per diluted share reflects the recording of a reserve in the pre-tax amount of $48.0 million for an estimated receivable due from Turing Pharmaceuticals AG as of March 31, 2016 for government rebates paid by Impax on Turing’s behalf related to Turing’s use, marketing and sale of Daraprim®. A reconciliation of GAAP to non-GAAP specified items is provided in the “Non-GAAP Financial Measures” section.
Business Segment Information
The Company has two reportable segments, the Impax Generics division (generic products and services) and the Impax Specialty Pharma division (brand products and services) and does not allocate general corporate services to either segment. All information presented is on a GAAP basis unless otherwise noted.
Impax Generics Division Information
(Unaudited, amounts in thousands)
|
Three Months Ended |
||||||||
|
March 31, |
||||||||
|
2016 |
2015 |
|||||||
|
Revenues: |
||||||||
|
Impax Generics Product sales, net |
$ | 167,184 | $ | 125,959 | ||||
|
Rx Partner |
2,835 | 2,239 | ||||||
|
Other revenues |
60 | 543 | ||||||
|
Total revenues |
170,079 | 128,741 | ||||||
|
Cost of revenues |
110,122 | 76,472 | ||||||
|
Gross profit |
59,957 | 52,269 | ||||||
|
Operating expenses: |
||||||||
|
Selling, general and administrative |
4,774 | 4,286 | ||||||
|
Research and development |
14,595 | 10,863 | ||||||
|
Patent litigation expense |
114 | 778 | ||||||
|
Total operating expenses |
19,483 | 15,927 | ||||||
|
Income from operations |
$ | 40,474 | $ | 36,342 | ||||
|
Gross margin |
35.3 | % | 40.6 | % | ||||
|
Adjusted gross profit (a) |
$ | 66,815 | $ | 57,909 | ||||
|
Adjusted gross margin (a) |
39.3 | % | 45.0 | % | ||||
(a) Adjusted gross profit is calculated as total revenues less adjusted cost of revenues. Adjusted gross margin is calculated as adjusted gross profit divided by total revenues. Refer to the "Non-GAAP Financial Measures" for a reconciliation of GAAP to non-GAAP items.
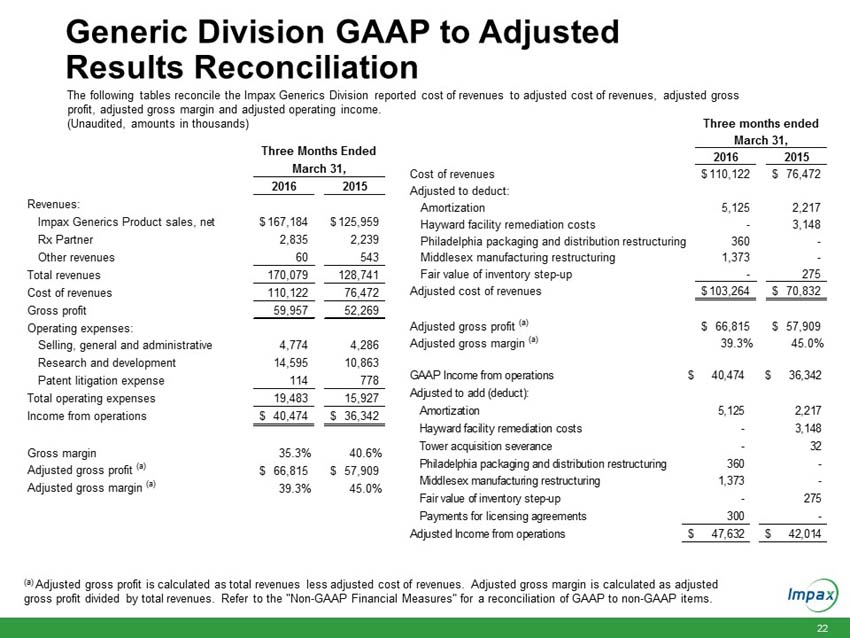
Total revenues for the Impax Generics division increased $41.3 million to $170.1 million in the first quarter 2016, compared to $128.7 million in the prior year period. The increase was primarily due to higher sales volumes from diclofenac sodium gel, increased product sales from the Tower acquisition which the Company completed in early March 2015, and sales resulting from more than a dozen generic products launched over the past twelve months.
Gross margin in the first quarter 2016 decreased to 35.3%, compared to gross margin of 40.6% in the prior year period. Adjusted gross margin in the first quarter 2016 decreased to 39.3%, compared to adjusted gross margin of 45.0% in the prior year period. The decrease in gross margin and adjusted gross margin was primarily due to the impact of higher sales of low margin products diclofenac and metaxalone during the first quarter 2016 compared to the prior year period, as increased competition has resulted in lower pricing.
Total operating expenses in the first quarter 2016 increased $3.6 million to $19.5 million, compared to $15.9 million in the prior year period, primarily due to an increase in research and development (R&D) expenses related to external development projects and the full quarter impact of R&D projects resulting from the Tower acquisition.
Impax Specialty Pharma Division Information
(Unaudited, amounts in thousands)
|
Three Months Ended |
||||||||
|
March 31, |
||||||||
|
2016 |
2015 |
|||||||
|
Revenues: |
||||||||
|
Impax Specialty Pharma Product sales, net |
$ | 55,429 | $ | 14,128 | ||||
|
Other revenues |
- | 227 | ||||||
|
Total revenues |
55,429 | 14,355 | ||||||
|
Cost of revenues |
12,796 | 7,390 | ||||||
|
Gross profit |
42,633 | 6,965 | ||||||
|
Operating expenses: |
||||||||
|
Selling, general and administrative |
13,818 | 14,856 | ||||||
|
Research and development |
4,427 | 4,099 | ||||||
|
Patent litigation expense |
1,205 | 182 | ||||||
|
Total operating expenses |
19,450 | 19,137 | ||||||
|
Income (loss) from operations |
$ | 23,183 | $ | (12,172 | ) | |||
|
Gross margin |
76.9 | % | 48.5 | % | ||||
|
Adjusted gross profit (a) |
$ | 46,276 | $ | 9,883 | ||||
|
Adjusted gross margin (a) |
83.5 | % | 68.8 | % | ||||
(a) Adjusted gross profit is calculated as total revenues less adjusted cost of revenues. Adjusted gross margin is calculated as adjusted gross profit divided by total revenues. Refer to the "Non-GAAP Financial Measures" for a reconciliation of GAAP to non-GAAP items.
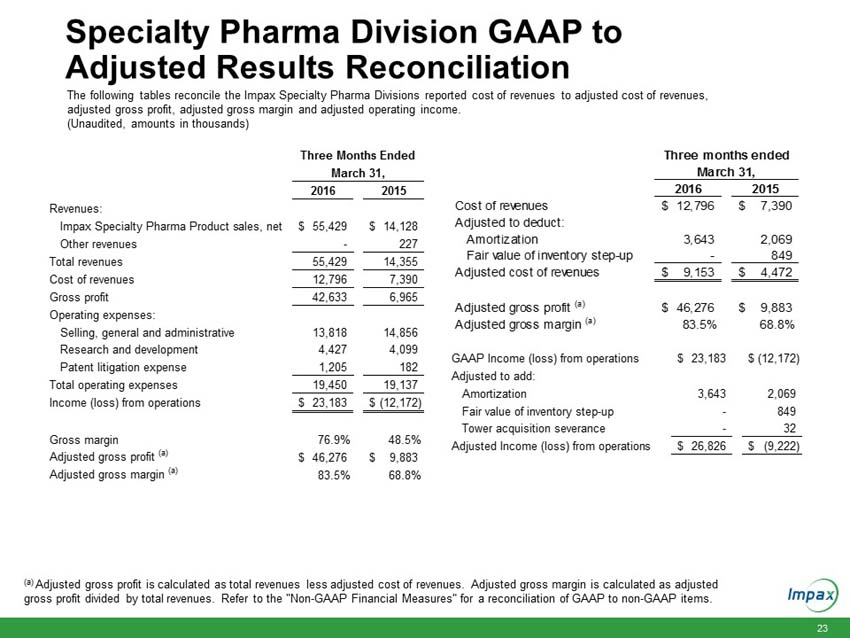
Total revenues for the Impax Specialty Pharma division increased $41.1 million to $55.4 million in the first quarter 2016, compared to $14.4 million in the prior year period. The increase is primarily due to the launch of Rytary at the end of the first quarter 2015 and increased sales from products acquired in the Tower acquisition including the initiation of the launch of EMVERM in late March 2016.
Gross margin in the first quarter 2016 increased to 76.9%, compared to 48.5% in the prior year period. Adjusted gross margin in the first quarter 2016 increased to 83.5%, compared to adjusted gross margin of 68.8% in the prior year period, primarily due to the new product sales as noted above.
Total operating expenses in the first quarter 2016 increased 1.6% to $19.5 million, compared to $19.1 million in the prior year period, primarily due to higher patent litigation expense partially offset by lower selling, general and administrative expense.
Corporate and Other Information
(Unaudited, amounts in thousands)
|
Three Months Ended |
||||||||
|
March 31, |
||||||||
|
2016 |
2015 |
|||||||
|
General and administrative expenses |
$ | 25,706 | $ | 31,018 | ||||
|
Unallocated corporate expenses |
$ | (25,706 | ) | $ | (31,018 | ) | ||
General and administrative expenses in the first quarter 2016 decreased $5.3 million to $25.7 million, compared to $31.0 million in the prior year period. The decrease was principally driven by Tower acquisition related costs included in the prior year period.
Interest expense in the first quarter 2016 was $8.3 million, an increase of $4.4 million compared to the prior year period, which was entirely attributable to interest expense incurred on the Company’s outstanding 2% convertible senior notes. Of the $8.3 million of interest expense, $3.0 million was cash and $5.3 million was non-cash accretion of debt discount attributable to deferred financing costs and bifurcation of the conversion option of the convertible notes.
2016 Financial Guidance
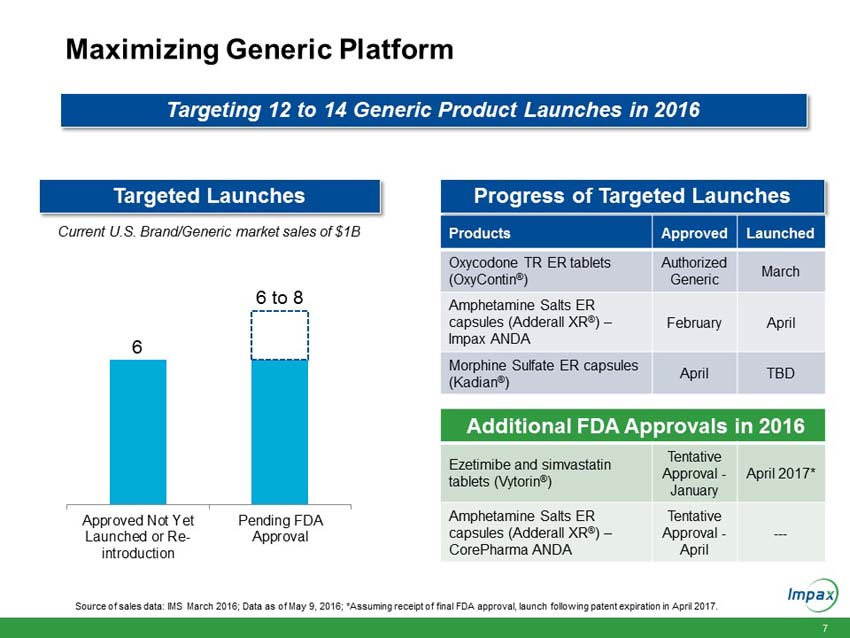
The Company’s full year 2016 financial guidance remains unchanged from when it was issued on February 22, 2016. The Company’s full year 2016 estimates are based on management’s current expectations, including with respect to prescription trends, pricing levels, inventory levels, and the anticipated timing of future product launches and events. The 2016 guidance assumes 12 to 14 generic product launches including six to eight new generic product approvals. The following statements are forward looking and actual results could differ materially depending on market conditions and the factors set forth under “Safe Harbor” below.
|
● |
Total Company revenues to increase at least 15% over full year 2015. |
|
● |
Adjusted gross margins as a percent of total revenue are expected to be approximately 50%. |
|
● |
Adjusted research and development expenses across the generic and brand divisions of approximately $100 million to $105 million (approximately 10% of total Company revenues). This includes patent litigation expenses. |
|
● |
Adjusted selling, general and administrative expenses of approximately $200 million to $210 million (approximately 20% to 21% of total Company revenues). |
|
● |
Adjusted interest expense of approximately $12 million. |
|
● |
Capital expenditures of approximately $40 million. |
|
● |
Adjusted EPS to increase at least 10% over full year 2015 adjusted diluted EPS. |
|
● |
Effective tax rate of approximately 34% to 36% on a GAAP basis. The Company anticipates that its GAAP effective tax rate may experience volatility as the Company’s tax benefits may be high compared to the Company’s operating income or loss. |
Conference Call Information
The Company will host a conference call with a slide presentation on May 10, 2016 at 8:30 a.m. ET to discuss its results. The call and presentation can also be accessed via a live Webcast through the Investor Relations section of the Company’s Web site, www.impaxlabs.com. The number to call from within the United States is (877) 356-3814 and (706) 758-0033 internationally. The conference ID is 94935242. A replay of the conference call will be available shortly after the call for a period of seven days. To access the replay, dial (855) 859-2056 (in the U.S.) and (404) 537-3406 (international callers).
About Impax Laboratories, Inc.
Impax Laboratories, Inc. (Impax) is a specialty pharmaceutical company applying its formulation expertise and drug delivery technology to the development of controlled-release and specialty generics in addition to the development of central nervous system disorder branded products. Impax markets its generic products through its Impax Generics division and markets its branded products through the Impax Specialty Pharma division. Additionally, where strategically appropriate, Impax develops marketing partnerships to fully leverage its technology platform and pursues partnership opportunities that offer alternative dosage form technologies, such as injectables, nasal sprays, inhalers, patches, creams, and ointments. For more information, please visit the Company's Web site at: www.impaxlabs.com.
"Safe Harbor" statement under the Private Securities Litigation Reform Act of 1995:
To the extent any statements made in this news release contain information that is not historical; these statements are forward-looking in nature and express the beliefs and expectations of management. Such statements are based on current expectations and involve a number of known and unknown risks and uncertainties that could cause the Company’s future results, performance, or achievements to differ significantly from the results, performance, or achievements expressed or implied by such forward-looking statements. Such risks and uncertainties include, but are not limited to: fluctuations in revenues and operating income; the Company’s ability to successfully develop and commercialize pharmaceutical products in a timely manner; reductions or loss of business with any significant customer; the substantial portion of the Company’s total revenues derived from sales of a limited number of products; the impact of consolidation of the Company’s customer base; the impact of competition; the Company’s ability to sustain profitability and positive cash flows; any delays or unanticipated expenses in connection with the operation of the Company’s manufacturing facilities; the effect of foreign economic, political, legal, and other risks on the Company’s operations abroad; the uncertainty of patent litigation and other legal proceedings; the increased government scrutiny on the Company’s agreements with brand pharmaceutical companies; product development risks and the difficulty of predicting FDA filings and approvals; consumer acceptance and demand for new pharmaceutical products; the impact of market perceptions of the Company and the safety and quality of the Company’s products; the Company’s determinations to discontinue the manufacture and distribution of certain products; the Company’s ability to achieve returns on its investments in research and development activities; changes to FDA approval requirements; the Company’s ability to successfully conduct clinical trials; the Company’s reliance on third parties to conduct clinical trials and testing; the Company’s lack of a license partner for commercialization of NUMIENTTM (IPX066) outside of the United States; impact of illegal distribution and sale by third parties of counterfeits or stolen products; the availability of raw materials and impact of interruptions in the Company’s supply chain; the Company’s policies regarding returns, allowances and chargebacks; the use of controlled substances in the Company’s products; the effect of current economic conditions on the Company’s industry, business, results of operations and financial condition; disruptions or failures in the Company’s information technology systems and network infrastructure caused by third party breaches or other events; the Company’s reliance on alliance and collaboration agreements; the Company’s reliance on licenses to proprietary technologies; the Company’s dependence on certain employees; the Company’s ability to comply with legal and regulatory requirements governing the healthcare industry; the regulatory environment; the effect of certain provisions in the Company’s government contracts; the Company’s ability to protect its intellectual property; exposure to product liability claims; risks relating to goodwill and intangibles; changes in tax regulations; the Company’s ability to manage growth, including through potential acquisitions and investments; the risks related to the Company’s acquisitions of or investments in technologies, products or businesses; the restrictions imposed by the Company’s credit facility and indenture; the Company’s level of indebtedness and liabilities and the potential impact on cash flow available for operations; uncertainties involved in the preparation of the Company’s financial statements; the Company’s ability to maintain an effective system of internal control over financial reporting; the effect of terrorist attacks on the Company’s business; the location of the Company’s manufacturing and research and development facilities near earthquake fault lines; expansion of social media platforms and other risks described in the Company’s periodic reports filed with the Securities and Exchange Commission. Forward-looking statements speak only as to the date on which they are made, and the Company undertakes no obligation to update publicly or revise any forward-looking statement, regardless of whether new information becomes available, future developments occur or otherwise.
Company Contact:
Mark Donohue
Investor Relations and Corporate Communications
(215) 558-4526
www.impaxlabs.com
Impax Laboratories, Inc.
Consolidated Statements of Operations
(unaudited, amounts in thousands, except share and per share data)
|
Three Months Ended |
||||||||
|
March 31, |
||||||||
|
2016 |
2015 |
|||||||
|
Revenues: |
||||||||
|
Impax Generics, net |
$ | 170,079 | $ | 128,741 | ||||
|
Impax Specialty Pharma, net |
55,429 | 14,355 | ||||||
|
Total revenues |
225,508 | 143,096 | ||||||
|
Cost of revenues |
122,918 | 83,862 | ||||||
|
Gross profit |
102,590 | 59,234 | ||||||
|
Operating expenses: |
||||||||
|
Selling, general and administrative |
44,298 | 50,160 | ||||||
|
Research and development |
19,022 | 14,962 | ||||||
|
Patent litigation expense |
1,319 | 960 | ||||||
|
Total operating expenses |
64,639 | 66,082 | ||||||
|
Income (loss) from operations |
37,951 | (6,848 | ) | |||||
|
Other expense, net: |
||||||||
|
Interest expense |
(8,331 | ) | (3,975 | ) | ||||
|
Interest income |
333 | 284 | ||||||
|
Reserve for Turing receivable |
(48,043 | ) | - | |||||
|
Other, net |
596 | (166 | ) | |||||
|
Loss before income taxes |
(17,494 | ) | (10,705 | ) | ||||
|
Benefit from income taxes |
(7,086 | ) | (4,372 | ) | ||||
|
Net loss |
$ | (10,408 | ) | $ | (6,333 | ) | ||
|
Net loss per share: |
||||||||
|
Basic |
$ | (0.15 | ) | $ | (0.09 | ) | ||
|
Diluted |
$ | (0.15 | ) | $ | (0.09 | ) | ||
|
Weighted-average common shares outstanding: |
||||||||
|
Basic |
70,665,394 | 68,967,875 | ||||||
|
Diluted |
70,665,394 | 68,967,875 | ||||||
Impax Laboratories, Inc.
Condensed Consolidated Balance Sheets
(unaudited, amounts in thousands)
|
March 31, |
December 31, |
|||||||
|
2016 |
2015 |
|||||||
|
Assets |
||||||||
|
Current assets: |
||||||||
|
Cash and cash equivalents |
$ | 412,178 | $ | 340,351 | ||||
|
Accounts receivable, net |
214,448 | 324,451 | ||||||
|
Inventory, net |
133,563 | 125,582 | ||||||
|
Prepaid expenses and other assets |
22,185 | 31,689 | ||||||
|
Total current assets |
782,374 | 822,073 | ||||||
|
Property, plant and equipment, net |
219,400 | 214,156 | ||||||
|
Intangible assets, net |
596,752 | 602,020 | ||||||
|
Goodwill |
208,382 | 210,166 | ||||||
|
Deferred income taxes |
284 | 315 | ||||||
|
Other non-current assets |
79,107 | 73,757 | ||||||
|
Total assets |
$ | 1,886,299 | $ | 1,922,487 | ||||
|
Liabilities and Stockholders' Equity |
||||||||
|
Current liabilities: |
||||||||
|
Accounts payable and accrued expenses |
$ | 263,836 | $ | 261,036 | ||||
|
Accrued profit sharing and royalty expenses |
38,709 | 65,725 | ||||||
|
Total current liabilities |
302,545 | 326,761 | ||||||
|
Long-term debt, net |
429,878 | 424,595 | ||||||
|
Deferred income taxes |
47,464 | 72,770 | ||||||
|
Other non-current liabilities |
36,986 | 35,952 | ||||||
|
Total liabilities |
816,873 | 860,078 | ||||||
|
Total stockholders' equity |
1,069,426 | 1,062,409 | ||||||
|
Total liabilities and stockholders' equity |
$ | 1,886,299 | $ | 1,922,487 | ||||
Impax Laboratories, Inc.
Condensed Consolidated Statements of Cash Flows
(unaudited, amounts in thousands)
|
Three Months Ended |
||||||||
|
March 31, |
||||||||
|
2016 |
2015 |
|||||||
|
Cash flows from operating activities: |
||||||||
|
Net loss |
$ | (10,408 | ) | $ | (6,333 | ) | ||
|
Adjustments to reconcile net loss to net cash provided by operating activities: |
||||||||
|
Depreciation and amortization |
15,720 | 10,442 | ||||||
|
Non-cash interest expense |
5,305 | - | ||||||
|
Share-based compensation expense |
7,278 | 6,488 | ||||||
|
Tax impact related to the exercise of employee stock options and restricted stock |
(445 | ) | (660 | ) | ||||
|
Deferred income taxes - net and uncertain tax positions |
(12,078 | ) | (668 | ) | ||||
|
Accrued profit sharing and royalty expense, net of payments |
(27,016 | ) | 5,318 | |||||
|
Reserve for Turing receivable |
48,043 | - | ||||||
|
Provision for inventory reserves |
6,777 | (822 | ) | |||||
|
Deferred revenue |
- | 2,290 | ||||||
|
Other |
- | (81 | ) | |||||
|
Changes in assets and liabilities which used cash |
44,281 | 7,683 | ||||||
|
Net cash provided by operating activities |
77,457 | 23,657 | ||||||
|
Cash flows from investing activities: |
||||||||
|
Payment for acquisition, net of cash acquired |
- | (697,183 | ) | |||||
|
Proceeds from sale of intangible assets |
- | 4,000 | ||||||
|
Purchases of property, plant and equipment |
(10,882 | ) | (4,223 | ) | ||||
|
Payments for licensing agreements |
(3,500 | ) | - | |||||
|
Maturities of short-term investments |
- | 200,064 | ||||||
|
Net cash used in investing activities |
(14,382 | ) | (497,342 | ) | ||||
|
Cash flows from financing activities: |
||||||||
|
Proceeds from issuance of term loan |
- | 435,000 | ||||||
|
Payment of deferred financing fees |
- | (17,831 | ) | |||||
|
Proceeds from exercise of stock options and ESPP |
7,662 | 3,065 | ||||||
|
Tax impact related to the exercise of employee stock options and restricted stock |
445 | 660 | ||||||
|
Net cash provided by financing activities |
8,107 | 420,894 | ||||||
|
Effect of exchange rate changes on cash and cash equivalents |
645 | 1,011 | ||||||
|
Net increase (decrease) in cash and cash equivalents |
71,827 | (51,780 | ) | |||||
|
Cash and cash equivalents, beginning of period |
340,351 | 214,873 | ||||||
|
Cash and cash equivalents, end of period |
$ | 412,178 | $ | 163,093 | ||||
Impax Laboratories, Inc.
Non-GAAP Financial Measures
Adjusted net income, adjusted net income per diluted share, EBITDA, adjusted EBITDA, adjusted cost of revenues, adjusted research and development expenses and adjusted selling, general and administrative expenses are not measures of financial performance under generally accepted accounting principles (GAAP) and should not be construed as substitutes for, or superior to, GAAP net loss, GAAP net loss per diluted share, GAAP cost of revenues, GAAP research and development expenses and GAAP selling, general and administrative expenses as a measure of financial performance. However, management uses both GAAP financial measures and the disclosed non-GAAP financial measures internally to evaluate and manage the Company’s operations and to better understand its business. Further, management believes the addition of non-GAAP financial measures provides meaningful supplementary information to, and facilitates analysis by, investors in evaluating the Company’s financial performance, results of operations and trends. The Company’s calculations of adjusted net income, adjusted net income per diluted share, EBITDA, adjusted EBITDA, adjusted cost of revenues, adjusted research and development expenses and adjusted selling, general and administrative expenses, may not be comparable to similarly designated measures reported by other companies, since companies and investors may differ as to what type of events warrant adjustment.
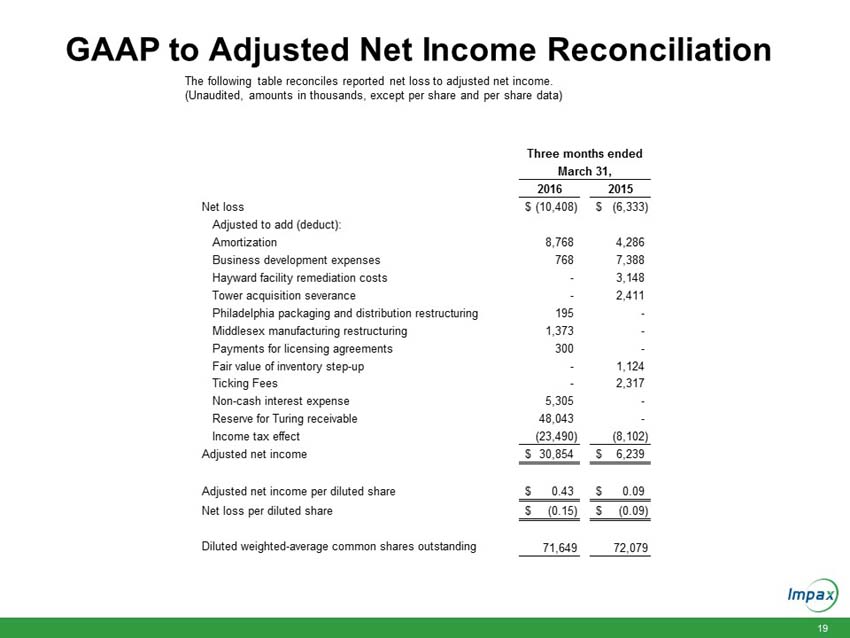
The following table reconciles reported net loss to adjusted net income.
(Unaudited, amounts in thousands, except per share data)
|
Three months ended |
||||||||
|
March 31, |
||||||||
|
2016 |
2015 |
|||||||
|
Net loss |
$ | (10,408 | ) | $ | (6,333 | ) | ||
|
Adjusted to add (deduct): |
||||||||
|
Amortization (a) |
8,768 | 4,286 | ||||||
|
Business development expenses (b) |
768 | 7,388 | ||||||
|
Hayward facility remediation costs (c) |
- | 3,148 | ||||||
|
Tower acquisition severance (d) |
- | 2,411 | ||||||
|
Philadelphia packaging and distribution restructuring (e) |
195 | - | ||||||
|
Middlesex manufacturing restructuring (f) |
1,373 | - | ||||||
|
Payments for licensing agreements (g) |
300 | - | ||||||
|
Fair value of inventory step-up (h) |
- | 1,124 | ||||||
|
Ticking fees (i) |
- | 2,317 | ||||||
|
Non-cash interest expense (j) |
5,305 | - | ||||||
|
Reserve for Turing receivable (k) |
48,043 | - | ||||||
|
Income tax effect |
(23,490 | ) | (8,102 | ) | ||||
|
Adjusted net income |
$ | 30,854 | $ | 6,239 | ||||
|
Adjusted net income per diluted share |
$ | 0.43 | $ | 0.09 | ||||
|
Net loss per diluted share |
$ | (0.15 | ) | $ | (0.09 | ) | ||
|
Diluted weighted-average common shares outstanding |
71,649 | 72,079 | ||||||
Impax Laboratories, Inc.
Non-GAAP Financial Measures
|
(a) |
Reflects amortization of intangible assets which increased substantially during the first quarter 2016 as compared to the prior year period as a result of the March 2015 acquisition of Tower (including its operating subsidiaries CorePharma LLC and Amedra Pharmaceuticals LLC) and Lineage. Included in “Cost of revenues” on the Consolidated Statements of Operations. |
|
(b) |
Professional fees related to business development activities, including Tower integration-related activities. Included in “Selling, general and administrative” expenses on the Consolidated Statements of Operations. |
|
(c) |
Remediation costs related to the Hayward, California manufacturing facility. Included in “Cost of revenues” on the Consolidated Statements of Operations. |
|
(d) |
Related to the Tower acquisition. Included in “Selling, general and administrative” expense on the Consolidated Statements of Operations. |
|
(e) |
Costs related to the closing of the Company’s packaging and distribution facilities in Pennsylvania. Included in “Cost of revenues” and “Other income” on the Consolidated Statements of Operations. |
|
(f) |
In March 2016, the Company announced the closure of its Middlesex, New Jersey manufacturing and packaging site and a related reduction in workforce at the site over the following 24 months. Included in “Cost of revenues” on the Consolidated Statements of Operations. |
|
(g) |
During the first quarter 2016, the Company made a milestone payment to a third party partner under the terms of a Research and Development Agreement. Included in “Research and development expense” on the Consolidated Statements of Operations. |
|
(h) |
Fair value adjustment of inventory as a result of purchase accounting for the Tower acquisition. Included in “Cost of revenues” on the Consolidated Statements of Operations. |
|
(i) |
Fees incurred relating to the Company’s $435.0 million term loan to lock in the financing terms beginning from the lenders’ commitment of the term loan to the actual allocation of the term loan upon the closing of the Tower transaction. The term loan was subsequently terminated by the Company on June 30, 2015. Included in “Interest expense” on the Consolidated Statements of Operations. |
|
(j) |
Related to non-cash accretion of debt discount attributable to deferred financing costs associated with both the $435.0 million term loan and $600.0 million of outstanding 2% convertible senior notes and bifurcation of the conversion option of the convertible notes. Included in “Interest expense” on the Consolidated Statements of Operations. |
|
(k) |
The Company recorded a reserve in the amount of $48.0 million representing the full amount of the estimated receivable due from Turing Pharmaceuticals AG as of March 31, 2016, as a result of the uncertainty of the Company collecting the reimbursement amounts owed by Turing. |
Impax Laboratories, Inc.
Non-GAAP Financial Measures
(Unaudited, amounts in thousands)
The following table reconciles reported net loss to adjusted EBITDA.
|
Three months ended |
||||||||
|
March 31, |
||||||||
|
2016 |
2015 |
|||||||
|
Net loss |
$ | (10,408 | ) | $ | (6,333 | ) | ||
|
Adjusted to add (deduct): |
||||||||
|
Interest income |
(333 | ) | (284 | ) | ||||
|
Interest expense |
8,331 | 3,975 | ||||||
|
Depreciation and amortization |
15,098 | 10,442 | ||||||
|
Income taxes |
(7,086 | ) | (4,372 | ) | ||||
|
EBITDA |
5,602 | 3,428 | ||||||
|
Adjusted to add (deduct): |
||||||||
|
Business development expenses |
768 | 7,388 | ||||||
|
Hayward facility remediation costs |
- | 3,148 | ||||||
|
Tower acquisition severance |
- | 2,411 | ||||||
|
Philadelphia packaging and distribution restructuring |
195 | - | ||||||
|
Middlesex manufacturing restructuring |
1,373 | - | ||||||
|
Payments for licensing agreements |
300 | - | ||||||
|
Reserve for Turing receivable |
48,043 | - | ||||||
|
Fair value of inventory step-up |
- | 1,124 | ||||||
|
Share-based compensation |
7,278 | 6,488 | ||||||
|
Adjusted EBITDA |
$ | 63,559 | $ | 23,987 | ||||
Impax Laboratories, Inc.
Non-GAAP Financial Measures
(Unaudited, amounts in thousands)
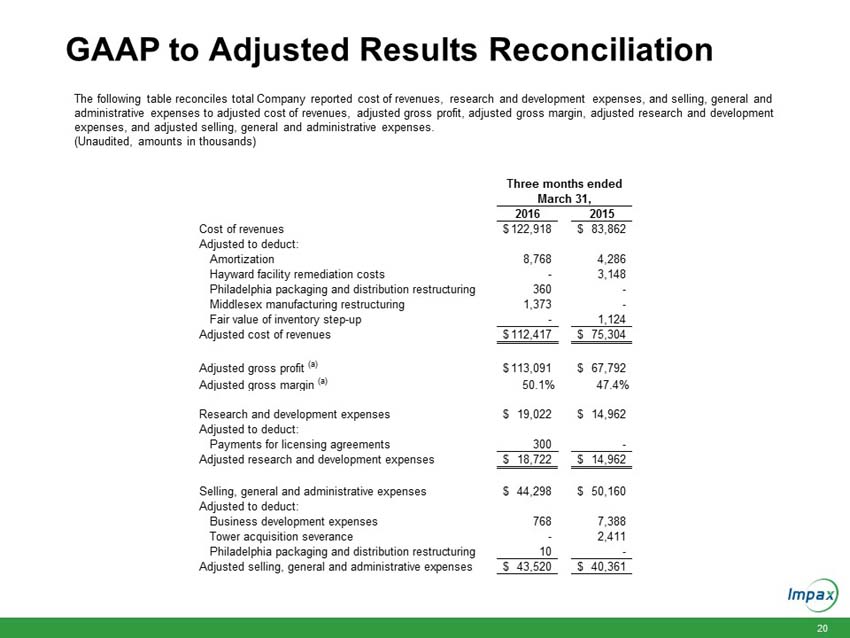
The following table reconciles reported cost of revenues, research and development expenses, and selling, general and administrative expenses to adjusted cost of revenues, adjusted gross profit, adjusted gross margin, adjusted research and development expenses, and adjusted selling, general and administrative expenses.
|
Three months ended |
||||||||
|
March 31, |
||||||||
|
2016 |
2015 |
|||||||
|
Cost of revenues |
$ | 122,918 | $ | 83,862 | ||||
|
Adjusted to deduct: |
||||||||
|
Amortization |
8,768 | 4,286 | ||||||
|
Hayward facility remediation costs |
- | 3,148 | ||||||
|
Philadelphia packaging and distribution restructuring |
360 | - | ||||||
|
Middlesex manufacturing restructuring |
1,373 | - | ||||||
|
Fair value of inventory step-up |
- | 1,124 | ||||||
|
Adjusted cost of revenues |
$ | 112,417 | $ | 75,304 | ||||
|
Adjusted gross profit (a) |
$ | 113,091 | $ | 67,792 | ||||
|
Adjusted gross margin (a) |
50.1 | % | 47.4 | % | ||||
|
Research and development expenses |
$ | 19,022 | $ | 14,962 | ||||
|
Adjusted to deduct: |
||||||||
|
Payments for licensing agreements |
300 | - | ||||||
|
Adjusted research and development expenses |
$ | 18,722 | $ | 14,962 | ||||
|
Selling, general and administrative expenses |
$ | 44,298 | $ | 50,160 | ||||
|
Adjusted to deduct: |
||||||||
|
Business development expenses |
768 | 7,388 | ||||||
|
Tower acquisition severance |
- | 2,411 | ||||||
|
Philadelphia packaging and distribution restructuring |
10 | - | ||||||
|
Adjusted selling, general and administrative expenses |
$ | 43,520 | $ | 40,361 | ||||
|
(a) |
Adjusted gross profit is calculated as total revenues less adjusted cost of revenues. Adjusted gross margin is calculated as adjusted gross profit divided by total revenues. |
Impax Laboratories, Inc.
Non-GAAP Financial Measures
(Unaudited, amounts in thousands)
The following tables reconcile the Impax Generics and Impax Specialty Pharma Divisions reported cost of revenues to adjusted cost of revenues, adjusted gross profit and adjusted gross margin.
Impax Generics Division Information
|
Three months ended |
||||||||
|
March 31, |
||||||||
|
2016 |
2015 |
|||||||
|
Cost of revenues |
$ | 110,122 | $ | 76,472 | ||||
|
Adjusted to deduct: |
||||||||
|
Amortization |
5,125 | 2,217 | ||||||
|
Hayward facility remediation costs |
- | 3,148 | ||||||
|
Philadelphia packaging and distribution restructuring |
360 | - | ||||||
|
Middlesex manufacturing restructuring |
1,373 | - | ||||||
|
Fair value of inventory step-up |
- | 275 | ||||||
|
Adjusted cost of revenues |
$ | 103,264 | $ | 70,832 | ||||
|
Adjusted gross profit (a) |
$ | 66,815 | $ | 57,909 | ||||
|
Adjusted gross margin (a) |
39.3 | % | 45.0 | % | ||||
Impax Specialty Pharma Division Information
|
Three months ended |
||||||||
|
March 31, |
||||||||
|
2016 |
2015 |
|||||||
|
Cost of revenues |
$ | 12,796 | $ | 7,390 | ||||
|
Adjusted to deduct: |
||||||||
|
Amortization |
3,643 | 2,069 | ||||||
|
Fair value of inventory step-up |
- | 849 | ||||||
|
Adjusted cost of revenues |
$ | 9,153 | $ | 4,472 | ||||
|
Adjusted gross profit (a) |
$ | 46,276 | $ | 9,883 | ||||
|
Adjusted gross margin (a) |
83.5 | % | 68.8 | % | ||||
|
(a) |
Adjusted gross profit is calculated as total revenues less adjusted cost of revenues. Adjusted gross margin is calculated as adjusted gross profit divided by total revenues. |
Page 13 of 13


