Exhibit 99.1
 |
MSC Industrial Direct Co., Inc. 75 Maxess Road Melville, New York 11747-3151 Tel. 800.645.7270 Fax. 800.255.5067 www.mscdirect.com |
news |
Investor Contact:
John G. Chironna
VP Investor Relations & Treasurer
MSC Industrial Direct Co., Inc.
(516) 812-1216
Media Contact:
Rachel Rosenblatt
FTI Consulting – Strategic Communications
(212) 850-5600
FOR RELEASE
MSC INDUSTRIAL DIRECT CO., INC. REPORTS
FISCAL 2013 THIRD QUARTER RESULTS
- Net Sales of $636.9 Million in Fiscal 2013 Third Quarter -
- Adjusted Diluted Earnings per Share of $1.05, GAAP Diluted Earnings per Share of $0.98 in Fiscal 2013 Third Quarter -
Melville, NY, July 10, 2013 - MSC INDUSTRIAL DIRECT CO., INC. (NYSE: MSM), “MSC” or the “Company,” a premier distributor of Metalworking and Maintenance, Repair and Operations (“MRO”) supplies to industrial customers throughout the United States and Canada, today reported financial results for its fiscal third quarter ended June 1, 2013.
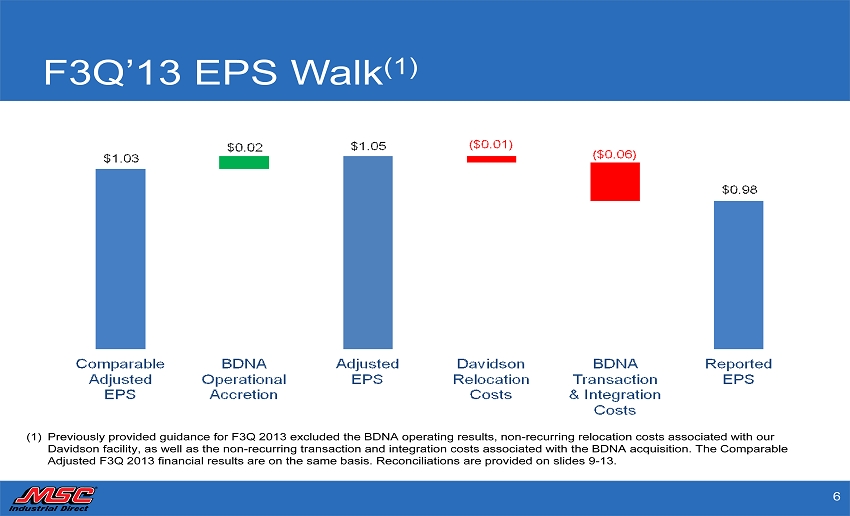
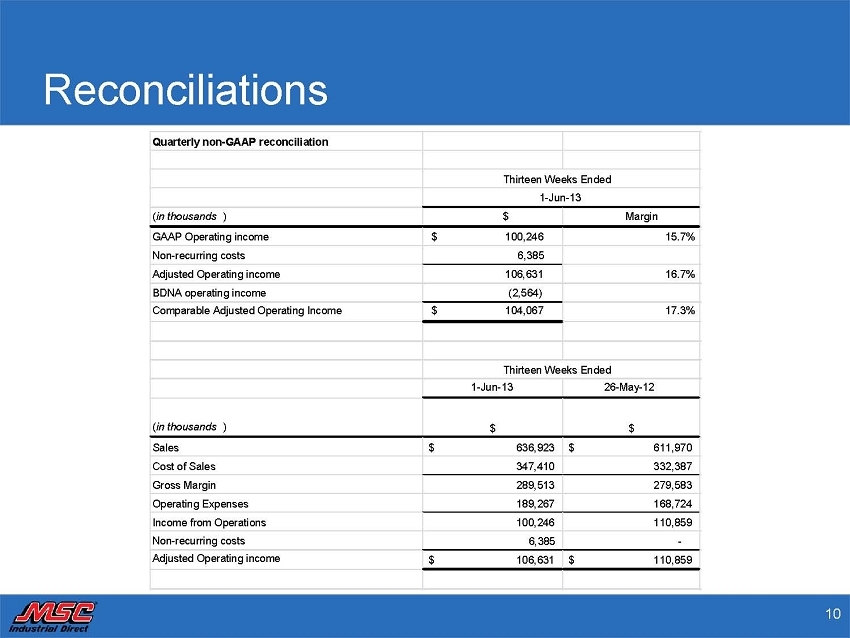
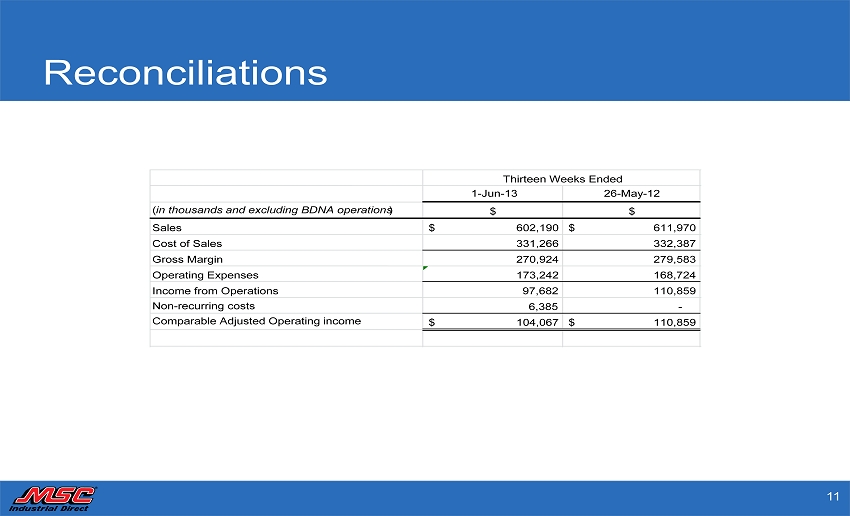
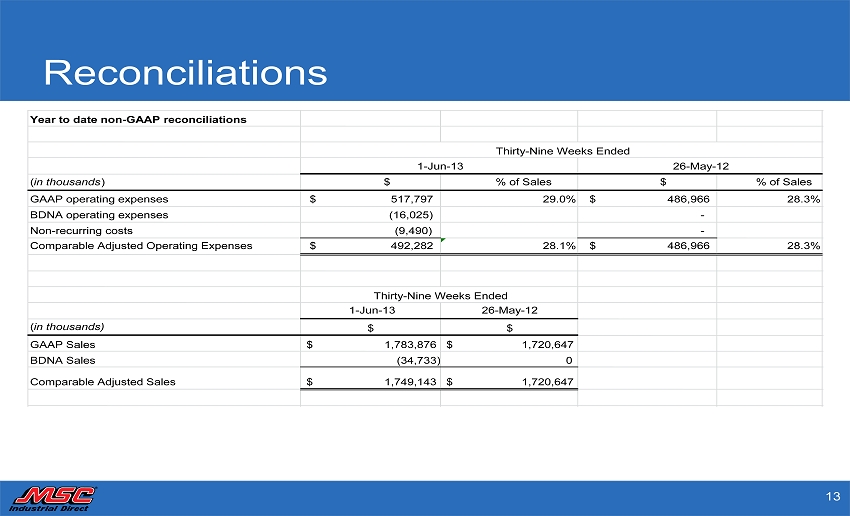
Net sales for the third quarter of fiscal 2013 were $636.9 million, an increase of 4.1% (5.7% on an average daily sales basis) over net sales of $612.0 million in the third quarter of fiscal 2012. The recently acquired Barnes Distribution North America (“BDNA”) business contributed approximately $34.7 million to net sales, reflecting its contribution to net sales from the acquisition date of April 22, 2013, to the end of the fiscal third quarter. Excluding non-recurring costs of $6.4 million associated with the BDNA acquisition and the co-location of the Company’s headquarters, adjusted operating income for the fiscal 2013 third quarter was $106.6 million, or 16.7% of net sales, compared to GAAP operating income of $110.9 million, or 18.1% of net sales in the same quarter a year ago. GAAP operating income for the fiscal 2013 third quarter was $100.2 million.
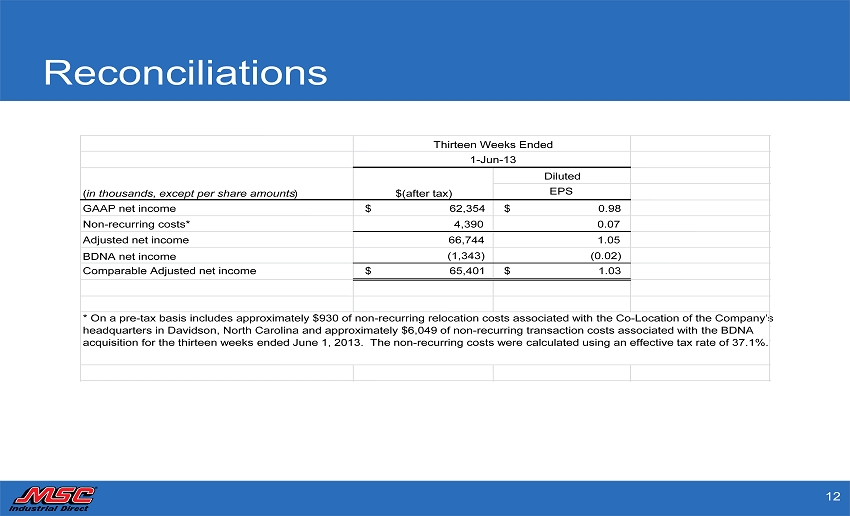
Excluding the after tax effects of non-recurring costs, adjusted net income for the third quarter of fiscal 2013 was $66.7 million, or $1.05 per diluted share (based on 63.1 million diluted shares outstanding), compared to GAAP net income of $70.2 million, or $1.10 per diluted share, a year ago (based on 63.1 million diluted shares outstanding). The BDNA operations contributed approximately $0.02 to the fiscal third quarter EPS and GAAP net income for the third quarter of fiscal 2013 was $62.4 million, or $0.98 per diluted share.
Erik Gershwind, President and Chief Executive Officer, stated, “We continue to fuel share gains in our targeted markets despite a sluggish manufacturing sector, particularly in metalworking-related end markets. The organic growth investments we have made in E-commerce, vending and other areas are offsetting a weak demand environment.”
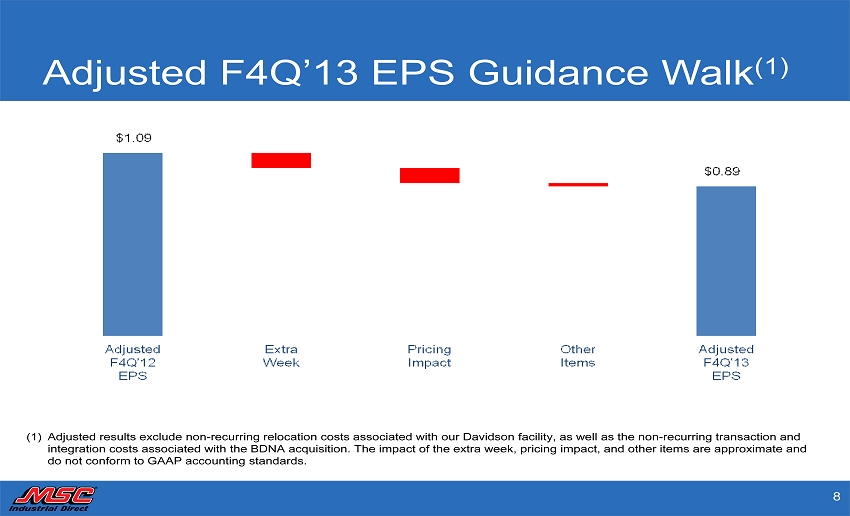
Jeff Kaczka, Executive Vice President and Chief Financial Officer, commented, "Our cost reduction and tight working capital management enabled us to exceed our third quarter EPS guidance against the backdrop of a soft demand environment. For the fourth quarter, our adjusted EPS at the midpoint of guidance is 89 cents, which is down from $1.09 last year, reflecting primarily the extra week in FY12 and the lack of the mid-year price increase. After those adjustments, the fourth quarter will be very similar to the past couple of quarters.”
MSC INDUSTRIAL DIRECT CO., INC. REPORTS FISCAL 2013 THIRD QUARTER RESULTS Page - 2 -
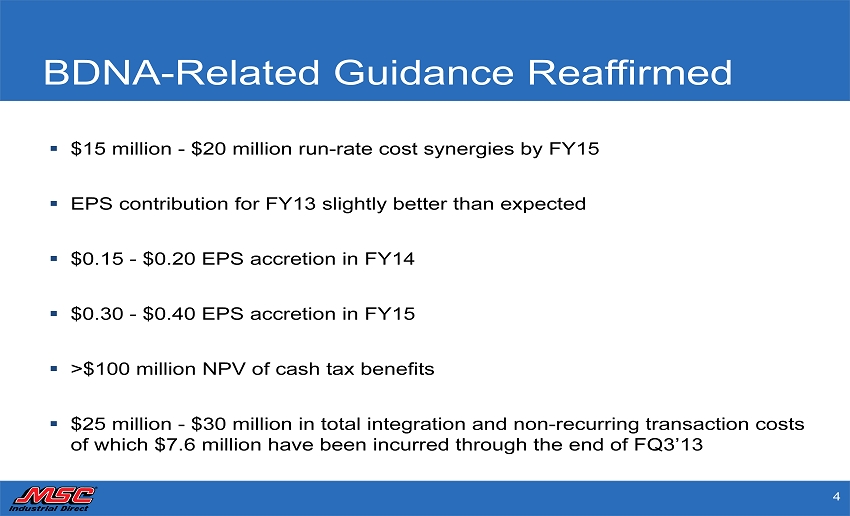
Mr. Gershwind concluded, “I remain confident about our future prospects for revenue and earnings growth, as we execute on our strategic investments and gain traction with the new, high margin growth platform in BDNA. We are excited about our early returns on BDNA and are beginning to execute our integration plans including distribution network and headquarter consolidations with MSC. We are on track to achieving our long-term growth goal of $4 billion in revenue by FY2016.”
Outlook
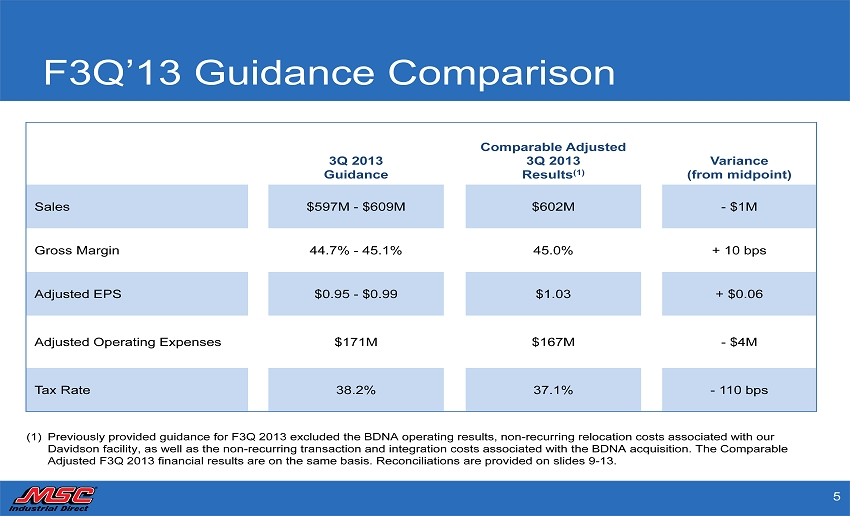
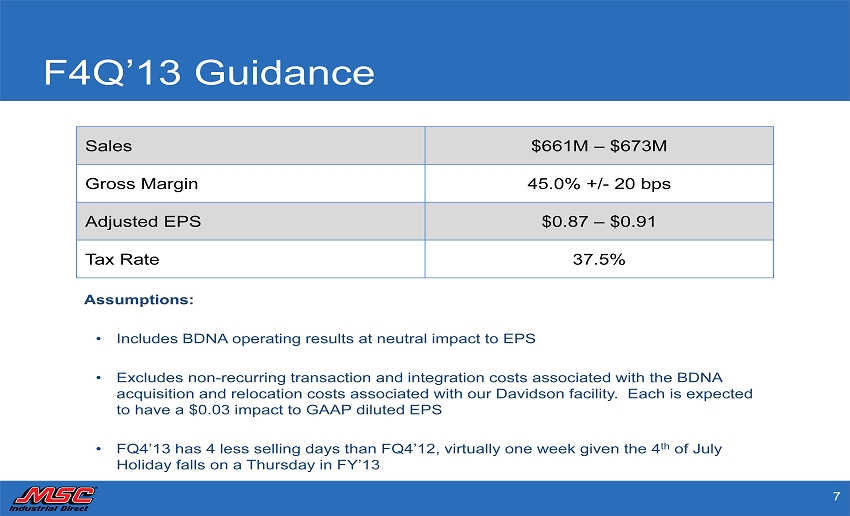
Based on a continuation of current market conditions, for the fiscal 2013 fourth quarter the Company expects net sales including BDNA to be between $661 million and $673 million. At the midpoint, average daily sales exclusive of BDNA are expected to be flat. Excluding non-recurring costs related to the co-location of the Company’s headquarters and non-recurring transaction and integration costs associated with BDNA, the Company expects adjusted diluted earnings per share for the fourth quarter of fiscal 2013 to be between $0.87 and $0.91.
The Company expects the non-recurring costs related to the co-location of the Company’s headquarters to have a $0.03 impact and the integration costs related to the BDNA acquisition to have approximately a $0.03 impact on its GAAP diluted earnings per share in the fiscal fourth quarter.
The management of MSC will host a conference call today, at 11:00 a.m. Eastern Time, to review the Company’s results for the fiscal 2013 third quarter. The call and accompanying slides may be accessed via the Internet on MSC’s website located at: http://investor.mscdirect.com. A replay of the conference call will be available on the Company’s website until Friday, August 9, 2013.
Alternatively, the conference call can be accessed by dialing 1-877-270-2148 (U.S.) or 1-412-902-6510 (international). A replay will be available within one hour of the conclusion of the call and will remain available until Friday, August 9, 2013. The replay is accessible by dialing 1-877-344-7529 (U.S.) or 1-412-317-0088 (international) and entering passcode 10030820.
The Company’s next reporting date for its fiscal 2013 fourth quarter will be October 30, 2013.
An explanation and reconciliation of the non-GAAP financial measures contained in this press release to the most directly comparable GAAP financial measures are included in the attached tables.
About MSC Industrial Direct Co., Inc.
MSC Industrial Direct Co., Inc. is one of the largest distributors of Metalworking and Maintenance, Repair and Operations ("MRO") supplies to industrial customers throughout the United States and Canada. MSC employs one of the industry's largest sales forces and distributes approximately 600,000 industrial products from approximately 3,000 suppliers. In-stock availability is approximately 99%, with next day standard delivery to the contiguous United States on qualifying orders up until 8 p.m. Eastern Time. For more information, visit MSC's website at http://www.mscdirect.com.
Note Regarding Forward-Looking Statements: Statements in this Press Release may constitute "forward-looking statements" under the Private Securities Litigation Reform Act of 1995. All statements, other than statements of historical fact, that address activities, events or developments that we expect, believe or anticipate will or may occur in the future, including statements about expected future results, are forward-looking statements. Forward-looking statements involve risks and uncertainties that could cause actual results to differ materially from those anticipated by these forward-looking statements. Readers are cautioned not to place undue reliance on these forward-looking statements, which speak only as of the date hereof. The inclusion of any statement in this release does not constitute an admission by MSC or any other person that the events or circumstances described in such statement are material. Factors that could cause actual results to differ materially from those in forward-looking statements include: problems with successfully integrating acquired operations, unanticipated delays or costs associated with opening or expanding our customer fulfillment centers or customer service centers, current economic, political and social conditions, changing customer and product mixes, financial restrictions on outstanding borrowings, industry consolidation, the loss of key suppliers or supply chain disruptions, competition, general economic conditions in the markets in which we operate, volatility in commodity and energy prices, credit risk of our customers, risk of cancellation or rescheduling of orders, work stoppages or other business interruptions (including those due to extreme weather conditions) at transportation centers or shipping ports, the risk of war, terrorism and similar hostilities, dependence on our information systems and on key personnel, and the outcome of potential government or regulatory proceedings or future litigation relating to pending or future claims, inquiries or audits. Additional information concerning these and other risks is described under "Risk Factors" and "Management's Discussion and Analysis of Financial Condition and Results of Operations" in the reports on Forms 10-K and 10-Q that we file with the U.S. Securities and Exchange Commission. We assume no obligation to update any of these forward-looking statements.
(Tables Follow)
MSC INDUSTRIAL DIRECT CO., INC. REPORTS FISCAL 2013 THIRD QUARTER RESULTS Page - 3 -
MSC INDUSTRIAL DIRECT CO., INC. AND SUBSIDIARIES
Condensed Consolidated Balance Sheets
(In thousands)
| June 1, 2013 | September 1, 2012 | |||||||
| (Unaudited) | ||||||||
| ASSETS | ||||||||
| Current Assets: | ||||||||
| Cash and cash equivalents | $ | 58,017 | $ | 168,453 | ||||
| Accounts receivable, net of allowance for doubtful accounts | 337,779 | 297,215 | ||||||
| Inventories | 414,268 | 393,412 | ||||||
| Prepaid expenses and other current assets | 43,584 | 29,313 | ||||||
| Deferred income taxes | 31,718 | 31,718 | ||||||
| Total current assets | 885,366 | 920,111 | ||||||
| Property, plant and equipment, net | 234,643 | 174,597 | ||||||
| Goodwill | 632,801 | 289,124 | ||||||
| Identifiable intangibles, net | 159,807 | 51,212 | ||||||
| Other assets | 6,875 | 9,832 | ||||||
| Total assets | $ | 1,919,492 | $ | 1,444,876 | ||||
| LIABILITIES AND SHAREHOLDERS’ EQUITY | ||||||||
| Current Liabilities: | ||||||||
| Revolving credit note | $ | 40,000 | $ | -- | ||||
| Current maturities of long-term debt | 10,527 | 1,007 | ||||||
| Accounts payable | 106,082 | 96,640 | ||||||
| Accrued liabilities | 88,240 | 72,868 | ||||||
| Total current liabilities | 244,849 | 170,515 | ||||||
| Long-term debt, net of current maturities | 242,353 | 2,189 | ||||||
| Deferred income taxes and tax uncertainties | 85,180 | 85,061 | ||||||
| Total liabilities | 572,382 | 257,765 | ||||||
| Commitments and Contingencies | ||||||||
| Shareholders’ Equity: | ||||||||
| Preferred Stock | -- | -- | ||||||
| Class A common stock | 55 | 53 | ||||||
| Class B common stock | 14 | 16 | ||||||
| Additional paid-in capital | 522,327 | 483,682 | ||||||
| Retained earnings | 1,095,568 | 970,965 | ||||||
| Accumulated other comprehensive loss | (3,608 | ) | (2,443 | ) | ||||
| Class A treasury stock, at cost | (267,246 | ) | (265,162 | ) | ||||
| Total shareholders’ equity | 1,347,110 | 1,187,111 | ||||||
| Total liabilities and shareholders’ equity | $ | 1,919,492 | $ | 1,444,876 | ||||
MSC INDUSTRIAL DIRECT CO., INC. REPORTS FISCAL 2013 THIRD QUARTER RESULTS Page - 4 -
MSC INDUSTRIAL DIRECT CO., INC. AND SUBSIDIARIES
Condensed Consolidated Statements of Income
(In thousands, except net income per share data)
(Unaudited)
| Thirteen Weeks Ended | Thirty-Nine Weeks Ended | |||||||||||||||
| June 1, 2013 | May 26, 2012 | June 1, 2013 | May 26, 2012 | |||||||||||||
| Net sales | $ | 636,923 | $ | 611,970 | $ | 1,783,876 | $ | 1,720,647 | ||||||||
| Cost of goods sold | 347,410 | 332,387 | 972,905 | 929,471 | ||||||||||||
| Gross profit | 289,513 | 279,583 | 810,971 | 791,176 | ||||||||||||
| Operating expenses | 189,267 | 168,724 | 517,797 | 486,966 | ||||||||||||
| Income from operations | 100,246 | 110,859 | 293,174 | 304,210 | ||||||||||||
| Other income (expense): | ||||||||||||||||
| Interest expense | (1,141 | ) | (63 | ) | (1,266 | ) | (179 | ) | ||||||||
| Interest income | 31 | 42 | 113 | 160 | ||||||||||||
| Other income (expense), net | (5 | ) | 15 | 66 | (5 | ) | ||||||||||
| Total other income (expense) | (1,115 | ) | (6 | ) | (1,087 | ) | (24 | ) | ||||||||
| Income before provision for income taxes | 99,131 | 110,853 | 292,087 | 304,186 | ||||||||||||
| Provision for income taxes | 36,777 | 40,642 | 110,467 | 114,070 | ||||||||||||
| Net income | $ | 62,354 | $ | 70,211 | $ | 181,620 | $ | 190,116 | ||||||||
| Per Share Information: | ||||||||||||||||
| Net income per common share: | ||||||||||||||||
| Basic | $ | 0.99 | $ | 1.11 | $ | 2.88 | $ | 3.02 | ||||||||
| Diluted | $ | 0.98 | $ | 1.10 | $ | 2.86 | $ | 3.00 | ||||||||
| Weighted average shares used in computing net income per common share: | ||||||||||||||||
| Basic | 62,808 | 62,651 | 62,628 | 62,517 | ||||||||||||
| Diluted | 63,134 | 63,055 | 62,947 | 62,896 | ||||||||||||
| Cash dividend declared per common share | $ | 0.30 | $ | 0.25 | $ | 0.90 | $ | 0.75 | ||||||||
MSC INDUSTRIAL DIRECT CO., INC. REPORTS FISCAL 2013 THIRD QUARTER RESULTS Page - 5 -
MSC INDUSTRIAL DIRECT CO., INC. AND SUBSIDIARIES
Condensed Consolidated Statements of Comprehensive Income
(In thousands)
(Unaudited)
| Thirteen Weeks Ended | Thirty-Nine Weeks Ended | |||||||||||||||
| June 1, 2013 | May 26, 2012 | June 1, 2013 | May 26, 2012 | |||||||||||||
| Net income, as reported | $ | 62,354 | $ | 70,211 | $ | 181,620 | $ | 190,116 | ||||||||
| Cumulative foreign currency translation adjustment | (388 | ) | (132 | ) | (1,165 | ) | (505 | ) | ||||||||
| Comprehensive income | $ | 61,966 | $ | 70,079 | $ | 180,455 | $ | 189,611 | ||||||||
MSC INDUSTRIAL DIRECT CO., INC. REPORTS FISCAL 2013 THIRD QUARTER RESULTS Page - 6 -
MSC INDUSTRIAL DIRECT CO., INC. AND SUBSIDIARIES
Condensed Consolidated Statements of Cash Flows
(In thousands)
(Unaudited)
| Thirty-Nine Weeks Ended | ||||||||
| June 1, 2013 | May 26, 2012 | |||||||
| Cash Flows from Operating Activities: | ||||||||
| Net income | $ | 181,620 | $ | 190,116 | ||||
| Adjustments to reconcile net income to net cash provided by operating activities: | ||||||||
| Depreciation and amortization | 33,994 | 25,279 | ||||||
| Stock-based compensation | 11,989 | 11,410 | ||||||
| Loss on disposal of property, plant, and equipment | 791 | 876 | ||||||
| Provision for doubtful accounts | 2,111 | 2,520 | ||||||
| Deferred income taxes | — | 3,025 | ||||||
| Excess tax benefits from stock-based compensation | (5,563 | ) | (4,844 | ) | ||||
| Write-off of deferred financing costs on previous credit facility | 594 | — | ||||||
| Changes in operating assets and liabilities, net of amounts associated with business acquired: | ||||||||
| Accounts receivable | (6,791 | ) | (30,150 | ) | ||||
| Inventories | 28,084 | (44,499 | ) | |||||
| Prepaid expenses and other current assets | (11,136 | ) | (11,837 | ) | ||||
| Other assets | 2,162 | 4,388 | ||||||
| Accounts payable and accrued liabilities | 7,574 | (1,076 | ) | |||||
| Total adjustments | 63,809 | (44,908 | ) | |||||
| Net cash provided by operating activities | 245,429 | 145,208 | ||||||
| Cash Flows from Investing Activities: | ||||||||
| Expenditures for property, plant and equipment | (62,305 | ) | (28,753 | ) | ||||
| Cash used in business acquisition, net of cash received | (548,769 | ) | (33,451 | ) | ||||
| Net cash used in investing activities | (611,074 | ) | (62,204 | ) | ||||
| Cash Flows from Financing Activities: | ||||||||
| Purchases of treasury stock | (3,656 | ) | (47,986 | ) | ||||
| Payment of cash dividends | (56,843 | ) | (47,341 | ) | ||||
| Payments on capital lease and financing obligations | (981 | ) | (721 | ) | ||||
| Excess tax benefits from stock-based compensation | 5,563 | 4,844 | ||||||
| Proceeds from sale of Class A common stock in connection with associate stock purchase plan | 2,891 | 2,630 | ||||||
| Proceeds from exercise of Class A common stock options | 19,986 | 19,566 | ||||||
| Borrowings under financing obligation | 257 | 1,050 | ||||||
| Borrowings under Credit Facility | 370,000 | — | ||||||
| Credit facility financing costs | (1,904 | ) | — | |||||
| Pay down revolving loans from credit facility | (80,000 | ) | — | |||||
| Net cash provided (used) in financing activities | 255,313 | (67,958 | ) | |||||
| Effect of foreign exchange rate changes on cash and cash equivalents | (104 | ) | (56 | ) | ||||
| Net (decrease) increase in cash and cash equivalents | (110,436 | ) | 14,990 | |||||
| Cash and cash equivalents – beginning of period | 168,453 | 95,959 | ||||||
| Cash and cash equivalents – end of period | $ | 58,017 | $ | 110,949 | ||||
| Supplemental Disclosure of Cash Flow Information: | ||||||||
| Cash paid for income taxes | $ | 102,107 | $ | 113,299 | ||||
| Cash paid for interest | $ | 367 | $ | 34 | ||||
# # #
MSC INDUSTRIAL DIRECT CO., INC. REPORTS FISCAL 2013 THIRD QUARTER RESULTS Page - 7 -
Non-GAAP Financial Measures
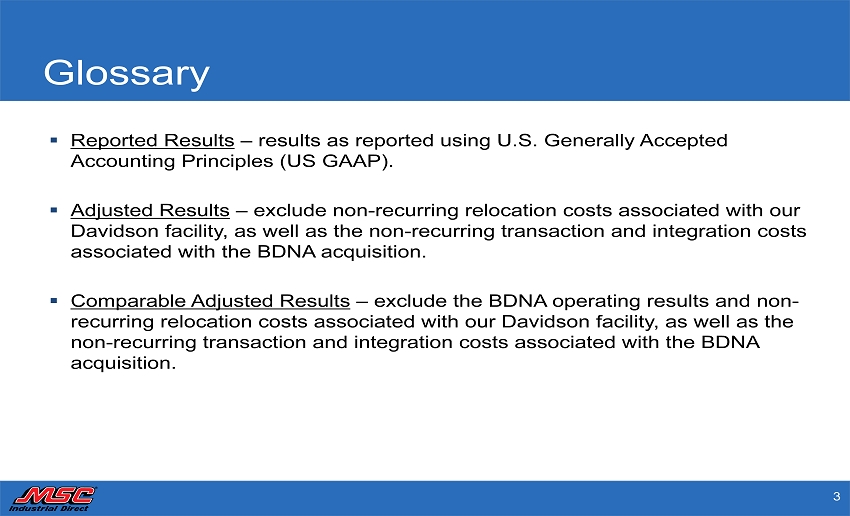
To supplement MSC’s unaudited selected financial data presented on a basis consistent with Generally Accepted Accounting Principles (“GAAP”), the Company discloses certain non-GAAP financial measures, including adjusted operating income, adjusted net income, and adjusted net income per diluted share. The adjusted supplemental measures exclude non-recurring costs associated with the Barnes Distribution North America (“BDNA”) and co-location of our corporate headquarters in Davidson, North Carolina and the related tax effects. These non-GAAP measures are not in accordance with or an alternative for GAAP, and may be different from non-GAAP measures used by other companies. We believe that these non-GAAP measures have limitations in that they do not reflect all of the amounts associated with MSC's results of operations as determined in accordance with GAAP and that these measures should only be used to evaluate MSC’s results of operations in conjunction with the corresponding GAAP measures. The presentation of this additional information is not meant to be considered in isolation or as a substitute for the most directly comparable GAAP measures. We compensate for the limitations of non-GAAP financial measures by relying upon GAAP results to gain a complete picture of Company performance.
In calculating non-GAAP financial measures, we exclude these non-recurring costs to facilitate a review of the comparability of the Company's operating performance on a period-to-period basis because such costs are not, in our view, related to the Company's ongoing operational performance. We use non-GAAP measures to evaluate the operating performance of our business, for comparison with forecasts and strategic plans, and for benchmarking performance externally against competitors. In addition, we use non-GAAP financial measures as performance metrics for management incentive programs. Since we find these measures to be useful, we believe that investors benefit from seeing results "through the eyes" of management in addition to seeing GAAP results. We believe that these non-GAAP measures, when read in conjunction with the Company's GAAP financials, provide useful information to investors by offering:
| · | the ability to make more meaningful period-to-period comparisons of the Company’s on-going operating results; | |
| · | the ability to better identify trends in the Company’s underlying business and perform related trend analyses; and | |
| · | a better understanding of how management plans and measures the Company’s underlying business. |
The following tables reconcile GAAP operating income, GAAP net income and GAAP net income per diluted share ("EPS") to non-GAAP adjusted operating income, adjusted net income, and adjusted net income per diluted share:
| Thirteen Weeks Ended | ||||||||
| June 1, 2013 | ||||||||
| (in thousands) | $ | Margin | ||||||
| GAAP Operating income | $ | 100,246 | 15.7 | % | ||||
| Non-recurring costs | 6,385 | |||||||
| Adjusted Operating income | $ | 106,631 | 16.7 | % | ||||
MSC INDUSTRIAL DIRECT CO., INC. REPORTS FISCAL 2013 THIRD QUARTER RESULTS Page - 8 -
| Thirteen Weeks Ended | ||||||||
| June 1, 2013 | May 26, 2012 | |||||||
| (in thousands) | $ | $ | ||||||
| Sales | $ | 636,923 | $ | 611,970 | ||||
| Cost of Sales | 347,410 | 332,387 | ||||||
| Gross Margin | 289,513 | 279,583 | ||||||
| Operating Expenses | 189,267 | 168,724 | ||||||
| Income from Operations | 100,246 | 110,859 | ||||||
| Non-recurring costs | 6,385 | - | ||||||
| Adjusted Operating income | $ | 106,631 | $ | 110,859 | ||||
| Thirteen Weeks Ended | ||||||||
| June 1, 2013 | ||||||||
| Diluted | ||||||||
| (in thousands, except per share amounts) | $(after tax) | EPS | ||||||
| GAAP net income | $ | 62,354 | $ | 0.98 | ||||
| Non-recurring costs* | 4,390 | 0.07 | ||||||
| Adjusted net income | $ | 66,744 | $ | 1.05 | ||||
* On a pre-tax basis includes approximately $930 of non-recurring relocation costs associated with the Co-Location of the Company’s headquarters in Davidson, North Carolina and approximately $6,049 of non-recurring transaction costs associated with the BDNA acquisition for the thirteen weeks ended June 1, 2013. The non-recurring costs were calculated using an effective tax rate of 37.1%.