UNITED STATES
SECURITIES AND EXCHANGE COMMISSION
WASHINGTON, D.C. 20549
Form
(Mark One)
|
|
REGISTRATION STATEMENT PURSUANT TO SECTION 12(b) or (g) OF THE SECURITIES EXCHANGE ACT OF 1934 |
OR
|
|
ANNUAL REPORT PURSUANT TO SECTION 13 OR 15(d) OF THE SECURITIES EXCHANGE ACT OF 1934 |
For the fiscal year ended
OR
|
|
TRANSITION REPORT PURSUANT TO SECTION 13 OR 15(d) OF THE SECURITIES EXCHANGE ACT OF 1934 |
For the transition period from to
OR
|
|
SHELL COMPANY REPORT PURSUANT TO SECTION 13 OR 15(d) OF THE SECURITIES EXCHANGE ACT OF 1934 |
Date of event requiring this shell company report
Commission file number:
|
|
|
|
(Exact name of Registrant as specified in its charter)
Republic of
(Jurisdiction of incorporation or organization)
(Address of principal executive offices)
Tel +
(Name, Telephone, Email and/or Facsimile number and Address of Company Contact Person)
|
|
|
|
Securities registered or to be registered pursuant to Section 12(b) of the Act.
|
Title of each class |
|
Trading Symbol(s) |
|
Name of each exchange on which registered |
|
|
|
|
|
|
|
|
|
|
|
|
|
(Which represent the right to receive two Shares) |
|
|
|
* Not for trading, but only in connection with the registration of American Depositary Shares, pursuant to the requirements of the Securities and Exchange Commission. |
Securities registered or to be registered pursuant to Section 12(g) of the Act:
None
Securities for which there is a reporting obligation pursuant to Section 15(d) of the Act:
None
Indicate the number of outstanding shares of each of the issuer’s classes of capital or common stock as of the close of the period covered by the annual report.
|
Ordinary shares |
|
Indicate by check mark if the registrant is a well-known seasoned issuer, as defined in Rule 405 of the Securities Act.
Yes
If this report is an annual or transition report, indicate by check mark if the registrant is not required to file reports pursuant to Section 13 or 15(d) of the Securities Exchange Act of 1934.
Yes
Note - Checking the box above will not relieve any registrant required to file reports pursuant to Section 13 or 15(d) of the Securities Exchange Act of 1934 from their obligations under those Sections.
Indicate by check mark whether the registrant (1) has filed all reports required to be filed by Section 13 or 15(d) of the Securities Exchange Act of 1934 during the preceding 12 months (or for such shorter period that the registrant was required to file such reports), and (2) has been subject to such filing requirements for the past 90 days.
Yes
Indicate by check mark whether the registrant has submitted electronically every Interactive Data File required to be submitted and posted pursuant to Rule 405 of Regulation S-T (§ 232.405 of this chapter) during the preceding 12 months (or for such shorter period that the registrant was required to submit and post such files).
Yes
Indicate by check mark whether the registrant is a large accelerated filer, an accelerated filer, a non-accelerated filer, or an emerging growth company. See the definitions of “large accelerated filer,” “accelerated filer,” and “emerging growth company” in Rule 12b-2 of the Exchange Act.
If an emerging growth company that prepares its financial statements in accordance with U.S. GAAP, indicate by check mark if the registrant has elected not to use the extended transition period for complying with any new or revised financial accounting standards† provided pursuant to Section 13(a) of the Exchange Act. ☐
† The term “new or revised financial accounting standard” refers to any update issued by the Financial Accounting Standards Board to its Accounting Standards Codification after April 5, 2012.
Indicate by check mark whether the registrant has filed a report on and attestation to its management's assessment of the effectiveness of its internal control over financial reporting under Section 404(b) of the Sarbanes-Oxley Act (15 U.S.C. 7262(b)) by the registered public accounting firm that prepared or issued its audit report.
If securities are registered pursuant to Section 12(b) of the Act, indicate by check mark whether the financial statements of the registrant included in the filing reflect the correction of an error to previously issued financial statements. ☐
Indicate by check mark whether any of those error corrections are restatements that required a recovery analysis of incentive- based compensation received by any of the registrant’s executive officers during the relevant recovery period pursuant to §240.10D-1(b). ☐
Indicate by check mark which basis of accounting the registrant has used to prepare the financial statements included in this filing:
U.S. GAAP ☐
If “Other” has been checked in response to the previous question, indicate by check mark which financial statement item the registrant has elected to follow.
Item 17 ☐ Item 18 ☐
If this is an annual report, indicate by check mark whether the registrant is a shell company (as defined in Rule 12b-2 of the Exchange Act).
Yes
TABLE OF CONTENTS
Certain disclosures contained herein including, without limitation, certain information appearing in “Item 4 – Information on the Company”, and in particular “Item 4 – Exploration & Production”, “Item 5 – Operating and Financial Review and Prospects” and “Item 11 – Quantitative and Qualitative Disclosures about Market Risk” contain forward-looking statements regarding future events and the future results of Eni that are based on current expectations, estimates, forecasts, and projections about the industries in which Eni operates and the beliefs and assumptions of the management of Eni. Eni may also make forward-looking statements in other written materials, including other documents filed with or furnished to the U.S. Securities and Exchange Commission (the “SEC”). In addition, Eni’s senior management may make forward-looking statements orally to analysts, investors, representatives of the media and others. In particular, among other statements, certain statements with regard to management objectives, trends in results of operations, margins, costs, return on capital, risk management and competition are forward looking in nature. Words such as ‘expects’, ‘anticipates’, ‘targets’, ‘goals’, ‘projects’, ‘intends’, ‘plans’, ‘believes’, ‘seeks’, ‘estimates’, variations of such words, and similar expressions are intended to identify such forward-looking statements. These forward-looking statements are only predictions and are subject to risks, uncertainties, and assumptions that are difficult to predict because they relate to events and depend on circumstances that will occur in the future. Therefore, Eni’s actual results may differ materially and adversely from those expressed or implied in any forward-looking statements. Factors that might cause or contribute to such differences include, but are not limited to, those discussed in this Annual Report on Form 20-F under the section entitled “Risk factors” and elsewhere. Any forward-looking statements made by or on behalf of Eni speak only as of the date they are made. Eni does not undertake to update forward-looking statements to reflect any changes in Eni’s expectations with regard thereto or any changes in events, conditions or circumstances on which any such statement is based. The reader should, however, consult any further disclosures Eni may make in documents it files with the SEC.
In this Form 20- F, the terms “Eni”, the “Group”, or the “Company” refer to the parent company Eni SpA and its consolidated subsidiaries and, unless the context otherwise requires, their respective predecessor companies. All references to “Italy” or the “State” are references to the Republic of Italy, all references to the “Government” are references to the government of the Republic of Italy. For definitions of certain oil and gas terms used herein and certain conversions, see “Glossary” and “Conversion Table”.
The Consolidated Financial Statements of Eni, included in this Annual Report, have been prepared in accordance with International Financial Standards (IFRS) as issued by the International Accounting Standards Board (IASB).
Unless otherwise indicated, any reference herein to “Consolidated Financial Statements” is to the
Consolidated Financial Statements of Eni (including the Notes thereto) included herein.
Unless otherwise specified or the context otherwise requires, references herein to “dollars”, “$”, “U.S. dollars”, “US$” and “USD” are to the currency of the United States, and references to “euro”, “EUR” and “€” are to the currency of the European Monetary Union.
Unless otherwise specified or the context otherwise requires, references herein to “Division” and “segment” are to any of the following Eni’s business activities: “Exploration & Production” (or “E&P”), “Global Gas & LNG Portfolio” (or “GGP”), “Refining & Marketing and Chemicals” (or “R&M & C”), “Plenitude & Power” and “Corporate and Other activities”.
References to Versalis or Chemical are to Eni’s chemical activities which are managed through its fully-owned subsidiary Versalis and Versalis’ controlled entities.
References to Plenitude are to Eni’s retail gas and power activities and renewables business which are managed through its fully-owned subsidiary Plenitude and Plenitude’s controlled entities. The results of the operations of Plenitude are included in the segment information “Plenitude & Power” for financial reporting purposes.
Statements made in “Item 4 – Information on the Company” referring to Eni’s competitive position are based on the Company’s belief, and in some cases rely on a range of sources, including investment analysts’ reports, independent market studies and Eni’s internal assessment of market share based on publicly available information about the financial results and performance of market participants. Market share estimates contained in this document are based on management estimates unless otherwise indicated.
Below is a selection of the most frequently used terms throughout this Annual Report on Form 20-F. Any reference herein to a non-GAAP measure and to its most directly comparable GAAP measure shall be intended as a reference to a non-IFRS measure and the comparable IFRS measure.
Financial terms
| Identified net gains (losses) |
Identified net gains (losses) include certain significant income or charges pertaining to either: (i) infrequent or unusual events and transactions, being identified as non-recurring items under such circumstances; (ii) certain events or transactions which are not considered to be representative of the ordinary course of business, as in the case of environmental provisions, restructuring charges, asset impairments or write ups and gains or losses on divestments even though they occurred in past periods or are likely to occur in future ones. Exchange rate differences and derivatives relating to industrial activities and commercial payables and receivables, particularly exchange rate derivatives to manage commodity pricing formulas which are quoted in a currency other than the functional currency are reclassified in operating profit with a corresponding adjustment to net finance charges, notwithstanding the handling of foreign currency exchange risks is made centrally by netting off naturally-occurring opposite positions and then dealing with any residual risk exposure in the derivative market. Finally, special items include the accounting effects of fair-valued commodity derivatives relating to commercial exposures, in addition to those which lack the criteria to be designed as hedges, also those which are not eligible for the own use exemption, including the ineffective portion of cash flow hedges, as well as the accounting effects of settled commodity and exchange rates derivatives whenever it is deemed that the underlying transaction is expected to occur in future reporting periods. Correspondently, special charges/gains also include the evaluation effects relating to assets/liabilities utilized in a natural hedge relation to offset a market risk, as in the case of accrued currency differences at finance debt denominated in a currency other than the reporting currency, where the cash outflows for the reimbursement are matched by highly probable cash inflows in the same currency. The deferral of both the unrealized portion of fair-valued commodity and other derivatives and evaluation effects are reversed to future reporting periods when the underlying transaction occurs. |
| Leverage |
A non-GAAP measure of the Company’s financial condition, calculated as the ratio between net borrowings and shareholders’ equity, including non-controlling interest. For a discussion of management’s view of the usefulness of this measure and its reconciliation with the most directly comparable GAAP measure, “Ratio of total debt to total shareholders equity (including non-controlling interest)” see “Item 5 – Financial Condition”. |
| Net borrowings |
Eni evaluates its financial condition by reference to “net borrowings”, which is a non-GAAP measure. Eni calculates net borrowings as total finance debt less: cash, cash equivalents and certain very liquid investments not related to operations, including among others non-operating financing receivables and securities not related to operations. Non-operating financing receivables consist of amounts due to Eni’s financing subsidiaries from banks and other financing institutions and amounts due to other subsidiaries from banks for investing purposes and deposits in escrow. Securities not related to operations consist primarily of government and corporate securities. For a discussion of management’s view of the usefulness of this measure and its reconciliation with the most directly comparable GAAP measure, “Total debt” see “Item 5 – Financial condition”. |
| TSR | Management uses this measure to assess the total return on Eni’s shares. It is calculated on a yearly basis, keeping account of the change in market price of Eni’s shares (at the beginning and at end of year) and dividends distributed and reinvested at the ex-dividend date. |
| (Total Shareholder Return) |
Business terms
| 2nd and 3rd generation feedstock |
All feedstocks not in competition with the food supply chain as opposed to first generation feedstocks (vegetable oils). Second generation feedstocks are mostly agricultural non-food and agro/urban waste (such as animal fats, used cooking oils and agricultural waste) and the third generation feedstocks are Non-agricultural High Innovation Feedstocks (deriving from algae or waste). |
| ARERA (Italian Regulatory Authority for Energy, Networks and Environment) formerly AEEGSI (Authority for Electricity Gas and Water) |
The Italian Regulatory Authority for Energy, Networks and Environment is, the Italian independent body which regulates, controls and monitors the electricity, gas and water sectors and markets in Italy. The Authority’s role and purpose is to protect the interests of users and consumers, promote competition and ensure efficient, cost-effective and profitable nationwide services with satisfactory quality levels. Furthermore, since December 2017 the Authority also has regulatory and control functions over the waste cycle, including sorted, urban and related waste. |
| Associated gas |
Associated gas is a natural gas found in contact with or dissolved in crude oil in the reservoir. It can be further categorized as Gas-Cap Gas or Solution Gas. |
| Average reserve life index |
Ratio between the amount of reserves at the end of the year and total production for the year. |
| Barrel/BBL |
Volume unit corresponding to 159 liters. A barrel of oil corresponds to about 0.137 metric tons. |
| BOE |
Barrel of Oil Equivalent. It is used as a standard unit measure for oil and natural gas. The latter is converted from standard cubic meters into barrels of oil equivalent using a certain coefficient (see “Conversion Table” on page viii). |
| Compounding |
Activity specialized in production of semifinished products in granular form, resulting from the combination of two or more chemical products. |
| Concession contracts |
Contracts currently applied mainly in Western countries regulating relationships between states and oil companies with regards to hydrocarbon exploration and production. The company holding the mining concession has an exclusive right on exploration, development and production activities and for this reason it acquires a right to hydrocarbons extracted against the payment of royalties on production and taxes on oil revenues to the state. |
| Condensates |
Condensates are a mixture of hydrocarbons that exists in the gaseous phase at original reservoir temperature and pressure, but that, when produced, is in the liquid phase at surface pressure and temperature. |
| Consob |
The Italian National Commission for listed companies and the stock exchange (Commissione Nazionale per le Società e la Borsa). |
| Contingent resources |
Contingent resources are those quantities of petroleum estimated, as of a given date, to be potentially recoverable from known accumulations, but the applied project(s) are not yet considered mature enough for commercial development due to one or more contingencies. |
| Conversion capacity |
Maximum amount of feedstock that can be processed in certain dedicated facilities of a refinery to obtain finished products. Conversion facilities include catalytic crackers, hydrocrackers, visbreaking units, and coking units. |
| Conversion index |
Ratio of capacity of conversion facilities to primary distillation capacity. The higher the ratio, the higher is the capacity of a refinery to obtain high value products from the heavy residue of primary distillation. |
| Deep waters | Waters deeper than 200 meters. |
| Development |
Drilling and other post-exploration activities aimed at the production of oil and gas. |
| Enhanced recovery |
Techniques used to increase or stretch over time the production of wells. |
| Eni carbon efficiency index |
Ratio between GHG emissions (Scope 1 and Scope 2 in tonnes CO2eq.) of the main industrial activities operated by Eni divided by the productions (converted by homogeneity into barrels of oil equivalent using Eni’s average conversion factors) of the single businesses of reference. |
| EPC |
Engineering, Procurement and Construction. |
| EPCI |
Engineering, Procurement, Construction and Installation. |
| Exploration |
Oil and natural gas exploration that includes land surveys, geological and geophysical studies, seismic data gathering and analysis and well drilling. |
| FPSO |
Floating Production Storage and Offloading System. |
| FSO |
Floating Storage and Offloading System. |
| Greenhouse Gases (GHG) |
Gases in the atmosphere, transparent to solar radiation, that trap infrared radiation emitted by the earth’s surface. The greenhouse gases relevant within Eni’s activities are carbon dioxide (CO2), methane (CH4) and nitrous oxide (N2O). GHG emissions are commonly reported in CO2 equivalent (CO2eq) according to Global Warming Potential values in line with IPCC AR4, 4th Assessment Report. |
| Infilling wells |
Infilling wells are wells drilled in a producing area in order to improve the recovery of hydrocarbons from the field and to maintain and/or increase production levels. |
| LNG |
Liquefied Natural Gas obtained through the cooling of natural gas to minus 160 °C at normal pressure. The gas is liquefied to allow transportation from the place of extraction to the sites at which it is transformed back into its natural gaseous state and consumed. One tonne of LNG corresponds to 1,400 cubic meters of gas. |
| LPG |
Liquefied Petroleum Gas, a mix of light petroleum fractions, gaseous at normal pressure and easily liquefied at room temperature through limited compression. |
| Margin |
The difference between the average selling price and direct acquisition cost of a finished product or raw material excluding other production costs (e.g. refining margin, margin on distribution of natural gas and petroleum products or margin of petrochemical products). Margin trends reflect the trading environment and are, to a certain extent, a gauge of industry profitability. |
| Mineral Potential |
(Potentially recoverable hydrocarbon volumes) Estimated recoverable volumes which cannot be defined as reserves due to a number of reasons, such as the temporary lack of viable markets, a possible commercial recovery dependent on the development of new technologies, or for their location in accumulations yet to be developed or where evaluation of known accumulations is still at an early stage. |
| Moulding | Moulding activity of expanded polyolefins for production of ultra-light products. |
| Natural gas liquids (NGL) |
Liquid or liquefied hydrocarbons recovered from natural gas through separation equipment or natural gas treatment plants. Propane, normal-butane and isobutane, isopentane and pentane plus, that were previously defined as natural gasoline, are natural gas liquids. |
| Net GHG Lifecycle Emissions |
GHG Scope 1+2+3 emissions associated with the value chain of the energy products sold by Eni, including both those deriving from own productions and those purchased from third parties, accounted on equity basis, net of offset, mainly from Natural Climate Solutions. |
| Net Carbon Footprint |
Overall Scope 1 and Scope 2 GHG emissions associated with Eni’s operations, accounted for on an equity basis, net of carbon offsets mainly from Natural Climate Solutions. |
| Net Carbon Intensity |
Ratio between the Net GHG lifecycle emissions and the energy content of products sold accounted for on an equity basis. |
| Network Code |
A code containing norms and regulations for access to, management and operation of natural gas pipelines. |
| Oilfield chemicals |
Innovative solutions for supply of chemicals and related ancillary services for Oil & Gas business. |
| Over/Under lifting |
Agreements stipulated between partners which regulate the right of each to its share in the production for a set period of time. Amounts lifted by a partner different from the agreed amounts determine temporary Over/Under lifting situations. |
| Plasmix |
Plasmix is the collective name for the different plastics that currently have no use in the market of recycling and can be used as a feedstock in the new circular economy businesses of Eni. |
| Possible reserves |
Possible reserves are those additional reserves that are less certain to be recovered than probable reserves. |
| Probable reserves |
Probable reserves are those additional reserves that are less certain to be recovered than proved reserves but which, together with proved reserves, are as likely as not to be recovered. |
| Primary balanced refining capacity |
Maximum amount of feedstock that can be processed in a refinery to obtain finished products measured in BBL/d. |
| Production Sharing Agreement (PSA) |
Contract regulates relationships between states and oil companies with regard to the exploration and production of hydrocarbons. The mineral right is awarded to the national oil company jointly with the foreign oil company that has an exclusive right to perform exploration, development and production activities and can enter into agreements with other local or international entities. In this type of contract the national oil company assigns to the international contractor the task of performing exploration and production with the contractor’s equipment and financial resources. Exploration risks are borne by the contractor and production is divided into two portions: “Cost Oil” is used to recover costs borne by the contractor and “Profit Oil” is divided between the contractor and the national company according to variable schemes and represents the profit deriving from exploration and production. Further terms and conditions of these contracts may vary from country to country. |
| vii |
| Proved reserves |
Proved oil and gas reserves are those quantities of oil and gas, which, by analysis of geoscience and engineering data, can be estimated with reasonable certainty to be economically producible, from a given date forward, from known reservoirs, and under existing economic conditions, operating methods, and government regulations, prior to the time at which contracts providing the right to operate expire, unless evidence indicates that renewal is reasonably certain, regardless of whether deterministic or probabilistic methods are used for the estimation. The project to extract the hydrocarbons must have commenced or the operator must be reasonably certain that it will commence the project within a reasonable time. Existing economic conditions include prices and costs at which economic producibility from a reservoir is to be determined. The price shall be the average price during the 12-month period prior to the ending date of the period covered by the report, determined as an unweighted arithmetic average of the first-day-of-the-month price for each month within such period, unless prices are defined by contractual arrangements, excluding escalations based upon future conditions. Reserves are classified as either developed and undeveloped. Proved developed oil and gas reserves are reserves that can be expected to be recovered through existing wells with existing equipment and operating methods or in which the cost of the required equipment is relatively minor compared to the cost of a new well, and through installed extraction equipment and infrastructure operational at the time of the reserves estimate if the extraction is by means not involving a well. Proved undeveloped oil and gas reserves are reserves of any category that are expected to be recovered from new wells on undrilled acreage, or from existing wells where a relatively major expenditure is required for recompletion. |
| REDD+ |
The REDD+ (Reducing Emissions from Deforestation and Forest Degradation) scheme was designed by the United Nations (United Nations Framework Convention on Climate Change - UNFCC). It involves conserving forests to reduce emissions and improve the natural storage capacity of CO2, as well as helping local communities develop through socio-economic projects in line with principles on sustainable management, forest protection and nature conservation. |
| Renewable Installed Capacity |
Renewable Installed Capacity is measured as the maximum generating capacity of Eni’s share of power plants that use renewable energy sources (wind, solar and wave, and any other non-fossil fuel source of generation deriving from natural resources, excluding, from the avoidance of doubt, nuclear energy) to produce electricity. The capacity is considered “installed” once the power plants are in operation or the mechanical completion phase has been reached. The mechanical completion represents the final construction stage excluding the grid connection. |
| Reserves |
Reserves are estimated remaining quantities of oil and gas and related substances anticipated to be economically producible, as of a given date, by application of development projects to known accumulations. In addition, there must exist, or there must be a reasonable expectation that there will exist, the legal right to produce or a revenue interest in the production, installed means of delivering oil and gas or related substances to market, and all permits and financing required to implement the project. |
| Reserve life index |
Ratio between the amount of proved reserves at the end of the year and total production for the year. |
| Reserve replacement ratio |
Measure of the reserves produced replaced by proved reserves. Indicates the company’s ability to add new reserves through exploration and purchase of property. A rate higher than 100% indicates that more reserves were added than produced in the period. The ratio should be averaged on a three-year period in order to reduce the distortion deriving from the purchase of proved property, the revision of previous estimates, enhanced recovery, improvement in recovery rates and changes in the amount of reserves – in PSAs – due to changes in international oil prices. |
| Scope 1 GHG Emissions |
Direct greenhouse gas emissions from company’s operations, produced from sources that are owned or controlled by the company. |
| Scope 2 GHG Emissions |
Indirect greenhouse gas emissions resulting from the generation of electricity, steam and heat purchased from third parties. |
| Scope 3 GHG Emissions |
Indirect GHG emissions associated with the value chain of Eni’s products. |
| SERM (Standard Eni Refining Margin) | It approximates the margin of Eni's refining system in consideration of the refinery slates and refineries' product yields. |
| Ship-or-pay |
Clause included in natural gas transportation contracts according to which the customer is requested to pay for the transportation of gas whether or not the gas is actually transported. |
| Take-or-pay |
Clause included in natural gas supply contracts according to which the purchaser is bound to pay the contractual price or a fraction of such price for a minimum quantity of gas set in the contract whether or not the gas is collected by the purchaser. The purchaser has the option of collecting the gas paid for and not delivered at a price equal to the residual fraction of the price set in the contract in subsequent contract years. |
| Title Transfer Facility |
The Title Transfer Facility, more commonly known as TTF, is a virtual trading point for natural gas in the Netherlands. TTF Price is quoted in euro per megawatt hour and, for business day, is quoted day-ahead, i.e. delivered next working day after assessment. |
| UN SDGs |
The Sustainable Development Goals (SDGs) are the blueprint to achieve a better and more sustainable future for all by 2030. Adopted by all United Nations Member States in 2015, they address the global challenges the world is facing, including those related to poverty, inequality, climate change, environmental degradation, peace and justice. For further detail see the website https://unsdg.un.org |
| Upstream/Downstream |
The term upstream refers to all hydrocarbon exploration and production activities. The term downstream includes all activities inherent to the oil and gas sector that are downstream of exploration and production activities. |
| Upstream GHG Emission intensity | Ratio between 100% Scope 1 GHG emissions from Upstream operated assets and 100% gross operated production (expressed in barrel of oil equivalent). |
| ABBREVIATIONS | |||
| mmCF | = million cubic feet | mmtonnes | = million tonnes |
| BCF |
= billion cubic feet | MW | = megawatt |
| mmCM | = million cubic meters | GWh | = gigawatthour |
| BCM | = billion cubic meters | TWh | = terawatthour |
| BOE | = barrel of oil equivalent | /d | = per day |
| KBOE | = thousand barrel of oil equivalent | /y |
= per year |
| mmBOE | = million barrel of oil equivalent | E&P |
= the Exploration & Production segment |
| BBOE | = billion barrel of oil equivalent | R&M & C | = the Refining & Marketing and Chemicals segment |
| BBL | = barrels | GGP | = theGlobal Gas & LNG Portfolio segment |
| KBBL | = thousand barrels | ||
| mmBBL | = million barrels | ||
| BBBL | = billion barrels | ||
| mmBTU | = million British thermal unit | ||
| ktonnes | = thousand tonnes | ||
| KW | = kilowatt | ||
| GW | = gigawatt | ||
| Gcal | = giga calorie | ||
| CONVERSION TABLE | ||
| 1 acre | = 0.405 hectares | |
| 1 barrel | = 42 U.S. gallons | |
| 1 BOE | = 1 barrel of crude oil | = 5,263 cubic feet of natural gas |
| 1 barrel of crude oil per day | = approximately 50 tonnes of crude oil per year | |
| 1 cubic meter of natural gas | = 35.3147 cubic feet of natural gas | |
| 1 cubic meter of natural gas | = approximately 0.00671 barrels of oil equivalent | |
| 1 kilometer | = approximately 0.62 miles | |
| 1 short ton | = 0.907 tonnes | = 2,000 pounds |
| 1 long ton | = 1.016 tonnes | = 2,240 pounds |
| 1 tonne | = 1 metric ton | = 1,000 kilograms |
| = approximately 2,205 pounds | ||
| 1 tonne of crude oil | = 1 metric ton of crude oil | = approximately 7.3 barrels of crude oil (assuming an API gravity of 34 degrees) |
NOT APPLICABLE
NOT APPLICABLE
The Group’s performance is mainly exposed to the volatility of the prices of crude oil and natural gas and to changing margins of oil derivative products such as, refined products and chemical products
The price of crude oil is the main driver of the Company’s operating performance and cash flow, given the current size of Eni’s Exploration & Production segment relative to other Company’s business segments. The price of crude oil has a history of volatility because, like other commodities, it is influenced by the ups and downs in the economic cycle and several other macro-variables that are beyond management’s control. Crude oil prices are mainly determined by the balance between global oil supplies and demand, the global levels of commercial inventories and producing countries’ spare capacity. In the short-term, worldwide demand for crude oil is highly correlated to the macroeconomic cycle. A downturn in economic activity normally triggers lower global demand for crude oil and possibly a supply and/or an inventory build-up, because in the short-term producers are unable to respond to swings in demand quickly. Whenever global supplies of crude oil outstrip demand, crude oil prices weaken. Factors that can influence the global economic activity in the short-term and demand for crude oil include several, unpredictable events, like trends in the economic growth which shape crude oil demand in big consuming countries like China, India and the United States, financial crisis, geo-political crisis, local conflicts and wars, social instability, pandemic diseases, the flows of international commerce, trade disputes and governments’ fiscal policies, among others. All these events could influence demands for crude oil. Long-term demands for crude oil is driven, on the positive side, by demographic growth, improving living standards and GDP (Gross Domestic Product) expansion; on the negative side, factors that in the long-term may significantly reduce demands for crude oil include availability of alternative sources of energy (e.g., nuclear and renewables), technological breakthroughs, shifts in consumer preferences, and finally measures and other initiatives adopted or planned by governments to tackle climate change and to curb carbon-dioxide emissions (CO2 emissions), including stricter regulations and control on production and consumption of crude oil. Many governments and supranational institutions, with the USA and EU leading the way, have begun implementing policies to transition the economy towards a low-carbon model of development through various means and strategies, particularly by supporting development of renewable energies and the replacement of internal combustion engine vehicles with electric vehicles, including the possible adoption of tougher regulations on the use of hydrocarbons such as the taxation of CO2 emissions. According to Eni’s management, the push to reduce worldwide greenhouse gas emissions and an ongoing energy transition towards a low carbon economy are likely to materially affect the worldwide energy mix in the long-term and may lead to structural lower crude oil demands and prices. See the section dedicated to the discussion of climate-related risks below.
Notwithstanding the USA being the first oil producer in the world since the shale oil revolution of 2011, global oil supplies are controlled to a large degree by the Organization of the Petroleum Exporting Countries (“OPEC”) cartel and its allied countries, like Russia and Kazakhstan, known as the OPEC+ alliance. Saudi Arabia plays a crucial role within the cartel, because it is estimated to hold huge amounts of reserves and a vast majority of worldwide spare production capacity. This explains why geopolitical developments in the Middle East and particularly in the Gulf area, like regional conflicts, acts of war, strikes, attacks, sabotages, and social and political tensions can have a big influence on crude oil prices. Furthermore, due to expectations of a slowdown in the growth rate of the US shale oil production or of a possible decline in the long-term due to capital discipline and industrial factors like a shrinking number of premium locations and high-yield wells, the OPEC+ alliance could exert an increasingly large influence over the crude oil market. Finally, sanctions imposed by the United States and the EU against certain producing countries may influence trends in crude oil prices.
To a lesser extent, extreme weather events, such as hurricanes in areas of highly concentrated production like the Gulf of Mexico, and operational issues at key petroleum infrastructure may have an impact on crude oil prices.
2022 marked one of the most volatile year in the history of crude oil prices, as measured by the number of days in a year in which the Brent crude oil benchmark moved by more than 5 $/bbl.
Immediately after the start of Russia’s military operations in Ukraine, the price of the Brent crude oil benchmark spiked, approaching its all-time high set in 2008 at approximately 140 $/bbl, then retreated once fears dissipated about possible disruptions in the flows of liquid hydrocarbons from Russia to international markets. Overall, crude oil prices remained well supported in the first half of the year. A favorable combination of macro and micro developments helped sustain prices in the 100-120 $/bbl range through the first half of 2022. The full reopening of Western economies and the post-pandemic recovery drove pent-up demand for all kinds of refined products with the last leg of end-markets, the airline sector, joining a rebound in consumption. International oil companies and listed shale producers in the USA remained reluctant to invest in new oil&gas fields and retained the financial discipline adopted in response to the Covid-19 crisis, allocating the extra-cash generated in the high oil-price environment to restructure the balance sheet and to boost shareholders’ returns. Pressured by investor demanding higher returns and by ESG considerations and, in the case of European players, by the need to allocate more funds to the businesses of the energy transition, oil&gas companies have continued to constrain the spending in the traditional upstream business, reinvesting in the business just a fraction of the cash flows to maintain production. According to market sources, global upstream’s capital expenditures in 2022 increased by about 20% from 2021 mainly in response to cost inflation. According to market intelligence, the current level of global upstream investment is insufficient to hold oil production steady at 100 million barrels/d, which is the needed level to match current global oil demand.
The alliance of petroleum producers OPEC+ has continued supporting the oil market by means of effective production management. The production performance exhibited a systematic trend of underdelivering against the stated production targets, raising doubts about the ability to retain an adequate spare capacity to meet eventual demand spikes. New consumption trends emerged in response to surging natural gas costs in Europe, like a resumption of the utilization of fuel oil to produce electricity (gas-to-oil switch). Finally, continuing uncertainties have been surrounding a possible return of Iran to comply with a revised version of the 2015 Iran nuclear deal, known as JCPOA, that would see Western countries lift the embargo on Iranian crude oil in exchange.
These price-supporting developments were partially mitigated by the effects of the zero-tolerance policy adopted by the Chinese authorities against the spread of the Covid-19 pandemic, which resulted in the continuing lockdowns of large cities and districts, thus dampening mobility and economic activities. Furthermore, to mitigate market imbalances and reduce the cost of fuels to American consumers, U.S. authorities executed an emergency plan to release 1 million bbl/day of crude oil from the national Strategic Petroleum Reserve for a six-month period, starting in May; other sales were arranged in the months of November and December. Other OECD governments coordinated by the IEA also arranged the release of their strategic reserves in response to the Russia-Ukraine crisis.
Crude oil prices peaked at the end of June. As developments in the second half of 2022 would demonstrate, the oil industry is a cyclical business, and our results of operations and cash flows are exposed to the risks of rapidly changing market conditions and of sudden and sharp price downturns due to the complexity and unpredictability of macro variables to which the oil business is subject. Among those variables, one of the most important, albeit difficult to be perceived, is the relatively low elasticity of supplies, which helps when demand rebounds, but backfires in case of a demand shock, leading to a quick build-up in supplies and a sell-off in prices. It is worth mentioning, based on our experience, that a small imbalance between supply and demand could cause a significant contraction in prices.
As a matter of fact, the trading environment has changed radically from the end of June 2022. The resurgence of inflationary pressures led by rising commodity prices forced the Federal Reserves (“Fed”) to change course in its monetary policy and to start a tightening cycle by raising interest rates and suspending its program of buying treasuries. Other central banks have followed the Fed’s new stance towards inflation. Rising interest rates and quantitative tightening are expected to dent economic activity and to reduce demand for crude oil. Furthermore, since the Fed has been moving at a faster pace than other central banks, it has driven the value of the US dollar that has appreciated significantly against all other currencies. A stronger dollar makes the dollar-denominated contracts for crude oil more expensive for holders of other currencies, thus weighing on demand.
Macroeconomic indicators started to weaken during the summer months amid the uncertainties associated with the Russia-Ukraine war, growing geopolitical risks and surging energy costs impacting industrial activity and consumers’ confidence, fueling fears of a prolonged slowdown or of a global recession and expectations of lower demand for crude oil. Furthermore, Russian production levels and exports towards Western markets held steady, defying expectations of a sharp drop. Those developments triggered a sharp correction in the price of Brent crude oil that lost approximately 40 $/bbl or 30% in just a quarter (from 125 $/bbl at the end of June 2022 to approximately 85 $/bbl by the end of September). In the final months of 2022, Brent prices seemed to stabilize due to the decision of the OPEC+ alliance to reduce the production quotas by about 2 million bbl/day from November 2022 until December 2023, resulting in an actual production cut of approximately half that amount considering that many cartel countries were producing well below their respective stated quotas. The market was also affected by uncertainties due to the entry into force of an EU ban on importation of seaborne Russian crude and the perceived risks of a reduction at Russian supplies, while China began relaxing the restrictive measures to contain the Covid-19 pandemic. Finally, G-7 nations, the EU and Australia agreed to impose a price cap on Russian crude at 60 $/bbl, banning Western insurers and shippers to provide services to support transportation of Russian crude oil unless the price cap is fulfilled. The downtrend in crude oil prices resumed in December, erasing all the gains made so far in 2022, with prices falling below 80 $/bbl. The downturn in crude oil prices in the second half of 2022 was largely driven by the liquidation of derivative positions by financial market participants driven by fears and uncertainties about possible broad-based macroeconomic issues, that pushed the forward prices curve back into contango in relation to short-term deliveries. However, the physical markets continued to signal steady demand trends as highlighted by continuing drawdowns of global inventories of crude oil, including global oil-on-water, with commercial stocks at OECD countries falling to about 4 billion barrels at the end of the year. That is one of the lowest levels for this time of year on record.
Overall, in 2022 global demand for crude oil continued recovering from the Covid-19 pandemic lows, increasing by approximately 2 million bbl/d to reach a level almost in line with 2019, at approximately 99.6 million bbl/d.
Looking forward, we believe crude oil prices to be negatively affected by continuing uncertainties among market participants about a possible slowdown or a recession of the global economy leading to a contraction in demand for crude oil, thus limiting the chance of a price recovery from the 2022 lows registered in December 2022. Furthermore, due to pressures from governments to increase output, international oil&gas companies have been announcing capital budget significantly higher than in 2022 and that could lead to faster growth in supplies than the market is currently anticipating.
Natural gas prices experienced a degree of volatility even higher than that of crude oil, especially in Europe (see risk factors below). Overall, natural gas prices rose sharply across all geographies due to slow additions of new supplies reflecting a slowdown in expenditures in past years and a demand recovery in the wake of an improved macroeconomic backdrop. Russia’s military invasion of Ukraine greatly compounded the already tight market fundamentals, triggering fears among market participants of possible disruptions in the natural gas flows from Russia to Europe. During summer months, prices reached all time-highs at spot markets in Europe driven by tight supplies, a progressive reduction in the flows of gas imported via pipeline from Russia amidst deteriorating political relationships with the EU block of nations (see below) and increased demand to replenish natural gas inventories in preparation of the heating season. In 2022, the spot price at the European reference hub Title Transfer Facility “TTF” averaged about 40 $/mmBTU, almost a threefold increase versus 2021. However, from the final months of 2022 and the beginning of 2023, market fundamentals have begun trending lower due to a recovery in US production of dry natural gas and a significant increase in exported volumes through LNG facilities, the wide adoption of energy-saving measures in Europe, a slowdown in industrial activities and finally a warmer-than usual winter season which has reduced heating consumption in the Western Hemisphere. In response to those trends, natural gas prices have been falling very rapidly: by the end of February 2023, the TTF European benchmark has plunged below 20 $/mmBTU, an eighteen-month low, down about 80% from the all-time high reached during the summer 2022. We believe this deteriorating trend in natural gas prices to affect significantly and adversely our results of operations and cash flows in 2023.
The volatility of hydrocarbons prices significantly affects the Group’s financial performance. Lower hydrocarbon prices from one year to another negatively affect the Group’s consolidated results of operations and cash flow; the opposite occurs in case of a rise in prices. This is because lower prices translate into lower revenues recognised in the Company’s Exploration & Production segment at the time of the price change, whereas expenses in this segment are either fixed or less sensitive to changes in crude oil prices than revenues. With respect to price assumptions for 2023 (our Brent crude oil price forecast for 2023 is 85 $/bbl), we estimate our cash flow from operations to vary by approximately €0.13 billion for each one-dollar change in the price of the Brent crude oil applied to liquids and oil-linked gas and by approximately €0.13 billion for each one-dollar change in the spot price (1 $/mmbtu) of the European benchmark TTF spot price of natural gas compared to our assumption of 25-26 $/mmBTU for 2023. Eni is planning to gradually increase the share of natural gas production in its portfolio to reach 60% by 2030. Considering the higher volatility experienced in the natural gas market compared to the crude oil market, this long-term shift in the production mix could increase the variability of the Group’s results of operations and cash flows.
The exposure of our cash flow from operations to the volatility of hydrocarbons prices and our expectations of lower hydrocarbons prices in 2023 compared to 2022 are due to increase our financial risk profile going forward, in light of the projected significant expected increase in the capital budget planned for 2023, which at about €9.5 billion is featuring a 15% rise compared to 2022.
Finally, movements in hydrocarbons prices significantly affect the reportable amount of production and proved reserves under our production sharing agreements (“PSAs”), which represented about 54% of our proved reserves as of end of 2022. The entitlement mechanism of PSAs foresees the Company is entitled to a portion of a field’s reserves, the sale of which is intended to cover expenditures incurred by the Company to develop and operate the field. The higher the reference prices for Brent crude oil used to estimate Eni’s proved reserves, the lower the number of barrels necessary to recover the same amount of expenditure, and vice versa. In 2022 our reported production and reserves were lowered by an estimated amount of respectively 5 KBOE/d and by 34 mmBOE due to an increased Brent reference price. Considering the current portfolio of oil&gas assets, the Company estimates its production to vary by about 0.5 KBOE/d for each one-dollar change in the price of the Brent crude oil.
Eni’s Refining & Marketing and Chemical businesses are cyclical. Their results are impacted by trends in the supply and demand of oil products and plastic commodities, which are influenced by the macro-economic scenario and by product margins. Generally speaking, margins for refined and chemical products depend upon the speed at which products’ prices adjust to reflect movements in oil prices.
All these risks may adversely and materially impact the Group’s results of operations, cash flow, liquidity, business prospects, financial condition, and shareholder returns, including dividends, the amount of funds available for stock repurchases and the price of Eni’s share.
Risks in connection with Russia’s military aggression of Ukraine
A prolonged war could derail the post-pandemic macroeconomic recovery and that could reduce demands for hydrocarbons
Russia’s military aggression of Ukraine in late February 2022 occurred against a backdrop of already tight crude oil and natural gas markets, particularly in Europe. The post-pandemic recovery leading to a pent-up demand for all kind of energy commodities and the suppression of supplies due to the financial discipline of oil&gas companies, and years of underinvestment in the industry drove a strong upcycle in commodity prices. Against this backdrop, the war triggered an energy crisis that hit severely businesses’ balance sheet and the purchasing power of households across all of EU member states and the UK, souring mood and confidence. Increasingly high costs of natural gas and electricity have reignited inflationary pressures along the supply chain, forcing central banks to change course in their monetary policy. In response to Russia’s aggression, the EU nations, the UK and the USA have adopted massive economic and financial sanctions to curb Russia’s ability to fund the war and that is negatively affecting the economic activity. All these developments have resulted in a significant slowdown of the economy in the Euro-zone, in the UK, in the USA and in other areas.
A prolonged armed conflict, a possible escalation in the military action, an enlargement of the ongoing geopolitical crisis and a further tightening up of the economic sanctions against Russia represent elements of uncertainty that could eventually sap consumers’ confidence and deter investment decisions, increasing the risks of a worldwide macroeconomic recession and with it, expectations of a reduction in hydrocarbons demands. This scenario would lead to lower commodity prices and would adversely and significantly affect our results of operations and cash flow, as well as business prospects, with a possible lower remuneration of our shareholders.
2022 was characterized by an unprecedented level of volatility in the European natural gas market due to the uncertainties triggered by the Russia-Ukraine crisis and continuing disruptions in the supplies from Russia. We expect prices to remain volatile in the foreseeable future and this may negatively affect our results of operations and cash flow.
In the aftermath of the start of the conflict, hydrocarbons prices rallied well above the peaks recorded in 2021, driven by the macro-uncertainty associated with the geopolitical situation, the possible fallout of the economic sanctions adopted by EU countries, the USA, and the UK against Russia and rising worries among market participants about possible disruptions in the hydrocarbons flows from Russia to international markets. While the Brent benchmark crude oil price initially approached its all-time highs at about 140 $/bbl and then retreated to below 80 $/bbl due to macroeconomic drivers, the natural gas market in Europe underwent far more complex trading conditions due to Europe’s dependency on Russian supplies. The Title Transfer Facility (TTF), the European benchmark of natural gas, which was trading at about 6 $/mmBTU at the beginning of 2021, increased exponentially throughout the year and approached the 90-dollar mark in August 2022, driven by strong fundamentals and rising uncertainties about supply risks, amidst deteriorating political relationships between the EU and Russia. Those latter materialized in the summer months as on several occasions the flows of natural gas from Russia to Europe were halted or reduced due to a dispute between Russia and European nations about the currency of settlement of the payments due by European operators. To make things worse, in September 2022, a massive leak occurred at the North-Stream pipeline, which is one of the main routes for transporting natural gas from Russia to Europe, forcing the operator to completely shut down the facility to execute major repairs. Natural gas flows from Russia to Italy experienced a significant reduction, too. With prices of natural gas increasing by several hundred percentage points against the backdrop of unprecedented volatility, traders like Eni faced large margin calls and high funding costs that increased pressure on their balance sheet and leverage.
The exceptionally large price movements resulted in sizeable daily or even intraday variation margin calls as derivatives contracts were marked to market. Furthermore, the elevated volatility prompted central counterparties and financial institutions to increase the initial margin substantially. As a matter of fact, to maintain derivatives positions, traders are required to pledge liquid assets as collateral for the settlement of the derivative transactions (initial margin). Materially higher natural gas prices triggered proportional increases in the initial margins (margin call), leading to substantially higher funding needs of traders and impairing their creditworthiness, as many traders saw their bond prices fall significantly. To cope with raising borrowing costs and surging financing needs, traders opted to reduce the volume of transactions in financial derivatives leading to substantially thinner markets. Trading volumes in both exchange markets and over-the-counter saw large declines. In response to much higher funding requirements than in the past to maintain derivatives positions, as well as due to much lower hedging opportunities because of thinner liquidity in the financial derivatives markets, the Company has opted to reduce our usual risk management activities and to retain a higher share of the commodity price risks unhedged, also considering risks of a possible default of supplies from our Russian counterparts (see below). Those developments may negatively affect our results of operations and cash flow in the GGP business that engages in trading large volumes of natural gas in the European markets. We believe this risk factor to continue affecting the business performance for the foreseeable future as trading conditions in the natural gas market are expected to remain challenging and volatile.
In response to our expectations of much more volatile markets going forward, we have increased our financial headroom by raising our reserves of cash on hand, increasing amounts of committed credit lines, and entering into repurchase agreements using our portfolio of securities as collateral, to cope with expected higher margins requirements and other possible financing needs. This could lead to higher finance expense and reduced investment opportunities.
Risks in connection with our presence in Russia and our commercial relationships with Russia’s State-owned companies.
Eni’s assets located in Russia are immaterial to the Group results. Our exploration projects in the Russian oil&gas sector have been suspended indefinitely, following the previous sanction regime, and the expenditures incurred in relation to those projects were written off in past reporting periods. Currently, we do not have booked hydrocarbons reserves in Russia.
The Group has announced the intention to divest its interest in the Blue Stream joint operations, which manages the gas pipeline that transports natural gas produced in Russia to Turkey through the Black Sea. Those volumes of gas are jointly marketed by Eni and Gazprom to the Turkish state-owned company Botas. This divestment is not expected to have a significant effect on the Group consolidated results and balance sheet; the book value of this asset was €90 million as of December 31, 2022.
In 2022 the Group ceased signing new supply contracts of Russian crude oil to supply its operated refineries and has incurred higher expenses and lower margins to replace the Russian crude oil. We do not plan to alter our course of action in 2023 and will continue to avoid supplying any quantity of Russian crude for processing at our refineries or otherwise to trade any volume of Russian crude oil or refined products. In 2022 the purchase of crude oil from Russia represented 5% of the total volumes of crudes traded by Eni to support its operated refineries; those volumes were supplied before the start of the war.
Finally, Russian oil&gas companies are currently joint operators in certain upstream projects where we have a working interest. Every possible decision about the participation of the Russian counterparts to those projects are in the power of the state-owned companies of the host countries where such projects are located.
The most important transactions that involve Russian counterparts relate to the purchase of natural gas from the Russian state-owned company Gazprom and its affiliates, based on long-term supply contracts with take-or-pay clauses. In the past, the volumes supplied from Russia have represented a material amount of our global portfolio of natural gas supplies (see table “Natural gas supply” in Item 4 – Global Gas & LNG Portfolio, providing information about the last three-year period). In 2022, we significantly reduced natural gas supplies from Russia to 28% (down from 43% in 2021). We intend to continue our effort to substitute Russian-origin gas in our portfolio, with the aim to continue to reduce such dependence in the shortest possible timeframe.
Further, although we have access to increased supplies from other geographies in our portfolio by means of developing our existing reserves and we are currently able to import larger volumes from producing countries under existing contracts, should supplies from non-Russian sources be insufficient to compensate for lower quantities purchased from Gazprom and its affiliated companies, we may suffer adverse effects which we cannot currently estimate or quantify, but could be material.
To cope with the emerging risk of a possible shortfall of natural gas supplies from Russia and with a view to reducing our contractual selling obligations going forward, the business has adopted a cautious stance in signing new selling contracts for the current thermal year (October 2022 – September 2023) and in doing so, it has been missing out on better selling margin opportunities than what can be earned by selling natural gas at the spot markets.
The process of substituting Russian-origin gas may entail operational and financial risks which may be significant.
Those development could negatively and significantly affect the performance of the GGP business.
In 2022 the GGP business delivered a significant performance due to the continuing optimizations of the portfolio of assets, amidst exceptional market conditions due to the war situation. There is no guarantee that a similar level of performance can be sustained in the near future.
In 2022, the profitability in the GGP business was underpinned by management’s ability to leverage the assets portfolio (long-term natural gas purchase contracts, transport capacity booked at the main European pipelines, access to storage capacity, thermoelectric plants, presence in the LNG business) to drive sales opportunities and margin improvements on the back of favorable market trends. There is no guarantee that a similar level of performance can be reiterated next year or in the medium term due to rapidly changing market conditions and unpredictable developments in the European natural gas markets. The Company’s decision to reduce its hedging activity in response to risks of undersupplies from its Russian counterparts has also increased the business exposure to the commodity risk.
In response to the current energy crisis, EU member states have been implementing measures intended to curb the consumption of electricity and to contain the cost of energy to businesses and households, and that could negatively affect demand for natural gas and electricity and the profitability of our operations.
Russia’s military invasion of Ukraine triggered a relevant deterioration in the fundamentals of the European natural gas and electricity sectors due to European’ dependency on Russian natural gas supplies and actual reductions in the volumes of natural gas available to Europe. This has driven material increases in the price of natural gas and in the cost of electricity that is indexed to natural gas. High energy costs have put enormous pressure on the balance sheet of businesses, also in the energy sector, forcing many industrial undertakings to halt production or to shut down plants indefinitely, while several energy wholesalers and retailers unable to manage volatility have gone bankrupt or have been bailed out by governments. Many businesses highly dependent on energy consumption have been assessing whether to relocate their operations overseas to reduce the costs of energy inputs. Households have seen their energy bills increase manyfold, resulting in social anger and protest. The economic and social ramifications of this crisis have yet to be appreciated. In response to the crisis, EU member states have been implementing several initiatives intended to reduce electricity consumptions by imposing mandated saving targets to each of the member states and to reduce the cost of electricity by introducing a mandatory cap on market revenues of electricity producers from certain sources (e.g. photovoltaic and wind power) and the possibility for the member states to temporarily set electricity prices below production costs. For example, the EU Commission’s REPowerEU plan has set a strategic goal of ceasing the EU’s dependency on Russia’s natural gas well before 2030, through various measures including supplies diversification, development of renewable energies and energy savings. Those measures could reduce electricity consumption and hence demands for natural gas and that could significantly and adversely affect the results of operations and cash flow of our E&P and GGP businesses. The mandated cap on market revenues of electricity produced at photovoltaic and wind facilities will limit the profitability upside in our business of renewable energies. Governments may introduce administrative measures intended to limit the ability of retail operators in the natural gas and electricity markets to pass increases in the cost of supplies onto final customers and that could significantly and adversely affect the results of operations and cash flow at our retail subsidiary Plenitude. Finally, governments across Europe and in the UK have imposed windfall taxes on the profits of energy companies to raise funds to compensate businesses and households for the surging energy costs and this trend has negatively affected our results of operations and cash flow (see below).
There is strong competition worldwide, both within the oil industry and with other industries, to supply energy and petroleum products to the industrial, commercial, and residential energy markets.
The current competitive environment in which Eni operates is characterized by volatile prices and margins of energy commodities, limited product differentiation and complex relationships with state-owned companies and national agencies of the countries where hydrocarbons reserves are located to obtain mineral rights. As commodity prices are beyond the Company’s control, Eni’s ability to remain competitive and profitable in this environment requires continuous focus on technological innovation, the achievement of efficiencies in operating costs, effective management of capital resources and the ability to provide valuable services to energy buyers. It also depends on Eni’s ability to gain access to new investment opportunities.
In the Exploration & Production segment, Eni is facing competition from both international and state-owned oil companies for obtaining exploration and development rights and developing and applying new technologies to maximize hydrocarbon recovery. Because of the larger size of some other international oil companies, Eni may face a competitive disadvantage when bidding for large scale or capital intensive projects and it may be exposed to the risk of obtaining lower cost savings in a deflationary environment compared to its larger competitors given its potentially smaller market power with respect to suppliers, whereas in case of rising input costs due to a shortage of materials, labour and other productive factors Eni may experience higher pressure from its suppliers to raise the price of goods and services to the Company compared to Eni’s larger competitors. Due to those competitive pressures, Eni may fail to obtain new exploration and development acreage, to apply and develop new technologies and to control costs. The COVID-19 pandemic has caused exploration & production companies to significantly reduce their capital investment in response to lower cash flows from operations and to focus on the more profitable and scenario-resilient projects. The Company believes that this development will be long-lasting and likely drive increased competition among players to gain access to relatively cheaper reserves (onshore vs. offshore; proven areas vs. unexplored areas).
In the Global Gas & LNG Portfolio business, Eni is facing strong competition in the European wholesale markets to sell gas to industrial customers, the thermoelectric sector and retail companies from other gas wholesalers, upstream companies, traders and other players. The results of Eni’s wholesale gas business are affected by global and regional dynamics of gas demand and supplies, as well as by the constraints of its portfolio of long-term, take-or-pay supply, whereby the Company is obligated to offtake minimum annual volumes of gas or in case of failure to pay the corresponding purchase price (see below). Due to the competitive nature of the business, sales margins tend to be small. We believe wholesale margins of gas will be negatively affected by competitive pressures and by the expected growth of renewable sources of energy that will replace natural gas in supplying electricity to European markets in the medium term. Also, the energy crisis of 2022 stimulated energy saving measures and a curtailment of consumption among businesses and households and by public administrations and that could lead to long-term natural gas demand destruction, intensifying competition.
The results of the LNG business are mainly influenced by the global balance between demand and supplies, considering the higher level of flexibility of LNG with respect to gas delivered via pipeline.
In its Refining & Marketing segment, Eni is facing competition both in the refining business and in the retail marketing of fuels.
Eni’s refining business has been negatively affected for many years by structural headwinds due to muted trends in the European demand for fuels, refining overcapacity and continued competitive pressure from players in the Middle East, the United States and Far East Asia. Those competitors can leverage on larger plant scale and cost economies, availability of cheaper feedstock and lower energy expenses. Those unfavorable competitive dynamics were exacerbated by the economic downturn triggered by the COVID-19 pandemic in 2020, whose effects rippled throughout 2021 due to the gradual lifting of restrictions to mobility and air travel. In 2022, the weak underlying fundamentals of the sector were superseded by a widespread recovery in demands for refined products also helped by a recovery in the airline sector, and by market disruptions caused by the Russia-Ukraine war which negatively affected the flows of products from Russia, reducing particularly the supplies of gasoil, and other market dislocations. The trading environment was very volatile with refining margins hitting historic highs on some occasions (for example in the second quarter and at the start of the Autumn months) and then retreating.
Overall, in 2022 the Company’s own internal performance measure to gauge the profitability of its refineries, the SERM, averaged about 8 $/bbl, a noteworthy increase compared to 2021 when the margin was negative at minus 0.9 $/bbl, and one of the best values in several years. However, due to the start-up of new refining capacity in Middle East and other geographies, management does not expect that level of refining margin to be sustainable in the future. Furthermore, management expects demand for oil-based refined products in Europe to be negatively affected by the market penetration of EV and a growth in biofuels. Based on those assumptions, despite the strong results of the refining business in 2022, management did not record any reversal of previously recognized impairment losses and confirmed the full write-off of the Company’s oil-based, operated refineries. Furthermore, management assessed that certain refinery production lines that were shut down during the COVID-19 downturn would not restart under management’s planning assumptions and forecast trading environment. As a consequence of that, management recognized a provision to decommission such product lines, for an amount of about €300 million.
Furthermore, refinery’s operating expenses were negatively affected by higher costs for the purchase of emission allowances to comply with the requirements of the European ETS, which reached all-time highs due to a combination of macroeconomic recovery which drove industrial production and rising coal consumption to fire power generation due to a shortage of gas supplies and cost competitiveness. The 2022 cost for emission allowance was on average 80 €/ton, up by about 50% from 2021 (53.4 €/ton). We believe costs for the purchase of CO2 allowances to continue trending higher in the foreseeable future also due to a possible revision of the EU regulation that is anticipated to reduce free allowances.
Eni’s Chemical business has been facing for years strong competition from well-established international players and state-owned petrochemical companies, particularly in the most commoditized market segments such as the production of basic petrochemical products (like polyethylene), where demand is a function of macroeconomic growth. Many of these competitors based in the Far East and the Middle East have been able to benefit from cost economies due to larger plant scale, wide geographic moat, availability of cheap feedstock and proximity to end-markets. Excess worldwide capacity of petrochemical commodities has also fueled competition in this business. Furthermore, petrochemical producers based in the United States have regained market share, as their cost structure has become competitive due to the availability of cheap feedstock deriving from the production of domestic shale gas from which ethane is derived, which is a cheaper raw material to produce ethylene than the oil-based feedstock utilized by Eni’s petrochemical subsidiaries. Finally, it is likely that rising public concern about climate change and the preservation of the environment will negatively affect the consumption of single-use plastics going forward. In 2021 those challenging business fundamentals were mitigated by the post-pandemic economic recovery and supply chain issues, which alleviated competitive issues. In 2022, the Eni’s chemicals business reverted to its historical trend of underperformance driven by a recovery in the export of cheap product flows from the Middle and Far East, the entry into service of new capacity and surging costs of plant utilities indexed to the price of natural gas. An uncertain macroeconomic outlook also weighed on the purchase decision of distributors and resellers who opted for destocking their inventories. Management believes the profitability prospects of the chemicals business to remain weak in the foreseeable future and as a consequence the carrying amounts of the Company’s chemicals plants were marked down to account for lower recoverable values with an impairment loss of €385 million.
Plenitude and Power business engages in the supply of gas and electricity to customers in the retail markets mainly in Italy, France, Spain, and other countries in Europe. Customers include households, large residential accounts (hospitals, schools, public administration buildings, offices) and small and medium-sized businesses. The retail market is characterized by strong competition among selling companies which mainly compete in terms of pricing and the ability to bundle valuable services with the supply of the energy commodity. In this segment, competition has intensified in recent years due to the progressive opening of the market and the ability of residential customers to switch smoothly from one supplier to another.
Eni also engages in the business of producing gas-fired electricity that is largely sold in the wholesale market and in the dispatching services market. As far as the wholesale market is concerned, margins of electricity production from gas-fired plants (“Clean Spark Spread” or “CSS”) have experienced some fluctuations in recent years due to the volatility of costs of production, as well as to increasing competition from renewables. In 2022, the business profitability was driven by a non-recurring increase in revenues from the dispatching services market. Looking forward, management is assuming service revenues to normalize.
In case the Company is unable to effectively manage the above described competitive risks, which may increase in case of an economic slowdown or a recession weaker-than anticipated recovery in the post-pandemic economy or in a worst case scenario of the imposition by governments of new lockdown measures and other restrictions in response to the pandemic, the Group’s future results of operations, cash flow, liquidity, business prospects, financial condition, shareholder returns, including dividends, the amount of funds available for stock repurchases and the price of Eni’s shares may be adversely and significantly affected.
The Group is exposed to significant safety, security, environmental and other operational risk in connection with the nature of its operations
The Group engages in the exploration and production of oil and natural gas, processing, transportation and refining of crude oil, transport of natural gas, storage and distribution of petroleum products and the production of base chemicals, plastics, and elastomers. By their nature, the Group’s operations expose Eni to a wide range of significant health, safety, security, and environmental risks. Technical faults, malfunctioning of plants, equipment and facilities, control systems failure, human errors, acts of sabotage, attacks, loss of containment and climate-related hazards can trigger adverse consequences such as explosions, blow-outs, fires, oil and gas spills from wells, pipeline and tankers, release of contaminants and pollutants in the air, ground and water, toxic emissions, and other negative events. The magnitude of these risks is influenced by the geographic range, operational diversity, and technical complexity of Eni’s activities. Eni’s future results of operations, cash flow and liquidity depend on its ability to identify and address the risks and hazards inherent to operating in those industries.
In the Exploration & Production segment, Eni faces natural hazards and other operational risks including those relating to the physical and geological characteristics of oil and natural gas fields. These include the risks of eruptions of crude oil or of natural gas, discovery of hydrocarbon pockets with abnormal pressure, crumbling of well openings, oil spills, gas leaks, risks of blowout, fire or explosion and risks of earthquake in connection with drilling activities.
Eni’s activities in the Refining & Marketing and Chemical segment entail health, safety and environmental risks related to the handling, transformation and distribution of oil, oil products and certain petrochemical products. These risks can arise from the intrinsic characteristics and the overall lifecycle of the products manufactured and the raw materials used in the manufacturing process, such as oil-based feedstock, catalysts, additives, and monomer feedstock. These risks comprise flammability, toxicity, long-term environmental impact such as greenhouse gas emissions and risks of various forms of pollution and contamination of the soil and the groundwater, emissions and discharges resulting from their use and from recycling or disposing of materials and wastes at the end of their useful life.
All of Eni’s segments of operations involve, to varying degrees, the transportation of hydrocarbons. Risks in transportation activities depend on several factors and variables, including the hazardous nature of the products transported due to their flammability and toxicity, the transportation methods utilized (pipelines, shipping, river freight, rail, road and gas distribution networks), the volumes involved and the sensitivity of the regions through which the transport passes (quality of infrastructure, population density, environmental considerations). All modes of transportation of hydrocarbons are particularly susceptible to risks of blowout, fire and loss of containment and, given that normally high volumes are involved, could present significant risks to people, the environment and the property.
Eni has material offshore operations relating to the exploration and production of hydrocarbons. In 2022, approximately 71% of Eni’s total oil and gas production for the year derived from offshore fields, mainly in Egypt, Norway, Libya, Angola, Congo, Indonesia, the United Arab Emirates, Kazakhstan, the United States, Venezuela and the United Kingdom. Offshore operations in the oil and gas industry are inherently riskier than onshore activities. Offshore accidents and spills could cause damage of catastrophic proportions to the ecosystem and to communities’ health and security due to the apparent difficulties in handling hydrocarbons containment in the sea, pollution, poisoning of water and organisms, length and complexity of cleaning operations and other factors. Furthermore, offshore operations are subject to marine risks, including storms and other adverse weather conditions and perils of vessel collisions, which may cause material adverse effects on the Group’s operations and the ecosystem.
The Company has invested and will continue to invest significant financial resources to continuously upgrade the methods and systems for safeguarding the reliability of its plants, production facilities, vessels, transport and storage infrastructures, the safety and the health of its employees, contractors, local communities, and the environment, to prevent risks, to comply with applicable laws and policies and to respond to and learn from unforeseen incidents. Eni seeks to manage these operational risks by carefully designing and building facilities, including wells, industrial complexes, plants and equipment, pipelines, storage sites and other facilities, and managing its operations in a safe and reliable manner and in compliance with all applicable rules and regulations, as well as by applying the best available techniques in the marketplace. However, these measures may ultimately not be completely successful in preventing and/or altogether eliminating risks of adverse events. Failure to properly manage these risks as well as accidental events like human errors, unexpected system failure, sabotages, cyberattacks or other unexpected drivers could cause oil spills, blowouts, fire, release of toxic gas and pollutants into the atmosphere or the environment or in underground water and other incidents, all of which could lead to loss of life, damage to properties, environmental pollution, legal liabilities and/or damage claims and consequently a disruption in operations and potential economic losses that could have a material and adverse effect on the Group’s results of operations, cash flow, liquidity, business prospects, financial condition, and shareholder returns, including dividends, the amount of funds available for stock repurchases and the price of Eni’s shares.
Eni also faces risks once production is discontinued because Eni’s activities require the decommissioning of productive infrastructures, well plugging and the environmental remediation and clean-up of industrial hubs and oil and gas fields once production and manufacturing activities cease. Furthermore, in certain situations where Eni is not the operator, the Company may have limited influence and control over third parties, which may limit its ability to manage and control such risks. Eni retains worldwide third-party liability insurance coverage, which is designed to hedge part of the liabilities associated with damage to third parties, loss of value to the Group’s assets related to adverse events and in connection with environmental clean-up and remediation. As of the date of this filing, maximum compensation allowed under such insurance coverage is equal to $1.1 billion in case of offshore incident and $1.3 billion in case of incident at onshore facilities (refineries). Additionally, the Company may also activate further insurance coverage in case of specific capital projects and other industrial initiatives. Management believes that its insurance coverage is in line with industry practice and is enough to cover normal risks in its operations. However, the Company is not insured against all potential risks. In the event of a major environmental disaster, such as the incident which occurred at the Macondo well in the Gulf of Mexico several years ago, Eni’s third-party liability insurance would not provide any material coverage and thus the Company’s liability would far exceed the maximum coverage provided by its insurance. The loss Eni could suffer in case of a disaster of material proportions would depend on all the facts and circumstances of the event and would be subject to a whole range of uncertainties, including legal uncertainty as to the scope of liability for consequential damages, which may include economic damage not directly connected to the disaster. The Company cannot guarantee that it will not suffer any uninsured loss and there can be no guarantee, particularly in the case of a major environmental disaster or industrial accident, that such a loss would not have a material adverse effect on the Company.
The occurrence of any of the above-mentioned risks could have a material and adverse impact on the Group’s results of operations, cash flow, liquidity, business prospects, financial condition, and shareholder returns, including dividends, the amount of funds available for stock repurchases and the price of Eni’s shares and could also damage the Group’s reputation.
Risks deriving from Eni’s exposure to weather conditions
Significant changes in weather conditions in Italy and in the rest of Europe from year to year may affect demand for natural gas and some refined products.
In colder years, demand for such products is higher. Accordingly, the results of operations of Eni’s businesses engaged in the marketing of natural gas and, to a lesser extent, the Refining & Marketing business, as well as the comparability of results over different periods may be affected by such changes in weather conditions. Over recent years, this pattern could have been possibly affected by the rising frequency of weather trends like milder winter or extreme weather events like heatwaves or unusually cold snaps, which are possible consequences of climate change.
The Group is exposed to significant financial, operational and industrial risks associated with the exploration and production of crude oil and natural gas
The exploration and production of oil and natural gas require high levels of capital expenditures and are subject to natural hazards and other uncertainties, including those relating to the physical characteristics of oil and gas fields. The exploration and production activities are subject to the mining risk that is the risk of discovering uncommercial quantities of hydrocarbons or of producing less reserves than initially estimated, and the risks of cost overruns and delayed start-up at the projects to develop and produce hydrocarbons reserves with adverse consequences on the return on capital employed. Those risks could have an adverse, significant impact on Eni’s future growth prospects, results of operations, cash flows, liquidity, and shareholders’ returns.
The production of oil and natural gas is highly regulated and is subject to conditions imposed by governments throughout the world in matters such as the award of exploration and production leases, the imposition of specific drilling and other work obligations, higher-than-average rates of income taxes, additional royalties and taxes on production, environmental protection measures, control over the development and decommissioning of fields and installations, and restrictions on production. A description of the main risks facing the Company’s business in the exploration and production of oil and gas is provided below.
a) Exploratory drilling efforts may be unsuccessful
Exploration activities are mainly subject to the mining risk, i.e. the risk of dry holes or failure to find commercial quantities of hydrocarbons. The costs of drilling and completing wells have margins of uncertainty, and drilling operations may be unsuccessful because of a large variety of factors, including geological failure, unexpected drilling conditions, pressure or heterogeneities in formations, equipment failures, well control (blowouts) and other forms of accidents. A large part of the Company exploratory drilling operations is located offshore, including in deep and ultra-deep waters, remote areas and environmentally-sensitive locations (such as the Barents Sea, the Gulf of Mexico, deep water leases off West Africa, Indonesia, the Mediterranean Sea and the Caspian Sea). In these locations, the Company generally experiences higher operational risks and more challenging conditions and incurs higher exploration costs than onshore. Furthermore, deep and ultra-deep water operations require significant time before commercial production of discovered reserves can commence, increasing both the operational and the financial risks associated with these activities.
Because Eni plans to make significant investments in executing exploration projects, it is likely that the Company will incur significant amounts of dry hole expenses in future years. Unsuccessful exploration activities and failure to discover additional commercial reserves could reduce future production of oil and natural gas, which is highly dependent on the rate of success of exploration projects and could have an adverse impact on Eni’s future performance, growth prospects and returns.
b) Development projects bear significant operational risks which may adversely affect actual returns
Projects to develop reserves of crude oil and natural gas normally take several years before production start-up after a discovery. Such long lead times are due to the complexity of the activities and tasks that need to be performed before a project final investment decision is made and commercial production can be achieved. Those activities include the appraisal of a discovery to evaluate the technical and economic feasibility of the development project, obtaining the necessary authorizations from governments, state agencies or national oil companies, signing agreements with the first party regulating a project’s contractual terms such as the production sharing and cost recovery, agreeing on fiscal terms, obtaining partners’ approval, environmental permits and other conditions, signing long-term gas contracts, carrying out the concept design and the front-end engineering and building and commissioning the related plants and facilities. Moreover, projects executed with partners and joint venture partners reduce the ability of the Company to manage risks and costs, and Eni could have limited influence over and control of the operations and performance of its partners. The execution of development projects on time and on budget depends on several factors:
| ● | the outcome of negotiations with joint venture partners, governments and state-owned companies, suppliers and potential customers to define project terms and conditions, including, for example, the fiscal take, the production sharing terms with the first party, or Eni’s ability to negotiate favorable long-term contracts to market gas reserves; | |
| ● | timely issuance of permits and licenses by government agencies, including obtaining all necessary administrative authorizations to drill locations, install producing infrastructures, build pipelines and related equipment to transport and market hydrocarbons; | |
| ● | the ability to carry out the front-end engineering design in order to prevent the occurrence of technical inconvenience during the execution phase; | |
| ● |
timely manufacturing and delivery of critical plants and equipment by contractors, like floating production storage and offloading (FPSO) vessels, floating units for the production of liquefied natural gas (FLNG) and platforms; | |
| ● | risks associated with the use of new technologies and the inability to develop advanced technologies to maximise the recoverability rate of hydrocarbons or gain access to previously inaccessible reservoirs; | |
| ● | delays in the commissioning and hook-up phase; | |
| ● | changes in operating conditions and cost overruns. We expect the prices of key input factors such as labour, basic materials (steel, cement, and other metals) and utilities to increase meaningfully in the next year or two due to rising inflationary pressures rippling through the entire supply chain at our development projects driven by higher worldwide demand for commodities and semi-finished goods as well as a shortage of productive factors. We also expect a rise in the daily rates of leased rigs and other drilling vessels and facilities as oil companies competes for a stable amount of supply of this kind of equipment. As a matter of fact, oilfield services companies have seen their revenues shrink meaningfully in recent years due to a contraction in capital expenditures made by their clients, and they have responded to the downturn by slashing costs and reducing expenditures in fleet upgrading and expansion; | |
| ● | the actual performance of the reservoir and natural field decline; | |
| ● | and the ability and time necessary to build suitable transport infrastructures to export production to final markets. |
The occurrence of any of such risks may negatively affect the time-to-market of the reserves and may cause cost overruns and start-up delays, lengthening the project pay-back period. Those risks would adversely affect the economic returns of Eni’s development projects and the achievement of production growth targets, also considering that those projects are exposed to the volatility of oil and gas prices which may be substantially different from those estimated when the investment decision was made, thereby leading to lower return rates.
Finally, if the Company is unable to develop and operate major projects as planned, it could incur significant impairment losses of capitalized costs associated with reduced future cash flows of those projects.
c) Inability to replace oil and natural gas reserves could adversely impact results of operations and financial condition, including cash flows
In case the Company’s exploration efforts are unsuccessful at replacing produced oil and natural gas, its reserves will decline. In addition to being a function of production, revisions and new discoveries, the Company’s reserve replacement is also affected by the entitlement mechanism in its production sharing agreements (“PSAs”), whereby the Company is entitled to a portion of a field’s reserves, the sale of which is intended to cover expenditures incurred by the Company to develop and operate the field. The higher the reference prices for Brent crude oil used to estimate Eni’s proved reserves, the lower the number of barrels necessary to recover the same amount of expenditure, and vice versa.
Future oil and gas production is a function of the Company’s ability to access new reserves through new discoveries, application of improved techniques, success in development activity, negotiations with national oil companies and other owners of known reserves and acquisitions.
An inability to replace produced reserves by discovering, acquiring, and developing additional reserves could adversely impact future production levels and growth prospects. If Eni is unsuccessful in meeting its long-term targets of reserve replacement, Eni’s future total proved reserves and production will decline.
d) Uncertainties in estimates of oil and natural gas reserves
The accuracy of proved reserve estimates and of projections of future rates of production and timing of development costs depends on several factors, assumptions and variables, including:
| ● | the quality of available geological, technical and economic data and their interpretation and judgment; | |
| ● | management’s assumptions regarding future rates of production and costs and timing of operating and development costs. The projections of higher operating and development costs may impair the ability of the Company to economically produce reserves leading to downward reserve revisions; | |
| ● | changes in the prevailing tax rules, other government regulations and contractual terms and conditions; | |
| ● | results of drilling, testing and the actual production performance of Eni’s reservoirs after the date of the estimates which may drive substantial upward or downward revisions; and | |
| ● | changes in oil and natural gas prices which could affect the quantities of Eni’s proved reserves since the estimates of reserves are based on prices and costs existing as of the date when these estimates are made. |
In 2022, despite rising hydrocarbons prices, we incurred around €400 million of asset impairment at upstream cash generating units “CGU” located in Congo, Egypt, the USA and Algeria due to the above-mentioned risks and accounting estimates. As part of our yearly review of recoverability of the carrying amounts of oil&gas assets, we determined that certain amounts of previously booked proved reserves were no longer economically producible at those assets and we increased future expected development expenditures leading to lower recoverable amounts and the recognition of impairment losses; for further information see Item 5.
Lower oil prices may impair the ability of the Company to economically produce reserves leading to downward reserve revisions.
Many of the factors, assumptions and variables underlying the estimation of proved reserves involve management’s judgment or are outside management’s control (prices, governmental regulations) and may change over time, therefore affecting the estimates of oil and natural gas reserves from year-to-year.
The prices used in calculating Eni’s estimated proved reserves are, in accordance with the U.S. Securities and Exchange Commission (the “U.S. SEC”) requirements, calculated by determining the unweighted arithmetic average of the first-day-of-the-month commodity prices for the preceding 12 months. For the 12-months ending at December 31, 2022, average prices were based on 101 $/barrel for the Brent crude oil. Compared to the 2022 reference price, Brent prices have declined significantly in the first quarter of 2023. If such prices do not increase in the coming months, Eni’s future calculations of estimated proved reserves will be based on lower commodity prices which would likely result in the Company having to remove non-economic reserves from its proved reserves in future periods.
Accordingly, the estimated reserves reported as of the end of 2022 could be significantly different from the quantities of oil and natural gas that will be ultimately recovered. Any downward revision in Eni’s estimated quantities of proved reserves would indicate lower future production volumes, which could adversely impact Eni’s business prospects, results of operations, cash flows and liquidity.
e) The development of the Group’s proved undeveloped reserves may take longer and may require higher levels of capital expenditures than it currently anticipates or the Group’s proved undeveloped reserves may not ultimately be developed or produced
As of December 31, 2022, approximately 37% of the Group’s total estimated proved reserves (by volume) were undeveloped and may not be ultimately developed or produced. Recovery of undeveloped reserves requires significant capital expenditures and successful drilling operations. The Group’s reserve estimates assume it can and will make these expenditures and conduct these operations successfully. These assumptions may prove to be inaccurate and are subject to the risk of a structural decline in the prices of hydrocarbons due to a possible acceleration towards a low-carbon economy and a shift in consumers’ behavior and preferences. In case of a prolonged decline in the prices of hydrocarbon the Group may not have enough financial resources to make the necessary expenditures to recover undeveloped reserves. The Group’s reserve report as of December 31, 2022 includes estimates of total future development and decommissioning costs associated with the Group’s proved total reserves of approximately €44.3 billion (undiscounted, including consolidated subsidiaries and equity-accounted entities). It cannot be certain that estimated costs of the development of these reserves will prove correct, development will occur as scheduled, or the results of such development will be as estimated. In case of change in the Company’s plans to develop those reserves, or if it is not otherwise able to successfully develop these reserves as a result of the Group’s inability to fund necessary capital expenditures or otherwise, it will be required to remove the associated volumes from the Group’s reported proved reserves.
f) The oil&gas industry is a capital-intensive business and needs large amount of funds to find and develop reserves. In case the Group does not have access to sufficient funds its oil&gas business may decline
The oil and gas industry is a capital intensive business. Eni makes and expects to continue making substantial capital expenditures in its business for the exploration, development and production of oil and natural gas reserves. Over the next four years, the Company plans to invest in the oil and gas business approximately €6-6.5 billion per year on average. Historically, Eni’s capital expenditures have been financed with cash generated from operations, proceeds from asset disposals, borrowings under its credit facilities and proceeds from the issuance of debt and bonds. The actual amount and timing of future capital expenditures may differ materially from Eni’s estimates as a result of, among other things, changes in commodity prices, changes in cost of oil services, available cash flows, lack of access to capital, actual drilling results, the availability of drilling rigs and other services and equipment, the availability of transportation capacity, and regulatory, technological and competitive developments. Eni’s cash flows from operations and access to capital markets are subject to several variables, including but not limited to:
● the amount of Eni’s proved reserves;
● the volume of crude oil and natural gas Eni is able to produce and sell from existing wells;
● the prices at which crude oil and natural gas are marketed;
● Eni’s ability to acquire, find and produce new reserves; and
● the ability and willingness of Eni’s lenders to extend credit or of participants in the capital markets to invest in Eni’s bonds.
If revenues or Eni’s ability to borrow decrease significantly due to factors such as a prolonged decline in crude oil and natural gas prices or a more stringent investment framework on part of lenders and financing institutions due to ESG considerations, Eni might have limited ability to obtain the capital necessary to sustain its planned capital expenditures. In addition, a greater than expected capital expenditure may curtail Eni’s ability to return cash to is shareholders through dividends and share repurchases. If cash generated by operations, cash from asset disposals, or cash available under Eni’s liquidity reserves or its credit facilities is not sufficient to meet capital requirements, the failure to obtain additional financing could result in a curtailment of operations relating to development of Eni’s reserves, which in turn could adversely affect its results of operations and cash flows and its ability to achieve its growth plans. The variability of Eni’s cash flow from operation has become an even greater risk factor in the current scenario, which is featuring significant increases in expenditures to sustain the Company’s current production plateau. In 2022 our capital expenditures in the E&P segment increased by about 60% to €6.4 billion due to the need to catch up following the capex cuts and activities rescheduling made during the COVID-19 pandemic, cost inflation, the appreciation of US dollar against the Euro (up by 10% in 2022) and the start of new projects. Higher cash requirements to fund the Company’s capital plans at a time when hydrocarbons prices may come under pressure due to macroeconomic risks may increase the Company’s financial risk profile and may require us to take on new finance debt from banks and financing institutions.
Finally, funding Eni’s capital expenditures with additional debt will increase its leverage and the issuance of additional debt will require a portion of Eni’s cash flows from operations to be used for the payment of interest and principal on its debt, thereby reducing its ability to use cash flows to fund capital expenditures and dividends.
g) Oil and gas activity may be subject to increasingly high levels of income taxes and royalties
Oil and gas operations are subject to the payment of royalties and income taxes, which tend to be higher than those payable in other commercial activities. Management believes that the marginal tax rate in the oil and gas industry tends to increase in correlation with higher oil prices, which could make it more difficult for Eni to translate higher oil prices into increased net profit. However, the Company does not expect that the marginal tax rate will decrease in response to falling oil prices. Adverse changes in the tax rate applicable to the Group’s profit before income taxes in its oil and gas operations would have a negative impact on Eni’s future results of operations and cash flows.
The surge in hydrocarbons and electricity prices drove a strong rebound in the results of companies in the energy sector. This trend started in 2021 due to a rebound in economic activity post the COVID-19 downturn and then accelerated in 2022 due to market fundamentals and geopolitical factors. The rise in the cost of fuels and energy has significantly and adversely affected businesses’ profit margins and households’ disposable income. In response to growing public concern, in the course of 2022 governments of EU member states and of UK have enacted or have announced the intention to enact one-off or temporary windfall levies to increase the taxes on the profits of energy companies relating to the portion of those profits deemed to exceed historical averages, to collect funds to alleviate the financial burden on households and businesses due to rising costs of fuels and energy.
In Italy, law n.51 of May 20, 2022, enacted a solidarity contribution for energy companies by establishing a one-off, windfall tax on the profits of those businesses. The levy was calculated by applying a 25% rate to the increase of the balance of sales and purchases declared in the periodic settlement of the value added tax in the six-month period starting October 1, 2021 through April, 30, 2022 over the corresponding prior years period. The Company recognized a cash expense of about €1.04 billion to settle this tax item.
In October, EU regulation 1854/2022 introduced a solidarity contribution for EU companies with activities in the crude petroleum, natural gas, coal and refinery sectors in order to mitigate the economic effects of the soaring energy prices for public authorities’ budgets, final customers and companies across the EU. Each Member State is demanded to adopt a national legislation to comply with that regulation. As part of that framework, the Italian government through the budget law for 2023 has enacted a windfall levy calculated by applying a 50% rate to the portion of taxable profit earned by companies in the hydrocarbons sector in 2022, which exceeds an amount equal to 110% of the average taxable profit of the previous four-year period. To account for this additional levy, the Group recognized a tax expense of about €1 billion, with the relevant cash out due in the course of 2023. Also Germany enacted a similar levy on the company’s our refining activity in this country, leading to the recognition of a tax expense of €0.17 billion.
Finally, the UK Energy Profits Levy was enacted effective May 26, 2022, which added a windfall tax rate of 25% to the corporate tax rate of oil&gas companies operating in UK and in the UK continental shelf. As a result of this windfall tax, the UK corporate tax rate increased to 65%. The windfall tax will remain valid until hydrocarbons prices normalize, and however no further than December 31, 2025. Eni accrued a charge of about €170 million to account for that levy. Furthermore, the UK proposal of budget law for fiscal year 2023 provisioned an increase of that rate to 35% and an extension of its term until the first quarter of 2028. Based on the latest levy modifications, the Company expects to incur a significant burden of income taxes at its UK activities in the next years, until the planned levy expiration in 2028.
Overall, all those extraordinary tax charges affected the Group net income for about €2.4 billion and reduced the yearly cash flow by about €1.1 billion.
Given the current environment of high energy prices, rising pressures on public finances due to an expected economic slowdown and the perception the oil&gas companies may be benefiting from the ongoing geopolitical situation, management cannot rule out the possibility of the introduction of new windfall taxes and other extraordinary levies targeting the hydrocarbons sector, which could negatively affect the Group’s results of operations and cash flows.
h) The present value of future net revenues from Eni’s proved reserves will not necessarily be the same as the current market value of Eni’s estimated crude oil and natural gas reserves
The present value of future net revenues from Eni’s proved reserves may differ from the current market value of Eni’s estimated crude oil and natural gas reserves. In accordance with the SEC rules, Eni bases the estimated discounted future net revenues from proved reserves on the 12- month unweighted arithmetic average of the first day of the month commodity prices for the preceding twelve months. Actual future prices may be materially higher or lower than the SEC pricing method in the calculations. Actual future net revenues from crude oil and natural gas properties will be affected by factors such as:
● the actual prices Eni receives for sales of crude oil and natural gas;
● the actual cost and timing of development and production expenditures;
● the timing and amount of actual production; and
● changes in governmental regulations or taxation.
The timing of both Eni’s production and its incurrence of expenses in connection with the development and production of crude oil and natural gas properties will affect the timing and amount of actual future net revenues from proved reserves, and thus their actual present value. Additionally, the 10% discount factor Eni uses when calculating discounted future net revenues may not be the most appropriate discount factor based on interest rates in effect from time to time and risks associated with Eni’s reserves or the crude oil and natural gas industry in general.
i) Oil and gas activity may be subject to increasingly high levels of regulations throughout the world, which may have an impact on the Group’s extraction activities and the recoverability of reserves
The production of oil and natural gas is highly regulated and is subject to conditions imposed by governments throughout the world in matters such as the award of exploration and production leases, the imposition of specific drilling and other work obligations, environmental and safety protection measures, control over the development and abandonment of fields and installations, and restrictions on production. These risks can limit the Group’s access to hydrocarbons reserves or may cause the Group to redesign, curtail or cease its oil and gas operations with significant effects on the Group’s business prospects, results of operations and cash flow.
Risks related to political considerations
As at December 31, 2022, about 81% of Eni’s proved hydrocarbon reserves were located in non-OECD (Organisation for Economic Co-operation and Development) countries, mainly in Africa, Central Asia and Middle East where the socio-political framework, the financial system and the macroeconomic outlook are less stable than in the OECD countries. In those non-OECD countries, Eni is exposed to a wide range of political risks and uncertainties, which may impair Eni’s ability to continue operating economically on a temporary or permanent basis, and Eni’s ability to access oil and gas reserves. Particularly, Eni faces risks in connection with the following potential issues and risks:
| ● | socio-political instability leading to internal conflicts, revolutions, establishment of non-democratic regimes, protests, attacks, and other forms of civil disorder and unrest, such as strikes, riots, sabotage, blockades, vandalism and theft of crude oil at pipelines, acts of violence and similar events. These risks could result in disruptions to economic activity, loss of output, plant closures and shutdowns, project delays, loss of assets and threats to the security of personnel. They may disrupt financial and commercial markets, including the supply of and pricing for oil and natural gas, and generate greater political and economic instability in some of the geographical areas in which Eni operates. Additionally, any possible reprisals because of military or other action, such as acts of terrorism in Europe, the United States or elsewhere, could have a material adverse effect on the world economy and hence on the global demand for hydrocarbons. In recent years including 2022, we have experienced higher-than-usual frequency in the theft of oil at our pipelines in Nigeria, which have resulted in significant loss of output and revenues; | |
| ● | lack of well-established and reliable legal systems and uncertainties surrounding the enforcement of contractual rights; | |
| ● | unfavorable enforcement of laws, regulations and contractual arrangements leading, for example, to expropriation, nationalization or forced divestiture of assets and unilateral cancellation or modification of contractual terms; | |
| ● |
sovereign default or financial instability since those countries rely heavily on petroleum revenues to sustain public finance. Financial difficulties at country level often translate into failure by state-owned companies and agencies to fulfil their financial obligations towards Eni relating to funding capital commitments in projects operated by Eni or to timely paying for supplies of equity oil and gas volumes; |
| ● | restrictions on exploration, production, imports and exports; | |
| ● | tax or royalty increases (including retroactive claims); | |
| ● | difficulties in finding qualified international or local suppliers in critical operating environments; and | |
| ● | complex processes of granting authorizations or licenses affecting time-to-market of certain development projects. |
Areas where Eni operates and where the Company is particularly exposed to political risk include, but are not limited to Libya, Venezuela, and Nigeria.
Eni’s operations in Libya are currently exposed to significant geopolitical risks. The social and political instability of the Country dates back to the revolution of 2011 that brought a change of regime and a civil war, triggering an uninterrupted period of lack of well-established institutions and recurrent acts of internal conflict, clashes, acts of war, disorders and other forms of civil turmoil and unrest between the two conflicting factions that emerged in the post-revolution political landscape. In the year of the revolution, Eni’s operations in Libya were materially affected by a full-scale war, which forced the Company to shut down its development and extractive activities for almost all of 2011, with a significant negative impact on the Group’s results of operation and cash flow. In subsequent years, Eni has experienced frequent disruptions to its operations, albeit on a smaller scale than in 2011, due to security threats to its installations and personnel and plan shutdowns due to force majeure. Since September 2020, the country had undergone a phase of stability which lasted for a large part of 2021, thanks to a pacification agreement with the aim of installing a new government freely elected by the entire population. However, the electoral process failed and the opposition between the Government of National Unity installed in Tripoli and the self-appointed National Stability Government installed in the east of the country resumed, fueling protests for a better redistribution of oil revenues and social tension. In 2022, the situation of instability and disorder determined between April and June the almost total shutdown of oil production in the eastern part of the country and the main export terminals, while two factions were disputing the appointment of the top management of the NOC State Company. The force majeure affected some assets participated by Eni. In 2022, Eni's production in Libya was 159 kboe/d.
Management believes that Libya’s geopolitical situation will continue to represent a source of risk and uncertainty to Eni’s operations in the country and to the Group’s results of operations and cash flow. Currently, Libyan production represents approximately 10% of the Group’s total production.
Venezuela is currently experiencing a situation of financial stress, which has been exacerbated by the economic recession caused by the effects of the COVID-19 pandemic. Lack of financial resources to support the development of the country’s hydrocarbons reserves has negatively affected the country’s production levels and hence fiscal revenues. The situation has been made worse by certain international sanctions targeting the country’s financial system and its ability to export crude oil to U.S. markets, which is the main outlet of Venezuelan production, as well as a US ban on dealing with Venezuela’s state-owned petroleum entities.
Currently, the Company retains just one main asset in Venezuela: the 50%-participated Cardón IV joint venture, which is operating an offshore natural gas field and is supplying its production to the national oil company, Petroleos de Venezuela SA (“PDVSA”), under a long-term supply agreement. PDVSA has failed to regularly pay the receivables for the gas volumes supplied by Cardón IV and consequently a significant amount of overdue receivables is outstanding at the closing date of the financial year 2022 and a credit loss provision has been booked to reflect the counterparty risk. The Company incurred in past years significant impairment losses and reserves de-bookings at the other main project in Venezuela relating to the PetroJunin onshore oilfield and at other minor projects, which were completely written off in past reporting periods. As of 31 December 2021, Eni’s invested capital in Venezuela was approximately €1.1 billion, mainly relating to trade receivable owed to us by PDVSA. Due to a partial lifting of US sanctions on the trade of Venezuelan crude oil, Eni was able in 2022 to obtain the reimbursement in-kind of a portion of its trade receivables, so to partly offset the increase of the year due to the current natural gas production and revenues. However, there is still a great deal of uncertainty about any possible evolution of the US sanctions against Venezuela and our ability to recover our outstanding receivables.
The Group has significant credit exposure towards state-owned and privately-held local companies in Nigeria in relation to their share of funding of petroleum projects operated by Eni. Eni has incurred significant credit losses because of the ongoing difficulties of Eni’s Nigerian counterparts to reimburse amounts past due.
Furthermore, Eni’s operations in Nigeria were negatively affected by continuing acts of theft of oil at onshore pipelines.
Finally, Eni’s Oil Prospecting License 245 expired in May 2021 and a request is pending to convert the license into an oil mining license to start development operations of the license reserves before the Nigerian authorities in charge. The management believes the request of conversion complies with the contractual terms, deadlines, and any other applicable conditions. However, the Nigerian authorities are holding back the approval. Eni has started an arbitration before an ICSID court to preserve the value of its asset.
Sanction targets
The most relevant sanction programs for Eni are those issued by the European Union and the United States of America and, as of today, the restrictive measures adopted by such authorities in respect of Russia and Venezuela.
As consequence of Russia’s military aggression of Ukraine, the European Union, the United Kingdom, the United States and the G-7 countries adopted a comprehensive system of sanctions against Russia to weaken its economy and its ability to finance the war. The sanction system is constantly evolving.
The main targets of the sanctions are the Russian Central Bank and the major financial institutions of the country. The EU has sanctioned the Russian Central Bank and many commercial banks by freezing assets and imposing a ban on EU operators from making transactions with sanctioned entities (such as providing financing, managing assets or Russian Central Bank’s reserves and any other kind of transaction).
Considering the complexity of the sanctions and the existing Eni’s contracts for gas supply from Russia and the need to make payments to Russian counterparties, the Company is exposed to the risk of possible violations of the sanction’s regime.
Eni adopted the necessary measures to ensure that its activities are carried out in accordance with the applicable rules, ensuring continuous monitoring of the evolution in the sanction framework, to adapt on an ongoing basis its activities to the applicable restrictions. In accordance with these guidelines, Eni complied with a new procedure of payment in rubles of Russian gas supplies, requested by the supplier GazpromExport in execution of legislative acts to which Eni is not subject (presidential decrees of the President of the Russian Federation).
The adhesion to this new payment procedure, not provided by the existing contractual provisions of regulation in euro, took place after considering the risks of possible violation of the sanction’s regime, as well as all the risks related to the duty to implement fairly the contractual obligations and after obtaining the prior approval of the Italian Authorities, responsible for verifying the compliance with the EU sanctions.
Eni has agreed to adhere to the new procedure, which we believe does not constitute a unilateral modification of the supply contract and invoices have continued to be issued in euro. This new procedure provides: i) the opening by Eni, as a precautionary measure, of two currency accounts called "K accounts" at the Russian Gazprombank; ii) the deposit by Eni of the invoices balance expressed in euro in one of the two K accounts (the one denominated in euro); iii) the conversion by Gazprombank into rubles at the Moscow Stock Exchange in the following 48 hours through a clearing agent; iv) the transfer according to the procedure of rubles obtained in the second K account (denominated in rubles). GazpromExport will be paid through this latter K account.
Eni considers that this conversion does not constitute the management of assets or reserves of the Russian Central Bank or a form of financing for Gazprombank or other entities subject to EU sanctions, as well as that the opening of K accounts takes place without prejudice to any of its contractual rights, which provide for the fulfilment of the obligation to pay in euro, while the risks and charges for conversion into rubles remains at the responsibility of the Russian supplier.
As a precautionary measure, Eni has initiated an international arbitration based on the Swedish law (as required by the existing contracts) to resolve doubts regarding the contractual changes required by the new payment procedure and the correct allocation of costs and risks.
Furthermore, an escalation of the international crisis, resulting in a tightening of sanctions, could entail a significant disruption of energy supply and trade flows globally, which could have a material adverse effect on the Group’s business, financial conditions, results of operations and prospects.
From 2017, the United States have enacted a regime of economic and financial sanctions against Venezuela. The scope of the restrictions, initially targeting certain financial instruments issued or sold by the Government of Venezuela, was gradually expanded over 2017 and 2018 and then significantly broadened during the course of 2019 when PDVSA, the main national state-owned enterprise, has been added to the “Specially Designated Nationals and Blocked Persons List” and the Venezuelan government and its controlled entities became subject to assets freeze in the United States. Even if such U.S. sanctions are substantially “primary” and therefore dedicated in principle to U.S. persons only, retaliatory measures and other adverse consequences may also interest foreign entities which operate with Venezuelan listed entities and/or in the oil sector of the country. The U.S. sanction regime against Venezuela was further tightened in the final part of 2020 by restricting any Venezuelan oil exports, including swap schemes utilised by foreign entities to recover trade and financing receivables from PDVSA and other Venezuelan counterparties. This latter tightening of the sanction regime has reduced the Group’s ability to collect the trade receivable owed to Eni for its activity in the country in 2021 and 2022, except for limited waivers agreed with US relevant authorities.
Eni carefully evaluates on a case-by-case basis the adoption of adequate measures to minimize its exposure to any sanctions risk which may affect its business operation. In any case, the U.S. sanctions add stress to the already complex financial, political and operating outlook of the country, which could further limit the ability of Eni to recover its investments in Venezuela.
Specific risks of the Company’s gas business in Italy
a) Current, negative trends in the competitive environment of the European natural gas sector may impair the Company’s ability to fulfil its minimum off-take obligations in connection with its take-or-pay, long-term gas supply contracts
Eni is currently party to a few long-term gas supply contracts with state-owned companies of key producing countries, from where most of the gas supplies directed to Europe are sourced via pipeline (Russia, Algeria, Libya and Norway). These contracts which were intended to support Eni’s sales plan in Italy and in other European markets, provide take-or-pay clauses whereby the Company has an obligation to lift minimum, preset volumes of gas in each year of the contractual term or, in case of failure, to pay the whole price, or a fraction of that price, up to a minimum contractual quantity. Similar considerations apply to ship-or-pay contractual obligations which arise from contracts with transmission system operators or pipeline owners, which the Company has entered into to secure long-term transport capacity. Long-term gas supply contracts with take-or pay clauses expose the Company to a volume risk, as the Company is obligated to purchase an annual minimum volume of gas, or in case of failure, to pay the underlying price. The structure of the Company’s portfolio of gas supply contracts is a risk to the profitability outlook of Eni’s wholesale gas business due to the current competitive dynamics in the European gas markets. In past downturns of the gas sector, the Company incurred significant cash outflows in response to its take-or-pay obligations. Furthermore, the Company’s wholesale business is exposed to volatile spreads between the procurement costs of gas, which are linked to spot prices at European hubs or to the price of crude oil, and the selling prices of gas which are mainly indexed to spot prices at the Italian hub.
Eni’s management is planning to continue its strategy of renegotiating the Company’s long-term gas supply contracts in order to constantly align pricing terms to current market conditions as they evolve and to obtain greater operational flexibility to better manage the take-or-pay obligations (volumes and delivery points among others), considering the risk factors described above. The revision clauses included in these contracts state the right of each counterparty to renegotiate the economic terms and other contractual conditions periodically, in relation to ongoing changes in the gas scenario. Management believes that the outcome of those renegotiations is uncertain in respect of both the amount of the economic benefits that will be ultimately obtained and the timing of recognition of profit. Furthermore, in case Eni and the gas suppliers fail to agree on revised contractual terms, both parties can start an arbitration procedure to obtain revised contractual conditions. All these possible developments within the renegotiation process could increase the level of risks and uncertainties relating the outcome of those renegotiations.
b) Risks associated with the regulatory powers entrusted to the Italian Regulatory Authority for Energy, Networks and Environment in the matter of pricing to residential customers
Eni’s wholesale gas and retail gas and power businesses are subject to regulatory risks mainly in Italy’s domestic market. The Italian Regulatory Authority for Energy, Networks and Environment (the “Authority”) is entrusted with certain powers in the matter of natural gas and power pricing. Specifically, the Authority retains a surveillance power on pricing in the natural gas market in Italy and the power to establish selling tariffs for the supply of natural gas to residential and commercial users who are opting for adhering to regulated tariffs until the market is fully opened. Developments in the regulatory framework intended to increase the level of market liquidity or of deregulation or intended to reduce operators’ ability to transfer to customers cost increases in raw materials may negatively affect future sales margins of gas and electricity, operating results, and cash flow. In the current environment characterized by rising energy costs, it is increasingly possible that the Authority may enact measures intended to limit revenues of inframarginal power generation and to reduce the indexation of the cost of the raw materials in pricing formulae applied by retail companies that market natural gas and electricity to residential customers and that development could negatively affect our results of operations and cash flow in the domestic retail business of natural gas and power. In the current energy crisis context, characterized by many regulatory interventions at EU and national level aimed at ensuring security of supply and curbing consumptions and energy prices for final customers, also our GGP business that engages in the wholesale marketing of natural gas and the power generation business that sell produced electricity on the spot market could be exposed to a regulatory risk, although on a smaller scale than the retail business due to well-established and liquid spot markets for natural gas and electricity.
Risks related to environmental, health and safety regulations and relevant legal risks
Eni has incurred in the past, and will continue incurring in future years, material operating expenses and expenditures in relation to compliance with applicable environmental, health and safety regulations, including compliance with any national or international regulation on greenhouse gas (GHG) emissions
Eni is subject to numerous European Union, international, national, regional and local laws and regulations regarding the impact of its operations on the environment and on health and safety of employees, contractors, communities and on the value of properties. Laws and regulations intended to preserve the environment and to safeguard health and safety of workers and communities impose several obligations, requirements and prohibitions to the Company’s businesses due to their inherent nature because of flammability, dangerousness and toxicity of hydrocarbons and of objective risks of industrial processes to explore, develop, extract, refine and transport oil, gas, and products. Generally, these laws and regulations require acquisition of a permit before drilling for hydrocarbons may commence, restrict the types, quantities and concentration of various substances that can be released into the environment in connection with exploration, drilling and production activities, including refinery and petrochemical plant operations, limit or prohibit drilling activities in certain protected areas, require to remove and dismantle drilling platforms and other equipment and well plug-in once oil and gas operations have terminated, provide for measures to be taken to protect the safety of the workplace, the health of employees, contractors and other Company collaborators and of communities involved by the Company’s activities, and impose criminal and civil liabilities for polluting the environment or harming employees’ or communities’ health and safety as result from the Group’s operations. These laws and regulations control the emission of scrap substances and pollutants, discipline the handling of hazardous materials and set limits to or prohibit the discharge of soil, water or groundwater contaminants, emissions of toxic gases and other air pollutants or can impose taxes on carbon dioxide emissions, as in the case of the European Trading Scheme that requires the purchase of an emission allowance for each tons of carbon dioxide emitted in the environment above a pre-set threshold, resulting from the operation of oil and natural gas extraction and processing plants, petrochemical plants, refineries, service stations, vessels, oil carriers, pipeline systems and other facilities owned or operated by Eni.
In addition, Eni’s operations are subject to laws and regulations relating to the production, handling, transportation, storage, disposal and treatment of waste. Breaches of environmental, health and safety laws and regulations as in the case of negligent or willful release of pollutants and contaminants into the atmosphere, the soil, water or groundwater or exceeding the concentration thresholds of contaminants set by the law expose the Company to the incurrence of liabilities associated with compensation for environmental, health or safety damage and expenses for environmental remediation and clean-up. Furthermore, in the case of violation of certain rules regarding the safeguard of the environment and the health and safety of employees, contractors, and other collaborators of the Company, and of communities, the Company may incur liabilities in connection with the negligent or willful violations of laws by its employees as per Italian Law Decree No. 231/2001.
Environmental, health and safety laws and regulations have a substantial impact on Eni’s operations. Management expects that the Group will continue to incur significant amounts of operating expenses and expenditures in the foreseeable future to comply with laws and regulations and to safeguard the environment and the health and safety of employees, contractors and communities involved by the Company operations, including:
| ● | costs to prevent, control, eliminate or reduce certain types of air and water emissions and handle waste and other hazardous materials, including the costs incurred in connection with government action to address climate change (see the specific section below on climate-related risks); | |
| ● | remedial and clean-up measures related to environmental contamination or accidents at various sites, including those owned by third parties; | |
| ● |
damage compensation claimed by individuals and entities, including local, regional or state administrations, should Eni cause any kind of accident, oil spill, well blowouts, pollution, contamination, emission of air pollutants and toxic gases above permitted levels or of any other hazardous gases, water, ground or air contaminants or pollutants, as a result of its operations or if the Company is found guilty of violating environmental laws and regulations; and | |
| ● | costs in connection with the decommissioning and removal of drilling platforms and other facilities, and well plugging at the end of oil and gas field production. Also, in case management decides to shut down production lines at refineries or petrochemicals complex, the Group would incur liabilities to dismantle and remove production facilities put out of service and to clean up and to remediate the area, as occurred in 2022 with management’s resolution to halt a refinery unit and ancillary equipment at an Italian refinery. |
As a further consequence of any new laws and regulations or other factors, like the actual or alleged occurrence of environmental damage at Eni’s plants and facilities, the Company may be forced to curtail, modify or cease certain operations or implement temporary shutdowns of facilities. If any of the risks set out above materialise, they could adversely impact the Group’s results of operations, cash flow, liquidity, business prospects, financial condition, and shareholder returns, including dividends, the amount of funds available for stock repurchases and the price of Eni’s shares.
Climate change-related risks
Increasing worldwide efforts to tackle climate change may lead to the adoption of stricter regulations to curb carbon emissions and this may end up suppressing demands for our products in medium-to-long term.
Governments of the nations that have signed the 2015 COP 21 Paris Agreement have been advancing plans and initiatives intended to transition the economy towards a low-carbon model in the long run to pursue the objective of containing the temperature increase to 1.5 °C above preindustrial levels and tackling risks of structural modifications to the Earth climate, which would pose serious threat to life on the planet. The scientific community has been sounding alarms over the potential, catastrophic consequences caused by rising global temperatures to the environment and has established that the release in the atmosphere of carbon dioxide (CO2) as a result of burning fossil fuels and other human activities and the emissions of other harmful gases like methane are the main drivers of climate change. The rising in frequency and dangerousness of many extreme weather events has been widely recognized as a direct consequence of the climate change such as floods, drought, hurricanes, heat waves, cold snaps, rising sea levels, fires, and other environmental mutations, which have been causing material damage to economies, loss of human lives, damage to property, destruction of ecosystems and other negative impacts. The energy transition, as well as increasingly stricter regulations in the field of CO2 emission, could adversely and materially affect demands for the Group’s products and hence our business, results of operations and prospects.
The dramatic fallout of the COVID-19 pandemic on economic activity and people’s lifestyle could have possibly accelerated the evolution toward a low-carbon model of development. This is because many governments and the EU deployed massive amounts of resources to help the economy recover and a large part of this economic stimulus has been or is planned to be directed to help transitioning the economy and the energy mix towards a low-carbon model, as in the case of the EU’s recovery fund, which provides for huge investments in the sector of renewable energies and the green economy, including large-scale adoption of hydrogen as a new energy source.
Those risks may emerge in the short, medium and long term.
Eni expects that the achievement of the Paris Agreement goal of limiting the rise in temperature to well below 2° C above pre-industrial levels in this century, or the more ambitious goal of limiting global warming to 1.5° C, will strengthen the global response to the issue of climate change and spur governments to introduce measures and policies targeting the reduction of GHG emissions, which are expected to bring about a gradual reduction in the use of fossil fuels over the medium to long-term, notably through the diversification of the energy mix, likely reducing local demand for fossil fuels and negatively affecting global demand for oil and natural gas.
Although the Company is investing a significant amount of resources to develop decarbonized products and to grow the generation capacity of renewable power and other low and zero carbon technologies to produce power or absorb carbon dioxide (CO2) from the atmosphere, the Group’s financial performance and business prospects still depends in a substantial way on the legacy business of Exploration & Production. In case demands for hydrocarbons decline rapidly due to widespread adoption of regulations, rules or international treaties designed to reduce GHG emissions, our results of operations and business prospects may be significantly and negatively affected.
Eni expects its operating and compliance expenses to increase in the short term due to the likely growing adoption of carbon tax mechanisms. Some governments have already introduced carbon pricing schemes, which can be an effective measure to reduce GHG emissions at the lowest overall cost to society. Currently, about half of the direct GHG emissions coming from Eni’s operated assets are included in national or supranational Carbon Pricing Mechanisms, such as the European Emission Trading Scheme (ETS), which provides an obligation to purchase, on the open market, emission allowances in case GHG emissions exceed a pre-set amount of emission allowances allotted for free. In 2022 to comply with this carbon emissions scheme, Eni purchased on the open market allowances corresponding to 16.73 million tons of CO2 emissions incurring expenses of around €950 million (12.42 million tons in 2021 for a total expense of €660 million). Due to the likelihood of new regulations in this area and expectations of a reduction in free allowances under the European ETS and the likely adoption of similar schemes by a rising number of governments, Eni is aware of the risk that a growing share of the Group’s GHG emissions could be subject to carbon-pricing and other forms of climate regulation in the near future, leading to additional compliance and cost obligations with respect to the release in the atmosphere of carbon dioxide. In the future, we could incur increased investments and significantly higher operating expenses in case the Company is unable to reduce the carbon footprint of its operations. Eni also expects that governments will require companies to apply technical measures to reduce their GHG emissions.
In the long-term demands for hydrocarbons may be materially reduced by the projected mass adoption of electric vehicles, the development of green hydrogen, the deployment of massive investments to grow renewable energies also supported by governments fiscal policies and the development of other technologies to produce clean feedstock, fuels and energy.
In the long term, the role of hydrocarbons in satisfying a large portion of the energy needs of the global economy may be displaced by the emergence of new products and technologies, as well as by changing consumers’ preferences. The automotive industry is investing material amounts of resources to upgrade its assembly line to ramp up production of electric vehicles (EVs) and to boost the EVs line-up, with R&D efforts focused on reducing the performance and cost gap with the internal-combustion-engine cars and light-duty vehicles, particularly by extending batteries range. The EV market has attracted large amounts of venture capital and financing, which have propelled the growth of an entirely new batch of pure-EV players, which are introducing smart EV models to gain consumers preference and market share, fueling continuing innovation in the sector and accelerating the strategic shift of well-established car companies. Sales of EVs have grown significantly in 2022, also thanks to fiscal incentives designed to increase the affordability of EVs by middle and low-income households, and according to market projections sales of EVs will surpass internal-combustion-engine sales by 2030 also helped by proposed measures to be introduced by states and local administration to ban sales of new internal-combustion-engine cars. This trend could disrupt in the long term the consumption of gasoline which is one of the main drivers of global crude oil demand. Other potentially disruptive technologies designated to produce clean energy and fuels are emerging, driven by the development of hydrogen-based solutions as an energy vector or the utilization of renewables feedstock to manufacture fuels and other goods replacing oil-based products. Production of hydrogen by means of green technologies will also reduce hydrocarbons demands. The electricity generation from wind power or solar technologies is projected to grow massively in line with the stated targets by several governments and institutions like the EU, the USA and the UK to decarbonize the electricity sector in the next one or two decades, replacing gas-fired generation.
These trends could disrupt demand for hydrocarbons in the future, with many forecasters, both within the industry, or state agencies and independent observers predicting peak oil demand in the next ten years or earlier.
A large portion of Eni’s business depends on the global demand for oil and natural gas. If existing or future laws, regulations, treaties, or international agreements related to GHG and climate change, including state incentives to conserve energy or use alternative energy sources, technological breakthroughs in the field of renewable energies, hydrogen, production of nuclear energy or mass adoption of electric vehicles trigger a structural decline in worldwide demand for oil and natural gas, Eni’s results of operations and business prospects may be materially and adversely affected.
Supranational institutions, like the United Nations, civil society and the scientific community are calling for bold action to tackle climate change and this may lead governments to take extraordinary measures to cut carbon emissions
The United Nations, representatives from the civil society, some Non-Governmental Organizations (“NGO”), international institutions and the scientific community have become increasingly vocal about the dramatic consequences of climate change for the life on the planet, warning about irreversible damages to the ecosystem and calling for drastic and immediate actions by governments to tackle the emergency. In a report issued on May 18, 2021 the International Energy Agency has claimed that to reach net-zero GHG emissions by 2050 and commitments set out in the Paris Agreement, there must be an immediate ban on investments in new oil and gas projects. In response to those requests for intervention, it is possible that certain governments in jurisdictions where we operate may deny permissions to start new oil and gas projects or may impose further restrictions on drilling and other field activities or ban oil&gas operations altogether. These possible developments could significantly and negatively affect our business’s prospects and results of operations.
We are exposed to growing legal risks in connection with the hundreds of lawsuits pending in various jurisdictions against oil&gas companies based on alleged violation of human rights, damage to environment and other claims and such legal actions may be brought against us.
In recent years, there has been a marked increase in climate-based litigation. Courts could be more likely to hold companies who have allegedly made the most significant contributions to climate change to account. Oil&gas companies are particularly exposed to that risk.
In 2021, a Dutch court ordered an international oil company to reduce their worldwide emissions (Scope 1, 2, and 3) by a significant amount within a preset timeframe. This indicates that oil and gas companies may have an individual legal responsibility to reduce emissions to address climate change and confirms the risk of liability, including liability for human rights violations. Courts may condemn oil and gas companies to compensate individuals, communities, and states for the economic losses due to global warming as a consequence of their alleged responsibility in supporting hydrocarbons and knowingly hurting the environment.
For example, we are defending in California against claims brought to us by local administrations and certain associations of individuals who are seeking compensation for alleged economic losses and environmental damage due to climate change.
Board’s directors may be summoned before courts for having failed to implement a climate strategy in line with the goals of the Paris Agreement or for not having acted quickly to reduce emissions of greenhouse gases “GHG”.
Private individuals, associations and NGOs may also bring legal actions against states to get them condemned to adopt stricter national targets of reduction in the absolute level of GHG emissions and that could entail more restrictive measures on businesses. For example, an association of private individuals have sued the Italian state for allegedly violating human rights and have claimed the Italian State to increase the national targets of reduction of GHG emissions and that could have negative consequences for Eni.
There are also risks that governments, regulators, organizations, NGOs and individuals may sue us for alleged crimes against the environment in connection with past and present GHG emissions related to our operations and the use of the products we have manufactured.
As such, climate litigation constitutes a material risk for the company and its investors. In case the Company is condemned to reduce its GHG emissions at a much faster rate than planned by management or to compensate for damage related to climate change due to ongoing or potential lawsuits, we could incur a material adverse effect on our results of operations and business’s prospects.
Asset managers, banks and other financing institutions have been increasingly adopting ESG criteria in their investment and financing decisions and this could reduce the attractiveness of our share or limit our ability to access the capital markets.
Many professional investors like asset managers, mutual funds, global allocation funds, generalist investors and pensions funds have been reducing their exposure to the fossil fuel industry due to the adoption of stricter ESG criteria in selecting investing opportunities. In some cases, those investors have adopted climate change targets in determining their policies of asset allocations. Many of them have announced plans to completely divest from the fossil fuel industry. This trend could reduce the market for our share and negatively affect shareholders’ returns. Likewise, banks, financing institutions, lenders and also insurance companies are cutting exposure to the fossil fuel industry due to the need to comply with ESG mandate or to reach emission reduction targets in their portfolios and this could limit our ability to access new financing, could drive a rise in borrowing costs to us or increase the costs of insuring our assets. During COP 26 at Glasgow (UK), 450 financial institutions, mostly banks and pension funds, in 45 countries with assets estimated at $130 trillion have committed to limiting greenhouse gas emitting assets in their portfolios. The finance pledge, known as the Glasgow Financial Alliance for Net Zero (GFANZ), will mean that by 2050 all the assets under management by the institutions that signed on can be counted toward a net-zero emission pathway. However, while this pledge does not preclude the continued funding of fossil fuels, as of recently several large, international financing institutions have taken a tougher approach as they announced they would not support direct financing to develop new oil and gas fields soon, a move that could herald an emerging trend among banks and lenders towards a phase-out of financing the hydrocarbons sector.
As a result of those developments, we expect the cost of capital to the Company to rise in the future and reduced ability on part of Eni to obtain financing for future projects in the oil&gas business or to obtain it at competitive rates, which may curb our investment opportunities or drive an increase in financing expenses, negatively affecting our results of operations and business prospects.
Activist shareholders have been increasingly pressuring oil&gas companies to accelerate the shift to renewable energies and to reduce CO2 emissions and this may interfere with management’s plans and lead to sub-optimal investment decisions
Shareholders and activist funds may have resolutions passed at annual general meetings of listed oil&gas companies, which would force management to implement faster than planned actions to curb emissions or to revise industrial plans to obtain a quicker pace of emissions reduction and that could interfere with management’s long-term goals, strategies and capital allocation processes leading to unplanned cost increases and sub-optimal investment decisions. For example, in 2021, activist shareholders succeeded in passing a nonbinding shareholders resolution to force Chevron into cutting its carbon emissions, including those relating to the products the company sells to its customers. Similar resolutions were also approved at other US oil&gas companies.
Meanwhile, an activist hedge fund conducted a successful proxy fight at ExxonMobil and won a seat in its board of directors. This will likely lead to greater scrutiny of the company strategies and capital allocation plans by the board.
More recently, activist investors have pursued claims against oil&gas companies. In UK, a group of institutional investors have brought a lawsuit against the board of directors of an oil&gas company over alleged climate mismanagement, arguing that directors failed to manage the material and foreseeable risks posed to the company by climate change, and as such they were breaking company law.
It is the first, notable lawsuit by a shareholder against a board over the alleged failure to properly prepare for a shift away from fossil fuels.
These events underscore the growing pressure from investors and capital markets on oil&gas companies towards a future based on renewables energies and an acceleration in the phase-out of investments into fossil fuels. We believe that our company could be exposed to that kind of risk.
Extreme weather phenomena, which has been widely recognized as a direct consequence of climate change, may disrupt our operations
The scientific community has concluded that increasing global average temperature produces significant physical effects, such as the increased frequency and severity of hurricanes, storms, droughts, floods, or other extreme climatic events that could interfere with Eni’s operations and damage Eni’s facilities. Extreme and unpredictable weather phenomena can result in material disruption to Eni’s operations, and consequent loss of or damage to properties and facilities, as well as a loss of output, loss of revenues, increasing maintenance and repair expenses and cash flow shortfall.
We are exposed to reputational risks in connection with the public perception of oil&gas companies as entities primarily responsible for the climate change
There is a reputational risk linked to the fact that oil companies are increasingly perceived by governments, financial institutions and the general public as entities primarily responsible for global warming due to GHG emissions across the hydrocarbon value chain, particularly related to the use of energy products, and as poorly-performing players alongside ESG dimensions. This could possibly impair the company reputation and a societally recognized mission to operate in the e&p area. . This could also make Eni’s shares and debt instruments less attractive to banks, funds and individual investors who have been increasingly applying ESG criteria and have been growing cautions in assessing the risk profile of oil and gas companies, due to their carbon footprint, when making investment and lending decisions.
As a result of these trends, climate-related risks could have a material and adverse effect on the Group’s results of operations, cash flow, liquidity, business prospects, financial condition, and shareholder returns, including dividends and the price of Eni’s shares.
Environmental, legal, IT and financial risks
a) Eni is exposed to the risk of material environmental liabilities in addition to the provisions already accrued in the consolidated financial statement.
Eni has incurred in the past and may incur in the future material environmental liabilities in connection with the environmental impact of its past and present industrial activities. Eni is also exposed to claims under environmental requirements and, from time to time, such claims have been made against the Company. Furthermore, environmental regulations in Italy and elsewhere typically impose strict liability. Strict liability means that in some situations Eni could be exposed to liability for clean-up and remediation costs, environmental damage, and other damages as a result of Eni’s conduct of operations that was lawful at the time it occurred or of the management of industrial hubs by prior operators or other third parties, who were subsequently taken over by Eni. In addition, plaintiffs may seek to obtain compensation for damage resulting from events of contamination and pollution or in case the Company is found liable for violations of any environmental laws or regulations. In Italy, Eni is exposed to the risk of expenses and environmental liabilities in connection with the impact of its past activities at certain industrial hubs where the Group’s products were produced, processed, stored, distributed, or sold, such as chemical plants, mineral-metallurgic plants, refineries, and other facilities, which were subsequently disposed of, liquidated, closed, or shut down. At these industrial hubs, Eni has undertaken several initiatives to remediate and clean up proprietary or concession areas that were allegedly contaminated and polluted by the Group’s industrial activities. State or local public administrations have sued Eni for environmental and other damages and for clean-up and remediation measures in addition to those which were performed by the Company, or which the Company has committed to performing. In some cases, Eni has been sued for alleged breach of criminal laws (for example for alleged environmental crimes such as failure to perform soil or groundwater reclamation, environmental disaster and contamination, discharge of toxic materials, amongst others). Although Eni believes that it may not be held liable for having exceeded in the past pollution thresholds that are unlawful according to current regulations, but were allowed by laws then effective, or because the Group took over operations from third parties, it cannot be excluded that Eni could potentially incur such environmental liabilities. Eni’s financial statements account for provisions relating to the costs to be incurred with respect to clean ups and remediation of contaminated areas and groundwater for which legal or constructive obligations exist and the associated costs can be reasonably estimated in a reliable manner, regardless of any previous liability attributable to other parties. In 2022, due to environmental regulation development setting more clear criteria concerning the recovery management of groundwater pollutants, and taking into account the expertise cumulated in years of environmental management, the Group was in position to reliably accrue a provision of about €1.3 billion to account for the future expected costs of completing ongoing cleanup of groundwater at a number of Italian hubs, where operations were shut down years ago. The accrued amounts of the existing environmental risk provision represent management’s best estimates of the Company’s existing liabilities for future remediation and clean-up of Eni’s shut-down Italian sites.
Management believes that it is possible that in the future Eni may incur significant or material environmental expenses and liabilities in addition to the amounts already accrued due to: (i) the likelihood of as yet unknown contamination; (ii) the results of ongoing surveys or surveys to be carried out on the environmental status of certain Eni’s industrial sites as required by the applicable regulations on contaminated sites; (iii) unfavourable developments in ongoing litigation on the environmental status of certain of the Company’s sites where a number of public administrations, the Italian Ministry of the Environment or third parties are claiming compensation for environmental or other damages such as damages to people’s health and loss of property value; (iv) the possibility that new litigation might arise; (v) the probability that new and stricter environmental laws might be implemented; and (vi) the circumstance that the extent and cost of environmental restoration and remediation programs are often inherently difficult to estimate leading to underestimation of the future costs of remediation and restoration, as well as unforeseen adverse developments both in the final remediation costs and with respect to the final liability allocation among the various parties involved at the sites. As a result of these risks, environmental liabilities could be substantial and could have a material adverse effect on the Group’s results of operations, cash flow, liquidity, business prospects, financial condition, and shareholder returns, including dividends, the amount of funds available for stock repurchases and the price of Eni’s shares.
Finally, in case of conviction of Eni’s employees for environmental crimes, the Company could be held liable as per Italian Legislative Decree 231/2001 which states the responsibility of legal entities for certain violations of laws committed by their employees and could face fines and restrictive measures to perform industrial activities which could adversely and significantly affect results of operations, cash flows and the Company’s reputation.
b) Risks related to legal proceedings and compliance with anti-corruption legislation
Eni is the defendant in a number of civil and criminal actions and administrative proceedings. In future years Eni may incur significant losses due to: (i) uncertainty regarding the final outcome of each proceeding; (ii) the occurrence of new developments that management could not take into consideration when evaluating the likely outcome of each proceeding in order to accrue the risk provisions as of the date of the latest financial statements or to judge a negative outcome only as possible or to conclude that a contingency loss could not be estimated reliably; (iii) the emergence of new evidence and information; and (iv) underestimation of probable future losses due to circumstances that are often inherently difficult to estimate. Certain legal proceedings and investigations in which Eni or its subsidiaries or its officers and employees are defendants involve the alleged breach of anti-bribery and anti-corruption laws and regulations and other ethical misconduct. Such proceedings are described in the notes to the condensed consolidated interim financial statements, under the heading “Legal Proceedings”. Ethical misconduct and noncompliance with applicable laws and regulations, including noncompliance with anti-bribery and anti-corruption laws, by Eni, its officers and employees, its partners, agents or others that act on the Group’s behalf, could expose Eni and its employees to criminal and civil penalties and could be damaging to Eni’s reputation and shareholder value.
c) Risks from acquisitions
Eni is constantly monitoring the market in search of opportunities to acquire individual assets or companies with a view of achieving its growth targets or complementing its asset portfolio. Acquisitions entail an execution risk – the risk that the acquirer will not be able to effectively integrate the purchased assets to achieve expected synergies. In addition, acquisitions entail a financial risk – the risk of not being able to recover the purchase costs of acquired assets, in case of a prolonged decline in the market prices of commodities. Eni may also incur unanticipated costs or assume unexpected liabilities and losses in connection with companies or assets it acquires. If the integration and financial risks related to acquisitions materialize, expected synergies from acquisition may fall short of management’s targets and Eni’s financial performance and shareholders’ returns may be adversely affected.
d) Eni’s crisis management systems may be ineffective
Eni has developed contingency plans to continue or recover operations following a disruption or incident. An inability to restore or replace critical capacity to an agreed level within an agreed period could prolong the impact of any disruption and could severely affect business, operations and financial results. Eni has crisis management plans and the capability to deal with emergencies at every level of its operations. If Eni does not respond or is not seen to respond in an appropriate manner to either an external or internal crisis, this could adversely impact the Group’s results of operations, cash flow, liquidity, business prospects, financial condition, and shareholder returns, including dividends, the amount of funds available for stock repurchases and the price of Eni’s shares.
e) Disruption to or breaches of Eni’s critical IT services or digital infrastructure and security systems could adversely affect the Group’s business, increase costs and damage Eni’s reputation
The Group’s activities depend heavily on the reliability and security of its information technology (IT) systems and digital security. The Group’s IT systems, some of which are managed by third parties, are susceptible to being compromised, damaged, disrupted or shutdown due to failures during the process of upgrading or replacing software, databases or components, power or network outages, hardware failures, cyberattacks (viruses, computer intrusions), user errors or natural disasters. The cyber threat is constantly evolving. The oil and gas industry is subject to fast-evolving risks from cyber threat actors, including nation states, criminals, terrorists, hacktivists and insiders. Attacks are becoming more sophisticated with regularly renewed techniques while the digital transformation amplifies exposure to these cyber threats. The adoption of new technologies, such as the Internet of Things (IoT) or the migration to the cloud, as well as the evolution of architectures for increasingly interconnected systems, are all areas where cyber security is a very important issue. The Group and its service providers may not be able to prevent third parties from breaking into the Group’s IT systems, disrupting business operations or communications infrastructure through denial of service, attacks, or gaining access to confidential or sensitive information held in the system. The Group, like many companies, has been and expects to continue to be the target of attempted cybersecurity attacks. While the Group has not experienced any such attack that has had a material impact on its business, the Group cannot guarantee that its security measures will be sufficient to prevent a material disruption, breach or compromise in the future. As a result, the Group’s activities and assets could sustain serious damage, services to clients could be interrupted, material intellectual property could be divulged and, in some cases, personal injury, property damage, environmental harm and regulatory violations could occur. If any of the risks set out above materialise, they could adversely impact the Group’s results of operations, cash flow, liquidity, business prospects, financial condition, and shareholder returns, including dividends, the amount of funds available for stock repurchases and the price of Eni’s share.
f) Violations of data protection laws carry fines and expose the Company and/or its employees to criminal sanctions and civil suits.
Data protection laws and regulations apply to Eni and its joint ventures and associates in the vast majority of countries in which they do business. The General Data Protection Regulation (EU) 2016/679 (GDPR) came into effect in May 2018 and increased penalties up to a maximum of 4% of global annual turnover for breach of the regulation. The GDPR requires mandatory breach notification, a standard also followed outside of the EU (particularly in Asia). Non-compliance with data protection laws could expose Eni to regulatory investigations, which could result in fines and penalties as well as harm the Company’s reputation. In addition to imposing fines, regulators may also issue orders to stop processing personal data, which could disrupt operations. The Company could also be subject to litigation from persons or corporations allegedly affected by data protection violations. Violation of data protection laws is a criminal offence in some countries, and individuals can be imprisoned or fined. If any of the risks set out above materialise, they could adversely impact the Group’s results of operations, cash flow, liquidity, business prospects, financial condition, and shareholder returns, including dividends, the amount of funds available for stock repurchases and the price of Eni’s shares.
g) Eni is exposed to treasury and trading risks, including liquidity risk, interest rate risk, foreign exchange risk, commodity price risk and credit risk and may incur substantial losses in connection with those risks.
Market risk
Eni’s business is exposed to the risk that changes in interest rates, foreign exchange rates or the prices of energy commodities and products will adversely affect the value of assets, liabilities or expected future cash flows.
The Group does not hedge its exposure to volatile hydrocarbons prices in its business of developing and extracting hydrocarbons reserves and other types of commodity exposures (e.g. exposure to the volatility of refining margins and of certain portions of the gas long-term supply portfolio) except for specific markets or business conditions. The Group has established risk management procedures and enters derivatives commodity contracts to hedge exposure to the commodity risk relating to commercial activities, which derives from different indexation formulas between purchase and selling prices of commodities. However, hedging may not function as expected. In addition, Eni undertakes commodity trading to optimize commercial margins or with a view of profiting from expected movements in market prices. Although Eni believes it has established sound risk management procedures to monitor and control commodity trading, this activity involves elements of forecasting and Eni is exposed to the risk of incurring significant losses if prices develop contrary to management expectations and to the risk of default of counterparties.
Eni is exposed to the risks of unfavorable movements in exchange rates primarily because Eni’s consolidated financial statements are prepared in Euros, whereas Eni’s main subsidiaries in the Exploration & Production sector are utilizing the U.S. dollar as their functional currency. This translation risk is unhedged.
Furthermore, Eni’s euro-denominated subsidiaries incur revenues and expenses in currencies other than the euro or are otherwise exposed to currency fluctuations because prices of oil, natural gas and refined products generally are denominated in, or linked to, the U.S. dollar, while a significant portion of Eni’s expenses are incurred in euros and because movements in exchange rates may negatively affect the fair value of assets and liabilities denominated in currencies other than the euro. Therefore, movements in the U.S. dollar (or other foreign currencies) exchange rate versus the euro affect results of operations and cash flows and year-on-year comparability of the performance. These exposures are normally pooled at Group level and net exposures to exchange rate volatility are netted on the marketplace using derivative transactions. However, the effectiveness of such hedging activity is uncertain, and the Company may incur losses also of significant amounts. As a rule of thumb, a depreciation of the U.S. dollar against the euro generally has an adverse impact on Eni’s results of operations and liquidity because it reduces booked revenues by an amount greater than the decrease in U.S. dollar-denominated expenses and may also result in significant translation adjustments that impact Eni’s shareholders’ equity.
Eni is exposed to fluctuations in interest rates that may affect the fair value of Eni’s financial assets and liabilities as well as the amount of finance expense recorded through profit. Eni enters into derivative transactions with the purpose of minimizing its exposure to the interest rate risk.
Eni’s credit ratings are potentially exposed to risk from possible reductions of the sovereign credit rating of Italy. Based on the methodologies used by Standard & Poor’s and Moody’s, a potential downgrade of Italy’s credit rating may have a potential knock-on effect on the credit rating of Italian issuers such as Eni and make it more likely that the credit rating of the debt instruments issued by the Company could be downgraded.
Credit risk
Eni is exposed to credit risk. Eni’s counterparties could default, could be unable to pay the amounts owed to it in a timely manner or meet their performance obligations under contractual arrangements. These events could cause the Company to recognize loss provisions with respect to amounts owed to it by debtors of the Company and cash flow shortfall. In recent years, the Group has experienced a significant level of counterparty default due to Europe and Italy’s weak economic growth and a downturn in crude oil prices affecting the solvency of national oil entities and local companies, which are joint operators of Eni-lead projects. Those trends were made worse by the COVID-19 recession, resulting in a significantly deteriorated credit and financial profile of many of Eni’s counterparties, including joint operators and national oil companies in Eni’s upstream projects, retail customers in the gas retail business and other industrial accounts. In 2022, the significant rise in the prices of energy commodities has increased Eni’s exposure to the credit risk in the mid and downstream businesses of natural gas. The retail gas & power business managed by Plenitude is particularly exposed to the credit risk due to its large and diversified customer base, which includes thousands of medium and small-sized businesses and retail customers whose financial condition has been negatively and adversely affected because the value of invoices has risen manyfold putting at stress the ability of our counterparts to pay amounts owed to us. Also, certain large industrial accounts at our wholesale natural gas business have been facing difficulties at paying amounts due to us. Due to that trend, we increased our credit loss provisions in 2022. It is possible that the ability of our debtors to pay amounts due to us will deteriorate in the next future, especially in case of a continuing uptrend in the prices of energy commodities. Furthermore, we are exposed to risks of growing working capital needs in case regulatory authorities introduce measures intended to safeguard households and other residential customers by mandating us to extend payment terms.
Eni believes that the management of doubtful accounts in the current environment of surging energy prices represents a significant financial risk to the Company, which will require management focus and commitment going forward. Eni cannot exclude the recognition of significant provisions for doubtful accounts in future reporting periods and increasing working capital needs.
If any of the risks set out above materializes, this could adversely impact the Group’s results of operations, cash flow, liquidity, business prospects, financial condition, and shareholder returns, including dividends, the amount of funds available for stock repurchases and the price of Eni’s shares.
Liquidity risk
Liquidity risk is the risk that suitable sources of funding for the Group may not be available, or that the Group is unable to sell its assets on the marketplace to meet short-term financial requirements and to settle obligations. Such a situation would negatively affect the Group’s results of operations and cash flows as it would result in Eni incurring higher borrowing expenses to meet its obligations or, under the worst conditions, the inability of Eni to continue as a going concern. Global financial markets are volatile due to several macroeconomic risk factors and unpredictable developments. In case new restrictive measures in response to a resurgence of the pandemic or the war in Ukraine lead to a double-dip in economic activity and energy demand, in the event of extended periods of constraints in the financial markets, or if Eni is unable to access the financial markets (including cases where this is due to Eni’s financial position or market sentiment as to Eni’s prospects) at a time when cash flows from Eni’s business operations may be under pressure, the Company may incur significantly higher borrowing costs than in the past or difficulties obtaining the necessary financial resources to fund Eni’s development plans, therefore jeopardizing Eni’s ability to maintain long-term investment programs. A reduction in the investments needed to develop Eni’s reserves and to grow the business may significantly and negatively affect Eni’s business prospects, results of operations and cash flows, and may impact shareholder returns, including dividends or share price.
Eni, the former Ente Nazionale Idrocarburi, a public law agency, established by Law No. 136 of February 10, 1953, was transformed into a joint stock company by Law Decree No. 333 published in the Official Gazette of the Republic of Italy No. 162 of July 11, 1992 (converted into law on August 8, 1992, by Law No. 359, published in the Official Gazette of the Republic of Italy No. 190 of August 13, 1992). The Shareholders’ Meeting of August 7, 1992 resolved that the company be called Eni SpA. Eni is registered at the Companies Register of Rome, register tax identification number 00484960588, R.E.A. Rome No. 756453. Eni is expected to remain in existence until December 31, 2100; its duration can however be extended by resolution of the shareholders.
The name of the agent of Eni in the United States is Marco Margheri, Washington DC – USA 601, 13th street, NW 20005.
The Company engages in producing and selling energy products and services to worldwide markets, with operations in the traditional businesses of exploring for, developing, extracting and marketing crude oil and natural gas, manufacturing and marketing oil-based fuels and chemicals products and gas-fired power as well as energy products from renewable sources. The company is implementing a strategy designed to reduce in the long term its dependence on hydrocarbons and to increase the weight of decarbonized products in its portfolio with the aim of reaching the target of net-zero greenhouse gas emissions by 2050 to pursue the most ambitious target of the Paris Agreement to limit global average temperature increase to 1.5°C by the end of the century. Management believes this strategic shift away from traditional hydrocarbons will place the Company in a very competitive position in the market for the supply of de-carbonized products, combining value creation, business sustainability and economic and financial robustness, lessening the Company’s dependence on the volatility of the results of the hydrocarbons businesses. To execute this strategy, the Company has established two business Groups.
The Natural Resources Business Group is committed to build up in a sustainable way, the value of Eni’s Oil & Gas upstream portfolio, with the objective of reducing its carbon footprint by scaling up energy efficiency and expanding production in the natural gas business, and its position in the wholesale market. Furthermore, it is focused on the development of projects to capture and store CO2 emissions and of carbon sink, mainly through initiatives of Natural Climate Solutions like the projects for forests conservation and rehabilitation, carried out mostly in developing Countries, that qualify as REDD+ projects.
The Energy Evolution Business Group is engaged in the evolution of the businesses of power generation, transformation and marketing of products from fossil to bio, blue and green. In particular, it is focused on growing power generation from renewable energy and biomethane, it coordinates the bio and circular evolution of the Company’s refining system and chemical business, and it further develops Eni’s retail portfolio, providing increasingly more decarbonized products for mobility, household consumption and small enterprises. The Business Group includes results of the Refining & Marketing business, the chemical business managed by Versalis SpA and its subsidiaries, the Eni Plenitude SpA Società Benefit (“Plenitude”) which combines renewables generation, gas and power retail and business customers, electric vehicle charging and energy services in a unique business model. In addition to these activities, this business Group include the results of power generation from thermoelectric plants and the activities of environmental reclamation and requalification implemented by the subsidiary company Eni Rewind.
For IFRS segmental reporting purposes, Eni’s principal segments of operations are described below:
| ● | Exploration & Production, which also comprises the economics of the forestry projects (REDD+) and projects for CO2 capture and storage and/or utilization. Eni’s Exploration & Production segment engages in oil and natural gas exploration and field development and production, as well as in LNG operations, in 37 countries, most notably Italy, Libya, Egypt, Norway, the United Kingdom, Angola, Congo, Nigeria, Mexico, the United States, Kazakhstan, Algeria, Iraq, Indonesia, Ghana, Mozambique, Qatar, Ivory Coast and United Arab Emirates. In 2022, Eni’s average daily production amounted to 1,487 KBOE/d on an available- for-sale basis. As of December 31, 2022, Eni’s total proved reserves amounted to 6,614 mmBOE, which include subsidiary undertakings and proportionally consolidated entities and Eni’s share of reserves of equity-accounted joint ventures and associates. | |
| ● | Global Gas & LNG Portfolio: engages in the wholesale activity of supplying and selling natural gas via pipeline and LNG, and the international transport activity. It also comprises gas trading activities targeting both hedging and stabilizing the Group’s commercial margins and optimizing the gas asset portfolio. In 2022, Eni’s worldwide sales of natural gas amounted to 60.52 BCM, of which 30.67 BCM was in Italy. The LNG business includes the purchase and marketing of LNG worldwide, with a large proportion of equity LNG supplies. |
| ● |
Refining & Marketing and Chemicals: engages in the manufacturing, supply and distribution and marketing activities of oil products and chemical products and in trading activities. The results of operations of the R&M business and of the chemical business have been combined in a single reporting segment because the two businesses exhibit similar characteristics. Oil and products trading activities are designed to perform supply balancing transactions in the market and to stabilize or hedge commercial margins. The R&M business engages in crude oil supply and refining and marketing of petroleum products to the cargo market, to large business accounts (airlines companies, bunker, public administrations, operators of privately-held networks of service stations) and to retail customers through a network of proprietary or leased service stations in Italy and in the rest of Europe. Production of refined products derives from both oil-based refineries and from manufacturing processes based on bio-feedstock. As of December 31, 2022, the balanced traditional and bio-feedstocks based refining capacity was 528 KBBL/d and 1.1 million tonnes/year, respectively. In 2022, processed volumes of crude oil and other feedstock, including renewable feedstock, amounted to 19.38 mmtonnes (of which traditional refinery throughputs were 18.84 mmtonnes and bio refinery throughputs were 0.54 mmtonnes) and sales of refined products were 27.79 mmtonnes, of which 21.32 mmtonnes were in Italy. Retail sales of refined products at Eni’s service stations amounted to 7.50 mmtonnes in Italy and in the rest of Europe. In 2022, Eni’s retail market share in Italy through its “Eni” branded network of service stations was 21.7%. In the Chemical business Eni, through its wholly-owned subsidiary Versalis, engages in the production and marketing of basic petrochemical products, plastics and elastomers. Versalis is developing the business of green chemicals. Activities are concentrated in Italy and in Europe. In 2022, production volumes of petrochemicals amounted to 6,775 ktonnes. | |
| ● | Plenitude & Power: engages in the activities of retail marketing of gas, power and related services, in the production and wholesale marketing of power produced by both thermoelectric plants and from renewable sources, as well as in the e-mobility services. It also comprises trading activities of CO2 emission allowances to help stabilize/hedge the Clean Spark Spread (CSS) of gas-fired power production and the power sales commercial margin. As of December 31, 2022, Eni’s customer base was over 10 million retail points of delivery (gas and electricity) in Europe (of which 8.1 million were in Italy). In 2022, retail power sales to end customers, managed by Plenitude and subsidiary companies in France, Greece and Iberian Peninsula, amounted to 18.77 TWh. Retail gas sales, in Italy and in European markets, amounted to 6.84 BCM. | |
| Eni is engaged in the renewable energy business (solar photovoltaic and wind facilities both onshore and offshore) through Plenitude which engages in building, commissioning and managing renewable energy producing plants. As of December 31, 2022, the installed capacity from renewable sources was 2,198 MW, doubled compared to December 31, 2021 (1,137 MW). When considering installed capacity at other Eni's business segments, Eni Group installed capacity from renewables amounted to 2,256 MW as of December 31, 2022 (1,188 MW as of December 31, 2021) | ||
| With reference to the e-mobility business, as of December 31, 2022, Eni’s network of charging stations for electric vehicles included over 13,000 installed charging points distributed throughout the Italian territory. | ||
| As of December 31, 2022, the installed operational capacity of Eni’s thermoelectric plants was 2.3 GW, with a total power generation of 21.37 TWh in 2022. | ||
| ● | Corporate and Other activities: include the costs of the main business support functions, as well as the results of the Group environmental clean-up and remediation activities performed by the subsidiary Eni Rewind. |
Eni’s registered head office is located at Piazzale Enrico Mattei 1, Rome, Italy (telephone number: +39-0659821).
Eni branches are located in:
San Donato Milanese (Milan), Via Emilia, 1; and
San Donato Milanese (Milan), Piazza Ezio Vanoni, 1. Internet address: eni.com
A list of Eni’s subsidiaries is provided in “Item 18 – Note 37 – Other information about investments – of the Notes on Consolidated Financial Statements”.
Strategy
The Company is executing a strategy designed to adapt its business model to and to grow in a low-carbon economy. Our long-term goal is to reach the carbon-neutrality of our industrial processes and products by 2050, addressing GHG emissions of scope 1, 2 and 3, in line with the climate goals set by the COP 21 Paris Agreement, which we fully endorse. The evolution of our business model and the underlying action plan will be accomplished over a thirty-year timeframe and will significantly increase the weight of fully-decarbonized products in our portfolio. In this timeframe, we are planning to gradually decrease the Company’s exposure to hydrocarbons, capitalizing on the opportunities arising from a rapidly-changing energy landscape. The strategic guidelines that will drive our evolution going forward are:
| ● | To actively contribute to the achievement of the 17 UN SDGs which are reflected in Eni’s mission, particularly the goals of tackling climate change and securing universal access to reliable, affordable and clean energy; | |
| ● |
To maximize the integration of the portfolio along the entire energy value chain; | |
| ● |
To retain a financial framework which prioritizes capital discipline and a strong balance sheet and ensures competitive and progressive returns to shareholders; | |
| ● |
To improve the Group’s resilience to the oil scenario, also by reducing the exposure to the traditional oil-based businesses and growing the relative weight of the businesses of renewable energies, biofuels, retail, circular economy and innovative energy vectors in the Group portfolio; | |
| ● |
To leverage our proprietary technologies to underpin the development of new businesses to respond to the specific decarbonization challenges of our clients; | |
| ● |
To develop our distinctive satellite approach, which consist of establishing entities focused on specific market segments or geographies, featuring tailored business models and capable of independently accessing capital markets to fund their growth and to unlock their intrisic values. Such entities are expected to continue benefiting from Eni’s research&development skills, know-how, services and risk management of health, safety and environmental risks and project management capabilities. In 2021 we established Plenitude a subsidiary that is planned to be financially independent from us, in charge of developing the businesses of electricity generation from renewable sources and a network of charging points for Electric Vehicles (EV), leveraging integration with the large customer portfolio of the legacy retail business to drive improving returns. We are evaluating options to monetize part of our interest in Plenitude in the next years. In E&P, in 2022, we have established with bp a financially-independent joint venture that has combined the partners’ asset portfolios in Angola, becoming the largest independent upstream producer, and is expected to drive value and growth by developing organic reserves. Following the successful growth of our JV Var Energi in Norway, we have monetized part of the intrinsic value of the investment through a share sale and listing on the Norway exchange. Finally, at the beginning of 2023, our new Eni Sustainable Mobility subsidiary was set up to offer increasingly decarbonized solutions/products to people on the move, leveraging a large marketing network and biorefineries vertically integrated with our agricultural business; | |
| ● | To leverage alliances and collaboration with a wide range of stakeholders to develop mutually beneficial solutions and synergies. As part of this guideline, in 2022 we have started our agricultural business in Kenya leveraging integration with local farmers to produce a renewable feedstock that will be used in the manufacturing of biofuels with low carbon footprint at our biorefineries in Italy. This project applies the best standards of sustainability and circular economy by repurposing abandoned land and by favorably contributing to local job creation and development, without competing with the food chain. This project marks the start of Eni’s innovative model of vertically integrating its agri-business with its biorefineries and will be replicated in other African countries. |
In the last part of 2021, the energy markets across the world, particularly in Europe, tightened due to a strong macroeconomic recovery following the reopening of activities post the pandemic crisis, which fueled a pent-up demand for crude oil, natural gas, and other energy commodities. This surge in demand has not been matched by a growth in supplies due to a slow response by operators. International listed oil&gas companies have adopted a new financial framework, which has been prioritizing the restructuring of balance sheets and increasing shareholders’ returns by limiting the reinvestment of funds from operations in new projects. The OPEC+ alliance has successfully adopted a policy of putting a floor to crude oil prices by gradually curbing the quotas agreed in response to the pandemic crisis, and furthermore has grossly underperformed its own production targets due to years of underinvestment. Finally, the oil&gas sector has seen a growing reluctance on part of financial institutions and lenders to fund new oil&gas projects owing to ESG considerations, thus further limiting funds to develop new hydrocarbons reserves, which would constrain new supplies going forward.
In 2022, the energy market imbalances have considerably deteriorated due to the outbreak of the conflict between Russia and Ukraine as signaled by the extreme volatility in commodities prices recorded throughout 2022, which was one of the most volatile year on record as measured by certain indicators. In response to the war of aggression of Russia, EU member states have adopted wide economic sanctions and have signaled a political will to reduce the energy dependence on Russia, which was the largest natural gas supplier of Europe in 2021. In a climate of uncertainty and confrontation, Russia has steadily reduced natural gas flows to Europe, triggering a spike in the prices of natural gas and electricity. The issue of the stability and reliability of energy supplies has come back on the agenda of EU national governments amidst rising public worries about access to and cost of fuels and energy. In 2022, our strategy in response to those market developments was to ensure continuity and affordability of energy supplies to Italy and Europe as we commenced an action plan to fully replace the volumes of natural gas imported from Russia to the Italian market, flowing at about 20 bmc per year before 2022. To accomplish this goal, we accelerated ongoing initiatives to develop equity reserves and deployed our assets consisting of a large portfolio of contracted natural gas under long-term agreements, contractual flexibilities, access to infrastructures, a solid presence in the LNG business and well-established relationships with producing countries, particularly those overlooking the Mediterranean Sea to find alternative and additional gas supply opportunities. In a few months we finalized several deals with our long-standing partners to diversify natural gas supplies to Europe and were able to replace about 50% of Russian gas supplies in 2022. When those initiatives are fully ramped up, we expect to be able to replace 100% of Russian supplies, which we expect to happen in 2025. Those initiatives include an increase in natural gas volumes from Algeria through ramping up equity production at our assets and additional supplies under the existing long-term contracts, which will be delivered to Italy through the existing pipelines from Algeria through Tunisia and the Mediterranean Sea. Then we are going to put into production the recent discoveries made in Egypt with a fast time-to-market due to their being close to production facilities. Increased production volumes of natural gas from our Egyptian concessions will be exported through our proprietary LNG terminal of Damietta. Development activities of the Congo LNG project have been started up by deploying a vessel for the floating production of LNG and by signing a turn-key contracts to build another vessel; operations are due to commence late in 2023. Natural gas production will be increased in Italy through the expected start-up of a new project and various initiatives to revitalize existing natural gas fields. In the medium term, new natural gas supplies will be secured through our interest of 3% in the North Field Est LNG project in Qatar and by a project off Libya designed to put into production reserves of the Structures A&E.
The capital expenditures associated with all the above-mentioned projects are included in our industrial plans for the years 2023-2026, which features an expenditure budget of about €37 billion, higher than the previous plan due to new project activities and the other factors described in Item 5. Low and zero carbon spending is expected to be about 25% of that amount.
In 2022, the Company has also moved forward its decarbonization strategy by investing in the expansion of the production capacity of renewable electricity reaching 2.2 GW and in the extension of the network of charging points for EV, by strengthening biofuels production by starting a new business model to secure sustainable feedstocks, by financing a venture engaged in building a pilot plant to test a new technology of nuclear energy based on magnetic fusion, by progressing two projects for the underground permanent geological storage of CO2 in Italy and in UK, and by leveraging its sustainability-linked financial framework to obtain financing at costs that reflect the Company’s ongoing decarbonization effort, the latest example of which was a sustainability-linked bond that was placed among retail investors in Italy early in January 2023 amounting to €2 billion.
Our financial plans for the next four-year period 2023-2026 assume a Brent crude oil price of 85 $/bbl in 2023-2024 and of 80 $ in both 2025 and 2026. Our future performance will be driven by profitable production growth in E&P, mainly through natural gas and LNG developments, expansion of the renewable generation capacity, continuing margin optimizations at our GGP business and increased volumes of contracted LNG leveraging integration with upstream equity projects, steady profitability in the refining business helped by product optimization and cost efficiencies, the upgrading of the manufacturing capacity of biofuels and the ramp up of vertical integration with the agricultural business in Africa to secure cheap and reliable feedstock for our biorefineries and a restructuring of our petrochemical business managed by Versalis by growing sales of high-performance polymers to end-user markets and by developing bio-based chemicals, recycled plastics and new technologies.
In 2023 we expect to make capital expenditures of €9.5 billion, some 20% higher than 2022, and expect hydrocarbons production to achieve 1.63-1.67 million boe/d (slightly lower on an available-for-sale basis), projecting a small increase compared to the 2022 production level. Our forecast of almost flat production despite rising capital expenditures is explained by the allocation of significant amounts of expenditures to accelerate the development of certain large upstream projects that will come online at the end of 2023 or in 2024, thus with a relatively low contribution to the 2023 expected production plateau.
We will remain financially disciplined by applying strict investment thresholds to our capital projects that are to meet minimum return rates and, in the case of oil &gas projects, be consistent with our projected emission profiles and targets. Financial discipline, coupled with cost control measures and margin expansion initiatives will drive our cash generation, enabling us to ensure competitive and progressive remuneration to our shareholders through dividends and share buy-backs (see Item 5 – remuneration policy).
Action plan to achieve carbon neutrality in 2050
Eni is aware of the ongoing climate emergency and intends to play a key role in the transition of the energy sector towards achieving carbon neutrality by 2050, in line with scenarios that are compatible with keeping global warming within the threshold of 1.5° C at the end of this century.
The strategy and the action plan designed by the Company for the medium and the long-term will drive a significant improvement in our carbon footprint in line with our objective of carbon neutrality of all our industrial activities and processes and energy products sold by 2050. The pathway towards Eni's Carbon Neutrality in 2050 includes a set of objectives that foresee net zero emissions (Scope 1+2) for the E&P business by 2030 and for the Eni's group by 2035, then net zero emissions by 2050 for all GHG Scope 1, 2 and 3 emissions associated with the portfolio of the energy products sold.
The stated Company's targets and levers are planned to be the following:
| ● | To achieve the net-zero carbon footprint of the E&P business (Scope 1+2) by 2030, with an intermediate target of down by 65% by 2025 vs. the 2018 baseline, and a net zero carbon footprint of the Eni Group by 2035; | |
| ● | To achieve a reduction of 35% in net GHG lifecycle emissions (Scope 1+2+3) by 2030 vs. the 2018 baseline, then down 55% by 2035 and 80% by 2040; | |
| ● | To achieve a reduction of 15% in the net carbon intensity of energy products sold by 2030 vs. the 2018 baseline and then a reduction of 50% by 2040. |
The residual emissions will be compensated through offsets, mainly from natural climate solutions, which will contribute to about 5% of the overall reduction of the value chain emissions in 2050.
Eni's decarbonization objectives are based on an industrial transformation plan that will be implemented on time according to market dynamics and in line with society's needs and which is based on solutions and technologies already available. The main levers of this plan are:
| ● | To reduce hydrocarbon production in the medium-long term with a plateau expected through 2030 and a gradual growth of the gas proportion, which will reach more than 60% by 2030 and more than 90% after 2040; | |
| ● |
To increase organic refining capacity to more than 5 million tonnes by 2030, leveraging on feedstock that are palm oil free since the end of 2022 and vertical integration with the nascent agribusiness, which is expected to supply about 700,000 tonnes of renewable feedstock by 2026; | |
| ● | To progressively increase Plenitude's renewable capacity with over 15 GW by 2030, to reach 60 GW in 2050 within a customer base growth to more than 20 million in 2050; | |
| ● |
To develop the business of sustainable mobility by installing about 30,000 charging points for electric vehicles by 2026 and about 160,000 by 2050; | |
| ● | To progressively increase the production of new energy carriers and develop the nuclear energy based on the technology of magnetic fusion, with the first operational plant expected by the beginning of 2030; | |
| ● | To develop the underground permanent geological storage of CO2 targeting hard-to-abate emissions both from Eni and third-party industrial sites, reaching a storage capacity of about 50 MtCO2 in 2050 (Eni share). |
Managing the risk of stranded oil&gas assets
The decarbonization of our E&P business (net zero on scope 1 and 2 GHG emissions by 2030 on an equity basis) is one of the main drivers to reduce the risk of our hydrocarbons reserves becoming stranded. This will be accomplished by:
| ● | increasing operational efficiency to minimize direct upstream CO2 emissions. As part of this guideline, in our upstream operated assets we plan to fully eliminate routine gas flaring and to keep methane emission intensity below 0.2%; | |
| ● |
CCS will contribute to reduce Eni's own emissions and emissions by third parties through the ramp up of projects of underground permanent geological storage of CO2 leveraging our technologies and availability of depleted reservoirs, targeting to capture 10 MTPA of CO2 by 2030 (coming from both our emissions and third parties' emissions) and by offsetting residual CO2 amount by means of Natural Climate Solutions initiatives, such as through our participation to projects for preserving forests (REDD+), and the application of technological solutions in various areas, with the goal of progressively maximizing the component of carbon removal. These initiatives will provide an annual portfolio of carbon credits capable of offsetting residual emissions for an amount of 15 million tonnes per year in 2030. |
Our portfolio of oil and gas properties features a large weight of natural gas, the least GHG-emitting fossil energy source. As of December 31, 2022, natural gas proved reserves represented approximately 52% of Eni’s total proved reserves of its subsidiary undertakings and joint ventures. The other constituencies of our portfolio of oil&gas properties which are mitigating the risk of stranded assets are the large weight of conventional projects, featuring low CO2 intensity and the low Brent price of breakeven. We estimate our reserves to have an average breakeven price that is fairly lower than current Brent crude oil prices (this estimation includes our proved reserves and a certain amount of unproved reserves), thus underpinning a rapid pay-back period, which is estimated at less than five years for the new projects.
The low breakeven price of our reserves has been driven by our exploration and development model that features: effective exploration focused on near-field and proven/mature plays to leverage on existing infrastructures to readily put new reserves into production; selected exploration in risky areas; a focus on low-complexity developments; and a phased approach to putting reserves into production featuring early production start-up and subsequent ramp up to reduce the financial exposure of development projects and accelerate the time-to-market and the pay-back period. Based on those drivers, we have gradually reduced the breakeven price of our reserves and improved the resilience to low-carbon scenarios, which also considering the emissive profiles of our assets are expected to mitigate the risk of stranded reserves going forward. The risk of stranded assets might emerge in case of a structural decline in hydrocarbons demands because of stricter global environmental constraints and regulations and changing consumers’ preferences resulting in trends like the mass adoption of electric vehicles or a lower weight of hydrocarbons in the energy mix, or regulatory constraints like a global adoption of carbon pricing schemes.
Eni’s portfolio exposure to those risks is reviewed annually against changing GHG regulatory regimes, evolving consumers’ preferences, technological developments, and physical conditions to identify emerging risks. To test the resilience of new capital projects, Eni assesses potential costs associated with GHG emissions and how projects’ returns may be affected. The development process and internal authorization procedures of each E&P capital project feature several checks that may require additional and well detailed GHG and energy management plans to address potential risks of underperformance in relation to possible scenarios of global or regional adoption of regulations introducing mechanisms of carbon cap and trade or carbon pricing.
Management stress-tested the recoverability of the book values of the Company’s oil & gas assets under the assumptions set forth in the IEA Net Zero “NZE 2050” scenario and other lowered price assumptions, without assuming any management’s actions on capex rescheduling, reduction or curtailments, cost revisions or other possible measure to adapt the business to a changed trading environment. The purpose of those stress tests is to evaluate the reasonableness of the outcome of the impairment review of those assets that is regularly performed by the management utilizing its own oil pricing, costs and other assumptions and considering proved reserves and certain amounts of unproved reserves, “the base case”, as well as possible risks of stranded assets that could emerge within transition pathways that are faster than those forecast by the managements. Those stress tests covered the whole of the oil & gas cash generating units (CGUs) that are regularly tested for impairment in accordance with IAS 36.
The stress test performed by Eni’s management of the values-in-use of Eni’s oil&gas assets under the pricing and cost assumptions of the IEA NZE scenario highlighted a loss of value and potential asset write-downs, all of which were not material based on management’s judgement. Overall, the stress test confirmed the quality and resilience of Eni’s assets. Those stress tests have been performed by just updating pricing and CO2 cost assumptions in management’s cash flow projections and do not assume any change to all other factors in the models used, such as cost levels, volumes, and the discount rate, to calculate recoverability of carrying amounts. Sensitivity testing has been performed by applying the alternative commodity price scenarios to cash flows for the whole period until the end of life of the assets tested. More information is provided in note no. 15 to the Consolidated Financial Statements.
|
Value in use of the O&G CGUs |
Assumption at 2050 in real terms USD 2021 |
||||||||
|
|
tax-deductible |
non tax-deductible |
Brent Price |
European gas price |
Cost of CO2 |
||||
|
Eni's scenario |
>100% |
- |
43 |
5.3 |
CO2 costs projections in the EU/ETS |
||||
|
10% Haircut of Eni's price scenario |
80% |
- |
39 |
4.8 |
CO2 costs projections in the EU/ETS |
||||
|
IEA NZE 2050 scenario |
55% |
49% |
24 |
3.8 |
250-180 each ton of CO2 (*) |
||||
|
(*) Differentiated price according to economy classified as "advanced" or "emerging". |
|||||||||
Capital allocation framework
Eni is also committed to aligning its plans and investment decisions to its decarbonisation strategy: the share of expenditures related to Oil&Gas activities will be gradually reduced and the main investment projects will be evaluated consistently with emission reduction targets and the commitment to gradually phase out investments in carbon-intensive “unabated” activities or products, as a necessary condition to achieve carbon neutrality by mid-century.
On our funding strategy, we have established a financial framework whereby our capex in fossil fuel activities is covered by internally-generated funds; while growth in our businesses of the energy transition, particularly the expansion of renewable generation capacity, will be supported also through third party financing.
Our long-term capital allocation plans foresee a share of 30% of our capex dedicated to grow the business of the energy transition at the end of the four-year industrial plan, increasing to 70% by 2030 and up to 85% by 2040.
Carbon neutrality by 2050
Aware of the ongoing climate emergency, Eni wants to be an active part of the energy sector's transition with a long-term strategy towards Carbon Neutrality in 2050, in line with scenarios that are compatible with keeping global warming within the 1.5 °C threshold by the end of the century. Eni has long been committed to promoting comprehensive and effective disclosure on climate change and in this respect confirms its commitment to implementing the recommendations of the Task Force on Climate Related Financial Disclosure (TCFD) of the Financial Stability Board, which Eni has adopted since 2017, the first year applicable for reporting.
Disclosure on Carbon Neutrality by 2050 is organized according to the four thematic areas indicated by TCFD: Governance, Risk Management, Strategy and Metrics and Targets. The key elements of each area are presented below; for a complete analysis of Eni’s climate strategy, please see "Eni for - A Just Transition" while additional information will be available through Eni’s disclosure to CDP Climate Change 2023 questionnaire.
Governance
Role of the BoD. Eni's decarbonization strategy is an integral part of Eni’s business strategy and is also implemented through a structured system of Corporate Governance, where the BoD and the CEO play a central role in managing key climate change issues. Specifically, the BoD examines and approves the Strategic Plan proposed by the CEO, which sets out strategies and targets including those related to climate change and energy transition, and, starting 2019, examines and approves also Eni’s medium/long-term plan which aims to outline and monitor the evolution of decarbonization objectives and their economic and business sustainability in a time frame up to 2050.
Since 2014, the Eni BoD has been supported in performing its duties by the Sustainability and Scenarios Committee (SSC), established on a voluntary basis , which, among other tasks, periodically examines the integration between strategy, development scenarios and the medium/ long-term sustainability of the business with a view to energy transition and climate change. During 2022, the SSC explored various topics related to climate change, including R&D activities for the energy transition, carbon pricing systems, agri-feedstock activities, Nature & Technology Based carbon offsets, Eni's positioning on climate targets and strategies versus peers, Eni's performance in CDP questionnaires, climate resolutions and Shareholders’ Meeting disclosures, Carbon Capture and Storage (CCS) projects, and Just Transition related topics.
With reference to the composition of the Board, it is reported that on the basis of the self-assessment conducted, about 90% of the Board Members expressed their positive opinion on the professionalism within the Board – in terms of knowledge, experience and skills (with particular reference to advisory, training and publication activities in the energy and environmental field, participation in governmental and non-governmental, national and international bodies that deal with these issues) – and on the personal contribution that the individual Board Members make to the Board of Directors in matters of sustainability, ESG and energy transition, which have characterized the BoD’ work for their entire mandate. The relevance of these skills is reaffirmed in the Guidance to Shareholders on the Optimum Composition of the Future Board of Directors, which emphasises the importance of ensuring Eni's directors have knowledge of topics related to sustainability and the control of climate and environmental risks, acted out in managerial or entrepreneurial roles and acquired in industrial contexts comparable to those in which the Company operates.
The commitment of the entire Board of Directors on the issues of energy transition, climate change, sustainability and ESG is unanimously recognised in its strategic guiding role and monitoring activities for the transition path undertaken. Equally significant is the support provided by the board committees, in particular the Sustainability and Scenarios Committee, to maintain continuity of training and discussion on these topics, which are unanimously seen as growing in perspective, along with strategy and business issues. Immediately after the appointment of the Board of Directors and the Board of Statutory Auditors, a board induction programme was implemented for directors and statutory auditors, which covered, among other topics, issues related to the decarbonization process and the environmental and social sustainability of Eni’s activities. The economic-financial exposure of Eni to the risks deriving from the introduction of new carbon pricing mechanisms is examined by the BoD both in the phase leading up to authorisation of each investment and in the following half-year monitoring of the entire project portfolio. The BoD is also informed annually on the results of the impairment test carried out on the main Cash Generating Units. Since 2021, the IEA’s1 NZE (Net Zero Emissions) scenario is included in the scenarios for portfolio evaluations. Finally, the BoD is informed on a quarterly basis on the results of the risk assessment and monitoring activities related to Eni’s top risks, including climate change.
Role of management. All company structures are involved in the definition or implementation of the carbon neutrality strategy that is reflected in Eni's organizational structure with the two business groups: Natural Resources, active in the optimisation and progressive decarbonization of the Upstream portfolio, Natural Climate Solutions initiatives and CO2 storage projects, and Energy Evolution, active in the expansion of bio, renewable and circular economy activities and the offer of new energy solutions and services. As of 2019, climate strategy issues are managed by the CFO area through dedicated structures with the aim of overseeing the process of defining Eni’s climate strategy and the related portfolio of initiatives, in line with international climate agreements. The strategic commitment in carbon footprint reduction is part of the essential goals of the Company and is therefore also reflected in the Variable Incentive Plans for the CEO and Company’s management. In particular, the Long-Term Stock-based Incentive Plan, in line with the previous one, provides specific objectives for decarbonization and energy transition that include the production of biojet fuel and circular economy projects, for a total weight of 35%, in line with the objectives communicated to the market and with the aim of aligning with the interests of all stakeholders. The Short-Term Incentive Plan, in line with the previous one, is closely linked to Eni's strategic transformation targets, including decarbonization and energy transition objectives consistent with the Long-Term Incentive Plan, with an overall weight of 25% for the CEO and, according to weights consistent with the responsibilities assigned, for all company management.
Risk Management
The process for identifying and assessing climate-related risks is part of Eni's Integrated Risk Management Model developed to ensure that decisions made take into account risks from an integrated, comprehensive and forward-looking perspective. The process ensures the detection, consolidation and analysis of all Eni’s risks and supports the BoD in checking the compatibility of the risk profile with the strategic targets, also in a long-term perspective, and monitoring the evolution of the main risks and the de-risking actions.
1 International Energy Agency.
Risks, including Climate Change, are assessed with quantitative and qualitative tools considering both the probability of occurrence and the impacts (environmental, health and safety, social, and reputational) that would take place in a given time frame if the risk were to occur. These risks are represented on matrices that allow comparison and classification by relevance based on the probability of occurrence and impact. Risks related to climate change are analysed, assessed and managed by considering the drivers identified in the TCFD recommendations, which refer both to energy transition risks (market scenario, regulatory and technological evolution, reputation issues) and physical risk (acute and chronic) associated with climate change. The identification of main transition risks adopts an integrated bottom-up and top-down approach. The former is applied during risk assessment down to the line of business and subsidiary level, and it assesses the executive risks related to strategic climate change de-risking actions through interviews with risk owners. The top-down approach involves multi-disciplinary teams (covering regulatory, legal, technological, etc. aspects) and identifies, for in the medium- to long-term, possible context developments. The analysis considers both external sources (e.g. IEA scenarios) and internal monitoring. Concerning physical risk, Eni has developed an assessment process that includes both its assets and those of third parties that may impact Eni's operations. The process, which is constantly evolving based on the results of the first implementations, based on data provided by specialist data providers, assesses the inherent risk of assets (based on position and over a 30-year time frame) against ten identified risks (acute and chronic). The strength and effectiveness of existing mitigation actions is assessed for exposed assets, identifying the residual risk (per individual asset). Assets still exposed are analysed in more detail as part of the Asset Integrity process with a specific check on the consistency between adopted design criteria and prospective climatic conditions. When the process ends, if necessary, further mitigation actions are identified and implemented. The table below summarises the main risks and opportunities identified by Eni in relation to the energy transition:
| TRANSITION RISKS | OPPORTUNITIES | |
|
LOW CARBON SCENARIO |
• Uncertainty on market development for new products • Changing consumer preferences (e.g. decline in global demand for hydrocarbons) • Loss of profits and cash flow • "Stranded asset" risk • Impacts on shareholders’ returns |
• Opening up of new market opportunities for low-carbon products • Development of renewables and low carbon energy • Growing demand for hydrogen • Diversification of raw materials for biorefineries and the chemical industry and development of new products • CCS development |
|
REGULATORY AND LEGAL ISSUES |
• New regulatory requirements imposing a potential increase in operating and investment costs for traditional businesses • New regulatory requirements imposing a potential reduction in demand for hydrocarbons • Proceedings relating to climate change and greenwashing |
• Development of renewables and low carbon energy • Diversification of raw materials for biorefineries and the chemical industry and development of new products • Reassessment of assets from a circular perspective • Energy efficiency interventions with the adoption of BAT |
|
TECHNOLOGICAL DEVELOPMENTS |
• Reduction in hydrocarbon demand through technological breakthroughs • Profitability and specific risks of transition technologies |
• Development of renewables and low carbon energy • Development of new products and services through R&D and innovation • Partnerships for the development of technological solutions to cut emissions |
|
REPUTATION |
• Changing consumer preferences • Deterioration of the sector's image in the face of accusations of greenwashing • Impact on share price • Dropping attractiveness for retail savers |
• Development of renewables and low carbon energy • Positive impact on stakeholder perception (e.g. rise in share price) • Eni's distinctive positioning in climate benchmarks • Partnerships for decarbonization |
Strategy and Objectives
For “Strategy and Objectives” see paragraph above.
Performance metrics and comments
Eni has historically been committed to reducing its direct GHG emissions and was among the first in the industry to have defined, starting in 2016, a series of objectives aimed at improving GHG emissions performance from operated assets, with specific indicators that illustrate the progress achieved to date. In addition to these, in 2020 new indicators were defined, accounted for on an equity basis. These indicators refer to a distinctive GHG accounting methodology that considers all energy products managed by Eni's various businesses, including purchases from third parties, and all the emissions they generate along the entire value chain (Scope 1+2+3), according to a well-to-wheel approach.
The methodology was developed with the collaboration of independent experts. The resulting indicators are subject to third-party verification as part of Eni's GHG data verification process (see the Eni for Sustainability Performance 2022 for the auditor's report and GHG Statement).
The performance of key equity indicators is described below:
Net GHG Lifecycle Emissions: the indicator refers to all Scope 1, 2 and 3 emissions associated with Eni activities and energy products sold along their value chain, net of offsets, mainly from Natural Climate Solutions. In 2022, the indicator decreased by around 8% compared to 2021, mainly driven by the decline in upstream production and gas sales in the GGP sector.
Net Carbon Intensity: the indicator is calculated as the ratio between absolute net GHG emissions (Scope 1, 2 and 3) along the value chain of energy products and the amount of energy they contain. In 2022, it was essentially stable compared to 2021 (-0.4%); the trend is influenced on the one hand by the increase in renewable energy production (+160% vs. 2021) partly offset by the reduction in GGP's gas sales. These metrics are integrated by specific indicators to monitor operational emissions.
Net Carbon Footprint Upstream: the indicator considers Scope 1+2 emissions from all upstream assets, operated by Eni and by third parties, net of offsets mainly from Natural Climate Solutions. In 2022, the indicator decreased by around 11% compared to 2021 mainly in relation to lower upstream production and compensation through carbon credits, which amount to 3 MtCO2eq in 2022. The credits are linked to Natural Climate Solutions (NCS) projects to halt deforestation.
Net Carbon Footprint Eni: the indicator considers Scope 1+2 emissions from activities carried out by Eni and third parties, net of offsets, mainly from Natural Climate Solutions.
In 2022, the indicator decreased by around 11% mainly in relation to a decrease in emissions from the Upstream and Power businesses and compensation through carbon credits, which in 2022 amount to 3 MtCO2eq.
The indirect GHG emissions Scope 3 are accounted for in accordance with IPIECA guidelines, which require an activity-based analysis. These include GHG emissions related to the final consumption of the products sold (the so-called Scope 3, end-use category) form the largest contribution, and are calculated on the basis of upstream production in equity share. These emissions form part of the Scope 3 end-use emissions considered in the Net GHG Lifecycle Emissions and Net Carbon Intensity indicators. In particular they represent the emissions from end users from Eni's upstream supply chain. They decreased by 7% in 2022 compared to 2021 due to the reduction in hydrocarbon production sold by the upstream business. For the other Scope 3 emission categories, the trend is broadly constant over the 2016-2022 period.
With reference to operated assets, the following is a summary of the performance of the main indicators, accounted on a 100% basis according to the operatorship approach.
Overall, direct GHG Scope 1 emissions from the assets operated by Eni, in 2022 amounted to 39.4 million tons of CO2eq, a slight reduction compared to 2021, mainly due to the decrease of emissions in the upstream, power and chemicals sectors, partially compensated for by an increase in the transport and gas liquefaction sector. Indirect GHG Scope 2 Emissions decreased by about 3% in 2022 compared to 2021 due to lower consumptions in the Chemicals sector (new Porto Marghera plant configuration). These emissions are related to the purchase of energy from third parties for the consumption of the operated assets and are marginal for Eni as electricity is generated mainly through its own installations.
The energy efficiency interventions implemented in the year resulted in actual primary energy savings compared to baseline consumption of about 422 ktoe/year resulting mainly from upstream projects (about 84%), with an emission reduction benefit of about 1 million tons of CO2 eq. If Scope 2 emissions, i.e., those from power and heat purchase, are also considered, the net CO2 savings from energy-saving projects amount to about 1.1 million tons of CO2 eq.
In 2022, Eni's consumption of raw primary sources decreased also in relation lower production levels compared to 2021. The total energy consumed was 517 million GJ: upstream 226 million GJ, Power 161 million GJ, R&M 60 million GJ and Chemical 55 million GJ.
Concerning upstream operated assets, the overall reduction of the Scope 1 GHG emission intensity with respect to 2014 is around 23%, slightly behind schedule, mainly due to COVID pandemic and local factors in Libya. Flaring down and CCS projects are being sanctioned, and their impact on target achievement date will be evaluated. With respect to 2021, the index slightly increased mainly in relation to the exit of Var Energi from the operated domain. The volumes of hydrocarbons sent for routine flaring decreased by around 9% in 2022 compared to 2021, mainly due to energy efficiency and gas valorisation interventions in Egypt and Nigeria, in line with the zero routine flaring by 2025 target. Fugitive emissions are progressively decreasing thanks to monitoring and maintenance activities carried out as part of the LDAR (Leak Detection And Repair) campaigns. These are implemented periodically and in 2022 contributed to a reduction of emissions of about 50 ktCO2eq. In fact, the methane emission intensity is improving and in 2022 was 0.08%, in line with the commitment to maintain it below 0.2 % in 2025.
In 2022, the renewables business reached an installed capacity from renewable sources of 2.3 MW (doubling the result for 2021). This growth was achieved thanks to the organic development of projects in the United States (Brazoria, Texas), Spain (Cerillares) and Kazakhstan (Badamsha 2), as well as recent acquisitions in Europe (Plt Group, Fortore Energia in Italy and Cuevas in Spain) and the United States (Corazon, Texas). Renewable energy production reached 2.8 TWh (more than twice the 2021 result), thanks to the contribution of both organically developed and acquired assets in operation.
Compared to 2021, the production of biofuels has declined due to a few stops at the biorefinery in Gela; production in Venice grew. For 2022, the financial commitment of Eni in scientific research and technological development amounted to €164 million, of which €114 allocated to processes carbon footprint reduction, circular economy, renewable energy deployment. These investments are related to energy transition, bio-refinement, renewable chemicals, production from renewable sources, reduction of emissions and energy efficiency.
Climate disclosure - Transparency in climate related disclosure and the strategy implemented by the company have enabled Eni to be confirmed, once again in 2022, as a leading company in CDP Climate Change Programme. The A- rating achieved by Eni is higher than both the global average (C) and the sector rating of B2. In the same year, Carbon Tracker's3 research on Integrated Energy Companies (IEC) placed Eni first among the peers for the completeness of the GHG emissions methodology, the medium/long-term intermediate targets and the emission boundary extended to the entire company. For the second year in a row, the Net Zero Company Benchmark of the CA100+4 investor coalition reported Eni as one of the companies most aligned with the Benchmark requirements regarding GHG emission reduction targets, governance and climate disclosure. The CA100+ valuation is one of the primary references for the dialogue with investors on aspects related to climate strategy.
Commitment to partnerships - Partnerships are one of the strategic drivers of Eni's decarbonization path, as the company has long been working with the academic world, civil society, institutions and businesses to promote the energy transition, making it possible to exploit and generate knowledge, share best practices and support initiatives that can simultaneously create value for the company and its stakeholders. Within the framework of its partnerships and advocacy activities, Eni supports and shares clearly and transparently its positioning on the principles considered essential in climate protection, having published its guidelines on responsible climate change engagement within the associations to which it belongs in 20205. The alignment between Eni’s positioning and the business associations it participates in is periodically assessed through the "Assessment of industry association's climate policy positions"6. Among the many international climate initiatives Eni participates in, the Oil and Gas Climate Initiative (OGCI) plays a key role in accelerating the Oil & Gas industry's response to the challenges of climate change. Established in 2014 by five companies, including Eni, OGCI now counts twelve Oil & Gas companies, representing about one-third of the global hydrocarbon production. The CEOs of the participating companies sit on the initiative's Steering Committee.
|
Key target indicators7 |
|||||
|
|
|
2022 |
2021 |
2020 |
Target |
|
Net Carbon Footprint upstream (Scope 1+2) |
(million tonnes CO2eq) |
9.9 |
11.0 |
11.4 |
UPS Net zero @2030 |
|
Net Carbon Footprint Eni (Scope 1+2) |
29.9 |
33.6 |
33.0 |
Eni Net zero @2035 |
|
|
Net GHG Lifecycle Emissions (Scope 1+2+3) |
419 |
456 |
439 |
Net zero @2050 |
|
|
Carbon Credits |
3 |
2 |
1.5 |
<25 @2050 |
|
|
Net Carbon Intensity (Scope 1+2+3) |
(gCO2eq./MJ) |
66 |
67 |
68 |
Net zero @2050 |
|
Renewable installed capacity(a) |
MW |
2,256 |
1,188 |
351 |
15 GW @2030 |
|
Capacity of biorefineries |
(million tonnes/year) |
1.1 |
1.1 |
1.1 |
>5 million tonnes/year @2030 |
|
(a) This KPI represents Eni's share and relates primarily to Plenitude |
|||||
2 On an assessment scale from D (minimum) to A (maximum).
3 Independent financial think tank that has been conducting analyses for years to assess the impact of the energy transition on carbon intensive companies and financial markets.
4 Climate Action 100+ is the largest shareholder engagement initiative on climate change issues with about 700 investors to date.
5 Guidelines on responsible climate change engagement in trade associations can be found at Eni.com
6 Report available on eni.com
7 Indicators accounted for on an equity basis.
| 41 |
Key performance indicators
|
2022 |
2021 |
2020 |
||||||||
|
|
|
Total |
of which fully consolidated entities |
Total |
Total |
|||||
|
GHG EMISSIONS |
||||||||||
|
Direct GHG emissions (Scope 1) |
(million tonnes CO2eq) |
39.39 |
23.81 |
40.08 |
37.76 |
|||||
|
of which: CO2 equivalent from combustion and process |
29.77 |
20.51 |
30.58 |
29.70 |
||||||
|
of which: CO2 equivalent from flaring(a) |
6.71 |
2.64 |
7.14 |
6.13 |
||||||
|
of which: CO2 equivalent from venting |
2.72 |
0.55 |
2.12 |
1.64 |
||||||
|
of which: CO2 equivalent from methane fugitive emissions |
0.20 |
0.11 |
0.24 |
0.29 |
||||||
|
Carbon efficiency index (Scope 1 and 2) |
(tonnes CO2eq/kboe) |
32.67 |
49.10 |
31.95 |
31.64 |
|||||
|
Direct GHG emissions (Scope 1)/100% operated hydrocarbon gross production |
20.64 |
23.54 |
20.19 |
19.98 |
||||||
|
Direct GHG emissions (Scope 1)/Equivalent |
(gCO2eq/kWheq) |
392.9 |
393.4 |
379.6 |
391.4 |
|||||
|
Direct GHG emissions (Scope 1)/Refinery throughputs (raw and semi-finished materials) |
(tonnes CO2eq/ktonnes) |
233 |
233 |
228 |
248 |
|||||
|
Eni Direct methane emissions (Scope 1) |
(ktonnes CH4) |
49.6 |
26.4 |
54.5 |
55.9 |
|||||
|
of which: fugitive upstream |
7.2 |
3.6 |
9.2 |
11.2 |
||||||
|
Upstream methane emission intensity |
(%) |
0.08 |
n.a. |
0.09 |
0.09 |
|||||
|
Volumes of hydrocarbon sent to flaring |
(billion Sm3) |
2.1 |
n.a. |
2.2 |
1.8 |
|||||
|
of which: Upstream routine |
1.1 |
n.a. |
1.2 |
1.0 |
||||||
|
Indirect GHG emissions (Scope 2) |
(million tonnes CO2eq) |
0.79 |
0.55 |
0.81 |
0.73 |
|||||
|
Indirect GHG emissions (Scope 3) from use of sold products(b) |
164 |
n.a. |
176 |
185 |
||||||
|
ENERGY |
||||||||||
|
Electricity produced from renewable sources(c) |
(GWh) |
2,836 |
2,249 |
1,166 |
393 |
|||||
|
Primary source consumption |
(millions of GJ) |
498.2 |
359.0 |
529.1 |
515.3 |
|||||
|
of which: natural/fuel gas |
395.1 |
260.1 |
429.0 |
421.9 |
||||||
|
of which: other primary sources |
103.2 |
99.0 |
100.1 |
93.4 |
||||||
|
Primary energy purchased from other companies |
17.6 |
14.1 |
21.7 |
20.2 |
||||||
|
of which: Electricity |
15.0 |
11.6 |
18.3 |
16.9 |
||||||
|
of which: Other sources(d) |
2.6 |
2.5 |
3.4 |
3.3 |
||||||
|
Hydrogen consumption |
1.3 |
1.3 |
1.7 |
1.8 |
||||||
|
Total energy consumption |
517.1 |
374.4 |
552.5 |
537.3 |
||||||
|
Energy consumption must come from renewable sources |
5.1 |
5.1 |
1.5 |
0.9 |
||||||
|
of which: electricity from photovoltaics |
4.0 |
4.0 |
0.6 |
0.7 |
||||||
|
of which: biomass |
1.1 |
1.1 |
0.9 |
0.2 |
||||||
|
Export of electricity to other companies |
177.8 |
157.8 |
183.0 |
167.7 |
||||||
|
Export of heat and steam to other companies |
5.7 |
5.2 |
5.4 |
5.7 |
||||||
|
Energy Intensity Index (refineries) |
115.5 |
115.5 |
116.4 |
124.8 |
||||||
|
Energy consumption from production activities/ 100% operated hydrocarbon gross production (upstream) |
(GJ/toe) |
1.41 |
n.a. |
1.45 |
1.52 |
|||||
|
Net consumption of primary resources/ Equivalent electricity produced (EniPower) |
(toe/MWheq) |
0.18 |
0.18 |
0.16 |
0.17 |
|||||
|
PRODUCTION OF BIOFUELS |
||||||||||
|
Sold production of biofuels |
(ktonnes) |
428 |
428 |
585 |
622 |
|||||
|
R&D |
||||||||||
|
R&D expenditures |
(€ million) |
164 |
164 |
177 |
157 |
|||||
|
of which: related to decarbonization |
114 |
114 |
114 |
74 |
||||||
|
First patent filing applications |
(number) |
23 |
23 |
30 |
25 |
|||||
|
of which: deposits on renewable energy sources |
|
13 |
13 |
11 |
7 |
|||||
|
Unless otherwise indicated, the emission and consumption KPIs refer to 100% data of the assets operated. |
||||||||||
|
(a) From 2020, the indicator includes all Eni emissions deriving from flaring, also aggregating the contributions of Refining & Marketing and Chemicals, which until 2019 are accounted for in the combustion and process category. |
||||||||||
|
(b) Category 11 of GHG Protocol - Corporate Value Chain (Scope 3) Standard. Estimates based on upstream (Eni's share) production sold in line with IPIECA methodologies. |
||||||||||
|
(c) In line with the company's strategic objectives, this indicator is reported on an equity basis. This KPI represents Eni's share and relates primarily to Plenitude. |
||||||||||
|
(d) This includes steam, heat and hydrogen. |
Significant business and portfolio developments
- March 2023 - Exploration activities yielded positive results with the Yatzil discovery in the Block 7 off Mexico (Eni operator with a 45% interest).
- March 2023 - Eni signs a new collaboration agreement with the Commonwealth Fusion Systems (CFS) to accelerate the industrialization of magnetic fusion energy.
- March 2023 – Eni has completed the installation of the world's first ISWEC (Inertial Sea Wave Energy Converter) which will convert energy from sea waves to supply renewable electricity.
- March 2023 – Eni signed a strategic agreement with ADNOC to explore potential opportunities in the areas of renewable energy, blue and green hydrogen, carbon dioxide capture and storage (CCS), in the reduction of GHG and methane gas emissions, energy efficiency, routine gas flaring reduction and the Global Methane Pledge, to support global energy security and a sustainable energy transition.
- February 2023 - Eni Sustainable Mobility signed a Memorandum of Understanding (MoU) with Saipem with the aim of boosting biofuels on Saipem’s drilling and construction naval vessels, with particular attention to operations in the Mediterranean Sea. This agreement represents an important milestone for Eni and Saipem, confirming the mutual commitment to diversifying energy sources and to reducing the carbon footprint across offshore operations.
- February 2023 - Eni Sustainable Mobility entered into definitive agreements with PBF to partner in a 50-50 joint venture, St. Bernard Renewables LLC (SBR), for the biorefinery currently under construction in Louisiana (US). The deal, which is subject to customary closing conditions, foresees Eni’s subsidiary Eni Sustainable Mobility to make a capital contribution of $835 million and to provide expertise in biorefining operations. The biorefinery startup is expected in the first half of 2023, with a target processing capacity of about 1.1 mln tonnes/year of raw materials to produce mainly HVO Diesel.
- January 2023 - Plenitude started production at the 263 MW “Golden Buckle Solar Project” in Brazoria County, Texas.
- January 2023 - The 30% interest in offshore exploration Blocks 4 and 9, in Lebanon, operated by TotalEnergies, was farmed out to QatarEnergy. Eni will retain a 35% interest in the venture.
- January 2023 – Eni signed an agreement with the National Oil Corporation of Libya (NOC) for the development of the large gas reserves of A&E Structures, offshore Tripoli. Production is expected to start in 2026 to reach a plateau of 750 mmscf/d, with volumes destined both to the domestic market and to Europe via the existing Greenstream offshore pipeline leveraging synergies with the Mellitah Complex. The project comprises construction of an onshore Carbon Capture and Storage (CCS) hub.
- January 2023 - Eni and and Sonatrach have signed strategic agreements to accelerate emissions reduction and strengthen energy security. Through these agreements will identify opportunities for the reduction of GHG and methane gas emissions and will define energy efficiency initiatives, renewable energy developments, green hydrogen projects and carbon dioxide capture and storage projects, to support energy security and a sustainable energy transition. In addition, studies will conduct to identify possible measures to improve Algeria's energy export capacity to Europe.
- January 2023 - Plenitude signed an agreement with Simply Blue Group for the joint development of a pipeline of new floating offshore wind projects in Italy. The first two projects, "Messapia" in Apulia and "Krimisa" in Calabria, have already been submitted to the relevant authorities. The Messapia project, located about 30 km off the Otranto coast, will have a total capacity of 1.3 GW and will be able to provide annual power generation of about 3.8 TWh. The Krimisa project, located about 45 km off the coast of Crotone, will have a total capacity of 1.1 GW and will be able to provide annual energy production of up to 3.5 TWh.
- January 2023 - Announced a new gas discovery at the Nargis-1 exploration well located in Nargis Offshore Area Concession, in the Eastern Mediterranean Sea, offshore Egypt. This concession total acreage is 1,800 square kilometers. Eni with 45% interest, Chevron Holdings C Pte. Ltd. operator with a 45% interest, Tharwa Petroleum Company’s interest 10%.
- January 2023 - Vår Energi has been awarded 12 new licenses of which 5 as operator and 7 as a partner, as a result of the “Awards in Predefined Areas 2022” (APA) by the Ministry of Petroleum and Energy of Norway. The licenses are distributed over the three main oil and gas provinces in the Norwegian Continental Shelf: North Sea; Norwegian Sea; Barents Sea.
- January 2023 - Finalized Snam’s acquisition of a 49.9% of the equity interest directly and indirectly held by Eni in the companies operating two groups of international gas pipelines connecting Algeria to Italy. More specifically, the onshore gas pipelines running from the Algeria and Tunisia borders to the Tunisian coast (TTPC), and the offshore gas pipelines connecting the Tunisian coast to Italy (TMPC). These ownership interests were transferred by Eni to SeaCorridor Srl, of which Snam has acquired 49.9% of the share capital, while the remaining 50.1% continues to be held by Eni. Eni and Snam will exercise joint control of SeaCorridor under joint governance arrangements.
- January 2023 - Announced the incorporation of Eni Sustainable Mobility, the new company dedicated to sustainable mobility. The company is vertically integrated along the entire value chain, bringing together services and products that support the energy transition. Eni Sustainable Mobility will develop bio-refining, biomethane and the sale of mobility products and services in Italy and abroad, on a path that will enable the company to evolve into a multi-service, multi-energy company.
- December 2022 - Plenitude, through its US subsidiary Eni New Energy US Inc., has signed an agreement for the acquisition of the 81 MW Kellam photovoltaic plant located in North Texas, with closing in January 2023. The plant, sold by Hanwha Qcells USA Corp., joins the other assets within Texas and the rest of the United States in Plenitude's portfolio, which reaches, with this transaction, an installed capacity of 878 MW in the U.S. market.
- December 2022 - Vår Energi announced a new gas discovery in the Barents Sea, Norway. The 7122/9-1 T2 well (Lupa) is the first exploration well drilled in the license PL229E. Vår Energi holds a 50% stake in the PL229E license, with partner Aker BP (50%).
- December 2022 - Eni signed a contract with Wison Heavy Industry for the construction and installation of a Floating Liquefied Natural Gas (FLNG) unit with a capacity of 2.4 mmtonnes/y in order to increase LNG production and export from the Republic of Congo. The vessel will be anchored at a water-depth of around 40 metres and will be able to store over 180 kcm of LNG and 45 kcm of LPG. This facility represents the second FLNG deployed in the Republic of Congo (the first was Tango FLNG).
- December 2022 - Eni signed an agreement with DHL Express Italy and SEA Group, which manages Milan Malpensa and Milan Linate airports, to test Eni Biojet, a Sustainable Aviation Fuel (SAF) 20% blended with JetA1 and produced exclusively from waste raw materials, animal fat and used vegetable oils. By the end of 2022, 28 flights departing from Malpensa will be powered also by SAF produced by Eni at Livorno refinery in partnership with Eni's bio-refinery in Gela.
- December 2022 - Eni announced a new gas discovery offshore Cyprus with the well Zeus-1, drilled in Block 6, 162 km off the coastline in 2,300 meters of water depth. The Block is operated by Eni Cyprus, holding 50% interest, with TotalEnergies as partner. Zeus-1 is the third consecutive discovery in Block 6 and follows Cronos-1 and Calypso-1.
- December 2022 - Eni signed an agreement with Snam to jointly develop and manage Phase 1 of the Ravenna Carbon Capture and Storage (CCS) Project, through an equal joint venture. The agreement also includes the implementation of studies and preparatory activities for the subsequent development phases. Phase 1 of the Ravenna CCS Project covers the capture of 25 ktons of CO2 emitted from Eni's natural gas treatment plant in Casalborsetti (Ravenna). The CO2 captured will be piped to the Porto Corsini Mare Ovest platform and injected into the homonymous depleted gas field in Ravenna’s offshore.
- December 2022 - Versalis acquired from DSM, a global company focused on Health, Nutrition & Bioscience, the technology to produce enzymes for second-generation ethanol. This strategic agreement integrates the proprietary Proesa® technology, applied at the Crescentino plant for the production of sustainable bioethanol and chemical products from lignocellulosic biomass, improving the competitiveness of technology and production.
- December 2022 - Eni, Euglena and Petronas announced the possibility of developing and operating a biorefinery in Malaysia, in the Pengerang Integrated Complex (PIC), one of the largest integrated refinery and petrochemical developments in Southeast Asia. The three parties are currently carrying out technical and economic feasibility assessments for the proposed project, with the investment decision expected to be reached by 2023 and the plant completed by 2025.
- December 2022 - Started the production at the photovoltaic plant in Tataouine, southern Tunisia, following the connection to the national grid. The plant, with an installed capacity of 10 MW, will supply over 20 GWh of power per year to the national grid, ensuring savings of around 211 ktons of CO2 equivalent over its lifetime. The electricity produced will be supplied to STEG (Société Tunisienne de l'Electricité et du Gaz) as agreed through a 20-year Power Purchase Agreement.
- December 2022 - Plenitude acquired 100% of PLT (PLT Energia Srl and SEF Srl and their respective subsidiaries and affiliates), an integrated Italian group engaged in producing electricity from renewables and supplying energy to retail customers. The acquired company includes 90,000 customers in Italy and 1.6 GW of renewable capacity.
- November 2022 - Enjoy, Eni's car sharing service, expanded its activity in Milan, with the addition, by the end of December of 200 the XEV YOYO battery swapping city cars to its fleet. In 2022, the XEV YOYO city cars were also introduced in the city of Turin (on May), Bologna (on September), and Florence (on October).
- November 2022 -Eni signed a collaboration agreement with Bonifiche Ferraresi to evaluate the development of crops for energy use in Italy, recovering degraded, abandoned or polluted land, not in competition with the food chain. The agreement has a first study-phase, to evaluate the sustainability and competitiveness of an agro-industrial chain to be jointly developed aiming at recovering the marginal areas identified in the Country through the development of sustainable agronomic practices.
- November 2022 - Eni signed four agreements with the Government of Rwanda to develop innovative joint initiatives in agriculture, protection of unique forest ecosystems, technology and health. The initiatives are part of Eni's just transition strategy to support the decarbonisation of African countries.
- November 2022 - Eni signed a protocol with Inail on research, innovation and safety in the workplace. The five-year agreement, in line with the expiry of the PNRR (Piano Nazionale di Ripresa e Resilienza) in 2026, will involve joint initiatives to test high-tech value solutions and to spread prevention culture across the energy supply chain, involving trade unions in the process.
- November 2022 - Eni UK announced the launch of the Bacton Thames Net Zero (BTNZ) Cooperation Agreement with the shared aim of decarbonising industrial processes in the South-East of England and the Thames Estuary area, near London, by means of capturing and storing carbon dioxide. The initiative will decarbonise a number of sectors including power generation and waste disposal.
- November 2022 – Eni signed an agreement with Autostrade per l'Italia and CDP to develop joint initiatives for the energy transition. The agreement on sustainable mobility has the specific target of decarbonizing Italy’s motorway network. It includes the development of new energy carriers for both lorries and cars, starting with biofuel from sustainable raw materials and not in competition with the food chain, hydrogen, biomethane and charging points for electric cars. The agreement also includes the development of renewable energy plants by installing photovoltaic farms in areas owned by Autostrade per l'Italia or near the motorway network.
- November 2022 - Inaugurated with Sonatrach the research laboratory, Solar Lab, and laid the first stone of a 10 MW photovoltaic plant in the Bir Rebaa North (BRN) production complex, in the Berkine basin, south-eastern Algeria.
- November 2022 - Eni established a collaboration with PASQAL, leader in neutral atoms quantum computing, to develop next-generation HPC (high performance computing) solutions for the energy sector through quantum computing. Quantum technology allows to solve problems too complex for classical computer and its application to the energy sector could further accelerate the energy transition.
- November 2022 - Eni, as Delegated Operator of the Coral South project on behalf of its Area 4 Partners announced that the first shipment of liquefied natural gas (LNG) produced from the Coral gas field, in the ultra-deep waters of the Rovuma Basin, has departed from Coral Sul Floating Liquefied Natural Gas (FLNG) facility.
- November 2022 - Eni and Leonardo signed an agreement for the development of joint sustainability and innovation initiatives, with the aim of boosting the energy transition and decarbonising their operations. The collaboration will be developed within a circular economy framework to promote and accelerate the energy transition and decarbonisation of the aerospace sector, the production and use of energy from renewable sources, the energy efficiency of buildings and production plants, the recycling of materials and the re-use of waste.
- November 2022 - Eni announced the start-up of the HDLE/HDLS oil field, in Zemlet el Arbi concession in the Berkine North Basin, onshore Algeria, only six months after its discovery in March. HDLE/HDLS is currently producing 10,000 barrels of oil per day (bod). Production ramp up will be achieved through an accelerated development plan which envisages the drilling of new wells in 2023.
- October 2022 - Eni and the University of Pisa signed a joint research agreement (JRA) that will consolidate their partnership and extend their collaboration to other topics of common interest, in which the University of Pisa has recognised excellence. These include metallurgy, new applications of ionic liquids, aerial and submarine robotics, biofuels, information technology and new additives for lubricants.
- October 2022 - Completed the phase-out of palm oil as feedstock supply for Eni’s biorefineries, fully replaced with sustainable raw materials.
- October 2022 - Launched a feasibility study on a biorefinery to be built in Livorno. The project contemplates three plants for the manufacturing of hydrogenated biofuels: a biogenic feedstock pre-treatment unit, a 500,000 ton/year Ecofining™ plant and a plant for the production of hydrogen from methane gas.
- October 2022 - Two projects by Eni and Enel Green Power to develop green hydrogen were appointed as beneficiaries of public funding approved under IPCEI Hy2Use, a project of common European interest aimed at supporting research, innovation, and construction of related infrastructure along the hydrogen value chain. South Italy Green Hydrogen, the joint venture set up to move forward with the development of the projects, will be the beneficiary of the funding. One of the projects will be implemented at the biorefinery in Gela, Sicily, where a 20 MW electrolyzer will be installed. The other will be near Eni’s refinery in Taranto, in the Apulia region, with a 10 MW electrolyzer. Both will use PEM (polymer electrolyte membrane) technology.
- October 2022 - A first cargo of vegetable oil, produced at Eni’s Makueni agri-hub in Kenya, to be used as feedstock for biofuels has been shipped to Gela’s biorefinery. The vegetable oil is obtained processing castor, croton, and cotton seeds. This project marks the start of Eni’s innovative model of agri-business vertically integrated with its biorefineries, supplying sustainable feedstock not competing with the food supply chain and capable of making a significant contribution to local development and the circular economy. This model will be replicated in other African countries, long-term partners of Eni.
- October 2022 - As part of its plan to strengthen and diversify gas supplies to Italy, Eni has begun providing additional volumes of liquefied natural gas to the regasification terminal of Panigaglia (La Spezia) ahead of the 2022-2023 winter. The first cargo arrived from Angola, reloaded on smaller ships at Spanish terminals for them to be compatible with the terminal in Liguria.
- October 2022 - Started production at two gas fields within the new Berkine South contract in Algeria, just six months after the contract was awarded, through an accelerated development.
- October 2022 - Plenitude inaugurated the 104.5 MW El Monte wind farm, located in the Spanish region Castilla La Mancha, built in collaboration with the strategic partner Azora Capital. The plant will produce about 300 GWh/year, equivalent to the domestic consumption of 100,000 households.
- September 2022 - The European Climate, Infrastructure and Environment Executive Agency (CINEA) has selected a project of Be Charge, the Plenitude integrated operator for electric mobility, to build one of the largest high-speed charging networks in Europe for EVs along key European transport corridors (TEN-T) and at parking areas and in major cities by 2025.
- September 2022 - Plenitude entered a new partnership with Infrastrutture SpA to develop solar and wind power projects in Italy and Spain by acquiring a 65% stake in Hergo Renewables SpA, a company that holds a portfolio of projects in the two countries with a total capacity of approximately 1.5 GW.
- September 2022 - Eni UK applied for carbon storage license for the Hewett depleted field in the UK Southern North Sea, for the development of a CCS project aimed at decarbonising the Bacton and Thames Estuary area. To support this application, Eni UK announces the set-up of the Bacton Thames Net Zero initiative with the aim to decarbonise and to unlock new greener growth opportunities for energy-intensive industrial businesses in the South-East of UK, supporting the country’s decarbonisation strategy.
- September 2022 - Opportunities have been evaluated with ADNOC to increase natural gas production accelerating the time-to-market of large gas projects like the Ghasha project. Fast-track development options were considered for the recent significant gas discovery offshore Abu Dhabi, in the Block 2 (Eni’s interest 70%).
- September 2022 - Eni launched an important cooperation project with Automobile Club d’Italia (ACI), an institutional reference point for motorists and the Italian Motor Sports Federation in order to speed up the widespread use of products, services and solutions for sustainable mobility and the energy transition. ACI’s widespread presence on the Italian territory will be combined with technologies and businesses from all Eni companies.
- September 2022 - Eni signed a preliminary agreement to purchase bp’s assets in Algeria including the two gas-producing concessions “In Amenas” and “In Salah” (Eni’s interest 45.89% and 33.15%, respectively). The deal will enhance Eni’s position in the natural gas business, contributing to cover Europe’s energy needs. The closing for the acquisition of the assets was achieved in February 2023.
- August 2022 - Eni announced the Cronos-1 well discovery, in Block 6, 160 km off Cyprus coastline, in 2,287 metres of water depth. The Block is operated by Eni Cyprus holding 50% interest with TotalEnergies as partner.
- August 2022 – Eni acquired the Tango FLNG floating liquefaction vessel, which will be deployed at the natural gas development project in the Marine XII block, Republic of Congo, in line with Eni's strategy to leverage gas equity resources. The vessel has production capacity of approximately 0.6 million tons/year of LNG (about 1 billion standard cubic meters/year).
- August 2022 - Azule Energy, the equally-owned joint venture between bp and Eni started operations. Azule Energy combines both companies’ Angolan upstream, LNG and solar businesses and is Angola’s largest independent oil and gas producer. Azule is a further example of Eni’s distinctive satellite model designed to unlock value.
- August 2022 - Eni announced the establishment of Eniverse Ventures (Eniverse), a 100% Eni Corporate Venture Building dedicated to the identification, creation and development of innovative and high-potential entrepreneurial initiatives that explore new markets while promoting a just transition and creating short and medium-term value.
- July 2022 - Eni announced a significant gas discovery of 1-1.5 trillion cubic feet (TCF) of raw gas in place, in a deeper zone, in its first exploration well drilled in Offshore Block 2 Abu Dhabi, United Arab Emirates (UAE). The gas-bearing reservoirs were tested with excellent flow rates and fast-track development options are currently under evaluation. Eni has a 70% stake and is Operator of Block 2, with partner PTTEP that holds the remaining 30%.
- July 2022 - Appraisal of the Baleine discovery in the Ivory Coast with the well Baleine East-1X in Block CI-802. The well has been successfully tested, allowing the optimization of ongoing and future development plans.
- July 2022 - Reached the final investment decision (FID) by New Gas Consortium (Eni 25.6%, operator) for the development of the Quiluma and Maboqueiro fields in Angola. The project, the first non-associated gas development in the country, is planned to start-up in 2026.
- July 2022 - Eni and SONATRACH announced a further discovery in Sif Fatima II concession, located in the Berkine North Basin in the Algerian desert. The Rhourde Oulad Djemaa Ouest-1 (RODW-1) exploration well, in the Sif Fatima II research perimeter, is the third well in the exploration drilling campaign.
- July 2022 – Eni signed with Sonatrach, Oxy and TotalEnergies a new Production Sharing Contract (PSC) for blocks 404 and 208 located in the Berkine basin in Algeria. This will allow to boost investments, increasing the fields’ reserves while enabling future valorization of associated gas, available for export, further contributing to the diversification of gas supplies to Europe.
- July 2022 - Completed the construction of an oilseed collection and pressing plant (agri-hub) in Makueni, Kenya and started the production of the first vegetable oil for bio-refineries. The first agri-hub will have an installed capacity of 15,000 tons with an expected production of 2,500 tons in 2022.
- July 2022 - Versalis, Eni's chemical company, agreed terms with Forever Plast to acquire a license to build a mechanical recycling unit for post-consumer plastics from waste, capable of manufacturing 50 ktonnes/year of recycled polymer compounds. The expected start-up is in 2024 and the plant will be located in Porto Marghera contributing to the progressive transformation of industrial hub.
- June 2022 - Plenitude and HitecVision reached a deal to boost the joint venture Vårgrønn in Norway to become a material full cycle offshore wind player. In October 2022, Plenitude contributed to the venture a 20% interest in the Dogger Bank offshore wind project in the UK, with HitecVision increasing its ownership share from 30.4% to 35% through a cash injection.
- June 2022 - Eni entered in the Qatar’s North Field East project, the world’s largest LNG project, expanding its presence in the Middle East and gaining access to a leading LNG producer country
- June 2022 - Started the commissioning of the Coral Sul Floating Liquefied Natural Gas (FLNG) vessel, offshore Mozambique, by safely achieving the introduction of natural gas from the Coral South reservoir into the treatment plant.
- June 2022 - Eni strengthened the collaboration with the United Nations Industrial Development Organization (UNIDO) to pursue joint initiatives in the fields of green hydrogen, renewables, energy efficiency, technical education, youth employment and the agricultural value chain, particularly in Africa, as part of Eni’s commitment to develop the UN’s SDG.
- June 2022 - Versalis started recycling plastics from used industrial packaging. The project has successfully tested sacks made at 50% with recycled materials for the packaging and shipping of polyethylene products. The new product will be deployed at all Versalis industrial hubs.
- June 2022 - The first Eni-branded hydrogen refuelling station was inaugurated in Venice Mestre. The station is equipped with two dispensing points with a capacity of over 100 kg/day, where vehicles or buses could be filled in about 5 minutes.
- June 2022 - Eni announces secondary placement of 5.0% of existing share capital in Vår Energi ASA was successfully completed by Eni and HitecVision (selling 1.2% and 3.8% respectively) at NOK 40.2 per share, totaling USD 530 Million of proceeds. As a result, the free float will increase from 11.2% to approximately 16.2%. The sale takes place through an accelerated book building process
- May 2022 – Eni signed an agreement with Ansaldo Energia to evaluate technologies for storing electricity, as an alternative to electrochemical batteries. Those technologies will be implemented in synergy at Eni’s industrial hubs in Italy, leveraging existing power generation and consumption systems
- May 2022 – Eni and XEV signed a cooperation agreement to explore areas of collaboration concerning research and development into sustainable mobility systems to reduce the environmental impact of vehicles, the development of battery swapping technology and the assembly of the car manufacturer's vehicles.
- May 2022 – Eni signed with Sonatrach a MoU to evaluate viability of a green hydrogen project at the Bir Rebaa North concession, to enable decarbonizing the operations of the gas complex.
- May 2022 - Eni, CNH Industrial and Iveco Group have signed a memorandum of understanding for potential joint social development initiatives in countries of common interest in the areas of agriculture, sustainable mobility and education, contributing in their respective industries.
- May 2022 - Solenova, a venture equally owned by Eni and the Angolan national oil company Sonangol, commenced construction of the Country’s first photovoltaic project in Caraculo, with a targeted generation capacity of 50 MW, being the first phase of 25 MW.
- April 2022 – Eni signed a cooperation agreement with Iveco to develop a sustainable mobility platform for commercial fleets by offering innovative vehicles powered by biofuels and other sustainable energy vectors, as well as the related supply infrastructure.
- April 2022 - Plenitude announced an investment in EnerOcean S.L., a Spanish developer of the W2Power technology for floating wind power. The agreement is structured as a long-term partnership focused on the deployment of the W2Power technology as a lead solution for floating wind power developments worldwide. Plenitude will contribute with capital and expertise to the EnerOcean development program leveraging on its 25% equity share in EnerOcean S.L., which will continue to operate independently.
- April 2022 - Eni signed a letter of intent with the petroleum authorities of the Republic of Congo, to increase gas production and export to Italy through the development of a Liquefied Natural Gas (LNG) project with start-up expected in 2023 and a capacity of approximately 160 BCF/y in 2025. LNG exports will allow to valorize the production of gas that exceeds Congo’s internal market needs.
- April 2022 - Near-field oil and gas discoveries were made in the Meleiha concessions, in Egypt’s Western Desert, which have already been tied into production, in line with the near-field exploration strategy, allowing to maximize exploration opportunities nearby existing infrastructures.
- April 2022 - Eni signed an agreement with the Egyptian state-owned company “EGAS” to valorize local gas reserves by increasing activities in jointly operated concessions and by exploring near field areas, with the goal of boosting production and gas exports to Italy via the Damietta liquefaction plant to a level of approximately 3 billion cubic meters in the coming years.
- April 2022 – Signed an agreement with Sonatrach to gradually increase the volumes of gas exported to Italy through the Transmed pipeline as part of the existing long-term supply contracts, with additional gas deliveries rising to up to 9 billion cubic meters per year in 2024. Additional gas reserves will be jointly developed by Eni and Sonatrach leveraging Eni’s distinctive fast track model, to support export flows to Italy.
- April 2022 – Eni signed an agreement with the Chinese Shandong Eco Chemical Co. Ltd. to license Versalis proprietary continuous mass technology to manufacture styrenic polymers with a low-carbon footprint.
- April 2022 - Eni and the Government of Rwanda signed a Memorandum of Understanding (MoU) to identify collaborative opportunities in the areas of circular economy, agriculture, forestry, innovation and digital information technology.
- April 2022 - GreenIT, a joint venture between Plenitude and the Italian agency CDP Equity, engaged in the development of electricity generation capacity from renewable sources, signed an agreement with the equity fund Copenhagen Infrastructure Partners (CIP) to build and operate two floating offshore wind farms in Sicily and Sardinia, with an expected total capacity of approximately 750 MW.
For significant business and portfolio developments occurred from January 2022 to the beginning of March 2022 see also the Annual Report on Form 20-F 2021 filed to SEC on April 8, 2022.
Eni’s Exploration & Production segment engages in oil and natural gas exploration and field development and production, as well as in LNG operations, in 37 countries, most notably Italy, Libya, Egypt, Norway, the United Kingdom, Angola, Congo, Nigeria, Mexico, the United States, Kazakhstan, Algeria, Iraq, Indonesia, Ghana, Mozambique, Qatar, Ivory Coast and the United Arab Emirates. In 2022, Eni average daily production amounted to 1,487 KBOE/d on an available-for-sale basis. As of December 31, 2022, Eni’s total proved reserves amounted to 6,614 mmBOE; proved reserves of subsidiaries totaled 4,933 mmBOE; Eni’s share of reserves of equity-accounted entities was 1,681 mmBOE. Profit per barrel of oil equivalent8 was 21.07 $/bbl (compared to 13.66 $/bbl in 2021 and -4.33 $/bbl in 2020).
In 2022, as part of the stated company’ strategy to reduce 65% of net carbon footprint in upstream Scope 1 & 2 by 2025 versus 2018 with the goal to reach net zero by 2030, Eni’s Natural Resources General Directorate progressed emission efficiency measures to its Exploration & Production assets and started up several initiatives to bring at industrial scale emission reduction solutions and circular economy projects, namely: (i) carbon capture storage projects will contribute to cut Company Scope 1 emissions and also provide a solution for third party emitters beyond the energy sector, in particular hard to abate industrial players. Eni has industrial scale projects with well-defined economics under development, based on the repurposing of depleted reservoirs and conversion of part of the existing infrastructures. One of the most advanced, Hynet North-West, located in the area of Liverpool Bay, is on track to start-up in 2025. In Italy, Ravenna CCS Phase 1 project took FID in December 2022 and will start-up in early 2024. We are also advancing a second UK project, using our depleted Hewett field aimed at decarbonising the Bacton and Thames Estuary areas. In September 2022 we applied for a carbon storage appraisal license for the Hewett field; the award of the licence is expected in April 2023 and the start-up by 2027. We are pursuing other CCS opportunities also in North Africa and in the Middle East; (ii) we launched agri-feedstock projects through a vertical integration model in several countries (for example Kenya, Congo, Ivory Coast, Mozambique, Kazakhstan, Angola and Italy) to develop the agri-feedstock value chain from cultivation and agro-industrial waste and residues collection, to supply of certified vegetable oil for our bio-refineries in Italy. This model allows to securitize supply and to contribute to local development, without competing with food production. In October 2022, the first cargo of vegetable oil from Eni’s Makueni agri-hub in Kenya reached our biorefinery of Gela (Sicily Region). Production from Congo, Mozambique and Ivory Coast is expected to start up in 2023; and (iii) initiatives of both nature and technology-based carbon offset, mainly in developing Countries, like for example the REDD+ projects for forest conservation and rehabilitation in Zambia, Malawi, Tanzania and Mexico and the distribution of Improved Cookstoves for the promotion of Clean Cooking in Ivory Coast.
“Eni’s strategy and short-to-medium term targets in its Exploration & Production segment are disclosed in Item 5 – Business trends and Management’s expectations of operations.”
Disclosure of reserves
Overview
The Company has adopted comprehensive classification criteria for the estimate of proved, proved developed and proved undeveloped oil&gas reserves in accordance with applicable U.S. Securities and Exchange Commission (SEC) regulations, as provided for in Regulation S-X, Rule 4-10. Proved oil&gas reserves are those quantities of liquids (including condensates and natural gas liquids) and natural gas which, by analysis of geoscience and engineering data, can be estimated with reasonable certainty to be economically producible from a given date forward, from known reservoirs, under existing economic conditions, operating methods, and government regulations prior to the time at which contracts providing the right to operate expire, unless evidence indicates that renewal is reasonably certain.
Oil and natural gas prices used in the estimate of proved reserves are obtained from the official survey published by Platt’s Marketwire, except when their calculation derives from existing contractual conditions. Prices are calculated as the unweighted arithmetic average of the first-day-of- the-month price for each month within the 12-month period prior to the end of the reporting period. Prices include consideration of changes in existing prices provided only by contractual arrangements.
Engineering estimates of the Company’s oil&gas reserves are inherently uncertain. Although authoritative guidelines exist regarding engineering criteria that have to be met before estimated oil&gas reserves can be designated as “proved”, the accuracy of any reserves estimate is a function of the quality of available data and engineering and geological interpretation and evaluation. Consequently, the estimated proved reserves of oil and natural gas may be subject to future revision and upward and downward revisions may be made to the initial booking of reserves due to analysis of new information.
Proved reserves to which Eni is entitled under concession contracts are determined by applying Eni’s equity interest to total proved reserves of the contractual area, until expiration of the relevant mineral right. Eni’s proved reserves entitlements at PSAs are calculated so that the sale of production entitlements cover expenses incurred by the Group for field development (Cost Oil) and recognize a share of profit set contractually (Profit Oil). A similar scheme applies to service contracts.
Reserves governance
Eni retains rigorous control over the process of booking proved reserves, through a centralized model of reserves governance. The Reserves Department of the Exploration & Production segment is in charge of: (i) ensuring the periodic certification process of proved reserves; (ii) updating the Company’s guidelines on reserves evaluation and classification and the internal procedures; and (iii) providing training of staff involved in the process of reserves estimation.
Company guidelines have been reviewed by DeGolyer and MacNaughton (D&M), an independent petroleum engineering company, which stated that those guidelines comply with the SEC rules9. D&M has also stated that the Company guidelines provide reasonable interpretation of facts and circumstances in line with generally accepted practices in the industry whenever SEC rules may be less precise. When participating in exploration and production activities operated by other entities, Eni estimates its share of proved reserves on the basis of the above guidelines.
The process for estimating reserves, as described in the internal procedure, involves the following roles and responsibilities: (i) the business unit managers (geographic units) and Local Reserves Evaluators (LRE) are in charge with estimating and classifying gross reserves including assessing production profiles, capital expenditure, operating expenses and costs related to asset retirement obligations; (ii) the petroleum engineering department and the operations unit at the head office verify the production profiles of such properties where significant changes have occurred and operating expenses, respectively; (iii) geographic area managers verify the commercial conditions and the progress of the projects; (iv) the Planning and Control Department provides the economic evaluation of reserves; and (v) the Reserves Department, through the Headquarter Reserves Evaluators (HRE), provides independent reviews of fairness and correctness of classifications carried out by the above-mentioned units and aggregates worldwide reserves data.
The head of the Reserves Department attended the La Sapienza University of Rome and received a degree in Environmental Engineering and received a Master’s in petroleum engineering from Imperial College of London.
He has 20 years of experience in evaluating reserves.
Staff involved in the reserves evaluation process fulfils the professional qualifications requested by the role and complies with the required level of independence, objectivity and confidentiality in accordance with professional ethics. Reserves Evaluators qualifications comply with international standards defined by the Society of Petroleum Engineers.
9 See “Item 19 – Exhibits” in the Annual Report on Form 20-F 2009.
Reserves independent evaluation
Eni has its proved reserves audited on a rotational basis by independent oil engineering companies10. The description of qualifications of the persons primarily responsible for the reserves audit is included in the third-party audit report11. In the preparation of their reports, independent evaluators rely upon information furnished by Eni, without independent verification, with respect to property interests, production, current costs of operations and development, sales agreements, prices and other factual information and data that were accepted as represented by the independent evaluators. These data, equally used by Eni in its internal process, include logs, directional surveys, core and PVT (Pressure Volume Temperature) analysis, maps, oil/gas/water production/injection data of wells, reservoir studies, technical analysis relevant to field performance, development plans, future capital and operating costs.
In order to calculate the net present value of Eni’s equity reserves, actual prices applicable to hydrocarbon sales, price adjustments required by applicable contractual arrangements and other pertinent information are provided by Eni to third-party evaluators. In 2022, Ryder Scott Company and Sproule provided an independent evaluation of approximately 27% of Eni’s total proved reserves at December 31, 202212, confirming, as in previous years, the reasonableness of Eni internal evaluation13.
In the 2020-2022 three-year period, 90% of Eni total proved reserves were subject to an independent evaluation. As at December 31, 2022, the Nené and Litchendjili fields in Congo were the main Eni assets, which did not undergo an independent evaluation in the last three years.
10 For the past three years we have availed ourselves of the independent certification service of DeGolyer and Mac Naughton, Ryder Scott, Societè Generale de Surveillance and Sproule.
11 See “Item 19 – Exhibits”.
12 Includes Eni’s share of proved reserves of equity-accounted entities.
13 See “Item 19 – Exhibits”.
Summary of proved oil and gas reserves
The tables below provide a summary of proved oil and gas reserves of the Group companies and its equity-accounted entities by geographic area for the three years ended December 31, 2022, 2021 and 2020.
|
HYDROCARBONS (mmBOE) |
Italy |
Rest of Europe |
North Africa |
Egypt |
Sub-Saharan Africa |
Kazakhstan |
Rest of Asia |
Americas |
Australia and Oceania |
Total reserves |
||||||||||
|
Consolidated subsidiaries |
|
|
|
|
|
|
|
|
|
|
||||||||||
|
Dec. 31, 2022(a) |
352 |
78 |
806 |
904 |
813 |
941 |
675 |
285 |
79 |
4,933 |
||||||||||
|
developed |
271 |
73 |
329 |
655 |
460 |
881 |
383 |
207 |
43 |
3,302 |
||||||||||
|
undeveloped |
81 |
5 |
477 |
249 |
353 |
60 |
292 |
78 |
36 |
1,631 |
||||||||||
|
Dec. 31, 2021 |
369 |
81 |
820 |
992 |
1,145 |
1,032 |
762 |
288 |
82 |
5,571 |
||||||||||
|
developed |
283 |
80 |
373 |
852 |
766 |
963 |
445 |
203 |
51 |
4,016 |
||||||||||
|
undeveloped |
86 |
1 |
447 |
140 |
379 |
69 |
317 |
85 |
31 |
1,555 |
||||||||||
|
Dec. 31, 2020(b) |
243 |
73 |
798 |
1,110 |
1,352 |
1,182 |
879 |
256 |
91 |
5,984 |
||||||||||
|
developed |
199 |
68 |
434 |
1,022 |
799 |
1,093 |
424 |
162 |
60 |
4,261 |
||||||||||
|
undeveloped |
44 |
5 |
364 |
88 |
553 |
89 |
455 |
94 |
31 |
1,723 |
||||||||||
|
Equity-accounted entities |
|
|
|
|
|
|
|
|
|
|
||||||||||
|
Dec. 31, 2022(a)(c) |
473 |
9 |
|
531 |
|
383 |
285 |
|
1,681 |
|||||||||||
|
developed |
257 |
9 |
|
338 |
|
285 |
|
889 |
||||||||||||
|
undeveloped |
216 |
|
193 |
|
383 |
|
|
792 |
||||||||||||
|
Dec. 31, 2021(d) |
502 |
10 |
|
263 |
|
282 |
|
1,057 |
||||||||||||
|
developed |
261 |
10 |
|
39 |
|
282 |
|
592 |
||||||||||||
|
undeveloped |
241 |
|
224 |
|
|
|
465 |
|||||||||||||
|
Dec. 31, 2020(b) |
496 |
14 |
|
87 |
|
324 |
|
921 |
||||||||||||
|
developed |
254 |
14 |
|
47 |
|
324 |
|
639 |
||||||||||||
|
undeveloped |
242 |
|
40 |
|
|
|
282 |
|||||||||||||
|
Consolidated subsidiaries and equity accounted entities |
|
|
|
|
|
|
|
|
|
|
||||||||||
|
Dec. 31, 2022(a) |
352 |
551 |
815 |
904 |
1,344 |
941 |
1,058 |
570 |
79 |
6,614 |
||||||||||
|
developed |
271 |
330 |
338 |
655 |
798 |
881 |
383 |
492 |
43 |
4,191 |
||||||||||
|
undeveloped |
81 |
221 |
477 |
249 |
546 |
60 |
675 |
78 |
36 |
2,423 |
||||||||||
|
Dec. 31, 2021 |
369 |
583 |
830 |
992 |
1,408 |
1,032 |
762 |
570 |
82 |
6,628 |
||||||||||
|
developed |
283 |
341 |
383 |
852 |
805 |
963 |
445 |
485 |
51 |
4,608 |
||||||||||
|
undeveloped |
86 |
242 |
447 |
140 |
603 |
69 |
317 |
85 |
31 |
2,020 |
||||||||||
|
Dec. 31, 2020(b) |
243 |
569 |
812 |
1,110 |
1,439 |
1,182 |
879 |
580 |
91 |
6,905 |
||||||||||
|
developed |
199 |
322 |
448 |
1,022 |
846 |
1,093 |
424 |
486 |
60 |
4,900 |
||||||||||
|
undeveloped |
44 |
247 |
364 |
88 |
593 |
89 |
455 |
94 |
31 |
2,005 |
||||||||||
|
(a) Effective January 1, 2022, Eni has updated the conversion rate of gas produced to 5,263 cubic feet of gas equals 1 barrel of oil (it was 5,310 cubic feet of gas per barrel in previous reporting periods). The effect of this update on the change in the initial reserves balance as of January 1, 2022 amounted to 30 mmBOE. Prior-year converted amounts were left unchanged. |
||||||||||||||||||||
|
(b) Effective January 1, 2020, Eni has updated the conversion rate of gas produced to 5,310 cubic feet of gas equals 1 barrel of oil (it was 5,408 cubic feet of gas per barrel in previous reporting periods). The effect of this update on the change in the initial reserves balance as of January 1, 2020 amounted to 67 mmBOE. |
||||||||||||||||||||
|
(c) Reserves volumes of the Sub-Saharan Africa area, in 2022, are affected by the derecognition of the Angolan companies transferred to the JV Azule Energy Holdings Ltd. For further information see note 5 in Item 18 - Notes on Consolidation Financial Statements. |
||||||||||||||||||||
|
(d) Reserves volumes of the Sub-Saharan Africa area, in 2021, are affected by the change in the classification of the stake held in Mozambique Rovuma Venture SpA from joint operation to joint venture. |
||||||||||||||||||||
|
LIQUIDS (mmBBL) |
Italy |
Rest of Europe |
North Africa |
Egypt |
Sub-Saharan Africa |
Kazakhstan |
Rest of Asia |
Americas |
Australia and Oceania |
Total reserves |
||||||||||
|
Consolidated subsidiaries |
|
|
|
|
|
|
|
|
|
|
||||||||||
|
Dec. 31, 2022 |
188 |
36 |
364 |
167 |
367 |
644 |
433 |
234 |
1 |
2,434 |
||||||||||
|
developed |
139 |
32 |
201 |
135 |
212 |
585 |
231 |
171 |
1 |
1,707 |
||||||||||
|
undeveloped |
49 |
4 |
163 |
32 |
155 |
59 |
202 |
63 |
|
727 |
||||||||||
|
Dec. 31, 2021 |
197 |
34 |
393 |
210 |
589 |
710 |
476 |
237 |
1 |
2,847 |
||||||||||
|
developed |
146 |
34 |
225 |
164 |
435 |
641 |
262 |
164 |
1 |
2,072 |
||||||||||
|
undeveloped |
51 |
|
168 |
46 |
154 |
69 |
214 |
73 |
|
775 |
||||||||||
|
Dec. 31, 2020 |
178 |
34 |
383 |
227 |
624 |
805 |
579 |
224 |
1 |
3,055 |
||||||||||
|
developed |
146 |
31 |
243 |
172 |
469 |
716 |
297 |
143 |
1 |
2,218 |
||||||||||
|
undeveloped |
32 |
3 |
140 |
55 |
155 |
89 |
282 |
81 |
|
837 |
||||||||||
|
Equity-accounted entities |
|
|
|
|
|
|
|
|
|
|
||||||||||
|
Dec. 31, 2022(a) |
350 |
8 |
|
235 |
|
100 |
27 |
|
720 |
|||||||||||
|
developed |
173 |
8 |
|
135 |
|
27 |
|
343 |
||||||||||||
|
undeveloped |
177 |
|
100 |
|
100 |
|
|
377 |
||||||||||||
|
Dec. 31, 2021 |
378 |
9 |
|
21 |
|
6 |
|
414 |
||||||||||||
|
developed |
175 |
9 |
|
9 |
|
6 |
|
199 |
||||||||||||
|
undeveloped |
203 |
|
12 |
|
|
|
215 |
|||||||||||||
|
Dec. 31, 2020 |
400 |
12 |
|
18 |
|
30 |
|
460 |
||||||||||||
|
developed |
176 |
12 |
|
15 |
|
30 |
|
233 |
||||||||||||
|
undeveloped |
224 |
|
3 |
|
|
|
227 |
|||||||||||||
|
Consolidated subsidiaries and equity accounted entities |
|
|
|
|
|
|
|
|
|
|
||||||||||
|
Dec. 31, 2022 |
188 |
386 |
372 |
167 |
602 |
644 |
533 |
261 |
1 |
3,154 |
||||||||||
|
developed |
139 |
205 |
209 |
135 |
347 |
585 |
231 |
198 |
1 |
2,050 |
||||||||||
|
undeveloped |
49 |
181 |
163 |
32 |
255 |
59 |
302 |
63 |
|
1,104 |
||||||||||
|
Dec. 31, 2021 |
197 |
412 |
402 |
210 |
610 |
710 |
476 |
243 |
1 |
3,261 |
||||||||||
|
developed |
146 |
209 |
234 |
164 |
444 |
641 |
262 |
170 |
1 |
2,271 |
||||||||||
|
undeveloped |
51 |
203 |
168 |
46 |
166 |
69 |
214 |
73 |
|
990 |
||||||||||
|
Dec. 31, 2020 |
178 |
434 |
395 |
227 |
642 |
805 |
579 |
254 |
1 |
3,515 |
||||||||||
|
developed |
146 |
207 |
255 |
172 |
484 |
716 |
297 |
173 |
1 |
2,451 |
||||||||||
|
undeveloped |
32 |
227 |
140 |
55 |
158 |
89 |
282 |
81 |
|
1,064 |
||||||||||
|
(a) Reserves volumes of the Sub-Saharan Africa area, in 2022, are affected by the derecognition of the Angolan companies transferred to the JV Azule Energy Holdings Ltd. For further information see note 5 in Item 18 - Notes on Consolidation Financial Statements. |
||||||||||||||||||||
|
NATURAL GAS (BCF) |
Italy |
Rest of Europe |
North Africa |
Egypt |
Sub-Saharan Africa |
Kazakhstan |
Rest of Asia |
Americas |
Australia and Oceania |
Total reserves |
||||||||||
|
Consolidated subsidiaries |
|
|
|
|
|
|
|
|
|
|
||||||||||
|
Dec. 31, 2022 |
869 |
223 |
2,323 |
3,881 |
2,341 |
1,560 |
1,281 |
264 |
408 |
13,150 |
||||||||||
|
developed |
695 |
214 |
670 |
2,732 |
1,306 |
1,560 |
796 |
195 |
223 |
8,391 |
||||||||||
|
undeveloped |
174 |
9 |
1,653 |
1,149 |
1,035 |
|
485 |
69 |
185 |
4,759 |
||||||||||
|
Dec. 31, 2021 |
918 |
247 |
2,272 |
4,152 |
2,953 |
1,705 |
1,522 |
274 |
428 |
14,471 |
||||||||||
|
developed |
729 |
242 |
781 |
3,656 |
1,759 |
1,705 |
971 |
210 |
266 |
10,319 |
||||||||||
|
undeveloped |
189 |
5 |
1,491 |
496 |
1,194 |
|
551 |
64 |
162 |
4,152 |
||||||||||
|
Dec. 31, 2020 |
348 |
208 |
2,201 |
4,692 |
3,864 |
2,003 |
1,589 |
175 |
474 |
15,554 |
||||||||||
|
developed |
280 |
194 |
1,014 |
4,511 |
1,751 |
2,003 |
674 |
109 |
315 |
10,851 |
||||||||||
|
undeveloped |
68 |
14 |
1,187 |
181 |
2,113 |
|
915 |
66 |
159 |
4,703 |
||||||||||
|
Equity-accounted entities |
|
|
|
|
|
|
|
|
|
|
||||||||||
|
Dec. 31, 2022(a) |
646 |
9 |
|
1,562 |
|
1,490 |
1,355 |
|
5,062 |
|||||||||||
|
developed |
444 |
9 |
|
1,070 |
|
1,355 |
|
2,878 |
||||||||||||
|
undeveloped |
202 |
|
492 |
|
1,490 |
|
|
2,184 |
||||||||||||
|
Dec. 31, 2021(b) |
654 |
10 |
|
1,285 |
|
1,460 |
|
3,409 |
||||||||||||
|
developed |
457 |
10 |
|
165 |
|
1,460 |
|
2,092 |
||||||||||||
|
undeveloped |
197 |
|
1,120 |
|
|
|
1,317 |
|||||||||||||
|
Dec. 31, 2020 |
510 |
14 |
|
364 |
|
1,559 |
|
2,447 |
||||||||||||
|
developed |
415 |
14 |
|
170 |
|
1,559 |
|
2,158 |
||||||||||||
|
undeveloped |
95 |
|
194 |
|
|
|
289 |
|||||||||||||
|
Consolidated subsidiaries and equity accounted entities |
|
|
|
|
|
|
|
|
|
|
||||||||||
|
Dec. 31, 2022(a) |
869 |
869 |
2,332 |
3,881 |
3,903 |
1,560 |
2,771 |
1,619 |
408 |
18,212 |
||||||||||
|
developed |
695 |
658 |
679 |
2,732 |
2,376 |
1,560 |
796 |
1,550 |
223 |
11,269 |
||||||||||
|
undeveloped |
174 |
211 |
1,653 |
1,149 |
1,527 |
|
1,975 |
69 |
185 |
6,943 |
||||||||||
|
Dec. 31, 2021(b) |
918 |
901 |
2,282 |
4,152 |
4,238 |
1,705 |
1,522 |
1,734 |
428 |
17,880 |
||||||||||
|
developed |
729 |
699 |
791 |
3,656 |
1,924 |
1,705 |
971 |
1,670 |
266 |
12,411 |
||||||||||
|
undeveloped |
189 |
202 |
1,491 |
496 |
2,314 |
|
551 |
64 |
162 |
5,469 |
||||||||||
|
Dec. 31, 2020 |
348 |
718 |
2,215 |
4,692 |
4,228 |
2,003 |
1,589 |
1,734 |
474 |
18,001 |
||||||||||
|
developed |
280 |
609 |
1,028 |
4,511 |
1,921 |
2,003 |
674 |
1,668 |
315 |
13,009 |
||||||||||
|
undeveloped |
68 |
109 |
1,187 |
181 |
2,307 |
|
915 |
66 |
159 |
4,992 |
||||||||||
|
(a) Reserves volumes of the Sub-Saharan Africa area, in 2022, are affected by the derecognition of the Angolan companies transferred to the JV Azule Energy Holdings Ltd. For further information see note 5 in Item 18 - Notes on Consolidation Financial Statements. |
||||||||||||||||||||
|
(b) Reserves volumes of the Sub-Saharan Africa area, in 2021, are affected by the change in the classification of the stake held in Mozambique Rovuma Venture SpA from joint operation to joint venture. |
||||||||||||||||||||
Proved reserves of natural gas liquids are immaterial to the Group operations.
Volumes of oil and natural gas applicable to long- term supply agreements with foreign governments in mineral assets where Eni is operator totaled 5 mmBOE as of December 31, 2022 (34 and 80 mmBOE as of December 31, 2021 and 2020, respectively). Said volumes are not included in reserves volumes shown in the table herein.
|
Subsidiaries |
Equity-accounted entities |
||||||||||
|
(mmBOE) |
2022 |
2021 |
2020 |
|
2022 |
2021 |
2020 |
||||
|
Revisions of previous estimates |
(64) |
42 |
216 |
152 |
216 |
3 |
|||||
|
Improved recovery |
7 |
12 |
5 |
4 |
|||||||
|
Extensions and discoveries |
118 |
62 |
17 |
61 |
8 |
30 |
|||||
|
Purchases of minerals-in-place |
22 |
2 |
551 |
||||||||
|
Sales of minerals-in-place |
(228) |
(5) |
(49) |
||||||||
|
Total additions to proved reserves |
(145) |
113 |
238 |
719 |
224 |
33 |
|||||
|
Production for the year (a) |
(493) |
(526) |
(541) |
(95) |
(88) |
(93) |
|||||
|
|
|
|
|
|
|
|
|||||
|
(a) The difference compared to production sold of 532.0 mmBOE (575.2 mmboe in 2020 and 566.7 mmboe in 2021) reflected hydrocarbons volumes of 55.8 mmBOE consumed in operations (45.4 mmBOE in 2020 and 42.4 mmBOE in 2021), changes in inventories and other factors. |
|||||||||||
|
Subsidiaries and equity-accounted entities |
|||||
|
(%) |
2022 |
2021 |
2020 |
||
|
Proved reserves replacement ratio of subsidiaries and equity-accounted entities, all sources |
98 |
55 |
43 |
||
|
Proved reserves replacement ratio of subsidiaries and equity-accounted entities, organic |
47 |
55 |
43 |
||
Eni’s proved reserves as of December 31, 2022 totaled 6,614 mmBOE (liquids 3,154 mmBBL; natural gas 18,212 BCF) and included the effect of an updating of the gas conversion factor (up by 30 mmBOE). Eni’s proved reserves reported a decrease of 14 mmBOE from December 31, 2021. Portfolio transactions entailed a net addition of 296 mmBOE and comprised: (i) the purchase of 3% interest in the North Field East LNG project in Qatar; (ii) the purchase of the BHP asset in Algeria and other minor assets in Italy and the United States; (iii) sales of 16.2% stake in our associates Vår Energi following the process of listing the investee at the local stock exchange; (iv) the disposal of our production assets in Pakistan and our interest in the OML 11 block in Nigeria; and (v) the business combination between Eni and bp, leading to the creation of Azule Energy, an equity-accounted joint venture (Eni’s interest 50%).
All sources additions to proved reserves booked in 2022 were 574 mmBOE; of which negative for 145 mmBOE came from Eni’s subsidiaries, while 719 mmBOE from Eni’s equity-accounted entities.
The overall effect of price variations was negative and estimated to be 34 mmBOE in 2022 (of which a net negative revision of 28 mmBOE recorded at Eni’s subsidiaries and a net negative revision of 6 mmBOE recorded at Eni’s equity-accounted entities) due to an increase in oil price environment where the Brent reference price used in the reserve estimation process was 101 $/barrel in 2022, much higher than the 69 $/barrel used in 2021. This price effect was determined to the recovery of volumes reserves which were previously uneconomic in the 2021 scenario more than offset by net lower reserves entitlements under PSA contracts.
The methods (or technologies) used in the Eni’s proved reserves assessment in 2022 depend on stage of development, quality and completeness of data, and production history availability. The methods include volumetric estimates, analogies, reservoir modelling, decline curve analysis or a combination of such methods. The data considered for these analyses are obtained from a combination of reliable technologies that produce consistent and repeatable results including well or field measurements (i.e. logs, core samples, pressure information, fluid samples, production test data and performance data) and indirect measurements (i.e. seismic data). However, for each reservoir assessment the most suitable combination of technologies and methods is applied providing a high degree of confidence in establishing reliable reserves estimates.
The all sources reserves replacement ratio reported by Eni’s subsidiaries and equity-accounted entities was 98% in 2022 (55% in 2021 and 43% in 2020). The organic reserves replacement ratio was 47% in 2022 (55% in 2021 and 43% in 2020) which excluded sales and purchases of minerals-in-place.
The all sources reserve replacement ratio during the three years ended December 1, 2022, which included a net increase of 293 mmBOE retaled to sales and purchases, was 64%.
The all sources reserves replacement ratio was calculated by dividing additions to proved reserves including sales and purchases of mineral-in-place by total production, each as derived from the tables of changes in proved reserves prepared in accordance with FASB Extractive Activities – Oil & Gas (Topic 932) (see the supplemental oil and gas information in “Item 18 – Consolidated Financial Statements”). The reserves replacement ratio is a measure used by management to assess the extent to which produced reserves in the year are replaced by booked reserves total additions. Management considers the reserve replacement ratio to be an important indicator of the Company’s ability to sustain its growth prospects.
However, this ratio measures past performances and is not an indicator of future production because the ultimate recovery of reserves is subject to a number of risks and uncertainties. These include the risks associated with the successful completion of large-scale projects, including addressing ongoing regulatory issues and completion of infrastructures, reservoir performance, application of new technologies to improve the recovery factor as well as changes in oil&gas prices, political risks and geological and environmental risks. See “Item 3 – Risks associated with the exploration and production of oil and natural gas – Uncertainties in estimates of oil and natural gas reserves”.
The average reserves life index of Eni’s proved reserves was 11.3 years as of December 31, 2022, which included reserves of both subsidiaries and equity-accounted entities.
Eni’s subsidiaries
Additions in Eni’s subsidiaries were negative in 2022 (a decrease of 187 mmBBL and an increase of 83 BCF) and derived mainly from the sales of minerals-in-place included the business combination between Eni and bp. The agreement provided for the sale of the reserves of the former subsidiaries in Angola as part of the business combination with bp and the acquisition of Eni’s share of the reserves held by the combined company Azule Energy, an equity-accounted entity participated by Eni with a 50% interest. The breakdown of total additions to proved reserves is the following: (i) extensions and discoveries were up by 118 mmBOE mainly due to the final investment decisions made for the project of Baleine in Ivory Coast and Bashrush in Egypt; (ii) revisions of previous estimates were negative for 64 mmBOE. The main positive revisions are in the Nené field in Congo and E Structure in Libya. The main negative changes are in some fields in Nigeria and Zubair in Iraq. Revisions also included net negative price effects of 28 mmBOE and the effect of an updating of the gas conversion factor (up 25 mmBOE); (iii) improved recovery of 7 mmBOE related to the Mizton field in the Mexico; (iv) purchase of minerals-in-place of 22 mmBOE and related to the acquisition of BHP share in Algeria and the share of some fields in the United States and Italy; and (v) sales of minerals-in-place of 228 mmBOE due to the business combination in Angola described above, the OML 11 divestment in Nigeria and the exit from Pakistan.
Further information and explanations of significant changes with respect to each line item of the movements in net proved reserves are provided in “Item 18 – Notes to the Consolidated Financial Statement - Supplemental oil and gas information”.
Eni’s share of equity-accounted entities
Eni’s share of equity-accounted entities added 719 mmBOE of proved oil and gas reserves in 2022 and included the purchase of minerals-in-place due to the business combination in Angola described above. The breakdown of total additions to proved reserves is the following: (i) revisions of previous estimates were overall positive for 152 mmBOE and mainly related to the Eni’s interest held in Azule in Angola and Var Energi in Norway, as well as the progress in development activities at certain fields in Venezuela partly offset by negative revision in Mozambique. Revisions also included net negative price effects of 6 mmBOE and the effect of an updating of the gas conversion factor (up 5 mmBOE); (ii) improved recovery were up by 4 mmBOE in Angola; (iii) extensions and discoveries were up by 61 mmBOE mainly due to the final investment decisions made in Angola and Norway; (iv) purchase of 551 mmBOE due to Eni's joining the NFE project in Qatar and the business combination in Angola described above; and (v) sales of minerals-in-place of 49 mmBOE due to the sale of 16.2% stake in Var Energi, described above.
Further information and explanations of significant changes with respect to each line item of the movements in net proved reserves are provided in “Item 18 – Notes to the Consolidated Financial Statement - Supplemental oil and gas information”.
Proved undeveloped reserves
Proved undeveloped reserves as of December 31, 2022 totaled 2,423 mmBOE. At year-end, proved undeveloped reserves of liquids amounted to 1,104 mmBBL and of natural gas amounted to 6,943 BCF, mainly concentrated in Africa and Asia. Proved undeveloped reserves of consolidated subsidiaries amounted to 727 mmBBL of liquids and 4,759 BCF of natural gas. The table below provide a summary of changes in total proved undeveloped reserves for 2022.
|
Subsidiaries and equity-accounted entities |
|
|
(mmBOE) |
2022 |
|
Proved undeveloped reserves as of December 31, 2021 |
2,020 |
|
Transfers to proved developed reserves |
(317) |
|
Extensions and discoveries |
152 |
|
Revisions of previous estimates |
227 |
|
Improved recovery |
4 |
|
Portfolio |
337 |
|
Proved undeveloped reserves as of December 31, 2022 |
2,423 |
During 2022, Eni matured 317 mmBOE of proved undeveloped reserves to proved developed reserves due to progress in development activities, production start-ups and project revisions. The main reclassifications to proved developed reserves related to the following fields/projects: Coral in Mozambique, Kashagan in Kazakhstan and Amoca in Mexico.
For further information see also “Item 18 – Notes to the Consolidated Financial Statement - Supplemental oil and gas information”.
In 2022, capital expenditure amounted to approximately €7.1 billion to progress the development of PUDs.
Reserves that remain proved undeveloped for five or more years are a result of several factors that affect the timing of the projects development and execution, such as the complexity of development project in adverse and remote locations, physical limitations of infrastructures or plant capacity and contractual limitations that establish production levels. The Company estimates that 0.6 BBOE of proved undeveloped reserves have remained undeveloped for five years or more at the balance sheet date and increased from 2021. The proved undeveloped reserves that have remained undeveloped for five years or more at the balance sheet date mainly related to: (i) certain Libyan gas fields (0.4 BBOE) where development completion and production start-ups are planned according to the delivery obligations set forth in a long-term gas supply agreement currently in force; (ii) Johan Castberg project for Var Energi, the development of which is ongoing and first oil is expected in the last quarter of 2024 (0.1 BBOE); and (iii) other fields in Italy and Iraq (0.1 BBOE) where development activities are in progress. (See also our discussion under the “Risk factors” section about risks associated with oil and gas development projects).
Eni remains strongly committed to put these projects into production in the coming years. The length of the development period depends on a range of external factors, such as for example the type of development, the location and physical operating environment of the field or the absence of infrastructure, considering that the majority of our projects are infrastructure-driven, and not a function of internal factors, such as an insufficient devotion of resources by Eni or a diminished commitment on the part of Eni to complete the project.
Delivery commitments
Eni, through consolidated subsidiaries and equity-accounted entities, sells crude oil and natural gas from its producing operations under a variety of contractual obligations. Some of these contracts, mostly relating to natural gas, specify the delivery of fixed and determinable quantities.
Eni is contractually committed under existing contracts or agreements to deliver in the next three years mainly natural gas to third parties for a total of approximately 576 mmBOE from producing assets located mainly in Algeria, Australia, Egypt, Ghana, Indonesia, Kazakhstan, Libya, Nigeria, Norway and Venezuela.
The sales contracts contain a mix of fixed and variable pricing formulas that are generally indexed to the market price for crude oil, natural gas or other petroleum products. Management believes it can satisfy these contracts from quantities available mainly from production of the Company’s proved developed reserves and supplies from third parties based on existing contracts. Production is expected to account for approximately 99% of delivery commitments.
Eni has met all contractual delivery commitments as of December 31, 2022.
Oil and gas production, production prices and production costs
The matters regarding future production, additions to reserves and related production costs and estimated reserves discussed below and elsewhere herein are forward-looking statements that involve risks and uncertainties that could cause the actual results to differ materially from those in such forward-looking statements. Such risks and uncertainties relating to future production and additions to reserves include political developments affecting the award of exploration or production interests or world supply and prices for oil and natural gas, or changes in the underlying economics of certain of Eni’s important hydrocarbons projects. Such risks and uncertainties relating to future production costs include delays or unexpected costs incurred in Eni’s production operations.
In 2022, oil and natural gas production available for sale averaged 1,487 KBOE/d (1,566 KBOE/d in 2021) and decreased by 5% due to planned and unplanned outages in Kazakhstan, local issues in Nigeria, lower production in Norway and Egypt as well as mature fields decline. These decreases were partly offset by the start-up of the Coral project in Mozambique and the Amoca project in Mexico, higher activity in Algeria, also following the business acquisition, and in the United States as well as the progressive easing of OPEC+ production quotas (particularly in the United Arab Emirates; an overall effect of approximately 6 KBOE/d).
Liquids production (750 KBBL/d) decreased by 62 KBBL/d, or approximately 8% from the full year of 2021. The reduction in Kazakhstan, Norway and Nigeria was partly offset by production growth in Algeria, Mexico and in the United States as well the progressive easing of OPEC+ production quotas (an overall effect of approximately 6 KBOE/d).
Natural gas production (3,878 mmCF/d) decreased by 125 mmCF/d, or approximately 3% compared to the full year of 2021. Lower production in Norway, Nigeria and Egypt was partly offset by production growth in Algeria and Mozambique.
Sales volumes of oil and gas production sold were 532 mmBOE. The 11 mmBOE difference over production on available-for-sale basis (543 mmBOE in 2022) reflected mainly changes in inventory and other factors. Approximately 63% of liquids production sold (270 mmBBL) was destined to Eni’s Refining & Marketing business. About 16% of natural gas production sold (1,381 BCF) was destined to Eni’s Global Gas & LNG Portfolio segment.
The tables below provide Eni subsidiaries and its equity-accounted entities’ production (annual volumes and daily averages), by final product marketed of liquids and natural gas by country and geographical area of each of the last three fiscal years.
|
Average daily production available for sale (a) |
|||||||||||||||||
|
2022 (b) |
2021 |
2020 (c) |
|||||||||||||||
|
Liquids |
Natural gas |
Hydrocarbons |
Liquids |
Natural gas |
Hydrocarbons |
Liquids |
Natural gas |
Hydrocarbons |
|||||||||
|
(KBBL/d) |
|
(mmCF/d) |
|
(KBOE/d) |
(KBBL/d) |
|
(mmCF/d) |
|
(KBOE/d) |
(KBBL/d) |
|
(mmCF/d) |
|
(KBOE/d) |
|||
|
Eni consolidated subsidiaries |
|||||||||||||||||
|
Italy |
36 |
208 |
76 |
36 |
218 |
77 |
47 |
279 |
100 |
||||||||
|
Rest of Europe |
20 |
113 |
42 |
19 |
106 |
39 |
23 |
143 |
50 |
||||||||
|
United Kingdom |
20 |
113 |
42 |
19 |
106 |
39 |
23 |
143 |
50 |
||||||||
|
North Africa |
122 |
641 |
244 |
124 |
607 |
238 |
111 |
638 |
231 |
||||||||
|
Algeria |
62 |
96 |
81 |
54 |
85 |
70 |
53 |
67 |
65 |
||||||||
|
Libya |
58 |
536 |
159 |
67 |
510 |
163 |
55 |
561 |
161 |
||||||||
|
Tunisia |
2 |
9 |
4 |
3 |
12 |
5 |
3 |
10 |
5 |
||||||||
|
Egypt |
77 |
1,337 |
331 |
82 |
1,403 |
346 |
64 |
1,123 |
275 |
||||||||
|
Sub-Saharan Africa |
139 |
361 |
207 |
198 |
351 |
265 |
218 |
539 |
320 |
||||||||
|
Angola |
52 |
52 |
91 |
91 |
89 |
89 |
|||||||||||
|
Congo |
40 |
145 |
68 |
44 |
91 |
62 |
49 |
89 |
66 |
||||||||
|
Ghana |
16 |
76 |
30 |
20 |
77 |
34 |
24 |
80 |
40 |
||||||||
|
Nigeria |
31 |
140 |
57 |
43 |
183 |
78 |
56 |
370 |
125 |
||||||||
|
Kazakhstan |
87 |
168 |
119 |
101 |
199 |
138 |
109 |
247 |
156 |
||||||||
|
Rest of Asia |
78 |
345 |
143 |
80 |
372 |
150 |
88 |
326 |
149 |
||||||||
|
China |
1 |
1 |
1 |
1 |
1 |
1 |
|||||||||||
|
Indonesia |
1 |
271 |
52 |
1 |
269 |
51 |
1 |
208 |
40 |
||||||||
|
Iraq |
15 |
15 |
24 |
24 |
31 |
31 |
|||||||||||
|
Pakistan |
50 |
10 |
53 |
10 |
69 |
13 |
|||||||||||
|
Timor Leste |
1 |
17 |
4 |
1 |
40 |
9 |
2 |
45 |
10 |
||||||||
|
Turkmenistan |
4 |
4 |
6 |
6 |
7 |
7 |
|||||||||||
|
United Arab Emirates |
56 |
7 |
57 |
47 |
10 |
49 |
46 |
4 |
47 |
||||||||
|
Americas |
59 |
54 |
69 |
53 |
55 |
63 |
57 |
58 |
68 |
||||||||
|
Mexico |
14 |
9 |
15 |
11 |
13 |
14 |
12 |
10 |
14 |
||||||||
|
United States |
45 |
45 |
54 |
42 |
42 |
49 |
45 |
48 |
54 |
||||||||
|
Australia and Oceania |
50 |
10 |
82 |
16 |
88 |
17 |
|||||||||||
|
Australia |
50 |
10 |
82 |
16 |
88 |
17 |
|||||||||||
|
|
618 |
|
3,277 |
|
1,241 |
693 |
|
3,393 |
|
1,332 |
717 |
|
3,441 |
|
1,366 |
||
|
Eni share of equity-accounted entities |
|||||||||||||||||
|
Angola |
36 |
63 |
49 |
3 |
74 |
17 |
4 |
87 |
20 |
||||||||
|
Mozambique |
6 |
1 |
|||||||||||||||
|
Norway |
89 |
274 |
141 |
111 |
297 |
167 |
116 |
338 |
180 |
||||||||
|
Tunisia |
3 |
2 |
3 |
1 |
3 |
2 |
1 |
2 |
|||||||||
|
Venezuela |
4 |
258 |
53 |
2 |
238 |
47 |
2 |
210 |
41 |
||||||||
|
|
132 |
|
601 |
|
246 |
119 |
|
610 |
|
234 |
124 |
|
636 |
|
243 |
||
|
Total |
750 |
|
3,878 |
|
1,487 |
812 |
|
4,003 |
|
1,566 |
841 |
|
4,077 |
|
1,609 |
||
|
(a) It excludes production volumes of hydrocarbons consumed in operations. Said volumes were 124, 116 and 124 KBOE/d in 2022, 2021 and 2020, respectively. |
|||||||||||||||||
|
(b) Effective January 1, 2022, the conversion rate of natural gas from cubic feet to boe has been updated to 1 barrel of oil = 5,263 cubic feet of gas (it was 1 barrel of oil = 5,310 cubic feet of gas). The effect of this update on production was 8 KBOE/d in the full year 2022. Prior-year converted amounts were left unchanged. |
|||||||||||||||||
|
(c) Effective January 1, 2020, the conversion rate of natural gas from cubic feet to boe has been updated to 1 barrel of oil = 5,310 cubic feet of gas (it was 1 barrel of oil = 5,408 cubic feet of gas). The effect of this update on production expressed in boe was approximately 14 KBOE/d for the full year 2020. |
|
Annual production available for sale (a) |
||||||||||||||||||
|
2022 (b) |
2021 |
2020 (c) |
||||||||||||||||
|
Liquids |
Natural gas |
Hydrocarbons |
Liquids |
Natural gas |
Hydrocarbons |
Liquids |
Natural gas |
Hydrocarbons |
||||||||||
|
(mmBBL) |
|
(BCF) |
|
(mmBOE) |
(mmBBL) |
|
(BCF) |
|
(mmBOE) |
(mmBBL) |
|
(BCF) |
|
(mmBOE) |
||||
|
Eni consolidated subsidiaries |
||||||||||||||||||
|
Italy |
13 |
76 |
28 |
13 |
80 |
28 |
17 |
102 |
36 |
|||||||||
|
Rest of Europe |
7 |
41 |
15 |
7 |
39 |
14 |
8 |
52 |
18 |
|||||||||
|
United Kingdom |
7 |
41 |
15 |
7 |
39 |
14 |
8 |
52 |
18 |
|||||||||
|
North Africa |
45 |
234 |
89 |
45 |
221 |
87 |
41 |
234 |
85 |
|||||||||
|
Algeria |
23 |
35 |
30 |
20 |
31 |
26 |
19 |
25 |
24 |
|||||||||
|
Libya |
21 |
196 |
58 |
24 |
186 |
59 |
21 |
205 |
59 |
|||||||||
|
Tunisia |
1 |
3 |
1 |
1 |
4 |
2 |
1 |
4 |
2 |
|||||||||
|
Egypt |
28 |
488 |
121 |
30 |
512 |
126 |
24 |
411 |
101 |
|||||||||
|
Sub-Saharan Africa |
51 |
132 |
76 |
73 |
128 |
96 |
80 |
198 |
117 |
|||||||||
|
Angola |
19 |
19 |
33 |
33 |
33 |
33 |
||||||||||||
|
Congo |
15 |
53 |
25 |
16 |
33 |
22 |
18 |
33 |
24 |
|||||||||
|
Ghana |
6 |
28 |
11 |
8 |
28 |
13 |
9 |
29 |
14 |
|||||||||
|
Nigeria |
11 |
51 |
21 |
16 |
67 |
28 |
20 |
136 |
46 |
|||||||||
|
Kazakhstan |
32 |
61 |
43 |
37 |
73 |
51 |
40 |
90 |
57 |
|||||||||
|
Rest of Asia |
28 |
126 |
52 |
29 |
136 |
55 |
32 |
119 |
55 |
|||||||||
|
China |
||||||||||||||||||
|
Indonesia |
99 |
19 |
98 |
19 |
76 |
15 |
||||||||||||
|
Iraq |
6 |
6 |
9 |
9 |
11 |
11 |
||||||||||||
|
Pakistan |
18 |
3 |
19 |
4 |
25 |
5 |
||||||||||||
|
Timor Leste |
7 |
1 |
1 |
15 |
3 |
1 |
16 |
4 |
||||||||||
|
Turkmenistan |
2 |
2 |
2 |
2 |
3 |
3 |
||||||||||||
|
United Arab Emirates |
20 |
2 |
21 |
17 |
4 |
18 |
17 |
2 |
17 |
|||||||||
|
Americas |
22 |
20 |
25 |
19 |
20 |
23 |
21 |
21 |
25 |
|||||||||
|
Mexico |
5 |
3 |
5 |
4 |
5 |
5 |
4 |
4 |
5 |
|||||||||
|
United States |
17 |
17 |
20 |
15 |
15 |
18 |
17 |
17 |
20 |
|||||||||
|
Australia and Oceania |
18 |
4 |
30 |
6 |
32 |
6 |
||||||||||||
|
Australia |
18 |
4 |
30 |
6 |
32 |
6 |
||||||||||||
|
|
226 |
|
1,196 |
|
453 |
253 |
|
1,239 |
|
486 |
263 |
|
1,259 |
|
500 |
|||
|
Eni share of equity-accounted entities |
||||||||||||||||||
|
Angola |
13 |
23 |
18 |
1 |
27 |
6 |
1 |
32 |
7 |
|||||||||
|
Mozambique |
2 |
1 |
||||||||||||||||
|
Norway |
33 |
100 |
51 |
41 |
109 |
61 |
42 |
124 |
66 |
|||||||||
|
Tunisia |
1 |
1 |
1 |
1 |
1 |
1 |
||||||||||||
|
Venezuela |
1 |
95 |
19 |
1 |
87 |
17 |
1 |
77 |
15 |
|||||||||
|
|
48 |
|
220 |
|
90 |
44 |
|
223 |
|
85 |
45 |
|
233 |
|
89 |
|||
|
Total |
274 |
|
1,416 |
|
543 |
297 |
|
1,462 |
|
571 |
308 |
|
1,492 |
|
589 |
|||
|
(a) It excludes production volumes of hydrocarbons consumed in operations. Said volumes were 45.1, 42.4 and 45.4 mmBOE in 2022, 2021 and 2020, respectively. |
||||||||||||||||||
|
(b) Effective January 1, 2022, the conversion rate of natural gas from cubic feet to boe has been updated to 1 barrel of oil = 5,263 cubic feet of gas (it was 1 barrel of oil = 5,310 cubic feet of gas). The effect of this update on production expressed in boe was approximately 3 mmBOE for the full year of 2022. Prior-year converted amounts were left unchanged. |
||||||||||||||||||
|
(c) Effective January 1, 2020, the conversion rate of natural gas from cubic feet to boe has been updated to 1 barrel of oil = 5,310 cubic feet of gas (it was 1 barrel of oil = 5,408 cubic feet of gas). The effect of this update on production expressed in boe was approximately 5 mmBOE for the full year 2020. |
||||||||||||||||||
Volumes of oil and natural gas purchased under long-term supply contracts with foreign governments or similar entities in properties where Eni acts as producer totaled 35 KBOE/d, 43 KBOE/d and 60 KBOE/d in 2022, 2021 and 2020, respectively.
The tables below provide Eni subsidiaries and its equity-accounted entities’ average sales prices per unit of liquids and natural gas by geographical area for each of the last three fiscal years. In addition, Eni subsidiaries and its equity-accounted entities’ average production cost per unit of production are provided.
| ($) | |||||||||||||||||||||||||||||||||||
| 2020 | |||||||||||||||||||||||||||||||||||
| Consolidated subsidiaries | Italy | Rest of Europe | North Africa | Egypt | Sub-Saharan Africa | Kazakhstan | Rest of Asia | Americas | Australia and Oceania | Total | |||||||||||||||||||||||||
| Oil and condensates, per BBL | 34.58 | 32.82 | 38.33 | 36.66 | 39.99 | 37.37 | 37.69 | 33.03 | 17.45 | 37.56 | |||||||||||||||||||||||||
| Natural gas, per KCF | 3.16 | 3.12 | 4.33 | 4.78 | 2.76 | 0.69 | 4.09 | 2.10 | 3.84 | 3.77 | |||||||||||||||||||||||||
| Total hydrocarbons, per BOE | 25.28 | 23.94 | 30.28 | 28.03 | 32.06 | 27.22 | 31.31 | 29.57 | 20.35 | 29.20 | |||||||||||||||||||||||||
| Average production cost, per BOE | 10.41 | 8.76 | 4.99 | 4.15 | 7.63 | 4.94 | 4.92 | 12.54 | 3.10 | 6.31 | |||||||||||||||||||||||||
| Equity-accounted entities | |||||||||||||||||||||||||||||||||||
| Oil and condensates, per BBL | 35.23 | 18.16 | 17.13 | 27.20 | 34.21 | ||||||||||||||||||||||||||||||
| Natural gas, per KCF | 3.25 | 6.29 | 3.94 | 4.37 | 3.73 | ||||||||||||||||||||||||||||||
| Total hydrocarbons, per BOE | 29.17 | 19.36 | 19.97 | 23.39 | 27.33 | ||||||||||||||||||||||||||||||
| Average production cost, per BOE | 6.07 | 9.97 | 3.56 | 1.37 | 5.10 | ||||||||||||||||||||||||||||||
| 2021 | |||||||||||||||||||||||||||||||||||
| Consolidated subsidiaries | |||||||||||||||||||||||||||||||||||
| Oil and condensates, per BBL | 61.26 | 70.60 | 68.03 | 63.53 | 69.12 | 66.92 | 68.39 | 61.93 | 58.76 | 66.91 | |||||||||||||||||||||||||
| Natural gas, per KCF | 15.47 | 15.75 | 6.42 | 4.74 | 4.32 | 0.54 | 6.21 | 4.06 | 4.25 | 5.93 | |||||||||||||||||||||||||
| Total hydrocarbons, per BOE | 72.42 | 78.48 | 51.51 | 34.18 | 58.24 | 49.37 | 51.48 | 55.66 | 23.03 | 49.82 | |||||||||||||||||||||||||
| Average production cost, per BOE | 13.74 | 12.35 | 7.91 | 3.74 | 10.00 | 4.96 | 5.43 | 14.72 | 3.52 | 7.39 | |||||||||||||||||||||||||
| Equity-accounted entities | |||||||||||||||||||||||||||||||||||
| Oil and condensates, per BBL | 66.72 | 17.89 | 44.41 | 57.75 | 65.10 | ||||||||||||||||||||||||||||||
| Natural gas, per KCF | 15.11 | 5.83 | 14.68 | 4.32 | 10.71 | ||||||||||||||||||||||||||||||
| Total hydrocarbons, per BOE | 71.19 | 18.69 | 70.02 | 24.99 | 61.11 | ||||||||||||||||||||||||||||||
| Average production cost, per BOE | 7.53 | 7.36 | 4.71 | 0.99 | 6.00 | ||||||||||||||||||||||||||||||
| 2022 | |||||||||||||||||||||||||||||||||||
| Consolidated subsidiaries | |||||||||||||||||||||||||||||||||||
| Oil and condensates, per BBL | 67.07 | 93.94 | 92.11 | 87.64 | 103.96 | 86.94 | 94.13 | 92.03 | 60.89 | 92.41 | |||||||||||||||||||||||||
| Natural gas, per KCF | 20.32 | 30.22 | 10.52 | 5.50 | 4.99 | 0.69 | 10.57 | 6.48 | 4.10 | 8.61 | |||||||||||||||||||||||||
| Total hydrocarbons, per BOE | 87.98 | 128.03 | 73.29 | 42.64 | 83.12 | 64.59 | 76.85 | 83.45 | 22.25 | 69.07 | |||||||||||||||||||||||||
| Average production cost, per BOE | 14.77 | 13.15 | 5.75 | 4.22 | 12.12 | 5.85 | 6.56 | 17.05 | 6.15 | 7.94 | |||||||||||||||||||||||||
| Equity-accounted entities | |||||||||||||||||||||||||||||||||||
| Oil and condensates, per BBL | 97.51 | 17.82 | 85.71 | 88.39 | 92.97 | ||||||||||||||||||||||||||||||
| Natural gas, per KCF | 31.02 | 9.67 | 33.79 | 4.76 | 19.87 | ||||||||||||||||||||||||||||||
| Total hydrocarbons, per BOE | 121.12 | 19.31 | 108.43 | 29.27 | 98.29 | ||||||||||||||||||||||||||||||
| Average production cost, per BOE | 11.58 | 7.57 | 14.15 | 1.32 | 9.86 | ||||||||||||||||||||||||||||||
Development well activity
In 2022, a total of 187 development wells were drilled (71.1 of which represented Eni’s share) as compared to 154 development wells drilled in 2021 (47.7 of which represented Eni’s share) and 182 development wells drilled in 2020 (57.4 of which represented Eni’s share).
The drilling of 40 development wells (13.5 of which represented Eni’s share) is currently underway.
The table below summarizes the number of the Company’s net interest in productive and dry development wells completed in each of the past three years and the status of the Company’s development wells in the process of being drilled as of December 31, 2022. A dry well is one found to be incapable of producing either oil or gas in sufficient quantities to justify completion as an oil or gas well.
| Net wells completed | Wells in progress at 31 Dec. 2021 |
||||||||||||||
| (units) | 2022 | 2021 | 2020 | ||||||||||||
| Productive | Dry | Productive | Dry | Productive | Dry | Gross | Net | ||||||||
| Italy | 1.0 | 8.0 | 3.7 | ||||||||||||
| Rest of Europe | 4.6 | 4.8 | 2.8 | 1.0 | 0.5 | ||||||||||
| North Africa | 5.7 | 0.5 | 2.5 | 4.3 | 5.0 | 2.3 | |||||||||
| Egypt | 19.9 | 17.0 | 0.8 | 23.2 | 17.0 | 3.0 | |||||||||
| Sub-Saharan Africa | 8.5 | 3.8 | 1.2 | ||||||||||||
| Kazakhstan | 0.6 | 0.3 | 8.0 | 3.9 | |||||||||||
| Rest of Asia | 22.1 | 14.9 | 23.2 | 0.4 | 1.0 | 0.1 | |||||||||
| Americas | 8.2 | 3.9 | 2.0 | ||||||||||||
| Australia and Oceania | |||||||||||||||
| Total including equity-accounted entities | 70.6 | 0.5 | 46.9 | 0.8 | 57.0 | 0.4 | 40.0 | 13.5 | |||||||
Exploration well activity
In 2022, a total of 40 new exploratory wells were drilled (18.9 of which represented Eni’s share), as compared to 31 exploratory wells drilled in 2021 (17.4 of which represented Eni’s share) and 28 exploratory wells drilled in 2020 (13.8 of which represented Eni’s share).
The overall commercial success rate was 45% (44% net to Eni) as compared to 54% (49% net to Eni) and 28% (30% net to Eni) in 2021 and 2020, respectively.
The following table summarizes the Company’s net interests in productive and dry exploratory wells completed in each of the last three fiscal years and the number of exploratory wells in the process of being drilled and evaluated as of December 31, 2022. A dry well is one found to be incapable of producing either oil or gas in sufficient quantities to justify completion as an oil or gas well. For further information on the ageing of suspended wells see note 12 on Consolidated Financial Statements.
| Net wells completed | Wells in progress at Dec. 31 2022 |
||||||||||||||
| (units) | 2022 | 2021 | 2020 | ||||||||||||
| Productive | Dry | Productive | Dry | Productive | Dry | Gross | Net | ||||||||
| Italy | 26.0 | 6.7 | |||||||||||||
| Rest of Europe | 0.4 | 1.2 | 0.1 | 0.3 | 0.8 | 0.4 | 9.0 | 6.0 | |||||||
| North Africa | 1.0 | 4.0 | 0.5 | 1.5 | 12.0 | 10.3 | |||||||||
| Egypt | 4.4 | 4.3 | 5.0 | 5.0 | 0.7 | 1.5 | 39.0 | 19.7 | |||||||
| Sub-Saharan Africa | 3.7 | 2.4 | 1.1 | 0.4 | 0.1 | 0.9 | |||||||||
| Kazakhstan | 1.1 | 13.0 | 5.7 | ||||||||||||
| Rest of Asia | 0.7 | 1.0 | 0.7 | 1.0 | 0.8 | 0.9 | 3.0 | 1.9 | |||||||
| Americas | 0.7 | 0.6 | 1.0 | 0.3 | |||||||||||
| Australia and Oceania | |||||||||||||||
| Total including equity-accounted entities | 10.2 | 12.9 | 7.0 | 7.4 | 2.9 | 6.9 | 103.0 | 50.6 | |||||||
Oil and gas properties, operations and acreage
In 2022, Eni performed its operations in thirty-seven countries located in five continents. As of December 31, 2022, Eni’s mineral right portfolio consisted of 752 exclusive or shared rights of exploration and development activities for a total acreage of 308,550 square kilometers net to Eni (335,501 square kilometers net to Eni as of December 31, 2021), of which 643 square kilometers related to the CCUS activities in Norway and the United Kingdom. Developed acreage was 27,262 square kilometers and undeveloped acreage was 281,288 square kilometers net to Eni.
In 2022 new leases were purchased or awarded in Qatar, Algeria, Egypt, Norway and Ivory Coast as well as the CCUS project in Norway for a total increase in acreage of approximately 18,900 square kilometers. Interest increases were reported mainly in Vietnam, Algeria and Congo for a total acreage of approximately 1,450 square kilometers. Relinquishment for the year related mainly to South Africa, Myanmar, Bahrain, Greenland, Ireland, Pakistan, Italy, Mozambique and Montenegro covering an acreage of approximately 39,650 square kilometers. Partial relinquishment was reported mainly in Angola, Indonesia and Norway for approximately 7,700 square kilometers.
Eni’s investment in developed and undeveloped acreage is comprised of numerous concessions, blocks and leases. The terms and conditions under which the Company maintains exploration and/or production rights to the acreage are property-specific, contractually defined and vary significantly from property to property. Work programs are designed to ensure that the exploration potential of any property is fully evaluated before expiration. In some instances, Eni may elect to relinquish acreage in advance of the contractual expiration date if the evaluation process is complete and there is not a business basis for extension. In cases where additional time may be required to fully evaluate acreage, Eni has generally been successful in obtaining extensions. The scheduled expiration of leases and concessions for undeveloped acreage over the next three years is not expected to have a material adverse impact on the Company.
The gross undeveloped acreages that will expire in the next three years are related to exploration leases, blocks, concessions in: (i) Rest of Europe, in particular in Albania and Cyprus; (ii) Rest of Asia, in particular in Oman, Vietnam, Indonesia, Russia and United Arab Emirates; (iii) North Africa, in particular in Morocco and Libya; (iv) Sub-Saharan Africa, in particular in Kenya, Ivory Coast and Mozambique; and (v) Americas, in particular in Mexico. In most cases extension or renewal options are contractually defined and may or may not be exercised depending on the results of the studies and the planned activities. Management believes that a significant amount of acreage will be maintained following extension or renewal.
The table below provides certain information about the Company’s oil&gas properties. It provides the total gross and net developed and undeveloped oil and natural gas acreage in which the Group and its equity-accounted entities had interest as of December 31, 2022. A gross acreage is one in which Eni owns a working interest.
| December 31, 2021 | December 31, 2022 | ||||||||||||||
| Total net acreage (a) |
Number of interests |
Gross developed acreage (a) (b) |
Gross undeveloped acreage (a) |
Total gross acreage (a) |
Net developed acreage (a) (b) |
Net undeveloped acreage (a) |
Total net acreage (a) |
||||||||
| EUROPE | 39,858 | 302 | 14,635 | 54,096 | 68,731 | 8,137 | 25,495 | 33,632 | |||||||
| Italy | 12,118 | 113 | 7,993 | 4,966 | 12,959 | 6,698 | 4,186 | 10,884 | |||||||
| Rest of Europe | 27,740 | 189 | 6,642 | 49,130 | 55,772 | 1,439 | 21,309 | 22,748 | |||||||
| Albania | 587 | 1 | 587 | 587 | 587 | 587 | |||||||||
| Cyprus | 13,988 | 7 | 25,474 | 25,474 | 13,988 | 13,988 | |||||||||
| Greenland | 1,909 | ||||||||||||||
| Montenegro | 614 | ||||||||||||||
| Norway | 7,272 | 147 | 5,723 | 21,789 | 27,512 | 815 | 5,871 | 6,686 | |||||||
| United Kingdom | 1,487 | 34 | 919 | 1,280 | 2,199 | 624 | 863 | 1,487 | |||||||
| Other Countries | 1,883 | ||||||||||||||
| AFRICA | 128,186 | 293 | 51,139 | 232,739 | 283,878 | 14,207 | 103,189 | 117,396 | |||||||
| North Africa | 27,775 | 81 | 16,820 | 104,546 | 121,366 | 7,773 | 35,307 | 43,080 | |||||||
| Algeria | 4,765 | 54 | 11,561 | 6,915 | 18,476 | 5,332 | 3,388 | 8,720 | |||||||
| Libya | 13,294 | 14 | 1,963 | 78,085 | 80,048 | 958 | 23,686 | 24,644 | |||||||
| Morocco | 7,529 | 1 | 16,730 | 16,730 | 7,529 | 7,529 | |||||||||
| Tunisia | 2,187 | 12 | 3,296 | 2,816 | 6,112 | 1,483 | 704 | 2,187 | |||||||
| Egypt | 6,776 | 55 | 5,022 | 15,179 | 20,201 | 1,789 | 5,314 | 7,103 | |||||||
| Sub-Saharan Africa | 93,635 | 157 | 29,297 | 113,014 | 142,311 | 4,645 | 62,568 | 67,213 | |||||||
| Angola | 10,810 | 82 | 10,863 | 30,544 | 41,407 | 907 | 5,609 | 6,516 | |||||||
| Congo | 1,306 | 19 | 971 | 1,320 | 2,291 | 586 | 713 | 1,299 | |||||||
| Gabon | 2,931 | 3 | 2,931 | 2,931 | 2,931 | 2,931 | |||||||||
| Ghana | 495 | 3 | 226 | 930 | 1,156 | 100 | 395 | 495 | |||||||
| Ivory Coast | 3,385 | 6 | 4,523 | 4,523 | 4,000 | 4,000 | |||||||||
| Kenya | 41,892 | 6 | 50,677 | 50,677 | 41,892 | 41,892 | |||||||||
| Mozambique | 4,171 | 8 | 719 | 13,883 | 14,602 | 180 | 3,688 | 3,868 | |||||||
| Nigeria | 6,374 | 30 | 16,518 | 8,206 | 24,724 | 2,872 | 3,340 | 6,212 | |||||||
| South Africa | 22,271 | ||||||||||||||
| ASIA | 155,482 | 55 | 10,926 | 256,816 | 267,742 | 3,238 | 142,347 | 145,585 | |||||||
| Kazakhstan | 1,947 | 7 | 2,391 | 3,853 | 6,244 | 442 | 1,505 | 1,947 | |||||||
| Rest of Asia | 153,535 | 48 | 8,535 | 252,963 | 261,498 | 2,796 | 140,842 | 143,638 | |||||||
| Bahrain | 2,858 | ||||||||||||||
| China | 10 | 3 | 62 | 62 | 10 | 10 | |||||||||
| Indonesia | 14,184 | 13 | 3,770 | 14,465 | 18,235 | 1,787 | 10,319 | 12,106 | |||||||
| Iraq | 446 | 1 | 1,074 | 1,074 | 446 | 446 | |||||||||
| Lebanon | 1,461 | 2 | 3,653 | 3,653 | 1,461 | 1,461 | |||||||||
| Myanmar | 4,113 | ||||||||||||||
| Oman | 58,955 | 3 | 102,016 | 102,016 | 58,955 | 58,955 | |||||||||
| Pakistan | 1,072 | ||||||||||||||
| Qatar | 1 | 1,206 | 1,206 | 38 | 38 | ||||||||||
| Russia | 17,975 | 2 | 53,930 | 53,930 | 17,975 | 17,975 | |||||||||
| Timor Leste | 1,928 | 4 | 412 | 2,200 | 2,612 | 122 | 1,806 | 1,928 | |||||||
| Turkmenistan | 180 | 1 | 200 | 200 | 180 | 180 | |||||||||
| United Arab Emirates | 18,771 | 12 | 3,017 | 29,603 | 32,620 | 251 | 18,411 | 18,662 | |||||||
| Vietnam | 28,338 | 5 | 31,290 | 31,290 | 28,633 | 28,633 | |||||||||
| Other Countries | 3,244 | 1 | 14,600 | 14,600 | 3,244 | 3,244 | |||||||||
| AMERICAS | 9,270 | 98 | 2,230 | 14,570 | 16,800 | 1,046 | 8,140 | 9,186 | |||||||
| Mexico | 3,106 | 10 | 34 | 5,436 | 5,470 | 34 | 3,073 | 3,107 | |||||||
| United States | 751 | 76 | 935 | 280 | 1,215 | 515 | 139 | 654 | |||||||
| Venezuela | 1,066 | 6 | 1,261 | 1,543 | 2,804 | 497 | 569 | 1,066 | |||||||
| Other Countries | 4,347 | 6 | 7,311 | 7,311 | 4,359 | 4,359 | |||||||||
| AUSTRALIA AND OCEANIA | 2,705 | 4 | 728 | 2,608 | 3,336 | 634 | 2,117 | 2,751 | |||||||
| Australia | 2,705 | 4 | 728 | 2,608 | 3,336 | 634 | 2,117 | 2,751 | |||||||
| Total | 335,501 | 752 | 79,658 | 560,829 | 640,487 | 27,262 | 281,288 | 308,550 | |||||||
| (a) | Square kilometers. | |||||||||||||||
| (b) | Developed acreage refers to those leases in which at least a portion of the area is in production or encompasses proved developed reserves. | |||||||||||||||
The table below sets forth, as of December 31, 2022 and by main producing countries in each geographic area, Eni’s producing assets, the year in which Eni’s activities started, the Eni’s participating interest in each asset and whether Eni is operator of the asset.
|
ITALY |
(1926) |
Operated |
Adriatic and Ionian Sea: Barbara (100%), Annamaria (100%), Clara NW (51%), Hera Lacinia (100%) and Bonaccia (100%) |
|
Basilicata Region: Val d'Agri (61%) |
|||
|
|
|
|
Sicily: Gela (100%), Tresauro (75%), Giaurone (100%), Fiumetto (100%), Prezioso (100%) and Bronte (100%) |
|
REST OF EUROPE |
|||
|
Norway (a) |
(1965) |
Operated |
Goliat (41%), Marulk (12.62%), Balder & Ringhorne (56.77%) and Ringhorne East (44.14%) |
|
|
|
Non-operated |
Åsgard (15.41% ), Mikkel (30.51%), Great Ekofisk Area (7.81%), Snorre (11.70%), Ormen Lange (4.00%), Statfjord Unit (13.47%), Statfjord Satellites East (9.17%), Statfjord Satellites North (15.77%), Statfjord Satellites Sygna (13.25%) and Grane (17.86%) |
|
United Kingdom |
(1964) |
Operated |
Liverpool Bay (100%) |
|
|
|
Non-operated |
Elgin/Franklin (21.87%), Glenelg (8%), J Block (33%), Jasmine (33%) and Jade (7%) |
|
NORTH AFRICA |
|||
|
Algeria (b) |
(1981) |
Operated |
Sif Fatima II (49%), Zemlet El Arbi (49%), Ourhoud II (49%), Blocks 403a/d (from 65% to 100%), Block ROM North (35%), Blocks 401a/402a (55%), Block 403 (50%), Block 405b (75%) and Berkine South (75%) |
|
|
|
Non-operated |
Block 404 (12.25%) and Block 208 (12.25%) |
|
Libya (b) |
(1959) |
Non-operated |
Onshore contract areas: Area A (former concession 82 - 50%), Area B (former concession 100/ Bu-Attifel and Block NC 125 - 50%), Area E (El-Feel - 33.3%) and Area D (Block NC 169 - 50%) |
|
|
|
|
Offshore contract areas: Area C (Bouri - 50%) and Area D (Block NC 41 - 50%) |
|
Tunisia |
(1961) |
Operated |
Maamoura (49%), Baraka (49%), Adam (25%) and Oued Zar (50%) |
|
|
|
Non-operated |
MLD (50%) and El Borma (50%) |
|
EGYPT (b)(c) |
(1954) |
Operated |
Shorouk (Zohr - 50%), Nile Delta (Abu Madi West/Nidoco - 75%), Sinai (Belayim Land, Belayim Marine and Abu Rudeis - 100%), Meleiha (76%), North Port Said (Port Fouad - 100%), Temsah (Tuna, Temsah and Denise - 50%), Southwest Meleiha (100%) and Baltim (50%) |
|
|
|
Non-operated |
Ras el Barr (Ha'py and Seth - 50%) and South Ghara (25%) |
|
SUB-SAHARAN AFRICA |
|
|
|
|
Angola (d) |
(1980) |
Operated |
Block 31 (13.33%), Block 18 (23%) and Block 15/06 (18.42%) |
|
|
|
Non-operated |
Block 17 (7.9%), Block 15 (21%), Block 0 (4.90%), Block 3 e 3/05-A (6%), Block 14 (10%) and Block 14K/A IMI (5%). |
|
Congo |
(1968) |
Operated |
Néné-Banga Marine and Litchendjili (Block Marine XII, 65%), Ikalou (85%), Djambala (50%), Foukanda (58%), Mwafi (58%), Kitina (52%), Awa Paloukou (90%) and M’Boundi (83%) |
|
|
|
Non-operated |
Yanga Sendji (29.75%) and Likouala (35%) |
|
Ghana |
(2009) |
Operated |
Offshore Cape Three Points (44.44%) |
|
Mozambique |
(2006) |
Operated |
Area 4 (25%) |
|
Nigeria |
(1962) |
Operated |
OMLs 60, 61, 62 and 63 (20%) and OML 125 (100%) |
|
|
|
Non-operated (e) |
OML 118 (12.5%) |
|
KAZAKHSTAN (b) |
(1992) |
Operated (f) |
Karachaganak (29.25%) |
|
|
|
Non-operated |
Kashagan (16.81%) |
|
REST OF ASIA |
|
|
|
|
Indonesia |
(2001) |
Operated |
Jangkrik (55%) and Merakes (65%) |
|
Iraq |
(2009) |
Operated (g) |
Zubair (41.56%) |
|
Turkmenistan |
(2008) |
Operated |
Burun (90%) |
|
United Arab Emirates |
(2018) |
Non-operated |
Lower Zakum (5%), Umm Shaif and Nasr (10%) and Area B - Sharjah ( 50%) |
|
AMERICAS |
|
|
|
|
Mexico |
(2019) |
Operated |
Area 1 (100%) |
|
United States |
(1968) |
Operated |
Gulf of Mexico: Allegheny (100%), Appaloosa (100%), Pegasus (100%), Longhorn (75%), Devils Towers (100%) and Triton (100%) |
|
Alaska: Nikaitchuq (100%) and Oooguruk (100%) |
|||
|
Non-operated |
Gulf of Mexico: Europa (32%), Medusa (25%), Lucius (14.45%), K2 (13.4%), Frontrunner (37.5%) and Heidelberg (12.5%) |
||
|
|
|
|
Texas: Alliance area (27.5%) |
|
Venezuela |
(1998) |
Non-operated |
Perla (50%), Corocoro (26%) and Junin 5 (40%) |
|
(a) Assets held by the Var Energi associate (Eni's interest 63.1%). |
|||
|
(b) In certain extractive initiatives, Eni and the host Country agree to assign the operatorship of a given initiative to an incorporated joint venture, a so‐called operating company. The operating company in its capacity as the operator is responsible of managing extractive operations. Those operating companies are not controlled by Eni. |
|||
|
(c) Eni’s working interests (and not participating interests) are reported. This include Eni’s share of costs incurred on behalf of the first party accordingly to the terms of PSAs inforce in the Country. |
|||
|
(d) Assets held through Azule Energy, an equity accounted joint venture (Eni's interest 50%). |
|||
|
(e) As partners of SPDC JV, Eni holds a 5% interest in 16 onshore blocks and in 1 conventional offshore block and with a 12.86% in 2 conventional offshore blocks. |
|||
|
(f) Eni and Shell are co-operators. |
|||
|
(g) Eni is leading a consortium of partners including international companies and the national oil company Missan Oil, a part of a technical service contract as a contractor. |
The table below provides the number of gross and net productive oil and natural gas wells in which the Group companies and its equity-accounted entities had an interest as of December 31, 2022. A gross well is a well in which Eni owns a working interest. The number of gross wells is the total number of wells in which Eni owns a whole or fractional working interest. The number of net wells is the sum of the whole or fractional working interests in a gross well. One or more completions in the same borehole are counted as one well. Productive wells are producing wells and wells capable of production. The total number of oil and natural gas productive wells is 8,200 (2,680.3 of which represent Eni’s share).
|
Productive oil and gas wells at Dec. 31, 2022 (a) |
|||||||
|
(units) |
Oil Wells |
|
Natural gas Wells |
||||
|
Gross |
Net |
Gross |
Net |
||||
|
Italy |
156.0 |
130.0 |
331.0 |
292.4 |
|||
|
Rest of Europe |
635.0 |
105.0 |
223.0 |
49.1 |
|||
|
North Africa |
627.0 |
263.8 |
138.0 |
74.9 |
|||
|
Egypt |
1,253.0 |
533.5 |
145.0 |
44.7 |
|||
|
Sub-Saharan Africa |
2,639.0 |
480.1 |
175.0 |
26.1 |
|||
|
Kazakhstan |
209.0 |
57.2 |
1.0 |
0.3 |
|||
|
Rest of Asia |
1,004.0 |
349.4 |
108.0 |
45.6 |
|||
|
Americas |
269.0 |
144.4 |
285.0 |
81.8 |
|||
|
Australia and Oceania |
2.0 |
2.0 |
|||||
|
Total including equity-accounted entities |
6,792.0 |
2,063.4 |
|
1,408.0 |
616.9 |
||
|
(a) Multiple completion wells included above: approximateley 1,089 (306.4 net to Eni). |
Eni’s exploration and production activities are subject to a broad range of laws and regulations. These cover virtually all aspects of exploration and production activities, including matters such as license acquisition, production rates, royalties, pricing, environmental protection, export, taxes and foreign exchange. The terms and condition of the leases, licenses and contracts under which these oil&gas interests are held vary from country to country. These leases, licenses and contracts are generally granted by or entered into with a government entity or state company and are sometimes entered into with private property owners. These contractual arrangements usually take the form of concession agreements or production sharing agreements:
- Concession contracts are currently applied mainly in OECD countries and regulate relationships between States and oil companies with regards to hydrocarbon exploration and production activity. The company holding the mining concession has an exclusive right on exploration, development and production activities, sustaining all the operational risks and costs related to the exploration and development activities, and it is entitled to the productions obtained. As compensation for mineral concessions, it pays royalties on production (which may be in cash or in-kind) and taxes on oil revenues to the state in accordance with local tax legislation. Both exploration and production licenses are granted generally for a specified period of time (except for production licenses in the United States which remain in effect until production ceases): the term of Eni’s licenses and the extent to which these licenses may be renewed vary by area. Proved reserves to which Eni is entitled are determined by applying Eni’s share of production to total proved reserves of the contractual area, in respect of the duration of the relevant mineral right.
In Particular, Eni’s exploration and production activities are regulated by concession contracts or a similar scheme mainly in Italy, Ghana, Tunisia, the United Arab Emirates, the United Kingdom, the United States, certain assets in Nigeria, Angola and Australia. In Norway, Eni’s activities are regulated by Production Licenses (PL). According to a PL, the holder is entitled to perform seismic surveys and drilling and production activities for a given number of years with possible extensions.
- Eni operates under Production Sharing Agreement (PSA) in several of the foreign jurisdictions mainly in African, Middle Eastern, Far Eastern countries. The mineral right is awarded to the national oil company jointly with the foreign oil company that has an exclusive right to perform exploration, development and production activities and can enter into agreements with other local or international entities. In this type of contract, the national oil company assigns to the international contractor the task of performing exploration and production with the contractor’s equipment (technologies) and financial resources. Exploration risks are borne by the contractor and production is divided into two portions: “Cost Oil” is used to recover costs borne by the contractor and “Profit Oil” is divided between the contractor and the national company according to variable schemes and represents the profit deriving from exploration and production. Further terms and conditions of these contracts may vary from country to country. Pursuant to these contracts, Eni is entitled to a portion of a field’s reserves, the sale of which is intended to cover expenditures incurred by the Company to develop and operate the field. The Company’s share of production volumes and reserves representing the Profit Oil includes the share of hydrocarbons which corresponds to the taxes to be paid, according to the contractual agreement, by the national government on behalf of the Company. As a consequence, the Company has to recognize at the same time an increase in the taxable profit, through the increase of the revenues, and a tax expense. Proved reserves to which Eni is entitled under PSAs are calculated so that the sale of production entitlements should cover expenses incurred by the Group to develop a field (Cost Oil) and recognize the Profit Oil set contractually (Profit Oil).
A similar scheme applies to some Service contracts.
Eni’s exploration and production activities are regulated by PSA or scheme similar in Algeria, Angola, China, Congo, Egypt, Indonesia, Libya, Mexico, Mozambique, Timor Leste in the JPDA area, Turkmenistan, certain assets in Nigeria, and Kazakhstan. Development and production activities in Iraq are regulated by a technical service contract. This contractual scheme establishes an oil entitlement mechanism and an associated risk profile similar to those applicable to PSA.
Eni’s principal oil and gas properties are described below. For further information on main activities of the year see also “Significant business portfolio”. In the discussion that follows, references to hydrocarbon production are intended to represent hydrocarbon production available for sale.
Italy
Eni’s activities in Italy are mainly deployed in the Adriatic and Ionian Seas, the Central Southern Apennines and mainland and offshore Sicily. Eni operates 24 onshore and 49 offshore productive concessions. Exploration activities have been substantially abandoned in recent years. In 2022, Italy accounted for approximately 5% of Eni’s total worldwide production of oil and natural gas.
In 2022, 33% of Eni’s domestic production came from fields in the Adriatic and Ionian Seas, 49% from the Central Southern Apennines and approximately 13% from Sicily.
In the Adriatic Sea, activities in 2022 mainly concerned maintenance and production optimization intervention at the Bonaccia, Arianna and Basil fields to recover the residual mineral potential. Decommissioning plan to plug-in depleted wells and to remove idle platforms progressed during the year in compliance with Italian Ministerial Decree 15 February 2019 “Linee guida nazionali per la dismissione mineraria delle piattaforme per la coltivazione in mare e delle infrastrutture connesse”. The decommissioning process is ongoing for the first 10 platforms.
Development activities of the Argo and Cassiopea operated gas fields (Eni’s interest 60%) progressed offshore Sicily. Start-up is expected in the first half of 2024.
In Italy, a national plan was enacted, that identifies areas in the national territory and in the territorial water where exploration and development of hydrocarbons are compatible with environmental standards and other sustainability national and local guidelines. However, development concessions that fall in areas that do not meet all the environmental and sustainability criteria can continue as long as the cost-benefit analysis of the ongoing petroleum activities yield a positive outcome. As a result of these criteria, Eni did not record any significant impact on its petroleum activities in the Country, nor any downward reserve revision. See “Risk Factors – Oil and gas activity may be subject to increasingly high levels of regulations throughout the world, which may impact our extraction activities and the recoverability of reserves”.
| 69 |
Rest of Europe
Eni’s operations in the Rest of Europe are mainly conducted in the United Kingdom and in Norway, in this latter country through Vår Energi. In 2022, the Rest of Europe accounted for 12% of Eni’s total worldwide production of oil and natural gas.
Norway. During 2022, Eni and the private equity fund HitecVision, shareholders of Vår Energi, have finalized the process of listing the investee at the local stock exchange, placing about a 16.2% interest. Following the closing Eni’s interest is 63.1%.
In 2022, Vår Energi acquired: (i) 30% and operatorship of the PL820S and PL820 SB production licenses, north of the Balder field in the North Sea. The transaction is pending government approval; (ii) the 40% stake and operatorship of the PL 917 and PL 917B production licenses, west of the Balder field, through an equity swap with Aker BP in PL 956 and PL 985 licenses. The transaction has been approved by the authorities.
Development activities mainly concerned: (i) the Johan Castberg sanctioned project with start-up expected in 2024; (ii) the Balder X sanctioned project in the PL 001 license, located in the North Sea. The Balder project scheme provides for drilling additional productive wells, to be linked to an upgraded Jotun FPSO unit that will be relocated in the area that will support the development of new discoveries near to the area through upgrading existing infrastructure. Production start-up is expected in 2024; and (iii) the Breidablikk sanctioned project with start-up in 2024. The project scheme provides for drilling production wells to be linked to existing treatment facilities in the area.
Exploration activity yielded positive results with the Lupa (Eni’s interest 31.54%), Snofonn (Eni’s interest 18.92%) and Skavl Sto (Eni’s interest 18.92%) discoveries in the Barents Sea, and the Calypso discovery (Eni’s interest 12.61%) in the Norwegian Sea.
In January, Vår Energi was awarded twelve exploration licenses (five of which are operated) following the “Awards in Predefined Areas 2022” (APA) by the Ministry of Petroleum and Energy of Norway.
United Kingdom. In the year production start-up was achieved at the J-Area with three new development wells as well as at the Jade South recent discovery by means of the linkage to the existing facilities.
Development activities mainly concerned: (i) Talbot development project was sanctioned in 2022. Drilling activities start-up are planned during 2023 with first oil in 2024; (ii) work-over program at the Douglas field; and (iii) decommissioning planned activity of the Hewett Area.
North Africa
Eni’s operations in North Africa, with Egypt being discussed separately due to the size of Eni’s reserves in the Country, are mainly conducted in Algeria, Libya and Tunisia. In 2022, North Africa accounted for 17% of Eni’s total worldwide production of oil and natural gas.
Algeria. In September 2022, signed an agreement to purchase bp’s assets in Algeria including the two gas-producing concessions In Amenas and In Salah, located in the southern Sahara Desert. Eni finalized this agreement in February 2023 and acquired a stake of 45.89% and 33.15% in the mentioned concessions, respectively.
During 2022, signed several agreements leveraging Eni’s strong relationship with the country to increase natural gas export flows to Europe as well as other decarbonization initiatives. In particular: (i) in March 2022 awarded a new PSA agreement for the Berkine South Area (Eni’s interest 75%). The project includes a fast-track development hub for oil and gas production through a synergy with existing assets in block 405b; (ii) in April 2022 signed a Memoradum of Understading to evaluate gas mineral potential and fast-track development of recent discoveries. Additional natural gas production expected from the agreed areas will increase export capacity of the Transmed pipeline. In addition, the agreement launched a study to assess technical and economic feasibility of a green hydrogen pilot project nearby the BRN gas plant; (iii) in July 2022 a new PSA agreement was signed with the partner of the Blocks 404 and 208. The agreement will support additional investments to develop mineral potential in the area and possible initiatives for the development of associated gas volumes; and (iv) in November 2022 the Solar Lab research center was launched to identify the most efficient technologies for the exploitation of solar energy in the country; as well as the activities for the construction of a 10 MW photovoltaic plant in the BRN production area started.
During the year production start-up was achieved at: (i) the Berkine North area (Eni’s interest 49%) with two gas and two oil fields. Ongoing development activities concerned the drilling and completion of four additional production wells; and (ii) the Berkine South area with two gas and two oil fields just six months after the closing a contract agreement with a fast-track development. The linkage to treatment plant and the installation of the transport facilities were completed.
Other development activities concerned: (i) production optimization by means of work-over and rig-less activities in the production area of the Blocks 403 a/d and Rom North, Blocks 401a/402a and Blocks 403 and 404; and (ii) development program of the CAFC project in the Block 405b.
Exploration activities yielded positive results with: (i) the HDLE oil and gas discovery in the Zemlet el Arbi concession; and (ii) the HDLS e RODW oil and associated gas discoveries in the Sif Fatima II. These discoveries will be put into production through fast-track development activities leveraging on the existing production facilities.
Libya. Currently, Libya represents approximately 11% of the Group’s total production. The social and political instability of the Country dates back to the revolution of 2011 that brought a change of regime and a civil war, triggering an uninterrupted period of lack of well-established institutions and recurrent events of internal conflict, clashes, disorders and other forms of civil turmoil and unrest between the two conflicting factions. In the year of the revolution, Eni’s operations in Libya were materially affected by a full-scale war, which forced the Company to shut down its development and extractive activities for almost all of 2011, with a significant negative impact on the Group’s results of operation and cash flow. In subsequent years Eni has experienced frequent disruptions to its operations, albeit on a smaller scale than in 2011, due to security threats to its installations and personnel. Since September 2020, the country had undergone a phase of stability which lasted for a large part of 2021, thanks to a pacification agreement with the aim of installing a new government freely elected by the entire population. However, the electoral process failed and the opposition between the Government of National Unity installed in Tripoli and the self-appointed National Stability Government installed in the east of the country resumed, fueling protests for a better redistribution of oil revenues and social tension. In 2022, the situation of instability and disorder determined between May and June the almost total shutdown of oil production in the eastern part of the country and the main export terminals, as well as in a dispute between the two factions relating to the top management of the NOC State Company. The force majeure affected some assets owned by Eni. Going forward, management believes that Libya's geopolitical situation will continue to represent a source of risk and uncertainty to Eni's operations in the Country and to the Group results of operations and cash flow. For further information on this matter, see “Item 3 – Risk factors – Political considerations”.
The rights of Eni to produce at its assets in Libya will expire in 2038 for Contract Areas C, in 2042 for Contract Area E, in 2043 for Contract Areas A, B and D.
In January 2023, Eni signed an agreement with the National Oil Corporation of Libya (NOC) for the development of A&E Structures, offshore Tripoli. Production is expected to start in 2026 with gas volumes destined both to the domestic market and to Europe. The project comprises construction of an onshore Carbon Capture and Storage (CCS) hub.
In November 2022 farm-out agreement with bp was ratified by relevant authority. The agreement provides for the acquisition of a 42.5% interest and operatorship by Eni in the Ghadames North, Ghadames South and Sirte offshore exploration permits.
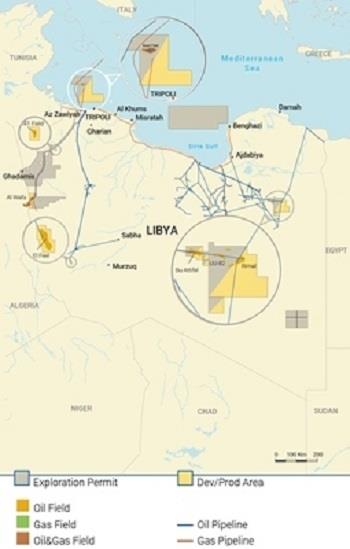
Tunisia. Exploration activities yielded positive results with the Anbar-1 exploration commitment well in the Borj El Khadra permit.
Egypt
In 2022, Egypt accounted for 22% of Eni’s total worldwide production of oil and natural gas, the largest contributor to the Company overall production level.
In 2022, the portfolio mineral interest was reloaded with: (i) the awarded of five exploration licenses as part of the Egypt International Bid Round for Petroleum Exploration and Exploitation 2021, out of which four as operator, for a total acreage of about 8,400 square kilometers. The licenses are distributed in the mining area of greatest interest to Eni, which will allow rapid developments through nearby existing plants. The operation is subjected to be ratified by the relevant authorities; (ii) the award of the operatorship of three concessions in the eastern Mediterranean Sea following the agreement with Ministry of Petroleum and the Egyptian state-owned company EGAS; (iii) a farm-in agreement in the Nargis Offshore Area with the acquisition of a 45% stake in the license; and (iv) the disposal of interests in the Ras Qattara (Eni’s interest 75%), West Abu Gharadig (Eni’s interest 45%), East Kanays (Eni’s interest 100%) and West Razzak (Eni’s interest 100%) production assets.
In April 2022 Eni signed a framework agreement with the Egyptian state-owned company EGAS to enhance gas production and LNG exports through the Damietta liquefaction plant. In January 2023 Eni signed a Memorandum of Intent (MoI) with EGAS to launch joint studies on identifying opportunities for the reduction of greenhouse gas emissions in the country's upstream sector, through initiatives that will lead to further valorisation of natural gas. In addition, during the year unitization agreement was finalized for the Sand-1 field with the North El Hammad (NEHO) concession.
Development activities concerned: (i) production optimization program in the Sinai concession; (ii) development drilling activities in the Baltim and NEHO concessions; (iii) the FID of the Meleiha Phase 2 project was sanctioned. The project was already started up in early production and the completion of the development program is expected in 2024; (iv) upgrading of the facilities in the Emry Deep and Arcadia fields as well as of the water injection facilities in the Western Desert.
Development activities of the Zohr project in the Shoruk concession concerned: (i) EPCI activities for the construction of new submarine facilities and two additional treatment unit with a capacity of 6,000 barrels/d to manage and recover production water. The construction of further three units with a capacity of 9,000 barrels/d is being studied; (ii) development drilling activities with the completion of three additional production wells with start-up in 2022.
The rights of Eni to produce at the Zohr Development Lease will expire in 2037.
As of December 31, 2022, the aggregate development costs incurred by Eni for developing the Zohr project and capitalized in the financial statements amounted to $6 billion (€5.6 billion at the EUR/USD exchange rate of December 31, 2022). Development expenditure incurred in the year were €349 million.
As of December 31, 2022, Eni’s proved reserves booked at the Zohr field amounted to 650 mmBOE.
Eni holds interest in the Damietta liquefaction plant with a capacity of 5.2 mmtonnes/y of LNG associated to approximately 283 BCF/y of feed gas.
Exploration activities yielded positive results with near-field discoveries in: (i) the Sinai production concession with the Semiramis 1X oil exploration well; (ii) the Nile Delta concession with the El Qara South-1X gas well; and (iii) in the Meleiha concessions through three oil and natural gas discovery wells. New discoveries were started up by means of the linkage to the existing facilities and already in production.
In January 2023, exploration activities yielded positive results with the Nargis-1 gas discovery in the non-operated Nargis Offshore Area. The discovery will be developed by leveraging Eni’s existing facilities.
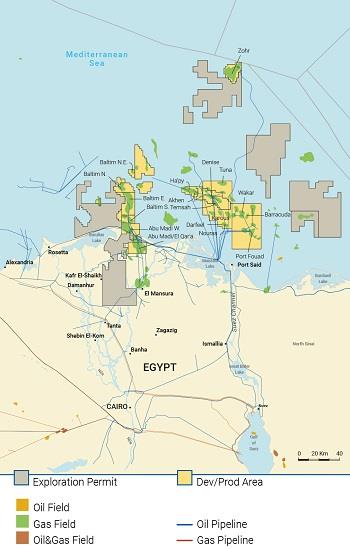
Sub-Saharan Africa
Eni’s operations in Sub-Saharan Africa are conducted mainly in Angola, Congo, Ghana, Mozambique and Nigeria. In 2022, Sub-Saharan Africa accounted for 17% of Eni’s total worldwide production of oil and natural gas.
Angola. In August 2022, Azule Energy, the equally owned joint venture by bp and Eni, started operations by combining the partners' respective assets in the Country. For further information see note 5 in Item 18 - Notes on Consolidation Financial Statements.
In 2022 production start-up was achieved at: (i) the Ndungu Early Production by hooking it up to the Ngoma FPSO; (ii) the Agogo Early Production Phase 2 in the Block 15/06 with the completion of the development activities and the installation of the required submarine facilities; and (iii) one well started up from Cuica field in the Eastern area of Block 15/06.
In July 2022, reached the final investment decision (FID) by partners of the New Gas Consortium for the development of the Quiluma and Maboqueiro fields. The project, the first non-associated gas development in the country, is planned to start-up in 2026 with an expected production plateau at 330 mmCF/d.
Development activities concerned: (i) the definition phases of the Agogo Integrated West Hub for the full development of the western Block 15/06 area by means of the Ngoma and Agogo FPSOs; (ii) the Sanha Lean Gas Connection and Booster Gas Compressor project in Block 0 increasing associated gas production to feed the A-LNG liquefaction plant; and (iii) the FEED activity of the South Ndola e Sanha-Mafumeira connector projects for the construction of transportation facilities to put in production the residual reserves in the area.
Exploration activities yielded positive results with the Ndungu-2 delineation well.
Congo. In April 2022 Eni signed a letter of intent with the Republic of Congo to strength joint operations in the upstream sector targeting to increase natural gas exports.
Development plans provide for an increase in natural gas production through fast-track projects to monetize the associated and non-associated volumes in the Marine XII block both for the domestic power generation and LNG exports. The export project consists of modular and phased commissioning of LNG floating production vessels with reduced time-to-market. Start-up is expected in 2023 with capacity of approximately 35 BCF/year and approximately 160 BCF/y in 2025.
In December, as part of the Congo LNG project, a turn-key contract was signed to build, install and commission a Floating Liquefied Natural Gas (FLNG) vessel with a capacity of 2.4 mln tonnes/year, which will pair the Tango FLNG vessel purchased earlier to speed up Eni’s development plans.
During 2022 additional development phase of the Néné-Banga field on the Marine XII block was completed with the installation of a new platform resulting production start-up.
Ivory Coast. Development activities focused on the development project of the Baleine discovery in the operated offshore CI-101 (Eni’s interest 83%) and CI-802 (Eni’s interest 90%) blocks. Management believes this field to contain a large amount of hydrocarbon. During 2022 FID of both Phase 1 and 2 development projects was sanctioned. The development of Baleine Field is phased and fast-tracked with start-up of Phase 1 in 2023 and Phase 2 at the end of 2024.
Exploration activities yielded positive results with the Baleine East 1x appraisal well.
Mozambique Eni has been present in Mozambique since 2006, following the award of the exploration license relating to gas-rich Area 4 offshore the Rovuma Block.
In 2011, Eni made the important gas discovery of Mamba. The Mamba reservoir extends through Area 4 and the adjacent Area 1 operated by TotalEnergies. In 2012, Eni made another large gas discovery at the Coral prospect, which falls entirely in Area 4.
During the exploration period, which expired in 2015, six Discovery Areas (DA) were identified. Mozambique Decree Law 02/2014 provides that individual plans of development can be submitted in respect of each DA. Under the Area 4 EPCC (Exploration and Production Concession Contract), each Plan of Development once approved by the Government of Mozambique entitles the Concessionaires to develop and to produce in a term of 30 years, with an extension option pursuant to the terms of the Area 4 EPCC and the applicable Petroleum Law.
Following two separate transactions occurred respectively in 2013 and in 2017, Eni divested to CNPC and ExxonMobil indirect interests of 20% and 25% respectively in the discoveries of Area 4, by diluting its participating interest in Mozambique Rovuma Venture SpA, the operator of Area 4. Post transactions, Eni retains a 25% indirect interest in the Area 4 concession. The other concessionaires of Area 4 are the state-owned oil company ENH, Galp and Kogas, each with a 10% working interest.
In 2017, the concessionaires of Area 4 made the final investment decision to develop the reserves of the Coral discovery, sanctioning the Coral South project. The project provided for the installation of the Coral Sul Floating Liquefied Natural Gas (FLNG) vessel for the treatment, liquefaction, storage and export, with a capacity of approximately 3.4 mmtonnes/y of LNG, feed by six subsea wells. The vessel was moored on the field in the first half of 2022 and commissioning started up.
In November, the first loading of liquefied natural gas produced from the Coral gas field was shipped from the Coral Sul Floating Liquefied Natural Gas (FLNG) vessel, marking the first commercial production of Area 4.
Additional development phases to put into production the Area 4 reserves, are being evaluated by the delegated operators of Area 4 (Eni and ExxonMobil), which are expected to include offshore development options, based on the expertise achieved with the Coral South FLNG project, and onshore activities also through synergies with Area 1.
In December 2022, Eni was awarded a 60% interest and operatorship of the A6-C exploration block following the participation in the 6th Bid Round. The completion of the relevant oil contract is expected in early 2023.
Nigeria. In August 2022 Eni finalized a twenty-year extension of the PSC agreement for the operated OML 125 block. In addition, Eni signed an agreement with the State company NNPC to recover past receivables related to the OML 125 development and production activities, starting in 2023.
Development activities at the operated OMLs 60, 61, 62 and 63 blocks concerned workover and rigless activities to mitigate mature fields decline as well as asset integrity program of the facilities and the installation of new compressor units to monetize additional natural gas volumes. During the year, additional production well was started up by means of the completion of drilling activity.
Development activities of the SPDC joint venture (Eni’s interest 5%) operated production areas concerned: (i) restore the Trans Niger Pipeline (TNP) integrity that had been compromised by external interference from third parties. The TNP is the main trunk oil line to the Bonny export terminal. The TNP line was shut down for almost 2022 to address illegal tapping resulting from bunkering activities and the operation of illegal refineries.; (ii) five new production gas wells in the Kolo Creek and Gbaran production areas have been linked, and five oil wells have been drilled in the Forcados area to increase oil production; (iii) workover and rigless programs to mitigate mature natural fields decline; and (iv) asset integrity activities.
In the participated OML 118 block development activities focused on the drilling of five development wells, of which three wells were completed. Start-up was achieved with one production and one injection wells.
Eni holds a 10.4% interest in the Nigeria LNG Ltd joint venture, which runs the Bonny liquefaction plant located in the Eastern Niger Delta. The plant has a production capacity of 22 mmtonnes/y of LNG associated with approximately 1,270 BCF/y of feed gas. Natural gas supplies to the plant are currently provided under a gas supply agreement from the SPDC JV (Eni’s interest 5%), TEPNG JV and the NAOC JV (Eni’s interest 20%). In 2022, the Bonny liquefaction plant processed approximately 830 BCF. LNG production is sold under long-term contracts and exported mainly to the United States, Asian and European markets by the Bonny Gas Transport fleet, wholly owned by Nigeria LNG, as well as is sold FOB by means of the fleet owned by third parties.
The acquisition of the OPL 245 property made by Eni in 2011 is the subject of certain judicial proceedings described in “Item 18 – consolidated financial statement – Note 28”. The license expired in May 2021. Eni filed a request for the conversion of the license into a mining permit (OML) in accordance to contractual terms and having complied with all conditions and deadlines to start the development of the prospect reserves.
Kazakhstan
Eni’s operations in Kazakhstan comprised the Kashagan and the Karachaganak fields. In 2022, Kazakhstan accounted for 8% of Eni’s total worldwide production of oil and natural gas.
Kashagan. Eni holds a 16.81% working interest in the North Caspian Sea Production Sharing Agreement (NCSPSA). The NCSPSA defines terms and conditions for the exploration and development of the Kashagan field, that was discovered in the Northern section of the contractual area in the year 2000 in an area extending for 4,600 square kilometers. Management believes this field to contain a large amount of hydrocarbon resources, which are expected to be developed in phases. The NCSPSA expires in 2041.
In addition to Eni, the partners of the Consortium are the Kazakh national oil company, KazMunayGas, with a participating interest of 16.88%, the international oil companies TotalEnergies, Shell and ExxonMobil, each with a participating interest of 16.81%, CNPC with 8.33%, and Inpex with 7.56%.
In 2022, production at the Kashagan field averaged 47 KBBL/d of liquids and 39 mmCF/d of natural gas net to Eni. Gas volumes undergo a treatment process and then are delivered to the national gas marketing and transportation company (KazTransGas); a part of the gas volumes is utilized as fuel gas. A part of the raw gas volumes (approximately 50%) is re-injected in the reservoir. The liquid production is stabilized at the Bolashak facilities and exported to Western markets through the Caspian Pipeline Consortium (Eni’s interest 2%) and the Atyrau-Samara pipeline.
Current development plans envisage a phased increase in the production capacity up to 450 KBBL/d by upgrading the existing associated gas compression facilities. The ongoing activities, sanctioned in 2020, mainly concerned: (i) increasing gas reinjection capacity by means of upgrading the existing facilities. Activities were completed during 2022; and (ii) delivering a part of gas volumes to a new onshore treatment unit operated by a third party, currently under construction.
Management believes that significant capital expenditure will be required in case the partners of the venture would sanction a second development phase and possibly other additional phases. Eni will fund those investments in proportion to its participating interest of 16.81%. However, taking into account that future development expenditures will be incurred over a long-time horizon, management does not expect any material impact on the Company’s liquidity or its ability to fund these capital expenditures.
As of December 31, 2022, Eni’s proved reserves booked for the Kashagan field amounted to 587 mmBOE, down from 633 mmBOE in 2021, due to price effects.
As of December 31, 2022, the aggregate costs incurred by Eni for the Kashagan project capitalized in the financial statements amounted to $10.1 billion (€9.5 billion at the EUR/USD exchange rate of December 31, 2022). This capitalized amount included: (i) $7.5 billion relating to expenditures incurred by Eni for the development of the oil field; and (ii) $2.6 billion relating primarily to accrued finance charges and expenditures for the acquisition of interests in the Consortium from exiting partners upon exercise of pre-emption rights in previous years. Cost incurred in the year were €82.6 million.
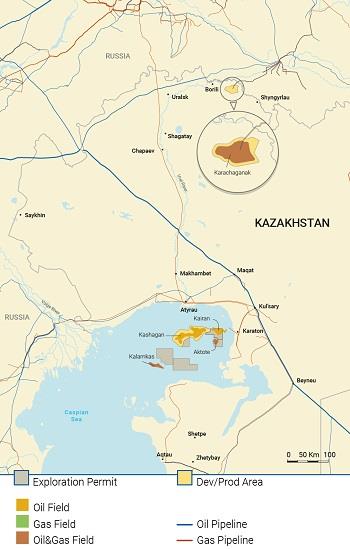
Karachaganak. Located onshore in West Kazakhstan, Karachaganak is a liquid and gas field. Operations are conducted by the Karachaganak Petroleum Operating consortium (KPO) and are regulated by a PSA that expires in 2037. Eni and Shell are co-operators of the venture. Eni’s interest in the Karachaganak project is 29.25%.
In 2022, production of the Karachaganak field averaged 40 KBBL/d of liquids and 129 mmCF/d of natural gas net to Eni. This field is producing liquids from the deeper layers of the reservoir. The gas is delivered (about 45%) to the Russian gas plant of Orenburg; management believes this transaction does not violate the current sanction regime imposed to Russia following the military invasion of Ukraine. The remaining gas volumes are utilized for re-injection in the higher layers of the reservoir and as fuel gas. Almost the entire liquid production is stabilized at the Karachaganak Processing Complex (KPC) and exported to Western markets through the Caspian Pipeline Consortium (Eni’s interest 2%) and the Atyrau-Samara pipeline.
During 2022 within the development plan of the Karachaganak field to increase gas re-injection treatment expansion in several phases, the installation and start-up of a fourth gas compression unit was completed. Ongoing development phases, sanctioned in 2020, include: (i) the drilling of three additional injection wells; (ii) a new injection line; and (iii) the installation of a fifth compression gas unit. Start-up is expected in 2024. In addition, in 2022 the last phase for the installation of a sixth compression unit was sanctioned. Start-up is expected in 2026.
As of December 31, 2022, Eni’s proved reserves booked for the Karachaganak field amounted to 354 mmBOE, lower than 399 mmBOE in 2021, due to price effects.
As of December 31, 2022, the aggregate costs incurred by Eni for the Karachaganak project capitalized in the financial statements amounted to $4.7 billion (€4.4 billion at the EUR/USD exchange rate of December 31, 2022). Cost incurred in the year were €189 million.
Rest of Asia
Eni’s operations in the Rest of Asia are mainly conducted in Indonesia, Iraq and the United Arab Emirates. In 2022, Eni’s operations in the Rest of Asia accounted for approximately 10% of its total worldwide production of oil and natural gas.
Indonesia. Development activities concerned: (i) the Merakes East project in the operated East Sepinggan block (Eni’s interest 65%), in the deep offshore eastern Kalimantan. The project was approved with the completion of the plan program definition; (ii) the Maha project in the operated West Ganal offshore block (Eni’s interest 40%). Plan program definition is ongoing; and (iii) upgrading activities of the gas compression facilities in the operated Muara Bakau block (Eni’s interest 55%).
Iraq. Development activities comprised the execution of an additional development phase of the ERP (Enhanced Redevelopment Plan) at the Zubair field (Eni’s interest 41.56%), which will allow to achieve a production contractual plateau of 700 KBBL/d. The production capacity and main facilities to treat the production plateau target have already been installed. Activities to increase treatment capacity are ongoing. The field reserves will be progressively put into production by drilling additional productive wells over the next few years by means of the collection facilities expansion and the completion of the water reinjection wells. In particular, projects ensuring water availability to maintain reservoir pressurization are being implemented.
Myanmar. Eni transferred 90% participation interest and operatorship of the onshore exploration Block RSF-5 to Myanmar Petroleum Exploration & Production (MPEP).
Pakistan. In December 2022 Eni finalized the divestment the entire upstream activity in the Country.
Qatar. In December 2022, Eni closed the acquisition of a 3% interest in the North Field East LNG project in Qatar.
United Arab Emirates. In March 2023 Eni signed a strategic agreement with ADNOC to explore potential opportunities in the areas of renewable energy, blue and green hydrogen, carbon dioxide capture and storage (CCS), in the reduction of GHG and methane gas emissions, energy efficiency, routine gas flaring reduction and the Global Methane Pledge, to support global energy security and a sustainable energy transition.
Development activities concerned: (i) the Dalma Gas Development sanctioned project in the offshore Ghasha concession (Eni’s interest 25%) and the Umm Shaif Long-Term Development Phase 1 sanctioned project in the Umm Shaif concession (Eni’s interest 10%); and (iii) ramp-up production program of the Mahani field in the onshore Area B concession (Eni’s interest 50%).
Exploration activities yielded positive results in the operated Block 2 (Eni’s interest 70%) with the XF-002 well and DM-002 appraisal well, in offshore Abu Dhabi.
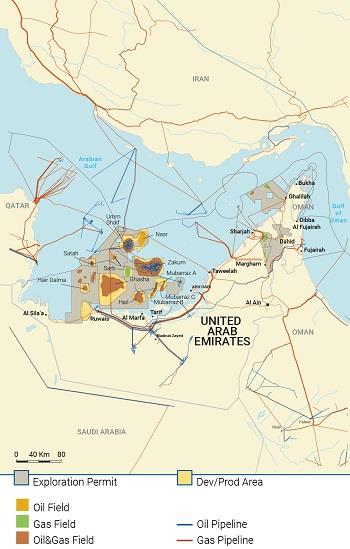
Americas
Eni’s operations in Americas are conducted mainly in Mexico, United States and Venezuela. In 2022, Eni’s operations in the Americas area accounted for approximately 8% of its total worldwide production of oil and natural gas.
Mexico. The development activities mainly concerned the full field development program of the operated license Area 1 (Eni’s interest 100%), already in production, with the completion of the first development phase. In particular: (i) in February 2022 start-up of the Miamte FPSO in the Miztón field with production ramp-up in the area and oil export from April 2022. During the year drilling production wells and water injection wells were completed; and (ii) in March 2022 start-up of the Amoca WHP-1 platform. Drilling activities are ongoing.
The development plan includes a second phase with the construction and installation of additional two platform in the Amoca and Tecoalli fields.
In March 2023 exploration activities yielded positive results with the Yatzil discovery in the Block 7 (Eni operator with a 45% interest).
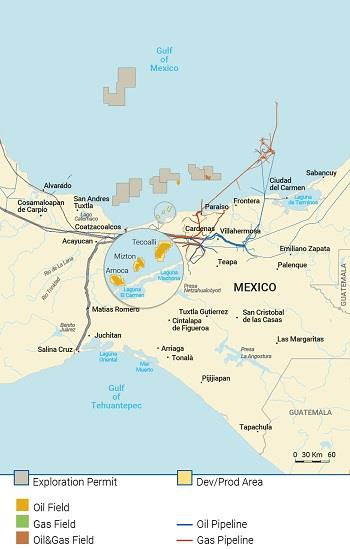
United States. Eni holds: (i) interests in 46 exploration and production blocks in the Gulf of Mexico, of which 15 as operator; (ii) interests in 27 operated production blocks and interest in 1 non-operated block in Alaska; and (iii) Alliance area in Texas.
Venezuela. In 2022, Eni’s production of oil and natural gas averaged 53 KBOE/d and accounted for approximately 4% of Eni’s total production. Eni’s production comes mainly from the Perla gas field (Eni’s interest 50%). Other petroleum interests held by Eni in the Country comprise the Corocoro field (Eni’s interest 26%) in the Gulf de Paria and the Junín 5 oil field (Eni’s interest 40%) in the Orinoco Oil Belt. These latter interests are immaterial to the Company. The operations in the Country has been negatively affected by a difficult operational environment mainly due to the deteriorated economic and financial outlook of the Country that has been made worse by the U.S. sanctions regime, thus limiting the ability of the Company to collect the revenues from the sale of its equity production at the Perla field. Due to a partial lifting of US sanctions on the trade of Venezuelan crude oil, Eni was able in 2022 to obtain the reimbursement in-kind of a portion of its trade receivables, so to partly offset the increase of the year due to the current natural gas production and revenues. However, there is still a great deal of uncertainty about any possible evolution of the US sanctions against Venezuela and Eni’s ability to recover its outstanding receivables.
For further information on this matter, see “Item 3 — Risk factors – Political considerations”.
Capital expenditures
See “Item 5 – Liquidity and capital resources – Capital expenditures by segment”
Disclosure pursuant to Section 13(r) of the Exchange Act
The Iran Threat Reduction and Syria Human Rights Act of 2012 (ITRA) created a new subsection (r) in Section 13 of the Exchange Act which requires a reporting issuer to provide disclosure if the issuer or any of its affiliates engaged in certain enumerated activities relating to Iran, including activities involving the Government of Iran. In accordance with our general business principles and Code of Ethics, Eni seeks to comply with all applicable international trade laws including applicable sanctions and embargoes. The activities referred to below have been conducted outside the U.S. by non-U.S. Eni subsidiaries. For purposes of the disclosure below, amounts have been converted into U.S. dollars at the average or spot exchange rate, as appropriate.
In 2017, Eni fully recovered the overdue trade receivable owed by Iranian state- owned companies relating to the cost recovery of past projects due to enactment of the agreements signed in 2016. There were no more outstanding receivables towards Iran’s national oil companies as of December 31, 2022. Eni retains at December 31, 2022 a residual payable amounting to approximately $1.4 million, which will be settled upon de-registration of our local branch.
Global Gas & LNG Portfolio engages in the wholesale activity of supplying and selling natural gas via pipeline and LNG, and the international transport activity. It also comprises gas trading activities targeting to both hedge and stabilize the Group commercial margins and optimize the gas asset portfolio. In 2022, Eni’s worldwide sales of natural gas amounted to 60.52 BCM. Sales in Italy amounted to 30.67 BCM, while sales in European markets were 27.41 BCM that included 2.43 BCM of gas sold to certain importers to Italy.
The business results of operations in 2022 and its strategy are described in “Item 5 – Group results of operations” and “Item 5 – Management’s expectations of operations.”
Supply of natural gas
In 2022, Eni subsidiaries’ total supply of natural gas was 60.59 BCM, decreased by 10.39 BCM, or 14.6% from 2021. Gas volumes supplied outside Italy (57.19 BCM from consolidated companies), imported in Italy or sold outside Italy, represented approximately 94% of total supplies, decreased by 10.20 BCM, or 15.1% compared to the previous year, due to lower volumes purchased in Russia (down by 13.01 BCM), in Norway (down by 0.77 BCM), in the UK (down by 0.74 BCM), in Libya (down by 0.56 BCM) and Indonesia (down by 0.45 BCM), partially offset by higher purchases in Algeria (up by 1.74 BCM) and in the other European markets, in particular: France, Germany and Spain (the overall increase amounted to 5.72 BCM). Supplies in Italy (3.40 BCM) were down by 5.3% from 2021.
In 2022, main gas volumes from equity production derived from: (i) Eni fields located in the British and Norwegian sections of the North Sea (2.5 BCM); (ii) Italian gas fields (2.1 BCM); (iii) Indonesia (0.8 BCM); (iv) Libyan fields (0.6 BCM). Supplied gas volumes from equity production were approximately 6 BCM representing around 10% of total volumes available for sale.
The table below sets forth Eni’s purchases of natural gas by source for the periods indicated.
|
Natural gas supply |
2022 |
2021 |
2020 |
|||||
|
|
(BCM) | |||||||
|
Italy |
3.40 |
3.59 |
7.47 |
|||||
|
Outside Italy |
57.19 |
67.39 |
54.69 |
|||||
|
Russia |
17.20 |
30.21 |
22.49 |
|||||
|
Algeria (including LNG) |
11.86 |
10.12 |
5.22 |
|||||
|
Libya |
2.62 |
3.18 |
4.44 |
|||||
|
the Netherlands |
1.39 |
1.41 |
1.11 |
|||||
|
Norway |
6.75 |
7.52 |
7.19 |
|||||
|
the United Kingdom |
1.91 |
2.65 |
1.62 |
|||||
|
Indonesia (LNG) |
1.36 |
1.81 |
1.15 |
|||||
|
Qatar (LNG) |
2.56 |
2.30 |
2.47 |
|||||
|
Other supplies of natural gas |
8.11 |
2.39 |
5.24 |
|||||
|
Other supplies of LNG |
3.43 |
5.80 |
3.76 |
|||||
|
Total supplies of subsidiaries |
60.59 |
70.98 |
62.16 |
|||||
|
Withdrawals from (input to) storage |
0.00 |
(0.86 |
) |
0.52 |
||||
|
Network losses, measurement differences and other changes |
(0.07 |
) |
(0.04 |
) |
(0.03 |
) | ||
|
Volumes available for sale of Eni’s subsidiaries |
60.52 |
70.08 |
62.65 |
|||||
|
Volumes available for sale of Eni’s affiliates |
0.00 |
0.37 |
2.34 |
|||||
|
Total volumes available for sale |
60.52 |
70.45 |
64.99 |
Sales of natural gas
Eni is selling gas to wholesale markets in Italy and in a number of European countries. The wholesale market includes sales to large accounts (industrials and thermoelectric utilities) and on European spot markets.
In 2022, natural gas sales amounted to 60.52 BCM (including Eni’s own consumption, Eni’s share of sales made by equity-accounted entities), representing a decrease of 9.93 BCM, or 14.1% from the previous year, due to lower sales in Italy and abroad. Sales in Italy (30.67 BCM) decreased by 16.8% from 2021, due to lower sales to hub,to industrial and wholesalers segments. Sales in the European markets amounted to 24.98 BCM, a slight decrease of 1% or 0.14 BCM from 2021.
Sales to long-term buyers were 2.43 BCM; down by 15.9% compared to the previous year due to the lower availability of Libyan output.
Sales in the Extra European markets (2.44 BCM) decreased by 3.12 BCM or 56.1% due to lower LNG sales in the Asian markets.
The tables below set forth sales of natural gas by principal market for the periods indicated.
|
Natural gas sales by entities |
2022 |
2021 |
2020 |
||
|
|
(BCM) | ||||
|
Total sales of subsidiaries |
60.52 |
69.99 |
62.58 |
||
|
Italy (including own consumption) |
30.67 |
36.88 |
37.30 |
||
|
Rest of Europe |
27.41 |
27.69 |
21.54 |
||
|
Outside Europe |
2.44 |
5.42 |
3.74 |
||
|
Total sales of Eni's affiliates (Eni's share) |
0.00 |
0.46 |
2.41 |
||
|
Rest of Europe |
0.00 |
0.32 |
1.46 |
||
|
Outside Europe |
0.00 |
0.14 |
0.95 |
||
|
Worldwide gas sales |
60.52 |
70.45 |
64.99 |
|
Natural gas sales by market |
2022 |
2021 |
2020 |
||
|
(BCM) |
|||||
|
ITALY |
30.67 |
36.88 |
37.30 |
||
|
Wholesalers |
12.22 |
13.37 |
12.89 |
||
|
Italian gas exchange and spot markets |
9.31 |
12.13 |
12.73 |
||
|
Industries |
2.89 |
4.07 |
4.21 |
||
|
Power generation |
0.83 |
0.94 |
1.34 |
||
|
Own consumption |
5.42 |
6.37 |
6.13 |
||
|
INTERNATIONAL SALES |
29.85 |
33.57 |
27.69 |
||
|
Rest of Europe |
27.41 |
28.01 |
23.00 |
||
|
Importers in Italy |
2.43 |
2.89 |
3.67 |
||
|
European markets |
24.98 |
25.12 |
19.33 |
||
|
Iberian Peninsula |
3.93 |
3.75 |
3.94 |
||
|
Germany/Austria |
3.58 |
0.69 |
0.35 |
||
|
Benelux |
4.24 |
3.47 |
3.58 |
||
|
United Kingdom/Northern Europe |
1.92 |
2.65 |
1.62 |
||
|
Turkey |
7.62 |
8.50 |
4.59 |
||
|
France |
3.62 |
5.80 |
5.01 |
||
|
Other |
0.07 |
0.26 |
0.24 |
||
|
Extra European markets |
2.44 |
5.56 |
4.69 |
||
|
WORLDWIDE GAS SALES |
60.52 |
70.45 |
64.99 |
||
The LNG business
Eni LNG business can count currently on a portfolio of contracted long-term supplies mainly from: Qatar, Egypt, Nigeria and Indonesia. In the plan period, Eni intends to develop its LNG business leveraging on the integration with the E&P segment and the valorization of the equity gas. Final markets of that gas include Europe and Asia. The business’s profitability will be also driven by enhancing the commercial presence in premium markets and continuing integration with trading activities.
|
LNG sales |
2022 |
2021 |
2020 |
||
|
|
(BCM) | ||||
|
Europe |
7.0 |
5.4 |
4.8 |
||
|
Extra European markets |
2.4 |
5.5 |
4.7 |
||
|
9.4 |
10.9 |
9.5 |
Eni has transport rights on a large European network of integrated infrastructures for transporting natural gas, which links key consumption markets with the main producing areas (Russia, Algeria, the North Sea, including the Netherlands and Norway, and Libya). Eni has contracted the transport capacity under ship-or-pay contracts, which are similar to take-or-pay contracts.
The main assets of Eni’s transport activities are provided in the table below.
|
International Transport infrastructure Route |
|||||||||
|
Lines |
Total length |
Diameter |
Transport capacity |
Compression stations |
|||||
|
(units) |
(km) |
(inch) |
(BCM/y) |
(No.) |
|||||
|
TTPC (Oued Saf Saf-Cap Bon) |
2 lines of km 370 |
740 |
48 |
34.3 |
5 |
||||
|
TMPC (Cap Bon-Mazara del Vallo) |
5 lines of 155 |
775 |
20/26 |
33.5 |
|||||
|
GreenStream (Mellitah-Gela) |
1 line of km 516 |
516 |
32 |
11.5 |
1 |
||||
|
Blue Stream (Beregovaya-Samsun) |
2 lines of km 387 |
774 |
24 |
16.0 |
1 |
||||
International transport activities
The TTPC pipeline, 740-kilometer long, is made up of two lines that are each 370-kilometers long with a transport capacity of 34.3 BCM/y and five compression stations. This pipeline transports natural gas from Algeria across Tunisia from Oued Saf Saf at the Algerian border to Cap Bon on the Mediterranean coast where it links with the TMPC pipeline.
The TMPC pipeline for the import of Algerian gas is 775-kilometer long and consists of five lines that are each 155-kilometers long with a transport capacity of 33.5 BCM/y. It crosses the Sicily Channel from Cap Bon to Mazara del Vallo in Sicily, the point of entry into the Italian natural gas transport system.
The GreenStream pipeline, jointly-owned with the Libyan National Oil Corporation, started operations in October 2004 for the import of Libyan gas produced at the Eni operated fields of Bahr Essalam and Wafa. It is 516-kilometers long with a transport capacity of 11.5 BCM/y crossing the Mediterranean Sea from Mellitah on the Libyan coast to Gela in Sicily, the point of entry into the Italian natural gas transport system.
The Blue Stream underwater pipeline (water depth greater than 2,150 meters) links the Russian coast to the Turkish coast of the Black Sea. This pipeline is 774-kilometer long on two lines and has transport capacity of 16 BCM/y. It is part of a joint venture to sell gas produced in Russia on the Turkish market.
See “Risks in connection with the conflict between Russia and Ukraine” in the Risk factors section for further information.
Capital expenditures
See “Item 5 – Liquidity and capital resources – Capital expenditures by segment”.
Refining & Marketing
Eni’s Refining & Marketing business engages in the supply and refining of crude oil to produce a large slate of fuels and other refined products and in the marketing of fuels primarily in Italy and in selected European markets. In Italy, Eni is the largest refining and marketing operator in terms of capacity and market share. The Company operations are fully integrated through refining, supply, logistics and marketing in order to maximize cost efficiencies and operational effectiveness.
The Company also engages in the production of bio-fuels inVenice and Gela biorefineries, where sustainable bio-feedstock are processed.
The business results depend heavily on trends in refining margins, i.e. the spread between the cost of the oil feedstock and the price of the refined products obtained from the crude processing.
In 2022, the Standard Eni Refining Margin reported an average of 8.5 $/barrel vs. negative values of the comparative periods. Refining margins increased materially driven by a strong rebound in demand for all kinds of refined products due to the reopening of the economy and bottlenecks in the refining system.
The business results of operations in 2022 and its strategy are described in “Item 5 – Group results of operations” and “Item 5 – Management’s expectations of operations”.
Supply
In 2022, a total of 19.15 mmtonnes of crude were purchased (compared with 18.85 mmtonnes in 2021), of which 5.02 mmtonnes by equity crude oil. The breakdown by geographic area was the following: approximately 36% of purchased crude came from Central Asia, 18% from North Africa, 17% from the Middle East, 11% from Italy, 6% from West Africa, 5% from Russia14, 3% from North Sea and 4% from other areas.
Ref ining
In 2022, Eni refinery capacity (balanced with conversion capacity) was approximately 26.4 mmtonnes (equal to 528 KBBL/d), with a conversion index of 42%. Conversion index is a measure of refinery complexity. The higher the index, the wider the range of crude qualities and feedstock that a refinery is able to process thus enabling refineries to benefit from the cost economies arising from the discount – versus the benchmark – at which certain qualities of crude (particularly the heavy ones) may be supplied. Eni’s 100% owned refineries have a balanced capacity of 18.4 mmtonnes (equal to 368 KBBL/d), with a 38% conversion index. In 2022, Eni’s refineries throughputs in Italy and outside Italy were 18.84 mmtonnes. The average refinery utilization rate, ratio between throughputs and refinery capacity, is 79%.
14 After the first quarter of 2022, following the Russia's military aggression of Ukraine, Eni interrupted Russian crude oil purchase from cargo market. During 2022, the PCK refinery continued to supply Ural crude oil through Druzbha pipeline. Russian crude oil was replaced by volumes from Central Asia and North Africa.
|
Refining system in 2022 |
|
Ownership |
Balanced refining capacity |
Utilization rate |
Conversion index (2) |
||||
|
(%) |
(KBBL/d) |
(%) |
(%) |
||||
|
Wholly-owned refineries |
368 |
72 |
38 |
||||
|
Italy |
|||||||
|
Sannazzaro |
100 |
180 |
81 |
40 |
|||
|
Taranto |
100 |
104 |
70 |
56 |
|||
|
Livorno |
100 |
84 |
55 |
11 |
|||
|
Partially owned refineries |
160 |
91 |
51 |
||||
|
Italy |
|||||||
|
Milazzo |
50 |
100 |
92 |
60 |
|||
|
Germany |
|||||||
|
Vohburg/Neustadt (Bayernoil) |
20 |
41 |
86 |
36 |
|||
|
Schwedt |
8.33 |
19 |
101 |
31 |
|||
|
Total |
|
528 |
79 |
42 |
|
(1) Including 20% share in ADNOC Refining, balanced refining capacity amounted to 691 KBBL/d. |
|||||||
|
(2) Conversion index: catalytic cracking equivalent capacity/topping capacity (%wt). |
|||||||
Italy
Eni’s refining system in Italy is composed of the wholly-owned refineries of Sannazzaro, Livorno and Taranto, as well as its 50% stake in the Milazzo refinery in Sicily. Eni’s refineries operate to maximize asset value according to market conditions and the integration with marketing activities.
The Sannazzaro refinery has a balanced capacity of 180 KBBL/d and a conversion index of 40%. Located in the Po Valley, in the center of the Northern Italy, Sannazzaro is one of the most efficient refineries in Europe. The high flexibility and conversion capacity of this refinery allows it to process a wide range of feedstock. The main equipments in the refinery are: two primary distillation columns and two associated vacuum units, three desulphurization units, a fluid catalytic cracker (FCC), two hydrocrackers (HdC), two reforming units, a visbreaking conversion unit integrated with a gasification producing a syngas used in a combined cycle power generation.
The Taranto refinery has a balanced capacity of 104 KBBL/d and a conversion index of 56%. Taranto has a strong market position due to the fact that is the only refinery in Southern Continental Italy, and is upstream integrated with the Val d’Agri (Eni 61%) and Tempa Rossa fields in Basilicata through a pipeline. The main equipments are a topping-vacuum unit, a residue hydrocracking and a gasoil hydrocracking unit, a platforming unit and two desulphurization units.
The Livorno refinery, with a balanced refining capacity of 84 KBBL/d and a conversion index of 11%, is dedicated to the production of lubricants and specialties. The refinery is connected by pipeline to a depot in Florence (Calenzano). The refinery has a topping-vacuum unit, a platforming unit, two desulphurization units and a de-aromatization unit (DEA) – for the production of fuels; a propane de-asphalting (PDA), aromatics extraction and de-waxing units, for the production of base oils; a blending and filling plant – for the production of finished lubricants.
The Milazzo refinery (Eni 50%) has a balanced capacity of 200 KBBL/d and a conversion index of 60%. Located in Sicily, Milazzo is mainly dedicated to export and to the supply of Italian coastal depots. The main equipments in the refinery are: two primary distillation columns and a vacuum unit, two desulphurization units, a fluid catalytic cracker (FCC), one hydrocracker (HdC), one reforming unit and one LC fining (ebullated bed residue conversion).
Outside Italy
In Germany, Eni owns an interest of 8.33% stake in the Schwedt refinery (PCK) and an interest of 20% in the Vohburg and Neustadt refineries (Bayernoil). Eni’s refining capacity in Germany is 60 KBBL/d to supply Eni’s distribution network in the country.
|
Biorefineries |
|
Ownership share |
Capacity (2022) |
Throughput (2022) |
|||
|
(%) |
(mmtonnes/y) |
(mmtonnes/y) |
|||
|
Wholly-owned |
|||||
|
Venezia |
100 |
0.4 |
0.2 |
||
|
Gela |
100 |
0.7 |
0.4 |
||
|
Total biorefineries |
|
1.1 |
0.6 |
Eni fully owns two biorefineries in Italy, specifically in Venice and Gela.
In Venice biorefinery biofuels production started in June 2014, after the conversion of the existing oil-based refinery that was shut down at the same time. The biorefinery has processing capacity of 0.4 mmtonnes/y, leveraging on the Ecofining TM proprietary technology to transform biofeedstock (both vegetable oil and waste and residues) in hydrogenated bio-fuels.
Gela refinery is located in the Southern coast of Sicily. In March 2014 the traditional refinery was shut-down and in 2017 the conversion project obtained the official authorization to proceed with the transformation into a biorefinery (the environmental impact assessment and authorization (VIA/AIA) issued by the Italian Ministry of the Environment and the Ministry of Cultural Heritage. In August 2019, Eni started-up the biorefinery equipped with the EcofiningTM technology, developed and licensed by Eni, to produce HVO from vegetable oil and waste and residues feedstocks, such as used cooking oil and animal fat. The plant properties together with a strong supply strategy allow the production of HVO in compliance with the last regulatory constraints in terms of GHG emissions reduction, considering the whole life cycle of the product . In March 2021, the Biomass Treatment Unit (BTU) has been started up to expand the range of feedstocks to be processed by the plant, allowing the replacement of palm oil with more sustainable raw materials.
In October 2022, Eni completed the phase-out of palm oil as feedstock supply in both biorefineries, with it fully replaced by sustainable raw materials.
The table below sets forth Eni’s sales of refined products by distribution channel for the periods indicated.
|
Availability of refined products |
2022 |
2021 |
2020 |
|||||
|
|
(mmtonnes) | |||||||
|
ITALY |
||||||||
|
Refinery throughputs |
||||||||
|
At wholly-owned refineries |
13.25 |
14.01 |
12.72 |
|||||
|
Less input on account of third parties |
(1.70 |
) |
(1.71 |
) |
(1.75 |
) | ||
|
At affiliated refineries |
4.57 |
4.21 |
3.85 |
|||||
|
Refinery throughputs on own account |
16.12 |
16.51 |
14.82 |
|||||
|
Consumption and losses |
(1.11 |
) |
(1.11 |
) |
(0.97 |
) | ||
|
Products available for sale |
15.01 |
15.40 |
13.85 |
|||||
|
Purchases of refined products and change in inventories |
7.02 |
7.38 |
7.18 |
|||||
|
Products transferred to operations outside Italy |
(0.40 |
) |
(0.67 |
) |
(0.66 |
) | ||
|
Consumption for power generation |
(0.31 |
) |
(0.31 |
) |
(0.35 |
) | ||
|
Sales of products |
21.32 |
21.80 |
20.02 |
|||||
|
Biorefinery throughputs |
0.54 |
0.67 |
0.71 |
|||||
|
OUTSIDE ITALY |
||||||||
|
Refinery throughputs on own account |
2.72 |
2.27 |
2.18 |
|||||
|
Consumption and losses |
(0.19 |
) |
(0.18 |
) |
(0.17 |
) | ||
|
Products available for sale |
2.53 |
2.09 |
2.01 |
|||||
|
Purchases of finished products and change in inventories |
3.54 |
3.41 |
3.39 |
|||||
|
Products transferred from Italian operations |
0.40 |
0.67 |
0.66 |
|||||
|
Sales of products |
6.47 |
6.17 |
|
6.06 |
||||
|
Refinery throughputs on own account |
18.84 |
18.78 |
17.00 |
|||||
|
of which: refinery throughputs of equity crude on own account |
5.02 |
3.86 |
|
3.55 |
||||
|
Total sales of refined products |
27.79 |
27.97 |
26.08 |
|||||
|
Crude oil sales |
0.21 |
0.60 |
0.67 |
|||||
|
TOTAL SALES |
28.00 |
28.57 |
|
26.75 |
In 2022, Eni’s refining throughputs on own account in Europe were 18.84 mmtonnes, substantially in line with 2021.
In Italy, the refinery throughputs (16.12 mmtonnes) down by 2.4% from 2021 following lower volumes processed at the Livorno refinery due to refinery shutdown in first half 2022, partly offset by higher volumes processed at the Milazzo refinery due to the maintenance and upset occurred in 2021.
Outside Italy, Eni’s refining throughputs on own account were 2.72 mmtonnes, up by approximately 450 ktonnes or 19.8% due to higher volumes processed in Germany. Total throughputs in wholly-owned refineries were 13.25 mmtonnes, down by 0.76 mmtonnes or 5.4% compared with 2021.
The refinery utilization rate, ratio between throughputs and refinery capacity, is 79%.
Approximately 26.8% of processed crude was supplied by Eni’s Exploration & Production segment, up 21% from 2021.
In 2022, biorefineries throughput has been 0.54 mmtonnes, 0.12 mmtonnes less compared to 2021, due to the shutdown of Gela biorefinery occurred in the first months of the year, partially offset by the higher Venice biorefinery throughputs.
Logistics
Eni is a leading operator in the Italian oil and refined products storage and transportation business.
Oil and refined products are transported: (i) by sea through spot and long-term contracts of tanker ships; and (ii) inland through a proprietary pipeline and depots network directly operated.
In particular, Eni owns and operates an integrated infrastructure consisting of 15 directly managed depots and one managed through the subsidiary Petroven, 100% owned since December 2019.
Eni also owns a network of oil and refined products pipelines extending approximately 1.156 kilometers operating. Eni logistic model is organized in four operative management (Northern depots, Central depots, Southern depots and LPG and Pipeline) operating in handling and storage of the product flows in order to guarantee high safety, asset integrity and technical standards (HSE e asset integrity), as well as cost optimization and constant products availability along the country. Eni is also part of 7 different logistic joint ventures (Sigemi, Seram, Disma, Seapad, Toscopetrol, Porto Petroli Genova and Costiero Gas Livorno), together with other Italian operators, that operate other localized depots and pipelines.
Secondary distribution is outsourced to independent trucks, selected as market leaders.
Marketing
Eni markets a wide range of refined petroleum products, primarily in Italy, through a widespread operated network of service stations, franchises and other distribution systems.
The table below sets forth Eni’s sales of refined products by distribution channel for the periods indicated.
|
Oil products sales in Italy and outside Italy |
2022 |
2021 |
2020 |
|||||
|
|
(mmtonnes) | |||||||
|
Italy |
||||||||
|
Retail |
5.38 |
5.12 |
4.56 |
|||||
|
Wholesale |
6.19 |
6.02 |
5.75 |
|||||
|
11.57 |
11.14 |
10.31 |
||||||
|
Petrochemicals |
0.39 |
0.52 |
0.61 |
|||||
|
Other sales |
9.36 |
10.14 |
9.1 |
|||||
|
Total |
21.32 |
21.8 |
20.02 |
|||||
|
Outside Italy |
||||||||
|
Retail |
2.12 |
2.11 |
2.05 |
|||||
|
Wholesale |
2.96 |
2.71 |
2.88 |
|||||
|
5.08 |
4.82 |
4.93 |
||||||
|
Other sales |
1.39 |
1.35 |
1.13 |
|||||
|
Total |
6.47 |
6.17 |
6.06 |
|||||
|
TOTAL SALES |
27.79 |
27.97 |
26.08 |
In 2022, retail sales of refined products (27.79 mmtonnes) were down by 0.18 mmtonnes or by 0.6% from 2021, as result of lower sales in Italy, partly balanced by higher volumes marketed abroad.
Retail sales in Italy
In 2022, retail sales in Italy were 5.38 mmtonnes, with an increase compared to 2021 (0.26 mmtonnes from 2021 or up by 5.1%) due to higher volumes of gasoline and gasoil.
Average gasoline and gasoil throughputs (1,445 kliters) were up by 83 kliters vs. 2021 (1,362 kliters). Eni’s retail market share of 2022 was 21,7%, down from 2021 (22.2%). As of December 31, 2022, Eni’s retail network in Italy consisted of 4.003 service stations, lower by 75 units from December 31, 2021 (4.078 service stations), resulting from the negative balance of acquisitions/releases of lease concessions (90 units), the negative balance of the company-owned stations (9 units), partly balanced by the increase of 24 lease stations.
Retail sales in the Rest of Europe
Retail sales in the Rest of Europe were 2.12 mmtonnes, substantially in line with 2021 as a result of higher volumes sold in Germany, France, Spain and Austria partly balanced by the decrease of the volumes in Switzerland.
At December 31, 2022, Eni’s retail network in the Rest of Europe consisted of 1.240 units, increasing by 4 unit from December 31, 2021, mainly thanks to the openings in Germany and Austria balanced by the reduction in Switzerland and France. Average throughput (2,027 kliters) increased by 2 kliters compared to 2021 (2,025 kliters).
Other businesses
Wholesale
Eni is strongly present in wholesale market in Italy, including sales of diesel fuel for automotive use and for heating purposes, for agricultural vehicles and for vessels and sales of fuel oil. Major customers are resellers, agricultural users, manufacturing industries, public utilities and transports, as well as final users (transporters, condominiums, farmers, fishers, etc.). Eni provides its customers with its expertise in the area of fuels with a wide range of products that cover all market requirements. Customer care and product distribution are supported by a widespread commercial and logistical organization presence throughout Italy and is articulated in local marketing offices and a network of agents and concessionaires.
In 2022, sales volumes on wholesale markets in Italy (6.19 mmtonnes) increased by 2.7% from 2021, mainly due to higher sales of jet fuel for the recovery of the aviation sector.
Wholesale sales in the Rest of Europe were 2.44 mmtonnes, up by 11.4% from 2021 mainly in Germany, Austria and Spain.
Supplies of feedstock to the petrochemical industry (0.39 mmtonnes) decreased by 25%. Other sales in Italy and outside Italy (10.76 mmtonnes) decreased by 0.74 mmtonnes or down by 6.4%, mainly due to lower volumes sold to other oil companies.
LPG
The marketing of LPG in Italy is supported by the refining production and a logistic network made up of two bottling plants, one owned storage site and coastal storage sites located in Livorno, Naples and Ravenna.
LPG is used as heating and automotive fuel. In 2022, Eni share of LPG market in Italy was 15.4%.
Outside Italy, the main market of Eni is Ecuador, with a market share of 35.5%.
Lubricants
Eni operates five (owned and co-owned) blending and filling plants, in Italy, Spain, Germany, Africa and in the Far East. With a wide range of products composed of over 650 different blends Eni masters international state of the art know how for the formulation of products for vehicles (engine oil, special fluids and transmission oils) and industries (lubricants for hydraulic systems, grease, industrial machinery and metal processing). In Italy, Eni is leader in the manufacture and sale of lubricant bases, manufactured at Eni’s refinery in Livorno. Eni also owns one facility for the production of additives in Robassomero.
In 2022, Eni’s share of lubricants market in Italy was 14,4%, in Europe below 2% and on a worldwide base below 1%. Eni operates in more than 80 countries by subsidiaries, licensees and distributors.
Oxygenates
Eni’s, through its subsidiary Ecofuel (100% Eni’s share), sells approximately 1.08 mmtonnes/y of oxygenates, mainly ethers (approximately 3% of world demand, used as a gasoline octane booster) and methanol (mainly for petrochemical use). About 81% of oxygenates are produced in Eni’s plants in Italy (Ravenna), Saudi Arabia (in joint venture with Sabic) and Venezuela (in joint venture with Pequiven) and the remaining 19% is purchased.
Chemicals
Eni operates in the businesses of olefins and aromatics, basic and intermediate products, polystyrene, elastomers and polyethylene. Its major production hubs are located in Italy and Western Europe. Eni is also engaged in the development of chemicals from renewable sources and recycled materials.
The business results of operations in 2022 and its strategy are described in “Item 5 – Group results of operations” and “Item 5 – Management’s expectations of operations”.
In 2022 sales of chemical products amounted to 3,676 ktonnes, decreased from 2021 (down by 775 ktonnes, or 17.4%), in particular, the main reductions were recorded in olefins (down by 22.8%), elastomers (down by 18.7%), polyethylene (down by 16.4%) and styrenic (down by 12.1%). In the moulding & compounding business, sales amounted to 76 ktons.
Average sale prices of the intermediates business increased by 34.2% from 2021, with aromatics and olefins up by 47.2% and 32.4%, respectively. The polymers reported an increase of 22% from 2021.
Petrochemical production of 6,775 ktonnes decreased from 2021 (down by 1,701 ktonnes vs. 2021) mainly due to lower production of intermediates business (down by 1,387 ktonnes), in particular olefins and aromatics. The main reductions were registered at Porto Marghera site (down by 821 ktonnes), Dunkerque (down by 563 ktonnes) and Priolo (down by 164 ktonnes).
Plants nominal capacity decreased from the 2021. The average plant utilization rate, calculated on nominal capacity, was 59% (66% in 2021).
The table below sets forth Eni’s main chemical products availability for the periods indicated.
|
|
Year ended December 31, |
|||||||
|
|
2022 |
|
2021 |
|
2020 |
|||
|
|
|
(ktonnes) | ||||||
|
Intermediates |
4,897 |
|
6,284 |
|
5,861 |
|||
|
Polymers |
1,873 |
|
2,184 |
|
2,211 |
|||
|
Biochem |
5 |
|
8 |
|
1 |
|||
|
Production of petrochemical products |
6,775 |
|
8,476 |
|
8,073 |
|||
|
Moulding & Compounding |
81 |
|
20 |
|
|
|||
|
Total production |
6,856 |
|
8,496 |
|
8,073 |
|||
|
Consumption losses |
(3,923 |
) |
|
(4,590 |
) |
|
(4,366 |
) |
|
Purchases and change in inventories |
819 |
|
565 |
|
632 |
|||
|
|
3,752 |
|
4,451 |
|
4,339 |
|||
The table below sets forth Eni’s main petrochemical products revenues for the periods indicated.
|
|
Year ended December 31, |
|||||||
|
|
2022 |
|
2021 |
|
2020 |
|||
|
|
|
(€ million) | ||||||
|
Intermediates |
2,368 |
|
2,166 |
|
1,329 |
|||
|
Polymers |
3,203 |
|
3,114 |
|
1,888 |
|||
|
Biochem. |
25 |
|
60 |
|
6 |
|||
|
Moulding & compounding |
327 |
|
70 |
|
|
|||
|
Oilfield chemicals |
83 |
|
65 |
|
56 |
|||
|
Other revenues |
209 |
|
115 |
|
108 |
|||
|
Total revenues |
6,215 |
|
5,590 |
|
3,387 |
|||
Intermediates
Intermediates revenues (€2,368 million) increased by €202 million from 2021 (up by 9.3%) mainly reflecting the higher commodity prices scenario. Sales (2,158 ktonnes) decreased by 18.5% vs. 2021. The main reductions were registered in olefins (down by 22.8%), aromatics (down by 15.3%) and derivatives (down by 0.8%). Average prices increased by 34.2%, in particular aromatics (up by 47.2%), olefins (up by 32.4%) and derivatives (up by 23.5%). Intermediates production (4,897 ktonnes) registered a decrease of 22.1% from 2021. Decreases were also registered in olefins (down by 24.3%), in the aromatics (down by 22.6%), while a slight increase was reported in derivatives (up by 0.6%).
Polymers
Polymers revenues (€3,203 million) increased by €89 million or 2.9% from 2021 due to the increase of the average unit prices. The styrenics business benefitted by the increase of sale prices (up by 25.8%), notwithstanding the reduction of volumes sold (down by 12.1%) for lower product availability and lower demand. The reduction in volumes is mainly attributable to AN (down by 33.1%), EPS (down by 26.8%) and GPPS (down by 11.5%), partly offset by higher sales of ABS (up by 11.9%).
In the elastomers business, the decrease of sold volumes (down by 17.2%) was attributable to the decline in European and extra-European consumption and to the non-competitive prices, due to the higher energy costs. In particular were registered lower sales of BR (down by 23.7%), SBR (down by 17.9%) and NBR rubbers (down by 17.3%). Overall, the sold volumes of polyethylene business reported a decrease (down by 16.4%) with lower sales of LDPE (down by 27.7%), EVA (down by 12.5%) and HDPE (down by 10.6%). In addition, average sale prices increased by 13.4%.
Polymers productions (1,873 ktonnes) decreased by 14.2% from the 2021 due to the lower productions of polyethylene (down by 17.3%), elastomers (down by 17.2%) and styrenics (down by 10%).
Oilfield chemicals, Biochem e Moulding & Compounding
Oilfiled chemicals revenues (€83 million) increased by 26.6% (up by €17 million compared to 2021) as a result of the combined mix of increased unit price for formulations and for the associated services.
Biochem business revenues (€25 million) decreased by €35 million from 2021, mainly due to lower production of disinfectant, following the end of the health emergency, partly offset by the sale of energy produced at the biomass power plant at the Crescentino hub, at full capacity.
Moulding & Compounding business revenues of €327 million include compounding activities for €78 million, moulding for €108 million and the Padanaplast activities for €141 million.
Capital expenditures
See “Item 5 – Liquidity and capital resources – Capital expenditures by segment”.
Plenitude & Power engages in the activities of retail sales of gas, electricity and related services, in the production and wholesale sales of electricity from thermoelectric and renewable plants, as well as in e-mobility services. It also includes trading activities of CO2 emission certificates and forward sale of electricity with a view to hedging/optimising the margins of the electricity.
The business results of operations in 2022 and its strategy are described in “Item 5 – Group results of operations” and “Item 5 – Management’s expectations of operations.”
Plenitude
Gas demand
Eni operates in a liberalized market where energy customers are allowed to choose the gas supplier and, according to their specific needs, to evaluate the quality of services and offers. Overall Eni supplies 10.1 million retail clients (gas and electricity) in Italy and Europe. In particular, clients located all over Italy are 8.1 million.
Retail and business gas sales
|
Gas sales by market |
2022 |
2021 |
2020 |
||||
|
ITALY |
(bcm) |
4.65 |
5.14 |
5.17 |
|||
|
Retail |
3.34 |
3.88 |
3.96 |
||||
|
Business |
1.31 |
1.26 |
1.21 |
||||
|
INTERNATIONAL SALES |
2.19 |
2.71 |
2.51 |
||||
|
European markets: |
|||||||
|
France |
1.69 |
2.17 |
2.08 |
||||
|
Greece |
0.33 |
0.39 |
0.34 |
||||
|
Other |
0.17 |
0.15 |
0.09 |
||||
|
RETAIL AND BUSINESS GAS SALES |
6.84 |
7.85 |
7.68 |
Retail and business gas sales, in Italy and in European markets, amounted to 6.84 BCM, down by 1.01 BCM or 13% from 2021. Sales in Italy amounted to 4.65 BCM, a decrease of 9.5% (down by 0.49 BCM) compared to 2021, due to lower sales to residential segment.
Sales in the European market were 2.19 BCM, decreasing by 19.2% (down by 0.52 BCM) compared to 2021. Lower volumes were marketed in France and Greece.
In Europe, Plenitude operates through the subsidiaries Eni Gas&Power France SA (99.999% Plenitude interest) in France, Gas Supply Company of Thessaloniki (100% Plenitude interest) in Greece, Adriaplin doo (51% Plenitude interest) in Slovenia and Eni Plenitude Iberia SLU (100% Plenitude interest) in Spain and Portugal.
In 2022, retail and business power sales to end customers, managed by Plenitude and its subsidiaries companies in France, Greece and Iberian Peninsula, amounted to 18.77 TWh, an increase by 13.8% from the full year 2021, due to the growth of activities in Italy and abroad.
Renewables
Eni is engaged in the renewable energy business (solar and wind) aiming at developing, constructing and managing renewable energy producing plant.
Eni’s targets in this business will be reached by leveraging on an organic development of a diversified and balanced portfolio of assets, integrated with selective asset acquisitions, as well as projects and national and international strategic partnership.
|
2022 |
2021 |
2020 |
|||||
|
Energy production sold from renewable sources |
(GWh) |
2,553 |
986 |
340 |
|||
|
of which: photovoltaic |
1,135 |
398 |
223 |
||||
|
onshore wind |
1,418 |
588 |
116 |
||||
|
of which: Italy |
818 |
400 |
112 |
||||
|
outside Italy |
1,735 |
586 |
227 |
||||
|
of which: own consumption ⁽*⁾ |
1% |
8% |
23% |
|
⁽*⁾ Electricity for Eni's production sites consumptions. |
The increase in production compared to the previous year benefitted from the entry in exercise of new capacity, mainly for the contribution of assets already operating in Italy, France, Spain and the United States.
|
|
(megawatt) |
2021 |
2020 |
2019 |
|||
| TOTAL INSTALLED CAPACITY FROM RENEWABLES AT PERIOD END (ENI'S SHARE) |
2,198 |
1,137 |
335 |
||||
|
of which: - photovoltaic (including installed storage capacity) |
54% |
49% |
80% |
||||
|
- onshore wind |
46% |
51% |
20% |
|
(megawatt) |
2021 |
2020 |
2019 |
||||
|
Italy |
844 |
466 |
112 |
||||
|
Outside Italy |
1,354 |
671 |
223 |
||||
|
Algeria * |
5 |
||||||
|
Australia |
64 |
64 |
64 |
||||
|
France |
114 |
108 |
|||||
|
Pakistan |
10 |
10 |
|||||
|
Tunisia * |
9 |
||||||
|
United States |
797 |
269 |
87 |
||||
|
Spain |
283 |
129 |
|||||
|
Kazakhstan |
96 |
91 |
48 |
||||
|
TOTAL PHOTOVOLTAIC INSTALLED CAPACITY |
2,198 |
1,137 |
335 |
||||
|
of which installed storage power |
7 |
7 |
8 |
* Assets transferred to other Eni's divisions in Q4 2021
At the end of 2022, the total installed capacity for the generation of energy from renewable sources amounted to 2.2 GW (in Eni share and including the storage power), up by 1.1 GW vs 2021 mainly due to the construction of the Brazoria photovoltaic plant in the USA and the Badamsha 2 onshore wind farm in Kazakhstan, as well as, the acquisition of the Fortore Energia and PLT assets in Italy, the Corazon photovoltaic plant in the USA and the Cuevas assets in Spain.
E-mobility
In a context of the mobility market that includes a constant increase in the number of electric vehicles in circulation in Italy and in Europe, Plenitude, thanks to the acquisition of Be Charge, disposes one of the largest and most widespread networks of public charging infrastructure for electric vehicles.
As of December 31, 2022, there are more than 13,000 charging points distributed throughout the country.
Power
As part of its marketing activities in Italy, Eni engages in selling electricity on the Italian market principally on the open market. Supplies of electricity include both own production volumes through gas-fired, combined-cycle facilities and purchases on the open market.
In 2022, Eni finalized the disposal to the investment company Sixth Street of the 49% share in EniPower which owns six gas power plants. Eni holds the remaining 51% share and maintains the operative control of EniPower as well as the consolidation of the company.
Power sales in the open market
In 2022, power sales in the open market were 22.37 TWh, representing a decrease of 21.6% compared to 2021 due to lower volumes sold to the power exchange.
|
Power availability |
2022 |
2021 |
2020 |
||
|
|
(TWh) | ||||
|
Power generation sold |
21.37 |
22.31 |
20.95 |
||
|
Trading of electricity (a) |
9.49 |
11.62 |
13.04 |
||
|
30.86 |
33.93 |
33.99 |
|||
|
Power sales in the open market |
22.37 |
28.54 |
25.34 |
||
|
Power sales to Plenitude |
8.49 |
5.39 |
8.65 |
|
(a) Include positive and negative imbalances (differences between power introduced in the grid and the one planned). |
||||||
Power generation
Enipower’s power generation sites are located in Brindisi, Ferrera Erbognone, Ravenna, Mantova, Ferrara and Bolgiano. As of December 31, 2022, installed operational capacity of Enipower’s power plants was 2.3 GW, down by 2.2 GW from December 31, 2021, due to the above-mentioned divestment. In 2022, thermoelectric power generation was 21.37 TWh, down by 0.94 TWh compared to 2021. Electricity trading (9.49 TWh) reported a decrease of 18.3% from 2021, due to the optimization of inflows and outflows of power.
|
Site |
Total installed |
Technology |
Fuel |
||
|
|
(MW) |
|
|
|
|
|
Brindisi |
647 |
|
CCGT |
|
gas |
|
Ferrera Erbognone |
536 |
CCGT |
gas/syngas |
||
|
Mantova |
375 |
CCGT |
gas |
||
|
Ravenna |
502 |
CCGT |
gas |
||
|
Ferrara |
204 |
CCGT |
gas |
||
|
Bolgiano |
33 |
Power station |
gas |
||
|
Photovoltaic plants (b) |
0.1 |
Photovoltaic |
Photovoltaic |
||
|
|
2,297 |
|
|
|
|
|
(a) Following the divestment to Sixth Streets of the 49% stake in EniPower, Eni's interest is 51%. |
|||||
|
(b) Managed by EniPower Mantova |
|||||
|
Power generation |
|
|
|
2022 |
|
2021 |
|
2020 |
|
Purchases |
|
|
|
|
|
|
|
|
|
Natural gas |
|
(mmCM) |
|
4,218 |
|
4,670 |
|
4,346 |
|
Other fuels |
|
(ktoe) |
|
175 |
|
93 |
|
160 |
|
- of which steam cracking |
|
|
|
86 |
|
68 |
|
88 |
|
Production |
|
|
|
|
|
|
|
|
|
Electricity |
|
(TWh) |
|
21.37 |
|
22.31 |
|
20.95 |
|
Steam |
|
(ktonnes) |
|
6,900 |
|
7,362 |
|
7,591 |
|
Installed generation capacity (*) |
|
(GW) |
|
2.3 |
|
4.5 |
|
4.5 |
(*) Eni's share.
Capital expenditures
See “Item 5 – Liquidity and capital resources – Capital expenditures by segment”.
These activities include the following businesses:
●the “Other activities” segment comprises results of operations of Eni’s subsidiary Eni Rewind (former Syndial SpA) which runs reclamation and decommissioning activities pertaining to certain businesses which Eni exited, divested or shut down in past years; and
●the “Corporate and financial companies” segment comprises results of operations of Eni’s headquarters and certain Eni subsidiaries engaged in treasury, finance and other general and business support services. Eni’s headquarters is a department of the parent company Eni SpA and performs Group strategic planning, human resources management, finance, administration, information technology, legal affairs, international affairs and corporate research and development functions. Through Eni’s subsidiaries Eni Finance International SA, Banque Eni SA, Eni International BV, Eni Finance USA Inc and Eni Insurance DAC, Eni carries out cash management activities, administrative services to its foreign subsidiaries, lending, factoring, leasing, financing Eni’s projects around the world and insurance activities, principally on an intercompany basis. EniServizi, Eni Corporate University, AGI and other minor subsidiaries are engaged in providing Group companies with diversified services (mainly services including training, business support, real estate and general purposes services to Group companies). Management does not consider Eni’s activities in these areas to be material to its overall operations.
Seasonality
Eni’s results of operations reflect the seasonality in demand for natural gas and certain refined products used in residential space heating, the demand for which is typically highest in the first quarter of the year, which includes the coldest months and lowest in the third quarter, which includes the warmest months. Moreover, year- to-year comparability of results of operations is affected by weather conditions affecting demand for gas and other refined products in residential space heating. In colder years, which are characterized by lower temperatures than historical average temperatures, demand for gas and products is typically higher than normal consumption patterns, and vice versa.
Eni’s Research and Technological Innovation is a key element to make effective and efficient access to new energy resources, improve the use of existing ones and at the same time reduce the impact on the environment. The objectives are, therefore, declined on the following strategic directives, defined as technological platforms:
| ● | PROCESS DECARBONIZATION: with the aim of reducing, capturing, transforming or storing CO2, increasing energy efficiency, reducing emissions and promoting energy vectors with a low carbon footprint; |
| ● | CIRCULAR AND BIO-PRODUCTS: with the aim of reducing, recycling and reusing products and by-products, transforming waste into value-added products for biorefinery, sustainable mobility and green chemistry; |
| ● |
RENEWABLES AND NEW ENERGIES: with the aim of supporting the development of renewable energies and energy storage solutions, and to develop breakthrough energy technologies such as magnetic confinement fusion; |
| ● |
OPERATIONAL EXCELLENCE: with the aim of developing technologies that ensure the highest level of efficiency and safety, the lowest environmental impact, while reducing costs and time to market of our activities. |
A key point of our research and innovation is the integrated and transversal approach. The technology research and development team is indeed at the center of a fruitful exchange of experiences, problem solving and knowledge management in the company – providing experience, solutions, innovation and expertise.
Research and Development becomes, therefore, the lever to create value, with the aim of minimizing the time to market that from research leads to the development of technologies and their implementation on an industrial scale.
In 2022, Eni filed 23 patent applications (30 in 2021).
In 2022, Eni’s overall expenditure in R&D amounted to €164 million which were almost entirely expensed as incurred (€177 million in 2021). In 2022, about 70% of total R&D expenditures were dedicated to the decarbonization pathway and the circular economy.
Research and Development in Eni is characterized by three main factors: in-house expertise, Open Innovation model and development of the entire technology chain. About 1,000 researchers are engaged in research activities, with expertise ranging from upstream to downstream, from renewables to the environment. This knowledge base is complemented and enriched by a network of 70 national and international universities and research centers. But this leverage becomes even more effective with an opening to the market and to startups, both in Italy and abroad, through Joule (startup accelerator) and Eni Next (Corporate Venture Capital).
Finally, our approach is based on the concept of enhancing the entire technology value chain: we identify a portfolio of technology solutions to be provided to the business, to meet the challenges of an evolving world with important decarbonization goals. With this in mind, we have also defined an approach that aims to accelerate the industrial deployment of technologies, including through financial instruments or specific vehicles: for this reason we created Eniverse, our corporate venture building company.
In this way, Eni Innovation follows all stages of the process: while we develop proprietary technologies already applicable to our businesses to increase efficiency, we continue to support the search for innovative solutions for business of tomorrow.
Talking about technological path under development, in the decarbonization path Carbon Capture Utilization and Storage (CCUS) represents an important lever, where technologies, skills and innovation are and will be key to success. Innovative solutions are studied in terms of capture technologies as well as new power generation systems with integrated capture. Hub solutions, transport networks and offshore injection network in depleted fields are also studied, taking advantage of the expertise acquired on gas developments, through an incremental innovation approach.
Great expectations at the decarbonization level come from Carbon Utilization initiatives, where our research efforts are significant. In particular, CO2 reduction to methane or methanol (e-fuels) and mineralization technologies are being developed. Mineralization of CO2 with minerals that are widely available in nature allows significant amounts of gas to be permanently fixed in inert, stable and non-toxic phases. The distinctive and innovative feature of our technology lies in the fact that we have been able to develop properties that allow the product to be used in the formulation of cements, thus opening the way to a potentially huge market.
Of equal importance is the approach typical of the circular economy, i.e. with a focus on research and development that looks at the entire lifecycle of technologies, with the aim of developing new and creative solutions along the entire value chain, making it possible to achieve significant savings in resources and energy, with considerable benefits for the environment.
To be effective, however, it needs to be implemented through integrated multidisciplinary approaches and with the involvement of all the actors in the value chain: companies, institutions, civil society.
Finally, scientific research and digitization will make it possible to do even more: smart digital solutions to be applied in all areas can, on their own, contribute substantially to reducing CO2 emissions by 2030. In fact, the ongoing digitalization process has the potential to accelerate the energy transition process, generating important benefits in terms of efficiency and environmental impact. Numerous projects have been launched at Eni: for example, for each physical asset a “digital twin” will be created through which it will be possible to predict and control operations in advance; with the widespread application of sensors and the use of advanced algorithms, Eni expects to be able to improve the performance and reduce the emissions of its activities.
In order to control the insurance costs incurred by each of Eni’s business units, the Company constantly assesses its risk exposure in both Italian and foreign activities. The Company has established a captive subsidiary, Eni Insurance DAC, in order to efficiently manage transactions with mutual entities and third parties providing insurance policies. Internal insurance risk managers work in close contact with business units in order to assess potential underlying business and other types of risks and possible financial impacts on the Group’s results of operations and liquidity. This process allows Eni to accept risks in consideration of results of technical and risk mitigation standards and practices, to define the appropriate level of risk retention and, finally, the amount of risk to be transferred to the market. Eni enters into insurance arrangements through its shareholding in the Everen Ltd (a mutual insurance and re-insurance company that provides its members with a broad coverage of insurance services tailored to the specific requirements of oil and energy companies) and with other insurance partners in order to limit possible economic impacts associated with damages to both third parties and the environment occurring in case of both onshore and offshore accidents. The main part of this insurance portfolio is related to operating risks associated with oil&gas operations which are insured making use of insurance policies provided by the Everen Ltd. In addition, Eni uses reputable, high quality insurance companies which are well established in the market. Insured liabilities vary depending on the nature and type of circumstances; however, underlying amounts represent significant shares of the plafond granted by insuring companies. In particular, in the case of oil spills and other environmental damage, current insurance policies cover costs of cleaning-up and remediating polluted sites, damage to third parties and containment of physical damage up to $1.1 billion for offshore events and $1.3 billion for onshore plants (refineries). These are complemented by insurance policies that cover owners, operators and renters of vessels with the following maximum amounts: $1.3 million for tankers and charters and up to $1 billion for FPSOs used by the Exploration & Production segment for developing offshore fields.
Management believes that the level of insurance maintained by Eni is generally appropriate for the risks of its businesses. However, considering the limited capacity of the insurance market, we believe that Eni could be exposed to material uninsured losses in case of catastrophic incidents, like the one that occurred in the Gulf of Mexico in 2010 which could have a material impact on our results, liquidity prospects, share price and reputation. See “Item 3 — Risk factors — Risk associated with the exploration and production of oil and natural gas”.
Environmental regulation
Eni is subject to numerous EU, international, national, regional and local environmental, health and safety laws and regulations concerning its oil&gas operations, products and other activities, including legislation that implements international conventions or protocols. In particular, exploration, drilling and production activities require acquisition of a special permit that restricts the types, quantities and concentration of various substances that can be released into the environment. The particular laws and regulations can also limit or prohibit drilling activities in the certain protected areas or provide special measures to be adopted to protect health and safety at workplace and health of communities that could have been affected by the Company’s activities. These laws and regulations may also restrict emissions and discharges to surface and subsurface water resulting from the operation of natural gas processing plants, petrochemical plants, refineries, pipeline systems and other facilities that Eni owns. In addition, Eni’s operations are subject to laws and regulations relating to the production, handling, transportation, storage, disposal and treatment of waste materials. Environmental laws and regulations have a substantial impact on Eni’s operations. Some risk of environmental costs and liabilities is inherent in certain operations and products of Eni, and there can be no assurance that material costs and liabilities will not be incurred. See “Item 3 – Risk factors”.
We believe that the Company will continue to incur significant amounts of expenses in order to comply with pending environmental, health and safety protection and safeguard regulations, particularly in order to achieve any mandatory or voluntary reduction in the emission of GHG in the atmosphere and cope with climate change and water quality of discharges, as well as availability.
International and European Union Environmental Laws Framework
On November 4, 2016, the Paris Agreement entered into force, exactly 30 days after the date on which the last of at least 55 Parties to the Convention accounting in total for at least 55% of the total global greenhouse gas emissions have deposited their instruments of ratification. To date, 193 Parties have ratified the Convention. This important step in the common international Climate Change strategy sets out a global action plan to keep a global temperature rise this century well below 2°C above pre-industrial levels and to pursue efforts to limit the temperature increase even further to 1.5°C.
In 2022, the UN Climate Change Conference of Parties (COP 27) has taken place in Sharm El-Sheikh under the Presidency of the Egyptian Minister of Foreign Affairs, Sameh Shoukry. While the COP 26 in 2021 had an important role in finalizing the Paris Agreement “rule-book” implementation, the COP27 had the merit to achieve some progresses, even in presence of a complex international context. Indeed, COP27 has reaffirmed the importance of (i) limiting the temperature rise to 1.5°C compared to pre-industrial era; (ii) substantially reducing the GHG emissions other than CO2 and in particular methane; iii) accelerating efforts towards the phase-down of unabated coal power and phase-out of inefficient fossil fuel subsidies. The final text also affirmed the importance of reducing GHG emissions by 43% by 2030 vs. 2019 and included a breakthrough agreement to provide “loss and damage” funding for vulnerable countries hit hard by natural disasters, due to climate change. Concerning the climate finance, the COP27 called for a reform of multilateral international financial institutions to unlock and increase financial flows towards the climate objectives. Finally, the COP27 invited the Parties to enhance their mitigation ambitions within the COP28.
Alongside the COP27, several initiatives have been launched or strengthened, among which, the US announced the Methane Emissions Reduction Act Plan, a proposal aimed to the reduction of the methane emissions. Also Canada and Nigeria announced initiatives on mitigation of methane emissions and the Global Methane Pledge reached the number of 150 members (50% more than at the COP26 in Glasgow). South Africa and Indonesia announced a partnership with industrialized countries in the framework of the Just Energy Transition Partnership (JETP) to boost the decarbonization of their economies by driving up the electrification of their energy systems with renewables while, at the same time, reducing the use of coal and improving the energy efficiency. Other developing countries announced the intention to finalize similar JEPT with industrialized countries.
Regarding the European Union (EU), the new EU 2030 GHG reduction target (-55% vs 1990) entailed a revision of the main targets and provisions enforced by the current EU legislation. In this regard, on 14 July 2021, the European Commission adopted a legislative proposal called “Fit for 55 package” which includes, among the others, a revision of the energy efficiency target up to at least 36 to 39% and the renewable energy target to 40%.
As part of the "Fit for 55" package, the European institutions achieved an informal agreement on Emissions Trading Systems (ETS) and Carbon Border Adjustment Measure (CBAM), in December 2022. The agreement on the ETS confirms the inclusion of emissions from the maritime sector, the application of the ETS only to intra-European flights up to 2026 and the launch of a new and separate ETS, mainly applicable to buildings and road transport sectors. The CBAM will be applied from 2026 to the cement, electricity, fertilisers, iron and steel, aluminum and hydrogen sectors, including some semi-finished products and will gradually replace the free allocation mechanism in sectors covered by the ETS.
Regarding the revised Renewable Energy Directive (RED III), as of today, the text is under negotiation among the European institutions, where the Parliament supports an higher 2030 target (45%) compared to the target proposed by the EU Commission and supported also by the Council. As for the transport sector, the EU Council is pushing for giving Member States the flexibility to choose between a target of 13% reduction in GHG intensity compared to a fossil fuel baseline and a 29% renewable share in the final energy consumption of the transport sector by 2030. The Commission proposal for RED III also requires Member States to increase the consumption of advanced biofuels to 0.5% in 2025 and 2.2% in 2030 and introduces a sub-target for Renewable Fuels of Non-Biological Origin (2.6% in 2030). On the other side, the sustainability criteria stay mostly unchanged (i.e. cap of 7% for biofuels produced from food and feed crops, ban for high Indirect Land Use Change risk feedstocks between 2023 and 2030). In a separate regulation, the Fit for 55 package introduces also a minimum blending mandate for Sustainable Aviation Fuels and a limit to the carbon intensity of the energy used on board ships, to support the uptake of sustainable maritime fuels.
The revised energy efficiency directive is also under negations among the European institutions. In this case, the Council supports the targets set out in the Commission's original proposal, namely reducing EU primary (-39%) and final (-36%) energy consumption by 2030, setting an upper limit of 1023 million tonnes of oil equivalent (Mtoe) in primary energy consumption and 787 Mtoe in final energy consumption. While the Parliament sets more ambitious targets, equivalent to a 42.5% reduction in primary energy consumption (upper limit of 960 Mtoe) and a 40% reduction in final energy consumption (upper limit of 740 Mtoe). Furthermore, Member States would need to deliver binding national contributions based on both indicators of energy consumption, and would need to meet milestones in 2025 and 2027 to ensure they are on track.
An additional relevant piece of climate legislation is the Taxonomy Regulation, a classification system, establishing a list of environmentally sustainable economic activities. The objective is to step up the transition and directing investments towards sustainable projects and activities by drawing on all possible solutions to reach the EU climate goals. In this regard, in 2021, EU Commission defined the first set of technical screening criteria on climate change mitigation and climate change adaptation to be used to classify an economic activity as taxonomy aligned. While on February 2022 the EU Commission adopted a delegated act showing the technical screening criteria for making the production of heat and power from natural gas and nuclear taxonomy aligned.
In 2022, the efforts of the European Commission legislators focused on several proposals to support enhanced non-financial disclosure obligations for financial market participants, financial advisors and large corporations.
On February 23, 2022, the European Commission published its proposal for a Directive on Corporate Sustainability Due Diligence. The future Directive and its national transposition rules should apply to large (more than 250 employees) and very large companies (more than 500 employees) and require the creation of a system to monitor, prevent and mitigate the negative impacts on the environment, working conditions and individual rights and freedoms of both the company's activity and the upstream and downstream value chain (suppliers, distributors, retailers, etc.). Interinstitutional negotiations on the proposal are expected to be concluded by the end of 2023.
The Corporate Sustainability Reporting Directive (CSRD) is another key initiative of the Green Deal for Europe and is part of a broader regulatory framework with non-financial disclosure requirements. On 5 January, Directive 2022/2464/EU came into force, updating the EU rules on corporate sustainability disclosures by broadening the scope and introducing detailed reporting requirements, also with a view to combating greenwashing. The CSRD amends Directive 2013/34/EU on non-financial business information by introducing ad hoc provisions on corporate sustainability reporting. The new obligations will apply progressively from 2024.
Air quality remains at the center of the European environmental policies and strategies. In 2019 the European Commission has completed a fitness check of the two EU Ambient Air Quality (AAQ) Directives (Directives 2008/50/EC and 2004/107/EC). In October 2022 the European Commission has proposed stronger rules on ambient air quality, setting an ‘interim’ 2030 EU air quality standards, aligned more closely with 2021 World Health Organization guidelines, while putting the EU on a trajectory to achieve zero pollution for air at the latest by 2050, in synergy with climate-neutrality efforts. In particular, the key proposed change is a tighter annual limit value for fine particulate matter (PM2.5) of 10 µg/m3, effective from 2030, down from the current limit of 25 µg/m3.
The Industrial Emission Directive (IED) 2010/75/EU is fundamental for European industries, it provides the framework for granting permits for about 50,000 industrial installations across the EU. It lays down rules on the integrated prevention and control of air, water and soil pollution arising from industrial activities. As part of the IED framework, additional emission limit values are defined by the sector specific and cross sector Best Available Technology (BAT) Conclusions. As foreseen in the European Green Deal roadmap, the European Commission got int the heart of the review of the IED (Industrial Emission Directive) . On 5 April 2022, the EU Commission presented a proposal for a directive revising, updating, and modernising Directive 2010/75/EU. The text published in the EU Official Journal proposes a revision of the measures to tackle pollution from large industrial installations in order to create better synergies of the directive with the ETS and European policies on circular economy and decarbonisation. In addition, the proposal updates the directive with respect to air quality legislation. The new directive is expected to be published by the end of 2023. At the same pace the European Commission is revising the European Pollutant Release and Transfer Register (E-PRTR) Regulation, which is closely related to the IED.
In particular, the main areas of improvement include: expansion of sectoral coverage and new pollutants of concern, better coherence with related environmental legislation and collecting information that helps contribute to the circular economy and decarbonisation and enhancing the quality, ease and speed of public access to information.
In 2021, the Commission’s efforts have focused on several activities to support policies related to the "Zero Pollution ambition for a toxic free environment", launched in October 2020. The EU wants to outline the actions to be introduced at European level to achieve the ambitious "Zero Pollution" target for water, air and soil for a toxic-free environment. In October 2020, the EU Commission launched the first consultation phase (Roadmap) on a number of proposals in this area. In 2021, the consultation "EU Action Plan Towards a Zero Pollution Ambition for air, water and soil" was launched, in which Eni participated through IOGP. Moreover, in July 2021 the conclusion of the EU consultation on the revision of the Wastewater Directive was published. The 25th October 2022, the European Commission published the proposal for the new Urban Wastewater Treatment Directive (UWWTD). The proposal focuses on the quality of rivers, lakes, groundwaters and seas through cost-effective wastewater treatment. It includes essential points, such as the energy-water nexus, nutrients recovery and new requirements for microplastics and other micropollutants in line with the Circular Economy Action Plan. The sector is supposed to become energy-neutral by 2040. Moreover, the proposal also aims for new standards and limit values, an extended producer responsibility, better and digitalized monitoring and tracking of pollution, and a cooperation between health and wastewater competent authorities.
In February 2019, the Best Available Techniques Reference Document for the Management of Waste from Extractive Industries was published. In accordance with Directive 2006/21/EC, the reviewed document presents up -dated data and information on the management of waste from extractive industries, including information on BAT, associated monitoring, and developments in them. The new risk-based “BAT” approach considers the diversity of types of extractive waste, sites and operators and covers a wide range of potential risks that must be considered by operators responsible for waste management in the extractive industries.
In November 2021 the Commission Implementing EU Decision 2021/2326 establishing best available techniques (BAT) conclusions, under Directive 2010/75/EU for large combustion plants was republished as agreed by the European Court of Justice in the sentence T-699/17.
It is also important to point out that, for hydrocarbon exploration and production activities, the European Commission is continuing its activities for the drafting of the new Bref Hydrocarbon with the aim of filling the gaps in available information on BAT used in Europe for upstream activities and their applicability, as well as identifying the activities likely to produce the most critical environmental effects using risk assessment techniques (Best Available Risk Management techniques, or BARM).
In 2018 the European Parliament and Council approved the directives included in the Circular Economy Package, revising the EU legislation on waste, aiming to stimulate Europe’s transition towards a circular economy. The approved directives introduce new waste-management targets regarding reuse, recycling and landfilling, strengthens provisions on waste prevention and extended producer responsibility, and streamlines definitions, reporting obligations and calculation methods for targets. The July 5, 2020 was the deadline for the Member States to transpose the directives in national legislation. The European Commission plans to revise the Waste Framework Directive, in order to reduce waste generation, improve waste collection and optimize recycling, increase the collected amount of waste oil and ensure its treatment according to the EU waste hierarchy; a call for ideas took place between 25th January 2022 and 22nd February 2022 and a legislative proposal is waited by 2Q2023. In January 2023 the European Parliament approved a text for the revision of the Regulation 1013/2006 regarding the international waste shipments. The Swedish presidency, which started on 1 January, aims to reach a general approach on the file at the Environment Council on 20 June 2023. The proposal of European Commission, which was presented on 17 November 2021, aimed to set stricter rules on waste export, also requiring independent audits in the facilities outside the EU, to strengthen the contrast to illegal shipments and to facilitate the waste shipments in the internal market of EU, also through the digitalization of procedures. The text approved by the EP requires that labour standards are considered in the assessment of the receiving country's ability to treat waste sustainably and stops EU exports of non-hazardous plastic waste to non-OECD countries, while plastic waste exports to OECD countries should be phased out within 4 years of the regulation's entry into force.
In January 2018, the first Europe-wide strategy on plastics was adopted. The directive 2019/904/EU was approved on June 2019; it bans some single use plastic products and establishes requirements for some other plastic products (examples: content of recycled plastic, marks on packaging). The directive, which also asks the adoption of measures to strengthen separate collection of plastic waste, must be transposed in national legislations of the Member States by July 3, 2021.
In March 2020 the European Commission adopted a new Circular Economy Action Plan (CEAP), one of the main building blocks of the European Green Deal. With measures along the entire life cycle of products, the new Action Plan aims to make our economy fit for a green future, strengthen our competitiveness while protecting the environment and give new rights to consumers. The measures announced in 2020 were adopted in March 2022 As announced in the CEAP, the legislative and non-legislative measures along the entire life cycle of products, were adopted in March 2022. The 30th November, the Commission proposed a revision of EU rules on Packaging and Packaging Waste and published a Communication on a policy framework for biobased, biodegradable and compostable plastics. In particular, the revision of Packaging and Plastic Waste aims to prevent the generation of packaging waste, reducing it in quantity, and promoting reuse and refill and increase the use of recycled plastics in packaging, substituting virgin materials.
European Union Health and Safety Laws Framework
Legislative Decree No. 81/2008 concerned the protection of health and safety in the workplace and was designed to regulate the work environments, equipment and individual protection devices, physical agents (noise, mechanical vibrations, electromagnetic fields, optical radiations, etc.), dangerous substances (chemical agents, carcinogenic substances, etc.), biological agents and explosive atmosphere, the system of signs, video terminals.
With Law 215 of 17 December 2021, important innovations were introduced into Legislative Decree 81/08. These changes bring a much-needed initial novelty and update to a number of prevention and control issues in the workplace, such as:
- Regional coordination committees;
- Joint organisms;
- Role of the “Preposto”;
- National prevention information system;
- Vigilance;
- Suspension of activities;
- Training.
On June 1, 2007, the REACH Regulation of the European Union came into force (Regulation (EC) No. 1907/2006 concerning the Registration, Evaluation, Authorization and Restriction of Chemicals).
The Commission is currently reviewing the REACH Regulation, through a public consultation aimed at SMEs, citizens and stakeholders with the aim of obtaining opinions on the expected impacts of the envisaged changes.
The overall objective of this revision is to ensure that the provisions of the REACH Regulation reflect the Commission's innovation ambitions for safe and sustainable chemicals and a high level of health and environmental protection, while preserving the internal market, as foreseen in the Chemical Strategy for Sustainability adopted on October 14, 2020.
This strategy is part of the EU's zero pollution ambition, a key commitment of the European Green Deal, and aims to better protect citizens and the environment from harmful chemicals as well as stimulate innovation by promoting the use of safer and more sustainable chemicals.
The European Chemicals Agency (ECHA) contributes to the implementation of the strategy with its scientific and regulatory expertise, databases, digital tools and networks, and practical experience in chemicals regulation, where necessary.
Furthermore, Regulation (EU) 2020/878 was published on 26 June 2020, amending Annex II of REACH relating to the "Requirements for completing safety data sheets (SDS)" for substances and mixtures, in force since 16 July 2020, applicable from 1 January 2021.
This represents a challenging moment for the company that manages a large number of SDSs, as starting from 1 January 2023 all SDSs will necessarily have to be drawn up in accordance with this Regulation.
Another impact of significant importance derives from the publication of Regulation (EU) 2017/542 of 22 March 2017 which amends Regulation (EC) no. 1272/2008 (CLP) of the European Parliament and of the Council on classification, labeling and packaging of substances and mixtures of the European Parliament and of the Council on classification, labeling and packaging of substances and mixtures through the addition of an annex on harmonized information on emergency health response and its subsequent amendments. In fact, starting from January 2021, in Italy, new dangerous preparations for consumer and professional use must be notified on the ECHA portal through the PCN (Poison Centers Notification). While previously, information on the dangerous mixture had to be sent to the ISS by 30 days from the date of placing on the market, now the submission of information has to be done to ECHA before the mixture is placed on the market.
Compliance with REACH requirements and the involvement of all stakeholders in the Company are coordinated and supervised by the HSEQ/Product Safety function.
Since 2022 Eni has been actively involved in the public consultation of the REACH Regulation and the CLP Regulation for an analysis of the resulting impacts; she is currently also involved in the public consultation for the proposal to sign the Ecodesign for Sustainable Products (ESPR) Regulation.
Legislative Decree 101/20 establishes safety standards in order to protect people from the risks deriving from ionizing radiation. The Decree regulates the protection of people subject to exposure to ionizing radiation from artificial and natural radioactive sources.
European institutions have also increased their activities in the area of environmental protection in the field of hydrocarbon extraction.
On June 12, 2013, the Directive No. 2013/30/EU was issued with the aim of replacing the existing National Legislations and uniform the legislative approach at European level. The Directive, also named Offshore Directive, was transposed into Italian law by means of Legislative Decree 145 of August 18, 2015.
The main elements of the EU Directive are the following:
| ● | The Directive introduces licensing rules for the effective prevention of and response to a major accident. The licensing authority in Member States will have to make sure that only operators with proven technical and financial capacities are allowed to explore and produce oil&gas in EU waters. Public participation is expected before exploratory drilling starts in previously un-drilled areas. | |
| ● | Independent national competent authorities, responsible for the safety of installations, are in charge of verifying the provisions for safety, environmental protection, and emergency preparedness of rigs and platforms and the operations conducted on them. Enforcement actions and penalties apply in case of non-compliance with the minimum set standards. | |
| ● | Obligatory emergency planning calls for companies to prepare reports on major hazards, containing an individual risk assessment and risk-control measures, and an emergency response plan before exploration or production begins. These plans have to be submitted to National Authorities. | |
| ● |
Technical solutions presented by the operator need to be verified independently prior to and periodically after the installation is taken into operation. | |
| ● | Companies are required publish on their websites information about standards of performance of the industry and the activities of the national competent authorities, as well as reports of offshore incidents. | |
| ● |
Companies are required prepare emergency response plans based on their rig or platform risk assessments and keep resources at hand to be able to put them into operation when necessary. These plans are periodically tested by the industry and National Authorities. | |
| ● | Oil and gas companies are fully liable for environmental damage caused to the protected marine species and natural habitats. For damage to waters, the geographical zone is extended to cover all EU waters including the exclusive economic zone (about 370 km from the coast) and the continental shelf, where the coastal Member States exercise jurisdiction. For water damage, the present EU legal framework for environmental liability is restricted to territorial waters (about 22 km offshore). | |
| ● | Operators working in the EU are required to demonstrate they apply the same accident-prevention policies overseas as they apply in their EU operations. |
We believe that Eni operations are currently in compliance with all those regulations in each European country where they have been enacted.
Adoption of stricter regulation both at national and European or international level and the expected evolution in industrial practices would trigger cost increases to comply with new HSE standards. Eni exploration and development plans to produce hydrocarbon reserves and drilling programs could also be affected by changing HSE regulations and industrial practices. Lastly, the Company expects that production royalties and income taxes in the oil&gas industry will probably increase in future years.
Moreover, in order to achieve the highest safety standards of our operations in the Gulf of Mexico, Eni entered into a consortium led by Helix that worked at the containment of the oil spill at the Macondo well. The Helix Well Containment Group (HWCG) performs certain activities associated with underwater containment of erupting wells, evacuation of hydrocarbon on the sea surface, storage and transport to the coastline.
Worldwide Eni approach was to join international consortiums for main equipment and to develop in-house technologies to improve the intervention capability. Eni Emergency Response Kit consists of:
| ● | Outsourced equipment contracted by Eni Head Quarter; | |
| ● |
Access Agreement to Subsea Capping Equipment consortium; |
|
| ● | Access Agreement to Global Dispersant Stockpile consortium; | |
| ● | Eni Head Quarter proprietary equipment; | |
| ● |
Rapid Cube; | |
| ● |
Killing System relating to drilling operations. |
In addition to the above, Eni is a participant member of Oil Spill Response Limited, the largest international industry-funded cooperative which exists to respond to oil spills wherever in the world they may occur, by providing preparedness, response and intervention services.
As regards major accidents, the Seveso III (Directive No. 2012/18/EU) was adopted on July 4, 2012 and entered into force on August 13, 2012. Italy has transposed it into national legislation through the Legislative Decree No. 105/2015 (June 26, 2015).
The main changes in comparison to the previous Seveso Directive are:
| ● | technical updates to take into account the changes in EU chemical classification, mainly regarding the 2008 European CLP Regulation of substances and mixtures; | |
| ● | expanded public information about risks resulting from Company activities; | |
| ● |
modified rules in participation by the public in land-use planning projects related to Seveso plants; and | |
| ● |
stricter standards for inspections of Seveso establishments. | |
| ● |
Eni has carried out specific activities aimed at guaranteeing the compliance of its own industrial site. |
HSE activity for the year
2022
Eni is committed to continuously improving its model for managing health, safety and environment issues across all its businesses in order to minimize risks associated with its own industrial activities, ensure reliability of its industrial operations and comply with all applicable rules and regulations.
In 2022, Eni’s business units continued to obtain certifications of their management systems, industrial installations and operating units according to the most stringent international standards. The total number of certifications achieved was 318, of which:
| ● | 98 certifications according to the ISO 14001 standard; | |
| ● |
10 registrations according to the EMAS regulation; |
|
| ● |
26 certifications according to the ISO 50001 standard (certification for an energy management system); | |
| ● | 103 according to the new ISO 45001 standard; | |
| ● |
42 according to the ISO 9001 standard (certification of the quality management system). |
In 2022 the percentage of Eni industrial installations and operating units with a significant HSE risk covered by certification is 88% for the ISO 45001 standard and 87% for the ISO 14001 standard.
In 2022, total HSE expenses (including cross-cutting issues such as HSE management systems implementation and certification, etc.) amounted to €1,523 million (+6% vs 2021).
Environment. In 2022, Eni incurred total expenditures of €1,136 million for the protection of the environment (with an increase of 5% with respect to 2021). Environmental expenditures are mainly related to remediation and reclamation activities (€558 million), waste management (€246 million), water management (€142 million), air protection (€77 million) and spill prevention (€46 million).
Safety.
Eni is constantly engaged in the research and development of all the actions necessary to guarantee safety in the workplace, in particular in the development of models and tools of risks assessment and management and in the promotion of a safety culture, in order to pursue its commitment to zero accidents.
In 2022, the new legislation did not have a significant impact on the procedures already in place for occupational safety.
In 2022, the commitment to reduce accidents continues at Eni, which has also focused on new projects:
| - | application of the THEME methodology on analysing worker behaviour and human reliability in order to identify action strategies to strengthen human barriers and safe behaviour; | |
| - |
development of a new training course dedicated to Operational Safety Management, reserved for operational and HSEQ area personnel, with the aim of familiarising them with the basic principles and minimum safety requirements to be applied in risky activities; | |
| - | development of a new training course on Process Safety Management, addressed to HSE as well to operating personnel, in order to provide them with basic information relevant to Process Safety and its Management System; | |
| - |
training of expert personnel on the new RC Eni investigation methodology, which enables the identification of root causes and effective action to prevent the recurrence of accidents; | |
| - |
extension to all operational sites of the digital Safety Presense tool, which, with the help of artificial intelligence and machine learning, enables predictive analysis by exploiting the data available in the safety reporting, sending the site an alert when it detects a high frequency of recurring hazardous situations that retrace a past accident. |
Finally, during year 2022, the Campaign of diffusion of Process Safety Fundamentals has continued and gained maturity in all Eni subsidiaries. Process safety Fundamentals are key operating principle that, if respected, may contribute to the reduction of approximately one third of Company Process safety events.
In terms of industrial hygiene, great attention was paid to the identification and management of personal protective equipment (PPE) and various specific training initiatives for workers were promoted to improve industrial hygiene culture.
Eni has developed a radiation protection system capable of managing the risk deriving from the use of artificial radioactive sources (for example in systems for monitoring fluid levels and density) and from the presence of natural radioactive sources (Radon and TENORM).
In particular, has implemented a project for the mapping of TENORM matrices in Eni sites in Italy and for the identification of possible technologies for the treatment and disposal of matrices contaminated by natural radionuclides.
In 2022, the total recordable injury rate (TRIR) of the workforce increased compared to 2021 (0.41 versus 0,34 in 2021), as the number of total recordable injuries increased (113 versus 88 in 2021). There were 4 fatalities to contractors, 3 in upstream operations (2 in Pakistan and 1 in Egypt) and 1 in a petrochemical plant in Italy.
In the area of emergencies, particular attention was paid to the prevention and management of emergencies induced by natural risks and in November 2021 a Memorandum of Understanding was signed between Eni and the Department of Civil Protection, to further strengthen cooperation and define emergency plans specific for each type of risk with an impact on the continuity of energy supply on the national territory.
Emergency preparedness is regularly tested during exercises where the response capacity is tested in line with dedicated plans, including the timely alerting of the chain of command and of the resources necessary to face the event. The operational sites maintained a high level of preparedness for emergencies by carrying out over 5,200 exercises.
Costs incurred in 2022 to support the safety levels of operations and to comply with applicable rules and regulations were €308 million.
Health activity for 2022.
Eni’s activities for protecting health aim to continuously improve the biopsychosocial wellbeing of people in the workplace and in host communities. Eni believes that it achieved a good performance in this area thanks to:
| ● | plant and facility efficiency and reliability; | |
| ● | promotion and dissemination of knowledge, adoption of best practices and operating management systems based on advanced criteria of protection of health and internal and external environment; | |
| ● | certification programs of management systems for production sites and operating units; | |
| ● |
identified indicators in order to monitor exposure to chemical and physical agents; | |
| ● | strong engagement in health protection for workers operating worldwide also with the support of international health providers capable of guaranteeing a prompt and adequate response to any emergency; | |
| ● |
Continuous improvement of Health integration at the early stage of business development |
|
| ● | identification of an effective and reliable health providers, in Italy and abroad; | |
| ● |
training programs for medics and paramedics. | |
| ● |
Strong collaboration with local Health Institutions and Organizations for the definition and implementation of welfare services for employees and their families and community projects for hosting populations. |
In order to protect the health and safety of its employees, Eni relies on a network of health care facilities located in its main operating areas. A set of international agreements with the best local and international health providers ensures efficient services and timely responses to emergencies. Thanks to the strong skills and experience developed on this topic around the world, in 2021 we managed to assuring business continuity while protecting workers’ and their families’ health.
Eni is engaged to the elaboration of HIA/ESHIA and relative standards to be applied to all new projects of evaluation of working exposure to environment, in Italy and abroad The main aim of HIA is to avoid any negative impacts and maximize any positive impacts of the project on the host community and it is usually carried out as part of/or in conjunction with the Health, Environmental and a Social Impact Assessment process. Its results are used to develop appropriate mitigation measures and an improvement plan with the host community.
Information about Eni’s strategy and targets in a low-carbon scenario in accordance to standards set by the Task Force on climate-related Financial Disclosures (TCFD) of the Financial Stability Board and other non-financial information about sustainability is provided in the “Non -financial Information report” which is part of Eni’s 2022 Annual Report published in accordance with Italian law and practice. These reports are not incorporated by reference in this Form 20-F.
Overview
The matters regarding the effects of recent or proposed changes in Italian legislation and regulations or EU directives discussed below and elsewhere herein are forward-looking statements and involve risks and uncertainties that could cause the actual results to differ materially from those in such forward-looking statements. Such risks and uncertainties include the precise manner of the interpretation or implementation of such legal and regulatory changes or proposals, which may be affected by political and other developments.
Regulation of exploration and production activities
Eni’s exploration and production activities are conducted in many countries and are therefore subject to a broad range of legislation and regulations. These cover virtually all aspects of exploration and production activities, including matters such as license acquisition, production rates, royalties, pricing, environmental protection, export, taxes and foreign exchange. The terms and conditions of the leases, licenses and contracts under which these oil&gas interests are held vary from country to country. These leases, licenses and contracts are generally granted by or entered into with a government entity or state company and are sometimes entered into with private property owners. These arrangements usually take the form of licenses or production sharing agreements.
Licenses (or concessions) give the holder the right to explore for and exploit a commercial discovery. Under a license, the holder bears the risk of exploration, development and production activities and provides the financing for these operations. In principle, the license holder is entitled to all production minus any production taxes or royalties, which may be in cash or in-kind. Concession contracts currently applied mainly in Western countries regulating relationships between States and oil companies with regards to hydrocarbon exploration and production activity. Both exploration and production licenses are generally for a specified period of time (except for production licenses in the United States which remain in effect until production ceases). The term of Eni’s licenses and the extent to which these licenses may be renewed vary by area. Contractual clauses governing mineral concessions, licenses and exploration permits regulate the access of Eni to hydrocarbon reserves. The company holding the mining concession has an exclusive right on exploration, development and production activities, sustaining all the operational risks and costs related to the exploration and development activities, and it is entitled to the productions realized. As a compensation for mineral concessions, pays royalties on production (which may be in cash or in-kind) and taxes on oil revenues to the state in accordance with local tax legislation.
Proved reserves to which Eni is entitled are determined by applying Eni’s share of production to total proved reserves of the contractual area, in respect of the duration of the relevant mineral right.
Eni operates under Production Sharing Agreement (PSA) in several foreign jurisdictions mainly in African, Middle Eastern and Far Eastern countries. The mineral right is awarded to the national oil company jointly with the foreign oil company that has an exclusive right to perform exploration, development and production activities and can enter into agreements with other local or international entities. In this type of contract, the national oil company assigns to the international contractor the task of performing exploration and production with the contractor’s equipment (technologies) and financial resources. Exploration risks are borne by the contractor and production is divided into two portions: “Cost Oil” is used to recover costs borne by the contractor and “Profit Oil” is divided between the contractor and the national company according to variable schemes and represents the profit deriving from exploration and production. Further terms and conditions of these contracts may vary from country to country.
Pursuant to these contracts, Eni is entitled to a portion of a field’s reserves, the sale of which is intended to cover expenditures incurred by the Company to develop and operate the field. The Company’s share of production volumes and reserves representing the Profit Oil includes the share of hydrocarbons which corresponds to the taxes to be paid, according to the contractual agreement, by the national government on behalf of the Company. Therefore, the Company recognizes at the same time an increase in the taxable profit, through the increase in revenues, and a tax expense. Proved reserves to which Eni is entitled under PSAs are calculated so that the sale of production entitlements should cover expenses incurred by the Group to develop a field (Cost Oil) and recognize the Profit Oil set contractually (Profit Oil). A similar scheme to PSA applies to Service contracts.
In general, Eni is required to pay income tax on income generated from production activities (whether under a license or PSA). The taxes imposed upon oil&gas production profits and activities may be substantially higher than those imposed on other businesses.
Regulation of the Italian hydrocarbons industry
The matters regarding the effects of recent or proposed changes in Italian legislation and regulations or EU directives discussed below and elsewhere herein are forward-looking statements and involve risks and uncertainties that could cause the actual results to differ materially from those in such forward-looking statements. Such risks and uncertainties include the precise manner of the interpretation or implementation of such legal and regulatory changes or proposals, which may be affected by political and other developments.
Exploration & Production
The Italian hydrocarbons industry is regulated by a combination of constitutional provisions, statutes, governmental decrees and other regulations that have been enacted and modified from time to time, including legislation enacted to implement EU requirements (collectively, the “Hydrocarbons Laws”).
Exploration permits and production concessions. Pursuant to the Hydrocarbons Laws, all hydrocarbons existing in their natural condition in strata in Italy or beneath its territorial waters (including its continental shelf) are the property of the State. Exploration activities require an exploration permit, while production activities require an exploiting concession, in each case granted by the Minister of Economic Development.
The initial duration of an exploration permit is six years, with the possibility of obtaining two three-year extensions and an additional one-year extension to complete activities underway. Upon each of the three-year extensions, 25% of the area under exploration must be relinquished to the State (only for initial acreages larger than 300 square kilometers). The initial duration of a production concession is 20 years, with the possibility of obtaining a ten-year extension and additional five-year extensions until the field depletes.
These provisions are to be coordinated with a new law effective as of February 12, 2019 (Law 12/2019 — ex “D.L. Semplificazioni”) and further amendment, which requires certain Italian administrative bodies to define and adopt within end September 2021 a plan (PiTESAI) aiming to identify areas that are suitable for carrying out exploration, development and production of hydrocarbons in the national territory, including the territorial seawaters. The plan has been at the end adopted by 11th February 2022.
As consequence, exploration permits resume their efficacy in areas that have been identified as suitable and for gas target only; on the contrary, in unsuitable areas, exploration permits are repealed.
As far as development and production concessions are concerned, if their infrastructures fall in suitable areas and are productive or have been unproductive for less than 7 years, can be granted further extensions and applications for new concessions can be filed; on the contrary development and production concessions whose infrastructures fall in unsuitable areas can be granted further extensions only if:
| ● | they are productive or have been unproductive for less than 5 years (offshore case); | |
| ● | they are productive or have been unproductive for less than 5 years and they exceed cost-benefit analysis (onshore case); | |
| ● | ongoing concessions applications can be filed for gas exploitation only having associated reserves greater than 150Msmc. |
Starting from June 1, 2019, the above mentioned law increases by 25 fold the current annual fee for all licensees (exploration permits and production concessions).
Moreover, the Fiscal decree no. 124/2019, converted into Law 157/2019 established (art. 38), starting from 2020, the property tax on marine structures (IMPI).
Finally, to face gas price crisis, Italian Government, issued by 1st March 2022 a first decree that mitigates effects of PiTESAI rules in order to increase internal production. Decree was then converted in effective law on 27th April 2022. Moreover, Italian Government issued a second decree, having the same purpose of the first one, by 18th November 2022, converted in law on 13th January 2023,
The new plan did not entail any significant and adverse consequence on Eni’s development and producing activities at its Italian concessions or on assets useful lives even due to provisions of the two recent above mentioned decrees.
Royalties. The Hydrocarbons Laws require the payment of royalties for hydrocarbon production. As per Legislative Decree No. 625 of November 25, 1996, subsequent modifications and integrations (the last modification was introduced by Law 160/2019 – Budget Law 2020, art. 1 par. 736 & 737) and Law Decree No. 83 of June 22, 2012, royalties are equal to 10% for gas and oil productions onshore, to 10% for gas and 7% for oil offshore, with exemptions only for on shore gas concessions with production lower than 10 Msmc/year and off shore gas concessions with production lower than 30 Msmc. (Only in the Autonomous Region of Sicily, following the Regional Law No. 9 of May 15, 2013, royalties onshore for oil and gas are equal to 20,06%, with no exemptions).
Gas & Power
Wholesale gas market in Italy
In the last decade, and even more in the last years, a number of new rules have been introduced in order to improve liquidity and efficient functioning of the Italian wholesale gas market, fostering competition and at the same time improving the system security of supply. Among such new rules, it could be worth mentioning:
| - |
Market based mechanisms for the allocation of storage capacities and of regasification capacities: moving away from the past allocation criteria based on tariffs, new auction mechanisms were implemented that enabled market players to express the market-value of storage and of regasification capacities, while at the same time ensuring the allowed revenues of storage operators and LNG terminal operators by means of specific parallel measures. Thanks to these reforms, much higher levels of capacity bookings have become structural for both types of infrastructures, and more LNG deliveries have been attracted recently to the country. | |
| - |
An organized market platform (MGAS) for gas trading and gas balancing market, managed by the independent operator Gestore dei Mercati Energetici (GME) which also acts as a central counterparty, where different market participants (including TSO) can carry out spot and forward transactions at the “Punto di Scambio Virtuale” (PSV – Virtual Trading Point). In addition, since February 2018 voluntary market making activity has been introduced in the spot section of the gas exchange MGAS: such activity is based on the service provided by some liquidity providers, in order to boost liquidity and trading activity on the same exchange, initially for the day-ahead market but with possible future extension to the within-day section and to the forward section of the MGAS. | |
| - | A gas balancing regime, entered into force since October 2016 as an evolution of the one already in place and in compliance with the EU regulatory framework. This system is based on the principle that network users have to balance their daily position, also in accordance with the timely information provided by the TSO about the daily gas consumption. The new gas balancing regime provides the incentive for shippers to balance their position via penalizing imbalance prices and at the same time it provides the possibility for shippers to modify intra-day their gas flow nominations and to trade on the market with other shippers and/or with the TSO itself (that can access the market under some constraints, in order to address overall system balancing needs that may arise on top of shippers’ activities). |
In the context of the energy crisis following the Russian-Ukrainian war, and in the framework of the emergency and transitional regulations at EU level, the Italian competent authorities introduced in 2022 a number of new regulatory measures aimed at ensuring the system security of supply in the short-term and improving it in the longer term, such as specific market based solutions in order to: i) incentivize storage booking and filling, while at the same time ensuring last-resort filling by the Italian TSO; ii) facilitate market access to existing regasification capacities; iii) quickly develop new regasification capacities and making them accessible to the market. Such new measures may represent risk factors as well as business opportunities.
Natural gas prices in the retail sector in Italy
Following the liberalization of the natural gas sector introduced in the year 2000 by Decree No. 164, prices of natural gas in the wholesale market which includes industrial and power generation customers are freely negotiated. However, the ARERA retains a power of surveillance on this matter as per Law No. 481/1995 (establishing the ARERA) and Legislative Decree No. 164/2000. Furthermore, the ARERA is still entrusted (as per the Presidential Decree dated October 31, 2002) with the power of regulating natural gas prices to residential customers, also with a view of containing inflationary pressure deriving from increasing energy costs. Consistently with those provisions, companies which sell natural gas to residential customers are currently required to offer to those customers the regulated tariffs set by ARERA beside their own price proposals.
In 2013, a new tariff regime was fully enacted by ARERA targeting Italian residential clients who are entitled to be safeguarded in accordance with current regulations. Clients who are eligible for the tariff mechanism set by the ARERA are residential clients. With Resolution No. 196 effective from October 1, 2013, the ARERA reformulated the pricing mechanism of gas supplies to those customers by providing a full indexation of the raw material cost component of the tariff to spot prices at the TTF (Title Transfer Facility) hub in Northern Europe, replacing the then current regime that provided a mix between an oil-based indexation and spot prices.
This tariff regime also reduced the tariff components intended to cover storage and transportation costs. Finally, it also increased the specific pricing component intended to remunerate certain marketing costs incurred by retail operators, including administrative and retention costs, losses incurred due to customer default and a return on capital employed.
This new gas tariff indexation aiming at safeguarding the households was initially intended to remain effective till July 1, 2019 (as provided by Law 124/17). However, this deadline had been already prorogated by one year (as per Law Decree 91/2018), and finally has been prorogated to January 2024. From that point onwards, in Italy households other than vulnerable customers will no longer have access to regulated tariffs for gas supplies. Consumers will have to choose among the different pricing proposals made by gas selling companies, while only vulnerable customers will be entitled to the regulated tariff after January 2024. The ARERA has established that gas selling companies comply with certain requirements about the offerings to customers which include at least two pricing indexations (fixed and variable), both complemented with contractual conditions regulated by the ARERA. Management believes that this development will increase competition in the Italian retail market for selling gas.
Given the context of rising prices that occurred between 2021 and 2022 in gas market, ARERA carried out a series of investigations to evaluate interventions on commodity prices and then decided to switch the gas raw material reference from TTF to PSV, with monthly update of the component covering wholesale natural gas supply costs for regulated customers.
In the electricity market the regulated prices phase out has been effective from July 1, 2021 for small enterprises (enterprise which employs fewer than 50 persons and whose annual turnover and/or annual balance sheet total does not exceed €10 million). For microenterprises (enterprise which employs fewer than 10 persons and whose annual turnover and/or annual balance sheet total does not exceed €2 million) the regulated prices phase out will be effective from April, 2023, while for households the deadline was furtherly prorogated to January 2024.
Other regulatory developments in the gas and electric sector in Italy and Europe
Within the scope of the costs and criteria for accessing the main logistic infrastructures of the gas system, the main risk factors for the business are linked to the periodic processes for defining the economic conditions and the rules for accessing transportation, LNG regasification and storage services, which periodically involve all the European countries in which Eni operates. Concerning gas transportation tariffs, in Italy and in the main European countries the last revision of the criteria for determining such tariffs and for recovering TSOs costs was implemented starting from 2020, for the 2020-2023 regulatory period, and the outcome of such process brought some improvements in our portfolio’s logistic costs. The re-definition of transportation tariffs criteria is in any case envisaged at pre-established deadlines in the various European countries – the next one is expected to take place starting from 2024 in most countries - and in the future it may still have impacts on logistic costs. Further rule changes – representing risk factors as well as business opportunities - could concern the regasification and storage sector, also in consideration of the current market context and the potential issues for the European security of supply due to the Russian-Ukrainian conflict.
Moreover, the current context of energy crisis is directing the European and national legislators towards evolutions - albeit temporary - of the legislation and the consequent regulations that can impact the market dynamics, in order to limit prices for end customers and improve the security of supplies (e.g. obligations to reduce final consumption, caps on prices of derivatives on wholesale gas products traded on regulated markets, possible storage obligations, tightening of use-it-or-lose-it rules on transportation capacity, obligations of ex-ante notification to the European Commission concerning new supply contracts).
From a retail perspective, there were a number of various measures adopted at national level. For example, in 2021, the Spanish government in a measure to protect final consumers with low voltage supplies (>10kW power), reduced VAT from 21% to 10% and in 2022 proceeded to lower it further, to 5%. However, while retailers invoice final costumers 5% VAT, distribution companies continue to invoice retailers at the normal 21% rate.
In France, during 2022, electricity and gas regulated tariffs were maintained below cost with a compensation distributed to all suppliers. For 2023, the government increased the frozen regulated electricity and gas tariffs by 15%. Although suppliers will continue to be compensated for 2023, this freeze will continue to have a negative impact on the competitiveness of alternative suppliers. Moreover, the amount of compensation is based on sales prices, which are set by the government below the suppliers' real costs. The ad hoc compensation mechanism introduced in 2022 for apartment blocks has also been extended until the end of 2023 and now covers both electricity and gas consumption. The government has also introduced a new support mechanism for SME electricity consumption throughout 2023. The compensation that suppliers will give to their customers (both condominiums and SMEs) will be financed by the government. Therefore, their financial and commercial impact is limited.
In Italy there have been some government interventions to contain retail prices such as:
| - |
cancellation of general system charges in the electricity sector, which in the gas sector even assume negative value | |
| - |
strengthening of social bonuses in both sectors | |
| - |
decrease of VAT in the gas sector |
In the medium term, we could expect that gas demand at European level will be supported by the need of accelerating the phase-out of coal based power generation in view of the decarbonisation targets and, in some countries, also by the envisaged phase out of nuclear power generation. On the other side, with the implementation of the EU Green Deal, in the medium term we could expect changes in the gas sector regulation, as a result of adjustments in the market design and / or new obligations or constraints deriving from the evolution of European regulations, in a context of energy transition and in line with the decarbonisation objectives of the energy sector (including the related objectives for the development of renewable or decarbonised gases, for the promotion of technologies enabling greater integration between the electricity and gas sectors, for the reduction of methane emissions). These changes will likely put pressures on the natural gas business, but on the other side they will likely open and support new business opportunities in the renewable and decarbonized gases business that Eni is ready to pursue.
For instance, in France a law signed in 2021 introduced a new obligation for gas suppliers to purchase Green Certificates (GC) in order to finance biomethane production in France. A first decree was issued, partially defining the mechanism for returning GCs to the government and the penalties in case of insufficient coverage (€100 per missing GC). Another decree is currently being prepared which should define the obligation levels for the coming years.
With regard to power sector, Italian Capacity Market auctions, taken place in November 2019 and in February 2022, allocated capacity with delivery in 2022, 2023 and 2024 to the power producers. During the delivery period the operators selected by the auctions will receive a fixed premium and, in return for this payment, they must i) offer power capacity on energy markets (day-ahead Market and intraday Market) and/or on the dispatching services market; ii) pay the difference between a market reference price and a pre-determined strike price whenever the reference price exceeds the strike price. Eni has been awarded all the capacity offered in the tenders so it will receive a net benefit for its existing Eni group’s power plants during the delivery period (2022, 2023 and 2024) and for a new power plant, that will be built in Ravenna, for a period of fifteen years (starting in 2023). There is a residual risk that the tenders could be canceled due to the administrative appeal filed by some power companies against the tender procedure.
The Capacity Market will be carried on after 2024 only if a new adequacy assessment conducted by the TSO will confirm the presence of adequacy concerns. The extension of Capacity Market, approved as consequence of adequacy assessment, it will stabilize the revenue of power generation from gas after 2024. In order to the reduce gas consumption to face the crisis concerning the Russian-Ukrainian war, Italian Government has published the Decree n.16, 28th February 2022, which envisages measures for the maximization of electricity produced by coal and oil power plants. The adoption of these measures would imply a reduction of the load factor of Enipower CCGT in the short term.
Besides, in the next years Italian power market design could significantly be affected by the implementation of European market model. The main innovations concern the introduction of negative prices and the launch of new Intraday Market based on continuous trading and gate-closure close to delivery period (h -1 gate closure), both adopted in the second half of 2021, fostering the cross-border integration of European energy and balancing market (coupling of intraday market, coupling of balancing reserves markets). Management believes that this development will increase competition, in particular in the Italian balancing market.
The ongoing revision of the European electricity market design carried by the Commission, as a result of the crisis, could lead to profound changes which would be felt across EU markets. In a public consultation launched in January, the Commission proposes a large range of policy changes to protect consumers from high prices. On 14 March the Commission’s proposal for a regulation would amend four pieces of legislation: the Electricity Directive 2019/944 and Regulation 2019/943, RED II (2018/2001, regarding support schemes for renewables) and Regulation 2019/942 establishing ACER. The proposal is more targeted and limited in the changes that were initially anticipated, most notably it conserves the merit-order pricing system. However, as it currently stands, it would introduce several obligations on suppliers. First, an obligation to offer fixed-price, fixed-term contracts, without first guaranteeing the possibility of charging termination fees. Second, it opens the possibility for Member States to require suppliers to cover part of their risk exposure using PPAs. Finally, it establishes the framework for declaring future price crisis, in which case Member States may impose below cost regulated prices, however, conditions are set whereby suppliers must be compensated for selling energy below cost, that there should be no discrimination between suppliers and that all suppliers are eligible to provide below cost offers on the same basis. This reform is likely to be adopted before the end of the year, and once the regulation enters into force, member states will have to prepare the necessary national measures within 6 months.
In order to limit the impacts of the scenario of high energy prices on households, the Italian government provided and has extended to IQ2023 with LAW 29 December 2022, n. 197 for:
| ● |
the temporary elimination of system charges for the electricity sector for all the final customers; | |
| ● |
the reduction of gas VAT to 5% for residential customers and the partial reduction of gas system charges; | |
| ● | the strengthening of the electricity and gas social bonus; | |
| ● |
the tax credit for electricity and gas customers. |
Moreover, the law n. 234 December 30, 2021 and the Decree-law n. 21 of March 21, 2022, provided for temporary installment of households bills, without interest, from January 1, 2022, to June 30, 2022.
With the Law Decree n.4 of January 27, 2022, , then amended with the Law Decree n. 115 of August 9, 2022, with the aim of limiting the effects of energy prices scenario, some urgent measures were defined, including an intervention on renewable power plants energy. In particular it was introduced a two-way compensation mechanism on the price of energy based on the difference between the reference prices given for GME area and market area price; this delta, applied to the energy produced from February 2022 to June 2023, will result in a flow from or to the GSE, thus affecting part of the profits of producers from renewable sources linked to the impact on electricity prices of the increase in gas prices.
The Group plants involved in the provision are the photovoltaic incentived with a fixed premium from Conto Energia, (installed power greater than 20 kW), supplied at market prices or with contracts at an average price 10% higher than the reference prices. The non-incentivized Group PV and wind plants, having entered into operation after 2010, are not involved in the intervention.
With the Law Decree n. 197 od December 29, 2022 (State budget for the financial year 2023 and multi-year budget for the three-year period 2023-2025), new implementing rules for Council Regulation (EU) 2022/1854 of October 6, 2022 were released, including a new extraordinary solidarity contribution charged to: persons exercising in the territory of the State, for the subsequent sale of commodities, the activity of producing electricity, persons exercising the activity of producing methane gas or extracting natural gas, persons reselling electricity, methane gas and natural gas, and persons exercising the activity of producing, distributing and trading petroleum products.
The solidarity contribution is determined by applying a rate equal to 50 percent to the amount of the portion of total income determined for corporate income tax purposes for the tax period 2022 that exceeds by at least 10 percent the average of total income determined for corporate income tax purposes earned in the four tax periods prior to the tax period current on January 1, 2022.
In Greece a similar measure was introduced in November 2022, whereby suppliers must pay an extraordinary solidarity contribution in case of “surplus revenues” between 1 August 2022 and 1 July 2023. A temporary mechanism for returning part of the retail market revenues is established during this period and applies on a quarterly basis. The monthly reasonable maximum retail price is the average physical cost of power, the reasonable supplier’s margin the system losses, operating costs, bad debts and other uncertainties. The ‘regulated’ gross margin (€/MWh) which will define the maximum reasonable price for all suppliers is a highly anticipated key decision by the Ministry of Energy. The difference between the above, plus any other hedging gains & losses, will be the “excess revenue”. If the difference is positive, will be returned (taxed) at 100%. If the difference is negative no return will be applied, netted with next months results.
Refining and marketing of petroleum products
Refining. The current regulations on refining activity in Italy provides that Italian administrative bodies authorize plans filed by refining operators intended to set up new processing and storage plants and to upgrade capacity, while all other changes that do not affect capacity can be freely implemented. This regime was streamlined by Law Decree No. 5/2012 (as converted in Law 35/2012) that defined mineral oil processing and storage plants as “strategic installations” that need authorization from the State, in agreement with the local administrations. The Decree introduced a unitized process of authorization that must be finalized within 180 days, subject to compliance with applicable environmental regulations.
Refining operations benefitted from a number of interventions aimed at lowering utility costs, temporarily adopted by the legislator as part of the energy crisis response package. These legislative support measures15, included reducing over 2022 the parafiscal levies (Oneri di Sistema) charged on electricity bills16, and introducing a new fiscal credit mechanism linked to the rise of wholesale energy costs.
Marketing. Following the enactment of the Law Decree No. 1/2012, certain measures are expected to be introduced in order to increase levels of competition in the retail marketing of fuels. The rules regulating relations between oil companies and managers of service stations have been changed introducing the difference between principal and non-principal of a service station. Starting from June 30, 2012, principals will be allowed to freely supply up to 50% of their requirements. In such case, the distributing company will have the option to renegotiate terms and conditions of supplies and brand name use. As for non-principals, the law allows the parties to renegotiate terms and conditions at the expiration of existing contracts and new contractual forms can be introduced in addition to the only one allowed so far, i.e. exclusive supply. The law also provides for an expansion of non-oil sales. Furthermore, the law 205/2017 provides some measures for preventing of tax evasion in the sale of oil products that in the past produced anticompetitive effects on the sector. The law requires the advance payment of Value Added Tax (VAT) on oil products before the extraction from deposits or the sale to consumer.
In 2019, the Law no 157/2019 introduced a set of measures to prevent illegal conduct/practices linked to fiscal fraud for the exchange of products in the retail fuel market. These regulatory initiatives will also address for more competition and efficiency of the sector. In 2020, the Budget Law 2021 (Law 178/2020) extends some measures to prevent fiscal frauds and introduces electronic communication for some information.
Service stations. Legislative Decree No. 32 of February 11, 1998, as amended by Legislative Decree No. 346 of September 8, 1999 and Law Decree No. 383 of October 29, 1999, as converted in Law No. 496 of December 28, 1999, significantly changed Italian regulation of service stations. Legislative Decree No. 32 replaces the system of concessions granted by the Ministry of Industry, regional and local authorities with an authorization granted by city authorities while the Legislative Decree No. 112 of March 31, 1998 still confirms the system of such concessions for the construction and operation of service stations on highways and confers the power to grant to Regions. Decree No. 32 also provides for: (i) the testing of compatibility of existing service stations with local planning and environmental regulations and with those concerning traffic safety to be performed by city authorities; (ii) the option to extend by 50% the opening hours (currently 52 hours per week) and a generally increased flexibility in scheduling opening hours; (iii) simplification of regulations concerning the sale of non-oil products and the permission to perform simple maintenance and repair operations at service stations; and (iv) the opening up of the logistics segment by permitting third -party access to unused storage capacity for petroleum products. Subsequently, various regulations have been enacted in Italy with the aim of improving network efficiency, modernizing service stations and opening up the market. Currently, all service stations are provided with self-service equipment and the sale of non-oil products has been broadly introduced by local administrative bodies.
Law Decree No. 1/2012 also allowed the installation of fully automated service stations with prepayment, but only outside urban areas. Law No. 133 of August 6, 2008, by intervening in competition provisions, removes some national and regional regulations, which might limit the liberty of establishment and introduces new provisions particularly concerning the elimination of restrictions concerning distances between service stations, the obligation to undertake non-oil activities and the liberalization of opening hours.
The new regulatory framework provided by the legislative decree No 257/2016 – implementing EU Directive 2014/94/UE on alternative fuel infrastructures – has introduced minimum requirements for the construction of infrastructure for the development of alternative fuels to mitigate the environmental impacts of the transport sector. The legislation established, furthermore, an adequate number of charging stations accessible to the public to be created throughout the country by 2020.
Law no. 124/2017 aims to promote the structural reorganization of the fuel distribution network also in order to increase competition and efficiency. The law requires the closure of fuel stations that are incompatible with road safety regulations and environmental streamlining procedures for the decommissioning. The Law Decree 76/2020 extended the simplified procedures for the fuel station decommissioning by 2023.
15Law Decree No 4/2022 converted into Law 25/2022, Law Decree No 50/2022 converted into Law 91/2022, Law Decree No 21/2022 converted in Law 51/2022, Law Decree No 115/2022 converted into Law 142/2020, Law Decree No 144/2022 converted into Law No 175/2022, Law Decree No 17/2022 converted into Law 34/2022, Law Decree No 80/2022 converted into Law No 91/2022.
16 The measure is not limited to industrial customers but covers also the commercial sector and households.
The 2021 Budget law (Law 178/2020) introduced the obligations for concessionaires’ highway stations to provide electric charging points (up to 50 kW) within their own area of competence. Finally, the Law Decree 76/2020 introduced simplified procedures for the installation of electric charging points and stations and incentives to be recognized by local authorities (i.e. tax reduction or exemption for public land use).
Moreover, the annual Competition Law for 2022 (legislative decree No 118/2022) provides for competitive, transparent and non-discriminatory procedures for the selection of the operators responsible for the installation of electric recharging points on the highways network (fast and ultra-fast).
Law Decree 121/2021 (“Infrastructures and transport”) defined a two-year prorogation for fuel distribution concessions on highways and further - for 2021 - upheld support for purchasing low-emission vehicles. Also for 2022, the incentives for the purchase of low-emission vehicles have been provided by Law Decree No 17/2022 converted into Law 34/2022.
Management believes that these measures will favor competition in the Italian retail market and enhance the competitiveness of efficient players.
Renewables uptake in the transport sector. In order to support the achievement of the renewables target in the transport sector established by the EU and national laws, the Ministerial Decree of March 2, 2018, provides the legislative framework to incentivize the production of both biomethane and other advanced biofuels to be used in the transport sector.
The Decree provides incentives for plants starting operations between 2018 and 2022 and to plants that are converted to biomethane production.
The incentive consists in an allocation of a Certificate (CIC) for every 10 Gcal of biomethane produced. The certificate has a market value since fossil fuel marketers have to sell a minimum percentage of biofuels annually, for which they receive the same Certificates.
In order to access to incentives, producers must comply with legal and technical regulations governing the quality and certification of the produced biomethane, verified by the competent Authority (Gestore dei Servizi Energetici, GSE).
These measures aim to favor advanced biofuels production through the valorization of waste, notably of agricultural and farm/zootechnical waste.
Regarding biomethane, the incentive scheme has been updated, following approval by the European Commission, by the Ministerial Decreee of September 15th 2022. The mechanism consists of an operating aid – in the form of a CfD linked to the value of natural gas and of the biomethane Guarantee of Origin, auctioned through a competitive procedure – and an investment aid – covering up to 40% of the allowed investment costs and funded by the NRRP. The mechanism differentiates between new plants and refurbishments and between agro or waste-based plants.
At the end of 2020, the Ministerial Decree of October 2014 on conditions, criteria and implementation of biofuels (conventional and advanced) obligations for suppliers was modified. Among the novelties, were introduced the increase of the overall 2021 target from 9% to 10% and a new additional target of 0,5% of advanced liquid biofuels to be mandatory blended by each supplier (outside the incentive scheme provided by DM 2018).
Law-Decree No 17/2022 (converted into Law No 34/2022) further developed the regime set in Legislative Decree No 199/2021 (transposing Directive (EU) 2018/2001 - REDII), introducing an obligation to supply pure bioliquids to be used in the transport sector (additional to the existing obligation on biofuels). The measure requires a mandatory cumulative share of at least 300 ktonnes released in 2023, with volumes increasing by 100 ktonnes per year and reaching 1 million tonnes per year from 2030 onwards.
The measure also incentivizes, by means of investment aid, existing refineries conversions aimed at producing the above-mentioned pure biofuels. The incentive is financed by the Fund for the decarbonisation and green conversion of existing refineries, established under the Ministry of environment and energy security with an overall budget of € 260 million for the three-year period 2022-24.
Provisions regarding both supply obligation and reconversion funding will be implemented by Decrees, which are expected to be issued in 2023.
Law no. 128/2019 anticipated the transposition of the EU regulation on End of Waste and the authorization stall has been unlocked. Italian Regions can now authorize the recycling and recovery systems “on a case-by-case basis”, pending the adoption of the regulations on individual processes.
The Directive (EU) 2018/2001 on the promotion of the use of energy from renewable sources confirms the use of some wastes as feedstock for the production of biofuels and allows the calculation of recycled carbon fuels for the purposes of the transport target, based on the criteria that will be issued by the European Commission.
The Directive has been transposed with the Legislative Decree No 199/2021. The Decree set new targets for RES penetration in the transport sector (16%) and introduced some innovations in the transport sector’s regulatory framework: i) palm-oil, PFAD and EFB based fuels cannot contribute to RES targets in the transport sector. However, they can be taken into account if certified as low-ILUC risk ii) biomethane support schemes – as defined by the Ministerial Decree of March 2, 2018 – will be updated by June 2022 iii) Recycled Carbon Fuels count as renewable towards the general target, on the basis of the upcoming EU delegated acts.
Law 238/2021 (European Law 2019-2020) confirmed the GHG saving requirement (6%) previously set for the year 2020 only and revised the calculation methodology for the current 7% maximum threshold for food-and-crop derived biofuels. The law excludes from the calculation fuels based on double counting feedstock.
With 2021 budget law and other several Acts (Law Decree 34/2020,104/2020, Legislative Decree 187/2021), new measures and extension of existing provisions for sustainable mobility have been adopted in order to decarbonize the transport sector, through incentive mechanisms for lowemission vehicles.
National Recovery and Resilience Plan (NRRP – Piano Nazionale Ripresa e Resilienza). The NRRP, as approved by the Italian Parliament in April 2021, includes relevant proposal for the R&M business area. It allocates €230 million to develop at least 40 recharging stations based on hydrogen for light and heavy vehicles by 2026. It also assigns €730 million for the installation of charging infrastructures for electric vehicles, envisaging the entry in operation, by 2025, of a minimum of 7.500 rapid recharging stations along freeways (at least 175 kW) as well as 13.000 rapid recharging stations in urban areas (at least 90 kW).
Petroleum product prices. Petroleum products’ prices were completely deregulated in May 1994 and are now freely established by operators. Oil and gas companies periodically report their recommended prices to the Ministry of Economic Development; such recommendations are considered by service station operators in establishing retail prices for petroleum products.
In order to mitigate the recent energy prices spikes, new legislative support measures have been introduced in Italy in 2022 to remodulate the tax burden (excise), from March to December, on petrol and diesel fuel prices for the automotive sector,aimed at lowering consumer prices17
Compulsory stocks. According to Legislative Decree of January 31, 2001, No. 22 (“Decree 22/2001”) enacting Directive No. 1993/98/EC (which regulates the obligation of Member States to keep a minimum amount of stocks of crude oil and/or petroleum products) compulsory stocks, must be at least equal to the quantities required by 90 days of consumption of the Italian market (net of oil products obtained by domestically produced oil). In order to satisfy the agreement with the International Energy Agency (Law No. 883/1977), Decree No. 22/2001 increased the level of compulsory stocks to reach at least 90 days of net import, including a 10% deduction for minimum operational requirements. Decree No. 22/2001 states that compulsory stocks are determined each year by a decree of the Minister of Ecological Transition based on domestic consumption data of the previous year, defining also the amounts to be held by each oil company on a site-by-site basis. The Legislative Decree No. 249/2012, entered into force on February 10, 2013 to implement the Directive No. 2009/119/EC (imposing an obligation on Member States to maintain minimum stocks of crude oil and/or petroleum products), sets forth in particular: (a) that a high level of oil security of supply through a reliable mechanism to assure the physical access to oil emergency and specific stocks shall be kept; and (b) the institution of a Central Stockholding Entity under the control of the Ministry for Economic Development that should be in charge of: (i) the purchase, holding, sell and transportation of specific stocks of products; (ii) the stocktaking; (iii) the statistics on emergency, specific and commercial stocks; and, eventually (iv) the storage and transportation service of emergency and commercial stocks in favor of sellers of petroleum products not vertically integrated in the oil chain.
As of December 31, 2022, Eni owned 5.1 mmtonnes of oil products inventories, of which 2.8 mmtonnes as “compulsory stocks”, 2.1 mmtonnes related to operating inventories in refineries and deposits (including 0.2 mmtonnes of oil products contained in facilities and pipelines) and 0.2 mmtonnes related to specialty products. Eni’s compulsory stocks were held in term of crude oil (31%), light and medium distillates (28%), refinery feedstock (29%), fuel oil (6%), Hydrotreated Vegetable Oil (3%) and other products (3%) were located throughout the Italian territory both in refineries (90%) and in storage sites (10%).
Competition
Like all Italian companies, Eni is subject to Italian and EU competition rules. EU competition rules are set forth in Articles 101 and 102 of the Lisbon Treaty on the Functioning of the European Union entered into force on December 1, 2009 (“Article 101” and “Article 102”, respectively being the result of the new denomination of former Articles 81 and 82 of the Treaty of Rome as amended by the Treaty of Amsterdam dated October 2, 1997 and entered into force on May 1, 1999) and EU Merger Control Regulation No. 139 of 2004 (EU Regulation 139). Article 101 prohibits collusion among competitors that may affect trade among Member States and that has the object or effect of restricting competition within the EU. Article 102 prohibits any abuse of a dominant position within a substantial part of the EU that may affect trade among Member States. EU Regulation 139 sets certain turnover limits for cross-border transactions, above which enforcement authority rests with the European Commission and below which enforcement is carried out by national competition authorities, such as the Antitrust Authority in the case of Italy. On May 1, 2004, a new regulation of the European Council came into force (No. 1/2003) which substitutes Regulation No. 17/1962 on the implementation of the rules on competition laid down in Articles 101 and 102 of the Treaty. In order to simplify the procedures required of undertakings in case of conducts that potentially fall within the scope of Article 101 and 102 of the Treaty, the new regulation substitutes the obligation to inform the Commission with a self-assessment by the undertakings that such conducts do not infringe the Treaty. In addition, the burden of proving an infringement of Article 101(1) or of Article 102 of the Treaty shall rest on the party or the authority alleging the infringement. The undertaking or association of undertakings claiming the benefit of Article 101(3) of the Treaty shall bear the burden of proving that the conditions of that paragraph are fulfilled. The regulation defines the functions of authorities guaranteeing competition in Member States and the powers of the Commission and of national courts. The Competition Authorities of the Member States shall have the power to apply Articles 101 and 102 of the Treaty in individual cases. For this purpose, acting on their own initiative or on a complaint, they may take the following decisions:
17Law Decree No 21/2022 converted into Law No. 51/2022, Law Decree No 115/2022 converted into Law No 142/2022, Law Decree No 144/2022 converted into Law No 175/2022, Law Decree No 176/2022 converted into Law 13/2023.
| ● |
requiring that an infringement be brought to an end; | |
| ● |
ordering interim measures; | |
| ● |
accepting commitments; and | |
| ● | imposing fines, periodic penalty payments or any other penalty provided for in their national law. |
National courts shall have the power to apply Articles 101 and 102 of the Treaty. Where the Commission, acting on a complaint or on its own initiative, finds that there is an infringement of Article 101 or of Article 102 of the Treaty, it may: (i) require the undertakings and associations of undertakings concerned to bring such infringement to an end; (ii) order interim measures; (iii) make commitments offered by undertakings to meet the concerns expressed to them by the Commission binding on the undertakings; and (iv) find that Articles 101 and 102 of the Treaty are not applicable to an agreement for reasons of Community public interest. Eni is also subject to the competition rules established by the Agreement on the European Economic Area (the “EEA Agreement”), which are analogous to the competition rules of the Lisbon Treaty (ex Treaty of Rome) and apply to competition in the European Economic Area (which consists of the EU and Norway, Iceland and Liechtenstein). These competition rules are enforced by the European Commission and the European Free Trade Area Surveillance Authority. In addition, Eni’s activities are subject to Law No. 287 of October 10, 1990 (the “Italian Antitrust Law”). In accordance with the EU competition rules, the Italian Antitrust Law prohibits collusion among competitors that restricts competition within Italy and prohibits any abuse of a dominant position within the Italian market or a significant part thereof. However, the Italian Antitrust Authority may exempt for a limited period agreements among companies that otherwise would be prohibited by the Italian Antitrust Law if such agreements have the effect of improving market conditions and ultimately result in a benefit for consumers.
Regulation EU 852/2020 of the European Parliament and of the Council enacted in June 2020 has established the criteria for determining whether an economic activity qualifies as environmentally sustainable for the purposes of establishing the degree to which an investment is environmentally sustainable. Based on the Regulation, an economic activity qualifies as environmentally sustainable where that economic activity:
| (a) | contributes substantially to one or more of the environmental objectives of the EU (set out in Article 9 of the Regulation); | |
| (b) | does not significantly harm any of the environmental objectives; | |
| (c) | is carried out in compliance with the minimum safeguards foreseen by the Regulation, which are procedures implemented by an undertaking that is carrying out an economic activity to ensure the alignment with the OECD Guidelines for Multinational Enterprises and the UN Guiding Principles on Business and Human Rights, including the principles and rights set out in the eight fundamental conventions identified in the Declaration of the International Labour Organisation on Fundamental Principles and Rights at Work and the International Bill of Human Rights; | |
| (d) | complies with technical screening criteria that have been established by the Commission, which define the performance thresholds whereby an economic activity offers a substantial contribution to an environmental objective and at the same time does not hurt in a significant way any of the other objectives. |
The Taxonomy Regulation has established six environmental objectives:
| 1. | Climate change mitigation | |
| 2. | Climate change adaptation | |
| 3. | The sustainable use and protection of water and marine resources | |
| 4. | The transition to a circular economy | |
| 5. | Pollution prevention and control | |
| 6. | The protection and restoration of biodiversity and ecosystems. |
Identification of Eni’s eligible and Taxonomy-aligned activities
The Taxonomy Regulation establishes technical screening criteria “TSC” for environmental sustainability with respect to the above-mentioned six environmental objectives, identifying several economic activities. The technical screening criteria (“TSC”) for each of the above-mentioned environmental objectives are established by the Commission by means of delegated acts based on the power conferred by the Taxonomy Regulation and subject to the conditions laid down in the Regulation itself.
So far, criteria have been approved for activities contributing to the first two objectives, climate change mitigation and climate change adaptation. Criteria for the four remaining objectives are expected to be adopted by the EU in 2023.
An activity is "taxonomy-eligible" if it is described in a delegated act adopted under the Taxonomy Regulation, irrespective of whether it complies with the technical screening criteria. Such an activity could potentially make a substantial contribution to a given environmental objective.
An activity is "taxonomy-aligned" if it contributes substantially to one or more environmental objectives, does no significant harm “DNSH” to any of the other objectives, is carried out in compliance with minimum human and labor rights safeguards, and complies with the relevant technical screening criteria.
Eni has assessed the economic activities performed by the Group against the economic activities qualifying for the taxonomy’s climate mitigation and climate adaptation objectives, which have been identified by Delegated Regulation EU 2021/2139 (the "Climate Delegated Act") and the nuclear and gas-related activities listed in Delegated Regulation EU 2022/1214 (the "Complementary Climate Delegated Act").
This assessment has comprised a two-step process: first, the Group economic activities have been screened to score those eligible in accordance with the above-mentioned delegated acts. Then, the technical screening criteria have been applied to verify alignment of each of the Group’s eligible economic activities with the relevant TSC to verify the substantial contribution criteria and respect of the DNSH criteria. The assessment of compliance with the minimum safeguards provided by art. 3 “c” of the Regulation has been performed at Group level.
Reporting obligations and basis of presentation
Based on article 8 of the Taxonomy Regulation, non-financial undertakings which are subject to the obligation to publish a consolidated non-financial statement pursuant to Article 19a or Article 29a of Directive 2013/34/EU of the European Parliament and of the Council are required to comply with a transparency regime by disclosing in their non-financial statements three key performance indicators (KPI) relating to the proportion of their turnover derived from products or services associated with economic activities that qualify as environmentally sustainable and the proportion of their capital expenditure and the proportion of their operating expenditure related to assets or processes associated with economic activities that qualify as environmentally sustainable as per the Regulation. The Commission has adopted a delegated regulation (2178/2021) specifying the content of KPIs and presentation of information concerning environmentally sustainable economic activities and the reporting methodology. Disclosures presented herein by Eni are intended to comply with that regulation.
EU Taxonomy Disclosures as per Annex I to COMMISSION DELEGATED REGULATION (EU) 2021/2178
KPIs of non-financial undertakings
|
EUROPEAN TAXONOMY: SUMMARY TEMPLATE OF ENI GROUP KPI |
|||||||||
|
Eni Group - Year 2022 |
TURNOVER |
CAPEX |
OPEX |
||||||
|
Absolute amount in € mln |
proportion % |
Absolute amount in € mln |
proportion % |
Absolute amount in € mln |
proportion % |
||||
|
A. Taxonomy-Eligible activities |
7.5% |
17.5% |
12.1% |
||||||
|
A.1. Environmentally sustainable activities (Taxonomy-Aligned) |
823 |
0.6% |
1,753 |
14.1% |
75 |
1.8% |
|||
|
A.2. Taxonomy-Eligible but not environmentally sustainable activities |
9,051 |
6.9% |
419 |
3.4% |
428 |
10.3% |
|||
|
TOTAL A.1 + A.2 |
9,874 |
7.5% |
2,172 |
17.5% |
503 |
12.1% |
|||
|
B. Taxonomy-Non-Eligible activities |
122,638 |
92.5% |
10,224 |
82.5% |
3,657 |
87.9% |
|||
|
TOTAL A+B |
132,512 |
100.0% |
12,396 |
100.0% |
4,160 |
100.0% |
|||
1. Content of KPIs
1.1. Specification of key performance indicators (KPIs)
1.1.1. KPI related to turnover (turnover KPI)
Eni Group’s consolidated financial statements are prepared in accordance with the International Financial Reporting Standards “IFRS” as adopted by Commission Regulation (EC) 1126/2008.
In compliance with that, the Group turnover and the turnover relating to Taxonomy-aligned economic activities and to Taxonomy-eligible economic activities (not Taxonomy-Aligned activities) have been recognised pursuant to International Accounting Standard (IAS) 1, paragraph 82(a).
The 7.5% share of eligible and aligned turnover is calculated as the part of turnover derived from eligible or aligned economic activities (numerator) divided by total turnover (denominator). Eligible and aligned economic activities are described under paragraph 1.2.2. The denominator comprises the Sales from operations (Revenue) line from the Consolidated Statement of Income. A reconciliation is provided below:
|
Turnover |
Aligned |
Eligible |
Total |
|||
|
(€ million) |
activities |
activities |
Group |
|||
|
Revenues from contracts with customers (sales from operations) |
823 |
|
9,051 |
|
132,512 |
The proportion of turnover referred to in Article 8(2), point (a), of Regulation (EU) 2020/852 “turnover KPI” is calculated as the part of the turnover derived from products or services associated with Taxonomy-aligned economic activities (numerator), divided by the Group total turnover (denominator).
The Group turnover and the turnover of eligible and aligned economic activities are recognized net of the effects of commodity derivatives activated to manage the Group’s exposure to movements in the prices of energy commodities, which qualify and are designated as cash flow hedges due to the efficacy of the relationship between the instrument and the hedged item, whereby a cash flow is either paid or received at the delivery of the underlying commodity. The mark-to-market of cash flow hedges relating to a forecast transaction are taken to other comprehensive income.
Other commodity derivatives utilized by the Group to manage exposure to the commodity risks, which lack the requirements to be recognized in accordance with the own use exemption or to be qualified as hedges in accordance with IFRS, are marked to market with gains or losses recognized through profit and loss in a separate line item from revenues. Such line item comprises the ineffective portion of cash flow hedges.
1.1.2. KPI related to capital expenditure (CapEx) (CapEx KPI)
Capital expenditure “CapEx” of the Eni Group and the “CapEx” relating to eligible economic activities and to aligned economic activities cover costs that are accounted based on:
(a) IAS 16 Property, Plant and Equipment, paragraphs 73, (e), point (i) and point (iii);
(b) IAS 38 Intangible Assets, paragraph 118, (e), point (i);
(c ) IFRS 16 Leases, paragraph 53, point h).
CapEx also covers additions to tangible and intangible assets resulting from business combinations.
The Group does not engage in economic activities that are recognized in accordance with IAS 40 and IAS 41.
The 17.5% share of CapEx of eligible and aligned economic activities is calculated as the part of CapEx derived from eligible or aligned economic activities (numerator) divided by total Group CapEx (denominator). Eligible and aligned economic activities are described under paragraph 1.2.2. The denominator comprises additions recognized in the financial year to the following line items of the Group’s assets reported in the Group statement of financial positions at December 31, 2022: “Property, plant and equipment”, “Intangible assets and goodwill” and “Right of Use” as disclosed under footnotes no. 12, 13 and 14 to the Group consolidated financial statements. A reconciliation is provided below:
|
Capex |
Aligned |
Eligible |
Total |
|||
|
(€ million) |
activities |
activities |
Group |
|||
|
Additions to tangible and intangible assets |
460 |
408 |
8,056 |
|||
|
Additions to right of use assets |
7 |
11 |
2,404 |
|||
|
Fair value of acquired tangible and intangible assets |
1,286 |
1,936 |
||||
| Acquired goodwill | 482 | |||||
|
Less: |
|
|||||
|
Goodwill |
(482) |
|||||
|
Total Capex |
1,753 |
|
419 |
|
12,396 |
The proportion of CapEx referred to in Article 8(2), point (b), of Regulation (EU) 2020/852 “CapEx KPI” is calculated as the part of CapEx relating to aligned economic activities (numerator) divided by the Group total CapEx (denominator) as specified in points 1.1.2.1. and 1.1.2.2. of Annex I to Commission Delegated Regulation (Eu) 2021/2178.
1.1.3. KPI related to operating expenditure (OpEx) (OpEx KPI)
The 12.1% share of eligible and aligned operating expenditure “OpEx” is calculated as the part of OpEx relating to eligible or aligned economic activities (numerator) divided by the Group total Opex (denominator). Eligible and aligned economic activities are described under paragraph 1.2.2. A reconciliation is provided below:
|
Opex |
Aligned |
Eligible |
Total |
|||
|
(€ million) |
activities |
activities |
Group |
|||
|
Costs of R&D expensed through profit and loss |
86 |
164 |
||||
|
Operating expenses |
75 |
342 |
3,996 |
|||
|
Total Opex |
75 |
|
428 |
|
4,160 |
The proportion of OpEx referred to in Article 8(2), point (b), of Regulation (EU) 2020/852 “OpEx KPI” is calculated as the Opex of aligned economic activities (numerator) divided by the Group total OpEX denominator as specified in points 1.1.3.1. and 1.1.3.2. of Annex I to Commission Delegated Regulation (Eu) 2021/2178.
1.2. Specification of disclosures accompanying the KPIs of non-financial undertakings
1.2.1. Accounting policy
Economic and financial data relating to Eni’s eligible and aligned economic activities for calculating the Taxonomy’s KPIs and proportion of eligible turnover, capex and opex, have been extracted from the Group accounting systems, the general ledger and the management accounting systems, which are used to prepare the separate financial statements of each consolidated subsidiary undertakings, mostly of which are in accordance with IFRS. Data extracted from separate financial statements are adjusted to align with the IFRS utilized in the preparation of the Group consolidated financial statements and for the consolidation transactions (intercompany sales and purchases, elimination of unrealized profit, etcetera) to calculate Eni’s Taxonomy KPIs and the eligible turnover, capex and opex proportion.
Therefore, data of turnover, OpEx and CapEx relating to Eni Group’s aligned and eligible economic activities utilized in calculating the Taxonomy KPIs and the proportion of eligible activities are the same the Group used in preparing the consolidated financial statements.
In case of mono-business consolidated subsidiary undertakings performing a given eligible activity, relevant economic and financial data for the calculation of the Group eligible proportions have been extracted from the general ledger and the financial accounting to retrieve amounts of revenues, operating expenditures, additions to property, plant and equipment (PP&E) and intangible assets, additions to the right-of-use and additions to PP&E and intangibles resulting from business combinations. In case of multi-business subsidiary undertakings, relevant data for calculating the Group eligible proportions have been derived also from the systems of managerial accounting that splits the accounts of the financial system and allocates revenues and cost amounts to different reporting objects: profit centers which correspond to business units, product lines which can share common costs, plants, capital projects, cost centers, etcetera, to support management’s understanding of the drivers of the financial performance and cost control.
Such structure of accounting flows, which is employed in preparing the Group consolidated financial statements, ensure that turnover, OpEx and CapEx are recognized by the economic activity where the underlying transactions occur, by this way avoiding double counting. This explained by evidence that amounts recognized or allocated by the managerial accounting system are reconciled with the accounting system and the general ledger. Common costs are apportioned to different reporting objectives and economic activities based on disaggregation criteria that reflect how common inputs are absorbed.
Operating costs of Eni Group companies to define the proportion of the opex of aligned and eligible activities to the Group total were determined on the basis of the managerial accounting system and Eni’s control model of fixed costs which, starting from accounting data relating to purchases of goods and materials, services, labour costs and other charges, excludes raw materials costs, industrial plant variable costs and costs of products for resale and aggregates the remaining cost items in relation to the different measurement and control stages in the manufacturing/sale process:
- fixed industrial costs which include the labor costs for personnel involved in the maintenance, operation and servicing of industrial plants, third-party services (mainly maintenance contracted to third parties), general plant costs, consumables (spare parts and components to modernize plants) and include energy efficiency actions on buildings and other properties, as well as the purchase of outputs from aligned activities to achieve CO2 emission reductions;
- non-capitalised research & development costs;
- commercial&marketing fixed costs;
- general and administrative costs.
For the purposes of reporting obligations, management has identified industrial fixed costs and non-capitalised R&D costs as the aggregate "opex" operating expenses corresponding to the definition of the denominator adopted by the Delegated Regulation on reporting.
In line with the provisions, the opex incurred to purchase enabling products or in relation to enabling manufacturing processes have been claimed by the economic activities carried out by Eni in compliance with Art. 16 of the Taxonomy Regulation so that do not lead to a lock-in of assets that undermine long-term environmental goals, considering their economic life. In this context, the opex incurred by the E&P sector to increase energy efficiency/reduce CO2 emissions at oil & gas plants were excluded. This principle has also been applied to capex.
1.2.2. Assessment of compliance with Regulation (EU) 2020/852
1.2.2.1. Information on assessment of compliance with Regulation (EU) 2020/852
Eni’s eligible activities for purpose of assessing their substantial contribution to the objective of climate change mitigation are:
3.14 Manufacture of organic basic chemicals: production of monomers and other basic chemicals from oil-based feedstock and ethane.
3.17 Manufacture of plastics in primary form: production of polyethylene and styrene’s obtained by processing monomers.
4.1 Electricity generation using solar photovoltaic technology: photovoltaic installations are managed by the Group subsidiary Plenitude and are located mainly in Italy, Spain, USA, Australia and France;
4.3 Electricity generation from wind power: the production is obtained from onshore windmills that are managed by the Group subsidiary Plenitude and are located mainly in Italy, Spain, Kazakhstan;
4.4 Electricity generation from ocean energy technologies: it is an inertial sea wave energy converter to convert the wave energy into electrical energy. This activity is in an experimental phase.
4.8 Electricity generation from bioenergy: production of electricity in installations with a total rated thermal input below 2 MW and using gaseous biomass fuels.
4.13 Manufacture of biogas and biofuels for use in transport and of bioliquids: production of biofuels by means of hydrogenating bio feedstock or waste organic materials. The manufactured product is a hydrogenated vegetable oil (HVO) that can be used as pure fuel or blended with fossil fuels to obtain a reduction in emitted CO2 from combustion. This activity is performed at the biorefinery of Gela (Sicily) and Venice with total production capacity of 1.1 mln tons/y.
4.20 Cogeneration of heat/cool and power from bioenergy: production of steam and electricity by means of cogeneration, utilizing forestry biomass at the Crescentino plant (Italy).
5.3-5.4 Construction, extension and operation of wastewater collection, treatment and supply systems and renewal of wastewater collection, treatment and supply system.
5.7 Anaerobic digestion of bio-waste: anaerobic digestion, biogas production and subsequent cogeneration for electricity production, as well as compost, at the Po' Energia Srl plant from organic fraction coming from the separate collection of municipal waste.
5.12 Underground permanent geological storage of CO2: this activity leverages depleted reservoirs operated by Eni. The main ongoing projects are the Hyte hub in UK to upgrade Eni’s depleted reservoirs in the Liverpool bay to permanently store CO2 emitted by local businesses in hard-to-abate industries and the Ravenna hub, off Italy.
6.5 Transport by motorbikes, cars and light commercial vehicles: Enjoy rental service based on the "free floating" model with collection and release of the vehicle at any point within the area covered by the service. The fleet consists of internal combustion, hybrid and electric vehicles.
6.15 Infrastructure enabling low carbon road transport and public transport: this activity comprises construction, maintenance, and operations of electric charging points for EV, and is performed by Eni’s subsidiary Plenitude. As of December 31, 2022, the network operated by Plenitude consisted of about 13 thousand recharging points.
The Company has excluded from its eligible activities the following activities:
3.10 Manufacture of hydrogen;
6.10 Sea and coastal freight water transport, vessels for port operations and auxiliary activities, which support hydrocarbons;
6.15 Infrastructure enabling low carbon road transport and public transport, which support fossil fuels.
The reason is their non-compliance with the lock-in clause stated at art. 16 of the Taxonomy.
Those activities are also eligible for the objective of climate change adaptation. However, the Group does not engage in economic activities that manufacture productions and solutions for climate change adaptation. Therefore, the objective of climate change adaptation has been assessed as far as necessary to verify that each of Eni’s eligible economic activities does not significantly harm any of the environmental objectives of the Taxonomy, in compliance with art. 3 of regulation (UE) 2020/852.
Eni has assessed whether its eligible economic activities are environmentally sustainable in compliance with the provisions of art. 3 of regulation (UE) 2020/852 complemented by Commission delegated regulation (UE) 2021/2139 adopted pursuant to articles 10-11 par. 3 of the above mentioned regulation, which establishes the technical screening criteria which set the performance conditions whereby an economic activity can be claimed to contribute substantially to the objective of climate change mitigation, does not significantly harm any of the environmental objectives of the Taxonomy and is carried out in compliance with the minimum safeguards laid down in Article 18 of regulation (UE) 2020/852. Based on those evaluations, the Group concluded that the following activities are environmentally sustainable as per regulation (UE) 2020/852.
4.1. Electricity generation using solar photovoltaic technology
Substantial contribution to climate change mitigation
The activity generates electricity using solar PV technology.
Do no significant harm (‘DNSH’)
Climate change adaptation.
The management has assessed the risk of exposure of the Group’s assets to climate-related acute and chronic hazards, following the guidelines of Appendix A to the Climate Delegated Regulation, setting generic criteria for DNSH to climate change adaptation.
The Group has put in place management control systems and procedures to identify, evaluate and mitigate physical climate risks, which the Company defines as the risk that potential perspective changes in meteorological patterns and extreme weather phenomena linked to climate change expected in the long-term may have adverse and significant effects on assets’ future performance, on the safety of operations and on expected future cash flows, so to significantly harm the objective of climate change adaptation.
The management regularly reviews the exposure of the Group’s assets to the acute and chronic climate-related hazards described in the above-mentioned Appendix A and other natural hazards based on a proprietary methodology to identify physical climate risks over a long-term horizon. The purpose of this risk assesment is to define and execute mitigation plans designated to adapt the Group assets to current or expected risks, considering the already existing barriers at each Company’s asset.
Eni’s assessment methodology of assets’ exposure to natural hazards features the following steps:
- It utilizes input data furnished by an external provider (currently Verisk Maplecroft), which has elaborated geographic maps of prospective climate-related risks ensuring a full coverage of onshore and offshore areas where Eni’s assets are located. The sources of such climate maps combine the most updated climate forecast models, also incorporating historical weather patterns, to provide expected qualitative trends in the evolution of climate-related events.
- It develops a stress test of the current asset portfolio, without limiting to assets’ residual useful lives, to evaluate the potential, perspective exposure to climate-related risks till 2050.
- It is performed yearly, and it will undergo continuous improvement based on the experience that will be accumulated over time, as well as the evolution in the framework on how to identify and measure climate-related risks.
- It utilizes the IPCC RPC 8.5 scenario to project the expected future geographical maps of climate-related hazards.
- It utilizes the geographic coordinates of each Company’s asset (longitude and latitude) to locate it in a given quadrant (each with an area of twenty square kilometers) as defined by the external provider to recognize the climate-related risks, which each asset is potentially exposed to over a thirty-year horizon based on the adopted climate scenario.
- It considers in the risk-evaluating process also third-party assets and assets of the supply chain, where relevant to a full understanding of the risks which each Eni’s asset is exposed.
Once climate-related hazards have been identified and classified, the management evaluates each asset’s existing barriers or mitigating factors both physical ones (structural characteristics of an asset design, materials used in its construction, distance from the sources of possible hazards, containment walls, etcetera) and systems and procedures (early warning systems, procedures to put in safety plants and equipment, existence of monitoring and verification plans, etcetera).
The outcome of that review informs the management of the residual risk which each assets remains exposed to, and how to define the action plan to achieve the objective of climate change adaptation:
- In case of chronic climate-related hazards, monitoring activities are designed, planned, and carried out leading to the possible implementation and follow-up of remediation measures.
- In case of acute climate-related hazards, an adaptation plan is assessed, designed, and implemented, which can comprise updates to operating procedures, the execution of works to upgrade or increase assets’ safety and the resilience to the identified physical climate risks, or an asset reconfiguration taking into account its useful residual life.
Based on the assessment of this activity’s exposure to climate-related hazards following the methodology and procedures described herein, the management has concluded that the Company’s PV facilities are not exposed to any significant physical climate risk considering the facilities residual useful lives and assets features and barriers. Therefore, this activity does not significantly harm the objective of climate change adaptation.
Transition to a circular economy
The activity has assessed availability of and, where feasible, it is using equipment and components of high durability and recyclability and that are easy to dismantle and refurbish.
Protection and restoration of biodiversity and ecosystem
Eni’s PV installations have obtained before the start of construction works an Environmental Impact Assessment in compliance with Directive 2011/92/EU or a proper authorization based on an equivalent environmental assessment in case of installations located outside EU. Therefore, this activity does not significantly harm the objective of the protection and restoration of biodiversity and ecosystem.
4.3. Electricity generation from wind power
Substantial contribution to climate change mitigation
The activity generates electricity from wind power.
DNSH
Climate change adaptation
Based on the assessment of this activity’s exposure to climate-related hazards following the methodology and procedures described herein, the management has concluded that the Company’s PV windmills are not exposed to any significant physical climate risk considering the facilities residual useful lives and assets features and barriers. Therefore, this activity does not significantly harm the objective of climate change adaptation.
Transition to a circular economy
The activity has assessed availability of and, where feasible, it is using equipment and components of high durability and recyclability and that are easy to dismantle and refurbish.
Protection and restoration of biodiversity and ecosystem
Eni’s windmills have obtained before the start of construction works an Environmental Impact Assessment in compliance with Directive 2011/92/EU or a proper authorization based on an equivalent environmental assessment in case of installations located outside EU. Therefore, this activity does not significantly harm the objective of the protection and restoration of biodiversity and ecosystem.
4.8. Electricity generation from bioenergy
Substantial contribution to climate change mitigation
Eni’s activity comprises electricity generation installations each with a total rated thermal input below 2 MW, which are using gaseous biomass fuels. The installations are located in Italy.
DNSH
Climate change adaptation
Based on the assessment of this activity’s exposure to climate-related hazards following the methodology and procedures described herein, the management has concluded that the Company’s electricity generation installations are not exposed to any significant physical climate risk. Therefore, this activity does not significantly harm the objective of climate change adaptation.
Sustainable use and protection of water and marine resources
Protection and restoration of biodiversity and ecosystem
Eni’s electricity generation installations have obtained before the start of construction works an Environmental Impact Assessment in compliance with Directive 2011/92/EU. Therefore, this activity does not significantly harm the objectives of the sustainable use and protection of water and marine resources and of protection and restoration of biodiversity and ecosystem.
4.13. Manufacture of biogas and biofuels for use in transport and of bioliquids
The activity consists in manufacturing HVO for use in transport. The activity is performed at the biorefinery of Gela (Sicily) and Venice.
Substantial contribution to climate change mitigation
Each batch of HVO manufactured in 2022 has been reviewed to assess the substantial contribution to climate change mitigation. Volumes of HVO manufactured using food and feed crops as feedstock have been excluded from the KPI, as well as those produced using agricultural biomass that does not comply with the criteria laid down in Article 29, paragraphs 2 to 5, of Directive (EU) 2018/2001.
The greenhouse gas emission savings from the HVO volumes manufactured from sustainable feedstock have been measured by applying the GHG saving methodology and the relative fossil fuel comparator set out in Annex V to Directive (EU) 2018/2001. The saving has been calculated for each kind of biomass used as feedstock. Based on the outcome of this review, 98% of the marketed to third parties volumes of HVO at the Gela biorefinery have been assessed to contribute substantially to climate change mitigation.
The activity turnover, OpEx, and Capex have apportioned to the relevant KPIs in proportion to the percentage of environmentally sustainable manufactured volumes of HVO.
DNSH
Climate change adaptation
Based on the assessment of this activity’s exposure to climate-related hazards following the methodology and procedures described herein, the management has concluded that the Company’s biorefinery of Gela exposed to a risk of water stress. A monitoring plan is being implemented to check how the risk exposure evolves over time with the goal of adapting the activity to climate change within five years.
Sustainable use and protection of water and marine resources
Protection and restoration of biodiversity and ecosystem
Eni’s biorefineries have obtained before the start of construction works and subsequently on occasion of any major upgrading, reconfiguration or restructuring an Environmental Impact Assessment in compliance with Directive 2011/92/EU. Therefore, this activity does not significantly harm the objectives of the sustainable use and protection of water and marine resources and of protection and restoration of biodiversity and ecosystem.
5.12. Underground permanent geological storage of CO2
The activity consists in building and operating the permanent underground Hyte hub to store CO2 by leveraging Eni’s depleted reservoirs, off the Liverpool Bay in UK. The storage service will be made available to local businesses in hard-to-abate industries according to a regulated tariff which is currently under negotiation. Italian authorities approved a pilot project to build and operate a plant for the storage of CO2 utilizing the depleted natural gas fields of Eni offshore Ravenna in the Adriatic Sea.
Substantial contribution to climate change mitigation
The UK activity complies with ISO 27914:2017 for geological storage of CO2. The Italian activity complies with provisions of Directive 2009/31/EC.
DNSH
Climate change adaptation
Based on the assessment of this activity’s exposure to climate-related hazards following the methodology and procedures described herein, the management has concluded that it is adapted to climate change.
Pollution prevention and control
The management foresees that by adopting the risk management systems and the procedures of monitoring&verification provided by the above-mentioned ISO rules, the activity will comply with the pollution thresholds and markers set by Directive 2009/31/C.
Sustainable use and protection of water and marine resources
Protection and restoration of biodiversity and ecosystem
The management foresees that by adopting the risk management systems and the monitoring&verification procedures provided by the above-mentioned ISO rules and by implementing all of the planned measures to ensure the environmental sustainability of the project to be granted all necessary authorizations by the relevant UK authorities, the DNSH criteria will be met with respect to the objectives of Sustainable use and protection of water and marine resources and of Protection and restoration of biodiversity and ecosystem.
6.15. Infrastructure enabling low-carbon road transport and public transport
Substantial contribution to climate change mitigation
The activity consists in installing and operating a network of electric charging points for EV.
DNSH
Climate change adaptation
Based on the assessment of this activity’s exposure to climate-related hazards following the methodology and procedures described herein, the management has concluded that it is adapted to climate change.
Pollution prevention and control
In the installation of electric charging points, the Company limits waste generation in processes related construction and demolition, in accordance with the EU Construction and Demolition Waste Management Protocol and taking into account best available techniques and using selective demolition to enable removal and safe handling of hazardous substances and facilitate reuse and high-quality recycling by selective removal of materials, using available sorting systems for construction and demolition waste.
Measures are taken to reduce noise, dust and pollutant emissions during construction or maintenance works, such as for example:
1. Utilization of equipment with low environmental impact, which reduces noise, dust and pollutant emissions compare to traditional equipment.
2. Limiting working hours by scheduling, when and where possible, construction or maintenance activities during the hours when there is less traffic to limit the impact on surrounding activities.
Sustainable use and protection of water and marine resources
Protection and restoration of biodiversity and ecosystem
Eni’s electric charging points have obtained before the start of construction works an Environmental Impact Assessment in compliance with Directive 2011/92/EU. Therefore, this activity does not significantly harm the objectives of the sustainable use and protection of water and marine resources and of protection and restoration of biodiversity and ecosystem.
The installation of charging points for electric vehicles complies with specific laws and technical rules to ensure the safety of users and the integrity of the infrastructure, which also include the protection of biodiversity/ecosystems.
1.2.2.2. Contribution to multiple objectives
Not applicable.
1.2.2.3. Disaggregation of KPIs
In the activity 4.13 manufacture of biofuels for use in transport, the biorefinery of Gela is a common facility for both the production of Taxonomy-aligned biofuels and for Taxonomy-eligible biofuels. The facility common costs have been apportioned to each activity in proportion to the manufactured volumes of biofuels.
The management believes that such disaggregation is based on criteria that are appropriate for the production process being implemented and reflects the technical specificities of that process.
1.2.3. Contextual information
1.2.3.1. Contextual information about turnover KPI
The amounts that sum up the numerator of the turnover KPI have derived from contracts with customers and were recognized based on IFRS 15. The total amount of the numerator was €823 million and the break-down is as follows:
- €31 million from the sale of electricity generated by the Group’s PV installations;
- €79 million from the sale of electricity generated by the Group’s windmills;
- €41 million from the sale of electricity generated by installations using gaseous biomass fuels;
- €667 million from the sale of biofuels (HVO).
1.2.3.2. Contextual information about CapEx KPI
The numerator of the CapEX KPI amounted to €1,753 million and comprised:
- €603 million related to the activity of electricity generation from photovoltaic installations, out of which €220 million related to additions to PP&E for progressing the construction program of which €188 million related to the new capacity installed in 2022 for 319 MW (or the revamping of existing installations) and €383 million related to acquisitions closed in the year of installations from third parties for a capacity in operation of 311 MW.
In particular, the additions to PP&E of €220 million related: i) for €146 million to the Brazoria project in Texas completed during 2022; ii) for about €30 million to the Cerillares project being completed in Spain with a fid taken in December 2021.
- €906 million related to the activity of electricity generation from wind power, which included €8 million additions to PP&E for progressing the construction program of which around €5 million related to new installed capacity in 2022 for 5 MW (Badamsha 2 project in Kazakhstan) and €898 million related to acquisitions closed in the year of plants from third parties for a capacity in operation of 368 MW.
- €97 million relating to the production of biofuels, all of which related to additions to PP&E, mainly relating to the bio-refineries in Venice and Gela for €94 million. With reference to Venice, several projects are underway to upgrade the biorefinery, of which the main ones concerned: construction of a new section (degumming) of the biomass treatment unit to enhance the processing of more complex feedstock with expected start-up in 2023; construction of a steam reforming system that is designated to replace the fuel cycle for the supply of hydrogen needed to produce pure HVO, with a consequent increase in processing capacity up to 0.6 million tons/year, with completion expected in 2024. With reference to Gela the main projects concerned: the upgrading of the biomass treatment unit (BTU) to enhance the processing of more complex feedstock, with completion expected in 2024; construction of a manufacturing unit of biojet, with completion expected in 2024. All those projects are included in the Company’s four-year industrial plan approved by the Board of Directors on February 22, 2023.
- €78 million relating to the activity of underground permanent storage of CO2, fully consisting of additions to PP&E as part of an ongoing project to build and operate the Hynet storage hub in UK and a pilot project to develop a CO2 storage hub off Ravenna, Italy. Both projects have been included in the Group four-year capital budget that was approved by the Board of Directors on February 22, 2023. Total capital expenditures for the Hynet project are estimated at €125 million in the four-year plan, with expected start-up in 2025 when the first volume of CO2 is forecast to be injected in the depleted reservoirs operated by Eni, offshore the Liverpool Bay. The expected expenditures for the Italian hub amount to €150 million in the four-year plan, with expected start-up at industrial scale within the term of five years;
- €60 million relating to the activity of installing recharging points for EV, fully consisting of additions to PP&E as about 6.8 thousand new charging points with the Plenitude logo were completed and commissioned in the financial year.
1.2.3.3. Contextual information about the OpEx KPI
The numerator of the OpEx KPI comprises €75 million of expenses that mainly related to maintenance and repair, and other direct expenditures relating to the day-to-day servicing of assets of property, plant and equipment by the Eni or third party to whom activities are outsourced that were necessary to ensure the continued and effective functioning of such assets.
Compliance with the Minimum Safeguards (Ms) - Article 3 "c" of the EU Taxonomy Regulation
The criteria for the eco-sustainability of economic activities outlined in Article 3 of the Taxonomy Regulation call for respecting minimum safeguards when conducting business (referred to in paragraph "c”) in addition to the principles of substantial contribution and "do no significant harm”. The rule under Article 18 identifies the MS with the procedures implemented by a company to ensure that business conduct complies with the OECD Guidelines for Multinational Enterprises and the United Nations Guiding Principles on Business and Human Rights. This includes identifying the principles and rights set out in the eight core conventions identified in the International Labour Organisation's Declaration on Fundamental Principles and Rights at Work and the International Bill of Human Rights.
When companies implement these procedures, they must comply with the "do no significant harm" principle outlined in Article 2(17) of Regulation (EU) 2019/2088, the Sustainable Finance Disclosure Regulation (SFDR). The SFDR requires financial market participants to assess the ESG risk of the investments within the financial products they intend to offer investors, measuring the performance of the investee companies against a predefined set of key impact indicators in critical "principal adverse impact" areas. Five of these indicators have a social nature: (i) violations of the UN Global Compact principles and the OECD Guidelines for Multinational Enterprises; (ii) lack of processes and compliance mechanisms to monitor compliance with the previous point’s principles; (iii) unadjusted gender pay gap; (iv) Board gender diversity; and (v) exposure to controversial weapons. The definition of sustainable investment in Article 2 (17) of the SFDR states that an investment is sustainable if it contributes to broadly defined environmental or social objectives, provided that it does not harm any of these objectives. Thus, Eni assumes that in complying with the SFDR principle to 'do no significant harm’, it is understood to refer to the five social impact indicators described above, four of which are included in Eni's human rights due diligence processes. Regarding the fifth, Eni confirms that it does not participate in the controversial weapons sector.
The OECD Guidelines for Multinational Enterprises are principles for responsible business conduct related to eight business areas:
- Three relate to the theme of human rights (human rights, consumer protection, employment and industrial relations)
- Anti-Corruption
- Fair Competition
- Taxation
Finally, the other sustainability criteria in Article 3 of the Taxonomy Regulation address the environment, while science/technology are out of the scope.
The ILO’s eight labour conventions18 are related as a whole to respect for human rights.
Observance of the fundamental principles of human rights contained in the International Bill of Human Rights (Universal Declaration of Human Rights, International Covenant on Civil and Political Rights and International Covenant on Economic Social and Cultural Rights) is ensured by Eni's compliance with the Italian Constitution and rules intended to implement it, which embody human rights principles. As a company incorporated in Italy, Eni is obliged to observe them.
The verification of compliance with the safeguard clause is based on establishing and maintaining adequate company due diligence processes and systems in the following areas:
- Human rights
- Anti-corruption
- Compliance with competition law
- Business taxation
Furthermore, evidence of compliance with the MS is given by absence of legal proceedings against each of the Group companies or members of its top management for violations of national or international laws relating to such matters that have resulted in final convictions; or the absence of complaints or reports of alleged human rights violations submitted by individual stakeholders or groups of stakeholders to an OECD National Contact Point or to the Business and Human Rights Resource Centre, in the wake of which the Company has not demonstrated concrete commitment to addressing and managing the report, failing to cooperate in its resolution and/or to adopt a remediation plan in the event it is responsible for causing and/or contributing to the negative impact of the complaint.
Eni's due diligence systems:
- ANTI-CORRUPTION. Within the context of the Company's zero tolerance for corruption , Eni has adopted a controlled environment that includes processes and controls designed to minimize the risk of behaviour or transactions that could lead to wilful or negligent acts of corruption. This aims to ensure the constant and punctual compliance of persons working at Eni or on behalf of Eni with the anti-corruption laws in force in the countries where the Company operates. This system also applies to money laundering. The control environment is based on values the organisation shares, starting with top management. It includes establishing a code of ethics inspired by the principles of transparency, honesty, fairness and good faith in conducting business, adherence to the UN Ten Principles of Corporate Responsibility, participation in the Global Compact and personnel training on ethical issues. The processes and controls are designed to ensure accurate and transparent recording of corporate transactions, assessment of economic counterparties in significant transactions (acquisitions/transfers of companies, company branches, mining rights, business combinations, etc.), involvement of certain types of counterparties (business associates, joint venture partners, brokers) or in areas (trading, non-profit initiatives, sponsorships) exposed to corruption risks, as well as compliance of business conduct with internal rules under all circumstances where a breach of the code of ethics might be possible, to prevent any form of corruption in managing the business. The establishment of a whistleblowing mechanism even for managing anonymous reports received by the Company through a well-identified and recognisable channel of alleged violations of anti-corruption and anti-money laundering regulations (this mechanism also applies to the DD on Human Rights) is an integral part of Eni's DD on Anti-Corruption. In 2022, neither the Company nor members of senior management were party to criminal proceedings for violating anti-corruption regulations that resulted in a final verdict of conviction. Please refer to the notes to the consolidated financial statements for more information on the status of the Group's legal proceedings.
18 See: https://www.ilo.org
- TAXATION. Eni has adopted a due diligence system for managing relations with the tax authorities of the countries in which it operates. The aim is to minimize the risk that business operations violate applicable tax regulations. The Company's tax guidelines provide for the payment of taxes in the countries where operations take place according to the merit as well as the letter of local rules and rejects aggressive tax policy choices, including delocalisation of economic activities to so-called tax havens. The Company has a Tax Control Framework, i.e. a specific tax risk control system. Management is responsible for verifying consistency between tax management choices and the Board-approved strategy. The control environment and processes/procedures are designed to mitigate the risk of violations which could trigger significant financial or reputational impact (tax risk). In 2022, no Group company was party to any tax dispute for violations of tax rules or tax fraud resulting in a final verdict of conviction. For more information on the status of the Group's tax litigation, please refer to the notes to the consolidated financial statements. These disputes relate to the technical interpretation of local tax regulations, which are often very complex. They are managed with a view to reconciliation.
- FAIR COMPETITION. Eni has set up a controlled environment and a set of procedures and controls to minimize the risk that business and corporate activities violate the rules protecting competition in the various countries where it operates. Among the fundamental values of the Company are the principles of fair competition - understood as a market environment that encourages companies to excel in the quality and cost-effectiveness of the products and/or services sold/supplied - and compliance with antitrust legislation. Eni's control system has three phases: prevention, risk monitoring/mitigation and counteracting unlawful conduct. It is designed to minimize the risk that Eni’s business units and subsidiaries engage in anti-competitive conduct, adopt practices that restrict the free market or collude with competing companies. Corporate transactions to increase market share (mergers) are executed after the antitrust authorities of the jurisdictions concerned have been informed. Appropriate remediation plans are formulated in response to any comments received and in compliance with standstill obligations and the prohibition of unlawful exchange of information during the negotiation and due diligence phases. In 2022, no Group company or senior management member was party to disputes for antitrust legislation violations that resulted in a final verdict of conviction. On the reporting date, there was no pending antitrust disputes.
- HUMAN RIGHTS. Human rights are at the heart of Eni's vision as a responsible company and integral to the organisation's values, culture and practices. Eni is committed to respecting human rights in all business activities and places similar expectations on business partners operating on behalf of Eni or who are contracted over the course of Eni's industrial activities. Eni has adopted a human rights due diligence process that complies with the OECD Guidelines for Multinational Enterprises and the United Nations Guiding Principles on Business and Human Rights (UNGP), which envisage five steps:
(i) adoption of a commitment statement by the top management, upholding respect for human rights and the integration of human rights into company processes and policies;
(ii) a risk-based process of identifying and assessing the adverse impacts of the company's activities on human rights, including the involvement of stakeholders;
(iii) the definition and adoption of measures to prevent, cease or mitigate any adverse impact;
(iv) the verification of the effectiveness of the measures taken;
(v) public reporting on the processes undertaken by the company to prevent, cease or mitigate the adverse impact and the measures taken.
Eni has established a mechanism for collecting and evaluating complaints and concerns brought to the Company's attention through appropriate channels for listening and for the receipt of communications by individuals, communities or associations of individuals, including providing a remedy to address the adverse impact on human rights that the company caused or contributed to. Eni actively cooperates with other state and non-state complaint mechanisms.
In this respect, Eni’s Statement on Respect for Human Rights, approved by the Board in December 2018, in addition to reaffirming the commitment to this topic, highlights salient issues which are subject to in-depth due diligence, according to an approach developed in coherence with the OECD Guidelines for Multinational Enterprises and the UNGPs.
To effectively implement this Statement of Commitment, Eni has gradually employed risk-based models that use context elements (risks specific to the countries in which Eni operates) and characteristics of the business activities that, according to potential risks to human rights, allow the company to identify and adopt appropriate management measures.
Eni is actively committed to reviewing complaints and providing or cooperating to provide remedies for adverse human rights impacts that it may have caused or contributed to, and to make every effort to promote the achievement of the same objective in cases where the impact is directly related to its operations. Eni has adopted a whistleblowing system and a grievance mechanism for addressing possible cases of violations. This is a dedicated channel for the receipt and the settlement of complaints from communities and stakeholders. Eni cooperates actively and in good faith with other access facilities to reach a judicial or non-judicial resolution to open issues. In no case does Eni prohibit potential claimants access to remediation measures. The company is committed to preventing reprisals against workers and other stakeholders for raising human rights concerns. It does not tolerate or contribute to threats, intimidation, reprisals or attacks against human rights defenders and stakeholders involved with its operations.
An integral part of due diligence is the communication of the obtained results. Every year, Eni publishes a yearly report "Eni for" sustainability, which includes a human rights report, "Eni for - Human Rights" to inform stakeholders on the progress made to address human rights issues.
In conclusion, in 2022, Eni did not receive any final verdict of conviction for violations of laws, regulations or other regulatory institutions relating to human rights, bribery, competition or tax violations. The Company is cooperating actively and in good faith with the OECD National Contact Points to resolve pending Specific Instances.
On the subject of human rights, Eni also maintains an ongoing dialogue with stakeholders. Refer to, for example, the responses to the Business and Human Rights Resource Centre19 and the assessment by the World Benchmarking Alliance20, in whose latest survey Eni was ranked first (along with a company from another segment) out of all the companies analysed21.
Considering the draft Report "Minimum Safeguards"22, Eni believes it is in compliance with the safeguard clause of Article 3, paragraph "c" of the EU Taxonomy Regulation.
19 The Business and Human Rights Resource Centre is a non-profit organisation that collects and reports on the activities of companies at a global level, with the aim of promoting greater awareness and informed discussion on business and human rights issues, https://www.business-humanrights.org/it/.
20 The World Benchmarking Alliance (WBA) is a non-profit organisation that assesses the world's most influential companies by ranking and measuring them according to their contribution to the SDGs, Home | World Benchmarking Alliance.
21 The last survey concerning Eni was conducted in 2021 by Corporate Human Rights Benchmark (later merged into the World Benchmarking Alliance) and saw the company ranked first (together with a company from another segment) out of all the companies analysed. The next survey is scheduled for 2023.
22 The Final Report on Minimum Safeguards was prepared by the EU Sustainable Platform on request from the EU Commission and advises on the application of minimum safeguards (MS) in relation to the Taxonomy Regulation (TR1) Articles 3 and 18. https://finance.ec.europa.eu/system/files/2022-10/221011-sustainable-finance-platform-finance-report-minimum-safeguards_en.pdf.
|
Turnover KPI |
|
|
|
Substantial contribution criteria |
DNSH |
|
|
|
|
||||||||||
|
Economic activities (1) |
Code(s) (2) |
Absolute Turnover (3) |
Proportion of Turnover (4) |
Climate Change Mitigation (CCM) (5) |
Climate Change Adaptation (CCA) (6) |
Water and marine resources (7) |
Circular economy (8) |
Pollution (9) |
Biodiversity and ecosystems (10) |
Climate Change Mitigation (CCM) (11) |
Climate Change Adaptation (CCA) (12) |
Water and marine resources (13) |
Circular economy (14) |
Pollution (15) |
Biodiversity and ecosystems (16) |
Minimum Safeguards (17) |
Taxonomy aligned proportion Turnover year 2022 (18) |
Category (enabling activity or) |
Category (transitional activity) (21) |
|
|
|
m€ |
% |
% |
% |
% |
% |
% |
% |
Y/N |
Y/N |
Y/N |
Y/N |
Y/N |
Y/N |
Y/N |
% |
E |
T |
|
A. TAXONOMY-ELIGIBLE ACTIVITIES |
|
9,874 |
7.5% |
|
|
|
|
|
|
|
|
|
|
|
|
|
|
|
|
|
A.1. Environmentally sustainable activities (Taxonomy-aligned) |
|
|
|
|
|
|
|
|
|
|
|
|
|
|
|
|
|
|
|
|
Electricity generation using solar photovoltaic technology |
4.1 (Annex I) / D35.11 |
31 |
0.0% |
100% |
|
|
|
|
|
y |
y |
y |
y |
y |
y |
y |
0.0% |
|
|
|
Electricity generation (wind) |
4.3 (Annex I) / D.35.11 |
79 |
0.1% |
100% |
|
|
|
|
|
y |
y |
y |
y |
y |
y |
y |
0.1% |
|
|
|
Electricity generation from bioenergy |
4.8 (Annex I) / (D35.11) |
41 |
0.0% |
100% |
|
|
|
|
|
y |
y |
y |
y |
y |
y |
y |
0.0% |
|
|
|
Manufacture of biogas and biofuels for use in transport and of bioliquids |
4.13 (Annex I) / (D35.21) |
667 |
0.5% |
100% |
|
|
|
|
|
y |
y |
y |
y |
y |
y |
y |
0.5% |
|
|
|
Anaerobic digestion of bio-waste |
5.7 (Annex I) / (E38.21) |
5 |
0.0% |
100% |
|
|
|
|
|
y |
y |
y |
y |
y |
y |
y |
0.0% |
|
|
|
Turnover of environmentally sustainable activities (Taxonomy-aligned) (A.1) |
|
823 |
0.6% |
100% |
|
|
|
|
|
|
|
|
|
|
|
|
0.6% |
|
|
|
A.2. Taxonomy-Eligible but not environmentally sustainable activities (not Taxonomy-aligned) |
|
|
|||||||||||||||||
|
Manufacture of organic basic chemicals |
3.14 (Annex I) / (C20.14) |
2,126 |
1.6% |
|
|
|
|
|
|
|
|
|
|
|
|
|
|
|
|
|
Manufacture of plastics in primary form |
3.17 (Annex I) / (C20.16) |
2,186 |
1.6% |
|
|
|
|
|
|
|
|
|
|
|
|
|
|
|
|
|
Manufacture of biogas/biofuels for use in transport |
4.13 (Annex I) / (D35.21) |
8 |
0.0% |
|
|
|
|
|
|
|
|
|
|
|
|
|
|
|
|
|
Transmission and distribution of electricity |
4.9 (Annex I) / (D35.12, D35.13) |
7 |
0.0% |
|
|
|
|
|
|
|
|
|
|
|
|
|
|
|
|
|
Cogeneration of heat/cool and power from bioenergy |
4.20 (Annex I) / (D35.11, D35.30) |
11 |
0.0% |
|
|
|
|
|
|
|
|
|
|
|
|
|
|
|
|
|
High-efficiency co-generation of heat/cool and power from fossil gaseous fuels |
4.30 (Annex I) / (D35.11, D35.30) |
4,682 |
3.5% |
|
|
|
|
|
|
|
|
|
|
|
|
|
|
|
|
|
Construction, extension and operation of waste water collection and treatmen |
5.3 (Annex I) / (E37.00, F42.99) |
9 |
0.0% |
|
|
|
|
|
|
|
|
|
|
|
|
|
|
|
|
|
Transport by motorbikes, passenger cars and commercial vehicles |
6.5 (Annex I) / (N77.11, H49.32, H49.39) |
22 |
0.0% |
|
|
|
|
|
|
|
|
|
|
|
|
|
|
|
|
|
Turnover of Taxonomy-eligible but not environmentally sustainable activities (not Taxonomy-aligned activities) (A.2) |
|
9,051 |
6.9% |
|
|
|
|
|
|
|
|
|
|
|
|
|
|
|
|
|
Total (A.1 + A.2) |
|
9,874 |
7.5% |
|
|
|
|
|
|
|
|
|
|
|
|
|
|
|
|
|
B. TAXONOMY-NON-ELIGIBLE ACTIVITIES |
|
|
|
|
|
|
|
|
|
|
|
|
|
|
|
|
|||
|
Turnover of Taxonomy-non-eligible activites (B) |
|
122,638 |
92.5% |
||||||||||||||||
|
Total (A+B) |
|
132,512 |
100% |
||||||||||||||||
|
Capex KPI |
|
|
|
Substantial contribution criteria |
DNSH |
|
|
|
|||||||||||
|
Economic activities (1) |
Code(s) (2) |
Absolute CapEx (3) |
Proportion of CapEx (4) |
Climate Change Mitigation (CCM) (5) |
Climate Change Adaptation (CCA) (6) |
Water and marine resources (7) |
Circular economy (8) |
Pollution (9) |
Biodiversity and ecosystems (10) |
Climate Change Mitigation (CCM) (11) |
Climate Change Adaptation (CCA) (12) |
Water and marine resources (13) |
Circular economy (14) |
Pollution (15) |
Biodiversity and ecosystems (16) |
Minimum Safeguards (17) |
Taxonomy aligned proportion CapEx year 2022 (18) |
Category (enabling activity or) |
Category (transitional activity) (21) |
|
|
|
m€ |
% |
% |
% |
% |
% |
% |
% |
Y/N |
Y/N |
Y/N |
Y/N |
Y/N |
Y/N |
Y/N |
% |
E |
T |
|
A. TAXONOMY-ELIGIBLE ACTIVITIES |
|
2,172 |
17.5% |
|
|
|
|
|
|
|
|
|
|
|
|
|
|
|
|
|
A.1. Environmentally sustainable activities (Taxonomy-aligned) |
|
|
|
|
|
|
|
|
|
|
|
|
|
|
|
|
|
|
|
|
Electricity generation using solar photovoltaic technology |
4.1 (Annex I) / D35.11 |
603 |
4.9% |
100% |
|
|
|
|
|
y |
y |
y |
y |
y |
y |
y |
4.9% |
|
|
|
Electricity generation (wind) |
4.3 (Annex I) / D.35.11 |
906 |
7.3% |
100% |
|
|
|
|
|
y |
y |
y |
y |
y |
y |
y |
7.3% |
|
|
|
Electricity generation from bioenergy |
4.8 (Annex I) / (D35.11) |
1 |
0.0% |
100% |
|
|
|
|
|
y |
y |
y |
y |
y |
y |
y |
0.0% |
|
|
|
Storage of electricity |
4.10 |
5 |
0.0% |
100% |
|
|
|
|
|
y |
y |
y |
y |
y |
y |
y |
0.0% |
0.0% |
|
|
Manufacture of biogas and biofuels for use in transport and of bioliquids |
4.13 (Annex I) / (D35.21) |
97 |
0.8% |
100% |
|
|
|
|
|
y |
y |
y |
y |
y |
y |
y |
0.8% |
|
|
|
Underground permanent geological storage of CO2 |
5.12 (Annex I) / (E39.00) |
78 |
0.6% |
100% |
|
|
|
|
|
y |
y |
y |
y |
y |
y |
y |
0.6% |
|
|
|
Transport by motorbikes, passenger cars and commercial vehicles |
6.5 (Annex I) / (N77.11, H49.32, H49.39) |
3 |
0.0% |
100% |
|
|
|
|
|
y |
y |
y |
y |
y |
y |
y |
0.0% |
|
0.0% |
|
Infrastructure enabling road transport and public transport |
6.15 (Annex I) / (F71.1, F71.20) |
60 |
0.5% |
100% |
|
|
|
|
|
y |
y |
y |
y |
y |
y |
y |
0.5% |
0.5% |
|
|
CapEx of environmentally sustainable activities (Taxonomy-aligned) (A.1) |
|
1,753 |
14.1% |
100% |
|
|
|
|
|
|
|
|
|
|
|
|
14.1% |
0.5% |
0.0% |
|
A.2. Taxonomy-Eligible but not environmentally sustainable activities (not Taxonomy-aligned) |
|
|
|||||||||||||||||
|
Manufacture of organic basic chemicals |
3.14 (Annex I) (C20.14) |
109 |
0.9% |
|
|
|
|
|
|
|
|
|
|
|
|
|
|
|
|
|
Manufacture of plastics in primary form |
3.17 (Annex I) / (C20.16) |
77 |
0.6% |
|
|
|
|
|
|
|
|
|
|
|
|
|
|
|
|
|
Transmission and distribution of electricity |
4.9 (Annex I) / (D35.12, D35.13) |
2 |
0.0% |
|
|
|
|
|
|
|
|
|
|
|
|
|
|
|
|
|
Manufacture of biogas/biofuels for use in transport |
4.13 (Annex I) / (D35.21) |
28 |
0.2% |
|
|
|
|
|
|
|
|
|
|
|
|
|
|
|
|
|
High-efficiency co-generation of heat/cool and power from fossil gaseous fuels |
4.30 (Annex I) / (D35.11, D35.30) |
148 |
1.2% |
|
|
|
|
|
|
|
|
|
|
|
|
|
|
|
|
|
Construction, extension and operation of waste water collection and treatmen |
5.3 (Annex I) / (E37.00, F42.99) |
44 |
0.4% |
|
|
|
|
|
|
|
|
|
|
|
|
|
|
|
|
|
Transport by motorbikes, passenger cars and commercial vehicles |
6.5 (Annex I) / (N77.11, H49.32, H49.39) |
11 |
0.1% |
|
|
|
|
|
|
|
|
|
|
|
|
|
|
|
|
|
CapEx of Taxonomy-eligible but not environmentally sustainable activities (not Taxonomy-aligned activities) (A.2) |
|
419 |
3.4% |
|
|
|
|
|
|
|
|
|
|
|
|
|
|
|
|
|
Total (A.1 + A.2) |
|
2,172 |
17.5% |
|
|
|
|
|
|
|
|
|
|
|
|
|
|
|
|
|
B. TAXONOMY-NON-ELIGIBLE ACTIVITIES |
|
|
|
|
|
|
|
|
|
|
|
|
|
|
|
|
|||
|
Capex of Taxonomy-non-eligible activites (B) |
|
10,224 |
82.5% |
||||||||||||||||
|
Total (A+B) |
|
12,396 |
100% |
||||||||||||||||
| OpEx KPI | Substantial contribution criteria | DNSH |
|
|
|
|
||||||||||||||
|
Economic activities (1) |
Code(s) (2) |
Absolute Opex (3) |
Proportion of Opex (4) |
Climate Change Mitigation (CCM) (5) |
Climate Change Adaptation (CCA) (6) |
Water and marine resources (7) |
Circular economy (8) |
Pollution (9) |
Biodiversity and ecosystems (10) |
Climate Change Mitigation (CCM) (11) |
Climate Change Adaptation (CCA) (12) |
Water and marine resources (13) |
Circular economy (14) |
Pollution (15) |
Biodiversity and ecosystems (16) |
Minimum Safeguards (17) |
Taxonomy aligned proportion OpEx year 2022 (18) |
Category (enabling activity or) |
Category (transitional activity) (21) |
|
|
|
|
m€ |
% |
% |
% |
% |
% |
% |
% |
Y/N |
Y/N |
Y/N |
Y/N |
Y/N |
Y/N |
Y/N |
% |
E |
T |
|
|
A. TAXONOMY-ELIGIBLE ACTIVITIES |
|
503 |
12.1% |
|
|
|
|
|
|
|
|
|
|
|
|
|
|
|
|
|
|
A.1. Environmentally sustainable activities (Taxonomy-aligned) |
|
|
|
|
|
|
|
|
|
|
|
|
|
|
|
|
|
|
|
|
|
Electricity generation using solar photovoltaic technology |
4.1 (Annex I) / D35.11 |
15 |
0.4% |
100% |
|
|
|
|
|
y |
y |
y |
y |
y |
y |
y |
0.4% |
|
|
|
|
Electricity generation (wind) |
4.3 (Annex I) / D.35.11 |
28 |
0.7% |
100% |
|
|
|
|
|
y |
y |
y |
y |
y |
y |
y |
0.7% |
|
|
|
|
Electricity generation from bioenergy |
4.8 (Annex I) / (D35.11) |
5 |
0.1% |
100% |
|
|
|
|
|
y |
y |
y |
y |
y |
y |
y |
0.1% |
|
|
|
|
Manufacture of biogas and biofuels for use in transport and of bioliquids |
4.13 (Annex I) / (D35.21) |
24 |
0.6% |
100% |
|
|
|
|
|
y |
y |
y |
y |
y |
y |
y |
0.6% |
|
|
|
|
Anaerobic digestion of bio-waste |
5.7 (Annex I) / (E38.21) |
3 |
0.1% |
100% |
|
|
|
|
|
y |
y |
y |
y |
y |
y |
y |
0.1% |
|
|
|
|
OpEx of environmentally sustainable activities (Taxonomy-aligned) (A.1) |
|
75 |
1.8% |
100% |
|
|
|
|
|
|
|
|
|
|
|
|
1.8% |
|
|
|
|
A.2. Taxonomy-Eligible but not environmentally sustainable activities (not Taxonomy-aligned) |
|
|
||||||||||||||||||
|
Manufacture of other low carbon technologies |
3.6 (Annex I) / (C22, C25, C26, C27, C28) |
26 |
0.6% |
|
|
|
|
|
|
|
|
|
|
|
|
|
|
|
|
|
|
Manufacture of organic basic chemicals |
3.14 (Annex I) (C20.14) |
69 |
1.7% |
|
|
|
|
|
|
|
|
|
|
|
|
|
|
|
|
|
|
Manufacture of plastics in primary form |
3.17 (Annex I) / (C20.16) |
68 |
1.6% |
|
|
|
|
|
|
|
|
|
|
|
|
|
|
|
|
|
|
Electricity generation using solar photovoltaic technology |
4.1 (Annex I) / D35.11 |
11 |
0.3% |
|
|
|
|
|
|
|
|
|
|
|
|
|
|
|
|
|
|
Electricity generation (wind) |
4.3 (Annex I) / D.35.11 |
1 |
0.0% |
|
|
|
|
|
|
|
|
|
|
|
|
|
|
|
|
|
|
Electricity generation from ocean energy technologies |
4.4 (Annex I) / (D35.11, F42.22) |
7 |
0.2% |
|
|
|
|
|
|
|
|
|
|
|
|
|
|
|
|
|
|
Transmission and distribution of electricity |
4.9 (Annex I) / (D35.12, D35.13) |
2 |
0.0% |
|
|
|
|
|
|
|
|
|
|
|
|
|
|
|
|
|
|
Storage of electricity |
4.10 |
3 |
0.1% |
|
|
|
|
|
|
|
|
|
|
|
|
|
|
|
|
|
|
Manufacture of biogas and biofuels for use in transport and of bioliquids |
4.13 (Annex I) / (D35.21) |
30 |
0.7% |
|
|
|
|
|
|
|
|
|
|
|
|
|
|
|
|
|
|
Cogeneration of heat/cool and power from bioenergy |
4.20 (Annex I) / (D35.11, D35.30) |
8 |
0.2% |
|
|
|
|
|
|
|
|
|
|
|
|
|
|
|
|
|
|
High-efficiency co-generation of heat/cool and power from fossil gaseous fuels |
4.30 (Annex I) / (D35.11, D35.30) |
49 |
1.2% |
|
|
|
|
|
|
|
|
|
|
|
|
|
|
|
|
|
|
Construction, extension and operation of waste water collection and treatmen |
5.3 (Annex I) / (E37.00, F42.99) |
136 |
3.3% |
|
|
|
|
|
|
|
|
|
|
|
|
|
|
|
|
|
|
Collection and transport of non-hazardous waste in source segregated fract. |
5.5 (Annex I) / (E38.11) |
5 |
0.1% |
|
|
|
|
|
|
|
|
|
|
|
|
|
|
|
|
|
|
Underground permanent geological storage of CO2 |
5.12 (Annex I) / (E39.00) |
9 |
0.2% |
|
|
|
|
|
|
|
|
|
|
|
|
|
|
|
|
|
|
Transport by motorbikes, passenger cars and commercial vehicles |
6.5 (Annex I) / (N77.11, H49.32, H49.39) |
4 |
0.1% |
|
|
|
|
|
|
|
|
|
|
|
|
|
|
|
|
|
|
OpEx of Taxonomy-eligible but not environmentally sustainable activities (not Taxonomy-aligned activities) (A.2) |
|
428 |
10.3% |
|
|
|
|
|
|
|
|
|
|
|
|
|
|
|
|
|
|
Total (A.1 + A.2) |
|
503 |
12.1% |
|
|
|
|
|
|
|
|
|
|
|
|
|
|
|
|
|
|
B. TAXONOMY-NON-ELIGIBLE ACTIVITIES |
|
|
|
|
|
|
|
|
|
|
|
|
|
|
|
|
||||
|
OpEx of Taxonomy-non-eligible activites (B) |
|
3,657 |
87.9% |
|||||||||||||||||
|
Total (A+B) |
|
4,160 |
100% |
|||||||||||||||||
|
Template 1: Nuclear and fossil gas related activities |
|||||||||||||||||||||
|
Row |
Nuclear energy related activities |
2022 | |||||||||||||||||||
|
1 |
The undertaking carries out, funds or has exposures to research, development, demonstration and deployment of innovative electricity generation facilities that produce energy from nuclear processes with minimal waste from the fuel cycle. |
No | |||||||||||||||||||
|
2 |
The undertaking carries out, funds or has exposures to construction and safe operation of new nuclear installations to produce electricity or process heat, including for the purposes of district heating or industrial processes such as hydrogen production, as well as their safety upgrades, using best available technologies. |
No | |||||||||||||||||||
|
3 |
The undertaking carries out, funds or has exposures to safe operation of existing nuclear installations that produce electricity or process heat, including for the purposes of district heating or industrial processes such as hydrogen production from nuclear energy, as well as their safety upgrades. |
No | |||||||||||||||||||
|
|
Fossil gas related activities |
||||||||||||||||||||
|
4 |
The undertaking carries out, funds or has exposures to construction or operation of electricity generation facilities that produce electricity using fossil gaseous fuels. |
No | |||||||||||||||||||
|
5 |
The undertaking carries out, funds or has exposures to construction, refurbishment, and operation of combined heat/cool and power generation facilities using fossil gaseous fuels. |
Yes | |||||||||||||||||||
|
6 |
The undertaking carries out, funds or has exposures to construction, refurbishment and operation of heat generation facilities that produce heat/cool using fossil gaseous fuels. |
No | |||||||||||||||||||
|
Template 2: Taxonomy-aligned economic activities (denominator), 2022 |
|
|
|
|
|
|
€ million, except where indicated |
||||||||||||
|
Row |
Economic activities |
Turnover |
Capex |
Opex |
|||||||||||||||
|
CCM + CCA |
Climate change mitigation (CCM) |
Climate change adaptation (CCA) |
CCM + CCA |
Climate change mitigation (CCM) |
Climate change adaptation (CCA) |
CCM + CCA |
Climate change mitigation (CCM) |
Climate change adaptation (CCA) |
|||||||||||
|
Amount |
% |
Amount |
% |
Amount |
% |
Amount |
% |
Amount |
% |
Amount |
% |
Amount |
% |
Amount |
% |
Amount |
% |
||
|
1 |
Amount and proportion of taxonomy-aligned economic activity referred to in Section 4.26 of Annexes I and II to Delegated Regulation 2021/2139 in the denominator of the applicable KPI |
|
|
|
|
|
|
|
|
|
|
|
|
|
|
|
|
|
|
|
2 |
Amount and proportion of taxonomy-aligned economic activity referred to in Section 4.27 of Annexes I and II to Delegated Regulation 2021/2139 in the denominator of the applicable KPI |
|
|
|
|
|
|
|
|
|
|
|
|
|
|
|
|
|
|
|
3 |
Amount and proportion of taxonomy-aligned economic activity referred to in Section 4.28 of Annexes I and II to Delegated Regulation 2021/2139 in the denominator of the applicable KPI |
|
|
|
|
|
|
|
|
|
|
|
|
|
|
|
|
|
|
|
4 |
Amount and proportion of taxonomy-aligned economic activity referred to in Section 4.29 of Annexes I and II to Delegated Regulation 2021/2139 in the denominator of the applicable KPI |
|
|
|
|
|
|
|
|
|
|
|
|
|
|
|
|
|
|
|
5 |
Amount and proportion of taxonomy-aligned economic activity referred to in Section 4.30 of Annexes I and II to Delegated Regulation 2021/2139 in the denominator of the applicable KPI |
0 |
0% |
0 |
0% |
0 |
0% |
0 |
0% |
0 |
0% |
0 |
0% |
0 |
0% |
0 |
0% |
0 |
0% |
|
6 |
Amount and proportion of taxonomy-aligned economic activity referred to in Section 4.31 of Annexes I and II to Delegated Regulation 2021/2139 in the denominator of the applicable KPI |
|
|
|
|
|
|
|
|
|
|
|
|
|
|
|
|
|
|
|
7 |
Amount and proportion of other taxonomy-aligned economic activities not referred to in rows 1 to 6 above in the denominator of the applicable KPI |
823 |
0.6% |
823 |
0.6% |
0 |
0% |
1,753 |
14.1% |
1,753 |
14.1% |
0 |
0% |
75 |
1.8% |
75 |
1.8% |
0 |
0% |
|
8 |
Total applicable KPI |
132,512 |
100% |
132,512 |
100% |
0 |
0% |
12,396 |
100% |
12,396 |
100% |
0 |
0% |
4,160 |
100% |
4,160 |
100% |
0 |
0% |
| 135 |
| Template 3: Taxonomy-aligned economic activities (numerator), 2022 | € million, except where indicated | ||||||||||||||||||||||||||
| Row | Economic activities | Turnover | Capex | Opex | |||||||||||||||||||||||
| CCM + CCA | Climate change mitigation (CCM) | Climate change adaptation (CCA) | CCM + CCA | Climate change mitigation (CCM) | Climate change adaptation (CCA) | CCM + CCA | Climate change mitigation (CCM) | Climate change adaptation (CCA) | |||||||||||||||||||
| Amount | % | Amount | % | Amount | % | Amount | % | Amount | % | Amount | % | Amount | % | Amount | % | Amount | % | ||||||||||
| 1 | Amount and proportion of taxonomy-aligned economic activity referred to in Section 4.26 of Annexes I and II to Delegated Regulation 2021/2139 in the numerator of the applicable KPI | ||||||||||||||||||||||||||
| 2 | Amount and proportion of taxonomy-aligned economic activity referred to in Section 4.27 of Annexes I and II to Delegated Regulation 2021/2139 in the numerator of the applicable KPI | ||||||||||||||||||||||||||
| 3 | Amount and proportion of taxonomy-aligned economic activity referred to in Section 4.28 of Annexes I and II to Delegated Regulation 2021/2139 in the numerator of the applicable KPI | ||||||||||||||||||||||||||
| 4 | Amount and proportion of taxonomy-aligned economic activity referred to in Section 4.29 of Annexes I and II to Delegated Regulation 2021/2139 in the numerator of the applicable KPI | ||||||||||||||||||||||||||
| 5 | Amount and proportion of taxonomy-aligned economic activity referred to in Section 4.30 of Annexes I and II to Delegated Regulation 2021/2139 in the numerator of the applicable KPI | 0 | 0% | 0 | 0% | 0 | 0% | 0 | 0% | 0 | 0% | 0 | 0% | 0 | 0% | 0 | 0% | 0 | 0% | ||||||||
| 6 | Amount and proportion of taxonomy-aligned economic activity referred to in Section 4.31 of Annexes I and II to Delegated Regulation 2021/2139 in the numerator of the applicable KPI | ||||||||||||||||||||||||||
| 7 | Amount and proportion of other taxonomy-aligned economic activities not referred to in rows 1 to 6 above in the numerator of the applicable KPI | 823 | 100% | 823 | 100% | 0 | 0% | 1,753 | 100% | 1,753 | 100% | 0 | 0% | 75 | 100% | 75 | 100% | 0 | 0% | ||||||||
| 8 | Total amount and proportion of taxonomy-aligned economic activities in the numerator of the applicable KPI | 823 | 100% | 823 | 100% | 0 | 0% | 1,753 | 100% | 1,753 | 100% | 0 | 0% | 75 | 100% | 75 | 100% | 0 | 0% | ||||||||
|
Template 4: Taxonomy-eligible but not taxonomy-aligned economic activities, 2022 |
€ million, except where indicated |
||||||||||||||||||||||||||
|
Row |
Economic activities |
Turnover |
Capex |
Opex |
|||||||||||||||||||||||
|
CCM + CCA |
Climate change mitigation (CCM) |
Climate change adaptation (CCA) |
CCM + CCA |
Climate change mitigation (CCM) |
Climate change adaptation (CCA) |
CCM + CCA |
Climate change mitigation (CCM) |
Climate change adaptation (CCA) |
|||||||||||||||||||
|
Amount |
% |
Amount |
% |
Amount |
% |
Amount |
% |
Amount |
% |
Amount |
% |
Amount |
% |
Amount |
% |
Amount |
% |
||||||||||
|
1 |
Amount and proportion of taxonomy-eligible but not taxonomy-aligned economic activity referred to in Section 4.26 of Annexes I and II to Delegated Regulation 2021/2139 in the denominator of the applicable KPI |
|
|
|
|
|
|
|
|
|
|
|
|
|
|
|
|
|
|
||||||||
|
2 |
Amount and proportion of taxonomy-eligible but not taxonomy-aligned economic activity referred to in Section 4.27 of Annexes I and II to Delegated Regulation 2021/2139 in the denominator of the applicable KPI |
|
|
|
|
|
|
|
|
|
|
|
|
|
|
|
|
|
|
||||||||
|
3 |
Amount and proportion of taxonomy-eligible but not taxonomy-aligned economic activity referred to in Section 4.28 of Annexes I and II to Delegated Regulation 2021/2139 in the denominator of the applicable KPI |
|
|
|
|
|
|
|
|
|
|
|
|
|
|
|
|
|
|
||||||||
|
4 |
Amount and proportion of taxonomy-eligible but not taxonomy-aligned economic activity referred to in Section 4.29 of Annexes I and II to Delegated Regulation 2021/2139 in the denominator of the applicable KPI |
|
|
|
|
|
|
|
|
|
|
|
|
|
|
|
|
|
|
||||||||
|
5 |
Amount and proportion of taxonomy-eligible but not taxonomy-aligned economic activity referred to in Section 4.30 of Annexes I and II to Delegated Regulation 2021/2139 in the denominator of the applicable KPI |
4,682 |
51.7% |
4,682 |
51.7% |
0 |
0% |
148 |
35.3% |
148 |
35.3% |
0 |
0% |
49 |
11.4% |
49 |
11.4% |
0 |
0% |
||||||||
|
6 |
Amount and proportion of taxonomy-eligible but not taxonomy-aligned economic activity referred to in Section 4.31 of Annexes I and II to Delegated Regulation 2021/2139 in the denominator of the applicable KPI |
|
|
|
|
|
|
|
|
|
|
|
|
|
|
|
|
|
|||||||||
|
7 |
Amount and proportion of other taxonomy-eligible but not taxonomy-aligned economic activities not referred to in rows 1 to 6 above in the denominator of the applicable KPI |
4,369 |
48.3% |
4,369 |
48.3% |
0 |
0% |
271 |
64.7% |
271 |
64.7% |
0 |
0% |
379 |
88.6% |
379 |
88.6% |
0 |
0% |
||||||||
|
8 |
Total amount and proportion of taxonomy-eligible but not taxonomy-aligned economic activities in the denominator of the applicable KPI |
9,051 |
100% |
9,051 |
100% |
0 |
0% |
419 |
100% |
419 |
100% |
0 |
0% |
428 |
100% |
428 |
100% |
0 |
0% |
||||||||
|
€ million, except where indicated |
|||||||
|
Template 5: Taxonomy non-eligible economic activities, 2022 |
Turnover |
Capex |
Opex |
||||
|
Riga |
Attività economiche |
Amount |
% |
Amount |
% |
Amount |
% |
|
1 |
Amount and proportion of economic activity referred to in row 1 of Template 1 that is taxonomy non-eligible in accordance with Section 4.26 of Annexes I and II to Delegated Regulation 2021/2139 in the denominator of the applicable KPI |
|
|
|
|
|
|
|
2 |
Amount and proportion of economic activity referred to in row 2 of Template 1 that is taxonomy non-eligible in accordance with Section 4.27 of Annexes I and II to Delegated Regulation 2021/2139 in the denominator of the applicable KPI |
|
|
|
|
|
|
|
3 |
Amount and proportion of economic activity referred to in row 3 of Template 1 that is taxonomy non-eligible in accordance with Section 4.28 of Annexes I and II to Delegated Regulation 2021/2139 in the denominator of the applicable KPI |
|
|
|
|
|
|
|
4 |
Amount and proportion of economic activity referred to in row 4 of Template 1 that is taxonomy non-eligible in accordance with Section 4.29 of Annexes I and II to Delegated Regulation 2021/2139 in the denominator of the applicable KPI |
|
|
|
|
|
|
|
5 |
Amount and proportion of economic activity referred to in row 5 of Template 1 that is taxonomy non-eligible in accordance with Section 4.30 of Annexes I and II to Delegated Regulation 2021/2139 in the denominator of the applicable KPI |
0 |
0% |
0 |
0% |
0 |
0% |
|
6 |
Amount and proportion of economic activity referred to in row 6 of Template 1 that is taxonomy non-eligible in accordance with Section 4.31 of Annexes I and II to Delegated Regulation 2021/2139 in the denominator of the applicable KPI |
|
|
|
|
|
|
|
7 |
Amount and proportion of other taxonomy non-eligible economic activities not referred to in rows 1 to 6 above in the denominator of the applicable KPI |
122,638 |
100% |
10,224 |
100% |
3,657 |
100% |
|
8 |
Total amount and proportion of taxonomy non-eligible economic activities in the denominator of the applicable KPI |
122,638 |
100% |
10,224 |
100% |
3,657 |
100% |
Eni has freehold and leasehold interests in real estate in numerous countries throughout the world. The Company enters into operating lease contracts with third parties to hire plant and equipment such as floating production and storage offloading vessels (FPSO), drilling rigs, time charter, service stations and other equipment. Management believes that certain individual petroleum properties are of major significance to Eni as a whole. Management regards an individual petroleum property as material to the Group in case it contains 10% or more of the Company’ worldwide proved oil&gas reserves and management is committed to invest material amounts of expenditures in developing it in the future. See “Exploration & Production” above for a description of Eni’s both material and other properties and reserves and sources of crude oil and natural gas.
Eni SpA is the parent company of the Eni Group. As of December 31, 2022, there were 401 subsidiaries and 134 associates, joint ventures and joint operations that were accounted for under the equity or cost method or in accordance to Eni’s share of revenues, costs and assets of the joint operations calculated based on Eni’s working interest. Information on Eni’s investments as of December 31, 2022 is provided in the notes to the Consolidated Financial Statements.
None.
| 138 |
This section is the Company’s analysis of its financial performance and of significant trends that may affect its future performance. It should be read in conjunction with the Key Information presented in Item 3 and the Consolidated Financial Statements and related Notes thereto included in Item 18. The Consolidated Financial Statements are prepared in accordance with International Financial Reporting Standards as issued by the IASB.
This section contains forward-looking statements, which are subject to risks and uncertainties. For a list of important factors that could cause actual results to differ materially from those expressed in the forward-looking statements, see the cautionary statement concerning forward-looking statements on page ii.
Key consolidated financial data
| 2022 | 2021 | 2020 | |||||
| (€ million) | |||||||
| Sales from operations | 132,512 | 76,575 | 43,987 | ||||
| Operating profit (loss) | 17,510 | 12,341 | (3,275) | ||||
| Adjusted operating profit (Non-GAAP measure) (1) | 20,386 | 9,664 | 1,898 | ||||
| Net profit (loss) attributable to Eni | 13,887 | 5,821 | (8,635) | ||||
| Adjusted net profit (Non-GAAP measure) (1) | 13,301 | 4,330 | (758) | ||||
| Net cash provided by operating activities | 17,460 | 12,861 | 4,822 | ||||
| Capital expenditures | 8,056 | 5,234 | 4,644 | ||||
| Acquisitions | 3,311 | 2,738 | 392 | ||||
| Disposal of assets, consolidated subsidiaries and businesses | 1,202 | 404 | 28 | ||||
| Shareholders’ equity including non-controlling interest | 55,230 | 44,519 | 37,493 | ||||
| Finance debt (including lease liabilities) | 31,868 | 33,131 | 31,704 | ||||
| Net borrowings excluding lease liabilities (1) | 7,026 | 8,987 | 11,568 | ||||
| Net profit (loss) attributable to Eni diluted | (€ per share) | 3.95 | 1.60 | (2.42) | |||
| Dividend per share | (€ per share) | 0.88 | 0.86 | 0.36 | |||
| Ratio of finance debt (including lease liabilities) to total shareholders’ equity | 0.58 | 0.74 | 0.84 | ||||
| Ratio of net borrowings excluding lease liabilities to total shareholders’ equity (leverage) (1) | 0.13 | 0.20 | 0.31 | ||||
| (1) | For a discussion of the usefulness and a reconciliation of these non-GAAP financial measures with the most directly comparable GAAP financial measures see – "Non-GAAP measures of performance" and "Liquidity and capital resources – Financial Conditions" below. |
The 2022 trading environment was very complex and volatile due to market imbalances in the energy sector at the start of 2022, reflecting the post-pandemic recovery driving a pent-up demand for hydrocarbons and other commodities and lack of responsiveness on part of the supply side due to the financial discipline of international oil companies, production management on part of the OPEC+ alliance and production underperformance of the cartel’s producers. Those tight fundamentals already driving commodity prices were greatly compounded by Russia’s military aggression of Ukraine, which caused a spike in energy commodity prices due to the role of Russia in the energy sector and Europe’s significant dependence at that time on Russian hydrocarbons.
While rising commodity prices were a net positive for the Company and supported the performance of the E&P business, the unprecedented level of volatility recorded in European energy markets and elsewhere posed significant financial risks to the Company, which could have negatively and significantly affected the Group performance and its financial condition absent adequate risk management activities.
The Company’s performance in 2022 was very positive due to financial discipline, cost and margin optimization across all business lines, a supportive commodity price environment, management of the market risk and availability of refining capacity and natural gas supplies, as well as the Company’s ability to maintain significant hydrocarbons production volumes at 1,487 Kboe/d despite unplanned downtime and force majeure events and reduced levels of investing activities as a result of the cuts implemented during the COVID-19 pandemic crisis.
The Company directed its efforts to secure the continuity of natural gas supplies to its customers and to address market needs, while Russia began reducing its natural gas exports to Europe in retaliation for economic sanctions imposed by Western countries. In a context of great uncertainty and volatility, we took several steps to lessen our dependency on Russian natural gas in agreement with Italian authorities by seeking to diversify the geographic reach of our natural gas supplies leveraging on equity reserves and long-term partnerships with producing countries, particularly those bordering the Mediterranean Sea. As part of this strategy, we signed deals to boost natural gas purchases under long-term contracts and equity production in Algeria; we are planning to scale up exports from Egypt leveraging our recent near-field discoveries which we plan to start in the near term to deliver volumes to Europe through the proprietary Damietta liquefaction plant; we have been fast-tracking the development of an important LNG project in Congo, which is scheduled to commence operations in 2023, and we are planning to increase natural gas production in Italy by revitalizing existing fields. Longer term, we plan to start an important natural gas project offshore Libya, that was agreed early in January 2023 with the Libyan National Oil Company, and to secure additional LNG supplies via our participation to the North Field East project in Qatar. Overall, based on our planning projections and assumption we target to completely replace Russian supplies with supplies from other geographies by 2025.
During 2022, we progressed the build-up of our renewable electricity business by growing our capacity organically and via focused acquisitions and were able to reach more than 2GW of installed capacity at year-end.
Management of the market risks was achieved by increasing our financial headroom to cope with significantly higher cash requirements in connection with the margin calls from our commodity derivatives counterparts, by reducing part of the hedging activities, by finding alternative trading venues and finally by reducing sales commitments to account for a growing risk of unilateral disruptions in Russian supplies.
Another highlight of the year was the closing of a business combination involving the contribution of our subsidiaries operating in the hydrocarbons sector in Angola to the newly established JV Azule Energy Holdings in partnership with bp. Following the deal, our subsidiaries were derecognized, and we recorded a capital gain of about €1.78 billion due to the difference between the fair value of the interest in the joint venture and the book values of the disposed assets, within the limit of the share realized towards the third party (50%). We also recorded a gain of €0.76 billion due to the recognition as profit of positive exchange rate differences which had matured over the years in the net equity of the contributed subsidiaries. Those gains are excluded from the underlying measure of business performance (Non-GAAP measure).
We incurred charges of about €2.2 billion related to taxes levied on energy profit due to extraordinary fiscal measures enacted in Italy in response to the higher oil price environment (also known as “windfall taxes”) and, to a lesser extent, in Germany. Those also were accounted as extraordinary items.
As a result of those drivers, we earned a GAAP net profit of €13.9 billion, increasing by €8 billion from 2021. A Non-GAAP measure of profitability tracked by management “adjusted net profit” came in at about €13.3 billion, which excluded certain identified items that we regarded as non-core to the Group underlying performance; this was more than twice the result of 2021. See the paragraph below for a commentary of Group Non-GAAP performance measures and their reconciliation with the corresponding GAAP measures of performance.
The improvement in the Group performance was driven by the E&P and the GGP segments and by the R&M business, while the Chemicals business reported weaker results.
Reported net profit was more or less in line with the adjusted profit because extraordinary gains and losses almost offset each other (see commentary below).
In 2022, the Group’s net cash provided by operating activities was €17.5 billion, €4.6 billion higher than in 2021, driven by improved cash generation at the E&P segment and the R&M business.
In 2022, capital expenditure and acquisitions amounted to €11.4 billion, of which capital expenditure were €8.1 billion, which were incurred mainly to explore for and develop hydrocarbons reserves and to grow organically the installed capacity of electricity generation from renewable sources. Capital expenditures were significantly higher than in 2021, driven by an increase of about 60% in expenditures incurred by the E&P segment, reflecting the carry-over of activities and projects that were slowed down during the pandemic crisis, cost inflation and the appreciation of the US dollar vs the euro (up by 10% on average), as well as the start of new projects to secure additional natural gas supplies to Italy and Europe. We expect capital expenditure to continue trending higher in 2023 to about €9.5 billion, driven by an expected increase in E&P expenditures due to the ramp up of new projects and another leg up in inflationary pressures and, to a lesser extent, by higher expenditures to develop the renewable electricity generation. In 2022, acquisitions of around €3.3 billion were mainly directed to the businesses of electricity generation from renewable sources in the operating segment Plenitude&Power, to the LNG activity by acquiring a floating vessel to produce LNG to be deployed off Congo and by acquiring a 3% participating interest in the NFE project in Qatar, as well as capital contributions to the investee Saipem and to a venture engaged in the field of nuclear energy.
In 2022, cash returns to shareholders were €5.4 billion and included the payment of the final 2021 dividend (€1.49 billion), the first two quarterly instalment of the 2022 dividend of €0.22 per share each (€1.47 billion) and the execution of a share repurchase program of €2.4 billion.
At the end of 2022 finance debt amounted to €26.9 billion, €0.9 billion lower than at the end of 2021.
Management evaluates the soundness of the Group balance sheet and its financial position by monitoring a non-GAAP measure of indebtedness, net borrowings, which is calculated by subtracting cash and cash equivalents and other financial assets from finance debt (see Glossary), before the accounting effects of IFRS 16 (see Item 18 - Note 20 to the Consolidated Financial Statements).
In 2022, our NON-GAAP measure of net borrowings before IFRS 16 effect decreased by €1.96 billion as a result of the excess of the operating cash flow after funding capital expenditures, acquisitions and shareholders cash returns, and taking into account disposition of €1.2 billion and other positive cash inflows in relation to our investing activities of about €2.2 billion, out of which €1.3 billion related to the reimbursement of financing operating receivables owed to us by Azule Energy Holdings.
The ratio of total finance debt to total equity (GAAP measure) was 0.58, compared to 0.74 at year-end 2021.
Our ratio of indebtedness – leverage – ratio of net borrowings before IFRS 16 effect to total equity, which is a non-GAAP measure, was 0.13 at year-end 2022 (compared to 0.20 at year-end 2021) and was at a historical low.
See paragraph “Financial condition” below, for a full reconciliation of net borrowings and leverage to the most comparable performance measures calculated in accordance with IFRS.
2022 RESULTS OF OPERATIONS AND CASH FLOW
Reported earnings
In 2022, Eni reported a net profit attributable to its shareholders of €13,887 million, driven by an operating profit of €17,510 million (against an operating profit of €12,341 million in 2021) and better results of investments (up by around €6,300 million) due to the capital gain recognized at the closing of the transaction involving the establishment of Azule Energy Holdings and increased results of equity-accounted entities. Those positives were partly offset by higher income taxes, which were negatively affected by the recognition of €2.4 billion of windfall taxes, including the UK energy profit levy enacted in 2022.
NON-GAAP measures of performance: adjusted results
Adjusted operating profit (loss) and adjusted net profit (loss) are determined by excluding from the reported results inventory holding gains or losses and identified gains and losses (pre and post-tax, respectively) that in our view do not reflect business base performance.
Adjusted operating profit (or loss) and adjusted net profit (or loss) provide management with an understanding of the results from our underlying operations and are used to evaluate our period-over-period operating performance, as management believes these provide more comparable measures as they adjust for disposals and special charges or gains not reflective of the underlying trends in our business. These Non-GAAP performance measures may also be useful to an investor in evaluating the underlying operating performance of our business and in comparing it with the performance of other oil&gas companies, because the items excluded from the calculation of such measures can vary substantially from company to company depending upon accounting methods, management’s judgment, book value of assets, capital structure and the method by which assets were acquired, among other factors. Nevertheless, other companies may adopt different criteria in identifying underlying results and therefore our measure of adjusted operating profit (loss) and adjusted net profit (loss) may not be comparable to the adjusted measures presented by other companies.
In 2022, identified items included environmental and remediation provision of €2 billion, including a decommissioning provision €0.3 billion taken at a refinery line that was shut down indefinitely, impairment charges of €1.1 billion for oil & gas assets and chemicals plants, and windfall taxes on energy profits of €2.2 billion, of which €1 billion was paid in 2022. These charges were offset by a gain of €2.5 billion on the contribution of Eni’s subsidiaries to a newly established venture jointly controlled with another partner, Azule Energy Holdings, a gain of €0.4 billion on the divestment of an interest in the Vår Energi associate and by the recognition of deferred taxes of €2.2 billion.
All these identified items amounted to a total negative adjustment of €185 million in net profit and of €3,440 million in operating profit, including an inventory pre-tax profit of €564 million (€401 million post-tax).
The table below sets forth details of the identified gains and losses included in the net results during the period presented.
|
Year ended December 31, |
|||||||||
|
2022 |
2021 |
2020 |
|||||||
|
(€ million) |
|||||||||
|
Identified gains and losses of operating profit (loss) |
3,440 |
(1,186) |
3,855 |
||||||
|
- environmental charges |
2,056 |
271 |
(25) |
||||||
|
- impairment losses (impairments reversal), net |
1,140 |
167 |
3,183 |
||||||
|
- impairment of exploration projects |
2 |
247 |
|||||||
|
- net gains on disposal of assets |
(41) |
(100) |
(9) |
||||||
|
- risk provisions |
87 |
142 |
149 |
||||||
|
- provision for redundancy incentives |
202 |
193 |
123 |
||||||
|
- commodity derivatives |
(389) |
(2,139) |
440 |
||||||
|
- exchange rate differences and derivatives |
149 |
183 |
(160) |
||||||
|
- other |
234 |
(150) |
154 |
||||||
|
Net finance (income) expense |
(127) |
(115) |
152 |
||||||
|
of which: |
|
||||||||
|
- exchange rate differences and derivatives reclassified to operating profit (loss) |
(149) |
(183) |
160 |
||||||
|
Net (income) expense from investments |
(2,834) |
851 |
1,655 |
||||||
|
of which: |
|
||||||||
|
- gains on the Azule Energy transaction |
(2,542) |
||||||||
|
- gain on the divestment interest in Var Energi |
(448) |
||||||||
|
Income taxes |
(683) |
19 |
1,278 |
||||||
|
Total identified gains and losses of net profit (loss) |
(204) |
|
(431) |
|
6,940 |
||||
|
Attributable to: |
|
||||||||
|
- non-controlling interest |
(19) |
||||||||
|
- Eni's shareholders |
(185) |
(431) |
6,940 |
||||||
The Group underlying performance – i.e. excluding the identified gains and losses as well as the inventory holding profit – was an adjusted operating profit of €20,386 million compared to €9,664 million in 2021, up by approximately 111% or €10.7 billion. This performance was driven by the E&P segment (up by €7.12 billion) due to a strong recovery in commodity prices that fueled significantly higher realizations on equity production. The Global Gas and LNG portfolio segment (up by €1.48 billion) benefitted from portfolio optimizations and contract renegotiations; the Refining & Marketing and Chemical segment (up by €1.78 billion) reflected the improved performance of the R&M segment reaching its best performance ever (up by €2.2 billion, compared to breakeven in 2021), due to plant availability and cost and output optimization allowing to capture the upside of a strong refining environment, partly offset by weaker results of the Chemical business (down by €0.45 billion), negatively affected by competitive pressures, weakening demand and higher plant expenses which were indexed to the price of natural gas. In summary the main drivers of the Group underlying improvements were:
| • |
Price and margin effects due to favorable market trends for hydrocarbons prices and refining margins and the 10% appreciation of the US dollar vs the euro amounting to €10.3 billion, net of unfavorable margin compression in the Chemicals business of -€0.73 billion; |
|
| • |
A positive effect of €0.54 billion of contractual renegotiations in the GGP segment resulting in more favorable indexation of selling prices vs purchase prices also due to lowered hedging activities, partly offset by higher risk provisions in connection with contractual disputes; |
|
| • |
Cost efficiencies and margin optimizations in the R&M and Chemicals businesses for €0.48 billion; |
|
| • |
Lower production volumes and unfavorable production mix impacts in E&P due to unplanned downtime and force majeure events dragging down production volumes and the value of production, for -€0.94 billion. |
Excluding identified items and the inventory evaluation profit, adjusted net profit for 2022 was €13,301 million, a €8,971 million increase compared to 2021. The result was driven by a significantly higher operating performance and by improved results from equity accounted entities. The Group tax rate, excluding identified items (see paragraph “Taxes” of this item), was 39% and was lower than in 2021 (50% in 2021) due to a more favorable geographic mix of taxable profits and scenario effects in the E&P segment and improved profitability at our Italian subsidiaries, which are subject to a corporate tax rate lower than our E&P subsidiaries abroad; whereas in 2021 our Italian subsidiaries incurred predominantly losses before income tax with limited options to recognized deferred tax assets.
The table below provides a reconciliation of those Non-GAAP measures to the most comparable performance measures calculated in accordance with IFRS.
|
|
|
Year ended December 31, |
||||
|
|
|
2022 |
|
2021 |
|
2020 |
|
|
|
(€ million) |
||||
|
GAAP operating profit (loss) |
|
17,510 |
12,341 |
(3,275) |
||
|
Inventory holding (gains) and losses |
(564) |
(1,491) |
1,318 |
|||
|
Identified net (gains) losses |
3,440 |
(1,186) |
3,855 |
|||
|
Total net items in operating profit |
2,876 |
(2,677) |
5,173 |
|||
|
Non-GAAP operating profit (loss) |
|
20,386 |
9,664 |
1,898 |
||
|
GAAP net profit (loss) |
|
13,887 |
5,821 |
(8,635) |
||
|
Inventory holding (gains) and losses, post tax |
(401) |
(1,060) |
937 |
|||
|
Identified net (gains) losses, post tax |
(185) |
(431) |
6,940 |
|||
|
Total net items in net profit |
(586) |
(1,491) |
7,877 |
|||
|
Non-GAAP net profit (loss) |
|
13,301 |
4,330 |
(758) |
||
Trading environment
|
2022 |
2021 |
2020 |
|||
|
Average price of Brent dated crude oil in U.S. dollars (1) |
101.19 |
70.73 |
41.67 |
||
|
Average price of Brent dated crude oil in euro (2) |
96.09 |
59.8 |
36.49 |
||
|
Average EUR/USD exchange rate (3) |
1.053 |
1.183 |
1.142 |
||
|
Standard Eni Refining Margin (SERM)(4) |
8.5 |
(0.9) |
1.7 |
||
|
Euribor - three month euro rate % (3) |
0.13 |
(0.55) |
(0.43) |
|
(1) Price per barrel. Source: Platt’s Oilgram. |
|||||
|
(2) Price per barrel. Source: Eni’s calculations based on Platt’s Oilgram data for Brent prices and the EUR/USD exchange rate reported by the European Central Bank (ECB). |
|||||
|
(3) Source: ECB. |
|||||
|
(4) In $/BBL FOB Mediterranean Brent dated crude oil. Source: Eni calculations, as difference between the cost of a barrel of Brent crude oil and the value of the products obtained according to the standard yields of the Eni refining system, less expenses for industrial utilities. |
Eni’s results of operations and the year-to-year comparability of its financial results are affected by a number of external factors which exist in the industry environment, including changes in oil, natural gas and refined products prices, industry-wide movements in refining margins and fluctuations in exchange rates and interest rates. Changes in weather conditions from year to year can influence demand for natural gas and some petroleum products, thus affecting results of operations of the natural gas business and, to a lesser extent, of the refining and marketing business. See “Item 3 – Risk factors” for a description of the main trends which characterized the year 2022.
2022 marked one of the most volatile years in the history of oil prices, due to the impact of Russia’s military aggression of Ukraine at the end of February 2022, against the backdrop of already tight energy commodity markets.
Brent prices reached $140/bbl, in the first half of the year, the highest value recorded from 2008. The first half of 2022, characterized by an average price of $108/bbl, was followed by a volatile second half of the year with a decrease of about $40/bbl from the closing value of the first half, driven by tightened monetary conditions, perceived risks of an imminent macroeconomic slowdown, the USD appreciation against other currencies and steady Russian supplies contrary to market expectations of a fall in Russian oil production. On annual average, the Brent price was $101/barrel with an increase of 40% compared to the 2021 average of about $ 70/bbl.
Natural gas prices experienced even greater volatility than oil prices, especially in Europe due to its dependence on pipeline supplies from Russia. Compared to the 2021 average of about $15/mmBTU for the European spot reference Title Transfer Facility (TTF) which already represented a historical record, in 2022 values recorded $80-90/mmBTU due to fears of shortage for the following winter season in relation to the progressive downsizing of Russian export flows via pipeline, in the context of a continuous deterioration of political relations with the EU. In the final part of 2022 and early 2023, natural gas prices, thanks to a particularly mild winter season and significant exports of LNG from the USA, corrected substantially, closing at year end at values equal to or lower than those recorded before the outbreak of the conflict and averaging $37/mmBTU for the year.
Refining margins were supported by a recovery in fuel demand in all sectors, including civil aviation, and substantial diesel shortages mainly due to lower supplies from Russia.
The movement of the USD vs the Euro positively and significantly affected results of operation and cash flow in 2022, as the USD appreciated by about 10% on average year-on-year.
The preparation of the Consolidated Financial Statements requires the use of estimates and assumptions that
affect the assets, liabilities, revenues and expenses recognised in the financial statements, as well as amounts included in the notes thereto, including disclosure of contingent assets and contingent liabilities. Estimates made are based on complex judgements and past experience of other assumptions deemed reasonable in consideration of the information available at the time. The accounting policies and areas that require the most significant judgments and estimates to be used in the preparation of the Consolidated Financial Statements are in relation to the accounting for oil and natural gas activities, specifically in the determination of reserves, impairment of financial and non-financial assets, leases, decommissioning and restoration liabilities, environmental liabilities, business combinations, employee benefits, revenue from contracts with customers, fair value measurements and income taxes. Although the Company uses its best estimates and judgements, actual results could differ from the estimates and assumptions used. A review of significant accounting estimates and judgmental areas is provided in “Item 18 – Note 1 to Consolidated Financial Statements”.
The table below sets forth a summary of Eni’s profit and loss account for the periods indicated. All line items included in the table below are derived from the Consolidated Financial Statements prepared in accordance with IFRS. For the disclosure on 2021 Group results compared to 2020 see the Annual Report on Form 20-F 2021, filed to the SEC on April 8, 2022.
|
Year ended December 31, |
||||||
|
2022 |
2021 |
2020 |
||||
|
(€ million) |
||||||
|
Sales from operations |
132,512 |
76,575 |
43,987 |
|||
|
Other income and revenues (1) |
1,175 |
1,196 |
960 |
|||
|
Total revenues |
133,687 |
77,771 |
44,947 |
|||
|
Operating expenses |
(105,497) |
(58,716) |
(36,640) |
|||
|
Other operating (expense) income |
(1,736) |
903 |
(766) |
|||
|
Depreciation, depletion and amortization |
(7,205) |
(7,063) |
(7,304) |
|||
|
Impairment reversals (impairment losses) of tangible and intangible and right of use assets, net |
(1,140) |
(167) |
(3,183) |
|||
|
Write-off of tangible and intangible assets |
(599) |
(387) |
(329) |
|||
|
OPERATING PROFIT (LOSS) |
17,510 |
12,341 |
(3,275) |
|||
|
Finance income (expense) |
(925) |
(788) |
(1,045) |
|||
|
Income (expense) from investments |
5,464 |
(868) |
(1,658) |
|||
|
PROFIT (LOSS) BEFORE INCOME TAXES |
22,049 |
10,685 |
(5,978) |
|||
|
Income taxes |
(8,088) |
(4,845) |
(2,650) |
|||
|
Net profit (loss) |
13,961 |
5,840 |
(8,628) |
|||
|
Attributable to: |
||||||
|
- Eni's shareholders |
13,887 |
5,821 |
(8,635) |
|||
|
- Non-controlling interest |
74 |
19 |
7 |
|||
|
(1) Includes, among other things, contract penalties, income from contract cancellations, gains on disposal of mineral rights and other fixed assets, compensation for damages and indemnities and other income. |
Analysis of the line items of the prof it and loss account
a) Sales from operations
The table below sets forth, for the periods indicated, sales from operations generated by each of Eni’s business segments including intragroup sales, together with consolidated sales from operations.
|
Year ended December 31, |
|||||
|
2022 |
2021 |
2020 |
|||
|
(€ million) |
|||||
|
Exploration & Production |
31,200 |
21,742 |
13,590 |
||
|
Global Gas & LNG Portfolio |
48,586 |
20,843 |
7,051 |
||
|
Refining & Marketing and Chemicals |
59,178 |
40,374 |
25,340 |
||
|
Plenitude & Power |
20,883 |
11,187 |
7,536 |
||
|
Corporate and other activities |
1,879 |
1,698 |
1,559 |
||
|
Consolidation adjustments |
(29,214) |
(19,269) |
(11,089) |
||
|
SALES FROM OPERATIONS |
132,512 |
76,575 |
43,987 |
||
2022 compared to 2021. Eni sales from operations (revenues) for 2022 (€132,512 million) increased by €55,937 million from 2021 (or up by 73%) reflecting the upside of a favorable commodity environment and the appreciation of the US dollar vs. the euro (+10%).
Revenues generated by the Exploration & Production segment (€31,200 million) increased by €9,458 million (or up by 43.5%) driven by improved market conditions that supported higher realized hydrocarbon prices for equity volumes (up by 43.7% on average compared to 2021). The translation into euros of revenues generated by US dollar-denominated subsidiaries increased the reported amount by €2.2 billion. Those positives were partly offset by lower sales volumes impacting the reported amounts of revenues for €1.6 billion.
Revenues generated by the Global Gas & LNG Portfolio (€48,586 million) increased by €27,743 million (or up by 133.1%). The increase reflected higher gas spot prices, as a result of tight natural gas markets, particularly during the winter season when the balk of revenues occur due to seasonal factors, when spot prices at the main European and Italian hubs increased by several hundred percentage points. Price effects were partly offset by lower sales volumes due to lower imports from Russian supplies and lower consumption due to trends of demand destruction in connection with production curtailments by industrial accounts and widespread saving measures.
Revenues generated by the Refining & Marketing and Chemical segment (€59,178 million) increased by €18,804 million (or up by 46.6%) due to higher prices of refined products (gasoline up by 50% and gasoil up by 70% in US dollar). Increased volumes also helped grow revenues.
Revenues generated by the Plenitude & Power segment (€20,883 million) increased by €9,696 million (or up by 86.7%) following the increase of commodity prices and the consolidation of entities acquired in 2021.
The detailed effects of scenario trends as well as volume/mix on the changes (2022 vs 2021) in sales from operations are reported in the table below.
|
Sales from operations: change 2022 vs 2021 |
change |
of which: |
scenario effects |
volume/mix |
|||||
|
|
(€ billion) | ||||||||
|
E&P |
9.5 |
11.1 |
(1.6 |
) | |||||
|
|
|
|
|
|
|
||||
|
GGP |
27.7 |
29.7 |
(2.0 |
) | |||||
|
|
|
|
|
|
|
||||
|
R&M |
18.2 |
13.0 |
5.2 |
||||||
|
|
|
|
|
|
|
||||
|
Chemicals |
0.6 |
1.5 |
(0.9 |
) | |||||
|
|
|
|
|
|
|
||||
|
Plenitude & Power |
9.7 |
9.5 |
0.2 |
Other income and revenues
2022 compared to 2021. Eni’s other income and revenues amounted to €1,175 million in 2022 and include the share of lease repayments debited to joint operators in Eni-led upstream projects (€204 million).
b) Operating expenses
The table below sets forth the components of Eni’s operating expenses for the periods indicated.
|
Year ended December 31, |
|||||
|
2022 |
2021 |
2020 |
|||
|
(€ million) |
|||||
|
Purchases, services and other |
102,529 |
55,549 |
33,551 |
||
|
Impairment losses (impairment reversals) of trade and other receivables, net |
(47) |
279 |
226 |
||
|
Payroll and related costs |
3,015 |
2,888 |
2,863 |
||
|
Operating expenses |
105,497 |
58,716 |
36,640 |
||
2022 compared to 2021. Operating expenses for 2022 (€105,497 million) increased by €46,781 million compared to the prior year, up by 79.7%, primarily reflecting the increase of purchases, services and other costs (€102,529 million; up by 84.6% vs. 2021) due to higher supply costs of raw materials (natural gas under long-term supply contracts, refinery and chemical feedstock), plant utilities (power, steam) indexed to the cost of natural gas, as well as higher expenses for the purchase of carbon credits to offset GHG emissions above certain thresholds to comply with the obligations of the European ETS.
Payroll and related costs (€3,015 million) increased by €127 million from 2021 mainly due to the appreciation of the US dollar and to higher provisions for redundancy incentives.
c) Depreciation, depletion, amortization, impairment losses (impairment reversals) net and write-off
The table below sets forth a breakdown of depreciation, depletion, amortization, impairment losses (impairment reversals) net and write-off for the periods indicated.
|
Year ended December 31, |
|||||
|
2022 |
2021 |
2020 |
|||
|
(€ million) |
|||||
|
Exploration & Production |
6,018 |
5,976 |
6,273 |
||
|
Global Gas & LNG Portfolio |
217 |
174 |
125 |
||
|
Refining & Marketing and Chemicals |
506 |
512 |
575 |
||
|
Plenitude & Power |
358 |
286 |
217 |
||
|
Corporate and other activities and impact of unrealized intragroup profit elimination |
106 |
115 |
114 |
||
|
Total depreciation, depletion and amortization |
7,205 |
7,063 |
7,304 |
||
|
Impairment losses (impairment reversals) of tangible and intangible assets, goodwill and right of use assets, net |
1,140 |
167 |
3,183 |
||
|
Write-off of tangible and intangible assets |
599 |
387 |
329 |
||
|
Total depreciation, depletion, amortization, impairment losses (impairment reversals) of tangible and intangible and right of use assets, net and write off of tangible and intangible assets |
8,944 |
7,617 |
10,816 |
||
2022 compared to 2021. In 2022, depreciation, depletion and amortization charges (€7,205 million) increased by €142 million from 2021, mainly in the Exploration & Production segment (an increase of €42 million) due to the appreciation of the US dollar against the euro and new project start-ups, partly offset by the derecognition of the subsidiaries contributed to Azule Energy Holdings. In the GGP segment (up €43 million), the increase was due to the ramp-up of the Damietta plant and in Plenitude & Power the increase was due to the start-up of new producing plants (up €72 million).
In 2022, the Group recorded impairment losses at property, plant and equipment for a total amount of €1,140 million, out of which €432 million were driven by downward reserve revisions and expenditures updates at oil&gas fields mainly in Congo, Algeria, Egypt, and the USA and the write-down of residual goodwill amounts. The Refining & Marketing and Chemical segment incurred €717 million of impairment losses driven by a reduced profitability outlook in the petrochemicals segment resulting in the book values of plants in the intermediates segment being marked down to their lower recoverable amounts (about €400 million) and the write-off of expenditures incurred in the year for compliance and stay-in-business at certain Cash Generating Units with expected negative cash flows.
Write-off charges amounted to €599 million and mainly related to previously capitalized costs of exploratory wells which were expensed through profit because it was determined that they did not encounter commercial quantities of hydrocarbons mainly in Libya, Egypt, the Ivory Coast, Vietnam and Kenya or due to lack of management commitment in pursuing further appraisal activity. The amount also comprised previously capitalized costs of development projects that were written off due to lack of economic perspectives.
d) Operating profit (loss) by segment
The table below sets forth Eni’s operating profit by business segment for the periods indicated.
|
Year ended December 31, |
|||||
|
2022 |
2021 |
2020 |
|||
|
(€ million) |
|||||
|
Exploration & Production |
15,908 |
10,066 |
(610) |
||
|
Global Gas & LNG Portfolio |
3,730 |
899 |
(332) |
||
|
Refining & Marketing and Chemicals |
460 |
45 |
(2,463) |
||
|
Plenitude & Power |
(825) |
2,355 |
660 |
||
|
Corporate and other activities |
(1,901) |
(816) |
(563) |
||
|
Impact of unrealized intragroup profit elimination |
138 |
(208) |
33 |
||
|
Operating profit (loss) |
17,510 |
12,341 |
(3,275) |
||
Exploration & Production. In 2022, the Exploration & Production segment reported an operating profit of €15,908 million, with an increase of €5,842 million compared to the operating profit of €10,066 million reported in 2021. The increase was driven by higher realized prices of hydrocarbons reflecting a favorable commodity environment.
In 2022, Eni’s average realizations on crude oil and natural gas liquids increased on average by 44%, compared to an increase of 43% recorded in international oil prices for the Brent market benchmark, with the difference due to Eni’s production mix. Eni’s average natural gas realizations increased by 56%. Those latter were reduced on average by 1.27 $/KCF (or 11%) due to the impact of cash flow hedges activated on the sale of about 85 BCF. Those transactions were part of a hedging program relating to the sale of volumes out of the Company’s natural gas proved reserves in the period December 2021 to December 2022.
In reviewing the performance of the Company’s business segments and with a view to better explaining year-on-year changes in segment performance, management generally excludes the identified gains and losses presented below in order to assess the underlying industrial trends and obtain a better comparison of core business performance across reporting periods.
In 2022, identified gains and losses included impairment losses of €432 million relating mainly to fields in Congo, Algeria, Egypt, and the USA, driven by downward reserve revisions, expenditures updates and the expiration of a concession, as well as to the write-down of the residual amount of goodwill recognized in past reporting periods. Other charges included the write-off of projects due to lack of economic perspectives (€199 million), environmental provisions (€30 million) and provisions for redundancy incentives (€34 million).
Excluding those items, the E&P segment reported a Non-GAAP operating profit of €16,411 million, with an increase of €7,118 million from 2021, up by 76.6%, driven by higher realized prices and the appreciation of the US dollar vs the Euro, which were partly offset by lower production volumes and increased exploration write-off expenses.
|
change |
of which: |
scenario effects |
volume/mix/costs |
||||
|
(€ million) |
|||||||
|
Change in E&P Non-GAAP operating profit (loss) 2022 vs. 2021 |
7,118 |
8,069 |
(951) |
||||
|
Year ended December 31, |
|||||||||||
|
2022 |
2021 |
2020 |
|||||||||
|
Exploration & Production |
(€ million) |
||||||||||
|
GAAP operating profit (loss) |
|
15,908 |
10,066 |
(610) |
|||||||
|
Impairment losses (impairment reversals), net |
432 |
(1,244) |
1,888 |
||||||||
|
Net gains on disposal of assets |
(27) |
(77) |
1 |
||||||||
|
Environmental provisions |
30 |
60 |
19 |
||||||||
|
Risk provisions |
34 |
113 |
114 |
||||||||
|
Reclassification of currency derivatives and translation effects to management measure of business performance |
|
(57) |
(3) |
13 |
|||||||
|
Valuation allowance of disputed receivables and others |
|
|
77 |
||||||||
|
Write off of exploration projects |
|
2 |
247 |
||||||||
|
Other |
|
89 |
131 |
45 |
|||||||
|
Total identified gains and charges |
|
503 |
(773) |
2,157 |
|||||||
|
Non-GAAP operating profit (loss) |
|
16,411 |
9,293 |
|
1,547 |
||||||
Global Gas & LNG Portfolio (GGP)
In 2022, the GGP segment reported an operating profit of €3,730 million compared to a profit of €899 million in 2021. The increase was due to the optimization of the natural gas and LNG portfolio in a tight market, while ensuring the continuity of supplies to customers and managing the financial risks arising in connection with the operations in commodity derivatives. Those risks are described in Item 3.
In reviewing the performance of the Company’s business segments and with a view to better explaining year-on-year changes in the segment performance, management generally excludes the gains and losses presented below in order to assess the underlying industrial trends and obtain a better comparison of base business performance across reporting periods. The items excluded from GAAP operating profit (loss) in determining the Non-GAAP measure of profitability mainly include effects associated with commodity fair-valued derivatives.
Particularly, we enter into commodity and currency derivatives to reduce our exposure to (i) the commodity risk due to different indexation between the purchase cost and the selling price of gas or to lock in a commercial margin once a sale contract has been signed or is highly probable, and (ii) the underlying exchange rate risk due to the fact that our selling prices are indexed to the euro and our supply costs are denominated in dollars. These derivatives normally hedge the Group net exposure to commodities and exchange rates but do not meet the requirements for being accounted for as hedges in accordance to IFRS. We also entered as part of our ordinary activities into forward gas sale contracts which are intended to be settled with the delivery of the commodity and which are accounted at fair value because they were not eligible for the own use exemption at their inceptions, whereas the purchase costs of gas were accounted on an accrual basis.
In explaining year-on-year changes and in evaluating the business performance, management believes that is appropriate to exclude the fair value of commodity derivatives which lacked the formal criteria to be accounted for as hedges or were not eligible for the own use exemption, including the ineffective portion of cash flow hedges. We also excluded from our measure of underlying performance the effects of the settlement of certain commodity derivatives of which the underlying physical transaction had yet to be finalized with the delivery of the commodity. Furthermore, although the Group classifies within net finance expense those gains and losses on currency derivatives, as well as on the alignment of trade receivable and payables denominated in dollars into the accounts of euro subsidiaries at the closing rate, we believe that it is appropriate to consider those gains and losses on currency derivatives and currency differences at our dollar-denominated trade payables and receivables as part of the underlying business performance.
In 2022, the trading environment was very complex due to a spike in prices of natural gas, leading to higher cash requirements in connection with contractual agreements with commodity exchanges and banks to cover the higher financial exposure driven by higher commodity prices (margin calls). Furthermore, a possible disruption in supplies from our Russian counterparts would have exposed us to a default risk with our clients. We took several steps to offset those risks. We increased our financial headroom to face higher margin calls requirements and shifted our commodity derivatives transactions to other trading venues to limit the exposure to margin calls requirements and we also left unhedged few exposures to reduce the financial risks. Finally, we limited entering new sales agreements for the thermal year starting on September 2022 to counter the risk of defaulting on contractual agreements in case of disruptions in the Russian gas flows. The whole of those measures enabled us to overcome the peak of the commodity volatility and to avoid any possible default risks, so to retain profitable operations in our GGP business.
In 2022, identified items excluded a gain given by the difference between the value of gas inventories accounted for under the weighted-average cost method provided by IFRS and management’s own measure of inventories, which moves forward at the time of inventory drawdown the margins captured on volumes in inventories above their normal levels leveraging the seasonal spread in gas prices net of the effects of the associated commodity derivatives.
Excluding the below-listed gains and charges, the GGP segment reported a Non-GAAP operating profit of €2,063 million, with an increase of €1,483 million from 2021. This improvement was mainly driven by the continuous initiatives of portfolio optimization and contract renegotiations, which allowed the business to benefit from extreme volatile natural gas and LNG markets, while managing the underlying risks and ensuring supplies to customers. The positive effect of “contract renegotiations and movements in risks provisions” was mainly driven by favorable time lags in the indexation of the purchase cost of natural gas vs the selling price due to contractual updates and the Company’s decision to reduce risk management activities; this was partly offset by higher provisions due to an increased nominal value of trade receivables and higher counterparty risks due to the financial difficulties of industrial accounts pressured by rising energy costs, as well as provisions for contractual claims.
|
change |
of which: |
scenario effects |
contract renegotiations and risk provisions |
||||
|
(€ million) |
|||||||
|
Change in GGP Non-GAAP operating profit (loss) 2022 vs. 2021 |
1,483 |
944 |
539 |
||||
|
Year ended December 31, |
||||||
|
2022 |
2021 |
2020 |
||||
|
Global Gas & LNG Portfolio |
(€ million) |
|||||
|
GAAP operating profit (loss) |
|
3,730 |
899 |
(332) |
||
|
Impairment losses (impairment reversals), net |
(12) |
26 |
2 |
|||
|
Provision for redundancy incentives |
4 |
5 |
2 |
|||
|
Fair value gains/losses on commodity derivatives |
(1,805) |
(207) |
858 |
|||
|
Reclassification of currency derivatives and translation effects to management measure of business performance |
|
244 |
206 |
(183) |
||
|
Other |
(98) |
(349) |
(21) |
|||
|
Total identified gains and charges |
(1,667) |
(319) |
658 |
|||
|
Non-GAAP operating profit (loss) |
|
2,063 |
580 |
|
326 |
|
Refining & Marketing and Chemicals. In 2022, the Refining & Marketing and Chemicals segment reported an operating profit of €460 million, compared to an operating profit of €45 million in 2021, an improvement of €415 million, driven by the R&M business.
The main item excluded from GAAP operating profit in determining the Non-GAAP measure of profitability of this segment is the inventory holding gain (or loss). Inventory holding gains or losses represent the difference between the cost of sales of the volumes sold during the period calculated using the cost of supplies incurred during the same period and the cost of sales calculated using the weighted average cost method. Under the weighted average cost method, which we use for IFRS reporting, the cost of inventory charged to the income statement is based on its historic cost of purchase, or manufacture, rather than its replacement cost. In volatile energy markets, this can have a significant impact on reported income thereby affecting comparability. The amounts disclosed represent the difference between the charge (to the income statement) for inventory on a weighted average cost method basis (after adjusting for any related movements in net realizable value provisions) and the charge that would have arisen if an average cost of supplies was used for the period. For this purpose, the average cost of supplies during the period is principally calculated on a quarterly or monthly basis by dividing the total cost of inventory acquired in the period by the number of barrels acquired. The amounts disclosed are not separately reflected in the financial statements as a gain or loss. No adjustment is made in respect of the cost of inventories held as part of a trading position and certain other temporary inventory positions. We regard the inventory holding gain or loss, including any write-down to align the carrying amounts of inventories to their net realizable value at the reporting date, as lacking correlation to the underlying business performance which we track by matching revenues with current costs of supplies.
In addition to the inventory holding profit, the identified items of this segment for the year 2022 also comprised net charges mainly related to environmental provisions of €676 million, an approximately €300 million decommissioning charge relating to certain refinery production units and facilities, impairment losses of chemical plants to reflect a reduced profitability outlook and the write-down of capital expenditures made for compliance and stay-in-business at certain CGU with expected negative cash flows (overall €717 million), as well as the accounting effect of certain fair-valued commodity derivatives lacking the formal criteria to be classified as hedges (charges of €11 million). The reclassification to adjusted operating profit of the negative balance of €33 million related to exchange rate differences and derivatives.
In reviewing the performance of the Company’s business segments and with a view to better explaining year-on-year changes in the segment performance, management generally excludes the inventory holding gain (or loss) and the other identified gains and losses described above in order to assess the underlying industrial trends and obtain a better comparison of base business performance across reporting periods. Excluding those items, the R&M business reported a Non-GAAP operating profit of €2,183 million (an operating loss of €46 million in 2021), while the Chemical business reported a Non-GAAP operating loss of €254 million (a profit of €198 million in 2021).
The refining activity benefitted from a favorable market scenario with refining margins increasing materially from 2021. The rise in refining margins with the Company’s gauge SERM up to an average of about 9 $/bbl vs zero in 2021, was driven by a strong rebound in demand for all kinds of refined products due to the reopening of the economy, including the airline sector which had lagged the post-pandemic recovery until 2022, and bottlenecks and lack of capacity in the refining system due to the plant closures and restructurings occurred in Western countries over the past decade resulting in a shortage of gasoil and other middle distillates in Europe, also reflecting low imports from Russia due to the sanction regime. Furthermore, the rise in natural gas prices and natural gas-indexed plant utilities was offset by internal measures to optimize natural gas consumption and by own production of syngas, which returned profitable in such a kind of environment. Those positives were partly offset by higher expenses for the purchase of emission allowances.
|
change |
of which: |
scenario effects |
volume/mix/cost measures |
||||
|
(€ million) |
|||||||
|
Change in R&M Non-GAAP operating profit (loss) 2022 vs. 2021 |
2,229 |
2,034 |
195 |
||||
The Chemical business reported a non-GAAP operating loss of €254 million in 2022, compared to a profit of €198 million in 2021 driven by a resumption of competition trends which were less evident in 2021 due to higher commodity availability from Middle and Far East which put pressures on products margins. That trend was compounded by a weaker demand environment and rising expenses mainly due to a large increase in plant utilities costs indexed to the price of natural gas. These were partly offset by optimization measures intended to reduce natural gas consumption.
|
change |
of which: |
scenario effects |
volume/mix/cost measures |
||||
|
(€ million) |
|||||||
|
Change in Chemicals' Non-GAAP operating profit (loss) 2022 vs. 2021 |
(452) |
(732) |
280 |
||||
|
Year ended December 31, |
||||||
|
2022 |
2021 |
2020 |
||||
|
Refining & Marketing and Chemicals |
(€ million) |
|||||
|
GAAP operating profit (loss) |
|
460 |
45 |
(2,463) |
||
|
(Profit) loss on inventory |
|
(416) |
(1,455) |
1,290 |
||
|
Environmental provisions ond other costs |
962 |
150 |
85 |
|||
|
Impairment losses (impairment reversals), net |
717 |
1,342 |
1,271 |
|||
|
Net gains on disposal of assets |
(10) |
|
(22) |
(8) |
||
|
Risk provisions |
52 |
|
(4) |
5 |
||
|
Provision for redundancy incentives |
46 |
|
42 |
27 |
||
|
Fair value gains/losses on commodity derivatives |
4 |
|
50 |
(185) |
||
|
Reclassification of currency derivatives and translation effects to management measure of business performance |
(33) |
|
(14) |
10 |
||
|
Other |
147 |
|
18 |
(26) |
||
|
Total identified gains and charges |
1,469 |
107 |
2,469 |
|||
|
Non-GAAP operating profit (loss) |
|
1,929 |
152 |
6 |
||
|
- Refining & Marketing |
2,183 |
(46) |
235 |
|||
|
- Chemicals |
(254) |
198 |
(229) |
|||
Plenitude & Power
In 2022, this segment reported an operating loss of €825 million, a decrease of €3,180 million compared to the profit of €2,355 million of the previous year, mainly due to the impact of commodity derivatives relating to the purchase of natural gas at fixed prices to hedge the sales volumes at clients with fixed-price contracts.
In reviewing the performance of the Company’s business segments and with a view to better explaining year-on-year changes in the segment performance, management generally excludes the gains and losses presented below in order to assess the underlying industrial trends and obtain a better comparison of base business performance across reporting periods. The items excluded from GAAP operating profit in determining the Non-GAAP measure of profitability mainly include effects associated with commodity fair-valued derivatives.
Particularly, we enter into commodity derivatives to reduce our exposure to the commodity risk due to different indexation between the purchase cost and the selling price of gas and power or to lock in a commercial margin once a sale contract has been signed or is highly probable. These derivatives normally hedge the Group net exposure, but do not meet the requirements for being accounted for as hedges in accordance to IFRS.
Therefore, in explaining year-on-year charges and in evaluating the business performance management believes that is appropriate to exclude the fair value of commodity derivatives which lacked the formal criteria to be accounted for as hedges, including the ineffective portion of cash flow hedges.
Excluding the below-listed gains and charges, the Plenitude & Power segment reported a Non-GAAP operating profit of €615 million, with an increase of €139 million from 2021, or 29.2%. The retail gas and power business and the renewables business managed by Plenitude, reported a Non-GAAP operating profit of €345 million, slightly down year-on-year. The business of retail sales of natural gas was negatively affected by significantly higher purchase costs of natural gas on unhedged volumes reflecting higher-than-average seasonal consumption (during both winter and summer) and a lower-than-expected churn out rate than initially planned at fixed-price contracts giving rise to a mismatch in indexation between purchase costs and selling prices of natural gas; those negative trends were partly offset by higher realized prices on renewable electricity production sold on spot basis.
The power business reported an adjusted operating profit of €270 million (up by €157 million) due to a favorable price scenario and higher revenues associated with the provision of services to the national grid.
Corporate and Other activities. These activities are mainly cost centers comprising holdings, financing and treasury activities in support of operating subsidiaries, central functions like legal counselling, human resources, captive insurance activities, general and administrative support, as well as research and development, new technologies, business digitalization and the environmental activity developed by the subsidiary Eni Rewind.
The aggregate Corporate and Other activities reported an operating loss of €1,901 million in 2022 which compared with a loss of €816 million reported in 2021. The increased loss reflected charges of €1,279 million mainly relating to environmental provision taken at dismissed Italian industrial hubs, based on management’s accumulate know-how about scale, reach and timing of remediation activities and a stabilized regulatory framework, allowing reliable estimate of the future costs of the reclamation of groundwater. This change was treated as an extraordinary item.
e) Net f inance expenses
The table below sets forth a breakdown of Eni’s net financial expenses for the periods indicated:
|
Year ended December 31, |
||||||
|
2022 |
2021 |
2020 |
||||
|
(€ million) |
||||||
|
Income (expense) on derivative financial instruments |
13 |
(306) |
351 |
|||
|
of which - Derivatives on exchange rate |
(70) |
(322) |
391 |
|||
|
- Derivatives on interest rate |
81 |
16 |
(40) |
|||
|
- Options |
2 |
|||||
|
Exchange differences, net |
238 |
476 |
(460) |
|||
|
Finance expense from banks on short and long-term debt |
(635) |
(569) |
(619) |
|||
|
Interest expense for lease liabilities |
(315) |
(304) |
(347) |
|||
|
Interest income due to banks |
57 |
4 |
10 |
|||
|
Net income from financial assets measured at fair value through profit or loss |
(55) |
11 |
31 |
|||
|
Finance expense due to the passage of time (accretion discount) |
(199) |
(144) |
(190) |
|||
|
Other finance income and expense, net |
(67) |
(24) |
106 |
|||
| (963) | (856) | (1,118) | ||||
|
Finance expense capitalized |
38 |
68 |
73 |
|||
|
NET FINANCE EXPENSES |
(925) |
(788) |
(1,045) |
|||
In 2022, net finance expenses were €925 million, €137 million higher than in 2021, mainly driven by a higher interest rate environment, which resulted in higher expenses relating to our floating rate financial liabilities, higher losses on the mark-to-market of securities measured at fair value through profit and the unwinding of discount of provisions (mainly the decommissioning provision). These negatives were partly offset by higher interest income, lower interest expense due to a reduction in average net borrowings and positive interest rate derivatives activated to match floating-rate finance debt.
f) Net income from investments
The table below sets forth a breakdown of Eni’s net income (loss) from investments for the periods indicated:
|
Year ended December 31, |
||||||
|
2022 |
2021 |
2020 |
||||
|
(€ million) |
||||||
|
Share of gains (losses) from equity-accounted investments |
1,841 |
(1,091) |
(1,733) |
|||
|
Dividends |
351 |
230 |
150 |
|||
|
Net gains (losses) on disposals |
483 |
1 |
||||
|
Other income (expense), net |
2,789 |
(8) |
(75) |
|||
|
5,464 |
(868) |
(1,658) |
||||
| 153 |
In 2022 the Group reported a net profit from investments of €5,464 million, which comprised a gain of €2,789 million mainly relating to the contribution of E&P’s subsidiaries in Angola to the newly established venture Azule Energy Holdings. The gain was calculated as the difference between the fair value of the interest in the venture received in exchange of the net equity’s book values of the former subsidiaries for the share realized with the third party (50%), and included positive exchange rate differences recycled from equity through profit and loss (around €750 million).
Eni’s share of profits generated by equity-accounted investments was €1,841 million and was mainly driven by profits in the Exploration&Production segment (€1,526 million) and the R&M and Chemicals segment (€446 million), partly offset by losses at Corporate and other activities (€115 million) segments, respectively in:
| (i) | the E&P Vår Energi associate, where we recognized a profit of €691 million mainly driven by a recovery in hydrocarbons prices, partly offset by impairment losses recorded at oil&gas assets; | |
| (ii) | the R&M ADNOC Refining&Trading associate, where we recognized a profit of €529 million due to a recovery of refining margins; | |
| (iii) | the E&P Azule Energy Holdings joint venture, where we recognized a profit of €455 million; | |
| (iv) | the E&P Coral FLNG SA associates for €140 million; | |
| (v) | the joint venture Saipem, where we recognized a loss of €82 million driven by an unfavorable trading environment on the back of capex cuts implemented by oil&gas companies which reduced the joint ventures revenues and profitability. |
Dividends of €351 million were paid by minority investments in certain entities which were designated at fair value through other comprehensive income under IFRS 9, except for dividends which are recorded through profit. These entities mainly comprised Nigeria LNG Ltd (€247 million, where Eni has an interest of 10.4%) and Saudi European Petrochemical Co (€77 million, where Eni has an interest of 10%).
Net gains on divestment of assets of €483 million mainly referred to the divestment of an interest in Vår Energi through a public offering at the Oslo stock exchange and a private placement.
g) Taxes
In 2022, income taxes increased by €3,243 million to €8,088 million and compared to pre-tax profit of €22,049 million resulted in a tax rate of 36.7% (compared to 45.3% in 2021).
In 2022, the Group income taxes included extraordinary solidarity tax contributions enacted in Italy (€2 billion) and Germany (€0.2 billion) as well as the UK Energy profit levy (€0.2 billion). The Group recognized deferred tax assets of about €2.2 billion due to a more favorable profitability outlook of Italian subsidiaries, which allowed to account for prior-year tax loss carryforwards. Excluding the above-mentioned one-off items, but reflecting the UK Energy Profit Levy which established in a structural increase in the corporate income tax levied on our oil&gas operations in the country, as opposed to the one-off charges in other jurisdictions, the Group underlying tax rate was about 39% and improved by ten percentage points year-on-year. This favorable trend was driven by a better geographic mix of earnings in the E&P segment resulting in a larger proportion of jurisdictions with lower-than-average rates of taxes, as well as positive scenario effects which reduced the impact of non-deductible expenses. Another improving trend was the higher contribution to results of Italian subsidiaries, which are subject to a corporate tax rate significantly lower than that of the foreign subsidiaries of the E&P segment, while in 2021 Italian subsidiaries were still recording losses and were unable to recognize deferred tax assets. Finally, higher earnings of equity-accounted entities improved the Group tax rate.
Eni’s cash requirements for working capital, dividends to shareholders, capital expenditures, acquisitions and share repurchases over the past three years were financed primarily by a combination of funds generated from operations, issues of equity investments (hybrid bonds) and divestments of property, plant and equipment and investments or the reimbursement of operating financing receivables owed to Eni by unconsolidated entities, while the Group has gradually reduced third-party financing over the same period to cope with the volatility of the trading environment. The Group continually monitors the balance between cash flow from operating activities and net expenditures targeting a sound and balanced financing structure.
The following table summarizes the Group cash flows and the principal components of Eni’s change in cash and cash equivalent for the periods indicated.
This cash flow statement is a GAAP measure of cash flow and is presented herein to help readers understand the change in the year of the Group net borrowings which is a NON-GAAP measure as explained further on.
|
Year ended December 31, |
|||||
|
2022 |
2021 |
2020 |
|||
|
(€ million) |
|||||
|
Net profit (loss) |
13,961 |
5,840 |
(8,628) |
||
|
Adjustments to reconcile net profit to net cash provided by operating activities: |
|||||
|
- amortization and depreciation charges, impairment losses, write-off and other non monetary items |
4,369 |
8,568 |
12,641 |
||
|
- net gains on disposal of assets |
(524) |
(102) |
(9) |
||
|
- dividends, interest, taxes and other changes |
8,611 |
5,334 |
3,251 |
||
|
Changes in working capital related to operations |
(1,279) |
(3,146) |
(18) |
||
|
Dividends received by equity investments |
1,545 |
857 |
509 |
||
|
Taxes paid |
(8,488) |
(3,726) |
(2,049) |
||
|
Interests (paid) received |
(735) |
(764) |
(875) |
||
|
Net cash provided by operating activities |
17,460 |
12,861 |
4,822 |
||
|
Capital expenditures |
(8,056) |
(5,234) |
(4,644) |
||
|
Acquisition of investments and businesses |
(3,311) |
(2,738) |
|
(392) |
|
|
Disposals of consolidated subsidiaries, businesses, tangible and intagible assets and investments |
1,202 |
404 |
|
28 |
|
|
Other cash flow related to investing activities |
2,361 |
289 |
|
(735) |
|
|
Net cash inflow (outflow) related to financial activities |
786 |
(4,743) |
|
1,156 |
|
|
Changes in short and long-term finance debt |
(2,569) |
(244) |
|
3,115 |
|
|
Repayment of lease liabilities |
(994) |
(939) |
|
(869) |
|
|
Dividends paid and changes in non-controlling interests and reserves |
(4,841) |
(2,780) |
(1,968) |
||
|
Net issue (repayment) of perpetual hybrid bond |
(138) |
1,924 |
2,975 |
||
|
Effect of changes in consolidation and exchange differences of cash and cash equivalent |
16 |
52 |
(69) |
||
|
Net increase (decrease) in cash and cash equivalent |
1,916 |
(1,148) |
3,419 |
||
|
Cash and cash equivalent at the beginning of the year |
8,265 |
9,413 |
|
5,994 |
|
|
Cash and cash equivalent at year end |
10,181 |
8,265 |
|
9,413 |
|
|
Year ended December 31, |
|||||
|
2022 |
2021 |
2020 |
|||
|
|
(€ million) |
||||
|
Net cash provided by operating activities |
17,460 |
12,861 |
4,822 |
||
|
Capital expenditures |
(8,056) |
(5,234) |
(4,644) |
||
|
Acquisitions of investments and businesses |
(3,311) |
(2,738) |
(392) |
||
|
Disposals of consolidated subsidiaries, businesses, tangible and intangible assets and investments |
1,202 |
404 |
28 |
||
|
Other cash flow related to capital expenditures, investments and divestments |
2,361 |
289 |
(735) |
||
|
Repayment of lease liabilities |
(994) |
(939) |
(869) |
||
|
Net borrowings (1) of acquired companies |
(512) |
(777) |
(67) |
||
|
Net borrowings (1) of divested companies |
142 |
||||
|
Exchange differences on net borrowings and other changes |
(1,352) |
(429) |
759 |
||
|
Dividends paid, share repurchases and changes in minority interest and reserves |
(4,841) |
(2,780) |
(1,968) |
||
|
Net issue (repayment) of perpetual hybrid bond |
(138) |
1,924 |
2,975 |
||
|
Change in net borrowings(1) before IFRS 16 effects |
1,961 |
2,581 |
(91) |
||
|
Repayment of lease liabilities |
994 |
939 |
869 |
||
|
Inception of new leases and other changes |
(608) |
(1,258) |
(239) |
||
|
Change in net borrowings after IFRS 16 effects (1) |
2,347 |
2,262 |
539 |
||
|
Net borrowings (1) at the beginning of the year |
14,324 |
16,586 |
17,125 |
||
|
Net borrowings (1) at year end |
11,977 |
14,324 |
16,586 |
||
|
(1) Net borrowings is a non-GAAP financial measure. For a discussion of the usefulness of net borrowings and its reconciliation with the most directly comparable GAAP financial measures see “Financial Condition” below. |
In 2022, adjustments to reconcile the net profit reported in the year to net cash provided by operating activities mainly related to depreciation, depletion, amortization and impairment charges net of €4,369 million relating to results of equity accounted entities and the gain recorded on the Azule Energy Holdings transaction. Adjustments to net profit also included accrued income taxes (€8,088 million) and interest expense (€1,033 million), which were partly offset by amounts actually paid (€8,488 million and €851 million, respectively).
The dividends received by equity-accounted and other investments mainly related to Vår Energi, Azule Energy Holdings, Adnoc R&T and Nigeria LNG.
a) Changes in working capital related to operations
In 2022, working capital generated an outflow of €1,279 million. This was mainly due to an increase in the book value of oil, natural gas and refined products inventories accounted for under the weighted-average cost method the replenishment of natural gas inventories in view of the next winter season, as well as the change in the fair value of commodity derivatives. Those outflows reduced corresponding amounts recognized in the profit and loss account because the change in the book values of inventories is credited to profit and loss, and the change in the fair value of non-hedging commodity derivatives is charged to profit and loss. Other changes were recorded in connection with a positive inflow due to the balance between trade receivables collected and trade payables paid (€1,248 million) and an increase in risk provisions reflecting the accrual of certain environmental provisions taken at shut down Italian industrial hubs and other facilities and decommissioning provisions in the R&M business.
|
Year ended December 31, |
|||||
|
2022 |
2021 |
2020 |
|||
|
(€ million) |
|||||
|
Exploration & Production |
6,362 |
3,861 |
3,472 |
||
|
Global Gas & LNG Portfolio |
23 |
19 |
11 |
||
|
Refining & Marketing and Chemicals |
878 |
728 |
771 |
||
|
Plenitude & Power |
631 |
443 |
293 |
||
|
Corporate and other activities |
166 |
187 |
107 |
||
|
Impact of unrealized intragroup profit elimination |
(4) |
(4) |
(10) |
||
|
Capital expenditures |
8,056 |
5,234 |
4,644 |
||
|
Acquisitions of investments and businesses |
3,311 |
2,738 |
|
392 |
|
|
11,367 |
7,972 |
|
5,036 |
||
|
Disposals of consolidated subsidiaries, businesses, tangible and intangible assets and investments |
(1,202) |
(404) |
|
(28) |
|
Capital expenditures totaled €8,056 million and €5,234 million, respectively in 2022 and in 2021.
For a discussion of capital expenditures by business segment and a description of year-on-year changes see “Capital expenditures by segment”.
Cash outflows for acquisitions of €3,311 million (to which around €400 million of assumed net finance debt are to be added) related to the acquisition of a 20% stake in the Dogger Bank C offshore wind project in the North Sea, the 100% stake in SKGR company owner of a portfolio of photovoltaic plants in Greece, renewable capacity in the United States, a 3% interest in the North Field East LNG project in Qatar, the 100% stake in PLT Energia engaged in the renewable business, the Tango FLNG floating liquefaction vessel in Congo, a capital contribution made to a venture engaged in the field of nuclear energy and a capital contribution to our joint venture Saipem to support a new industrial plan and a financial restructuring of the investee.
In 2022, disposals amounted to €1,202 million and related mainly to the divestment of a stake of the joint venture Vår Energi (about €0.53 billion) through an IPO at the main Norway’s stock exchange and then a private placement, a capital reimbursement by an equity-accounted investee (Angola LNG) and the disposal of a minor subsidiary by Plenitude.
Other positive inflows related to the reimbursement of operating financing receivables owed to Eni by the former subsidiaries in Angola following their derecognition due to their being contributed to Azule Energy Holdings (around €1.3 billion) and an increase of around €1 billion in payables due to the suppliers of capital goods reflecting the incurrence of a large part of capital expenditures in the final months of 2022, reducing the outflow in connection with investing activities.
b) Dividends paid, share repurchases and changes in non-controlling interests and reserves
In 2022, dividends paid and changes in non-controlling interests and reserves (€3,069 million) related to the dividends paid to Eni shareholders (€3,009 million which comprised the 2021 final dividend for about €1.5 billion and the first and the second quarterly instalment of the 2022 dividend of €0.22 per share each, amounting to €1.5 billion). A share repurchase program of €2,400 million was executed in the year by repurchasing about 196 million shares. Those outflows were partly offset by the purchase of a non-controlling interest (€0.5 billion) in Eni’s subsidiaries by an investor operating in the natural gas-fired power generation business.
Financial condition
Management assesses the Group’s capital structure and capital condition by tracking net borrowings, which is a non-GAAP financial measure. Eni calculates net borrowings as total finance debt (short-term and long-term debt) derived from its Consolidated Financial Statements prepared in accordance with IFRS less: cash, cash equivalents and certain highly liquid investments not related to operations including, among others, a liquidity reserve made of held-for-trading securities and finally other liquid assets not related to operations.
Financial assets measured at fair value through profit or loss constituting part of the Group’s liquidity reserves amounted to €8.3 billion as of end of 2022 and were accounted as mark-to-market financial instruments. Of this amount, fixed income securities issued by industrial companies and financial institutions were €5.2 billion. Although the fair value of these investments is netted from financial debt in our calculation of net borrowings, there is no certainty that these investments could be readily monetizable at their carrying value, particularly in the event of market stress. For further information, see “Item 18 – Note 7 – Financial assets at fair value through profit and loss – of the Notes on Consolidated Financial Statements”. Non-operating financing receivables consist mainly of deposits with banks and other financing institutions and deposits in escrow (mainly cash deposits established as a collateral of derivative transactions).
Management believes that net borrowings is a useful measure of Eni’s financial condition as it provides insight about the soundness of Eni’s capital structure and the ways in which Eni’s operating assets are financed. In addition, management utilizes the ratio of net borrowings to total shareholders’ equity including non-controlling interest (leverage) to assess Eni’s capital structure, to analyze whether the ratio between finance debt and shareholders’ equity is well balanced compared to industry standards and to track management’s short-term and medium-term targets. Management continuously monitors trends in net borrowings and trends in leverage in order to optimize the use of internally-generated funds versus funds from third parties. The measure calculated in accordance with IFRS that is most directly comparable to net borrowings is total debt (short-term and long-term debt). The most directly comparable measure, derived from IFRS reported amounts, to leverage is the ratio of total debt to shareholders’ equity (including non-controlling interest). Eni’s presentation and calculation of net borrowings and leverage may not be comparable to other companies.
The tables below set forth the calculations of net borrowings and leverage for the periods indicated and their reconciliation to the most directly comparable GAAP measure.
|
As of December 31, |
|||||||||||
|
2022 |
|
2021 |
|||||||||
|
Short-term |
Long-term |
Total |
Short-term |
Long-term |
Total |
||||||
|
Finance debt (short-term and long-term debt) |
7,543 |
19,374 |
26,917 |
4,080 |
23,714 |
27,794 |
|||||
|
Lease liabilities |
884 |
4,067 |
4,951 |
948 |
4,389 |
5,337 |
|||||
|
Cash and cash equivalents |
(10,155) |
(10,155) |
(8,254) |
(8,254) |
|||||||
|
Financial assets measured at fair value through profit or loss |
(8,251) |
(8,251) |
(6,301) |
(6,301) |
|||||||
|
Non operating financing receivables |
(1,485) |
(1,485) |
(4,252) |
(4,252) |
|||||||
|
Net borrowings including lease liabilities |
(11,464) |
23,441 |
11,977 |
(13,779) |
28,103 |
14,324 |
|||||
|
As of December 31, |
||||
|
2022 |
2021 |
|||
| (€ million) | ||||
|
Shareholders’ equity including non-controlling interest as per Eni’s Consolidated Financial Statements prepared in accordance with IFRS |
55,230 |
44,519 |
||
|
Ratio of finance debt including lease liabilities to total equity |
0.58 |
0.74 |
||
|
Less: ratio of cash, cash equivalents and certain liquid investments not related to operations to total equity |
(0.36) |
(0.42) |
||
|
Ratio of net borrowing to total equity |
0.22 |
0.32 |
||
|
Ratio of net borrowing excluding lease liabilities to total equity |
0.13 |
0.20 |
||
At December 31, 2022, total finance debt of €26,917 million consisted of €7,543 million of short-term debt (including the portion of long-term debt due within twelve months equal to €3,097 million) and €19,374 million of long-term debt. At the same date, lease liabilities were €4,951 million (short-term portion €884 million).
Total finance debt included unsecured bonds for €18,512 million (including accrued interest and discount on issuance). Bonds maturing in the next 18 months amounted to €2,723 million (including accrued interest and discount).
As part of a new financial framework that links the cost of borrowings to the attainment of certain targets of environmental performance, in 2021 Eni issued a sustainability-linked bond for a nominal amount of €1 billion linked to the achievement of the following sustainability targets: (i) net carbon footprint upstream (GHG emission Scope 1 and 2) equal to or lower than 7.4 million tons of CO2 equivalent as of December 31, 2024; (ii) renewable energy installed capacity equal to or greater than 5 GW as of December 31, 2025. If one of the targets is not achieved, a step-up mechanism will be applied, increasing the yield of the bonds.
In 2022, net borrowings including lease liabilities amounted to €11,977 million, representing a €2,347 million decrease from 2021 due to the cash flow from operating activities that exceeded the requirements to fund capital expenditures, acquisitions, and cash returns to shareholders.
IFRS 16 lease liabilities amounted to €4,951 million in 2022 compared to €5,337 million in 2021, down by €386 million, reflecting the derecognition of a leased FPSO vessel held by Angolan subsidiaries that were derecognized following their contribution to the Azule Energy Holdings JV, partly offset by the start of a project in Mexico operated by a leased vessel. The IFRS 16 lease liabilities included €494 million pertaining to joint operators in Eni-led upstream unincorporated joint ventures, which are expected to be recovered through a partner-billing process.
Net borrowings excluding the lease liabilities, which is the Non-GAAP measure of financial condition mostly tracked by management would amount to €7,026 million, down by €1,961 million compared to December 31, 2021.
The ratio of finance debt to total equity was 0.58 at 2022 year-end, including the IFRS 16 lease liability (0.74 at 2021 year-end). Total equity of €55,230 million increased by €10,711 million from December 31, 2021. This was due to the net profit for the period (€13,961 million), the positive foreign currency translation differences (€1,095 million) reflecting the appreciation of the US dollar vs. the euro as of December 31, 2022 vs. December 31, 2021, the positive change in the cash flow hedge reserve of €794 million reflecting trends in gas prices, partly offset by the payment of dividends to Eni shareholders (balance of the 2021 dividend of €1,522 million and the first and the second quarterly instalment of the 2022 dividend of €0.22 per share each, amounting to €1.47 bln) as well as the buy-back (€2,400 million).
The Group Non-GAAP measure of its financial condition mostly tracked by management was leverage calculated by excluding the impact of IFRS 16 and was 0.13 at year end (0.20 at the end of 2021).
Capital expenditures by segment
Exploration & Production. In 2022, capital expenditures of the Exploration & Production segment amounted to €6,362 million, mainly related to the development of oil&gas reserves (€5,348 million). Significant expenditures were directed mainly in Egypt, Ivory Coast, Congo, the United Arab Emirates, Mexico, Iraq, Italy and Algeria.
Exploration expenditures (€708 million) were directed in particular in Egypt, the United Arab Emirates, Ivory Coast, Cyprus, Angola, Vietnam, Congo, Kenya and Algeria.
Global Gas & LNG Portfolio. In 2022, capital expenditure in the Global Gas & LNG portfolio totaled €23 million.
Refining & Marketing and Chemicals. In 2022, capital expenditures in the Refining & Marketing and Chemicals segment amounted to €878 million and regarded mainly: (i) refining activity in Italy and outside Italy (€491 million) for the maintaining plants’ integrity and stay-in-business, as well as HSE initiatives; (ii) marketing activity (€132 million) for regulation compliance and stay-in-business initiatives in the retail network in Italy and in the rest of Europe.
Plenitude & Power. In 2022, capital expenditures in the Plenitude & Power segment amounted to €631 million and mainly related to development activities in the renewable business, acquisition of new customers as well as development of electric vehicles network infrastructure.
The table below sets forth certain indicators of the trading environment for the periods indicated:
|
Three months ended March 31, |
Three months ended March 31, |
|||
|
2022 |
2023 |
|||
|
Average price of Brent dated crude oil in U.S. dollars (1) |
101 |
81 |
||
|
Average EUR/USD exchange rate (2) |
1.122 |
1.073 |
||
|
Standard Eni Refining Margin (SERM) (3) |
(0.9) |
11 |
||
|
Natural gas spot price at the TTF in $/mmBTU |
31.6 |
17 |
|
(1) Price per barrel. Source: Platt’s Oilgram. |
|||||
|
(2) Source: ECB. |
|||||
|
(3) In $/BBL, FOB Mediterranean Brent dated crude oil. Source: Eni calculations, as difference between the cost of a barrel of Brent crude oil and the value of the products obtained according to the standard yields of the Eni refining system, less expenses for industrial utilities. |
In the period January 1 – March 31, 2023 the Brent crude oil price averaged 81 $/BBL down by about 20% compared to the first quarter 2022. This trend will negatively affect the year-on-year comparability of Eni is results of operations. It is also below management's Brent assumptions of 85 $/BBL for the whole of 2023. See “management expectations of operations” below. The refining margins in the first quarter 2023, as measured by our benchmark SERM of about 11 $/bbl have been trending much higher than our assumptions for 2023 and well above the first quarter 2022. Natural gas spot prices at the European Title Transfer Facility have been averaging 17 $/mmBTU and are trending below both our assumptions for 2023 and compared to the first quarter 2022 and this could negatively affect our results of operations in the first quarter 2023 and beyond. Finally the recovery of the euro vs the US dollar exchange rate with the first quarter 2023 average at 1EUR = 1.07 USD is still below the value recorded in the first quarter 2022 and this will help year-on-year comparability.
The main business transactions occurred in the firth quarter 2023 are reported in Item 4.
Business trends
Exploration & Production
The statements of expected group financial performance in this section are based on the strategic plan approved by our board of directors in February 2023; as further noted below, various commodity market prices have developed in the first quarter of 2023 in a manner less favorable to our assumptions for the whole of 2023, in a way that may negatively affect our earnings and cash flow.
In the next four-year plan 2023-2026, the management is planning to increase the cash generation and returns in the E&P segment leveraging on profitable production growth, capital discipline, fast time-to-market of projects, and strict control of operating expenses and working capital needs. Rising inflationary pressures driven by surging prices of all kinds of commodities (energy, steel, metals, cement), a shortage of specialized labor, supply-chain bottlenecks and a reduced availability of rigs and other sector specific machinery and facilities are likely to pose a risk to our profitability outlook.
Our production plans and financial projections in the E&P segment are based on our Brent crude oil price scenario of 85 $/BBL in 2023-2024 and 80 $/bbl to 2026, in nominal terms (i.e. taking into account management’s own assumption on the inflationary rate going forward). The 2023 outlook is featuring a 15% decline in crude oil prices from 2022 based on the assumptions of a more balanced supply-demand environment and a moderation in macroeconomic growth and in inflation pressures. Supply is expected to be constrained by continued financial discipline on the part of publicly-listed international oil&gas companies and production management on part of the OPEC+ alliance. Downside risks to this outlook could be a deeper-than-expected contraction in macroeconomic activity due to, for example, the uncertainties in case of a prolonged conflict between Russia and Ukraine, a faltering recovery in Chinese crude oil demand and persistence of inflationary pressures forcing the US Federal Reserve and other central banks to raise interest rates above market expectations which would curb demand for crude oil. We expect the spot prices of natural gas at the Title Transfer facility “TTF”, the main European hub, and other hubs to decline to a range of 26-28 $/mmBTU in 2023, from an average of about 40 $ in 2022, and then to continue trending down to half of the 2023 level by 2026.
Post 2026, our Brent price assumptions in real terms (i.e. without taking into account inflation) are 62 $/bbl till 2033, then declining to 43 $ in 2050 to take into account our expectations of the energy transition impacts and a possible significant decline in demands for crude oil. Our long-term assumptions about the inflationary rate are about 2% p.a.
Due to those risks and uncertainties, management intends to retain a strong focus on capital and cost discipline, on shortening the projects cycle and on reducing the time-to-market of our reserves as levers to maintain our development projects profitable also at lower crude oil prices.
We plan to invest €6-6.5 billion on average in the next four-year plan 2023-2026 to explore for and develop hydrocarbons reserves. Those cash outlays do not include expected expenditures that will be incurred by our participated joint ventures and associates, like the expenditures that will be incurred by Var Energi and by Azule Energy, this latter commenced operation in the final month of 2022. Those equity-accounted entities are expected to self-finance their respective capital expenditures needs, without recurring to shareholders’ funds.
We forecast hydrocarbons production to grow at a compounded average growth rate “CAGR” of 3-4% in the four-year plan, driven by new projects start-ups and ramp-ups, and then to plateau to 2030, with a gradual increase of the proportion of natural gas in the production mix till achieving 60% by 2030.
In 2023, the Company plans to start-up the first phase of the Baleine field off Ivory Coast and the Congo LNG project in Block Marine XII. In subsequent years start-ups are planned in Egypt in relation to recent near-field discoveries, in UAE, in Indonesia, in Italy, in Qatar and in Norway, while progressing the development program of natural gas reserves in Algeria and Baleine Phase 2. By 2026 the Company is expected to add around 800,000 BOE/d of new production from start-ups and ramp-ups; according to our plans all of these developments will feature high returns compared to our cost of capital, short payback periods and efficient unitary costs.
To reach our goals of returns and cash flow generation, we plan to carefully select our development projects against our pricing assumptions and minimum requirements of internal rates of return. We intend to reduce financial exposure and the execution risk leveraging on a phased approach in developing our projects. Although we plan to deliver our planned projects on time and on budget, several of our projects are complex due to scale and reach of operations, environmentally-sensitive locations, external conditions, including offshore operations, industry limits and other considerations including the risk factors described in Item 3. These constraints and factors might cause delays and cost overruns. In addition, costs of our industrial inputs (labor, materials, field services) are expected to rise driven by inflation. Our capital plans included our best assumptions of expected cost increases due to inflation. We have also factored in our projections of macro-economic conditions. We plan to continue to carry out actions to mitigate the inflationary pressures and the execution risks that we have started in 2022. These planned actions include:
| • |
performing project activities in accordance with a so-called parallel approach as opposed to a sequential approach, for example the discovery appraisal and pre-fid activities, and by deploying a phased project approach to achieve early start-up and then ramping up production, thus reducing the time-to-market; examples of this approach are the Baleine project and the Congo LNG project; |
|
| • |
signing master agreement with our main supplies to maximize cost savings and by designing facilities using a modular approach that enables us to extend the useful lives of plants and vessels; |
|
| • |
reducing the time to complete tender processes to sign up contracts with EPC contractors and other key suppliers reducing the risk of future price revisions; |
|
| • |
leveraging on near-field exploration that has proven to be successful at increasing the reserves at already producing fields thus enabling to exploit cost synergies with existing facilities; for example in Egypt we are developing several near-filed discoveries, which will support the expected growth rate in the plan period; |
|
| • |
continuing in-sourcing critical engineering and project management phases, for example by exercising tight control over construction, hook-up and commissioning, which based on our experience could significantly improve the ability of the Company to carry out projects on time and on budget; |
|
| • |
applying our design-to-cost method whereby the Company has redirected its exploration efforts towards mature and low-complexity areas where we can achieve fast time-to-market and cost synergies, for example the Congo LNG project, the discoveries recently made in the East of the Mediterranean Sea and in Egypt and Algeria onshore will provide a rapid time-to-market due to those features. We expect that cost control and profitable operations will be supported by a continued progress in our technologies designed to improve drilling performance and the recovery factor and digital investment to r improve workplace safety and asset integrity thus reducing asset downtime. |
Phased project development and strict integration between exploration and development have improved the overall project execution and cost efficiency. Finally, all our projects undergo a thorough HSE assessment leading to the definition of an integrated plan to reduce blow-out and other well and operational risks and costs.
Exploration will seek to ensure cost-effective replacement of produced reserves, supporting cash generation and evolving our reserve portfolio towards the planned mix of resources featuring a bigger proportion of natural gas. Our exploration initiatives will comprise two clusters:
| • | Exploration projects in proven/mature areas and targeting near-field, infrastructure lead opportunities i.e. in prospects close to producing fields, where we can leverage existing infrastructures to readily develop the discovered resources, attaining fast contribution to cash flows and production levels with minimum impact on expenditures; | |
| • | Selected initiatives in high-risk/high-rewards plays, where we retain high working interests and the operatorship, which will enable us to apply our dual exploration model in case of material discoveries. |
Our dual exploration model contemplates the acquisition of high interests in exploration leases and, in case of exploration success, the partial divestiture of the discovered resources with a view of accelerating the conversion of resources into cash or of accomplishing asset swaps.
In the four-year plan 2023-2026, we will invest around €2 billion in exploration activities.
Our production plans include assumptions relating to production levels in certain countries that are particularly exposed to risks of disruptions and political instability. To factor in possible risks of unfavorable geopolitical developments in those countries, which may lead to temporary production losses and disruptions in our operations in connection with, among others, acts of war, sabotage, social unrest, clashes and other form of civil disorder, we have applied a haircut to our future production levels based on management’s appreciation of those risks, past experience and other considerations. This contingency factor does not cover worst-case developments and extreme events, which could determine prolonged production shutdowns. Furthermore, in recent years we have pursued a strategy intended to diversify the geographic reach of our operations aiming at reducing the geopolitical risk in our portfolio.
Global Gas & LNG Portfolio
We expect natural gas markets to remain very volatile in 2023 and beyond, notwithstanding an improved balance between supply and demand on a global scale due to a milder-than-average winter season in the Northern Hemisphere in 2023, a significant growth in US production and LNG exports and a moderation in consumption due to energy-saving measures and a slowdown in industrial output, especially in Europe. However, a possible recovery in Chinese activity may add upside risks to that scenario. We plan to retain stable profitability and cash generation in this business in the plan period, although we believe that the level of 2022 profitability benefitted from exceptional market conditions.
Our priority going forward is to complete our stated goal of fully replacing Russian natural gas supplies with other flows by 2025, leveraging the integration between the E&P and the GGP segments. We are planning to step up purchase from our long-standing suppliers and to increase equity production by leveraging the fast time-to-market and ramp-up of natural gas volumes from our E&P projects in Algeria, Egypt, Mozambique, Congo and Qatar.
Against this scenario, the Company’s priority in its GGP business is to retain stable profitability and cash generation based on the following drivers:
| (i) | To continuously renegotiate our long-term gas supply and sale contracts to align pricing terms and delivery quantities to current market conditions and dynamics as they evolve; | |
| (ii) | To effectively manage our portfolio of assets (supply and sales contracts, their flexibilities and optionality and logistics availability) in order to extract value from portfolio flexibilities through continuing optimizations; | |
| (iii) | To grow the LNG marketing business leveraging on the integration with the E&P segment with the aim of maximizing the profitability along the entire gas value-chain. We plan to increase contracted supplies of LNG to achieve a robust portfolio of reselling opportunities. Contractual LNG volumes are expected to reach 18 MTPA by 2026. |
We make use of commodity and financial derivatives to hedge against the risks of different indexation formulas in our gas procurement costs vs. selling prices in relation to contracted sales or highly-probable sales. A number of these derivatives are not accounted as hedges in accordance with IFRS and consequently are recorded through profit and loss and may add a component of volatility to our results of operations. Furthermore, the rise in volatility could negatively affect the business due to a likely deterioration in the counterparty risk due to current difficulties of industrial accounts to translate higher energy costs to final customers and hence to pay amounts owed to us, as well as a liquidity risk in connection with the need to increase the cash collateral in favor of financial institutions and commodity-based exchanges to guarantee the settlement of derivatives.
Finally, we make use of derivatives to improve margins by leveraging on market volatility and availability of assets like the flexibilities associated with our take-or-pay gas contracts, LNG contracts, transport rights to capture arbitrage opportunities (for example the winter vs summer spread, the spot vs. the Brent indexation spread) and time lags in contracts indexation formulae. Those derivatives are of speculative nature with gains and losses recognized through profit. However, in response to the increased liquidity risks, we have opted to reduce our risk management activities and that could make our results more volatile. Furthermore, the supply, take-or-pay contracts with Russian counterparts are still current and represent a source of risk to the GGP profitability outlook, which is unpredictable and difficult to estimate.
Refining & Marketing
After years of underperformance, in 2022 the oil-based refining business reported positive results driven by under-capacity of existing infrastructures, following a decade-long of restructuring and plant closures in Western countries, a pent-up demand in all market segments, including a recovery in the airline sector, and tight supplies of gasoil. We believe those trends to continue supporting refining margins in 2023 and possibly beyond. However, due to the cyclical nature of the business, the fact that new capacity is forecast to enter the market in the next years, particularly in the Middle and Far East, and to structural reduction of fossil fuels consumption in our key European markets due to penetration of EV and mandated measures by EU governments to reduce CO2 emissions, we believe that refining margins will normalize in the long term. Based on those assumptions we plan to retain a strong focus on plant efficiency and reliability, cost discipline, measures to optimize natural gas consumption in the operations and the search of viable solution to eventually restructure and downsize our oil-based, operated refineries in Italy. Consistently with this market view, we have not reversed prior-year impairment losses recorded at our refineries, which continue to remain completely devaluated in our consolidated financial accounts. Furthermore, we accounted for a decommissioning provision of about €300 million regarding a refinery asset that is lacking any profitability prospect even in this favorable trading environment and where restructuring options are uneconomic.
The Group plans to grow significantly the manufacturing capacity of biofuels with the goal of reaching more than 3 million tons of installed capacity by the end of 2025 through the upgrading of the Gela and Venice plant and by restructuring another traditional plant. Furthermore, a joint venture with a US refining operator is expected to start-up in the first half 2023, which is progressing the upgrading of a refinery to a biorefinery. The environmental footprint of our bio-refineries will be improved. In the final months of 2022, we ceased supplying palm oil as feedstock for manufacturing biofuels and we are replacing it with used cooking oils and other sustainable raw materials that do not compete with the food chain. As part of our plans to establish a sustainable supply-chain for our biorefineries, we are developing a vertically-integrated business model, which contemplates establishing a network of agricultural hubs in many of the countries of E&P operations, in Africa and in other geographies. This activity is intended to not compete with the food chain and to produce a vegetable oil at Eni’s dedicated mills by treating supplies of raw vegetables grown by local farmers, supplied to Eni under long-term agreements. This business model has seen the first development in 2022 with a first cargo of vegetable oil produced in Kenya, which was delivered to our biorefineries in Italy. The agricultural business will be scaled up in the planning period to reach a level of supplies of 700 Ktonnes by 2026, covering approximately 25% of our requirements for the biorefineries. This vertical integration will also boost margins on the production of biofuels, insulating our company from the volatility of raw materials. We are also planning to develop the offer of sustainable aviation fuels and of natural gas from agricultural biomass.
In Marketing activities, where we expect a very competitive environment, we are seeking to retain steady and robust profitability mainly by focusing on innovation of products and services anticipating customer needs, strengthening our line of premium products, as well as efficiency in the marketing and distribution activities. Further value will be extracted by the development of our initiatives in the segment of sustainable mobility and new fuels (for example the service of recharging electric vehicles, the supply of compressed natural gas and of LNG, as well as the start of the supply of hydrogen) and developing non-fuel products and services.
From January 1, 2023, the activity of manufacturing biofuels and the retail network have been merged into a new subsidiary, wholly controlled by Eni, named Eni Sustainable Mobility, which will offer increasingly decarbonized solutions/products to people on the move, leveraging product and service innovation and the emerging trend in mobility. This subsidiary is expected to contribute significantly to the stability and robustness of the performance of the Refining&Marketing segment going forward.
Chemicals business
In 2022, the Eni’s chemicals sector managed by the subsidiary Versalis reported weak results due to the long-term challenged fundamentals of the business, because of renewed competition from producers in Middle and East Asia, which are advantaged by plant scale and lower operating expenses, and a slowdown in demand for plastics, which exacerbated the price competition. Furthermore, the Eni’s business was negatively affected by rising costs of plant utilities indexed to natural gas. We believe those negative trends to continue affecting the business performance in 2023 and beyond. The Company is focused on executing an industrial plan intended to recover profitability and to transform the business to a structurally more sustainable and competitive products mix, by reducing the exposure to the competitive trends in the most commoditized market segments. The main levers of the industrial plan comprise: (i) to increase the weight in the business mix of differentiated products with higher added, also leveraging on growing our market share in the compounding and specialized formulations through Finproject that we acquired in 2021, (ii) to develop the business of the circular economy by increasing production of polymers made from the mechanical recycling of waste plastics, (iii) to develop the chemicals from renewables feedstocks (second generation sugars and vegetable oils) to address end-markets with big potential, (iv) to improve integration and efficiency, balancing the cracking capacity with the internal needs for manufacturing polymers and lowering trade sales of intermediates which are exposed to the volatility of the cycle. A key driver of our strategy will be our proprietary technologies which can expand our presence in new markets, like for example the production of bio-ethanol from biomass, or the technology for producing polymers via the chemical recycling of used plastics that we are going to test by building a pilot plan at one of our industrial hubs in the plan period.
Plenitude
Plenitude, Eni’s subsidiary managing the Group legacy retail marketing of natural gas business, the renewable electricity business and the network of charging points for EV will leverage the synergies among those businesses to improve its profitability going forward. We plan to accelerate the development of the installed capacity to produce renewable power to reach more than 7 GW of installed capacity by the end of the plan. Our network of charging points for electric vehicles will be expanded with the objective of reaching around 30 thousand points by 2026.We plan to selectively grow our customer base, with the target to reach 11 million customers by 2026 and to boost profitability by extracting more value from the customer portfolio, by supplying an increasing share of equity renewable energy and bio-methane, as well as by expanding the offer of new products and services other than the commodity and by continuing innovation in marketing processes including the deployment of digitalization in the acquisition of new customers, a reduction in the cost to serve and effective management of working capital.
Expected Group financial performance
For 2023, we expect net cash provided by operating activities (“operating cash flow”) to be the primary source of cash to fund our capital plans and returns to shareholders.
Our operating cash flow is mainly driven by our E&P business due to its relative larger size and higher profitability compared to our other businesses.
Therefore, our operating cash flow is exposed to the volatility of hydrocarbons prices, that are highly correlated to the macroeconomic cycle, the global balance between demands and supplies and the worldwide levels of inventories, among others. Based on our experience, those backdrop conditions can vary very rapidly and accordingly hydrocarbons prices corrections can be sudden and severe. Due to those considerations, our operating cash flow features high variability and little predictability. The 2023 outlook is compounded by many uncertainties depending on the intensity of a possible macroeconomic slowdown, the effect of restrictive monetary policies on consumers’ and businesses’ spending decisions and confidence, the strength in the recovery of the Chinese economy and crude oil demands and the OPEC+ alliance continued support of crude oil prices. Taking into account those risks, we are assuming a Brent crude oil price of 85 $/bbl for 2023, some 15% lower than 2022. As a result of that, our results of operations and cash flows are expected to decline compared to 2022. We are assuming spot prices of natural gas at European hubs to be around 26-28 $/mmBTU, the Company’s gouge of the refining trading environment, SERM at 7 $/bbl and the average EUR vs USD exchange rate at 1EUR=1.03 USD.
In contrast to the volatility of our operating cash flows, our funding requirements to develop hydrocarbons reserves are characterized by a low degree of flexibility. The E&P segment is a capital-intensive business and needs large amounts of financial resources to support production volumes and to develop new oil&gas reservoirs. Hydrocarbons development projects are long lead-times projects due to the complexity of activities to be carried out before production is achieved and the pay-back period of capital projects may start. Once a final investment decision has been made to develop a new hydrocarbon field and contracts have been signed to build production facilities and other equipment, management may face difficulties at postponing or stopping cash outlays in response to a sudden contraction in operating cash flows. Management can reduce incremental investments at producing fields, like workover or infilling operations, when economic and operating conditions allow for that. The expected compression of our cash flow from operations in 2023 due to reduced pricing assumptions will be occurring at a time when our funding needs to support our capital plan are planned to rise significantly. In 2023, we plan to incur €9.5 billion of capital expenditures, higher than the €8 billion incurred in 2022, with the increase reflecting new project start-up and ramp-up in E&P and cost inflation. That development is expected to increase our financial risk profile going forward.
In addition, the Company is investing heavily to grow its business of power generation from renewable sources and other businesses linked to the energy transition. These businesses are currently absorbing cash because they are in a ramp-up phase.
For those reasons, management is always allocating a portion of funds to uncommitted projects, which can be more comfortably cancelled or postponed in case of a downturn in the oil prices. In the four-year plan 2023-2026 out of the planned capital budget of €37 billion, the portion allocated to uncommitted projects represents 46%.
Due to these considerations, management is retaining a prudent financial framework, based on selective investment criteria, pre-set cash allocation priorities and adoption of a ceiling to the maximum amount of debt that the Company may incur. New capital projects are approved if they fit strict economic criteria, including being profitable in a low-price environment, short pay-back periods, reduced time-to-market as a means to limit financial exposure and resilience to possible risks relating to price volatility and, in the long-term, the energy transition.
In 2023 under our pricing, exchange rate and inflation assumptions, we expect to generate enough cash flow from operations to fund planned capital expenditures of €9.5 billion and expected cash returns to shareholders.
To fund other Company’s commitments, including the possible purchase of assets to complement our organic growth, the payment of lease liabilities and of the windfall taxes on energy profits, we expect to increase net borrowings compared to 2022 levels; however, our core metric of indebtedness “leverage” will remain in line with our stated ceiling of 0.2-0.25. Those plans are exposed to the volatility of hydrocarbons prices and refining margins. Brent prices have been trending slightly below our expectations so far in 2023, averaging 81 $/bbl in the period January 1 – March 31, 2023. Currently, we are estimating our operating cash flow to vary by approximately €130 million for each one-dollar change in the Brent crude oil price with respect to our base case assumption of 85 $/bbl for 2023. Natural gas prices have been trending below Company’s expectation, with the first quarter 2023 average at around 17 $/mmBTU; each one-dollar change in the sport prices of natural gas in Europe has the same impact as a one-dollar change in the Brent price. The Company’s refining margins have been performing better than expected, with an average of around 11 $/bbl in the first quarter. Currently, we are estimating our cash flow operations to vary by about €140 million for each one-dollar change in the SERM.
For planning purposes, management assumed a USD/EUR exchange rate in the range of 1.03 – 1.15 U.S. dollars per euro in the 2023-2026 period. Given the sensitivity of Eni’s results of operations to movements in the euro versus the U.S. dollar exchange rate, trends in the currency market represent a factor of risk and uncertainty. We note that in the first quarter of 2023 the USD/EUR exchange rate was approximately 1.07; this trend will negatively affect the expected cash flow of the Eni’s E&P segment compared to our assumptions. Currently, we are estimating our cash flow from operating activities to vary by about €720 million for a 5 USD/cent movement in the USD/EUR cross rate.
For further information see Item 3 – Risk factors and notes to the consolidated financial statements.
This financial framework is completed by the maintenance of a liquidity reserve consisting of cash on hand, marketable securities and committed credit lines, which have been dimensioned to help the Company withstand a sudden contraction in operating cash flows, a spike in the volatility of commodity prices leading to increased margining obligations in connection with our derivatives transactions, or short-term difficulties in accessing capital markets. At the end of 2022 this liquidity reserve amounted to €20 billion of cash on hand and held-for-trading securities and €8 billion of committed borrowings facilities to meet our funding requirements for short-term debt, maturities of long-term debt and finance leases that come due in the next twelve months and commitments for capital expenditures over the same time horizon.
The actions planned in the next four-year period featuring profitable hydrocarbons production growth, an increasing contribution of our green businesses managed by the operating segment Plenitude&Power and of the biofuels business, continuing portfolio optimizations in GGP, margin preservation in the oil refining business and a restructuring of the petrochemicals business managed by Versalis coupled with capital and cost discipline will underpin a solid cash generation and increasing shareholders’ returns.
We are evaluating options to monetize part of our interests in Plenitude and Eni Sustainable Mobility. We plan to retain a robust balance sheet with our core ratio of net borrowings to total equity – leverage – before the effects of IFRS 16 expected to remain in line with our stated ceiling of 0.2 – 0.25 along the plan period.
In the next four-year plan 2023-2026, we expect to incur €37 billion of capital expenditures with the following break-down for the main businesses:
| • |
around €23 billion to develop new oil&gas projects, mainly natural gas and LNG initiatives, and to maintain the production plateau at existing fields; |
|
| • |
around €2 billion to explore for new hydrocarbons reserves, mainly in near-field prospects; |
|
| • |
around €5 billion to develop the renewable generation capacity, the network of EV charging points and other initiatives of Plenitude; |
|
| • |
around €1.2 billion to develop the ongoing initiatives in the nascent business of the underground permanent geological storage of CO2 and the construction of agricultural hubs to produce feedstock for Eni’s biorefineries; |
|
| • |
around €3.4 billion to develop the manufacturing capacity of biofuels, upgrade the network of service stations and to maintain plant reliability and safe operations in the refining business; |
|
| • |
around €1.3 billion in the petrochemicals business. |
This capex plans is 30% higher than the previous plan to account for the appreciation of the US dollar vs the Euro, cost inflation and the development of new projects to increase natural gas and LNG supplies to Europe, as well as the businesses intended to reduce our carbon footprint, as more funds are expected to be allocated to develop hubs for underground permanent geological storage of CO2 and to upgrade Eni’s biorefineries.
Our financial projections and capital investment decisions are based on management’s appreciation of the cost of capital to the Group at about 7%. This rate is in line with 2021 due to a perceived decrease of Eni’s equity risk due to the ongoing deleveraging process, which helped offset the increase in risk-free yields driven by a recovery in inflation. When making final investment decisions, the thresholds against which specific investment internal rate of returns are benchmarked, are defined by adding to the above-mentioned cost of capital, a risk premium associated with the country where the investment will be executed and an additional business risk premium to cover high-risk investments (like exploration projects).
This financial outlook is subject to the volatility of crude oil prices and to the other risk factors described in Item 3.
Remuneration policy
Management is committed to delivering on a progressive and competitive shareholder remuneration policy, that is reflective of the expected trend in underlying earnings and cash flows. In setting the level of shareholders’ remuneration, management also consider the level of crude oil prices and other market variables.
As part of that framework, management plans to distribute shareholders between 25 to 30% of the expected cash flow from operations before working capital needs of each year of the financial plan projections through a combination of dividends and share buy-back. In case the commodity price scenario evolves better than management expectations, management intend to distribute up to 35% of the incremental cash flow from operations due to better commodity prices compared to management’s planning assumptions. In case the scenario evolves contrary to management’s expectations, the Company intends to preserve shareholders’ returns leveraging on the flexibility allowed by a leverage that is currently well below the management’s ceiling as well as on possible revisions of the capital expenditure plans considering the proportion of uncommitted projects in our development portfolio.
For 2023, having assessed the progress of the Company in executing its strategy, a sound financial position and a supportive outlook for crude oil prices, Eni has committed to increase the annual total dividend to €0.94 per share, up 7% from €0.88 per share relating to fiscal year 2022. This dividend is expected to be paid in four quarterly instalments of about equal amount in September 2023, November 2023, March 2024 and May 2024. Therefore expected cash out for dividend payments in 2023 will include two instalments of the 2022 dividend of €0.22 per share each, and two instalments of the planned 2023 dividend of about €0.23-0.24 per share each.
Furthermore, consistently with its remuneration policy, Eni plans to activate a share buyback program of €2.2 billion, following due shareholders’ approval at the Annual General Meeting scheduled in May 2023.
See “Item 3 – Risk factors”.
The expectations described above are subject to risks, uncertainties and assumptions associated with the oil&gas industry, and economic, monetary and political developments in Italy and globally that are difficult to predict. There are a number of factors that could cause actual results and developments to differ materially, including, but not limited to, political instability in Libya and other countries, crude oil and natural gas prices; demand for oil&gas in Italy and other markets; developments in electricity generation; price fluctuations; drilling and production results; refining margins and marketing margins; currency exchange rates; general economic conditions; political and economic policies and climates in countries and regions where Eni operates; regulatory developments; the risk of doing business in developing countries; governmental approvals; global political events and actions, including war, terrorism and sanctions; project delays; material differences from reserves estimates; inability to find and develop reserves; technological development; technical difficulties; market competition; the actions of field partners, including the inability of joint venture partners to fund their share of operating or developments activities; industrial actions by workers; environmental risks, including adverse weather and natural disasters; and other changes to business conditions. Please refer to “Item 3 – Risk factors”.
Off-balance sheet arrangements
Eni has entered into certain off-balance sheet arrangements, including guarantees, commitments and risks, as described in “Item 18 – Note 28 – Guarantees, commitments and risks – of the Notes on Consolidated Financial Statements”. Eni’s principal contractual obligations, including commitments under take-or-pay or ship-or-pay contracts in the gas business, are described under “Contractual obligations” below. See the Glossary for a definition of take-or-pay or ship-or-pay clauses.
Off-balance sheet arrangements comprise those arrangements that may potentially impact Eni’s liquidity, capital resources and results of operations, even though such arrangements are not recorded as liabilities under generally accepted accounting principles. Although off-balance sheet arrangements serve a variety of Eni’s business purposes, Eni is not dependent on these arrangements to maintain its liquidity and capital resources; nor is management aware of any circumstances that are reasonably likely to cause the off-balance sheet arrangements to have a material adverse effect on the Company’s financial condition, results of operations, liquidity or capital resources.
Eni has provided various forms of guarantees on behalf of unconsolidated subsidiaries and affiliated companies, mainly relating to guarantees for loans, lines of credit and performance under contracts. In addition, Eni has provided guarantees on the behalf of consolidated companies, primarily relating to performance under contracts. These arrangements are described in “Item 18 – Note 28 – Guarantees, commitments and risks – of the Notes on Consolidated Financial Statements”.
Liquidity risk
Liquidity risk is the risk that suitable sources of funding for the Group may not be available, or the Group is unable to sell its assets on the marketplace as to be unable to meet short-term financing requirements and to settle obligations. Such a situation would negatively impact the Group results and cash flow as it would result in the Company incurring higher borrowing expenses to meet its obligations, divesting assets at discount to their fair values or under the worst of conditions the inability of the Company to continue as a going concern. At present, the Group believes it has access to sufficient funding and has also both committed and uncommitted borrowing facilities as well as cash reserves and cash on hand to meet currently foreseeable borrowing requirements. The Group cash reserve consists of cash on hand and very liquid financial assets (short-term deposits and held-for-trading securities). This cash reserve according to management plans can alternatively be used to absorb temporary swings in cash flows from operations, to provide financial flexibility to pursue the Group development programs or to fund the Group contractual obligations with respect to the repayment of financing debt at maturity up to a 24-month horizon. For a description of how the Company manages the liquidity risk see “Item 18 – Note 28 of the Notes on Consolidated Financial Statements”. Due to the continued volatility in commodity markets we might incur increased liquidity risks due to the need to deposit larger amount of cash collaterals at financial institutions and commodity-based exchanges to guarantee the settlement of derivatives contracts (margin calls). The Group is adopting measures to strengthen its financial headroom to cope with possible market turbulence. To withstand uncertain financial markets and macroeconomic conditions, the Group has retained a level of financial flexibility in planning future capital requirements to grow the business, as 46% of the capital expenditure plan of €37 billion is allocated to uncommitted projects in the four-year period 2023-2026.
Working capital
Management believes that, taking into account unutilized credit facilities, the Company’s liquidity reserves, our credit rating and access to capital markets, Eni has sufficient working capital for its foreseeable requirements.
Credit risk
Credit risk is the potential exposure of the Group to losses in case counterparties fail to perform or pay amounts due. For a description of how the Company manages the credit risk see “Item 18 – Note 28 of the Notes on Consolidated Financial Statements”. For more information about the allowance for doubtful accounts calculated in accordance with the expected credit loss model see “Item 18 – Note 8 of the Notes on Consolidated Financial Statements”. Due to the significant increase in commodity prices in 2022, we expect an increased counterparty risk due to a higher nominal value of trade receivables, which may force our clients to ask for a deferral in the timing of repayment, as well as rising risks of default particularly by industrial accounts whose financial conditions could be pressured by rising energy and commodity costs and difficulties in passing those increases onto final prices.
Market risk
In the normal course of its operations, Eni is exposed to market risks deriving from fluctuations in commodity prices and changes in the euro versus other currencies exchange rates, particularly the U.S. dollar, and in interest rates. For a description of how the Company manages the Market risk see “Item 18 – Note 28 of the Notes on Consolidated Financial Statements”.
Research and development
For a description of Eni’s research and development operations in 2021, see “Item 4 – Research and development”.
The following table lists the Company’s Board of Directors as at December 31, 2022:
|
Name |
|
Position |
|
Year elected or appointed |
|
Age |
|
Lucia Calvosa |
|
Chairman |
|
2020 |
|
61 |
|
Claudio Descalzi |
|
CEO |
|
2014 |
|
67 |
|
Ada L. De Cesaris |
|
Director |
|
2020 |
|
63 |
|
Filippo Giansante |
|
Director |
|
2020 |
|
55 |
|
Pietro A. Guindani |
|
Director |
|
2014 |
|
64 |
|
Karina A. Litvack |
|
Director |
|
2014 |
|
60 |
|
Emanuele Piccinno |
|
Director |
|
2020 |
|
49 |
|
Nathalie Tocci |
|
Director |
|
2020 |
|
45 |
|
Raphael Louis L. Vermeir |
|
Director |
|
2020 |
|
67 |
In accordance with Article 17.1 of Eni’s By-laws, the Board of Directors is made up of 3 to 9 members.
The current Board of Directors was appointed by the ordinary Shareholders’ Meeting held on May 13, 2020 which also established the number of Directors at nine for a term of three financial years. The Board’s term will therefore expire with the Shareholders’ Meeting called to approve the financial statements for the year ending December 31, 2022.
The Board of Directors is appointed by means of a slate voting system: slates may be presented by the shareholders representing at least 0.5% of the Company’s share capital. According to the Eni By-laws, three out of nine Directors are appointed from among the candidates of the non-controlling shareholders.
Lucia Calvosa, Claudio Descalzi, Ada Lucia De Cesaris, Filippo Giansante, Emanuele Piccinno, and Nathalie Tocci were the candidates of the Ministry of the Economy and Finance. Pietro A. Guindani, Karina A. Litvack and Raphael Louis L. Vermeir were the candidates of institutional investors (non-controlling shareholders). The Shareholders’ Meeting appointed Lucia Calvosa as the Chairman of the Board of Directors and, on May 14, 2020, the Board appointed Claudio Descalzi as the Chief Executive Officer of the Company.
Four Directors out of nine, including the Chairman, were drawn from the less represented gender, reaching the ratio of at least two-fifths of the Directors as provided by Italian law and Eni’s By-laws.
The following provides details on the personal and professional profiles of the Directors.
Lucia Calvosa was born in Rome and has been Chairman of Eni’s Board since May 2020. She has an honours degree in Law from the University of Pisa and is Professor of Commercial Law at the same university. She has been registered with the Pisa Bar since 1987 and works as a lawyer dealing with specialised aspects of corporate or bankruptcy law. She is currently an independent director in the board of CDP Venture Capital Sgr SpA, Chairman of the board of directors of Agi SpA – Eni Group and of the Board of Directors of Fondazione Eni Enrico Mattei (FEEM). She is also a member of the General Council of the Giorgio Cini Foundation. She is Chairman of the Italian Corporate Governance Committee.
Experience
She was Chairman of Cassa di Risparmio of San Miniato SpA and in that capacity she was also member of the Banking Companies committee and Director of the Italian Banking Association (ABI). She served as independent director and Chairman of the Control and Risk Committee of Telecom Italia SpA. She also served as independent director of SEIF SpA, Banca Monte dei Paschi di Siena SpA and Banca Carige SpA. She was a member of the Commission for the National Scientific Qualification for first and second-level university professors in sector 12 / b1 - Commercial Law.
She was a member of the Bankruptcy Procedures and Corporate Crisis Commission of the National Bar Council. She carried out studies and research for several years at the Institut fur ausländisches und internationales Privat- und Wirtschaftsrecht of the University of Heidelberg and has participated with reports and speeches in numerous conferences. In addition to many publications in leading legal journals and collective works, she has published three monographs on corporate and bankruptcy matters and has contributed to leading accredited manuals and commentaries on accounting issues. She has received numerous awards. In 2005, she was awarded the Order of the Cherubino, by the University of Pisa, for her contribution to increasing the University’s standing for its scientific and cultural achievements and for her contribution to the life and operation of the University. In 2010 she was awarded a UNESCO medal for having contributed to developing and disseminating the Italian artistic culture in the spirit of UNESCO. In 2012 she was awarded the honour of Cavaliere dell’Ordine "al merito della Repubblica Italiana". In 2015 she received the "Ambrogio Lorenzetti" award for good corporate governance, for having been able, as a Director, to introduce scientific rigour and the value of independence in highly complex and competitive business environments.
Claudio Descalzi was born in Milan, he has been Eni’s CEO since May 2014. He is a member of the General Council and of the Advisory Board of Confindustria and Director of Fondazione Teatro alla Scala. He is a member of the National Petroleum Council. He is one of the founding CEOs of the Oil and Gas Climate Initiative, and was awarded the Atlantic Council’s Distinguished Business Leadership Award in 2022.
Experience
He joined Eni in 1981 as Oil & Gas field petroleum engineer and then became project manager for the development of North Sea, Libya, Nigeria and Congo. In 1990 he was appointed Head of Reservoir and operating activities for Italy. In 1994, he was appointed Managing Director of Eni’s subsidiary in Congo and in 1998 he became Vice President & Managing Director of Naoc, a subsidiary of Eni in Nigeria. From 2000 to 2001 he held the position of Executive Vice President for Africa, Middle East and China. From 2002 to 2005 he was Executive Vice President for Italy, Africa, Middle East, covering also the role of member of the board of several Eni subsidiaries in the area. In 2005, he was appointed Deputy Chief Operating Officer of the Exploration & Production Division in Eni. From 2006 to 2014 he was President of Assomineraria and from 2008 to 2014 he was Chief Operating Officer in the Exploration & Production Division of Eni. From 2010 to 2014 he held the position of Chairman of Eni UK. In 2012, Claudio Descalzi was the first European in the field of Oil&Gas to receive the prestigious “Charles F. Rand Memorial Gold Medal 2012” award from the Society of Petroleum Engineers and the American Institute of Mining Engineers. He is a Visiting Fellow at The University of Oxford. In 2014 he founded the Oil and Gas Climate Initiative together with other CEOs of major Oil & Gas companies to lead the industry’s response to climate change. In December 2015 he was made a member of the “Global Board of Advisors of the Council on Foreign Relations”. In December 2016 he was awarded an Honorary Degree in Environmental and Territorial Engineering by the Faculty of Engineering of the University of Rome, Tor Vergata. In May 2022 he was awarded by the Atlantic Council with the Distinguished Business Leadership Award for the extraordinary role he has played in the energy sector at an international level, for the technological transformation of the company aimed at complete decarbonisation by 2050 and for his contribution to the new challenge of Italian and European energy security. He graduated in physics in 1979 from the University of Milan.
Ada Lucia De Cesaris was born in Milan in 1959 and has been a Director of Eni since May 2020. She is currently a partner at Studio Legale Amministrativisti Associati (Ammlex), where she advises clients on city planning, energy and environmental issues for private and publicly owned assets; supports investors and developers in proceedings with public authorities; engages in consulting, training and support activities on matters relating to energy sustainability and the management of environmental critical issues. In 1986 she contributed to research on the problems of energy governance, within the “Finalised Energy Programme”. Since 2000 she has been a member of the Scientific Committee of the Rivista Giuridica dell’Ambiente. Since February 2016 she has been a member of the Research Institute on Public Administration (IRPA). Since May 2020 she has been a member of the Advisory Committee of the Back2Bonis Fund.
Experience
From 1985 to 1988 she worked with Massimo Annesi, vice president of Associazione per lo Sviluppo del Mezzogiorno (Southern Development Association), on a comprehensive survey of all legislation concerning Southern Italy from 1970; she participated in the realization of the project Rivista Giuridica del Mezzogiorno, published by il Mulino, heading the editorial support staff. She also worked with the Rivista Giuridica dell’Ambiente (Legal Journal of the Environment). From 1989 to 2003, on behalf of CIRIEC, she carried out a research on environment protection legislation in Japan. From 2000 to 2011 as an independent consultant, she coordinated research activities of the legal department of the Environmental Insitute (Istituto per l’Ambiente). She participated in research activities for the Lombardy Foundation for the Environment, in particular regarding waste, air and accident risks. She produced studies and papers on environmental impact assessment both with regard to waste and activities at risk. She was a Professor of Environmental Law at the Faculty of Environmental Sciences at the University of Insubria. From 2011 to 2015 she was deputy mayor of the Municipality of Milan and Councillor with responsibility for town planning, private construction and agriculture. From 2015 to 2017 she was partner at the law firm Studio NCTM. From 2016 to 2019 she was member of the Board of Directors of Arexpo SpA. From December 2019 to March 2022 she was member of the Board of Directors of CDP Immobiliare S.r.l. She has authored numerous publications on the environment, energy and waste management. She graduated with honours in Law and received a scholarship and pursued an advanced course in “Economic development” with UNIONCAMERE.
Filippo Giansante was born in Avezzano (AQ) in 1967 and has been a Director of Eni since May 2020. He is currently Manager of the Italian Ministry of Economy and Finance. From May 2022 he is Chairman of the Board of Directors of SACE SpA.
Experience
From 1994 to 1996 he was Treasury Department Officer in International Affairs. In 1997 he was assistant to the Executive Director of the European Bank for Reconstruction and Investment; he was Director - International Financial Relations, Department of the Treasury, where he dealt with issues relating to the debt of developing countries as well as bilateral financial relations (2002 - 2011). With the same role he coordinated the G7/G8/G20, and supervised institutional relations with the International Monetary Fund (2011-2017). He was a Director of Simest SpA (2003-2005) and SACE SpA (2004-2007 and 2020-2022). He was Alternate Governor for Italy for the World Bank, the Asian Development Bank, the African Development Bank, the European Bank for Reconstruction and Development and the Caribbean Development Bank, as well as being a Board Member for Italy at the European Investment Bank (2015-2017). He was a member of the Administrative Council for Italy at the Council of Europe Development Bank (2016-2017). Furthermore, he was Executive Director for Italy of the European Bank for Reconstruction and Development. He graduated with honours in Political Science from the Sapienza University of Rome.
Pietro A. Guindani was born in Milan in 1958 and has been Director of Eni since May 2014. Since July 2008 he has been Chairman of the Board of Directors of Vodafone Italia SpA, where between 1995-2008 he was Chief Financial Officer and subsequently Chief Executive Officer. He previously held positions in the Finance Departments of Montedison and Olivetti and started his career in Citibank after graduating in Business at the Università Luigi Bocconi in Milan. He is currently also a Board Member of Inwit S.p.A.. He is a Member of the Executive Board of Assonime, Board Member of Confindustria, Member of the Executive Board of Assolombarda and Board Member of Asstel-Assotelecomunicazioni as Past President.
Experience
He was also Director of Société Française du Radiotéléphone – SFR S.A. (2008-2011), Pirelli & C. SpA (2011-2014), Carraro SpA (2009-2012), Sorin SpA (2009-2012), Finecobank SpA (2014-2017), Salini- Impregilo SpA (2012-2018), Cefriel-Polytechnic of Milan (2015-2021) and the Italian Institute of Technology (2014-2022).
Karina A. Litvack was born in Montreal in 1962 and she has been a Director in Eni since May 2014. She is currently Chairman of the Governing Board of the Climate Governance Initiative, and a member of the Senior Advisory Panel of Critical Resource and of the International Advisory Council of Transparency International.
Experience
From 1986 to 1988 she was a member of the Corporate Finance team of PaineWebber Incorporated. From 1991 to 1993 she was a Project Manager of the New York City Economic Development Corporation. In 1998 she joined F&C Asset Management plc where she held the position of Analyst Ethical Research, Director Ethical Research and Director Head of Governance and Sustainable Investments (2001-2012). She was also a member of the Board of the Extractive Industries Transparency Initiative (2003-2009) and of the Primary Markets Group of the London Stock Exchange Primary Markets Group (2006-2012). From 2003 to 2014 she was a member of the CEO Sustainability Advisory Panel of Lafarge SA; from January 2008 to December 2010 she was a member of the CEO Sustainability Advisory Panel of Veolia SA; from January to December 2010 she was a member of the CEO Sustainability Advisory Panel of ExxonMobil and Ipieca; from January 2010 to November 2017 she was a member of the CEO Sustainability Advisory Panel in SAP AG. From January 2015 to May 2019 she was a member of the Board of Yachad and from November 2014 to June 2021 she was a member of the Board of Business for Social Responsibility. From June 2019 to May 2021 she was executive member of the Board of Chapter Zero Limited, from June 2011 to December 2021 she was a member of the Advisory Council for Transparency International UK and, from July 2020 to February 2022 she was non-Executive Chairman of the Board Sustainability Committee of Viridor Waste Management Ltd. From May 2019 to September 2022, she was member of the Board of Governors of the CFA Institute. She graduated in Political Economy at the University of Toronto and in Finance and International Business from Columbia University Graduate School of Business.
Emanuele Piccinno was born in Rome in 1973 and has been a Director of Eni since May 2020. Expert in the sustainability of energy systems, he has carried out consulting and training activities in the energy and environmental field since 2003. From July 2022 , he is a member of the Steering Committee of the National Association of the Gas Industry (PROXIGAS).
Experience
Member of the Italian Chapter of the International Solar Energy Society, a non-profit association for the promotion of the use of Renewable Energy Sources from 2004 to 2008, and of the Research Unit “Innovation, Energy and Sustainability” in the Interuniversity Research Centre for Sustainable Development, Sapienza University of Rome from 2004 to 2013. He was also technical director of E-cube Srl, an energy and environmental services company in Rome from 2009 to 2013. From 2011 to 2013 he was Professor at the Università della Tuscia in Viterbo; from 2013 to 2017 he was a consultant - senior researcher at the University Consortium of Industrial and Managerial Economics (CUEIM) in Rome. He also served as a legislative consultant for energy and transport to the Chamber of Deputies during the 17th Legislature. From July 2018 to September 2019 he was head of the support staff of the Undersecretary of State for Energy at the Ministry for Economic Development; from October 2019 to May 2020 he was Councillor for Energy Issues at the Ministry for Economic Development. From September 2021 until July 2022, he was a member of the Executive Board of the National Association of the Gas Industry (ANIGAS). He graduated in Economics and Trade from the “Sapienza” University of Rome. He also obtained a PhD in “Sustainable development and international cooperation - energy and environmental technologies for development” from the same university, as well as having followed an advanced training course in “Environmental certification in the European Union”.
Nathalie Tocci was born in Rome in 1977 and has been a Director of Eni since May 2020. Since 2017 she has been Director of the Istituto Affari Internazionali. Since 2015 she has been Honorary Professor of the University of Tübingen. Since 2022 she is fellow at the Institut für die Wissenschaften vom Menschen, in Vienna. Since 2023 she is Professor of the Transnational School of Government of the European University Institute, in Florence. She is a member of the Board of the “European Policy Center”, the “Centre for European Reform”, the “Jacques Delors Centre”, the “Real Instituto Elcano” and the “Nuclear Threat Initiative”; a member of the scientific committee of the Fondation pour la Recherche Stratégique, the European Leadership Network; a member of the Advisory Board of Europe for Middle East Peace (EuMEP) and of European Council for Foreign Relations. She isa member of the advisory editorial board of the reviews Open Security/Open Democracy, International Politics, The Europe-Asia Journal, The Cyprus Review; a member of the Advisory Board of Mediterranean Politics and of The International Spectator.
Experience
From 1999 to 2003 she was Research Fellow within the Wider Europe Programme of the Centre for European Policy Studies in Brussels. From 2003 to 2007 she was Jean Monnet Fellow and Marie Curie Fellow at the European University Institute. In 2005 she was Analyst for Cyprus at the International Crisis Group. From 2006 to 2010 she was Research Manager at the Istituto Affari Internazionali in Rome. From 2007 to 2009 she was an Associate Fellow for EU foreign policy at the Centre for European Policy Studies in Brussels. From 2009 to 2010 she was Senior Fellow for Turkey’s relations with the United States, the European Union and the Middle East at the Transatlantic Academy in Washington. From 2012 to 2014 she was member of the Board of Directors of the University of Trento. In 2014 she was Councillor for international strategies of the Minister of Foreign Affairs, Federica Mogherini (June-November 2014). From 2013 to 2020 she was member of the Board of Directors of Edison SpA. In 2014 she was member of the NATO Transatlantic Bond Experts Group. She was Special Advisor to the High Representative of the European Union for Foreign and Security Policy and Vice President of the European Commission, Federica Mogherini (from 2015 to 2019), on whose behalf she drafted the EU’s global strategy and worked on its implementation; and Joseph Borrell (from 2020 to February 2022). In 2021 she was Pierre Keller visiting Professor of the Harvard Kennedy School. She writes editorials for “Politico” and “La Stampa” magazines, frequently contributes to editorials, comments and interviews with various media, including the BBC, CNN, Euronews, Sky, Rai, New York Times, Financial Times, Wall Street Journal, Washington Post and El Pais. She has received several awards from the European Commission and university institutes, besides obtaining various scholarships, including the University College of London scholarship for academic excellence. She graduated with honours from University College, Oxford in Politics, Philosophy and Economics.
Raphael Louis L. Vermeir was born in Merchtem (Belgium) in 1955 and has been a Director of Eni since May 2020. From April 2021 he is Lead Independent Director. He is currently an independent advisor for the mining and oil industry. He serves as Trustee of the Classical Opera Company in London, as well as board member of Malteser International. He is Fellow of the Energy Institute and the Royal Institute of Naval Architects.
Experience
He joined ConocoPhillips in 1979, initially working in marine transportation and production engineering services in Houston, Texas. He then handled upstream acquisitions in Europe and Africa and managed Conoco's exploration activities in continental Europe from the Paris headquarters. In 1991 Vermeir moved to London to lead the business development activities for refining and marketing in Europe. In 1996 he became managing director of Turcas in Istanbul (Turkey). He returned to London in 1999 to lead strategic initiatives in Russia and to complete major acquisition deals in the North Sea. He also headed an integration team during the Conoco-Phillips merger. In 2007 he became head of external affairs Europe and in 2011 was appointed as president of operations in Nigeria. Subsequently and until 2015, Vermeir was Vice President of Government Affairs International for ConocoPhillips. Raphael Vermeir was a member of the Board of Directors of Oil Spill Response Ltd and until 2011 was Chairman of the International Association of Oil and Gas Producers for four years in a row. Since 2016 and until April 2021 was Senior Advisor for Energy Intelligence and Strategia Worldwide. From 2016 and until 2021 he was Chairman of IP week. Since 2016 until 2022 he was Senior Advisor for AngloAmerican. He served as Trustee of St Andrews Prize for the Environment. A Belgian national, he graduated in Electrical and Mechanical Engineering from the Ecole Polytechnique in Brussels. He holds Masters of Science degrees in engineering and management from the Massachusetts Institute of Technology.
Senior Management
The table below sets forth the composition of Eni’s Senior Management as at December 31, 2022. It includes the CEO, as General Manager of Eni SpA, as well as the Chief Operating Officers and the executives who report directly to the CEO and to the Board, and on its behalf, to the Chairman.
|
Name |
Management position |
Year first appointed to current position |
Total number of years of service at Eni |
Age |
||||
|
Claudio Descalzi |
CEO and General Manager of Eni |
2014 |
41 |
67 |
||||
|
Guido Brusco |
Natural Resources Chief Operating Officer |
2022 |
25 |
52 |
||||
|
Francesco Gattei |
Chief Financial Officer |
2020 |
27 |
53 |
||||
|
Giuseppe Ricci |
Energy Evolutions Chief Operating Officer |
2021 |
37 |
64 |
||||
|
Gianfranco Cariola |
Internal Audit Director |
2021 |
11 |
54 |
||||
|
Grazia Fimiani |
Integrated Risk Management Director |
2021 |
26 |
52 |
||||
|
Luca Franceschini |
Integrated Compliance Director and Board Secretary and Board Counsel |
2016 |
31 |
56 |
||||
|
Claudio Granata |
Human Capital & Procurement Coordination Director |
2020 |
39 |
62 |
||||
|
Erika Mandraffino |
External Communication Director |
2020 |
16 |
50 |
||||
|
Lapo Pistelli |
Public Affairs Director |
2020 |
7 |
58 |
||||
|
Stefano Speroni |
Legal Affairs & Commercial Negotiation Director |
2020 |
4 |
60 |
||||
|
Roberto Ulissi |
Corporate Affairs and Governance Director |
2006 |
16 |
60 |
||||
|
Francesca Zarri |
Technology, R&D & Digital Director |
2020 |
26 |
53 |
||||
The Chief Operating Officer Natural Resources, the Chief Operating Officer Energy Evolution, the Chief Financial Officer, the Director Legal Affairs and Commercial Negotiations, the Director Corporate Affairs and Governance, the Director Integrated Compliance, the Director External Communication, the Director Human Capital & Procurement Coordination, the Director Internal Audit, the Director Public Affairs, the Director Integrated Risk Management, the Director Technology, R&D & Digital, the Deputies of the Chief Operating Officers, the Director Upstream, the Director of Exploration, the Director Refining Evolution and Transformation, the Director Sustainable Mobility23, the Director CCUS, Forestry & Agro-Feedstock, the Director Power Generation & Marketing, the Head of Accounting and Financial Statements and the Head of Planning, Control and Insurance are members of the Management Committee 24, which provides advice and support to the Chief Executive Officer. Other managers may be invited to attend meetings based on the agenda. The Chairman of the Board is invited to attend meetings. The duties of the Committee Secretary are performed by the Director Corporate Affairs and Governance.
As of August 1, 2020, the Head of the Accounting and Financial Statements has been appointed by the Board of Directors as the Officer in charge of preparing Company’s financial reports pursuant to Italian law, replacing the CFO, acting upon a proposal of the CEO in agreement with the Chairman, following consultation with the Nomination Committee and with the approval of the Board of Statutory Auditors.
The Internal Audit Director is appointed by the Board of Directors, acting upon a proposal of the Chairman in agreement with the Chief Executive Officer (as Director in charge of the internal control and risk management system).
The Board of Directors decides with the support of the Control and Risks Committee and the Nomination Committee, after having heard the Board of Statutory Auditors. The Board Secretary and Board Counsel is appointed by the Board of Directors upon a proposal of the Chairman.
Other members of Eni’s senior management are appointed by Eni’s CEO and may be removed without cause.
23 Until December 31, 2022.
24 The Committee includes also the Chairman of the Board and the CEOs of certain Eni’s subsidiaries.
Senior Managers
Guido Brusco was born in Maratea (Potenza) in 1970. He was appointed Chief Operating Officer Natural Resources of Eni on February 7th, 2022. Experience After graduating with Honors in Mechanical Engineering at the University of Roma “La Sapienza”, he joined Eni in 1997. He began his career in the technical areas of the Exploration & Production business, holding positions of growing responsibility, in Italy and abroad, up to the role of Operations Director in Egypt in 2005 and then in Kazakhstan in 2009. He took up the role of Managing Director in Kazakhstan in 2013 and subsequently in Angola in 2015. In 2018 he was appointed Executive Vice President for Sub-Saharan Africa Region and in 2020 Director of Upstream.
Francesco Gattei was born in Bologna in February 1969. He was appointed Chief Financial Officer in Eni on August 1, 2020. He joined Agip S.p.A. in 1995 and participated in major negotiation processes in Central Asia and Russia, firstly as Business Analyst and subsequently as Negotiator. From 2001 to 2005 he was Head of Negotiations & Commercial Planning in Libya activities during the start-up and then the construction phases of the Western Libyan Gas Project. From 2006 to 2008, he returned to Eni’s headquarters to become Head of Business Planning and Development activities for Africa, Europe, Asia and America during a period of major business growth, supporting the E&P Division’s Deputy General Director. In 2009, he was appointed Head of Upstream M&A, contributing to the rationalization of the portfolio, particularly in the UK and United States. In 2011, he became Senior Vice President of Market Scenarios and Strategic Options in Eni SpA, where he was also appointed Secretary of the Scenario and Sustainability Committee, a post he held until 2019. In 2014, he was appointed Head of Investor Relations and also acted as Secretary to Eni’s Advisory Board from 2016 to 2019. In 2019, he moved to Houston to become Upstream Director of the Americas, managing the E&P business in the United States, Mexico, Venezuela and Argentina. He was a member of the Board of Directors of Saipem from 2014 to 2015. He graduated in Economics and Commerce at the University of Bologna with a thesis on the oil market. He obtained the MEDEA (Master in Energy and Environmental Management) Master’s from the Scuola Mattei in 1994.
Giuseppe Ricci was born in Casale Monferrato in 1958. He was appointed Chief Operating Officer of Energy Evolution on January 1, 2021. He joined Eni in 1985 initially working in the study and development of new refining processes at the Sannazzaro refinery, before becoming involved in the creation and consolidation of the joint venture with Kuwait Petroleum at the Milazzo refinery. In 2000 he returned to head office as where he was responsible for Refining Processes Development and oversaw the performance optimisation at the refining facilities of Agip Petroli. He left central technologies to take over, in 2004, as director of the Gela Refinery, a particularly challenging assignment both from a managerial perspective and in terms of the refining cycle and the complexity of the plant; in 2006 he was appointed managing director of the refinery. In June 2010 he was made Senior Vice President of the Industrial Sector for Refining & Marketing, with responsibility for the refineries, storage deposits, oil pipelines and plant and facilities in Italy, as well as the management of subsidiary and associated companies in Italy and abroad. As Industrial Director he also held a series of additional responsibilities, such as the chairmanship of Gela and Milazzo. In 2012 he took on the delicate role of Eni’s Executive Vice President Health, Safety Environment and Quality with responsibility for providing the guidelines, coordination and control of safety, industrial health, product safety, the environment and quality. He was appointed as Chief Refining & Marketing Officer on 12 September 2016. He was appointed Deputy Chief Operating Officer of Energy Evolution and Director Green/Traditional Refinery and Marketing of Eni on July 1, 2020. He has been President of Confindustria Energia since July 2017 and President of AIDIC (Italian Association of chemical Engineering) since 2018. He has a degree in chemical engineering.
Gianfranco Cariola was born in Cosenza in 1968, he was appointed as Director Internal Audit at Eni on 1st April 2021. He is currently member of the FAO Oversight Advisory Committee (the United Nations Food and Agriculture Organization). Between 1993 and 1999, he served as Officer at Guardia di Finanza (Italian Tax Police) General Command. Afterwards, he joined KPMG-KLegal, where he took on the role of Ordinary Member working for a number of major multinational groups in the field of risk management, compliance programs and internal control systems. In 2001 he was seconded to KPMG LLP in Washington DC where he specializes in the structuring of compliance programs and anti-corruption models. In 2003, he moved to the Internal Audit Department of Eni spa where he initially worked on Eni’s Group compliance 231 models; then, he was appointed as Senior Audit Vice President and Head of Planning, Methodologies and Eni’s Internal Control System. From 2013 to 2016, he was the Group Chief Audit Executive and Head of Anti-Corruption and Transparency at RAI spa. Between 2016 and November 2019, he joined Ferrovie dello Stato Italiane spa (FS spa) as Group Chief Audit Executive. On December 2019 he was appointed as Chief Audit Executive at TIM spa. He graduated in Economics, qualified as Italian Certified Public Accountant, in 2008, he completed an Executive MBA in General Management at the SDA Bocconi School of Management and the Polytechnic University of Milan. In 2017 he obtained a second degree, in Economic and Financial Security Sciences.
Grazia Fimiani was born in Salerno in 1970, she was appointed Director Integrated Risk Management of Eni on January 1, 2021. Having graduated with honours in Economics and Commerce from Sapienza University in Rome, she joined Eni in 1996, following a brief experience in the financial sector. At Eni, she began her professional career in the Human Resources department, by gaining transversal experience on the processes of Organizational Management, HR Planning and Development. She then went on to management roles in International Business, in particular in the Gas & Power sector, acquiring increasing responsibilities until she took on the role of HR Business Partner in the Gas & Power division. During this period, she coordinated and managed aspects of Human Resources related to business development projects, with particular reference to the integration of entities/companies subject to acquisition at European level and to the re-engineering of business processes, required by the growing exposure of the sector to the dynamics of market. In 2014 she was appointed the Head of Human Resources and Organization of Eni reporting to the Chief Services & Stakeholder Relations Officer and, from July 2020, as the Human Capital & Procurement Coordination Director. In this role she coordinated central functions of the Organization Management, HR Development, Industrial Relations and all the activities related to HR Business Partner in several Eni Business areas (Natural Resources, Energy Evolution, Support Functions), as well as the Excellence Centers focused on Recruitment and Training (Eni International Resources and Eni Corporate University).From 2016 to June 2021 she was a standing member, representing Eni in the Executive Committee of Valore D. She participated in sessions of ‘In The Boardroom 4.0 – Eighth Class’ executive training program for Board members. In October 2022, as Eni representative, she was appointed Council Member of World Business Council for Sustainable Development.
Luca Franceschini was born in Milan in 1966, from 1 July 2020 he is Head of Integrated Compliance and, from 1 January 2021, also Secretary of the Board of Directors. He is lawyer registered with the Italian Bar Association in Rome. After graduating in Law from the University of Milan, he first joined Eni in 1991 in the legal department of the then Agip S.p.A., providing legal assistance, initially, in commercial litigation and procurement area, and, subsequently, in a wide range of national and international projects in the Exploration & Production sector. In 2000, during the process for the liberalization of the natural gas sector, he was involved in the spin-off of the gas storage business and in the establishment and operational start of Stogit SpA, for which he became head of Legal and Corporate Affairs. He made his return to Eni Spa in 2005 as head of Italian Legal Assistance in the Gas & Power division. Following the concentration of all legal functions in Eni’s central Legal Department, he takes on positions of increasing responsibility, becoming, in 2009, head of legal assistance for Italian Business and Antitrust and in 2015, head of Legal and Regulatory Compliance. After the separation of the compliance function from the Legal Affairs department, in 2016 he became head of the new Integrated Compliance department. In 2017 he was awarded “Compliance Officer of the Year” by the Top Legal Corporate Counsel Awards and the Inhouse Community Awards. He is a member of the Scientific Committee of the Advanced Training Course for Corporate Counsel of the Luiss Business School. He was also member of the boards of directors of Italgas and Stogit.
Claudio Granata was born in Rome in 1960. He was appointed Director Human Capital & Procurement Coordination in Eni on July 1, 2020. He has been Chairman of the board of Eni Corporate University since November 2014. He has also been member of the Board of Directors of AGI since September 2020 and member of the Board of Directors of FEEM He started working in Eni in 1983 and from 1983 to 1994 worked as a labour market and social welfare expert with ASAP (the trade union association for Eni Companies). From 1994 to 1999 he continued his experience with Eni Corporate as an expert in industrial relations. In 2000 he was made responsible for Staff and Organisation within Eni Servizi Amministrativi, a company that was set up to centralise Eni’s administrative activities. In 2001 he took over the management of Eni’s territorial divisions, restructuring the management of staff by geographical area and in 2003 he took on the role of Business HR for Eni Corporate, ensuring support for departments in the management and development of Eni Corporate’s managerial resources during a period of profound change (2002-2004), which was characterised by the mergers of Snam and AgipPetroli and the restructuring of staff organisation. In the same year he was also appointed head of Human Resources and Organisation of SOFID (Eni’s financial services company). In 2006 he was appointed Human Resources Director of the E&P Division, where he oversaw the planning, management, development and compensation processes for human resources and organization activities. He also collaborated with the top management in the reorganisation of macro processes for the division and promoted change management initiatives. He became a board member of Eni International Resources Ltd in 2006 and was Chairman of the board of Eni International Resources Ltd from 2012 to 2013. From 2012 to March 2015 he was a board member of Eni UK Ltd. In 2013 he was appointed Executive Vice President Sustainable Development, Safety, Environment and Quality at E&P, responsible for overseeing safety, environment and quality processes to promote integration with operational processes and contribute to improvements in “time to market” and efficiency. He has been Chief Services & Stakeholder Relations Officer in Eni since July 1, 2014. Until May 2016, he was a member of the Board of Directors of the Eni Foundation. He graduated in Economics.
Erika Mandraffino was born in Syracuse in 1972. She was appointed Director External Communication of Eni on November 1, 2020. After graduating in European Business Administration in London, where she lived almost uninterruptedly from 1991 to 2005, she began her career as a corporate and financial communications consultant at Ludgate Communications where she worked from 1996 to 1999. Before joining Eni in 2006 as head of the financial and international press office, to then become head of Eni Group media relations in 2011, she worked as Director at the Brunswick Group in London, managing the international communication of European corporates (in Italy, Spain, Holland, Portugal) during crisis situations, mergers, acquisitions and IPOs. From 2000 to 2001 she worked as a communication consultant at Barabino & Partners in Rome. From October 2013 to February 2015 she was Saipem’s Senior Vice President of Institutional Relations and Communication, where she built the external relations department reporting directly to the CEO and managed the company’s communication in a period of crisis. In 2015 she was called back to Eni as Senior Vice President Media Relations and Corporate Publishing, a position held until April 2016 when she took on the role of Senior Vice President Media Relations and Social Networks. In 2018 she became Senior Vice President Global Media Relations and Crisis Communications. From July 1, 2020 she was Eni’s Director Media Relation reporting directly to the CEO until she assumed the current role. She has also been Chairman of Versalis S.p.A from May 2018 until January 2021.
Lapo Pistelli was born in Florence in 1964. He was appointed Director Public Affairs of Eni on July 1, 2020. Graduated with honors in 1988 in International Law at the Political Science faculty “Cesare Alfieri” at the University of Florence, he started working at a research center, while serving for two mandates in the local administration of Florence. He was member of the Italian Parliament from 1996 to 2015 (1996/2004 and 2008/2015), and also member of the European Parliament (2004/2008). He served as Deputy Minister of Foreign Affairs and International Cooperation of Italy from 2013 to 2015. He resigned from all his institutional and political roles in July 2015, when he entered Eni. He taught and lectured at the University of Florence, the Overseas Studies Program of Stanford University and many others international academic institutions. He regularly contributed to many European and American think tanks and research centers specialized in international relations. He is member of the board of the European Council on Foreign Relations (ECFR) and of the Istituto Affari Internazionali (IAI), and member of the WE – World of Energy editorial committee. He also collaborates with Limes and Aspenia magazines. He’s Chairman of OME (Observatoire Mediterranéen de l’Energie).
Stefano Speroni was born in Milano in 1962. He was appointed Director Legal Affairs and Commercial Negotiations of Eni on July 1, 2020. He has accumulated vast experience in over 30 years of professional activity in the field of corporate affairs, mergers and acquisitions, private equity operations and capital markets. He has given professional support to Italian and International listed companies (in a wide range of sectors including aerospace and defence, oil & gas, telecommunications, transport and infrastructure) in strategic corporate affairs, in share trading, joint ventures and commercial agreements. From January 2016 to December 2018, he was a Managing Partner for Corporate M&A in Dentons’ Italian practice. He joined Eni in January 2019 and he was appointed Senior Executive Vice President of Legal Affairs. In 2012, he was one of the founders of the Grimaldi Legal Studio, after having previously been managing partner of Dewey Ballantine’s Rome practice which involved managing its Italian activities for around 10 years. He was also a partner in Studio Gianni, Origoni, Grippo Capelli & Partners (2001 – 2003), in the Simmons and Simmons Italian practice (1991 – 2001), and manager of the European Corporate Department and member of the World-wide Remuneration Committee. He is a member of the scientific committee and contributor to SDA Bocconi’s Private Equity Laboratory and was awarded “Best Lawyer of the Year” 2018 by the Best Lawyers international directory. He graduated in Law at Università degli Studi in Milan and is a registered member of the Italian Bar Association in Milan.
Roberto Ulissi was born in Rome in 1962 and is a lawyer. He was appointed Director Corporate Affairs and Governance in Eni on July 1, 2020 after serving as Senior Executive Vice President of Corporate Affairs and Governance since 2006. He was Board Secretary of Eni and Corporate Governance Counsel and Company Secretary and a Board Member of Eni International BV from 2006 until December 2020. He is a Board member and Vice Chairman of Banor SIM. From 2018 to 2021 he was the Coordinator of the Corporate Governance Forum of Company Secretaries. After a number of years spent as a lawyer at the Bank of Italy, in 1998 he was appointed General Manager at the Ministry of the Economy and Finance head of the Banking and Financial System and Legal Affairs Department. He was a Board member of Telecom Italia (and Chairman of the Audit Committee), Ferrovie dello Stato, Alitalia, Fincantieri and a government representative on the Governing Council of the Bank of Italy. He was also a member of numerous Italian and European committees representing the Ministry of the Economy including, at a national level, the Commission for the Reform of Corporate Law (Commission “Vietti”) and, at EU level, the Financial Services Policy Group, the Banking Advisory Committee, the European Banking Committee, the European Securities Committee and the Financial Services Committee. He was also special professor of banking law at the University of Cassino. He is Grande Ufficiale della Repubblica Italiana.
Francesca Zarri was born on June 22, 1969 in Bologna, she was appointed Director of Technology, R&D & Digital of Eni on July 1, 2020. In 1997, she joined Agip S.p.A to work in the Reservoir Department as reservoir modeler and petroleum engineer and in 2000, she worked on Eni operated assets in Scotland (North Sea). In 2004, after moving to the Engineering and Projects Department, she became the head of the Adriatic Off-shore Projects department, based in Ravenna District. In 2006, she was back to work on in-field production monitoring and optimization as the Head of the Production Optimization Technology Department, which at that time, also included most of the Eni’s Laboratories in Bolgiano. From 2007 to 2010, she worked for West Africa as Project and Development Director of Eni Congo, completing new and demanding project activities in the country (oil, gas and power). In 2011, she further expanded her experience by diversifying in the procurement function where she became the Head of American Region then the Head of Procurement Services, as well as the Professional Family. During the same period she was Eni’s representative for Commercial Committee in the South Stream Project. In 2013, she was back to follow the development of upstream projects as the Vice President for West Africa Projects Monitoring and Technical Coordination and later in Eni Congo as Development Projects Director, where she also became the President of Enrico Mattei School in Pointe Noire. In 2017, she was called to join the role of Head of the Italian Southern District until november 2019, when she was appointed as Senior Vice President Italian Activites Coordination. Since April 2020, she is the President of Eniservizi, the President and CEO of SPI and the Eni representative in Assomineraria. Since 2014, she has been the member of boards of directors of several Eni subsidiaries in Italy and abroad. She earned MS degree in Mining Engineering (100/100) from the University of Bologna; she also attended, in 1995, the Eni Master MEDEA (Master in Energy and Environmental Management) with Economics specialization.
The information concerning compensation is provided in the Remuneration Report prepared in accordance to Italian listing standards, which is incorporated herein by reference. See the Exhibit 15. a (i).
As of December 31, 2022, the total amount accrued to the reserve for employee termination indemnities with respect to Chief Executive Officer, Chief Operating Officers, and other Managers with strategic responsibilities (with reference to the employed ones in service, who, during the course of the 2022 period, filled said roles, even if only for a fraction of the year), was €1,304 thousand.
| Name | (€ thousand) | |||
| Descalzi Claudio | Chief Executive Officer | 421 | ||
| Brusco Guido | Chief Operating Officer Natural Resources | 6 | ||
| Ricci Giuseppe | Chief Operating Officer Energy Evolution | 88 | ||
| Senior managers(a) | 789 | |||
|
|
1,304 | |||
| (a) No. 23 managers. |
Corporate Governance
The Corporate Governance structure of Eni follows the Italian traditional management and control model, whereby corporate management is the responsibility of the Board of Directors, which is the core of the organizational system, while supervisory functions are allocated to the Board of Statutory Auditors. The Company’s accounts are independently audited by an accredited Audit Firm appointed by the Shareholders’ Meeting. On December 23, 2020 Eni adopted the Corporate Governance Code approved by the Italian Corporate Governance Committee on January 2020 (hereinafter “Code”), effective from January 1, 2021.
The names of Eni’s Directors, their positions, the year in which each of them was initially appointed as a Director and their ages are reported in the relevant table above.
Board of Directors’ duties and responsibilities
The Board of Directors has the fullest powers for the ordinary and extraordinary management of the Company in relation to its purpose. In a resolution dated May 14, 2020, the Board, while exclusively reserving to itself the most important strategic, operational and organizational powers, in addition to those that cannot be delegated by law, appointed Claudio Descalzi as CEO and General Manager, entrusting him with the fullest powers for the ordinary and extraordinary management of the Company, with the exception of those powers that cannot be delegated under current law and those retained by the Board.
In the same resolutions, the Board of Directors resolved to confer to the Chairman a major role in internal controls and non-operational functions. In particular, with reference to Internal Audit, the Board of Directors resolved that, in accordance with the Corporate Governance Code in force at that time, the Head of the Internal Audit Department reports to the Board, and on its behalf, to the Chairman, without prejudice to its functional reporting to the Control and Risk Committee and the Chief Executive Officer, as the director in charge of the internal control and risk management system. The Chairman is also involved in the appointment of the primary Eni officers in charge of internal controls and risk management, as well as in approving internal rules governing the Internal Audit process. In addition, the Chairman carries out her statutory functions as legal representative, managing institutional relationships in Italy, together with the Chief Executive Officer.
On the same date (May 14, 2020), the Board of Directors appointed the Secretary of the Board of Directors and entrusted him with the role of Corporate Governance Counsel.
Finally, on December 23, 2020 (effective from January 1, 2021), the Board appointed a new Secretary of the Board of Directors and Board Counsel, who reports hierarchically and functionally to the Board and, on its behalf, to the Chairman. He provides assistance and independent (from the management) legal advice to the Board and the Directors.
With resolution dated January 26, 2023 the Board of Directors updated the specific responsibilities reserved to itself, which are fully reported below. Accordingly, the Board, in addition to powers that may not be delegated by law and by By-laws, has the following exclusive powers:
25 The information contained in this chapter is updated to December 31, 2021 and for specific aspects, expressly indicated, up to the date of approval of this Report.
the Board:
•defines the system and rules of corporate governance for the Company, evaluating and promoting, where necessary, the appropriate amendments, submitting the same, when appropriate, to the Shareholders' meeting. Defines the structure of the group it leads. Approves the Report on corporate governance and ownership, with the support of the Control and Risk Committee with regard to the internal control and risk management system. Approves, having received the opinion of the Control and Risk Committee, the guidelines for the internal regulatory system and the policies on Ethics, Compliance & Governance. Having received the favourable opinion of the Control and Risk Committee, adopts rules ensuring the transparency and the substantive and procedural fairness of transactions with related parties and those in which a Director or a Statutory Auditor holds a personal interest or an interest on behalf of third parties, assessing on an annual basis whether any revision is needed. Upon proposal of the Chairwoman, in consultation with the CEO, it also adopts a procedure for the internal handling and the disclosure of Company documents and information, with particular reference to inside information.
•Defines its operational rules and procedures, including the procedures for providing information to directors. Establishes the Board’s internal Committees, with preliminary, propositional and consultative functions, defines their composition appointing and revoking their members and Chairmen, favouring the competence and experience of their members and avoiding an excessive concentration of offices. Determines their duties, and also upon proposal of the Remuneration Committee and following consultation with the Board of Statutory Auditors, the compensation of the relevant members; acting upon proposal of the same committees, approves their rules of procedures and annual budgets. Moreover, establishes in the rules of procedure of the committees the terms and conditions on which committees can use external consultants.
•Upon their appointment and on annual basis, as well as at the occurrence of relevant circumstances, based on the information provided by the interested party or available to the Company and following the preliminary investigation of the Nomination Committee, assesses the independence and integrity of its members, as well as the non-existence of reasons for ineligibility and incompatibility. Defines ex ante the quantitative and qualitative criteria for assessing the significance of commercial, financial or professional relations, as well as of any remuneration other than the fixed remuneration that may compromise or appear to compromise independence. Carries out the assessments vested in it by law in relation to the requirements applicable to Statutory Auditors. Acting upon a proposal of the Nomination Committee, it expresses its policy on the maximum number of director or statutory auditor positions that can be held by its members in any other listed company, whether Italian or foreign, or in financial, banking or insurance companies or in companies of significant size that are compatible with the effective performance of their role as director, taking into account the time commitment required by the role, and periodically verifies their compliance, at least on an annual basis. Every year, carries out an assessment on the specific functioning of the Board itself and of its committees, as well as on their size and composition, using an external independent consultant, appointed upon proposal of the Nomination Committee, also considering the role it has played in defining strategies and monitoring management and the adequacy of the internal control and risk management system. The Chairwoman ensures, with the help of the Board Secretary, the adequacy and transparency of the self-assessment process of the administrative body, with the support of the Nomination Committee. The Nomination Committee upon request of the Board, provides assistance in the self-assessment activities of the Board and its Committees. Taking into account the outcomes of such assessment, with the support of the Nomination Committee, the Board defines the optimal composition of the Board itself and of its committees, issuing its advice for shareholders on the size and composition of the new Board before its appointment. With the assistance of the Nomination Committee, identifies candidates for the office of Director in case of co-optation and, where possible and appropriate, prepares and submits its own slate for the renewal of the body. Requires to whoever submits a slate with a number of candidates that is higher than half the number of members to be elected to provide adequate information, in the documentation presented for filing the slate, on the compliance of the slate with the advice expressed by the Board, and also with reference to diversity criteria envisaged by the law and by the Corporate Governance Code, and to indicate the candidate for the office of Chairman of the Board.
•Where applicable, appoints and revokes an independent director as “lead independent director”.
•Delegates and revokes powers to/from the Chief Executive Officer and the Chairwoman, establishing the limits and methods for exercising these powers and, after examining the proposals of the Remuneration Committee and following consultation with the Board of Statutory Auditors, determining the remuneration connected with these duties. The Board may impart directives to the delegated bodies and itself undertake any operations falling within the delegated powers. Prepares, updates and implements, with the support of the Nomination Committee, a succession plan for the Chief Executive Officer identifying at least the procedures to be followed in the event of early termination of office. It also ascertains the existence of adequate procedures for the succession of top management.
•Taking into account the obligations established by current legislation on the matter: (i) establishes the basic guidelines for the organizational, administrative and accounting structure, including the internal control and risk management system, of the Company, of subsidiaries with strategic importance and of the Group; (ii) it evaluates the adequacy of the organizational, administrative and accounting structure of the Company, of the subsidiaries with strategic importance and of the Group, with particular reference to the internal control and risk management system, put in place by the Chief Executive Officer.
•With the support of the Control and Risk Committee and following consultation with the Chairwoman in regard of the internal audit activities, establishes the general guidelines for the internal control and risk management system, in line with the Company's strategies. With reference to the four-year Plan, defines the nature and level of risk compatible with the strategic objectives of the company, on the basis of an estimate of the probability and impact of the risks issued (and, if necessary, updated during the year) by the Integrated Risk Management function, including in its assessments all the risks that may be relevant in terms of sustainable success of the Company. Upon proposal of the Chief Executive Officer and with the support of the Control and Risk Committee, it annually defines, within the framework of the four-year Plan, the specific guidelines for the internal control and risk management system, in line with the Company's strategies, and evaluates their implementation annually, based on a report from the Chief Executive Officer, without prejudice to the general guidelines on the subject contained in internal regulations. Upon proposal of the Chief Executive Officer and in agreement with the Control and Risk Committee and the Board of Statutory, defines the principles concerning the coordination and information flows between the various subjects involved in the internal control and risk management system. Approves the guidelines on the internal audit activity, upon proposal of the Chairwoman, in agreement with the Chief Executive Officer and having consulted the Control and Risk Committee. Defines the guidelines for the management and control of financial risks, after having heard the opinion of the Control and Risk Committee, and defines the financial risk limits for the Company and its subsidiaries. With the support of the Control and Risk Committee (i) examines the main Company risks, identified by the Chief Executive Officer, taking into account the nature of the business of the Company and of its subsidiaries, as reported by the Chief Executive Officer to the Board at least once every three months and (ii) every six months, based on the reports prepared by the Officer in charge of preparing financial reports of Eni SpA, as well as the reports by the Control and Risk Committee, the Risk Report and, annually, also on the basis of the Report on compliance with financial risk limits and the Integrated Compliance Report, evaluates the adequacy of the internal control and risk management system with regard to the nature of the business and its risk profile, as well as its effectiveness. It also evaluates the adequacy of powers and means given to the Officer in charge of preparing financial reports, and the actual compliance with the administrative and accounting procedures prepared by said Officer; (iii) assesses on an annual basis the adequacy of the organizational structure of the internal control and risk management system with respect to the characteristics of the company and its risk profile as well as its effectiveness, except for amendments that could make a six-monthly revision necessary, taking this into account also for the purposes of the evaluation on the adequacy of the internal controls and risk management system under point ii). Approves the Management, Supervision and Control Model of the risks on Health, Safety and Environment, Security and Public Safety of the Company, and its substantial amendments.
•At least annually, approves the Audit Plan prepared by the Head of the Internal Audit Department, with the support of the Control and Risk Committee and following consultation with the Chairwoman, the Chief Executive Officer and the Board of Statutory Auditors. Evaluates, with the support of the Control and Risk Committee and following consultation with the Board of Statutory Auditors, the findings contained in the recommendation letter, if any, of the audit firm and in its additional report, together with any comments of the Board of Statutory Auditors, informing the Board of Directors on the results of the auditing.
•Defines, upon proposal of the Chief Executive Officer, the strategic guidelines and objectives of the Company and of the Group, pursuing its sustainable success and monitoring its implementation. Examines and approves the four-year Plan and the medium-long term plans of the Company and of the group and related budgets, also on the basis of the analysis of the issues relevant to the generation of long-term value, periodically monitoring their implementation. Examines and approves the plan for the Company’s non-profit activities, after the assessment of the Sustainability and Scenarios Committee; it also approves operations not included in the non-profit plan whose cost exceeds € 1 million, provided that reports on operations not included in the plan and not subject to Board approval are periodically submitted to the Board, in accordance with paragraph below.
•Examines and approves, with the support of the Board Committees to the extent applicable, the Annual Financial Report, which includes the draft of Eni Financial Statements, the Consolidated Financial Statements and the consolidated non-financial statement, the consolidated annual Sustainability Report not already contained within the non-financial statement and the half-year financial report. It also examines and approves any semi-annual and quarterly financial reports and preliminary reports, the annual Report on Payments to Governments and any additional periodic statements or reports in accordance with applicable regulations.
•Receives from Directors with delegated powers at the Board meetings, on at least a bi- monthly basis, reports on actions taken in exercising their delegated powers, as well as on Group activities and on atypical or unusual transactions that have not been submitted to the Board for examination and approval, as well as on the execution of transactions with related parties and those in which the Directors and Statutory Auditors hold an interest in accordance with the relevant internal procedures. It also receives prior information: (i) on the closure of significant industrial sites in the refining and chemical sector, when the closure does not follow the liquidation of a company and (ii) on exiting countries where the Company operates, when entry was authorized by the Board.
•Receives periodic reports from the Chairwoman, on the implementation of Board resolutions. At each Board meeting, receives information from the Board’s internal Committees on the most relevant issues examined during their meetings and, at least on a semi-annual basis, a report on their activities.
•Assesses general trends in the operations of the Company and of the group on the basis of information received from Directors with delegated powers, paying particular attention to conflicts of interest and comparing, normally on a quarterly basis, results – as reported in the annual financial statements and interim financial reports – with budget forecasts.
•Examines and approves, with the support of the competent board committees, transactions by the Company and by its subsidiaries with related parties as provided for in the relative procedure approved by the Board, as well as transactions in which the Chief Executive Officer holds an interest pursuant to art. 2391, first paragraph, of the Italian Civil Code, that fall under the responsibility of the Chief Executive Officer.
•Evaluates and approves any transaction executed by the Company and by its subsidiaries (excluding the joint-control companies), that has a significant impact on the Company's strategy, performance or financial position.
The Board ensures compliance with the principles of good corporate governance and management of the subsidiaries, protecting their operational autonomy with specific regard to listed companies and companies for which law or regulations require it. It also ensures the confidentiality of transactions between said subsidiaries and Eni or third parties for the protection of the subsidiaries' interests. Without prejudice to the provisions of point 26, transactions with a significant impact include the following:
a) acquisitions and disposals of equity investments, companies or business units, property rights, leases active and passive of companies or business units, transfers of assets, mergers, demergers and liquidations of companies exceeding €200 million in the upstream oil&gas sector and €150 million in other business sectors, without prejudice to art. 23.2 of the By-laws;
b) acquisitions and disposals (also as part of “unification” agreements) of exploration mining rights exceeding €150 million and productive mining rights exceeding €200 million;
c) capital increases (i) of subsidiaries: for amounts exceeding €1 billion, (ii) of associate companies: for amounts exceeding €500 million, if proportionate to the interest held, and of any amount, if not proportional to the interest held;
d) investments in fixed assets exceeding €500 million in the upstream oil&gas sector, and €300 million in other sectors;
e) transactions that imply: (i) entry into new countries, with a significant operational presence or with initiatives that present a particular risk and/or (ii) significant entry into new business sectors;
f) real estate leases, purchase and sale of goods and contracts for the provision of work or services (other than those intended for investment and gas supplies), with the exclusion of contracts with and between subsidiaries, at a total price exceeding €1 billion or, if the total price exceeds €500 million, with a duration of more than 20 years;
g) gas and LNG purchase and supply contracts, of at least 3 billion cubic meters per year and ten-year duration or changes to gas purchase and supply contracts involving increases in commitments of at least 3 billion cubic meters per year and increases in duration, inclusive of the residual duration of the contract, exceeding 10 years, with the exception of modifications made in execution of contractual clauses already included in the original agreement;
h) loans to subjects other than subsidiaries: (i) if in favour of associate companies: for an amount exceeding €300 million, if in proportion to interest held; and for an amount exceeding €10 million if not proportional to interest held; (ii) if in favour of non-associate companies: of any amount; (iii) changes in the loans referred to in points (i) and (ii), which determine a worsening in the approved contractual terms.
The following transactions do not require the approval of the Board:
a. financial commitments assumed in a non-proportional amount to interest held (so-called "carry agreement") within contracts relating to the exploration and development phase of hydrocarbons, provided that the following conditions are jointly warranted: (i) the obligations are assumed in favour of the host state or an oil company directly or indirectly wholly-owned by the host state; (ii) the obligations are distributed in proportion to the interest held in the reference asset by subjects other than the State or the State oil company (referred to in point i) at the time the financial commitment is made; (iii) with relation only to carry agreements for the development phase, the risk of repayment of the loan is guaranteed by any future financial or production flows of the underlying mining investment. The carry agreements, or amendments thereof, stipulated after the conclusion of the above contracts, are subject to the approval of the Board if they determine a non-proportional increase in the exposure and for amounts exceeding €200 million;
b. the signing and application of default clauses contained in the contracts regulating the mining activity between partners of a joint venture;
i) issuing of unsecured and secured guarantees to entities other than subsidiaries: (i) for amounts exceeding €500 million, if in the interest of the Company or of Eni subsidiaries; (ii) for amounts exceeding €300 million, if in the interest of non-controlled associated companies; (iii) in any case, for amounts exceeding €10 million if the guarantee is not proportionate to the interest held in the obligations underlying the guarantee (with the exception of the case in which the non-proportionality is due to the presence of a carry agreement within the limits indicated in letter h) above); (iv) for any amount, if in the interest of third parties; (v) for an indeterminate amount, in the interest of any person; (vi) changes to the guarantees referred to in the previous points, which determine a worsening in guarantees already issued;
j) waiver of rights with a value equal to the thresholds set out in the preceding letters for the acquisition or transfer of the same rights;
k) Eni S.p.A. intermediation agreements, understood as contracts in which the Company, in relation to a specific business initiative, appoints an entity for the exclusive purpose of putting the Company in contact with third parties, promoting the interests of the Company with the aforementioned subjects and facilitating the stipulation/execution of contracts with them.
•Appoints and revokes – acting upon proposal of the Chief Executive Officer in agreement with the Chairwoman and following consultation with the Nomination Committee – the Chief Operating Officers, defining the content and limits of their powers as well as the provisions for exercising them. In the case of appointment of the Chief Executive Officer as General Manager, the proposal is made by the Chairwoman. At the time of the appointment and periodically, the Board assesses compliance with the integrity requirements provided for by current legislation for General managers.
•Upon proposal of the Chairwoman, appoints and revokes the Board Secretary and Board Counsel, which reports hierarchically and operationally to the Board and by means of it to the Chairwoman, and determines the remuneration, the charter and the annual budget.
•After assessing his compliance with professional and integrity requirements, appoints and removes the Officer in charge of preparing financial reports – acting upon a proposal of the Chief Executive Officer and in agreement with the Chairwoman, following consultation with the Nomination Committee, and having received the favourable opinion of the Board of Statutory Auditors; also, following the opinion of the Control and Risk Committee, ensures that he has adequate powers and means to carry out his statutory duties and monitors compliance with the administrative and accounting procedures established by the abovementioned officer. The Board periodically assesses the possession of the integrity requirements provided for by current legislation for the Officer in charge of preparing financial reports.
•Acting upon proposal of the Chairwoman, in agreement with the Chief Executive Officer, with the support of the Control and Risk Committee, and following consultation with the Board of Statutory Auditors, it (i) appoints and removes the Head of Internal Audit Department, with the support of the Nomination Committee (ii) it approves the Internal Audit budget, ensuring that the Head of Internal Audit Department has adequate resources to carry out his duties: (iii) establishes his remuneration structure in accordance with the Company’s remuneration policies. The Head of Internal Audit Department reports hierarchically to the Board and, on its behalf, to the Chairwoman, without prejudice to its operational dependence on the Control and Risk Committee and on the Chief Executive Officer.
•With the support of the Control and Risk Committee, determines the attribution of supervisory functions and the composition criteria of the supervisory body pursuant to Legislative Decree 231/2001 and, on the proposal of the Chief Executive Officer, in agreement with the Chairwoman: (i) having heard the Nomination Committee and, for external members, also the opinion of the Board of Statutory Auditors, it appoints and removes the members of the Supervisory Body referred to in Legislative Decree no. 231 of 2001, determining its composition and (ii) establishing the remuneration of its members. Upon proposal of the Supervisory Body, approves the related annual "budget".
•Evaluates, with the support of the Control and Risk Committee, the adoption of measures to guarantee the effectiveness and impartiality of judgment of the Integrated Risk Management and Integrated Compliance functions and of any other functions involved in controls, verifying that they are equipped with adequate skills and resources.
•Promotes, in the most appropriate way, dialogue with shareholders and other relevant stakeholders for the company. Upon the proposal of the Chairwoman, in agreement with the Chief Executive Officer, adopts and describes, in the corporate governance report, a policy for managing dialogue with the generality of shareholders. The Chairwoman ensures, within the terms established by said policy, that the Board receives, by the first useful meeting and in any case within the terms established by the policy, information on the development and significant contents of the dialogue taking place with all the shareholders.
•Defines, with the assistance of the Remuneration Committee, the policy for the remuneration of directors, managers with strategic responsibilities and, without prejudice to the provisions of art. 2402 of the Italian civil code, of members of the control body; it approves, on the proposal of the same Committee, the Report on the remuneration policy and compensation paid to be presented to the Shareholders' Meeting called to approve the financial statements. Furthermore, in implementing the Remuneration Policy, approved in the Shareholders' Meeting, following a proposal from the Remuneration Committee: (i) defines, having heard the opinion of the Board of Statutory Auditors, the remuneration of Directors with delegated powers and those with particular offices; (ii) establishes the objectives, and verifies their final achievement, connected to the variable remuneration of Directors with delegated powers and the incentive plans; (iii) implements the remuneration plans based on shares or financial instruments approved by the Shareholders' Meeting; (iv) ensures that the remuneration paid and accrued is consistent with the principles and criteria defined in the policy, in light of the results achieved and other relevant circumstances for its implementation. Upon termination of office and/or of the relationship with the Chief Executive Officer or a Chief Operating Officer, based on the outcome of the internal processes leading to the attribution or recognition of any indemnity and/or other benefits, approves the press release to be disseminated to the market with the information required by the Corporate Governance Code and/or by any applicable regulations.
•Decides – acting upon a proposal of the Chief Executive Officer – on the exercise of voting rights and, in consultation with the Nomination Committee, on the appointment of members of corporate bodies of the subsidiaries with strategic importance and Saipem S.p.A. In the case of listed companies, the Board must guarantee compliance with the provisions of the Corporate Governance Code that fall under the competence of the Shareholders' Meeting.
•Formulates proposals to submit to the Shareholders' Meeting and, through the Chairwoman and the Chief Executive Officer, reports to the Shareholders' Meeting on the activities carried out and planned, working to ensure that shareholders receive adequate information about the elements they need to take the decisions pertaining to them, with knowledge of the facts.
•Examines and decides on other issues that Directors with delegated powers believe should be presented to the Board due to their particular importance or sensitivity.
In accordance with art. 23.2 of the By-laws, the Board also decides upon: mergers and proportional spin-offs of companies in which the Company’s shareholding is at least 90%; the establishment and closing of secondary offices; and the amendment of the By-laws to comply with regulatory provisions.
According to this resolution, the Chief Executive Officer is also in charge of establishing and maintaining the internal control and risk management system. The Board authorizes the Chief Executive Officer to modify investment transactions previously approved by the Board, in ways that do not involve a substantial reconfiguration of the underlying industrial project. The Board receives annual information on these modifications in the event of: (i) an increase in the whole life cost of more than 30% compared to the authorized amount and/or (ii) a reduction in profitability below the hurdle rate or of the adjusted WACC, for projects authorized on the basis of these parameters.
Directors’ independence
On the basis of statements made by the Directors and other information available to the Company, during its meeting of May 14, 2020, the Board of Directors determined that Chairman Calvosa and Directors De Cesaris, Guindani, Litvack, Piccinno, Tocci and Vermeir satisfy the independence requirements established by law, as referenced in Eni’s By-laws. Furthermore, Directors De Cesaris, Guindani, Litvack, Tocci, and Vermeir have been deemed independent by the Board pursuant to the criteria and parameters recommended by the previous Corporate Governance Code of July 2018 (the “Code 2018”). Chairman Calvosa, in compliance with the Corporate Governance Code 2018, could not be deemed independent as she was a significant representative of the Company.26
26 Although the Chairman of the Board of Directors is a non-executive Director, the Code 2018 treated her as a significant representative of the Company (Application Criterion 3.C.2 of the Corporate Governance Code 2018).
At the assessment carried out on April 2021, the Board of Directors, after preliminary assessment by the Nomination Committee:
- before proceeding with the annual assessment, defined the criteria for assessing independence, pursuant to the Code, confirming the criteria already identified in application of the Code 2018, relating to the identification of additional remuneration and significance of relationships that could compromise independence;
- confirmed the previous assessment that the Chairman and Directors De Cesaris, Guindani, Litvack, Piccinno, Tocci and Vermeir meet the independence requirements provided for by law and assessed that the Chairman and the Directors De Cesaris, Guindani, Litvack, Tocci and Vermeir meet also the independence requirements recommended by the Code. In particular, the Board deemed to be non-relevant pursuant to Code and on the basis of a substantive assessment, the relationships between Eni and: (i) a law firm whose partner is a relative of Director De Cesaris, having regard to the pre-existence of the relationships with respect to the appointment of Director De Cesaris to the Board of Eni, to the low incidence of the same with respect to the annual turnover of the law firm and to the fact that, at the request of the Director, the Company’s structure has been recommended not to enter into other professional relationships with the said law firm, and (ii) Istituto Affari Internazionali – IAI (a private, independent non-profit think tank), of which Director Tocci is General Manager having regard to the pre-existence of relationships between Eni and the Institute with respect to the appointment of the Director to the Board of Eni, to the low incidence of such relationships with respect to IAI’s annual revenues, as well as the low incidence in the bodies of the Institute, competent for the appointment of the Director, of the vote of the members who are also employees of Eni, it being understood that the appointment of Director Tocci as Director of the Institute preceded her appointment as member of the Board of Directors of Eni.
At the assessment carried out on February 2022, the Board of Directors, after preliminary assessment by the Nomination Committee, updated the criteria for assessing independence and confirmed the previous assessment of independence pursuant to law and to the Code of the Chairman and Directors De Cesaris, Guindani, Litvack, Tocci and Vermeir and assessed that Director Piccinno, already independent pursuant to law, is independent also pursuant to the Code.
At the last assessment carried out on February 2023, the Board of Directors, after preliminary assessment by the Nomination Committee, confirmed the previous assessment of independence pursuant to law and to the Code of the Chairman and Directors De Cesaris, Guindani, Litvack, Tocci, Piccinno and Vermeir.
The relationships were evaluated on the basis of statements made by the Directors and other information available to the Company.
The Board of Statutory Auditors verified the proper application of criteria and procedures adopted by the Board of Directors in assessing the independence of its members.
Such independence criteria may be not equivalent to the independence criteria set forth in the NYSE listing standards applicable to a U.S. domestic company.
On April 29, 2021, upon request of independent directors, the Board of Directors of Eni appointed Raphael Louis L. Vermeir Lead Independent Director. Pursuant to Italian Corporate Governance Code, the Lead Independent Director collects and coordinates the requests and contributions of non-executive directors and, in particular, of independent ones and coordinates the meetings of the independent directors.
Board Committees
The Board of Directors has established four internal Committees to provide it with recommendations and advice: (a) the Control and Risk Committee; (b) the Remuneration Committee; (c) the Nomination Committee; and (d) the Sustainability and Scenarios Committee. Committees under letters (a), (b) and (c) are recommended by the Code. The composition, duties and operational procedures of these committees are governed by their own rules, which are approved by the Board, in compliance with the criteria outlined in the Code.
The Committees recommended by the Code are composed of no fewer than three members and, in any case, less than a majority of members of the Board. The composition is described in the following sections pertaining each Committee.
All Board Committees report to the Board of Directors, at least once every six months, on activities carried out. In addition, the Chairmen of the Committees report to the Board at each meeting of the Board on the key issues examined by the Committees in their previous meetings.
In the exercise of their functions, the Committees have the right to access any information and Company functions necessary to perform their duties. They are also provided with adequate financial resources, in accordance with the terms established by the Board of Directors and can avail themselves of external advisers.
The Chairman of the Board of Statutory Auditors or a Statutory Auditor designated by her, participates in Control and Risk Committee. Members of the Board of Statutory Auditors and the Magistrate of the Court of Auditors may attend Committee’s meetings. Upon invitation of the Chairman of the Committee, the Chairman of the Board of Directors and/or the Chief Executive Officer may attend specific meetings27, as well as other Directors, after having heard the Chairman of the Board. Moreover, upon invitation of the Chairman of the Committee, and having informed the Chief Executive Officer, other members of the Company structure, for their own competence, may be invited to participate in the meeting on specific items of the agenda.
The Board Secretary and Board Counsel coordinates the secretaries of the Board Committees, receiving for this purpose information on the calendar of the meetings and the items in the Committees’ agendas, the notices of the meetings, as well as their signed minutes.
Minutes of all Committee meetings are usually drafted by their respective secretaries. The current members of the Control and Risk Committee, Remuneration Committee, Nomination Committee and Sustainability and Scenarios Committee were appointed by the Board of Directors on May 14, 2020.
Remuneration Committee
Members: Nathalie Tocci (Chairman), Karina A. Litvack, Raphael Louis L. Vermeir.
Established by the Board of Directors for the first time in 1996, in accordance with the By-laws, the Remuneration Committee is made up of three to four non-executive Directors, all of whom are independent or, alternatively, a majority of whom are independent. In the latter case, the Chairman of the Committee shall be chosen from among the independent Directors. The members of the Committee shall have expertise that is consistent with the duties they are required to perform, to be evaluated by the Board of Directors at the time of the appointment. The Committee’s Rules require that at least one of its members possess adequate knowledge and experience of financial matters or remuneration policies.
27 Except for meetings of the Remuneration Committee examining proposals regarding their remuneration. Rules of the Remuneration Committee establish that “no Director and, in particular, no Director with delegated powers may take part in meetings of the Committee during which Board proposals regarding his or her remuneration are being discussed, unless such proposals regard all the members of the Committees established within the Board of Directors.”
In accordance with the By-laws and the Corporate Governance Code, the Committee assists the Board of Directors with preparatory, consultative and advisory functions. More specifically, the Committee:
| a) | submits to the Board of Directors for its approval the “Report on remuneration policy and remuneration paid” and, in particular, the remuneration policy for members of corporate bodies, Chief Operating Officers and other Managers with strategic responsibilities, without prejudice to provisions of Art. 2402 of Italian Civil Code, to be presented to the Shareholders’ Meeting called to approve the financial statements, as provided for by the applicable law; |
||
| b) | presents proposals and expresses opinions for the remuneration of the Chairman of the Board of Directors and the Chief Executive Officer, covering the various forms of compensation and benefits awarded; |
||
| c) | presents proposals and expresses opinions for the remuneration of the members of the Board’s internal committees; |
||
| d) | examines the CEO’s indications and presents proposals for: |
||
| i. | general criteria for the remuneration of managers with strategic responsibilities; | ||
| ii. | annual and long-term incentive plans, including equity-based plans; | ||
| iii. | establishing performance targets and assessing results for performance plans in connection with the determination of the variable portion of the remuneration for Directors with delegated powers and with the implementation of incentive plans; | ||
| e) | periodically evaluates the adequacy, overall consistency and actual implementation of the adopted policy, as described in letter a) above and assesses, in particular, the actual achievement of the performance objectives, formulating proposals on the matter to the Board; |
||
| f) | performs the tasks required under the Company’s procedures for handling related party transactions; |
||
| g) | examines and monitors the results of engagement activities carried out in support of the Eni Remuneration Policy, within the terms set forth in the engagement policy approved by the Board. |
||
| h) | reports to the Board, at least once every six months and no later than the deadline for the approval of the annual and semi-annual financial report, on its activities at the Board meeting indicated by the Chairman of the Board of Directors; |
||
| i) | reports through its Chairman or another Committee member designated by the Chairman on its operational procedures to the Shareholders’ Meeting called to approve the financial statements. |
||
Control and Risk Committee
Members: Pietro Guindani (Chairman), Ada Lucia De Cesaris, Nathalie Tocci and Raphael Louis L. Vermeir.
The Control and Risk Committee is entrusted with supporting, on the basis of an appropriate control process, the Board of Directors’ assessments and decisions relating to the internal control and risk management system and the approval of periodical financial and non-financial reports. It is entirely made up of non-executive and independent Directors28 who possess the necessary expertise consistent with the duties they are required to perform29.
28 In accordance with the rules of the Control and Risk Committee, the Committee is made up of three to four non-executive Directors, all of whom are independent. Alternatively, the Committee may be made up of non-executive Directors, the majority of whom shall be independent. In the latter case, the Chairman of the Committee shall be chosen from among the independent Directors. In any case, the number of members shall be fewer than the number representing a majority on the Board.
29 The Governance system put in place by Eni establishes that the Committee as a whole possesses adequate expertise in the sector of activity in which the Company operates, as necessary to assess the related risks, and must in any case have adequate skills in relation to the tasks it is called upon to perform, as assessed by the Board of Directors upon the appointment; two members of the Committee if there are such members on the Board, or in any case at least one member of the Committee or in any case at least one member of the Committee must possess adequate experience in financial and accounting matters or in risk management, as assessed by the Board of Directors at the time of their appointment.
In particular, at their appointment, the Directors Guindani and Vermeir were identified by the Board as members with “adequate experience in accounting and financial matters or risk management”, as recommended by the Corporate Governance Code.
The Committee supports the Board of Directors with preparatory work, following which it formulates assessments and/or opinions, in particular with regard to: a) the guidelines for the internal control and risk management system (ICRMS) consistently with the Company’s strategies, so that the main risks that affect the Company and its subsidiaries can be correctly identified and appropriately measured, managed and monitored, expressing in this regard the opinion required by internal regulations on the matter; it also supports the Board of Directors in determining the degree of compatibility of such risks with the management of the Company in a manner consistent with its stated strategic objectives and preliminary examining the main company risks, taking into account the characteristics of the activities carried out by the company or its subsidiaries;
b) the definition, within the Strategic Plan, of the annual guidelines of the internal control and risk management system ("Annual plan for the integrated management of strategic risks"), proposed by the Chief Executive Officer, in line with the strategies of the company, as well as the annual assessment of the implementation of these guidelines, based on the Report prepared for this purpose by the Chief Executive Officer;
c) the evaluation performed at least every six months, of the adequacy of the internal control and risk management system, taking account of the characteristics of the Company and its risk profile, as well as its effectiveness. To this end, it reports to the Board of Directors, on the occasion of the approval of the annual and semi-annual financial reports, on its activities and on the adequacy of the ICRMS;
d) the fundamental guidelines of the Regulatory System, the regulatory instruments to be approved by the Board of Directors, their amendment or update, and, upon request by the CEO, on specific aspects in relation to the instruments implementing the fundamental guidelines, expressing in this regard the opinion required by internal regulations on the matter;
e) the guidelines for the management and control of financial risks, expressing in this regard the opinion required by internal regulations on the matter;
f) the proposals concerning the appointment, the removal and, consistent with the Company’s policies, the structure of the fixed and variable compensation of the Internal Audit Director, as well as on the adequacy of the resources provided to the latter to perform his duties, expressing the opinion required by internal regulations on the matter;
g) at least once a year, the Audit Plan prepared by the Internal Audit Director, expressing the opinion required by internal regulations on the subject;
h) the assessment of opportunities to adopt measures to ensure the effectiveness and impartiality of judgment of the Integrated Risk Management and Integrated Compliance units and of any other functions involved in the controls identified by the BoD, as well as the annual verification that they are equipped with adequate professionalism and resources;
i) the choice relating to the attribution of supervisory functions pursuant to Legislative Decree no. 231/2001 and the composition criteria of the Watch structure pursuant to Legislative Decree no. 231/2001 which is reported in the Corporate Governance Report;
j) the exam of reports on the ICRMS, also following periodic meetings with the relevant structures of the Company;
k) investigations and examinations carried out by third parties regarding the internal control and risk management system;
l) findings reported by the Audit Firm in any management letter it may issue and in the latter’s additional report which includes any opinions of the Board of Statutory Auditors (the additional report includes any opinions of the Board of Statutory Auditors);
m) the illustration, in the annual Corporate Governance Report, of the main features of the internal control and risk management system, and how the different subjects involved therein are coordinated, providing an indication of benchmark models as well as national and international best practices, and an evaluation of the overall adequacy of the system itself;
n) the adoption and amendment of the rules for the transparency and substantial and procedural correctness of transactions with related parties and those in which a Director or Statutory Auditor holds an interest, on his own or on behalf of third parties, expressing the opinion required by regulations, including internal ones, on the subject and carrying out the additional tasks assigned to it by the Board of Directors, also with reference to the examination and issue of an opinion on certain types of transactions, except for those relating to remuneration;
o) the proposal of the Chief Executive Officer for the definition of the principles concerning the coordination and information flows between the various parties involved in the ICRMS.
In addition, the Committee, in assisting the Board of Directors: a) evaluates, after having consulted the Officer in charge of preparing financial reports, the Audit Firm and the Board of Statutory Auditors, the proper application of accounting standards and their consistency in preparing the Consolidated Financial Statements, issuing an opinion prior to their approval by the Board of Directors; b) examines and evaluates Reports prepared by the Officer in charge of preparing financial reports through which it shall give its opinion to the Board of Directors on the appropriateness of the powers and resources assigned to the Officer himself and on the proper application of accounting and administrative procedures, enabling the Board to exercise its tasks of supervision required by law; c) assesses whether the periodic financial and non-financial information is suitable to correctly represent the Company’s business model, its strategies, the impact of its business and the performance achieved, expressing an opinion to the Board in coordination with the Sustainability and Scenarios Committee; d) examines the content of the periodic non-financial information relevant to the ICRMS; e) expresses opinions to the Board of Directors on specific aspects relating to the identification of the main corporate risks; f) on the request of the Board, it supports, with adequate preliminary activities, the Board of Directors’ assessments and resolutions on the management of risks arising from detrimental facts which the Board may have become aware of and g) monitors the independence, adequacy, efficiency and effectiveness of the Internal Audit Department and oversees its activities with respect to the duties of the Board of Directors and the Chairman of the Board on its behalf, in this area, ensuring that they are performed with the necessary independence and required level of objectivity, competence and professional diligence, in accordance with the Code of Ethics of Eni SpA and international standards, as well as with the terms provided by the guidelines on Internal Audit activities (Internal Audit Charter).
In particular, the Committee also: a) examines and evaluates, on the occasion of his/her appointment, whether the Internal Audit Director meets the integrity, professionalism, competence and experience requirements and, on an annual basis, assesses their fulfilment; b) examines the results of the audit activities performed by the Internal Audit Department and the periodic reports prepared by it containing adequate information on the activities carried out, on the manner in which risk management is conducted and on compliance with risk containment plans, as well as assessment of the appropriateness of the ICRMS . It also examines the reports promptly prepared by the Internal Audit Department on events of particular importance; c) examines the information received from the Internal Audit Department and promptly reports its assessment to the Board of Directors in the case of: (i) significant deficiencies in the system for preventing irregularities and fraudulent acts, and irregularities or fraudulent acts committed by management personnel or by employees who perform important roles in the design or operation of the ICRMS; and (ii) circumstances which may affect the maintenance of the independence of the Internal Audit Department and of auditing activities and d) may ask the Internal Audit Department to perform audits of specific operational areas, providing simultaneous notice to the Chairman of the Board of Directors, the CEO and the Chairman of the Board of Statutory Auditors, unless there are conflicts of interest;
The Committee also examines and assesses: a) communications and information received from the Board of Statutory Auditors and its members regarding the ICRMS, including those concerning the findings of enquiries conducted by the Internal Audit Department in connection with reports received (whistleblowing), including anonymous reports and b) half yearly reports issued by Eni’s Watch Structure, as well as the timely updates provided by the Structure, after the updates have been given to the Chairman of the Board and to the CEO, about any particular materiality or significant situation detected in the execution of its duty.
Furthermore, in case of judicial inquiries and proceedings, carried out in Italy and/or abroad, involving the CEO and/or the Chairman of Eni SpA and/or a member of the Board of Directors and/or an Executive reporting directly to the CEO, even if no longer in office, in relation to crimes against the Public Administration and/or corporate crimes and/ or environmental crimes, related to their duties and their scope of responsibility, in which the Board of Directors determines that the CEO may have an interest, pursuant to Article 2391 of the Civil Code, in order to ensure the independence of judgment of the Legal Department of the Company, in the interest of the same, the Board provides the Legal Department with the necessary information on its activities, with the support of the Committee. In particular, the Board avails itself of the Committee in order to ascertain the legal classification of the facts under investigation and proceedings, to acquire all necessary information on said investigations and proceedings from the legal department, to verify their completeness and accuracy, to be informed of the performance of such investigations and proceedings and to receive guidance to be provided to the legal department.
Nomination Committee
Members: Ada Lucia De Cesaris (Chairman), Pietro Guindani and Emanuele Piccinno.
The Nomination Committee is made up of non-executive Directors, a majority of whom are independent.
In accordance with the By-laws and the Corporate Governance Code, the Committee assists the Board of Directors with preparatory, consultative and advisory functions. More specifically, the Committee:
a) assists the Board of Directors in formulating any criteria for the appointment of persons indicated in letter b) below, and of the members of the other boards and bodies of Eni’s associated companies;
b) provides evaluations to the Board of Directors on the appointment of executives and members of the boards and bodies of the Company and of its subsidiaries, proposed by the Chief Executive Officer and/or the Chairman of the Board of Directors, whose appointment falls under the Board’s responsibilities and oversees the associated succession plans. It supports the Board in the elaboration, update and implementation of the Chief Executive succession plan, by identifying, at least, the procedures to be followed in the event of an early termination of office;
c) upon a proposal of the Chief Executive Officer, examines and evaluates criteria governing the succession planning for the Company’s managers with strategic responsibilities;
d) assists the Board in the identification of candidates to serve as Directors in the event one or more positions need to be filled during the course of the year (Article 2386, first paragraph, of the Italian Civil Code), ensuring compliance with the requirements regarding the minimum number of independent Directors and the percentage -5- reserved for the less represented gender, as well the representation of noncontrolling interests;
e) proposes to the Board of Directors candidates for the position of Director to be submitted to the Shareholders’ Meeting of the Company, in the absence of proposals submitted by the shareholders, in the event it is not possible to draw the required number of Directors from the slates presented by shareholders;
f) with reference to the annual evaluation program on the performance of the Board of Directors and its Committees, in compliance with the Corporate Governance Code, it assists the Chairman of the Board of Directors in the activity attributed to it, of ensuring the adequacy and transparency of the self-assessment process of the Board; assists the Board in the preparatory work for the appointment of an external consultant and in the evaluation of the outcomes of the process. On the basis of the results of the self-assessment, the Committee supports the Board of Directors regarding the size and composition of the Board or its Committees, as well as, the skills and managerial and professional qualifications it feels should be represented within the same Board and Committees also in light of the industrial characteristics of the Company, taking into account the diversity criteria and the Board of Directors guidelines on the maximum number of positions a Director can hold in other companies, so that the Board itself can issue its guidelines to the shareholders prior to the appointment of the new Board;
g) assists the outgoing Board in the proposition of the slate of candidates for the position of Director to be submitted to the Shareholders’ Meeting if the Board decides to opt for the process envisaged in Article 17.3 (1) of the By-laws, ensuring the transparency of the process leading to the slate’s structure and proposition;
h) in compliance with the Corporate Governance Code, proposes to the Board of Directors guidelines regarding the maximum number of positions of Director or Statutory Auditor that a Company Director may hold and performs the preliminary activity for the associated periodic checks and evaluations for submission to the Board;
i) periodically verifies that the Directors satisfy the independence and integrity requirements, and ascertains the absence of circumstances that would render them incompatible or ineligible, at least on an annual basis and upon the occurrence of circumstances relevant to independence;
j) provides its opinion to the Board of Directors on any activities carried out by the Directors, which are in competition with the Company;
k) reports to the Board of Directors, at least once every six months and no later than the deadline for the approval of the annual and semi-annual financial report, on the activity carried out, at the Board meeting indicated by the Chairman of the Board of Directors.
The preliminary examination of corporate affairs or governance issues is carried out jointly with the Director Corporate Affairs and Governance, who, in this case, participates in the Committee meetings.
Sustainability and Scenarios Committee
Members: Karina A. Litvack (Chairman), Filippo Giansante, Emanuele Piccinno, Nathalie Tocci and Raphael Louis L.Vermeir.
The Sustainability and Scenarios Committee is made up of non-executive Directors, a majority of whom are independent.
The Committee assists the Board of Directors with preparatory, consultative and advisory functions on scenarios and sustainability issues, i.e. the processes, projects and activities aimed at ensuring the Company’s commitment to sustainable development along the value chain, particularly with regard to: climate transition and technological innovation; access to energy, energy sustainability; environment and energy efficiency; local development, particularly economic diversification, health, well-being and safety of people and communities; respect and protection of rights, particularly of the human rights; integrity and transparency; diversity and inclusion.
More specifically, in its preparatory, consultative and advisory function towards the Board of Directors, the Committee:
a. examines scenarios for the preparation of the Strategic Plan, giving its opinion to the Board of Directors;
b. examines and evaluates climate transition issues, i.e. decarbonisation at both operational and product portfolio level, technological innovation, green chemistry and circular economy, aimed at ensuring the creation of value over time for shareholders and all other stakeholders;
c. examines and evaluates other aspects of the sustainability policy, in accordance with the principles of sustainable development, as well as sustainability strategies and objectives;
d. monitors the Company’s position in terms of sustainability with regard to financial markets, particularly with regard to annual reporting on new sustainable finance tools, as well as the Company’s inclusion in the leading sustainability indexes;
e. examines and evaluates the sustainability report submitted annually to the Board of Directors;
f. monitors international sustainability projects as part of global governance processes and the Company’s participation in such projects, designed to strengthen the Company’s international leadership;
g. examines and assesses local sustainability initiatives, including in relation to individual projects, provided for in agreements with producer countries, submitted by the CEO for presentation to the Board;
h. examines how the local sustainability policy is implemented in business initiatives, on the basis of indications provided by the Board of Directors;
i. examines the Company’s non-profit strategy and its implementation, including in relation to individual projects, through the non-profit plan submitted each year to the Board, as well as non-profit initiatives submitted to the Board;
j. at the request of the Board, gives its opinion on other sustainability issues;
k. in agreement with the Chief Executive Officer, evaluates the opportunity of organizing open Committee meetings, possibly including other directors, with institutional stakeholders, to listen to their point of view with reference to the issues falling within the competence of the Committee;
l. at least once every six months, reports to the Board of Directors on its activities, by the date of the approval of the annual and semi-annual financial reports, during the meeting of the Board of Directors indicated by the Chairman of the Board of Directors;
m. coordinates with the Control and Risk Committee in assessing the suitability of periodic financial and non-financial information, to correctly represent the business model, the strategies of the company, the impact of its activity and the performance achieved.
Board of Statutory Auditors
|
Name |
|
Position |
|
Year first appointed to Board of Statutory Auditors |
|
Rosalba Casiraghi |
|
Chairman |
|
2017 |
|
Enrico Maria Bignami |
|
Auditor |
|
2017 |
|
Marcella Caradonna |
|
Auditor |
|
2021 |
|
Giovanna Ceribelli |
|
Auditor |
|
2020 |
|
Marco Seracini |
|
Auditor |
|
2014 |
|
Roberto Maglio |
|
Alternate |
|
2020 |
|
Claudia Mezzabotta |
|
Alternate |
|
2017 |
Eni’s Board of Statutory Auditors, composed of five standing members and two substitute members, was appointed by the shareholders on May 13, 2020 for three years, until the date of the Ordinary Shareholders’ Meeting convened for approval of financial statements for the year ending 31 December 2022. The Standing Statutory Auditors Giovanna Ceribelli, Mario Notari, Marco Seracini and the Alternate Auditor, Roberto Maglio were elected from the slate submitted by the Ministry of Economy and Finance (the “majority slate”); Rosalba Casiraghi, appointed Chairman of the Board of Statutory Auditors, the Standing Statutory Auditor, Enrico Maria Bignami and the Alternate Auditor, Claudia Mezzabotta were elected from the slate presented by non controlling shareholders (the “minority slate”).
On September 1, 2020, the Alternate Auditor Roberto Maglio took over from the Auditor Mario Notari who resigned. On May 12, 2021 the shareholders appointed Marcella Caradonna as Standing Statutory Auditor and Roberto Maglio as Alternate Auditor, both proposed by the Ministry of Economy and Finance for the integration of the Board of Statutory Auditors.
The Auditors are appointed by means of a slate voting system: the lists are presented by shareholders representing at least 0.5% of the share capital. Two standing Statutory Auditors and one Alternate Auditor are selected from among the candidates of the non-controlling shareholders. The Chairman of the Board of Statutory Auditors is appointed by the Shareholders’ Meeting from among the Auditors chosen by the non controlling shareholders.
In accordance with the provisions designed to ensure gender balance, two Statutory Auditors were drawn from the less represented gender.
The Auditors must satisfy the independence, professional and integrity requirements established by Italian regulations. Article 28 of the By-laws specifies that the professionalism requirements may be fulfilled by having at least three years’ experience in: (i) professional or teaching activities pertaining to commercial law, business economics and corporate finance, or (ii) experience in executive positions in the fields of engineering and geology. U.S. regulations for Audit Committees require that at least one member of the Board of Statutory Auditors be a financial expert and have adequate knowledge of the functions of the Audit Committee and experience in the analysis and application of generally accepted accounting standards, the preparation and auditing of Financial Statements and internal control processes. The Board of Statutory Auditors, acting as the Internal Control and Financial Auditing Committee pursuant to Legislative Decree no. 39/2010 (Consolidate Law on Statutory Audits of annual accounts and consolidated accounts), must satisfy the requirement imposed by Art. 19 of that law, providing that “the members of the internal control and financial auditing committee, as a body, are competent in the sector in which the company being audited operates”. In addition, the Corporate Governance Code 2020 which Eni adopted from December 23, 2020, applicable from January 1, 2021, also recommends that all members of the Board of Statutory Auditor possess the independence requirements envisaged for Directors. Compliance with those criteria is verified by the Board of Statutory Auditors itself.
Pursuant to the Consolidated Law on Financial Intermediation, the Board of Statutory Auditors monitors: (i) compliance with the law and the Company’s By-laws; (ii) observance of the principles of sound administration; (iii) the appropriateness of the Company’s organizational structure for matters within the scope of the Board’s Authority, the adequacy of the internal control system and the administrative and accounting system and the reliability of the latter in accurately representing the Company’s transactions; (iv) the procedures for implementing the Corporate Governance rules provided for in the Corporate Governance Code, which the Company has adopted; and (v) the adequacy of the instructions imparted by the Company to its subsidiaries, in order to guarantee full compliance with legal reporting requirements.
In addition, pursuant to Article 19 of Legislative Decree No. 39/2010, in its role as the “internal control and financial auditing committee” the Board of Statutory Auditors: a) informs the Board of Directors of the conclusion of the statutory audit and transmits to the Board the “additional report” of the audit firm adding proper evaluation if deemed necessary; b) oversees the financial reporting process and presents recommendations to ensure its integrity; c) controls the effectiveness of internal quality control system and Risk Management, the effectiveness of internal audit, with reference to the financial reporting process, without violating its independence; d) oversees the statutory audit of annual accounts and consolidated accounts, also considering results of quality control of the audit activity performed by the public authority responsible for regulating the Italian financial markets; e) verifies and monitors the independence of the audit Firm with particular reference to non-audit services; f) is responsible of the procedure to select the audit Firm, making a recommendation to the Shareholders’ Meeting for the appointment of the audit Firm.
The responsibilities assigned under the Legislative Decree No. 39/2010 to the “internal control and financial auditing committee” are consistent and substantively in line with the duties already assigned to the Board of Statutory Auditors of Eni, with specific consideration of its role as Audit Committee pursuant to the “Sarbanes-Oxley Act” (discussed in greater detail below).
In accordance with law, the Board of Statutory Auditors presents the results of its supervisory activity in a report to the Shareholders Meeting. This report is made available in its entirety to the public within the time limits applicable to the Financial Statements
On March 22, 2005, the Board of Directors, electing the exemption granted by the SEC applicable to foreign issuers listed on the regulated U.S. markets, designated the Board of Statutory Auditors as the body that, as of June 1, 2005, would perform, to the extent permitted under Italian regulations, the functions attributed to the Audit Committee of foreign issuers by the Sarbanes-Oxley Act and SEC rules. On June 15, 2005, the Board of Statutory Auditors approved the internal rules, later updated, concerning its performance of the duties assigned to it under that U.S. legislation, the text of which is available on Eni’s website. The key functions performed by the Board of Statutory Auditors acting as an audit committee as provided for by the SEC include:
●evaluating the offers submitted by external Auditors for their engagement and providing a reasoned recommendation to the Shareholders’ Meeting concerning the engagement or removal of the external Auditor;
●overseeing the work of the external Auditor engaged to audit the accounts or perform other audit, review or certification services;
●examining the periodical reports from the external auditor relating to: a) all critical accounting policies and practices to be used; b) all alternative treatments of financial information within generally accepted accounting principles that have been discussed with management officials of the Company, ramifications of the use of such alternative disclosures and treatments, and the treatment preferred by the external auditor; and c) other material written communication between the external auditor and management;
● making recommendations to the Board of Directors on the resolution of disagreements between management and the auditor regarding financial reporting.
In addition the Board of statutory auditor:
●approves the procedures for: a) the receipt, retention, and treatment of complaints received by the Company regarding accounting, internal accounting controls, or auditing matters; and b) the confidential, anonymous submission by employees of the Company of concerns regarding questionable accounting or auditing matters;
● examines reports from the CEO and the Head of Eni’s Accounting and Financial Statements department concerning: i) any significant deficiency in the design or operation of internal controls which are reasonably likely to adversely affect the Company’s ability to record, process, summarize and report financial information and any material weakness in internal controls; and ii) any fraud that involves management or other employees who have a significant role in the Company’s internal controls.
The Board of Statutory Auditors, in the performance of its duties, is supported by the Company’s departments, in particular the Internal Audit Department and the Administrative and Financial Statement Department.
231 Supervisory Body and Model 231
In accordance with the Italian regulations concerning the “administrative liability of legal entities deriving from criminal offences”, contained in Legislative Decree No. 231 of June 8, 2001 (henceforth, “Legislative Decree No. 231/2001”), legal entities, including corporations, may be held liable – and consequently fined or subject to prohibitions – in relation to certain crimes attempted or committed in Italy or abroad in the interest or for the benefit of the Company by individuals in high-ranking positions and/or persons managed or supervised by an individual in a high ranking position. The companies may, in any case, adopt organizational, management and control models designed to prevent these crimes. With respect to this issue, Eni Board of Directors – in its Meetings of December 15, 2003 and January 28, 2004 – approved an organizational, management and control model pursuant to Legislative Decree No. 231 of 2001 (Model 231) and created the 231 Supervisory Body. Moreover, as a result of changes in the Italian legislation governing the matter and in the Company’s organizational structure, on March 14, 2008, the Board of Directors updated Model 231 and adopted Eni’s Code of Ethics – replacing the previous version of the Eni Code of Conduct of 1998 – which represents a clear definition of the value system that Eni recognizes, accepts and upholds and the responsibilities that Eni assumes internally and externally in order to ensure that all business activities are conducted in compliance with laws, in a context of fair competition, with honesty, integrity, correctness and in good faith, respecting the legitimate interests of all stakeholders with which Eni interacts on an ongoing basis. These include shareholders, employees, suppliers, customers, commercial and financial partners, and the local communities and institutions of the countries where Eni operates. Since its first adoption, Model 231 has been updated very frequently, in most cases in response to new provisions of law coming into force as well as to organizational changes in the company’s structure. Most recently, the Board of Directors, in its meeting of November 18, 2021 approved the updating of Model 231.
Furthermore, the Board of Directors, in its meeting of March 18, 2020, approved the new version of Eni’s Code of Ethics; the new Code sets out the fundamental principles of Eni’s Model 231 which is one of the pillars of Eni “regulatory system” and inspires it.
At present, the 231 Supervisory Body is composed of three external members, one of which with the role of Chairman as well as by the Chairman of the Board of Statutory Auditors and the Director of Internal Audit, as internal members. External members are independent professionals, experts in law and/or economic matters.
Audit Firm
The auditing of the Company’s accounts is entrusted, in accordance with the law, to an independent Audit Firm appointed by the Shareholders’ Meeting on the basis of a reasoned recommendation of the Board of Statutory Auditors.
In addition to the obligations set forth in national auditing regulations, Eni’s listing on the New York Stock Exchange requires that the Audit Firm issues a report on the Annual Report on Form 20-F, in compliance with the auditing principles generally accepted in the United States. Moreover, the Audit Firm is required to issue an opinion on the efficacy of the internal control system applied to financial reporting. The financial statements of Eni’s subsidiaries generally are subject to auditing by Eni’s Audit Firm. Acting on the Board of Statutory Auditors’ reasoned proposal, the Shareholders’ Meeting of May 10, 2018 approved the engagement of PricewaterhouseCoopers SpA to perform the external statutory audit of the accounts of the Company and the audit of the internal control system over financial reporting, pursuant to U.S. law, for the period 2019 – 2027.
Court of Auditors (Corte dei Conti)
The financial management of Eni is subject to the control of the Italian Court of Auditors in order to preserve the integrity of the public finances. This task has been carried out by the Magistrate of the Court of Auditors, Manuela Arrigucci, on the basis of the resolution approved in December 18-19, 2018, by the Presidential Council of the Court of Auditors.
The Magistrate of the Court of Auditors attends the meetings of the Board of Directors and of the Board of Statutory Auditors.
As of December 31, 2022, Eni had a total of 32,188 employees, with a decrease of 501 employees (1.5% compared to December 31, 2021), which mainly reflects a decrease of 157 employees working in Italy and 344 employees working abroad.
This reduction is mainly caused by the extraordinary M&A operations: deconsolidation of Eni Angola (business combination with bp) and divestiture of Eni Pakistan, partially compensated by the acquisition of some Saipem engineering activities and subsidiaries engaged in renewable activities by Plenitude in Italy.
|
Employees at year end |
|||||||||||||
|
2022 |
2021 |
2020 |
|||||||||||
|
(number) |
|||||||||||||
|
Exploration & Production |
8,689 |
9,409 |
9,815 |
||||||||||
|
Global Gas & LNG Portfolio |
870 |
847 |
700 |
||||||||||
|
Refining & Marketing and Chemicals |
13,132 |
13,072 |
11,471 |
||||||||||
|
Plenitude & Power |
2,794 |
2,464 |
2,092 |
||||||||||
|
Corporate and Other activities |
6,703 |
6,897 |
7,417 |
||||||||||
|
32,188 |
32,689 |
31,495 |
|||||||||||
The table below sets forth Eni’s employees as of December 31, 2020, 2021 and 2022 in Italy and outside Italy:
|
Employees Italy and outside Italy |
||||||
|
2022 |
2021 |
2020 |
||||
|
(number) |
||||||
|
Exploration & Production |
Italy |
3,192 |
3,364 |
3,692 |
||
|
Outside Italy |
5,497 |
6,045 |
6,123 |
|||
|
8,689 |
9,409 |
9,815 |
||||
|
Global Gas & LNG Portfolio |
Italy |
282 |
276 |
290 |
||
|
Outside Italy |
588 |
571 |
410 |
|||
|
870 |
847 |
700 |
||||
|
Refining & Marketing and Chemicals |
Italy |
8,986 |
9,028 |
8,915 |
||
|
Outside Italy |
4,146 |
4,044 |
2,556 |
|||
|
13,132 |
13,072 |
11,471 |
||||
|
Plenitude & Power |
Italy |
2,096 |
1,864 |
1,679 |
||
|
Outside Italy |
698 |
600 |
413 |
|||
|
2,794 |
2,464 |
2,092 |
||||
|
Corporate and other activities |
Italy |
6,322 |
6,503 |
6,999 |
||
|
Outside Italy |
381 |
394 |
418 |
|||
|
6,703 |
6,897 |
7,417 |
||||
|
Total |
Italy |
20,878 |
21,035 |
21,575 |
||
|
Outside Italy |
11,310 |
11,654 |
9,920 |
|||
|
32,188 |
32,689 |
31,495 |
||||
|
of which senior managers |
966 |
984 |
1,010 |
|||
As of February 28, 2023, the cumulative number of shares owned by Eni’s Directors, Statutory Auditors and Senior Managers was 734,316 less than 0.1% of Eni’s share capital outstanding as of the same date. Eni issues only ordinary shares, each bearing the right to one-vote; therefore shares held by those persons have no different voting rights. The breakdown of share ownership for each of those persons is provided below.
|
Name |
Position |
Number of shares owned |
||
|
Board of Directors |
||||
|
Claudio Descalzi |
CEO |
266,077 |
||
|
Senior Managers |
468,239(1) |
|
(1) Of which No. 6,237 shares owned by spouses not legally separated and by underage children. |
|||
The Ministry of Economy and Finance controls Eni as a result of the shares directly owned and those indirectly owned through Cassa Depositi e Prestiti SpA (CDP), in which the Ministry of Economy and Finance holds a 82.77% stake.
As of February 28, 2023, the total amount of Eni’s voting securities owned, either directly or indirectly, by persons that have notified that their holding exceeds the threshold of 3%30 pursuant to Article 120 of the Legislative Decree No. 58/1998 and to the Consob Regulation No. 11971/1999 was:
|
Title of class |
|
Number of shares owned |
|
Percent of class |
|
Ministry of Economy and Finance |
|
157,552,137 |
|
4.41 |
|
Cassa Depositi e Prestiti SpA |
|
936,179,478 |
|
26.21 |
As of February 28, 2023, the percentage of Eni’s treasury shares was equal to 6.33% of the share capital31.
In relation to the Italian legislation governing the special powers of the Italian State see “Item 10 – Additional information – Limitations on changes in control of the Company (Special Powers of the Italian State)”.
As of March 10, 2023, there were 28,395,526 ADRs outstanding, each representing two Eni ordinary shares, corresponding to approximately 1.4% of Eni’s share capital. See “Item 9 – The offer and the listing”.
In the ordinary course of its business, Eni enters into transactions concerning the exchange of goods, provision of services and financing with associates, joint ventures, joint operations or other affiliates, as well as other companies owned or controlled by the Italian Government. All such transactions are conducted in the interest of Eni Group companies32.
Amounts and types of trade and financial transactions with related parties and their impact on consolidated earnings and cash flow, and on the Group’s assets and financial condition are reported in “Item 18 – Note 36 of the Notes on Consolidated Financial Statements”.
30 Major holdings pursuant to Article 120 of the Legislative Decree No. 58/1998 are updated also on the basis of communication made by intermediaries pursuant to Article 83-novies of the Legislative Decree No. 58/1998 in order to exercise the corporate rights.
31 Eni's Board of Directors approved the start of the buy-back program for 2022 in execution of the authorization granted by the Shareholders Meeting held on May 11, 2022. Purchases started on May 30, 2022 and terminated on November 29, 2022. Following the purchases made until the termination of the buy-back programme for the year 2022, considering the treasury shares already held and the assignment of ordinary shares to Eni’s directors, following the conclusion of the Vesting Period as provided by the “Long-Term Incentive Plan 2017-2019” approved by Eni’s Meeting of shareholders of 13 April 2017, Eni holds n. 226,097,834 shares equal to 6.33% of the share capital.
32 For more details on internal rules on related parties transactions, please refer to Item 10, paragraph “Interests in Company’s transactions”.
See “Item 18 – Financial Statements”.
Legal proceedings
Eni is a party in a number of civil actions and administrative arbitral and other judicial proceedings arising in the ordinary course of business. Based on information available to date, and taking into account the existing risk provisions disclosed in Note 21 – Provisions, and that in some instances it is not possible to make a reliable estimate of contingency losses, Eni believes that these legal proceedings will likely not have a material adverse effect on the Group Consolidated Financial Statements.
A description of the most significant proceedings currently pending is provided in “Item 18 – Note 28 to the Consolidated Financial Statements”. Generally, and unless otherwise indicated, these legal proceedings have not been provisioned because Eni believes a negative outcome to be unlikely or because the amount of the provision cannot be estimated reliably.
Dividends and remuneration policy
Management is committed to delivering on a competitive and progressive shareholder remuneration policy, that is reflective of growth in underlying earnings, the level of cash flow from operations and other financial parameters, and the evolution in the crude oil prices scenario and other market variables. Going forward, Eni intends to distribute between 25%-30% of annual cash flow from operations by way of a combination of dividends and share buybacks. In case the scenario evolves better than management assumptions, the Company expects to direct 35% of the incremental cash flow from operations to enhanced shareholders distributions, in case of a downside scenario, the management intends to use the flexibility of the balance sheet and of the capital expenditures plan.
For 2023, having assessed the progress of the Company in executing its strategy, a solid financial position and a supportive outlook for crude oil prices, Eni is planning to distribute to shareholders a yearly total dividend to €0.94 per share up from €0.88 relating to fiscal year 2022. The 2023 dividend will be distributed out of distributable capital reserves of the parent company. This dividend is expected to be paid in four quarterly instalments of about equal amount in September 2023, November 2023, March 2024 and May 2024. Furthermore, consistently with its remuneration policy Eni will also activate a share buyback program of €2.2 billion, subject to shareholders’ approval at the Annual General Meeting scheduled in May 2023. Further information on the dividend policy is provided in Item 5.
The Company’s dividend policy going forward and the sustainability of the dividends that the Company is planning to distribute over the next four years will depend upon a number of factors including hydrocarbons prices, achievement of the Company’s industrial targets, future levels of profitability and cash flow provided by operating activities, a sound balance sheet structure, capital expenditures and development plans, in light of the oil price and exchange rate assumptions adopted by management and other planning and scenario assumptions described in “Item 5 — Management’s expectations of operations”.
The expectations described above are subject to risks, uncertainties and assumptions associated with the oil&gas industry, and economic, monetary, and political developments in Italy and globally that are difficult to predict, including the possible outcomes associated with the conflict between Russia and Ukraine. For further details see “Item 3 — Risk factors”.
See “Item 5 – Recent developments and Management’s expectations of operations” for a discussion of significant subsequent business developments and transactions occurred after the closing date up to the latest practicable date.
The principal trading market for the ordinary shares of the Company, without indication of par value (the “Shares”), is the Euronext Milan (“EXM”). EXM, which is the principal trading market for shares in Italy, is a regulated market organized and managed by Borsa Italiana SpA (“Borsa Italiana”). Eni’s American Depositary Receipts (“ADRs, and each an “ADR”), each representing two Shares, are listed on the New York Stock Exchange.
Since June 27, 2017, Citibank N.A. (the “Depositary”) acts as the company’s depositary bank issuing ADRs pursuant to a deposit agreement (the “Deposit Agreement”) entered into among Eni, the Depositary, some beneficial owners (the “Beneficial Owners”) and registered holders from time to time of the ADRs issued hereunder.
As of February 28, 2023, there were 28,223,155 ADRs outstanding, representing 56,466,310 ordinary shares or approximately 1.4% of all Eni’s shares outstanding, held by 99 holders of record (including the Depository Trust Company) in the United States, 98 of which are U.S. residents. Since a number of ADRs are held by nominees, the number of holders may not be representative of the number of Beneficial Owners in the United States or elsewhere. The Shares are included in the FTSE MIB Index (the “FTSE MIB”), the primary benchmark index for the Italian Stock Exchange. Capturing approximately 80% of the domestic market capitalization, the FTSE MIB measures the performance of 40 highly liquid, leading companies across leading industries listed on EXM and the Euronext MIV Milan (“MIV”) and seeks to replicate the broad sector weights of the Italian Stock Exchange. The constituents of the FTSE MIB are selected based on market capitalization of free float shares and liquidity. The FTSE MIB is market cap-weighted after adjusting constituents for free float and foreign ownership limits. FTSE MIB is the principal indicator used to track the performance of the Italian Stock Exchange and is the basis for future and option contracts traded on the Italian Derivatives Market (“IDEM”) managed by Borsa Italiana. The Shares are a component of the FTSE MIB, with a weighting of approximately 8.0%, as established by FTSE Russel after the quarterly rebalancing for FTSE MIB effective December 16, 2022.
A two-day rolling cash settlement applies to all trades of equity securities on Borsa Italiana. Besides Shares traded on EXM, futures and options contracts on the Shares are traded on IDEM and securitized derivatives based on the Shares are traded on the multilateral trading facility of securitised derivatives financial instruments, organised and managed by Borsa Italiana (“SeDeX”). IDEM facilitates the trading of futures and options contracts on index and shares issued by companies that meet certain required capitalization and liquidity thresholds. SeDeX is the Borsa Italiana electronic multilateral trading facility where it is possible to trade securitized derivatives (for instance, covered warrants and certificates).
Borsa Italiana disseminates daily market data and news for each listed security, including volume traded and high and low prices. At the end of each trading day an “official price”, calculated as the weighted average price of the total volume of each security traded in the market during the session without taking into account the contracts concluded with cross trades, and a “reference price”, calculated as the closing auction price, are reported by Borsa Italiana. For the purposes of the automatic control of the regularity of trading on EXM, the following price variation limits shall apply to contracts concluded on shares making up the FTSE MIB, effective January 31, 2023: (i) ± 5.0% (or such other amount established by Borsa Italiana in the “Guide to the Parameters” for trading on the regulated markets organized and managed by Borsa Italiana) with respect to the static price (the static price being the previous day’s reference price, in the opening auction or the price at which contracts are concluded in the auction phase after each auction phase; if no auction price is determined, the static price is equal to the price of the first contract concluded in the continuous trading phase); and (ii) ± 3.5% (or such other amount established by Borsa Italiana in the “Guide to the Parameters”) with respect to the dynamic price (the price of the last contract concluded during the continuous trading phase). Where the price of a contract that is being concluded exceeds one of the price variation limits referred to above, trading in that security will be automatically suspended and a volatility auction phase begun for a certain period of time.
Consob is the public authority responsible for regulating and supervising the Italian financial markets to, inter alia, ensure the transparency and regularity of the dealings and protect the investing public. Borsa Italiana, which is part of Euronext, following the acquisition effective April 29, 2021, is a joint stock company authorized by Consob to operate, among the others, regulated markets in Italy. It is responsible for the organization and management of the Italian Stock Exchange. One of the fundamental characteristics of the financial market organization in Italy is the separation of the supervisory tasks (to be performed by Consob and the Bank of Italy) from the tasks relating to market management (to be performed by Borsa Italiana). The main responsibilities of Borsa Italiana are the admission, exclusion and suspension of financial instruments and intermediaries to and from trading as well as the surveillance of the markets.
According to Consob regulations, Borsa Italiana has issued rules governing the organization and management of the Italian Regulated Markets it is responsible for. Such regulated markets are, by way of example, EXM (shares, convertible bonds, pre-emptive rights, warrants), ETFplus (Exchange Traded Funds, Exchange Traded Commodities, Exchange Traded Notes, Structured ETFs and Actively managed ETFs), IDEM (futures and options contracts whose underlying assets are financial instruments, interest rates, foreign currencies, goods or related indexes), MOT (bond market) and MIV (market for investment vehicles), as well as the admission to listing on and trading on these markets.
According to the regulatory framework introduced by: (i) Markets in Financial Instruments Directive No. 2014/65/EU as amended from time to time (“MiFID II”) and as implemented in Italy, (ii) Regulation (EU) No. 600/2014 (“MiFIR”), applicable from January 3, 2018 as amended from time to time, as well as (iii) Consob regulations, orders can be routed not only to Regulated Markets but also to either Multilateral Trading Facilities (MTFs) or Systematic Internalisers. A MTF is a multilateral system, operated by an investment firm or a market operator, which brings together multiple third-party buying and selling interests in financial instruments — in the system and in accordance with non-discretionary rules — in a way that results in a contract. A Systematic Internaliser is an investment firm which, on an organized, frequent, systematic and substantial basis, deals on own account when executing client orders outside a Regulated Market, an MTF or an Organized Trading Facility (“OTF”) without operating a multilateral system. Following the transposition in Italy of MiFID II and the application of MiFIR, OTFs are now included among the “trading venues” that are subject to regulation.
An OTF is a multilateral system which is not a Regulated Market or an MTF and in which multiple third-party buying and selling interests in bonds, structured finance products, emission allowances or derivatives are able to interact in the system in a way that results in a contract.
According to Italian Legislative Decree No. 58 of February 24, 1998, as amended from time to time (“Decree No. 58”, the Consolidated Law on Financial Intermediation), the provision of investment services and activities to the public on a professional basis is, inter alia, reserved to investment firms, EU investment companies, Italian banks, EU banks and companies of non-EU countries authorized to operate in Italy (“Authorized Persons”). The Bank of Italy and Consob shall exercise supervisory powers over authorized persons. They shall each supervise the observance of regulatory and legislative provisions according to their respective responsibilities. In particular, in connection with the pursuance of the safeguarding of faith in the financial system, the protection of investors, the stability and correct operation of the financial system, the competitiveness of the financial system and the observance of financial provisions, the Bank of Italy shall be responsible for risk containment, asset stability and the sound and prudent management of intermediaries whilst Consob shall be responsible for the transparency and correctness of conduct. Besides, for the purposes of the application of certain provisions of MiFIR, the Bank of Italy and Consob are the Italian competent authorities. In particular, Consob, as far as the protection of the investors is concerned, is competent for the orderly functioning and soundness of the financial markets or of the commodity markets whereas the Bank of Italy is competent for the stability of the whole (or part of) the financial system.
The Bank of Italy and Consob also regulate the functioning of the clearing and settlement service for transactions involving financial instruments as well as the performance of central securities depository services, in line with the European framework — in particular, Regulation (EU) No. 648/2012 as amended by Regulation EU n. 2019/834, as amended from time to time, (“EMIR REFIT”) and the Regulation (EU) No. 909/2014, as amended from time to time, (“Central Securities Depositories Regulation”). The regulations and measures of general application adopted by Consob and the Bank of Italy are respectively available on the website of Consob or Bank of Italy.
The regulations adopted by Borsa Italiana are available on its website.
Company register
“Eni SpA” is the company resulting from the privatization of Ente Nazionale Idrocarburi, a public agency, established by Law No. 136 of February 10, 1953 and it is registered in the Rome Companies Register, with identification number (and tax number) 00484960588, and VAT number 00905811006. The Company’s registered office is in Rome, Italy, and the Company has two offices in San Donato Milanese (Milan).
The full text of Eni’s By-laws is attached as an exhibit to this Annual Report. On May 11, 2022 the Shareholders’ Meeting approved an amendment to the By-laws regarding the cancellation of 34,106,871 treasury shares with no par value without changing the amount of the share capital of the Company. See “Exhibit 1”.
Company objects and purpose
In accordance with Article 4 of Eni’s By-laws, the Company’s purpose includes the direct and/or indirect exercise, through equity holdings in companies or other entities of: activities in the field of hydrocarbons and natural gases, in compliance with the terms of concessions provided for by law; activities in the field of chemicals, nuclear fuels, geothermal energy, renewable energy sources and energy in general, in the design and construction of industrial plants, in the mining industry, in the metallurgy industry, in the textile machinery industry, in the water sector, including water diversion, potabilization, purification, distribution and reuse; in the environmental protection sector and in the treatment and disposal of waste, as well as any other economic activity that is instrumental, ancillary or complementary to the aforementioned activities. The Company performs and manages the technical and financial coordination of subsidiaries and associated companies and provides financial assistance to them. Moreover, the Company may acquire equity holdings and interests in other companies or enterprises with corporate purposes that are similar, related or complementary to its own or those of companies in which it has equity holdings, either in Italy or abroad, and it may provide secured and/or unsecured guarantees for its own and others’ obligations, including, in particular, sureties.
Directors’ issues
Eni’s Board of Directors is invested with the fullest powers for the ordinary and extraordinary management of the Company and, in particular, the Board has the power to perform all acts it deems advisable for the implementation and achievement of the corporate purpose, with the sole exception of acts that the law or Eni’s By-laws reserve to the Shareholders’ Meeting. If the Shareholders’ Meeting has not appointed a Chairman of the Board, the Board shall elect one from among its members.
The Board of Directors appoints a Chief Executive Officer and delegates to him all necessary powers for the management of the Company, with the exception of those powers that cannot be delegated in accordance with current legislation and those retained exclusively by the Board of Directors on matters regarding major strategic, operational and organizational decisions. According to Eni’s By-laws, the Board of Directors may delegate powers to the Chairman to identify and promote integrated projects and international agreements of strategic importance.
The Board of Directors may at any time revoke the powers delegated, proceeding, in the case of revocation of the powers delegated to the Chief Executive Officer, to appoint another Chief Executive Officer at the same time.
The Board of Directors, acting upon a proposal of the Chairman and in agreement with the Chief Executive Officer, may confer powers for individual acts or categories of acts on other members of the Board of Directors.
In accordance with Eni’s By-laws, for a Board meeting to be valid, a majority of serving Directors must be present. Resolutions shall be approved by a majority of the votes of the Directors present; in the event of a tie, the person who chairs the meeting shall have a casting vote.
For further information on Directors’ duties and responsibilities and, in particular, the role of the Chairman see “Item 6 — Board of Directors’ duties and responsibilities”.
Interests in Company’s transactions
As provided by the Italian Civil Code, when a Director retains a personal interest or an interest on behalf of third parties in Company transactions, he shall disclose it to the Board of Directors and to the Board of Statutory Auditors, specifying the nature, terms, origin and extent of such interest. Based on this provision and in compliance with the Consob (“Commissione Nazionale per le Società e la Borsa” is the public authority responsible for regulating the Italian financial markets) regulation on transactions with related parties (the “Consob Regulation”), the Board of Directors — on November 18, 2010 — unanimously approved the Management System Guidelines “Transactions involving interests of Directors and Statutory Auditors and transactions with related parties” (“MSG”), which has been in effect from January 1, 201133 to ensure the transparency and substantial and procedural fairness of transactions with related parties and with parties that are of interest to Eni’s Directors and Statutory Auditors, carried out by Eni itself or its subsidiaries. This MSG and the subsequent amendments, lastly approved by the Board of Directors on May 27, 2021, received the preliminary favorable opinion, expressed unanimously, of the Control and Risk Committee, composed entirely of independent Directors as per the requirements set out in the Corporate Governance Code, which Eni has adopted, and in accordance with the Consob Regulation. The MSG sets out monitoring and evaluation requirements for the preliminary phase and for carrying out a transaction with a party in which a Director or Statutory Auditor has an interest. In this regard, both in the preliminary and deliberation phase, a thorough, documented examination of the reasons for the transaction, highlighting the Company’s interest in carrying it out and the soundness and fairness of the underlying terms, is required. Directors involved in matters subject to Board resolution normally shall not participate in the relevant discussion and decision and shall leave the room during these procedures. If the person involved is the Chief Executive Officer and the transaction falls under his duties, he shall in any case abstain from taking part in the transaction and shall entrust the matter to the Board of Directors (as provided by Article 2391 of the Italian Civil Code). In any case, if the transaction is under the responsibility of the Board of Directors of Eni, a non-binding opinion from the Control and Risk Committee is required.
Moreover, to ensure compliance with the procedures envisaged by the above mentioned MSG, Directors and Statutory Auditors issue a declaration, every six months and/or when there is any change, in which they state their potential interests related to Eni and its subsidiaries. In any case the Directors and the Statutory Auditors report in good time the single transactions that Eni intends to carry out in which they have an interest. Directors report the interest to the Chief Executive officer (or the Chairman, in the case of interests of the Chief Executive Officer), who will in turn notify the other Directors and the Board of Statutory Auditors. Statutory Auditors report the interest to the other Statutory Auditors and the Chairman of the Eni SpA Board of Directors.
Compensation
Directors’ compensation shall be determined by the Shareholders’ Meeting, as required by Italian law, while the compensation of Directors with delegated powers in accordance with the By-laws (such as the Board Chairwoman and the CEO), or that participate in Board Committees, shall be determined by the Board of Directors, upon the proposal of the Remuneration Committee, after examining the opinion of the Board of Statutory Auditors (for more details about the compensation policy in 2021, see the Remuneration Report 2022 incorporated herein by reference).
Borrowing powers
The power to borrow is included in the Company purpose. Moreover, in accordance with Article 11 of the By-laws, the Company may issue bonds, including convertibles bonds and warrants, in compliance with the law.
Retirement and shareholdings
There are no provisions in the By-laws relating to either retirement based on age-limit requirements and the number of shares required for a Director to qualify.
33 This MSG replaced the previous regulation issued by the Board of Directors on the matter on February 12, 2009. The provisions regarding information to be provided to the public, under both the Consob Regulation and the MSG, have been applied since December 1, 2010.
Company’s shares
In accordance with Article 5 of the By-laws, the Company’s share capital amounts to €4,005,358,876.00, fully paid, and is represented by 3,571,487,97734 ordinary registered shares without indication of par value. As required by the Italian law on the dematerialization of financial instruments, Eni’s shares (the “Shares”) must be held with “Monte Titoli SpA” (the Italian Central Securities Depository) and their beneficial owners may exercise their rights through special deposit accounts opened with intermediaries, such as banks, brokers and securities dealers. Shares are indivisible and each share is entitled to one vote. Shareholders are allowed to vote at ordinary and extraordinary Shareholders’ Meeting, including by proxy or by mail or, if envisaged in the notice calling the Meeting, by electronic means. Moreover, in accordance with Article 9 of the By-laws, the Shareholders’ Meeting may resolve to increase the Company share capital by issuing shares, including shares of different classes, to be granted for no consideration to Eni employees, pursuant to Article 2349 of the Italian Civil Code. This power has not been exercised.
In 1995, Eni established a sponsored American Depositary Receipts program directed at U.S. investors. Each Eni ADR is equal to two Eni ordinary shares; Eni ADRs are listed on the NYSE.
Dividend rights
Shareholders have the right to participate in profits and any other rights as provided by the law and subject to any applicable legal limitations. Specifically, the ordinary Shareholders’ Meeting called to approve the annual Financial Statements may allocate the net income resulting after allotment to the legal reserve to the payment of a final dividend per share. In addition, during the course of the financial year, the Board of Directors may distribute, as allowed by the By-laws, interim dividends to the shareholders. Entitlement to dividends not collected within five years of the day on which they become payable shall lapse in favor of the Company and such dividends shall be allocated to reserves.
Voting rights
The general provisions on share “voting rights” are described at the paragraph “Shareholders’ Meeting” below. In relation to the appointment of the Board of Directors (Eni’s Board is not a “staggered board”) and the Board of Statutory Auditors (see “Item 6”), Eni’s By-laws provide for a slate voting system. In particular, pursuant to Article 17 of the By-laws and in accordance with applicable law, slates may be presented both by shareholders, either severally or jointly, representing at least 1% of the share capital, or any other threshold established by Consob in its regulation (lastly, on January 30, 2023, Consob confirmed a threshold of 0.5% for Eni, given its market capitalization), or by the Board of Directors. Each shareholder may, severally or jointly, submit and vote for a single slate only. There are no provisions in Eni’s By-laws relating to: rights to share in Company profits; redemption provisions; sinking fund provisions; liability to further capital calls by the Company.
Liquidation rights
In the event the Company is wound up, the Shareholders’ Meeting shall decide the manner of its liquidation and appoint one or more liquidators, establishing their powers and remuneration. In accordance with Italian law, shareholders would be entitled to the distribution of the remaining liquidated assets of the Company in proportion to their shareholdings, only after payment of all the Company’s liabilities and satisfaction of all other creditors.
34 The Shareholders’ Meeting, held on May 11, 2022, has approved the proposal of cancellation of 34,106,871 treasury shares, without any impact on the Company’s share capital.
Change in shareholders’ rights
A shareholders’ resolution is required to make changes in shareholders’ rights. Italian law gives shareholders the right to withdraw in the event of an amendment of the provisions of the By-laws relating to, among other matters, voting and dividend rights, approved by resolution of the Shareholders’ Meeting with the attendance and decision making quorum established by law for extraordinary meetings.
Shareholders’ Meeting
The Shareholders’ Meeting resolves on the issues set forth by applicable law and Eni’s By-laws, in “ordinary” or “extraordinary” form. The ordinary and the extraordinary Shareholders’ Meetings are normally held after a single call, with the majorities required by law in this case. The Board of Directors may, if deemed necessary, establish that both the ordinary and the extraordinary Shareholders’ Meetings shall be held after more than one call; their resolutions at first, second or third call must be passed with the majorities required by law in each case. Shareholders’ Meetings shall normally be held at the Company’s registered office, unless otherwise decided by the Board of Directors, provided however they are held in Italy.
The Shareholders’ Meeting shall be called by way of a notice published on the Company website, as well as in accordance with the procedures specified in Consob regulations, by the statutory deadlines and in accordance with applicable law. The notice calling the meeting, the content of which is defined by the law and Eni’s By-laws, contains all the information for attending and voting at the meeting, including information on proxy voting and voting by mail (the information is also available on the Company’s website) and, if envisaged, it may include instructions for participating in the Shareholders’ Meeting by means of telecommunication systems, as well as exercising the right to vote by electronic means. The Board of Directors shall make a report on each of the items on the agenda available to the public at the Company’s registered office, on the Company’s website and by other means envisaged by Consob regulations by the same date of the publication of the notice calling the Shareholders’ Meeting for each of the items on the agenda. Specific legal provisions may require other terms of publication of the Board of Directors report (i.e. in case of extraordinary transactions). An ordinary Shareholders’ Meeting shall be called at least once a year, within 180 days of the end of the Company’s financial year (on December 31), to approve the financial statements, since the Company is required to draw up Consolidated Financial Statements.
The right to attend and cast a vote at the Shareholders’ Meeting shall be certified by a statement submitted by an authorized intermediary on the basis of its accounting records to the Company on behalf of the person entitled to vote. The statement shall be issued by the intermediary on the basis of the balances on the accounts recorded at the end of the seventh trading day prior to the date of the Shareholders’ Meeting. Credit and debit records entered on the authorized intermediaries’ accounts after this deadline shall not be considered for the purpose of determining entitlement to exercise voting rights at the Shareholders’ Meeting. The statement, issued by the authorized intermediary, must reach the Company by the end of the third trading day prior to the date of the Shareholders’ Meeting, or by any other deadline established by Consob regulations issued in agreement with the Bank of Italy. Shareholders shall nevertheless be entitled to attend the Meeting and cast a vote if the statements are received by the Company after the deadlines indicated above, provided they are received before the start of proceedings of the given call. For the purposes of these provisions, reference is made to the date of first call, provided that the dates of any subsequent calls are indicated in the notice calling the Meeting; otherwise, the date of each call is deemed the reference date.
Those persons who are entitled to vote may appoint a party to represent themselves at the Shareholders’ Meeting by means of a written proxy or in electronic form in the manner set forth by current law. Electronic notification of the proxy may be made through a special section of the Company website as indicated in the notice calling the Meeting. In order to simplify proxy voting by shareholders who are employees of the Company or of its subsidiaries and belong to shareholders’ associations that meet applicable statutory requirements, locations for communications and collection of proxies shall be made available in accordance with the terms and conditions agreed from time to time with the legal representatives of said associations.
The right to vote may also be exercised by mail in accordance with the applicable laws and regulations. If provided for in the notice calling the meeting, those persons entitled to vote may participate in the Shareholders’ Meeting by means of telecommunication systems and exercise their right to vote by electronic means in accordance with the provisions of the law, applicable regulations and the Shareholders’ Meeting Rules.
The Company may designate a person for each Shareholders’ Meeting to whom the shareholders may confer a proxy with voting instructions on all or some of the items on the agenda, as provided for by applicable laws and regulations, by the end of the second trading day preceding the date set for the Shareholders’ Meeting including for calls subsequent to the first. Such proxy shall not be valid for items in respect of which no voting instructions have been provided.
The Chairman of the meeting shall verify the validity of proxies and, in general, entitlement to participate in the Meeting.
The Shareholders’ Meetings are governed by the Shareholders’ Meeting Rules as approved by resolution of the ordinary Shareholders’ Meeting on December 4, 1998, in order to guarantee an efficient conduct of meetings and the right of each shareholder to express his or her opinion on the items on the agenda. The Shareholders' Meetings held on May 11, 2022 has approved an update of such Rules.
During Shareholders’ Meetings, the Board of Directors provides broad disclosure on items examined and shareholders can request information on issues in the agenda. Information is provided taking into account applicable rules on inside information.
In accordance with Article 106, paragraph 4, second sentence, of Decree Law no. 18 of March 17, 2020, ratified with amendments by Law No. 27 of April 24, 2020 containing “Measures to strengthen the National Health Service and provide economic support for families, workers and businesses connected with the COVID-19 epidemiological emergency”, and of Decree Law no. 228/2021, ratified with amendments by Law no. 15/2022, that extended the effectiveness of the above-mentioned measures also to the Shareholders’ Meeting to be held by July 31, 2022, the participation in the Shareholders’ Meeting of May 11, 2022 was permitted solely through the Shareholders’ representative designated by the Company pursuant to Article 135-undecies of Consolidated Law on Financial Intermediation. Decree Law no. 198/2022, ratified with amendments by Law no. 14/2023, extended the effectiveness of the above-mentioned measures to the Shareholders’ Meeting to be held by July 31, 2023.
Stock ownership limitation and voting rights restrictions
There are no limitations imposed by Italian law or by Eni’s By-laws on the rights of non-residents in Italy or foreign persons to hold shares or vote other than the limitations described below (which are equally applicable to both residents and non-residents of Italy). In accordance with Article 6 of the By-laws, and in application of the special rules pursuant to Article 335 of Decree Law No. 332 of May 31, 1994, ratified with amendments by Law No. 474 of July 30, 1994 (Law No. 474/1994), no shareholder may hold, in any capacity, directly or indirectly, more than 3% of the Company’s share capital. Any voting rights and any other non-financial rights attached to shares held in excess of the maximum limit indicated above may not be exercised and the voting rights of each shareholder to whom such limit applies shall be reduced in proportion, unless otherwise jointly specified in advance by the parties involved.
Pursuant to Article 32 of the By-laws and the above mentioned provision of law, shareholdings owned by the Ministry of the Economy and Finance, public entities or organizations controlled by them are exempt from this ban. Finally, this special rule provides that the clause regarding shareholding limits will lose effect if the limit is exceeded as a result of a take-over bid, provided that, as a result of the takeover, the bidder will own a shareholding of at least 75% of the share capital with the right to vote on resolutions concerning the appointment or dismissal of Directors.
Limitation on changes in control of the Company (Special Powers of the Italian State)
Decree Law No. 21 of March 15, 2012, ratified with amendments by Law No. 56 of May 11, 2012 (Law No. 56/2012), modified Italian legislation governing the special powers of the Italian State to comply with European rules.
35 This provision has been modified by the Decree Law No. 21 of March 15, 2012, ratified with amendments by Law No. 56 of May 11, 2012. For more details see the paragraph “Limitation on changes in control of the Company (Special Powers of the Italian State)” below.
The special powers apply to company assets in the following sectors: defense and national security; 5G technology; energy, transport and communications, as defined by the regulations which implement the relevant law.
With reference to the energy sector, taking into account the changes made by to Decree Law no. 21/2022, containing “Urgent measures to contrast the economic and humanitarian effects of the Ukrainian crisis”, ratified with amendments by Law No. 51/2022, the special powers include: a) veto power (or the power of imposing conditions or requirements) over certain transactions or resolutions involving strategic assets (identified by Decrees of the President of the Council of Ministers no. 179 and 180 of 2020) or companies that hold such assets; and b) power of attaching conditions or opposing the acquisition by an entity of shareholdings that determine the control of a company that holds, directly or indirectly, strategic assets and the acquisition, by an entity outside of the EU, of shareholdings in such company equal to at least 10% and the total value of the investment exceeds one million euros; there is also an obligation to notify acquisitions that result in the 15%, 20%, 25%, 50% thresholds being exceeded.
Companies that hold strategic assets or carry out activities of strategic importance, or entities that intend to acquire certain shareholdings in such companies, are required to notify the Prime Minister’s Office with a full disclosure of the resolution, act or transaction, or of the acquisition of the shareholdings. The notification obligation extends also to the incorporation of companies that carry out activities of strategic importance or hold strategic assets if one or more shareholders, external to the EU, hold a share of voting rights or capital equal to at least 10%.
With particular reference to the power referred to in letter b), until the notification and thereafter, up to the expiration of the term for the possible exercise of such power, the voting rights and any other non-financial right related to the significant shareholding may not be exercised.
In the case of non-fulfillment of imposed conditions, throughout the relevant period, the voting rights and any other non-financial right related to the significant shareholding may not be exercised. The resolutions adopted with the decisive vote of such shareholding, or otherwise the resolutions or acts adopted in breach or default of the imposed conditions are void. In addition, unless the fact constitutes a crime, failure to comply with imposed conditions entail for the purchaser a fine.
In case of opposition, the buyer may not exercise the voting rights and any other non-financial right related to the significant shareholding, which must be sold within a year. In case of non-compliance, at the request of the Government, the Court will order the sale of the significant shareholding. Shareholders’ Meeting resolutions adopted with the decisive vote of such participation shall be void.
The legislation provides for a general rule that the acquisition, for any reason, by an entity outside of the EU of stock in a company that holds strategic assets will be allowed on condition of reciprocity, in compliance with international agreements signed by Italy or the EU.
These powers are exercised exclusively on the basis of objective and non-discriminatory criteria.
Albeit with some amendments, the provisions regarding the stock ownership limitations and voting rights restrictions pursuant to Article 3 of Law No. 474/1994 are still in force.
In order to “promote privatization and the spread of investment in shares” of companies in which the Italian State has a significant shareholding, Article 1, paragraphs 381 to 384 of Law No. 266 of 2005 (2006 Financial Law) introduced the power to add provisions to the By-laws of privatized companies primarily controlled by the Italian State, like Eni, which allow shares or participating financial instruments to be issued that grant the special meeting of its holders the right to request that new shares, even at par value, or new financial instruments be issued to them with the right to vote in ordinary and extraordinary Shareholders’ Meetings. Making this amendment to the By-laws would lead to the shareholding limit referred to in Article 6.1 of the By-laws being removed. At the present time, however, Eni’s By-laws do not contain any such provisions.
Shareholder ownership thresholds
There are no By-law provisions governing the disclosure of the ownership threshold because the matter is regulated by Italian law. Pursuant to the Consolidated Law on Financial Intermediation36 and the Consob Regulation37, any direct or indirect holding in the voting shares of an Italian listed company in excess of 3%38, 5%, 10%, 15%, 20%, 25%, 30%, 50%, 66.6% and 90% must be notified to the investee company and to Consob. The same disclosure requirements refer to holdings that drop below one of the specified thresholds.
Such disclosures shall be made — using the forms contained in Annex 4A to the above Regulation — without delay and, in any case, within four trading days of the transaction, starting from the day on which the subject gains knowledge of the transaction that can lead to the obligation, regardless of the date of execution, or from the date on which the subject obliged to make the disclosure gains knowledge of the event that leads to changes in the share capital as contemplated in the Consob Regulation.
For the purpose of the above disclosure obligations, the Consob Regulation establishes investment calculation criteria39. The obligation to notify also applies to any direct or indirect holding owned through ADRs.
Specific disclosure requirements (with partially different thresholds) are connected to investments in financial instruments and for aggregate investments40.
Under the above mentioned Consolidated Law on Financial Intermediation, as amended by Decree Law No. 148/2017, in the case of the purchase of a stake in listed issuers equal or above the thresholds of 10%, 20% and 25% of the relevant share capital in listed companies, the investor shall state the objectives it intends to pursue in the following six months41. The declaration shall state under the responsibility of the declarant: a) the means of financing the acquisition; b) whether acting alone or in concert; c) whether it intends to stop or continue its purchases, and whether it intends to acquire control of the issuer or anyway have an influence on the management of the company and, in such cases, the strategy it intends to adopt and the transactions to be carried out; d) its intentions as to any agreements and shareholders’ agreements to which it is party; e) whether it intends to propose the integration or revocation of the issuer’s administrative or control bodies. Consob can identify, with its own regulation, the cases where the aforementioned declaration is not due, taking into account the characteristics of the entity making the declaration or of the company whose shares have been purchased.
The declaration shall be transmitted to the company whose shares have been purchased and to Consob and shall be subject to public disclosure in accordance with the terms and conditions established by Consob Regulation.
Voting rights attached to listed shares which have not been notified pursuant to the above mentioned disclosure requirements may not be exercised. Any resolution or act adopted in violation of such limitation, with the contribution of those undisclosed shares, could be voided if challenged in court, under the Italian Civil Code.
36 Legislative Decree No. 58 of February 24, 1998, with specific reference to Articles 120-122.
37 Article 117 of Consob Decision No. 11971/1999 and subsequent amendments.
38 If the company is not a SME (small or medium enterprise). Moreover, Consob may, by means of measures justified by the need to protect investors, as well as corporate control market and capital market efficiency and transparency, envisage — for a limited period of time — lower thresholds by its decree for companies with particularly extensive shareholding structure.
39 Article 118 of Consob Decision No. 11971/1999 and subsequent amendments.
40 Article 119 of Consob Decision No. 11971/1999 and subsequent amendments.
41 Consob may, with a provision reasoned by investor protection needs as well as efficiency and transparency of the corporate control market and of the capital market, introduce, for a limited period of time, in addition to the thresholds above indicated, a threshold of 5 percent for companies with a particularly widespread shareholder base.
According to the Italian Civil Code (Article 2359-bis), a subsidiary may acquire shares of the parent company only within the limits of distributable profits and available reserves as resulting from the last approved balance sheet. Only fully-paid shares can be purchased. The purchase must be approved by the Shareholders’ Meeting and, in any case, the nominal value of shares purchased may not exceed one-fifth of the capital of the parent company — if the latter is a listed company — taking into account for this purpose the shares held by the same parent company or its subsidiaries.
The Consolidated Law on Financial Intermediation provides rules governing cross-holdings. In particular, except for the cases contemplated by the above mentioned Article 2359-bis of the Italian Civil Code, in case of a reciprocal participation exceeding the limit of 3% of the shares, the company that exceeds the limit successively cannot exercise its right to vote relative to the shares held in excess of such threshold and must sell such shares within the following 12 months. In the event of failure to dispose of the shares by such time limit, the voting rights shall be suspended with respect to the entire shareholding. Where it is not possible to ascertain which of the two companies was the last to exceed the limit, the suspension of voting rights and the disposal requirement shall apply to both unless they have agreed otherwise. In the event of non-compliance, any resolution or act adopted with the contribution of the relevant shares may be challenged under the Italian Civil Code.
The above mentioned limit is increased to 5% (or to 10% if the issuer is a small or medium enterprise as per Article 1, letter w-quater.1 of the Consolidated Law on Financial Intermediation) if the threshold is exceeded by both companies subsequent to an agreement authorized in advance by the ordinary shareholders’ meetings of the companies concerned.
If a person holds an interest exceeding the aforementioned threshold of a listed company, such listed company or any person controlling such listed company may not acquire an interest exceeding such a limit in a listed company controlled by the former. In the event of non-compliance, the voting rights attached to the shares in excess of the limit specified shall be suspended. Where it is not possible to ascertain which of the two persons was the last to exceed the limit, the suspension shall apply to both unless they have agreed otherwise. In the event of non-compliance, any resolution or act adopted with the contribution of the relevant shares may be challenged under the Italian Civil Code.
The limitations described above are not applicable in the case of a takeover bid or exchange tender offer to acquire at least 60% of the ordinary shares of a listed company.
Under the Consolidated Law on Financial Intermediation, any agreement, in any form, regarding the exercise of voting rights in a listed company or in its parent company, must be, within five days of stipulation: (i) notified to Consob; (ii) published in abstract form, in the Italian daily press; (iii) filed with the Register of Companies in which the listed company is registered; and (iv) notified to the company with listed shares. In the event of non-compliance with these requirements, the agreements shall be null and void and the voting rights attached to the relevant shares may not be exercised and any resolution or act adopted with the contribution of such shares may be challenged under the Italian Civil Code.
The same provisions also apply to agreements, in any form, that: (a) create obligations of consultation prior to the exercise of voting rights in a listed company and in its controlling companies; (b) set limits on the transfer of the related shares or of other financial instruments that entitle holders to buy or subscribe them; (c) provide for the purchase of the shares or of the above mentioned financial instruments; (d) have as their object or effect the exercise, jointly or otherwise, of dominant influence on such companies; and (d-bis) which aim to encourage or frustrate a takeover bid or an exchange tender offer, including commitments relating to non-participation in a takeover bid.
Finally, pursuant to Law No. 287 of October 10, 1990, any merger or acquisition of (legal or factual) sole or joint control over a company or any change of control over a company is subject to the prior authorization by the Italian Antitrust Authority42 if the companies involved exceed given turnover thresholds. If the said merger, acquisition or change of control were to significantly affect competition, in particular because they create or strengthen a dominant position, the Italian Antitrust Authority can either prohibit the transaction or make it subject to remedies preventing a restriction of competition. Moreover, if the transaction or the companies involved exceed other quantitative or qualitative thresholds set by European or other jurisdictions’ legislations (e.g. other turnover thresholds or thresholds referred to transaction’s value, market shares of the parties or the potential competitiveness of the target), the transaction can also be subject to the prior authorization by competition authorities of such other jurisdictions. Finally, pursuant to new rules enacted in 2022, in some circumstances both the Italian Antitrust Authority and the European Commission might require that specific mergers, acquisitions or changes of control be made subject to their approval, even if they are below said thresholds.
Changes in share capital
Eni’s By-laws do not provide for more stringent conditions than those required by law. Share capital increases are resolved by a shareholders’ resolution at an extraordinary Shareholders’ Meeting. Under Italian law, shareholders have a pre-emptive right to subscribe newly issued shares and corporate bonds convertible into shares in proportion to their respective shareholdings. If the Company’s interest so requires, the pre-emptive right may be waived or limited by the shareholders’ resolution authorizing the share capital increase. The shareholders’ pre-emptive right is also waived if the shareholders’ resolution authorizing the share capital increase provides for the subscription of new issues of shares in the form of contributions in-kind.
None.
Under current Italian exchange control regulations, no limits exist on the amount of payments that Eni may remit to residents of the United States. Laws and regulations concerning foreign exchange controls do require, however, that an accredited intermediary must handle all payments or transfer of funds made by an Italian resident to a non-resident.
The information set forth below is only a summary; Italian, the United States and other tax laws may change from time to time. Holders of shares and ADRs should consult with their professional advisors as to the tax consequences of their ownership and disposition of the shares and ADRs, including, in particular, the effect of tax laws of any other jurisdiction.
Italian taxation
The following is a summary of the material Italian tax consequences of the ownership and disposition of shares or ADRs as at the date hereof and does not purport to be a complete analysis of all potential tax effects relevant to the ownership or disposition of shares or ADRs.
42 Autorità garante della concorrenza e del mercato (AGCM).
Income tax
Dividends regarding income of financial year 2022 to be paid in 2023, received by Italian resident individuals, holding the shares or ADRs in connection with entrepreneurial activity, are included in the taxable income subject to personal income tax to the extent of 58.14% of their amount. Personal income tax applies at progressive rates ranging from 23% to 43% plus local surtaxes. Dividends received by Italian resident individuals holding the shares or ADRs otherwise than in connection with entrepreneurial activity, are subject to a substitute tax of 26% withheld at the source by the dividend paying agent. This being the case, the dividend is not to be included in the individual’s tax return.
Dividends received by Italian investment funds and società di investimento a capitale variabile (“SICAV”) are not subject to substitute tax but are included in the aggregate income of the investment fund or SICAV. The investment fund or SICAV will not be subject to tax on the dividends. A withholding tax of 26% may apply on income of the investment fund or SICAV derived by unitholders or shareholders through distribution and/or upon redemption or disposal of the units and shares.
Dividends received by real estate funds to which the provisions of Law Decree No. 351 of September 25, 2001, as subsequently amended, apply, are not subject to any substitute tax nor to any other income tax in the hands of the fund. The income of the real estate fund is subject to tax, in the hands of the unitholder, depending on status and percentage of participation, or, when earned by the fund, through distribution and/or upon redemption or disposal of the units.
Dividends received by a pension fund (subject to the regime provided for by Article 17 of the Italian Legislative Decree No. 252 of December 5, 2005) and deposited with an authorized intermediary, will not be subject to substitute tax, but must be included in the result of the relevant portfolio accrued at the end of the tax period, to be subject to a 20% substitute tax.
Dividends paid to non-Italian residents are subject to substitute tax levied at source by the dividend paying agent at the rate of 26%, provided that the interest is not connected to an Italian permanent establishment.
The above-mentioned 26% substitute tax will not be applied in the event of dividends distributed in favor of foreign undertakings for collective investment which comply with European Directive 2009/65/EC of the European Parliament and of the Council of July 13, 2009 (UCITS Directive), and to undertakings for collective investment which do not comply with the aforesaid Directive 2009/65/EC, whose manager is subject to regulatory supervision in the foreign country in which it is established in accordance with European Directive 2011/61/EU of the European Parliament and of the Council of June 8, 2011 (AIFM Directive), established in an EU Member States or a European Economic Area (“EEA”) State included in the list of States and territories allowing an adequate exchange of information with the Italian tax authorities according to the Ministerial Decree of September 4, 1996 (“White List”).
Dividends are subject to a 1,20% substitute tax introduced by the Financial Bill for 2008 where the conditions in Article 27, paragraph 3-ter, Presidential Decree No. 600 of 1973 are met, i.e. dividends are paid to non-Italian companies and entities that are (i) resident in an EU Member State or EEA State included in the White List, and (ii) subject to a corporate income tax in their country of residence.
The substitute tax may also be reduced under the Tax Treaty in force between Italy and the country of residence of the Beneficial Owner of the dividend. Italy has executed income Tax Treaties with approximately 100 foreign countries, including all EU Member States, Argentina, Australia, Brazil, Canada, Japan, New Zealand, Norway, Switzerland, the United States and some countries in Africa, the Middle East and the Far East. Generally speaking, it should be noted that Tax Treaties are not applicable where the holder is a tax-exempt entity or, with few exceptions, a partnership or a trust.
In order to obtain the Treaty benefit of a reduced substitute tax rate at the same time of payment, the Beneficial Owner must file an application to the dividend paying agent chosen by the Depositary stating the existence of the conditions for the applicability of the Treaty benefit, together with a certification issued by the foreign tax authorities stating that the shareholder is a resident of that country for Treaty purposes.
Under the Tax Treaty between the United States and Italy (the “Italy U.S. Tax Treaty”), dividends derived and beneficially owned by a U.S. resident who holds less than 25% of the Company’s voting stock are subject to an Italian withholding or substitute tax at a reduced rate of 15%, provided that the interest is not effectively connected with a permanent establishment in Italy through which the U.S. resident carries on a business or a fixed base in Italy through which such U.S. resident performs independent personal services (for further details please refer to the relevant provisions set forth in the Italy U.S. Tax Treaty). In the absence of such conditions, the dividend paying agent will deduct from the gross amount of the dividend the substitute tax at the statutory rate of 26%. Based on the certification procedure required by the Italian Tax Authorities, to benefit from the direct application of the 15% substitute tax the U.S. shareholder must provide the dividend paying agent with a certificate obtained from the U.S. Internal Revenue Service (the “IRS”) with respect to each dividend payment. The request for this certificate must include a statement, signed under penalty of perjury, attesting that the shareholder is a U.S. resident individual or corporation, and does not maintain a permanent establishment in Italy, and must set forth other required information. The normal time for processing requests for certification by the IRS is normally about six to eight weeks.
Where the Beneficial Owner has not provided the above-mentioned documentation, the dividend paying agent will deduct from the gross amount of the dividend the substitute tax at the statutory rate of 26%. The U.S. recipient will then be entitled to claim from the Italian Tax Authorities the difference (treaty refund) between the domestic rate and the Treaty one by filing specific forms (certificate) with the Italian Tax Authorities.
As reflected in the Deposit Agreement, if any tax or other governmental charge shall become payable by or on behalf of the Custodian or the Depositary with respect to an ADR, any Deposited Securities represented by the American Depositary Shares (“ADSs”), such tax or other governmental charge shall be paid by the Holder hereof to the Depositary.
The Depositary may refuse to effect any registration, registration of transfer, split-up or combination hereof or any withdrawal of such Deposited Securities until such payment is made. The Depositary may also deduct from any distributions on or in respect of Deposited Securities, or may sell by public or private sale for the account of the Holder hereof any part or all of such Deposited Securities (after attempting by reasonable means to notify the Holder hereof prior to such sale), and may apply such deduction or the proceeds of any such sale in payment of such tax or other governmental charge, the Holder hereof remaining liable for any deficiency, and shall reduce the number of ADSs to reflect any such sales of shares. Pursuant to the Deposit Agreement, the Depositary and the Custodian may make and maintain arrangements to enable persons that are considered United States residents for purposes of applicable law to receive any tax rebates (pursuant to an applicable Treaty or otherwise) or other tax related benefits relating to distributions on the ADSs to which such persons are entitled. Notwithstanding any other terms of the Deposit Agreement or the ADR, absent the gross negligence or bad faith of, respectively, the Depositary and the Company, the Depositary and the Company assume no obligation, and shall not be subject to any liability, for the failure of any Holder or Beneficial Owner, or its agent or agents, to receive any tax benefit under applicable law or Tax Treaties. The Depositary shall not be liable for any acts or omissions of any other party in connection with any attempts to obtain any such benefit, and Holders and Beneficial Owners hereby agree that each of them shall be conclusively bound by any deadline established by the Depositary in connection therewith.
Capital gains tax
This paragraph concerns and applies to capital gains out of the scope of a business activity carried out in Italy. Profits gained by Italian resident individuals, not in connection with entrepreneurial activity, in financial year 2023, are subject to substitute tax for 26%. Two different systems may be applied at the option of the shareholder as an alternative to the so-called “tax return regime” (regime della dichiarazione – it is the default regime for taxation of capital gains, according to which capital gains are reported in the taxpayer's tax return and paid within the deadline for the payment of the balance income taxes due on the basis of the relevant tax return):
● the so-called “administered savings” tax regime (risparmio amministrato), based on which intermediaries acting as shares depositaries shall apply a substitute tax (26%) on each gain, on a cash basis. If the sale of shares generated a loss, said loss may be carried forward up to the fourth following year; and
● the so-called “portfolio management” tax regime (risparmio gestito) which is applicable when the shares form part of a portfolio managed by an Italian asset management company. The accrued net profit of the portfolio is subject to a 26% substitute tax to be applied by the portfolio.
Gains realized by non-residents from non-substantial interest in listed companies are deemed not to be realized in Italy and consequently are not subject to the capital gains tax. On the contrary, gains realized by non-residents from substantial interests even in listed companies are deemed to be realized in Italy and consequently are subject to the capital gains tax.
Gains realized by undertakings for collective investment which comply with European Directive 2009/65/EC of the European Parliament and of the Council of July, 13, 2009 (UCITS Directive), and by undertakings for collective investment, established in an EU Member States or a EEA State included in the White List, which do not comply with the aforesaid Directive 2009/65/EC, whose manager is subject to regulatory supervision in the foreign country in which it is established in accordance with European Directive 2011/61/EU of the European Parliament and of the Council of June 8, 2011 (AIFM Directive), will not be applied.
However, double taxation treaties may eliminate the capital gains tax. Under the Italy U.S. Tax Treaty, a U.S. resident will not be subject to the capital gains tax unless the shares or ADRs form part of the business property of a permanent establishment of the holder in Italy or pertain to a fixed establishment available to a shareholder in Italy for the purposes of performing independent personal services. U.S. residents who sell shares may be required to produce appropriate documentation establishing that the above mentioned-conditions of non taxability pursuant to the Italy U.S. Tax Treaty have been satisfied.
Financial Transactions Tax
Italian Law No. 228 of December 24, 2012 has introduced a Financial Transactions Tax which applies to the transfer of shares, ADR and other financial instruments issued by companies resident in Italy. The tax rate applicable is 0.10% for ADR negotiated in regulated markets (like the NYSE).
Non-Italian intermediaries, involved in the transactions of Eni ADR, must withhold and pay the Financial Transactions Tax. For this purpose, non-Italian intermediaries can appoint an Italian Tax Representative, according to the Italian tax law.
Inheritance and gift tax
Pursuant to Law Decree No. 262 of October 3, 2006, converted with amendments by Law No. 286 of November 24, 2006, effective from November 29, 2006, and Law No. 296 of December 27, 2006, the transfers of any valuable assets (including shares) as a result of death or donation (or other transfers for no consideration) and the creation of liens on such assets for a specific purpose are taxed as follows:
(a) 4 per cent: if the transfer is made to spouses and direct descendants or ancestors; in this case, the transfer is subject to tax on the value exceeding €1,000,000 (per beneficiary);
(b) 6 per cent: if the transfer if made to brothers and sisters; in this case, the transfer is subject to the tax on the value exceeding €100,000 (per beneficiary);
(c) 6 per cent: if the transfer is made to relatives up to the fourth degree, to persons related by direct affinity, as well as to persons related by collateral affinity up to the third degree; and
(d) 8 per cent: in all other cases.
If the transfer is made in favor of persons with severe disabilities, the tax applies on the value exceeding €1,500,000. Moreover, an anti-avoidance rule is provided for by Law No. 383 of October 18, 2001 for any gift of assets (including shares) which, if sold for consideration, would give rise to capital gains subject to a substitute tax (imposta sostitutiva) provided for by Decree No. 461 of November 21, 1997. In particular, if the donee sells the shares for consideration within five years from the receipt thereof as a gift, the donee is required to pay a relevant substitute tax on capital gains as if the gift had never taken place.
United States taxation
The following is a summary of certain U.S. federal income tax consequences to U.S. Holders (as defined below) of the ownership and disposition of Shares or ADSs. This summary is addressed to U.S. Holders that hold Shares or ADSs as capital assets, and does not discuss all material tax consequences of the ownership of Shares or ADSs, including tax consequences arising under the Medicare contribution tax on net investment income. The summary does not address special classes of investors, such as tax-exempt entities, dealers in securities, traders in securities that elect to mark-to-market, certain insurance companies, broker-dealers, investors liable for alternative minimum tax, investors that actually or constructively own 10% or more of the combined voting power of Eni SpA’s voting stock or of the total value of Eni SpA’s stock, a person that purchases or sells Shares or ADSs as part of a wash sale for U.S. federal income tax purposes, investors that hold Shares or ADSs as part of a straddle or a hedging or conversion transaction and investors whose “functional currency” is not the U.S. dollar.
This summary is based on the tax laws of the United States (including the Internal Revenue Code of 1986, as amended, (the “Code”), its legislative history, existing and proposed regulations thereunder, published rulings and court decisions) as in effect on the date hereof and the Italy U.S. Tax Treaty. These authorities are subject to change (or changes in interpretation), possibly with retroactive effect. The summary is based in part on representations of the Depositary and assumes that each obligation in the Deposit Agreement and any related agreement will be performed in accordance with its terms. U.S. Holders should consult their own tax advisors to determine the U.S. federal, state and local and foreign tax consequences to them of the ownership and disposition of Shares or ADSs.
If an entity or arrangement that is treated as a partnership for U.S. federal income tax purposes holds Shares or ADSs, the U.S. federal income tax treatment of a partner will generally depend on the status of the partner and the tax treatment of the partnership. A partner in a partnership holding Shares or ADSs should consult its tax advisor with regard to the U.S. federal income tax treatment of an investment in the Shares or ADSs.
As used in this section, the term “U.S. Holder” means a beneficial owner of Shares or ADSs that is:
(i) a citizen or resident of the United States; (ii) a domestic corporation; (iii) an estate the income of which is subject to the U.S. federal income tax without regard to its source; or (iv) a trust if a court within the United States is able to exercise primary supervision over the administration of the trust and one or more U.S. persons have the authority to control all substantial decisions of the trust.
The discussion does not address any aspects of U.S. taxation other than U.S. federal income taxation. In particular, U.S. Holders are urged to confirm their eligibility for benefits under the Italy U.S. Tax Treaty with their advisors and to discuss with their advisors any possible consequences of their failure to qualify for such benefits. In general, and taking into account the earlier assumptions, for U.S. federal income tax purposes, U.S. Holders who own ADRs evidencing ADSs will be treated as owners of the underlying Shares. Exchanges of Shares for ADRs and ADRs for Shares generally will not be subject to U.S. federal income tax.
Distributions
Subject to the passive foreign investment company (“PFIC”) rules discussed below, distributions paid on the Shares or ADSs will generally be treated as dividends for U.S. federal income tax purposes to the extent paid out of Eni SpA’s current or accumulated earnings and profits as determined for U.S. federal income tax purposes, but will not be eligible for the dividends-received deduction generally allowed to U.S. corporations. To the extent that a distribution exceeds Eni SpA’s earnings and profits, it will be treated, first, as a non-taxable return of capital to the extent of the U.S. Holder’s tax basis in the Shares or ADSs, and thereafter as capital gain. A U.S. Holder will be subject to U.S. federal taxation, on the date of actual or constructive receipt by the U.S. Holder (in the case of Shares) or by the Depositary (in the case of ADSs) with respect to the gross amount of any dividends, including any Italian tax withheld therefrom, without regard to whether any portion of such tax may be refunded to the U.S. Holder by the Italian Tax Authorities.
For non-corporate U.S. Holders, dividends that constitute qualified dividend income will be taxable at the preferential rates applicable to long-term capital gains provided that such person holds the Shares or ADSs for more than 60 days during the 121 day period beginning 60 days before the ex-dividend date and meet other holding period requirements. Dividends paid by Eni SpA that are received with respect to the ADSs will generally be qualified dividend income if the ADSs are readily tradable on an established securities market in the United States. Eni SpA’s ADSs are listed on the New York Stock Exchange and Eni SpA therefore expects that dividends with respect to the ADSs will be qualified dividend income. Dividends paid by Eni SpA with respect to the Shares will generally be qualified dividend income provided that, in the year that you receive the dividend, Eni SpA is eligible for the benefits of the Italy U.S. Tax Treaty. Eni SpA believes that it is currently eligible for the benefits of the Italy U.S. Tax Treaty and Eni SpA therefore expects that dividends on the Shares will also be qualified dividend income, but there can be no assurance that Eni SpA will continue to be eligible for the benefits of the Italy U.S. Tax Treaty.
The amount of the dividend distribution that must be included in the income of a U.S. Holder will be the U.S. dollar value of the euro payments made, determined at the spot EUR/USD rate on the date the dividend is distributed, regardless of whether the payment is in fact converted into U.S. dollars. Generally, any gain or loss resulting from currency exchange fluctuations during the period from the date the dividend is distributed to the date the U.S. Holder converts the payment into U.S. dollars will be treated as ordinary income or loss and will not be eligible for the special tax rate applicable to qualified dividend income. The gain or loss generally will be income or loss from sources within the United States for foreign tax credit limitation purposes.
Subject to certain conditions and limitations, Italian tax withheld from dividends will be treated as a foreign income tax eligible for credit against the U.S. Holder’s U.S. federal income tax liability. However, under recently finalized Treasury regulations, it is possible that taxes may not be creditable unless you are eligible for and elect to apply the benefits of the Italy U.S. Tax Treaty. Special rules apply in determining the foreign tax credit limitation with respect to dividends that are subject to the preferential rates. To the extent a reduction or refund of the tax withheld is available to a U.S. Holder under Italian law or under the Italy U.S. Tax Treaty, the amount of tax withheld that could have been reduced or that is refundable will not be eligible for credit against his or her U.S. federal income tax liability. See “Italian taxation — Income tax” above, for the procedures for obtaining a tax refund. For foreign tax credit purposes, dividends paid on the Shares or ADSs will generally be income from sources outside the United States and will, generally be “passive” income for purposes of computing the foreign tax credit allowable to you. However, if (a) Eni SpA is 50% or more owned, by vote or value, by United States persons and (b) at least 10% of Eni SpA’s earnings and profits are attributable to sources within the United States, then for foreign tax credit purposes, a portion of Eni SpA’s dividends would be treated as derived from sources within the United States. With respect to any dividend paid for any taxable year, the United States source ratio of Eni SpA’s dividends for foreign tax credit purposes would be equal to the portion of Eni SpA’s earnings and profits from sources within the United States for such taxable year, divided by the total amount of our earnings and profits for such taxable year. Eni SpA does not expect to be 50% or more owned, by vote or value, by United States persons, and therefore does not expect that any portion of Eni SpA’s dividends will be treated as derived from sources within the United States.
Sale or exchange of Shares
Subject to the PFIC rules discussed below, a U.S. Holder generally will recognize gain or loss for U.S. federal income tax purposes on the sale or exchange of Shares or ADSs equal to the difference between the U.S. Holder’s adjusted basis in the Shares or ADSs (determined in U.S. dollars), as the case may be, and the amount realized on the sale or exchange (or if the amount realized is denominated in a foreign currency its U.S. dollar equivalent). The amount realized will generally be reduced by any Italian Financial Transaction Tax paid in respect of such transfer, and a U.S. Holder will not be entitled to claim a foreign tax credit in respect of the payment of the Italian Financial Transaction Tax. Generally, such gain or loss will be treated as capital gain or loss if the Shares or ADSs are held as capital assets and will be a long-term capital gain or loss if the Shares or ADSs have been held for more than one year on the date of such sale or exchange. Long-term capital gain of a non-corporate U.S. Holder is generally taxed at preferential rates. In addition, any such gain or loss realized by a U.S. Holder generally will be treated as U.S. source income or loss for U.S. foreign tax credit purposes.
PFIC rules
Eni SpA believes that Shares and ADSs should not currently be treated as stock of a PFIC for U.S. federal income tax purposes and Eni SpA does not expect to become a PFIC in the foreseeable future. However, this conclusion is a factual determination that is made annually and thus may be subject to change. If Eni SpA were to be treated as a PFIC, gain realized on the sale or other disposition of your Shares or ADSs would in general not be treated as capital gain. Instead, unless a U.S. Holder elects to be taxed annually on a mark-to-market basis with respect to the Shares or ADSs, the U.S. Holder would be treated as having realized such gains and certain “excess distributions” ratably over the holding period for the Shares or ADSs and would be taxed at the highest tax rate in effect for each such year to which the gain or distribution was allocated, together with an interest charge in respect of the tax attributable to each such year. With certain exceptions, a U.S. Holder’s Shares or ADSs will be treated as stock in a PFIC if Eni SpA were a PFIC at any time during the period the Shares or ADSs were held. Dividends received from Eni SpA will not be eligible for the preferential tax rates applicable to qualified dividend income if Eni SpA is treated as a PFIC with respect to the U.S. Holders either in the taxable year of the distribution or the preceding taxable year, but instead will be taxable at rates applicable to ordinary income.
Eni’s Annual Report and Accounts and any other document concerning the Company are also available online on the Company’s website. The Company is subject to the information requirements of the Security Exchange Act of 1934 applicable to foreign private issuers. In accordance with these requirements, Eni files its Annual Report on Form 20-F and other related documents with the U.S. SEC. It’s possible to read and copy documents that have been filed with the U.S. via commercial document retrieval services, and from the SEC website (www.sec.gov).
Market risk is the possibility that the exposure to fluctuations in commodity prices, currency exchange rates, interest rates or other market benchmarks will adversely affect the value of the Group’s financial assets, liabilities or expected future cash flows. Eni’s financial performance is particularly sensitive to changes in the price of crude oil and movements in the EUR/USD exchange rate. Overall, a rise in the price of crude oil has a positive effect on Eni’s results from operations and liquidity due to increased revenues from oil&gas production. Conversely, a decline in crude oil prices reduces Eni’s results from operations and liquidity.
The impact of changes in crude oil prices on the Company’s refining and marketing and petrochemical businesses depends upon the speed at which the prices of finished products adjust to reflect changes in crude oil prices. In addition, the Group’s activities are, to various degrees, sensitive to fluctuations in the EUR/USD exchange rate as commodities are generally priced internationally in U.S. dollars or linked to dollar denominated products. Overall, an appreciation of the euro against the dollar reduces the Group’s results from operations and liquidity, and vice versa.
As part of its financing and cash management activities, the Company uses derivative instruments to manage its exposure to changes in interest rates and foreign exchange rates. These instruments are principally interest rate and currency swaps. The Company also enters into commodity derivatives as part of its ordinary commercial, optimization and risk management activities, as well as exceptionally to hedge the exposure to variability in future cash flows due to movements in commodity prices, in view of pursuing acquisitions of oil&gas reserves as part of the Company’s ordinary asset portfolio management or other strategic initiatives or in case of extraordinary market conditions.
The Company actively manages market risk in accordance with a set of policies and guidelines that provide a centralized model of undertaking finance, treasury and risk management operations based on the Company’s departments of operational finance: the parent company’s (Eni SpA) finance department and its subsidiaries Eni Finance International and Banque Eni, which is subject to certain bank regulatory restrictions preventing the Group’s exposure to concentrations of credit risk, and Eni Trade & Biofuels SpA and Eni Global Energy Markets (from January 1, 2021, together formerly Eni Trading & Shipping) that are in charge to execute certain activities relating to commodity derivatives. In particular, Eni SpA and Eni Finance International manage the Group subsidiaries’ financing requirements in Italy, outside Italy and in the United States, respectively, covering funding requirements and using available surpluses. All transactions concerning currencies and derivative contracts on interest rates and currencies are managed by the parent company. With respect to the commodity risk, Eni Trade & Biofuels and Eni Global Energy Markets centralize the negotiation of financial instruments on the markets.
In 2021, the above mentioned centralized model for the execution of financial instruments has been updated in light of the relevant changes in the main financial regulations (Mifid II/EMIR/Dodd Frank act). Eni’s activities comply with the regulatory requirements for the execution of financial instruments on European and non-European Regulated Markets, on Multilateral Trading Facilities, on Organized Trading Facilities or bilaterally with OTC counterparties.
In addition to the reinforcement of the centralized execution model, as required by the financial regulation, aur derivative transactions are classified and segregated in accordance with the EMIR requirements of “risk reducing” and “non-risk reducing” derivative contracts. The Company’s activities in financial instruments were thus classified in order to clearly: a) segregate ex ante non-risk reducing activities; b) define before inception the types of derivative contracts included in the hedging portfolios and the eligibility criteria, and stating that the derivative transactions included in the hedging portfolios are limited to covering risks directly related to commercial or treasury financing activities; and c) provide for a sufficiently disaggregated view of the hedging portfolios in terms of for example asset classes, products and time horizons, in order to establish the direct link between the portfolio of hedging transactions and the risks that this portfolio seeks to hedge. A financial instrument can be qualified as risk reducing when, by itself or in combination with other derivative contracts (so-called macro or portfolio hedging) it:
| (i) | directly or through closely correlated instruments (so-called proxy hedging) covers the risks arising from potential changes in the value of different assets under Eni control or that Eni will have under its control in the normal course of business driven by fluctuation of interest rates, inflation rates, foreign exchange rates or credit risk; or | |
| (ii) | qualifies as a hedge pursuant to IFRS. |
Use of financial instruments (in euro or currencies different from euro) is allowed with the following risk reducing purposes:
| • |
Back-to-back: includes market risk-free instruments that are negotiated in accordance with an execution criteria and normally settled with an intermediation fee. They normally comply with hedge accounting requirements or own use exemption. These are transaction-based activities characterized by a substantial absence of market risk. A hedging instrument can be considered back to back when the financial derivative is structured as to match as much as possible asset class, size and maturity of the hedged position. As a result, the combination of the hedged item, normally a single asset/contract, and the hedging instrument, i.e. the financial derivative, is substantially market risk free or is exposed only to a basic risk related to the ineffective portion of the hedging item. In addition, the hedging item may entail counterparty risk and operational risk. These derivatives are normally accounted for as hedges for financial statement purposes. |
| • |
Flow hedging: flow hedging seeks to optimize Group hedging requirements by pooling different positions retained by the business units and then by entering derivative instruments to hedge net exposures, according to a portfolio basis. A central department processes a continuous flow of orders from the Group’s various business units and then acts as a single broker on financial markets. Flow hedging is characterized by the lack of direct control by the central broker entity on the received orders, which are normally related to assets managed by the business units. The central broker entity can normally rely on a continuous flow of hedging orders that can be predictable to a large extent, on the basis of the regular hedging programs made by the Group’s business units. The central entity is therefore in the position to net opposite orders, by retaining the level of risk necessary to cover timing, volume and asset class mismatch among orders. The benefits are the maximization of integration across the whole of the Group assets portfolio and the related netting potential, avoiding unnecessary derivatives, thus reducing costs and aggregated notional amounts of hedging programs. Flow hedging is managed on a portfolio basis and is dynamic by nature, since resulting net position is normally adjusted in order to take into account new orders received and maximum allowed exposure, related to timing, volume and asset classes mismatch. Those derivatives are recorded in profit and loss as the hedging of net exposures does not qualify as hedges under IFRS . |
| • |
Asset-backed hedging: is a portfolio-based activity performed to enhance assets extrinsic value which is the fair value that a third party would potentially pay to buy the flexibility associated with assets available to the Group. It is normally characterized by a maximum level of market risk related to the size of managed assets and the volatility of underlying commodities. The more flexible the asset, the higher its extrinsic value that can be normally quantified as an option premium, linked to the price of an underlying commodity, volatility, time, interest rate. To enhance the value of asset flexibility, a business unit may transfer to a central entity part or the whole of an asset flexibility or a portfolio of flexibilities and the central entity will hedge such flexibility on financial markets so to lock its value by monetizing it via derivatives. Hedging strategies adopted for asset-backed hedging are normally portfolio based, very dynamic and entail large use of proxies. Depending on the optimization model such strategies are continuously adjusting relevant hedging ratios buying and selling the same financial products several times, since the underlying asset flexibility to be hedged is changing depending on price level, price volatility, time to delivery, etc. These derivatives may lead to gains as well as losses which in each case may be significant and are accounted through profit and loss as they lack the hedge requirements provided by IFRS. However, we believe that the risks associated with those derivatives are mitigated by the natural hedge granted by the asset availability. |
| • |
Portfolio management: is a portfolio based activity performed on a combination of underlying positions, such as physical assets (production plants, transmission infrastructures, storages, etc.), commercial assets (spot and forward short/medium/long term supply and sale contracts with physical delivery) and related financial derivatives. Normally, the target of a portfolio management activity is to optimize managed assets’ base by running quantitative models which, given production/consumption forecasts, price scenarios and logistic flexibility/constraints, determine the optimal configuration in terms of volume, price and flexibility for physical and commercial assets in the portfolio. Financial derivatives are then used in the portfolio management activity in order to manage the overall risk level associated with such optimal configuration within a set tolerance or to balance the combined risk-reward profile of the portfolio in line with the Company’s targets. Market risk associated with portfolio management is proportional to assets size and maturity and volatility/correlation of underlying markets. Financial derivatives are normally used to hedge the resulting net position, but they might hedge also single physical/commercial assets included in the portfolio. The activity is dynamic by nature, since optimization models are run periodically, even on a daily and infra-daily timescale, in order to rebalance optimal configuration in view of actual or forecast changes in volumes, prices and flexibility. As a consequence, financial derivatives are also managed dynamically, with a continuous adjustment that might lead to buy and sell the same financial product several times in a given time frame. These derivatives may lead to gains, as well as losses which in each case may be significant and are accounted through profit as they lack the hedge requirements provided by IFRS. |
Pursuant to internal policy, all derivatives transactions concerning interest rates and foreign currencies are executed for risk reducing purposes, as described above. Only commodity derivatives can also be executed in the context of non-risk reducing operations and be consequently classified as Proprietary Trading, which is an ancillary activity not related to industrial assets that makes use of financial derivatives which are entered into with the objective to obtain an uncertain profit, if favorable market expectations occur.
Eni monitors on a daily basis that every activity involving derivatives is correctly classified according to the risk reducing taxonomy (i.e. back to back, flow hedging, asset-backed hedging or portfolio management), is directly or indirectly related to the hedged industrial assets and effectively optimizes the risk profile to which Eni is, or could be, exposed. When some derivatives fail to prove their risk reducing purpose, they are reclassified as Proprietary Trading. Provided that Proprietary Trading is segregated ex ante from other activities, its resulting market risk exposure is subject to specific limits expressed in terms of Stop Loss, VaR and notional amounts. The aggregated notional amounts of non-risk reducing derivatives at Group/Entity level are constantly benchmarked with the thresholds required by relevant international financial regulations.
Please refer to “Item 18 — Note 28 of the Notes on Consolidated Financial Statements” for a qualitative and quantitative discussion of the Company’s exposure to market risks.
Not applicable.
Not applicable.
Not applicable.
In the United States, Eni’s securities are traded in the form of American Depositary Shares (ADSs) which are listed on the NYSE. ADSs are evidenced by American Depositary Receipts (ADRs), and each ADR represents two Eni ordinary shares.
Pursuant to the Deposit Agreement dated June 27, 2017 (the “Deposit Agreement”) between Eni, Citibank N.A. and the holders and beneficial owners ADSs, Citibank N.A. serves as the Depositary for Eni’s ADR Program, and Citibank N.A. Milan Branch serves as Custodian.
Computershare is the transfer agent for the Eni’s ADR Program.
Fees and charges payable by ADR holders
Pursuant to the Deposit Agreement, ADR holders may be required to pay various fees to the Depositary, and the Depositary may refuse to provide any service for which a fee is assessed until the applicable fee has been paid.
The following ADS fees are payable under the terms of the Deposit Agreement:
|
|
Service |
Rate |
By Whom Paid |
|||
|
(1) |
Issuance of ADSs (e.g., an issuance upon a deposit of Shares, upon a change in the ADS(s)-to-Share(s) ratio, or for any other reason), excluding issuances as a result of distributions described in paragraph (4) below. |
Up to U.S. $5.00 per 100 ADSs (or fraction thereof) issued. |
Person receiving ADSs. |
|||
|
(2) |
Cancellation of ADSs (e.g., a cancellation of ADSs for delivery of deposited Shares, upon a change in the ADS(s)-to-Share(s) ratio, or for any other reason). |
Up to U.S. $5.00 per 100 ADSs (or fraction thereof) cancelled. |
Person whose ADSs are being cancelled. |
|||
|
(3) |
Distribution of cash dividends or other cash distributions (e.g., upon a sale of rights and other entitlements). |
Up to U.S. $5.00 per 100 ADSs (or fraction thereof) held. |
Person to whom the distribution is made. |
|||
|
(4) |
Distribution of ADSs pursuant to (i) stock dividends or other free stock distributions, or (ii) an exercise of rights to purchase additional ADSs. |
Up to U.S. $5.00 per 100 ADSs (or fraction thereof) held. |
Person to whom the distribution is made. |
|||
|
(5) |
Distribution of securities other than ADSs or rights to purchase additional ADSs (e.g., spin-off shares). |
Up to U.S. $5.00 per 100 ADSs (or fraction thereof) held. |
Person to whom the distribution is made. |
|||
|
(6) |
ADS Services. |
Up to U.S. $5.00 per 100 ADSs (or fraction thereof) held on the applicable record date(s) established by the Depositary. |
Person holding ADSs on the applicable record date(s) established by the Depositary. |
Direct and indirect payments by the Depositary
The Depositary has agreed to reimburse certain company expenses related to the ADR Program and incurred in connection with the Program and the listing of Eni’s ADSs on the NYSE. These expenses are mainly related to legal and accounting fees incurred in connection with the preparation of regulatory filings and other documentation related to ongoing SEC compliance, NYSE listing fees, listing and custodian bank fees, advertising, certain investor relationship programs or special investor relations activities.
For the year 2022, the Depositary reimbursed to Eni $ 2,533,776.32 in connection with the above mentioned expenditures.
The Depositary has also agreed to waive certain standard fees associated with the administration of the ADR Program.
None.
None.
Disclosure controls and procedures
In designing and evaluating the Company’s disclosure controls and procedures (as defined in Rules 13a-15(e) and 15d-15(e) under the Securities Exchange Act of 1934 (the “Exchange Act”)), the Company’s management, including the Chief Executive Officer and the Head of Eni’s Accounting and Financial Statements department in his capacity as Officer in Charge of the Preparation of Corporate Accounts (“Dirigente Preposto alla redazione dei documenti contabili societari” pursuant to the Italian Consolidated Financial Law — Legislative Decree No. 58 of February 24, 1998), recognized that any controls and procedures, no matter how well designed and operated, can provide only reasonable assurance of achieving the desired control objectives, and the Company’s management necessarily was required to apply its judgment in evaluating the cost benefit relationship of possible controls and procedures. Because of the inherent limitations in all control systems, no evaluation of controls can provide absolute assurance that all control issues and instances of fraud, if any, within the Company have been detected.
It should be noted that the Company has investments in certain non-consolidated entities. As the Company does not control or manage these entities, its disclosure controls and procedures with respect to such entities are necessarily more limited than those it maintains with respect to its consolidated subsidiaries.
The Company’s management, with the participation of the Chief Executive Officer and the Head of Eni’s Accounting and Financial Statements department, has evaluated the effectiveness of the design and operation of its disclosure controls and procedures pursuant to Rule 13a-14(c) under the Exchange Act as of the end of the period covered by this Annual Report on Form 20-F. Based on that evaluation, the Chief Executive Officer and the Head of Eni’s Accounting and Financial Statements department have concluded that these disclosure controls and procedures are effective.
Management’s Annual Report on Internal Control over Financial Reporting
The Company’s management is responsible for establishing and maintaining adequate internal control over financial reporting as defined in Exchange Act Rules 13a-15(f). Because of its inherent limitations, internal control over financial reporting may not prevent or detect misstatements and even when determined to be effective can only provide reasonable assurance with respect to financial statement preparation and presentation. Also, the effectiveness of an internal control system may change over time.
Management has excluded 10 entities from its assessment of internal control over financial reporting as of December 31, 2022 because they were acquired by the Company in several purchase business combinations during 2022. These entities, which are wholly-owned, comprised, in the aggregate, total assets and total revenues excluded from management's assessment of internal control over financial reporting of approximately 2% of consolidated total assets and less than 1% of consolidated total revenues as of and for the year ended December 31, 2022.
The Internal Control Committee assists the Board of Directors in setting out the main principles for the internal control system so as to appropriately identify and adequately evaluate, manage, and monitor the main risks related to the Company and its subsidiaries, by laying down the compatibility criteria between said risks and sound corporate management. In addition, this Committee assesses, at least annually, the adequacy, effectiveness, and actual operations of the internal control system.
The Company’s management, including the Chief Executive Officer and the Head of Eni’s Accounting and Financial Statements department, conducted an evaluation of the effectiveness of its internal control over financial reporting based on the Internal Control — Integrated Framework issued by the Committee of Sponsoring Organizations of the Treadway Commission (CoSO) in 2013. Based on the results of this evaluation, the Group’s management concluded that its internal control over financial reporting was effective as of December 31, 2022.
The effectiveness of the Company’s internal control over financial reporting as of December 31, 2022, has been audited by PricewaterhouseCoopers SpA, an independent registered public accounting firm, as stated in its report that is included on page F-2 of this Annual Report on Form 20-F.
Changes in Internal Control over Financial Reporting
There have not been changes in the Company’s Internal Control over Financial Reporting that occurred during the period covered by this Form 20-F that have materially affected, or are reasonably likely to materially affect, the Company’s internal control over financial reporting.
Eni’s Board of Statutory Auditors has determined that the five members of Eni’s Board of Statutory Auditors are “audit committee financial expert”: Rosalba Casiraghi, who is the Chairman of the Board, Enrico Maria Bignami, Marcella Caradonna, Giovanna Ceribelli, and Marco Seracini. All members are independent.
Eni adopted a Code of Ethics that applies to all Eni’s employees, including Executive Officers, principal Financial and Accounting Officers, Directors and Statutory Auditors. Eni published its Code of Ethics on Eni’s website. It is accessible at www.eni.com, under the section Governance. A copy of this Code of Ethics is included as an exhibit to this Annual Report on Form 20-F. Information on our website is not incorporated by reference into this report.
Eni’s Code of Ethics contains ethical guidelines, describes corporate values and requires standards of business conduct and moral integrity. The ethical guidelines are designed to deter wrongdoing and to promote honest and ethical conduct, compliance with applicable laws and regulations and internal reporting of violations of the guidelines. The code affirms the principles of accounting transparency and internal control and endorses human rights and the issue of the sustainability of the business model.
PricewaterhouseCoopers SpA (PwC SpA) has served as Eni principal independent registered public accounting firm for fiscal year 2022, for which audited Consolidated Financial Statements have been included in this Annual Report on Form 20-F. PwC SpA, as the main external auditor, is wholly in charge of the auditing activities of the Consolidated Financial Statements.
The following table reports total fees for services rendered to Eni by its public auditors PwC SpA and member firms of its network for the years ended December 31, 2022 and 2021.
|
Year ended December 31, |
||||
|
2022 |
2021 |
|||
|
(€ thousand) |
||||
|
Audit fees |
24,355 |
18,858 |
||
|
Audit-related fees |
2,834 |
(1) |
4,359 |
|
|
Tax fees |
11 |
|||
|
All other fees |
- |
152 |
||
|
Total |
27,200 |
23,369 |
||
|
(1) Audit related services provided by PwC SpA mainly relate to services for the issue of comfort letters, services related to the report prepared by Eni SpA on payments to governments and checks on cost recharges/rates, agreed verification procedures, and tariff certifications. |
||||
Audit fees include professional services rendered by the principal accountant for the audit of the registrant’s annual financial statements or services that are normally provided by the accountant in connection with statutory and regulatory filings or engagements, including the audit on the Company’s internal control over financial reporting.
Audit-related fees include assurance and related services by the principal accountant that are reasonably related to the performance of the audit or review of the registrant’s financial statements and are not reported as Audit fees in this Item. The fees disclosed in this category mainly include, merger and acquisition due diligence, audit, certification services not required for by law and regulations and consultations concerning financial accounting and reporting standards.
Tax fees include professional services rendered by the principal accountant for tax compliance, tax advice, and tax planning.
All other fees include products and services provided by the principal accountant, other than the services reported in Audit fees, Audit-related fees and Tax fees of this Item and consists primarily of fees billed for consultancy services related to IT and secretarial services that are permissible under applicable rules and regulations.
Pre-approval policies and procedures of the Internal Control Committee
The Board of Statutory Auditors has adopted a pre-approval policy for audit and non-audit services that set forth the procedures and the conditions pursuant to which services proposed to be performed by the principal auditors may be pre-approved. Such policy is applied to entities controlled (directly or indirectly) by Eni SpA as well as to jointly controlled entities that are material to the Eni Group. According to this policy, permissible services within the other audit services category are pre-approved by the Board of Statutory Auditors. The Board of Statutory Auditors approval is required on a case-by-case basis for those requests regarding: (i) audit-related services; and (ii) non-audit services to be performed by the external auditors which are permissible under applicable rules and regulations. In such cases, the Company’s Internal Audit Department is charged with performing an initial assessment of each request to be submitted to the Board of Statutory Auditors for approval. The Internal Audit Department periodically reports to Eni’s Board of Statutory Auditors on the status of both pre-approved services and services approved on a case-by-case basis rendered by the external auditors.
During 2022, no audit-related fees, tax fees or other non-audit fees were approved by the Board of Statutory Auditors pursuant to the de minimis exception to the pre-approval requirement provided by paragraph (c)(7)(i) (C) of Rule 2-01 of Regulation S-X.
Making use of the exemption provided by Rule 10A-3(c)(3) for foreign private issuers, Eni has identified the Board of Statutory Auditors as the body that, starting from June 1, 2005, performs the functions required by the U.S. SEC rules and the Sarbanes-Oxley Act to be carried out by the audit committees of non-U.S. companies listed on the NYSE (see “Item 6 — Board of Statutory Auditors” above).
Eni’s Board of Directors, in execution of the authorization granted by the Eni Shareholders’ Meeting of May 11, 2022 approved the execution of a share buy-back program for 2022, for a maximum amount of €2,400 million, repurchasing 196 million of shares. The purchases started on May 30, 2022 and ended on November 29, 2022.
|
Period |
Total number of shares purchased |
Average weighted price paid per share |
Total number of shares purchased as part of publicly announced plans or programs |
Total purchase cost |
Approximate € value of Shares that may yet be purchased under the plans or programs |
|||||
|
€ per share |
(€ million) |
(€ million) |
||||||||
|
Start of the program May 30 - May 31,2022 |
1,249,967 |
14.23 |
1,249,967 |
18 |
2,382 |
|||||
|
1 June - 30 June |
15,260,885 |
12.76 |
15,260,885 |
195 |
2,187 |
|||||
|
1 July - 31 July |
16,845,913 |
11.12 |
16,845,913 |
187 |
2,000 |
|||||
|
1 August - 31 August |
30,801,784 |
11.97 |
30,801,784 |
369 |
1,631 |
|||||
|
1 September - 30 September |
40,620,097 |
11.38 |
40,620,097 |
462 |
1,169 |
|||||
|
1 October - 31 October |
51,982,696 |
12.00 |
51,982,696 |
624 |
545 |
|||||
|
1 November - 29 November |
38,788,742 |
14.06 |
38,788,742 |
545 |
0 |
|||||
|
Total as of December 31, 2022 |
|
195,550,084 |
|
12.27 |
|
195,550,084 |
|
2,400 |
|
|
Not Applicable
Corporate Governance. Eni’s Governance structure follows the traditional model as defined by the Italian Civil Code which provides for two main separate corporate bodies, the Board of Directors and the Board of Statutory Auditors to whom management and monitoring duties are respectively entrusted. This model differs from the U.S. one-tier model in which the Board of Directors is the sole corporate body responsible for management, with an Audit Committee established within the Board performing monitoring activities. The following offers a description of the most significant differences between corporate governance practices adopted by U.S. domestic companies under the NYSE standards and those followed by Eni, including with reference to Corporate Governance Code approved by the Italian Corporate Governance Committee in January 2020 effective from January 1, 2021, which Eni has adopted on December 23, 2020 (the “Code”).
Independent Directors
NYSE standards. In accordance with NYSE standards, the majority of the members on the Boards of Directors of U.S. companies must be independent. A Director qualifies as independent when the Board affirmatively determines that such Director does not have a material relationship with the listed company (and its subsidiaries), either directly, or indirectly. In particular, a Director may not be deemed independent if he or she or an immediate family member has a certain specific relationship with the issuer, its auditors or companies that have material business relationships with the issuer (e.g. he or she is an employee of the issuer or a partner of the Auditor). In addition, a Director cannot be considered independent in the three-year “cooling-off” period following the termination of any relationship that compromised a Director’s independence.
Eni standards. In Italy, the Consolidated Law on Financial Intermediation states that at least one of the Directors or two, if the Board is composed of more than seven members, must meet the independence requirements for Statutory Auditors of listed companies. In particular, a Director may not be deemed independent if he/she or an immediate family member has a relationship with the issuer, with its Directors or with the companies in the same group of the issuer that could influence the independence of judgment.
Eni’s By-laws require that at least one Director — if the Board has no more than five members — or at least three Directors — if the Board is composed of more than five members — must satisfy the independence requirements. The Corporate Governance Code provides for additional independence requirements, recommending that a significant number of non-executive directors is independent. In particular, in large companies other than those with concentrated ownership, like Eni, independent directors should account for at least half of the board (this recommendation shall apply starting from the first renewal of the board of directors following December 31, 2020). Independence is defined as not having currently or recently entered into, nor recently had, even indirectly, relations with the company or with subjects related to the latter, such as to condition their current autonomy of judgment. The Corporate Governance Code identifies Corporate the circumstances that jeopardise, or appear to jeopardise, the independence of a director. Immediately after the appointment of a Director who qualifies as independent and subsequently, upon the occurrence of circumstances that concern the independence and in any case at least once a year, the Board of Directors assesses the independence of the Director. The Board of Statutory Auditors verifies the correct application of the criteria and procedures adopted by the Board of Directors to evaluate the independence of its members. The Board of Directors shall disclose to the market the outcome of its assessment, immediately after the appointment, through a specific press release and, later, in the Annual Corporate Governance Report. In accordance with Eni’s By-laws, if a Director, who qualifies as independent, does not or no longer satisfies the independence requirements established by law, the Board declares the Director disqualified and provides for their substitution. Directors shall notify the Company if they should no longer satisfy the independence and integrity requirements or if cause for ineligibility or incompatibility should arise.
Meetings of non-executive Directors
NYSE standards. Non-executive Directors, including those who are not independent, must meet on a regular basis without the executive Directors. In addition, if the group of non-executive Directors includes Directors who are not independent, independent Directors should meet separately at least once a year.
Eni standards. Pursuant to Corporate Governance Code, independent Directors shall meet at least once a year in the absence of the other Directors.
On April 29, 2021, upon request of independent directors, the Board of Directors of Eni appointed Raphael Louis L. Vermeir Lead Independent Director. Pursuant to Italian Corporate Governance Code, the Lead Independent Director collects and coordinates the requests and contributions of non-executive directors and, in particular, of independent ones and coordinates the meetings of the independent directors.
Audit Committee
NYSE standards. Listed U.S. companies must have an Audit Committee that satisfies the requirements of Rule 10A-3 under the Securities Exchange Act of 1934 and that complies with the provisions of the Sarbanes-Oxley Act and of Section 303A.07 of the NYSE Listed Company Manual.
Eni standards. At its Meeting of March 22, 2005, the Board of Directors, as permitted by the rules of SEC applicable to foreign issuers listed on regulated U.S. markets, assigned to the Board of Statutory Auditors, effective from June 1, 2005 and within the limits set by Italian law, the functions specified and the responsibilities assigned to the Audit Committee of such foreign issuers by the Sarbanes-Oxley Act and the SEC rules (see “Item 6 — Board of Statutory Auditors” earlier). Under Section 303A.07 of the NYSE Listed Company Manual, audit committees of U.S. companies have additional functions and duties which are not mandatory for non-U.S. private issuers and which are therefore not included in the list of functions reported in “Item 6 — Board of Statutory Auditors”.
Nominating/Corporate Governance Committee
NYSE standards. U.S. listed companies must have a Nominating/Corporate Governance Committee (or equivalent body) composed entirely of independent Directors whose functions include, but are not limited to, selecting qualified candidates for the office of Director for submission to the Shareholders’ Meeting, as well as developing and recommending corporate governance guidelines to the Board of Directors. This provision is
not binding for non-U.S. private issuers.
Eni standards. Pursuant to the Code, the Board of Directors shall establish among its members a nomination committee the majority of whose members shall be independent Directors. The Nomination Committee of Eni is made up of three to four Directors, a majority of whom shall be independent in accordance with the recommendations of the Code. On May 14, 2020, the Board of Directors of Eni established the Nomination Committee, chaired by Ada Lucia De Cesaris (independent Director) and composed of Pietro Guindani (independent Director) and Emanuele Piccinno (non-executive Director independent pursuant to law and, since February 17, 2022, independent also pursuant to the Corporate Governance Code).
Further details on this Committee are reported in the Item 6.
Remuneration Committee
NYSE standards. U.S. listed companies must have a Remuneration Committee composed entirely of independent Directors who must satisfy the independence requirements provided for its members. The Remuneration Committee must have a written charter that addresses the Committee’s purpose and responsibilities within the limit set forth by the listing rules. The Remuneration Committee may, in its sole discretion, retain or obtain the advice of a compensation consultant, independent legal counsel or other adviser and shall be directly responsible for the appointment, compensation and oversight of the work of any compensation consultant, independent legal counsel or other adviser retained by it. These provisions are not binding for non-U.S. private issuers.
Eni standards. Pursuant to the Corporate Governance Code, the Board of Directors shall establish among its members a Remuneration Committee made up of three to four non-executive Directors, all of whom shall be independent or, alternatively, a majority of whom shall be independent. In the latter case, the Chairman of the Committee shall be chosen from among the independent Directors. At least one of the Committee’s members shall have an adequate knowledge and experience in financial matters or remuneration policies. First established by the Board of Directors in 1996, the Remuneration Committee is currently chaired by Director Nathalie Tocci (independent Director). The other members include Directors Karina A. Litvack, and Raphael Louis L. Vermeir, both independent Directors. All directors possess knowledge and experience in financial matters or remuneration policies. The composition and functions of the Remuneration Committee are outlined in the committee charter (“Rules”) available on the Company’s website.
Further details on this Committee are reported in the Item 6.
Code of Business Conduct and Ethics
NYSE standards. The NYSE listing standards require each U.S. listed company to adopt a Code of Business Conduct and Ethics for its Directors, Officers and employees, and to promptly disclose any waivers of the code for Directors or Executive Officers.
Eni standards. The Board of Directors of Eni, at its meetings of December 15, 2003 and January 28, 2004, approved an organizational, management and control model pursuant to Italian Legislative Decree No.231 of 2001 (hereinafter “Model 231”) and established the associated 231 Supervisory Body of Eni SpA, with the role of supervising the effectiveness of Model 231 and of assessing its suitability to prevent crimes provided in the Italian Legislative Decree No. 231 of 2001.
The Model 231 was most recently updated by resolution of the Board of Directors, in the meeting of November 18, 2021, taking into account the experience gained, amendments to Legislative Decree no. 231/2001, and the corporate organizational changes of Eni SpA.
The autonomy and independence of the 231 Supervisory Body are guaranteed by the position recognized to it within the organizational structure of the Company, and by the requisites of independence, good standing and professionalism of its members.
Furthermore, the Board of Directors, in its meeting of March 18, 2020, approved the new version of Eni’s Code of Ethics, that has been updated to become a modern and effective Charter of Values, designed to inspire and guide the conduct of all members of the administrative and control bodies and employees of Eni and its stakeholders.
Eni’s Code of Ethics sets out a clear definition of the value system that Eni recognizes, accepts and upholds and the responsibilities that Eni assumes internally and externally in order to ensure that all its business activities are conducted in compliance with the law, in a context of fair competition, with honesty, integrity, correctness and in good faith, respecting the legitimate interests of all the stakeholders with whom Eni interacts on an ongoing basis. These include shareholders, employees, suppliers, customers, commercial and financial partners, and the local communities and institutions of the countries where Eni operates. All Eni personnel, without exception or distinction, starting with Directors, senior management and members of the Company’s bodies, as also required under SEC rules and the Sarbanes-Oxley Act, are committed to observing and enforcing the principles set out in the Code of Ethics in the performance of their functions and duties.
Not applicable since Eni does not engage in mining operations.
Not applicable.
Not applicable.
Index to Financial Statements:
SIGNATURES
The registrant certifies that it meets all of the requirements for filing on Form 20-F and has duly caused this annual report to be signed on its behalf by the undersigned, thereunto duly authorized.
Date: April 5, 2023
| Eni SpA | ||
|
|
|
/s/FRANCESCO ESPOSITO |
|
|
|
|
|
|
|
Francesco Esposito |
|
|
|
Title: Head of Accounting and |
|
|
|
Financial Statements |
REPORT OF INDEPENDENT REGISTERED PUBLIC ACCOUNTING FIRM
To the Board of Directors and Shareholders of Eni SpA
Opinions on the Financial Statements and Internal Control over Financial Reporting
We have audited the accompanying consolidated balance sheet of Eni SpA and its subsidiaries (the “Company”) as of December 31, 2022 and 2021, and the related consolidated profit and loss account and consolidated statements of comprehensive income, of changes in equity and of cash flows for each of the three years in the period ended December 31, 2022, including the related notes (collectively referred to as the “consolidated financial statements”). We also have audited the Company's internal control over financial reporting as of December 31, 2022, based on criteria established in Internal Control - Integrated Framework (2013) issued by the Committee of Sponsoring Organizations of the Treadway Commission (COSO).
In our opinion, the consolidated financial statements referred to above present fairly, in all material respects, the financial position of the Company as of December 31, 2022 and 2021, and the results of its operations and its cash flows for each of the three years in the period ended December 31, 2022 in conformity with International Financial Reporting Standards as issued by the International Accounting Standards Board. Also in our opinion, the Company maintained, in all material respects, effective internal control over financial reporting as of December 31, 2022, based on criteria established in Internal Control - Integrated Framework (2013) issued by the COSO.
Basis for Opinions
The Company's management is responsible for these consolidated financial statements, for maintaining effective internal control over financial reporting, and for its assessment of the effectiveness of internal control over financial reporting, included in Management’s Annual Report on Internal Control over Financial Reporting appearing under Item 15. Our responsibility is to express opinions on the Company’s consolidated financial statements and on the Company's internal control over financial reporting based on our audits. We are a public accounting firm registered with the Public Company Accounting Oversight Board (United States) (PCAOB) and are required to be independent with respect to the Company in accordance with the U.S. federal securities laws and the applicable rules and regulations of the Securities and Exchange Commission and the PCAOB.
We conducted our audits in accordance with the standards of the PCAOB. Those standards require that we plan and perform the audits to obtain reasonable assurance about whether the consolidated financial statements are free of material misstatement, whether due to error or fraud, and whether effective internal control over financial reporting was maintained in all material respects.
Our audits of the consolidated financial statements included performing procedures to assess the risks of material misstatement of the consolidated financial statements, whether due to error or fraud, and performing procedures that respond to those risks. Such procedures included examining, on a test basis, evidence regarding the amounts and disclosures in the consolidated financial statements. Our audits also included evaluating the accounting principles used and significant estimates made by management, as well as evaluating the overall presentation of the consolidated financial statements. Our audit of internal control over financial reporting included obtaining an understanding of internal control over financial reporting, assessing the risk that a material weakness exists, and testing and evaluating the design and operating effectiveness of internal control based on the assessed risk. Our audits also included performing such other procedures as we considered necessary in the circumstances. We believe that our audits provide a reasonable basis for our opinions.
As described in Management’s Annual Report on Internal Control over Financial Reporting, management has excluded 10 entities from its assessment of internal control over financial reporting as of December 31, 2022 because they were acquired by the Company in several purchase business combinations during 2022. We have also excluded these 10 entities from our audit of internal control over financial reporting. These entities, which are wholly-owned, comprised, in the aggregate, total assets and total revenues excluded from management’s assessment and our audit of internal control over financial reporting of approximately 2% of consolidated total assets and less than 1% of consolidated total revenues as of and for the year ended December 31, 2022.
Definition and Limitations of Internal Control over Financial Reporting
A company’s internal control over financial reporting is a process designed to provide reasonable assurance regarding the reliability of financial reporting and the preparation of financial statements for external purposes in accordance with generally accepted accounting principles. A company’s internal control over financial reporting includes those policies and procedures that (i) pertain to the maintenance of records that, in reasonable detail, accurately and fairly reflect the transactions and dispositions of the assets of the company; (ii) provide reasonable assurance that transactions are recorded as necessary to permit preparation of financial statements in accordance with generally accepted accounting principles, and that receipts and expenditures of the company are being made only in accordance with authorizations of management and directors of the company; and (iii) provide reasonable assurance regarding prevention or timely detection of unauthorized acquisition, use, or disposition of the company’s assets that could have a material effect on the financial statements.
Because of its inherent limitations, internal control over financial reporting may not prevent or detect misstatements. Also, projections of any evaluation of effectiveness to future periods are subject to the risk that controls may become inadequate because of changes in conditions, or that the degree of compliance with the policies or procedures may deteriorate.
Critical Audit Matters
The critical audit matters communicated below are matters arising from the current period audit of the consolidated financial statements that were communicated or required to be communicated to the audit committee and that (i) relate to accounts or disclosures that are material to the consolidated financial statements and (ii) involved our especially challenging, subjective, or complex judgments. The communication of critical audit matters does not alter in any way our opinion on the consolidated financial statements, taken as a whole, and we are not, by communicating the critical audit matters below, providing separate opinions on the critical audit matters or on the accounts or disclosures to which they relate.
The Impact of Estimated Proved Oil and Natural Gas Reserves on Property, Plant and Equipment, Net
As described in Notes 1 and 12 to the consolidated financial statements, the Company’s consolidated net carrying amount for property, plant and equipment was €56.3 billion as of December 31, 2022, of which €49.5 billion relates to the Exploration and Production (E&P) segment. The Company’s depreciation, depletion and amortization (DD&A) expense for E&P wells, plant and machinery was €5.5 billion for the year ended December 31, 2022. Oil and natural gas exploration, appraisal and development activities are accounted for using the principles of the successful efforts method of accounting. Under this method, proved oil and gas assets are depreciated generally on a unit of production basis. Proved exploration rights and acquired proved mineral interests are amortised over proved reserves; proved exploration and appraisal costs and development costs are depreciated over proved developed reserves, while common facilities are depreciated over total proved reserves. The accuracy of reserve estimates depends on a number of factors, assumptions and variables, including: (i) the quality of available geological, technical and economic data and their interpretation and judgment; (ii) projections regarding future rates of production and operating costs and development costs; (iii) changes in the prevailing tax rules, other government regulations and contractual conditions; (iv) results of drilling, testing and the actual production performance of the Company’s reservoirs after the date of the estimates which may drive substantial upward or downward revisions; and (v) changes in oil and natural gas commodity prices which could affect expected future cash flows and the quantities of the Company’s proved reserves since the estimates of reserves are based on prices and costs existing as of the date when these estimates are made. As disclosed by management, staff involved in the reserves evaluation process have qualifications that comply with international standards and proved reserves are evaluated on a rotational basis by independent oil engineering companies (collectively “management’s specialists”).
The principal considerations for our determination that performing procedures relating to the impact of estimated proved oil and natural gas reserves on property, plant and equipment, net is a critical audit matter are (i) the significant judgment by management, including the use of management’s specialists, when developing the estimates of proved oil and natural gas reserves, including future rates of production, which in turn led to (ii) a high degree of auditor judgment, subjectivity, and effort in performing procedures and evaluating the audit evidence related to the data, methods, and assumptions used by management and its specialists in developing the estimates of proved oil and natural gas reserves, including future rates of production and the assumptions applied to the data related to operating costs and development costs.
Addressing the matter involved performing procedures and evaluating audit evidence in connection with forming our overall opinion on the consolidated financial statements. These procedures included testing the effectiveness of controls relating to management’s estimates of proved oil and natural gas reserves. The work of management’s specialists was used in performing the procedures to evaluate the reasonableness of the reserves, including future rates of production. As a basis for using this work, we obtained an understanding of the specialists’ qualifications and assessed the Company’s relationship with the specialists. The procedures performed also included evaluating the methods and assumptions used by the specialists, testing the data used by the specialists, and evaluating the specialists’ findings. These procedures also included, among others, testing the completeness and accuracy of the data related to operating costs and development costs. Additionally, these procedures included evaluating whether the assumptions applied to the data related to operating costs and development costs were reasonable as compared to the past performance of the Company.
Recoverability Assessment of E&P Property, Plant and Equipment, Net - Proved Oil and Natural Gas Properties
As described in Notes 1, 12 and 15 to the consolidated financial statements, the Company’s consolidated net carrying amount for property, plant and equipment was €56.3 billion as of December 31, 2022, of which €49.5 billion relates to the E&P segment. The Company incurred impairment losses, net of recognized impairment reversals, before taxes associated with oil and natural gas properties in the E&P segment of €0.3 billion for the year ended December 31, 2022. The recoverability of non-financial assets is assessed whenever events or changes in circumstances indicate that carrying amounts of the assets may not be recoverable. The recoverability assessment is performed for each cash-generating unit (CGU) represented by the smallest identifiable group of assets that generate cash inflows that are largely independent of the cash inflows from other assets or group of assets. The recoverability of a CGU is assessed by comparing its carrying amount with the recoverable amount, which is the higher of the CGU’s fair value less costs of disposal and its value in use. Value in use is the present value of the future flows expected to be derived from continuing use of the CGU and, if significant and reliably measurable, the cash flows expected to be obtained from its disposal at the end of its useful life, after deducting the costs of disposal. For oil and natural gas properties, the expected future cash flows are estimated based on proved and probable reserves including, among other elements, production taxes and the costs to be incurred for the reserves yet to be developed. The estimate of the future rates of production is based on assumptions related to future commodity prices, operating costs, lifting and development costs, field decline rates, market demand and other factors. When an impairment loss no longer exists or has decreased, a reversal of the impairment loss is recognised in the profit and loss account. The impairment reversal shall not exceed the carrying amount that would have been determined, net of depreciation, had no impairment loss been recognised for the asset in prior years.
The principal considerations for our determination that performing procedures relating to the recoverability assessment of E&P property, plant and equipment, net - proved oil and natural gas properties is a critical audit matter are (i) the significant judgment by management, including the use of specialists, when developing the value in use of proved oil and natural gas properties, which in turn led to (ii) a high degree of auditor judgment, subjectivity, and effort in performing procedures and evaluating management’s significant assumptions, including future rates of production, future commodity prices, operating costs, and development costs, and (iii) the audit effort involved the use of professionals with specialized skill and knowledge.
Addressing the matter involved performing procedures and evaluating audit evidence in connection with forming our overall opinion on the consolidated financial statements. These procedures included testing the effectiveness of controls relating to management’s recoverability assessments of proved oil and natural gas properties. These procedures also included, among others (i) testing management’s process for developing the value in use of proved oil and natural gas properties; (ii) evaluating the appropriateness of the value in use model; (iii) testing the completeness and accuracy of underlying data used in the model; and (iv) evaluating the reasonableness of significant assumptions used by management related to future rates of production, commodity prices, and operating costs and development costs. Evaluating the reasonableness of management’s assumptions related to future commodity prices involved comparing the prices against observable market data. Evaluating operating costs and development costs involved evaluating the reasonableness of management’s assumptions as compared to the past performance of the Company. Professionals with specialized skill and knowledge were used to assist in the evaluation of the Company’s future commodity prices. The work of management’s specialists was used in performing the procedures to evaluate the reasonableness of the future rates of production as stated in the Critical Audit Matter titled “The Impact of Estimated Proved Oil and Natural Gas Reserves on Property, Plant and Equipment, Net”. As a basis for using this work, we obtained an understanding of the specialists’ qualifications and assessed the Company’s relationship with the specialists. The procedures performed also included evaluating the methods and assumptions used by the specialists, testing the data used by the specialists, and evaluating the specialists’ findings.
/s/
April 5, 2023
We have served as the Company’s auditor since 2019.
(€ million)
| December 31, 2022 | December 31, 2021 | ||||||||||||
| Note | Total amount |
of which with related parties |
Total amount |
of which with related parties |
|||||||||
| ASSETS | |||||||||||||
| Current assets | |||||||||||||
| Cash and cash equivalents | (6) | |
|||||||||||
| Financial assets at fair value through profit or loss | (7) | ||||||||||||
| Other current financial assets | (17) | ||||||||||||
| Trade and other receivables | (8) | ||||||||||||
| Inventories | (9) | ||||||||||||
| Income tax receivables | (10) | ||||||||||||
| Other current assets | (11) (24) | ||||||||||||
| Non-current assets | |||||||||||||
| Property, plant and equipment | (12) | ||||||||||||
| Right-of-use assets | (13) | ||||||||||||
| Intangible assets | (14) | ||||||||||||
| Inventory - Compulsory stock | (9) | ||||||||||||
| Equity-accounted investments | (16) (37) | ||||||||||||
| Other investments | (16) | ||||||||||||
| Other non-current financial assets | (17) | ||||||||||||
| Deferred tax assets | (23) | ||||||||||||
| Income tax receivables | (10) | ||||||||||||
| Other non-current assets | (11) (24) | ||||||||||||
| Assets held for sale | (25) | ||||||||||||
| TOTAL ASSETS | |||||||||||||
| LIABILITIES AND EQUITY | |||||||||||||
| Current liabilities | |||||||||||||
| Short-term debt | (19) | ||||||||||||
| Current portion of long-term debt | (19) | ||||||||||||
| Current portion of long-term lease liabilities | (13) | ||||||||||||
| Trade and other payables | (18) | ||||||||||||
| Income tax payables | (10) | ||||||||||||
| Other current liabilities | (11) (24) | ||||||||||||
| Non-current liabilities | |||||||||||||
| Long-term debt | (19) | ||||||||||||
| Long-term lease liabilities | (13) | ||||||||||||
| Provisions | (21) | ||||||||||||
| Provisions for employee benefits | (22) | ||||||||||||
| Deferred tax liabilities | (23) | ||||||||||||
| Income tax payables | (10) | ||||||||||||
| Other non-current liabilities | (11) (24) | ||||||||||||
| Liabilities directly associated with assets held for sale | (25) | ||||||||||||
| TOTAL LIABILITIES | |||||||||||||
| Share capital | |||||||||||||
| Retained earnings | |||||||||||||
| Cumulative currency translation differences | |||||||||||||
| Other reserves and equity instruments | |||||||||||||
| Treasury shares | ( |
) | ( |
) | |||||||||
| Profit | |||||||||||||
| Equity attributable to equity holders of Eni | |||||||||||||
| Non-controlling interest | |||||||||||||
| TOTAL EQUITY | (26) | ||||||||||||
| TOTAL LIABILITIES AND EQUITY | |||||||||||||
See the accompanying notes
Information about the definitive purchase price allocation of business combinations made in 2021 is provided in note 27 ‐ Other Information.
(€ million except as otherwise stated)
| 2022 | 2021 | 2020 | |||||||||||||||||
| Note | Total amount |
of which with related parties |
Total amount |
of which with related parties |
Total amount |
of which with related parties |
|||||||||||||
| Sales from operations | |||||||||||||||||||
| Other income and revenues | |||||||||||||||||||
| REVENUES AND OTHER INCOME | (29) | ||||||||||||||||||
| Purchases, services and other | (30) | ( |
) | ( |
) | ( |
) | ( |
) | ( |
) | ( |
) | ||||||
| Net (impairments) reversals of trade and other receivables | (8) | ( |
) | ( |
) | ( |
) | ( |
) | ( |
) | ||||||||
| Payroll and related costs | (30) | ( |
) | ( |
) | ( |
) | ( |
) | ( |
) | ( |
) | ||||||
| Other operating income (expense) | (24) | ( |
) | ( |
) | ||||||||||||||
| Depreciation and amortization | (12) (13) (14) | ( |
) | ( |
) | ( |
) | ||||||||||||
| Net (impairments) reversals of tangible, intangible and right-of-use assets | (15) | ( |
) | ( |
) | ( |
) | ||||||||||||
| Write-off of tangible and intangible assets | (12) (14) | ( |
) | ( |
) | ( |
) | ||||||||||||
| OPERATING PROFIT (LOSS) | ( |
) | |||||||||||||||||
| Finance income | (31) | ||||||||||||||||||
| Finance expense | (31) | ( |
) | ( |
) | ( |
) | ( |
) | ( |
) | ( |
) | ||||||
| Net finance income (expense) from financial assets at fair value through profit or loss | (31) | ( |
) | ||||||||||||||||
| Derivative financial instruments | (24) (31) | ( |
) | ||||||||||||||||
| FINANCE INCOME (EXPENSE) | ( |
) | ( |
) | ( |
) | |||||||||||||
| Share of profit (loss) from equity-accounted investments | ( |
) | ( |
) | |||||||||||||||
| Other gain (loss) from investments | |||||||||||||||||||
| INCOME (EXPENSE) FROM INVESTMENTS | (16) (32) | ( |
) | ( |
) | ||||||||||||||
| PROFIT (LOSS) BEFORE INCOME TAXES | ( |
) | |||||||||||||||||
| Income taxes | (33) | ( |
) | ( |
) | ( |
) | ||||||||||||
| PROFIT (LOSS) | ( |
) | |||||||||||||||||
| Attributable to Eni | ( |
) | |||||||||||||||||
| Attributable to non-controlling interest | |||||||||||||||||||
| Earnings per share (€ per share) | (34) | ||||||||||||||||||
| Basic | ( |
) | |||||||||||||||||
| Diluted | ( |
) | |||||||||||||||||
See the accompanying notes.
(€ million)
| Note | 2022 | 2021 | 2020 | |||||||
| Profit (loss) | ( |
) | ||||||||
| Other items of comprehensive income (loss) | ||||||||||
| Items that are not reclassified to profit or loss in later periods | ||||||||||
| Remeasurements of defined benefit plans | (26) | ( |
) | |||||||
| Share of other comprehensive income (loss) on equity-accounted investments | (26) | |||||||||
| Change of minor investments measured at fair value with effects to OCI | (26) | |||||||||
| Tax effect | (26) | ( |
) | ( |
) | |||||
| Items that may be reclassified to profit or loss in later periods | ||||||||||
| Currency translation differences | (26) | ( |
) | |||||||
| Change in the fair value of cash flow hedging derivatives | (26) | ( |
) | |||||||
| Share of other comprehensive income (loss) on equity-accounted investments | (26) | ( |
) | ( |
) | |||||
| Tax effect | (26) | ( |
) | ( |
) | |||||
| ( |
) | |||||||||
| Total other items of comprehensive income (loss) | ( |
) | ||||||||
| Total comprehensive income (loss) | ( |
) | ||||||||
| Attributable to Eni | ( |
) | ||||||||
| Attributable to non-controlling interest |
See the accompanying notes.
(€ million)
| Equity attributable to equity holders of Eni | ||||||||||||||||||||||||||||
| Note | Share capital |
Retained earnings |
Cumulative currency translation differences |
Other reserves and equity instruments |
Treasury shares | Profit (loss) for the year | Total | Non-controlling interest | Total equity |
|||||||||||||||||||
| Balance at December 31, 2021 | (26) | ( |
) | |||||||||||||||||||||||||
| Profit for the year | ||||||||||||||||||||||||||||
| Other items of comprehensive income (loss) | ||||||||||||||||||||||||||||
| Remeasurements of defined benefit plans net of tax effect | (26) | |||||||||||||||||||||||||||
| Share of “Other comprehensive income (loss)” on equity-accounted investments | (26) | |||||||||||||||||||||||||||
| Change of minor investments measured at fair value with effects to OCI | (26) | |||||||||||||||||||||||||||
| Items that are not reclassified to profit or loss in later periods | ||||||||||||||||||||||||||||
| Currency translation differences | (26) | |
||||||||||||||||||||||||||
| Change in the fair value of cash flow hedge derivatives net of tax effect | (26) | |||||||||||||||||||||||||||
| Share of “Other comprehensive income (loss)” on equity-accounted investments | (26) | ( |
) | ( |
) | ( |
) | |||||||||||||||||||||
| Items that may be reclassified to profit or loss in later periods | ||||||||||||||||||||||||||||
| Total comprehensive income of the year | ||||||||||||||||||||||||||||
| Dividend distribution of Eni SpA | (26) | ( |
) | ( |
) | ( |
) | |||||||||||||||||||||
| Interim dividend distribution of Eni SpA | (26) | ( |
) | ( |
) | ( |
) | |||||||||||||||||||||
| Dividend distribution of other companies | ( |
) | ( |
) | ||||||||||||||||||||||||
| Allocation of 2021 profit | ( |
) | ||||||||||||||||||||||||||
| Capital contribution by non-controlling interests | ||||||||||||||||||||||||||||
| Purchase of treasury shares | (26) | ( |
) | ( |
) | ( |
) | ( |
) | |||||||||||||||||||
| Cancellation of treasury shares | (26) | ( |
) | |||||||||||||||||||||||||
| Long-term share-based incentive plan | (26)(30) | ( |
) | |||||||||||||||||||||||||
| Coupon payment on perpetual subordinated bonds | (26) | ( |
) | ( |
) | ( |
) | |||||||||||||||||||||
| Change in non‐controlling interest | (26) | |||||||||||||||||||||||||||
| Transactions with holders of equity instruments | ( |
) | ( |
) | ( |
) | ( |
) | ||||||||||||||||||||
| Other changes | ( |
) | ( |
) | ||||||||||||||||||||||||
| Other changes in equity | ( |
) | ( |
) | ||||||||||||||||||||||||
| Balance at December 31, 2022 | (26) | ( |
) | |||||||||||||||||||||||||
See the accompanying notes.
CONSOLIDATED STATEMENT OF CHANGES IN EQUITY
continued
(€ million)
| Equity attributable to equity holders of Eni | ||||||||||||||||||||||||||||
| Note | Share capital |
Retained earnings |
Cumulative currency translation differences |
Other reserves and equity instruments | Treasury shares | Profit (loss) for the year | Total | Non-controlling interest | Total equity | |||||||||||||||||||
| Balance at December 31, 2020 | ( |
) | ( |
) | ||||||||||||||||||||||||
| Profit for the year | ||||||||||||||||||||||||||||
| Other items of comprehensive income (loss) | ||||||||||||||||||||||||||||
| Remeasurements of defined benefit plans net of tax effect | (26) | |||||||||||||||||||||||||||
|
Share of “Other comprehensive income (loss)” on equity-accounted investments |
(26) | |||||||||||||||||||||||||||
| Change of minor investments measured at fair value with effects to OCI | (26) | |||||||||||||||||||||||||||
| Items that are not reclassified to profit or loss in later periods | ||||||||||||||||||||||||||||
| Currency translation differences | (26) | |||||||||||||||||||||||||||
| Change in the fair value of cash flow hedge derivatives net of tax effect | (26) | ( |
) | ( |
) | ( |
) | |||||||||||||||||||||
|
Share of “Other comprehensive income (loss)” on equity-accounted investments |
(26) | ( |
) | ( |
) | ( |
) | |||||||||||||||||||||
| Items that may be reclassified to profit or loss in later periods | ( |
) | ||||||||||||||||||||||||||
| Total comprehensive income (loss) of the year | ( |
) | ||||||||||||||||||||||||||
| Dividend distribution of Eni SpA | (26) | ( |
) | ( |
) | ( |
) | |||||||||||||||||||||
| Interim dividend distribution of Eni SpA | (26) | ( |
) | ( |
) | ( |
) | |||||||||||||||||||||
| Dividend distribution of other companies | ( |
) | ( |
) | ||||||||||||||||||||||||
| Allocation of 2020 loss | ( |
) | ||||||||||||||||||||||||||
| Purchase of treasury shares | (26) | ( |
) | ( |
) | ( |
) | ( |
) | |||||||||||||||||||
| Long-term share-based incentive plan | (26)(30) | ( |
) | |||||||||||||||||||||||||
|
Increase in non‐controlling interest relating to acquisition of consolidated entities |
( |
) | ( |
) | ||||||||||||||||||||||||
| Issue of perpetual subordinated bonds | (26) | |||||||||||||||||||||||||||
| Coupon payment on perpetual subordinated bonds | (26) | ( |
) | ( |
) | ( |
) | |||||||||||||||||||||
| Transactions with holders of equity instruments | ( |
) | ( |
) | ( |
) | ( |
) | ( |
) | ||||||||||||||||||
| Costs for the issue of perpetual subordinated bonds | ( |
) | ( |
) | ( |
) | ||||||||||||||||||||||
| Other changes | ( |
) | ||||||||||||||||||||||||||
| Other changes in equity | ( |
) | ( |
) | ( |
) | ||||||||||||||||||||||
| Balance at December 31, 2021 | (26) | ( |
) | |||||||||||||||||||||||||
See the accompanying notes.
CONSOLIDATED STATEMENT OF CHANGES IN EQUITY
continued
(€ million)
| Equity attributable to equity holders of Eni | ||||||||||||||||||||||||||||
| Share capital |
Retained earnings |
Cumulative currency translation differences |
Other reserves and equity instruments | Treasury shares | Profit (loss) for the year | Total | Non-controlling interest | Total equity | ||||||||||||||||||||
| Balance at December 31, 2019 | ( |
) | ||||||||||||||||||||||||||
| Profit (loss) for the year | ( |
) | ( |
) | ( |
) | ||||||||||||||||||||||
| Other items of comprehensive (loss) | ||||||||||||||||||||||||||||
|
Remeasurements of defined benefit plans net of tax effect |
||||||||||||||||||||||||||||
|
Change of minor investments measured at fair value with effects to OCI |
||||||||||||||||||||||||||||
|
Items that are not reclassified to profit or loss in later periods |
||||||||||||||||||||||||||||
| Currency translation differences | ( |
) | ( |
) | ( |
) | ( |
) | ||||||||||||||||||||
|
Change in the fair value of cash flow hedge derivatives net of tax effect |
||||||||||||||||||||||||||||
|
Share of “Other comprehensive income (loss)” on equity-accounted investments |
||||||||||||||||||||||||||||
|
Items that may be reclassified to profit or loss in later periods |
( |
) | ( |
) | ( |
) | ||||||||||||||||||||||
| Total comprehensive (loss) of the year | ( |
) | ( |
) | ( |
) | ( |
) | ||||||||||||||||||||
| Dividend distribution of Eni SpA | ( |
) | ( |
) | ( |
) | ||||||||||||||||||||||
| Interim dividend distribution of Eni SpA | ( |
) | ( |
) | ( |
) | ||||||||||||||||||||||
| Dividend distribution of other companies | ( |
) | ( |
) | ||||||||||||||||||||||||
| Allocation of 2019 profit | ( |
) | ||||||||||||||||||||||||||
| Cancellation of treasury shares | ( |
) | ||||||||||||||||||||||||||
| Long-term share-based incentive plan | ||||||||||||||||||||||||||||
|
Increase in non‐controlling interest relating to acquisition of consolidated entities |
||||||||||||||||||||||||||||
| Issue of perpetual subordinated bonds | ||||||||||||||||||||||||||||
| Transactions with holders of equity instruments | ( |
) | ( |
) | ||||||||||||||||||||||||
| Costs for the issue of perpetual subordinated bonds | ( |
) | ( |
) | ( |
) | ||||||||||||||||||||||
| Other changes | ( |
) | ( |
) | ( |
) | ( |
) | ( |
) | ( |
) | ||||||||||||||||
| Other changes in equity | ( |
) | ( |
) | ( |
) | ( |
) | ( |
) | ( |
) | ||||||||||||||||
| Balance at December 31, 2020 | ( |
) | ( |
) | ||||||||||||||||||||||||
(€ million)
| Note | 2022 | 2021 | 2020 | |||||||
| Profit (loss) | ( |
) | ||||||||
| Adjustments to reconcile profit (loss) to net cash provided by operating activities | ||||||||||
| Depreciation and amortization | (12) (13) (14) | |||||||||
| Net Impairments (reversals) of tangible, intangible and right-of-use assets | (15) | |||||||||
| Write-off of tangible and intangible assets | (12) (14) | |||||||||
| Share of (profit) loss of equity-accounted investments | (16) (32) | ( |
) | |||||||
| Net gain on disposal of assets | ( |
) | ( |
) | ( |
) | ||||
| Dividend income | (32) | ( |
) | ( |
) | ( |
) | |||
| Interest income | ( |
) | ( |
) | ( |
) | ||||
| Interest expense | ||||||||||
| Income taxes | (33) | |||||||||
| Other changes | ( |
) | ( |
) | ||||||
| Cash flow from changes in working capital: | ( |
) | ( |
) | ( |
) | ||||
| - inventories | ( |
) | ( |
) | ||||||
| - trade receivables | ( |
) | ( |
) | ||||||
| - trade payables | ( |
) | ||||||||
| - provisions | ( |
( |
||||||||
| - other assets and liabilities | ( |
) | ( |
) | ||||||
| Change in the provisions for employee benefits | ||||||||||
| Dividends received | ||||||||||
| Interest received | ||||||||||
| Interest paid | ( |
) | ( |
) | ( |
) | ||||
| Income taxes paid, net of tax receivables received | ( |
) | ( |
) | ( |
) | ||||
| Net cash provided by operating activities | ||||||||||
| - of which with related parties | (36) | ( |
) | ( |
) | |||||
| Cash flow from investing activities | ( |
) | ( |
) | ( |
) | ||||
| - tangible assets | (12) | ( |
) | ( |
) | ( |
) | |||
| - prepaid right-of-use assets | (13) | ( |
) | ( |
) | |||||
| - intangible assets | (14) | ( |
) | ( |
) | ( |
) | |||
| - consolidated subsidiaries and businesses net of cash and cash equivalents acquired | (27) | ( |
) | ( |
) | ( |
) | |||
| - investments | (16) | ( |
) | ( |
) | ( |
) | |||
| - securities and financing receivables held for operating purposes | ( |
) | ( |
) | ( |
) | ||||
| - change in payables in relation to investing activities | ( |
) | ||||||||
| Cash flow from disposals | ||||||||||
| - tangible assets | ||||||||||
| - intangible assets | ||||||||||
| - consolidated subsidiaries and businesses net of cash and cash equivalents disposed of | (27) | ( |
) | |||||||
| - tax on disposals | ( |
) | ||||||||
| - investments | ||||||||||
| - securities and financing receivables held for operating purposes | ||||||||||
| - change in receivables in relation to disposals | ( |
|||||||||
| Net change in securities and financing receivables held for non-operating purposes | ( |
) | ||||||||
| Net cash used in investing activities | ( |
) | ( |
) | ( |
) | ||||
| - of which with related parties | (36) | ( |
) | ( |
) | ( |
) |
See the accompanying notes.
CONSOLIDATED STATEMENT OF CASH FLOWS
continued
(€ million)
| Note | 2022 | 2021 | 2020 | |||||||
| Increase in long-term financial debt | (19) | |||||||||
| Repayments of long-term financial debt | (19) | ( |
) | ( |
) | ( |
) | |||
| Payments of lease liabilities | (13) | ( |
) | ( |
) | ( |
) | |||
| Increase (decrease) in short-term financial debt | (19) | ( |
) | |||||||
| Dividends paid to Eni's shareholders | ( |
) | ( |
) | ( |
) | ||||
| Dividends paid to non-controlling interest | ( |
) | ( |
) | ( |
) | ||||
| Capital contribution by non-controlling interests | ||||||||||
| Sale (purchase) of additional interests in consolidated subsidiaries | ( |
) | ||||||||
| Purchase of treasury shares | (26) | ( |
) | ( |
) | |||||
| Issue of perpetual subordinated bonds | (26) | |||||||||
| Coupon payment on perpetual subordinated bonds | (26) | ( |
) | ( |
) | |||||
| Net cash used in financing activities | ( |
) | ( |
) | ||||||
| - of which with related parties | (36) | ( |
) | ( |
) | |||||
| Effect of exchange rate changes and other changes on cash and cash equivalents | ( |
) | ||||||||
| Net increase (decrease) in cash and cash equivalents | ( |
) | ||||||||
| Cash and cash equivalents - beginning of the year | (6) | |||||||||
| Cash and cash equivalents - end of the year (a) | (6) |
(a) As of December 31, 2022, cash and cash equivalents included €
See the accompanying notes.
1 Significant accounting policies, estimates and judgments
Basis of preparation
The Consolidated Financial Statements of Eni SpA and its subsidiaries (collectively referred to as Eni or the Group) have been prepared on a going concern basis in accordance with International Financial Reporting Standards (IFRS)1 as issued by the International Accounting Standards Board (IASB).
The Consolidated Financial Statements have been prepared under the historical cost convention, taking into account, where appropriate, value adjustments, except for certain items that under IFRSs must be measured at fair value as described in the accounting policies that follow. The principles of consolidation and the significant accounting policies that follow have been consistently applied to all years presented, except where otherwise indicated.
The 2022 Consolidated Financial Statements included in the Annual Report on Form 20-F, were approved by the Eni’s Board of Directors on April 3, 2023.
The Consolidated Financial Statements are presented in euros and all values are rounded to the nearest million euros (€ million), except where otherwise indicated.
Significant accounting estimates and judgements
The preparation of the Consolidated Financial Statements requires the use of estimates and assumptions that affect the assets, liabilities, revenues and expenses recognised in the financial statements, as well as amounts included in the notes thereto, including disclosure of contingent assets and contingent liabilities. Estimates made are based on complex judgements and past experience of other assumptions deemed reasonable in consideration of the information available at the time. The accounting policies and areas that require the most significant judgments and estimates to be used in the preparation of the Consolidated Financial Statements are in relation to the accounting for oil and natural gas activities, specifically in the determination of reserves, impairment of financial and non-financial assets, leases, decommissioning and restoration liabilities, environmental liabilities, business combinations, employee benefits, revenue from contracts with customers, fair value measurements and income taxes. Although the Company uses its best estimates and judgements, actual results could differ from the estimates and assumptions used. The accounting estimates and judgments relevant for the preparation of the Consolidated Financial Statement are described below.
Significant accounting estimates and judgments made in assessing the impacts of climate-related risks
Significant accounting estimates and judgments made by management for the preparation of the 2022 Consolidated Financial Statements are affected by the effects of actions to address climate change and by the potential impact of the energy transition. In particular, the global pressure towards a low-carbon economy, increasingly restrictive regulatory requirements for oil&gas activities and hydrocarbons consumption, carbon pricing schemes, the technological evolution of alternative energy sources for transportation, as well as changes in consumer preferences could imply a structural decline of the demand for hydrocarbons in the medium-long term, an increase in operating costs and a higher risk of stranded assets for Eni.
The Eni strategy provides for the achievement of carbon neutrality by 2050, in line with the provisions of the scenarios compatible with maintaining global warming within the 1.5°C threshold; furthermore, this strategy sets intermediate targets for 2030 and 2040 in terms of reduction in absolute emissions and carbon intensity. Scenarios adopted by management take into account policies, regulatory requirements and current and expected developments in technology and set out a development path of the future energy system, on the basis of an economic and demographic framework, analysis of existing and announced policies and technologies, identifying those which can reasonably reach maturity within the considered time horizon. Price variables reflect the best estimate by management of the fundamentals of several energy markets, which incorporates the ongoing and reasonably expected decarbonisation trends, and are subject to continuous benchmarking with the views of market analysts and peers.
| 1 IFRSs include also International Accounting Standards (IAS), currently effective, as well as the interpretations developed by the IFRS Interpretations Committee, previously named International Financial Reporting Interpretations Committee (IFRIC) and initially Standing Interpretations Committee (SIC). |
|
Such scenarios represent the basis for significant estimates and judgments relating to: (i) the assessment of the intention to continue exploration projects; (ii) the assessment of the recoverability of non-current assets and credit exposures towards National Oil Companies; (iii) the definition of useful lives and residual values of fixed assets; (iv) impacts on provisions (e.g. the bringing forward of the expected timing of decommissioning and restoration costs).
For further information on sensitivity analyses performed on the values of assets considering the low carbon scenarios of international bodies, see Item 3 – Risk factors.
Principles of consolidation
Subsidiaries
The Consolidated Financial Statements comprise the financial statements of the parent Company Eni SpA and those of its subsidiaries, being those entities over which the Company has control, either directly or indirectly, through exposure or rights to their variable returns and the ability to affect those returns through its power over the investees. To have power over an investee, the investor must have existing rights that give it the current ability to direct the relevant activities of the investee, i.e. the activities that significantly affect the investee’s returns.
Subsidiaries are consolidated, on the basis of consistent accounting policies, from the date on which control is obtained until the date that control ceases.
Assets, liabilities, income and expenses of consolidated subsidiaries are fully recognised with those of the parent in the Consolidated Financial Statements, taking into account the appropriate eliminations of intragroup transactions (see the accounting policy for “Intragroup transactions”); the parent’s investment in each subsidiary is eliminated against the corresponding parent’s portion of equity of each subsidiary. Non-controlling interests are presented separately on the balance sheet within equity; the profit or loss and comprehensive income attributable to non-controlling interests are presented in specific line items, respectively, in the profit and loss account and in the statement of comprehensive income.
Taking into account the lack of any material2 impact on the representation of the financial position and performance of the Group3, the Consolidated Financial Statements do not consolidate: (i) some subsidiaries that are immaterial, both individually and in the aggregate, and (ii) subsidiaries acting as sole-operator in the management of oil and gas contracts on behalf of companies participating in a joint project. In the latter case, the activities are financed proportionally based on a budget approved by the participating companies upon presentation of periodical reports of proceeds and expenses. Costs and revenue and other operating data (production, reserves, etc.) of the project, as well as the related obligations arising from the project, are recognised directly in the financial statements of the companies involved based on their own share.
When the proportion of the equity held by non-controlling interests changes, any difference between the consideration paid/received and the amount by which the related non-controlling interests are adjusted is attributed to Eni owners’ equity. Conversely, the sale of equity interests with loss of control determines the recognition in the profit and loss account of: (i) any gain or loss calculated as the difference between the consideration received and the corresponding transferred net assets; (ii) any gain or loss recognised as a result of the remeasurement of any investment retained in the former subsidiary at its fair value; and (iii) any amount related to the former subsidiary previously recognised in other comprehensive income which may be reclassified subsequently to the profit and loss account4. Any investment retained in the former subsidiary is recognised at its fair value at the date when control is lost and shall be accounted for in accordance with the applicable measurement criteria.
| 2According to IFRSs, information is material if omitting, misstating or obscuring it could reasonably be expected to influence decisions that the primary users of general purpose financial statements make on the basis of those financial statements. | |
| 3 Unconsolidated subsidiaries are accounted for as described in the accounting policy for “The equity method of accounting”. | |
| 4 Conversely, any amount related to the former subsidiary previously recognised in other comprehensive income, which may not be reclassified subsequently to the profit and loss account, are reclassified in another item of equity. | |
Interests in joint arrangements
Joint control is the contractually agreed sharing of control of an arrangement, which exists only when decisions about the relevant activities require the unanimous consent of the parties sharing control.
A joint venture is a joint arrangement whereby the parties that have joint control of the arrangement have rights to the net assets of the arrangement. Investments in joint ventures are accounted for using the equity method as described in the accounting policy for “The equity method of accounting”.
A joint operation is a joint arrangement whereby the parties that have joint control of the arrangement have enforceable rights to the assets, and enforceable obligations for the liabilities, relating to the arrangement; in the Consolidated Financial Statements, Eni recognises its share of the assets/liabilities and revenues/expenses of joint operations on the basis of its rights and obligations relating to the arrangements.
After the initial recognition, the assets/liabilities and revenues/expenses of the joint operations are measured in accordance with the applicable measurement criteria. Immaterial joint operations structured through a separate vehicle are accounted for using the equity method or, if this does not result in a misrepresentation of the Company’s financial position and performance, at cost less any impairment losses.
Investments in joint venture, previously classified as joint operations are measured on the date of change in the classification of the joint arrangement at the net amount of the carrying amounts of the assets and liabilities that Eni had previously recognised, line by line, on the basis of its rights and obligations relating to the arrangement.
Investments in associates
An associate is an entity over which Eni has significant influence, that is the power to participate in the financial and operating policy decisions of the investee but is not control or joint control of those policies. Investments in associates are accounted for using the equity method as described in the accounting policy for “The equity method of accounting”.
The equity method of accounting
Investments in joint ventures, associates and immaterial unconsolidated subsidiaries, are accounted for using the equity method.5
Under the equity method, investments are initially recognised at cost6, allocating it, similarly to business combinations procedures, to the investee’s identifiable assets/liabilities; any excess of the cost of the investment over the share of the net fair value of the investee’s identifiable assets and liabilities is accounted for as goodwill, not separately recognised but included in the carrying amount of the investment. If this allocation is provisionally recognised at initial recognition, it can be retrospectively adjusted within one year from the acquisition date, to reflect new information obtained about facts and circumstances that existed at the acquisition date. Subsequently, the carrying amount is adjusted to reflect: (i) the investor’s share of the profit or loss of the investee after the date of acquisition, adjusted to account for depreciation, amortization and any impairment losses of the equity-accounted entity’s assets based on their fair values at the date of acquisition; and (ii) the investor’s share of the investee’s other comprehensive income. Distributions received from an equity-accounted investee reduce the carrying amount of the investment. In applying the equity method, consolidation adjustments are considered (see also the accounting policy for “Subsidiaries”). Losses arising from the application of the equity method in excess of the carrying amount of the investment, recognised in the profit and loss account within “Income (Expense) from investments”, reduce the carrying amount, net of the related expected credit losses (see below), of any financing receivables towards the investee for which settlement is neither planned nor likely to occur in the foreseeable future (the so-called long-term interests), which are, in substance, an extension of the investment in the investee. The investor’s share of any losses of an equity-accounted investee that exceeds the carrying amount of the investment and any long-term interests (the so-called net investment), is recognised in a specific provision only to the extent that the investor has incurred legal or constructive obligations or made payments on behalf of the investee.
| 5 Joint ventures, associates and immaterial unconsolidated subsidiaries are accounted for at cost less any impairment losses, if this does not result in a misrepresentation of the Company's financial position and performance. | |
| 6 If an investment in an equity instrument becomes an equity-accounted investee, the related cost is the sum of the fair value of the previously held equity interest in the investee and the fair value of any consideration transferred. | |
Whenever there is objective evidence of impairment (e.g. relevant breaches of contracts, significant financial difficulty, probable default of the counterparty, etc.), the carrying amount of the net investment, resulting from the application of the abovementioned measurement criteria, is tested for impairment by comparing it with the related recoverable amount, determined by adopting the criteria indicated in the accounting policy for “Impairment of non-financial assets”. When an impairment loss no longer exists or has decreased, any reversal of the impairment loss is recognised in the profit and loss account within “Income (Expense) from investments”. The impairment reversal of the net investment shall not exceed the previously recognised impairment losses.
The sale of equity interests with loss of joint control or significant influence over the investee determines the recognition in the profit and loss account of: (i) any gain or loss calculated as the difference between the consideration received and the corresponding transferred share; (ii) any gain or loss recognised as a result of the remeasurement of any investment retained in the former joint venture/associate at its fair value7; and (iii) any amount related to the former joint venture/associate previously recognised in other comprehensive income which may be reclassified subsequently to the profit and loss account8. Any investment retained in the former joint venture/associate is recognised at its fair value at the date when joint control or significant influence is lost and shall be accounted for in accordance with the applicable measurement criteria.
Business combinations
Business combinations are accounted for by applying the acquisition method. The consideration transferred in a business combination is the sum of the acquisition-date fair value of the assets transferred, the liabilities incurred and the equity interests issued by the acquirer. The consideration transferred includes also the fair value of any assets or liabilities resulting from contingent considerations, contractually agreed and dependent upon the occurrence of specified future events. Acquisition-related costs are accounted for as expenses when incurred.
The acquirer shall measure the identifiable assets acquired and liabilities assumed at their acquisition-date fair values9, unless another measurement basis is required by IFRSs. The excess of the consideration transferred over the Group’s share of the acquisition-date fair values of the identifiable assets acquired and liabilities assumed is recognised, on the balance sheet, as goodwill; conversely, a gain on a bargain purchase is recognised in the profit and loss account.
Any non-controlling interests are measured as the proportionate share in the recognised amounts of the acquiree’s identifiable net assets at the acquisition date excluding the portion of goodwill attributable to them (partial goodwill method). In a business combination achieved in stages, the purchase price is determined by summing the acquisition-date fair value of previously held equity interests in the acquiree and the consideration transferred for obtaining control; the previously held equity interests are remeasured at their acquisition-date fair value and the resulting gain or loss, if any, is recognised in the profit and loss account. Furthermore, on obtaining control, any amount recognised in other comprehensive income related to the previously held equity interests is reclassified to the profit and loss account, or in another item of equity when such amount may not be reclassified to the profit and loss account.
If the initial accounting for a business combination is incomplete by the end of the reporting period in which the combination occurs, the provisional amounts recognised at the acquisition date shall be retrospectively adjusted within one year from the acquisition date, to reflect new information obtained about facts and circumstances that existed as of the acquisition date.
The acquisition of interests in a joint operation whose activity constitutes a business is accounted for applying the principles on business combinations accounting. In this regard, if the entity obtains control over a business that was a joint operation, the previously held interest in the joint operation is remeasured at the acquisition-date fair value and the resulting gain or loss is recognized in the profit and loss account.10
| 7 If the retained investment continues to be classified either as a joint venture or an associate and so accounted for using the equity method, no remeasurement at fair value is recognised in the profit and loss account. | |
| 8 Conversely, any amount related to the former joint venture/associate previously recognised in other comprehensive income, which may not be reclassified subsequently to the profit and loss account, are reclassified in another item of equity. | |
| 9 Fair value measurement principles are described in the accounting policy for “Fair value measurements”. | |
Significant accounting estimates and judgments: investments and business combinations
The assessment of the existence of control, joint control, significant influence over an investee, as well as for joint operations, the assessment of the existence of enforceable rights to the investee’s assets and enforceable obligations for the investee’s liabilities imply that management makes complex judgments on the basis of the characteristics of the investee’s structure, arrangements between parties and other relevant facts and circumstances. Significant accounting estimates by management are required also for measuring the identifiable assets acquired and the liabilities assumed in a business combination at their acquisition-date fair values. For such measurement, to be performed also for the application of the equity method, Eni adopts the valuation techniques generally used by market participants taking into account the available information; for the most significant business combinations, Eni engages external independent evaluators.
Intragroup transactions
All balances and transactions between consolidated companies, and not yet realised with third parties, including unrealised profits arising from such transactions have been eliminated.
Unrealised profits arising from transactions between the Group and its equity-accounted entities are eliminated to the extent of the Group’s interest in the equity-accounted entity; such accounting treatment is applied also for transfer of businesses to equity-accounted entities (so-called downstream transactions). In both cases, the unrealised losses are not eliminated as the transaction provides evidence of an impairment loss of the asset transferred.
Foreign currency translation
The financial statements of foreign operations having a functional currency other than the euro, that represents the parent’s functional currency as well as the presentation currency of the Consolidated Financial Statements, are translated into euros using the spot exchange rates on the balance sheet date for assets and liabilities, historical exchange rates for equity and average exchange rates for the profit and loss account and the statement of cash flows.
The cumulative resulting exchange differences are presented in the separate component of Eni owners’ equity “Cumulative currency translation differences”11. Cumulative amount of exchange differences relating to a foreign operation are reclassified to the profit and loss account when the entity disposes the entire interest in that foreign operation or when the partial disposal involves the loss of control, joint control or significant influence over the foreign operation. On a partial disposal that does not involve loss of control of a subsidiary that includes a foreign operation, the proportionate share of the cumulative exchange differences is reattributed to the non-controlling interests in that foreign operation. On a partial disposal of interests in joint arrangements or in associates that does not involve loss of joint control or significant influence, the proportionate share of the cumulative exchange differences is reclassified to the profit and loss account. The repayment of share capital made by a subsidiary having a functional currency other than the euro, without a change in the ownership interest, implies that the proportionate share of the cumulative amount of exchange differences relating to the subsidiary is reclassified to the profit and loss account.
The financial statements of foreign operations which are translated into euros are denominated in the foreign operations’ functional currencies which generally is the U.S. dollar.
| 10 If the entity acquires additional interests in a joint operation that is a business, while retaining joint control, the previously held interest in the joint operation is not remeasured. | |
| 11 When the foreign subsidiary is partially owned, the cumulative exchange difference, that is attributable to the non-controlling interests, is allocated to and recognised as part of “Non-controlling interest”. | |
The main foreign exchange rates used to translate the financial statements into the parent’s functional currency are indicated below:
| (currency amount for 1 €) | Annual average exchange rate 2022 | Exchange rate at December 31, 2022 | Annual average exchange rate 2021 | Exchange rate at December 31, 2021 | Annual average exchange rate 2020 | Exchange rate at December 31, 2020 | |||||||||||
| U.S. Dollar | |||||||||||||||||
| Pound Sterling | |||||||||||||||||
| Australian Dollar |
Significant accounting policies
The most significant accounting policies used in the preparation of the Consolidated Financial Statements are described below.
Oil and natural gas exploration, appraisal, development and production activities
Oil and natural gas exploration, appraisal and development activities are accounted for using the principles of the successful efforts method of accounting as described below.
Acquisition of exploration rights
Costs incurred for the acquisition of exploration rights (or their extension) are initially capitalised within the line item “Intangible assets” as “exploration rights — unproved” pending determination of whether the exploration and appraisal activities in the reference areas are successful or not. Unproved exploration rights are not amortised, but reviewed to confirm that there is no indication that the carrying amount exceeds the recoverable amount. This review is based on the confirmation of the commitment of the Company to continue the exploration activities and on the analysis of facts and circumstances that indicate the absence of uncertainties related to the recoverability of the carrying amount. If no future activity is planned, the carrying amount of the related exploration rights is recognised in the profit and loss account as write-off. Lower value exploration rights are pooled and amortised on a straight-line basis over the estimated period of exploration. In the event of a discovery of proved reserves (i.e. upon recognition of proved reserves and internal approval for development), the carrying amount of the related unproved exploration rights is reclassified to “proved exploration rights”, within the line item “Intangible assets”. Upon reclassification, as well as whether there is any indication of impairment, the carrying amount of exploration rights to reclassify as proved is tested for impairment considering the higher of their value in use and their fair value less costs of disposal. From the commencement of production, proved exploration rights are amortised according to the unit of production method (the so-called UOP method, described in the accounting policy for “UOP depreciation, depletion and amortisation”).
Acquisition of mineral interests
Costs incurred for the acquisition of mineral interests are capitalised in connection with the assets acquired (such as exploration potential, possible and probable reserves and proved reserves). When the acquisition is related to a set of exploration potential and reserves, the cost is allocated to the different assets acquired based on their expected discounted cash flows.
Acquired exploration potential is measured in accordance with the criteria illustrated in the accounting policy for “Acquisition of exploration rights”. Costs associated with proved reserves are amortised according to the UOP method (see the accounting policy for “UOP depreciation, depletion and amortisation”). Expenditure associated with possible and probable reserves (unproved mineral interests) is not amortised until classified as proved reserves; in case of a negative result of the subsequent appraisal activities, it is written off.
Exploration and appraisal expenditure
Geological and geophysical exploration costs are recognised as an expense as incurred.
Costs directly associated with an exploration well are initially recognised within tangible assets in progress, as “exploration and appraisal costs — unproved” (exploration wells in progress) until the drilling of the well is completed and can continue to be capitalised in the following
Development costs
Development costs, including the costs related to unsuccessful and damaged development wells, are capitalised as “Tangible asset in progress — proved”. Development costs are incurred to obtain access to proved reserves and to provide facilities for extracting, treating, gathering and storing the oil and gas. They are amortised, from the commencement of production, generally on a UOP basis. When development projects are unfeasible/not carried on, the related costs are written off when it is decided to abandon the project. Development costs are tested for impairment in accordance with the criteria described in the accounting policy for “Property, plant and equipment”.
UOP depreciation, depletion and amortisation
Proved oil and gas assets are depreciated generally under the UOP method, as their useful life is closely related to the availability of proved oil and gas reserves, by applying, to the depreciable amounts at the end of each quarter a rate representing the ratio between the volumes extracted during the quarter and the reserves existing at the end of the quarter, increased by the volumes extracted during the quarter. This method is applied with reference to the smallest aggregate representing a direct correlation between expenditures to be depreciated and oil and gas reserves. Proved exploration rights and acquired proved mineral interests are amortised over proved reserves; proved exploration and appraisal costs and development costs are depreciated over proved developed reserves, while common facilities are depreciated over total proved reserves. Proved reserves are determined according to U.S. SEC rules that require the use of the yearly average oil and gas prices for assessing the economic producibility; material changes in reference prices could result in depreciation charges not reflecting the pattern in which the assets’ future economic benefits are expected to be consumed to the extent that, for example, certain non-current assets would be fully depreciated within a short term. In these cases the reserves considered in determining the UOP rate are estimated on the basis of economic viability parameters, reasonable and consistent with management’s expectations of production, in order to recognise depreciation charges that more appropriately reflect the expected utilization of the assets concerned.
Production costs
Production costs are those costs incurred to operate and maintain wells and field equipment and are recognised as an expense as incurred.
Production Sharing Agreements and service contracts
Oil and gas reserves related to Production Sharing Agreements are determined on the basis of contractual terms related to the recovery of the contractor’s costs to undertake and finance exploration, development and production activities at its own risk (Cost Oil) and the Company’s stipulated share of the production remaining after such cost recovery (Profit Oil). Revenues from the sale of the lifted production, against both Cost Oil and Profit Oil, are accounted for on an accrual basis, whilst exploration, development and production costs are accounted for according to the above-mentioned accounting policies. A similar scheme applies to the service contracts where the Group is entitled to a share of the production as consideration for the rendered service.
The Company’s share of production volumes and reserves includes the share of hydrocarbons that corresponds to the taxes to be paid, according to the contractual agreement, by the national government on behalf of the Company. As a consequence, the Company has to recognise at the same time an increase in the taxable profit, through the increase of the revenue, and a tax expense.
Plugging and abandonment of wells
Costs expected to be incurred with respect to the plugging and abandonment of a well, dismantlement and removal of production facilities, as well as site restoration, are capitalised, consistent with the accounting policy described under “Property, plant and equipment”, and then depreciated on a UOP basis.
Significant accounting estimates and judgments: oil and natural gas activities
Engineering estimates of the Company’s oil and gas reserves are inherently uncertain. Proved reserves are the estimated volumes of crude oil, natural gas and gas condensates, liquids and associated substances which geological and engineering data demonstrate that can be economically producible with reasonable certainty from known reservoirs under existing economic conditions and operating methods. Although there are authoritative guidelines regarding the engineering and geological criteria that must be met before estimated oil and gas reserves can be categorised as “proved”, the accuracy of reserve estimates depends on a number of factors, assumptions and variables, including: (i) the quality of available geological, technical and economic data and their interpretation and judgment; (ii) projections regarding future rates of production and operating costs and development costs; (iii) changes in the prevailing tax rules, other government regulations and contractual conditions; (iv) results of drilling, testing and the actual production performance of the Company’s reservoirs after the date of the estimates which may drive substantial upward or downward revisions; and (v) changes in oil and natural gas commodity prices which could affect expected future cash flows and the quantities of the Company’s proved reserves since the estimates of reserves are based on prices and costs existing as of the date when these estimates are made. Lower oil prices or the projections of higher operating and development costs may impair the ability of the Company to economically produce reserves leading to downward reserve revisions.
Many of the factors, assumptions and variables involved in estimating proved reserves are subject to change over time and therefore affect the estimates of oil and natural gas reserves. Similar uncertanties concern unproved reserves.
The determination of whether potentially economic oil and natural gas reserves have been discovered by an exploration well is made within a year after well completion. The evaluation process of a discovery, which requires performing additional appraisal activities on the potential oil and natural gas field and establishing the optimum development plans, can take longer, in most cases, depending on the complexity of the project and on the size of capital expenditures required. During this period, the costs related to these exploration wells remain suspended on the balance sheet. In any case, all such capitalised costs are reviewed, at least, on an annual basis to confirm the continued intent to develop, or otherwise to extract value from the discovery.
Field reserves will be categorised as proved only when all the criteria for attribution of proved status have been met. Proved reserves can be classified as developed or undeveloped. Volumes are classified into proved developed reserves as a consequence of development activity. Generally, reserves are booked as proved developed at the start of production. Major development projects typically take one to four years from the time of initial booking to the start of production.
Estimated proved reserves are used in determining depreciation, amortisation and depletion charges (see the accounting policy for “UOP depreciation, depletion and amortisation”). Assuming all other variables are held constant, an increase in estimated proved developed reserves for each field decreases depreciation, amortisation and depletion charge under the UOP method. Conversely, a decrease in estimated proved developed reserves increases depreciation, amortisation and depletion charge.
Property, plant and equipment, including investment properties, are recognized using the cost model and initially stated at their purchase price or construction cost including any costs directly attributable to bringing the asset to the location and condition necessary for it to be capable of operating in the manner intended by management. For assets that necessarily take a substantial period of time to get ready for their intended use, the purchase price or construction cost comprises the borrowing costs incurred in the period to get the asset ready for use that would have been avoided if the expenditure had not been made.
In the case of a present obligation for dismantling and removal of assets and restoration of sites, the initial carrying amount of an item of property, plant and equipment includes the estimated (discounted) costs to be incurred when the removal event occurs; a corresponding amount is recognised as part of a specific provision (see the accounting policy for “Decommissioning and restoration liabilities”). Analogous approach is adopted for present obligations to realise social projects in oil and gas development areas.
Property, plant and equipment are not revalued for financial reporting purposes.
Expenditures on upgrading, revamping and reconversion are recognised as items of property, plant and equipment when it is probable that they will increase the expected future economic benefits of the asset. Assets acquired for safety or environmental reasons, although not directly increasing the future economic benefits of any particular existing item of property, plant and equipment, qualify for recognition as assets when they are necessary for running the business.
Depreciation of tangible assets begins when they are available for use, i.e. when they are in the location and condition necessary for it to be capable of operating as planned. Property, plant and equipment are depreciated on a systematic basis over their useful life. The useful life is the period over which an asset is expected to be available for use by the Company. When tangible assets are composed of more than one significant part with different useful lives, each part is depreciated separately. The depreciable amount is the asset’s carrying amount less its residual value at the end of its useful life, if it is significant and can be reasonably determined. Land is not depreciated, even when acquired together with a building. Tangible assets held for sale are not depreciated (see the accounting policy for “Assets held for sale and discontinued operations”). Changes in the asset's useful life, in its residual value or in the pattern of consumption of the future economic benefits embodied in the asset, are accounted for prospectively.
Assets to be handed over for no consideration are depreciated over the shorter term between the duration of the concession or the asset’s useful life.
Replacement costs of identifiable parts in complex assets are capitalised and depreciated over their useful life; the residual carrying amount of the part that has been substituted is charged to the profit and loss account. Non-removable leasehold improvements are depreciated over the earlier of the useful life of the improvements and the lease term. Expenditures for ordinary maintenance and repairs are recognised as an expense as incurred.
The carrying amount of property, plant and equipment is derecognised on disposal or when no future economic benefits are expected from its use or disposal; the arising gain or loss is recognized in the profit and loss account.
Leases 12
A contract is, or contains, a lease, if the contract conveys the right to control the use of an identified asset for a period of time in exchange for consideration13; such right exists whether, throughout the period of use, the customer has both the right to obtain substantially all of the economic benefits from use of the identified asset and the right to direct the use of the identified asset.
At the commencement date of the lease (i.e. the date on which the underlying asset is available for use), a lessee recognises on the balance sheet an asset representing its right to use the underlying leased asset (hereinafter also referred as right-of-use asset) and a liability representing its obligation to make lease payments during the lease term (hereinafter also referred as lease liability).14 The lease term is the non-cancellable period of a contract, together with, if reasonably certain, periods covered by extension options or by the non-exercise of termination options.
| 12 As expressly provided for in IFRS 16, this accounting policy does not apply to leases to explore for and extract resources such as those for oil and gas rights, leases of land and any rights of way related to oil and gas activities. | |
| 13 The assessment of whether the contract is, or contains, a lease is performed at the inception date, that is the earlier of the date of a lease agreement and the date of commitment by the parties to the principal terms and conditions of the lease. | |
In particular, the lease liability is initially recognised at the present value of the following lease payments15 that are not paid at the commencement date: (i) fixed payments (including in-substance fixed payments), less any lease incentives receivable; (ii) variable lease payments that on an index or a rate16; (iii) amounts expected to be payable by the lessee under residual value guarantees; (iv) the exercise price of a purchase option if the lessee is reasonably certain to exercise that option; and (v) payments of penalties for terminating the lease, if the lease term reflects the lessee exercising an option to terminate the lease. The lease payments are discounted using the interest rate implicit in the lease or, if that rate cannot be readily determined, the lessee’s incremental borrowing rate. The latter is determined considering the term of the lease, the frequency and currency of the contractual lease payments, as well as the features of the lessee’s economic environment (reflected in the country risk premium assigned to each country where Eni operates).
After the initial recognition, the lease liability is measured on an amortised cost basis and is remeasured, normally, as an adjustment to the carrying amount of the related right-of-use asset, to reflect changes to the lease payments due, essentially, to: (i) modifications in the lease contract not accounted as a separate lease; (ii) changes in indexes or rates (used to determine the variable lease payments); or (iii) changes in the assessment of contractual options (e.g. options to purchase the underlying asset, extension or termination options).
The right-of-use asset is initially measured at cost, which comprises: (i) the amount of the initial measurement of the lease liability; (ii) any initial direct costs incurred by the lessee17; (iii) any lease payments made at or before the commencement date, less any lease incentives received; and (iv) an estimate of costs to be incurred by the lessee in dismantling and removing the underlying asset, restoring the site on which it is located or restoring the underlying asset to the condition required by the terms and conditions of the lease. After the initial recognition, the right-of-use asset is adjusted for any accumulated depreciation18, any accumulated impairment losses (see the accounting policy for “Impairment of non-financial assets”) and any remeasurement of the lease liability.
The depreciation charges of the right-of-use asset and the interest expenses on the lease liability directly attributable to the construction of an asset are capitalised as part of the cost of such asset and subsequently recognised in the profit and loss account through depreciation/impairments or write-off, mainly in the case of exploration assets.
In the oil and gas activities, the operator of an unincorporated joint operation which enters into a lease contract as the sole signatory recognises on the balance sheet: (i) the entire lease liability if, based on the contractual provisions and any other relevant facts and circumstances, it has primary responsibility for the liability towards the third-party supplier; and (ii) the entire right-of-use asset, unless, on the basis of the terms and conditions of the contract, there is a sublease with the followers.
The followers’ share of the right-of-use asset, recognised by the operator, will be recovered according to the joint operation’s contractual arrangements by billing the project costs attributable to the followers and collecting the related cash calls. Costs recovered from the followers are recognised as “Other income and revenues” in the profit and loss account and as net cash provided by operating activities in the statement of cash flows.
Differently, if a lease contract is signed by all the partners, Eni recognises its share of the right-of-use asset and lease liability on the balance sheet based on its working interest.
| 14 Eni applies the recognition exemptions allowed for short-term leases (for certain classes of underlying assets) and low-value leases, by recognising the lease payments associated with those leases as an expense on a straight-line basis over the lease term. | |
| 15 Eni, in accordance with the practical expedient allowed by the accounting standard, does not separate non-lease components from lease components except for main contracts related to upstream activities (drilling rigs), which provide for single payments relating to both lease and non-lease components. | |
| 16 Conversely, the other kinds of variable lease payments (e.g. payments that depend on the use of an underlying leased asset) are not included in the carrying amount of the lease liability, but are recognised in the profit and loss account as operating expenses over the lease term. | |
| 17 Initial direct costs are incremental costs of obtaining a lease that would not have been incurred if the lease had not been obtained. | |
| 18 Depreciation charges are recognised on a systematic basis from the commencement date to the earlier of the end of the useful life of the right-ofuse asset or the end of the lease term. Nevertheless, if the lease transfers ownership of the underlying asset to the lessee by the end of the lease term, or if the cost of the right-of-use asset reflects that the lessee will exercise a purchase option, the right-of-use asset is depreciated from the commencement date to the end of the useful life of the underlying asset. | |
If Eni does not have primary responsibility for the lease liability and, on the basis of the terms and conditions of the contract, there is not a sublease, it does not recognise any right-of-use asset and lease liability related to the lease contract.
When lease contracts are entered into by companies other than subsidiaries that act as operators on behalf of the other participating companies (the so-called operating companies), consistent with the provision to recover from the followers the costs related to the oil and gas activities, the participating companies recognise their share of the right-of-use assets and the lease liabilities based on their working interest, defined according to the expected use, to the extent that it is reliably determinable, of the underlying assets.
Significant accounting estimates and judgments: lease transactions
With reference to lease contracts, management makes significant estimates and judgments related to: (i) determining the lease term, making assumptions about the exercise of extension and/or termination options; (ii) determining the lessee’s incremental borrowing rate; (iii) identifying and, where appropriate, separating non-lease components from lease components, where an observable stand-alone price is not readily available, taking into account also the analysis performed with external experts; (iv) recognising lease contracts, for which the underlying assets are used in oil and gas activities (mainly drilling rigs and FPSOs), entered into as operator within an unincorporated joint operation, considering if the operator has primary responsibility for the liability towards the third-party supplier and the relationships with the followers; (v) identifying the variable lease payments and the related characteristics in order to include them in the measurement of the lease liability.
Intangible assets
Intangible assets are identifiable non-monetary assets without physical substance, controlled by the Company and able to produce future economic benefits, and goodwill. An asset is classified as intangible when management is able to distinguish it clearly from goodwill.
Intangible assets are initially recognised at cost as determined by the criteria used for tangible assetsand they are never revalued for financial reporting purposes.
Intangible assets with finite useful lives are amortised on a systematic basis over their useful life; the amortisation is carried out in accordance with the criteria described in the accounting policy for “Property, plant and equipment”.
Goodwill and intangible assets with indefinite useful lives are not amortised. For the recoverability of the carrying amounts of goodwill and other intangible assets see the accounting policy for “Impairment of non-financial assets”.
Costs of obtaining a contract with a customer are recognised on the balance sheet if the Company expects to recover those costs. The intangible asset arising from those costs is amortised on a systematic basis, that is consistent with the transfer to the customer of the goods or services to which the asset relates, and is tested for impairment.
Costs of technological development activities are capitalised when: (i) the cost attributable to the development activity can be measured reliably; (ii) there is the intention and the availability of financial and technical resources to make the asset available for use or sale; and (iii) it can be demonstrated that the asset is able to generate probable future economic benefits.
The carrying amount of intangible assets is derecognised on disposal or when no future economic benefits are expected from its use or disposal; any arising gain or loss is recognised in the profit and loss account.
Impairment of non-financial assets
Non-financial assets (tangible assets, intangible assets and right-of-use assets) are tested for impairment whenever events or changes in circumstances indicate that the carrying amounts for those assets may not be recoverable.
The recoverability assessment is performed for each cash-generating unit (hereinafter also CGU) represented by the smallest identifiable group of assets that generate cash inflows that are largely independent of the cash inflows from other assets or group of assets.
CGUs may include corporate assets which do not generate cash inflows independently of other assets or group of assets but which contribute to the future cash flows of more CGUs; the portions of corporate assets are allocated to a specific CGU or, if not possible, to a group of CGUs on a reasonable and consistent basis. Goodwill is tested for impairment at least annually, and whenever there is any indication of impairment, at the lowest level within the entity at which it is monitored for internal management purposes. Right-of-use assets, which generally do not generate cash inflows independently of other assets or groups of assets, are allocated to the CGU to which they belong; the right-of-use assets which cannot be fully attributed to a CGU are considered as corporate assets. The recoverability of the carrying amount of common facilities within the E&P operating segment is assessed by considering the set of recoverable amounts of the CGUs benefiting from the common facility.
The recoverability of a CGU is assessed by comparing its carrying amount with the recoverable amount, which is the higher of the CGU’s fair value less costs of disposal and its value in use. Value in use is the present value of the future cash flows expected to be derived from continuing use of the CGU and, if significant and reliably measurable, the cash flows expected to be obtained from its disposal at the end of its useful life, after deducting the costs of disposal. The expected cash flows are determined on the basis of reasonable and supportable assumptions that represent management’s best estimate of the range of economic conditions that will exist over the remaining useful life of the CGU, giving greater weight to external evidence.
The value in use of CGUs which include material right-of-use assets is calculated, normally, by ignoring lease payments included in the measurement of the lease liabilities.
With reference to commodity prices, management uses the price scenario adopted for economic and financial projections and for the evaluation of investments over their entire life. In particular, for the cash flows associated with oil, natural gas and petroleum products prices (and prices derived from them), the price scenario is approved by the Board of Directors (see “Significant accounting estimates and judgments used to take into account the impacts of climate-related risks”).
For impairment test purposes, cash outflows expected to be incurred to guarantee compliance with laws and regulations regarding CO2 emissions (e.g. Emission Trading Scheme) or on a voluntary basis (e.g. cash outflows related to forestry certificates acquired or produced consistent with the Company’s decarbonization strategy – hereinafter also forestry) are taken into account.
In particular, in estimating value in use, the cash outflows for forestry projects19 are included, consistent with the targets of the decarbonization strategy, within the expected operating cash outflows; in this regard, considering that the forestry projects can be developed in countries where Eni does not carry out operating activities and given the difficulty to allocate such cash outflows, on a reasonable and consistent basis, to CGUs of the relevant operating segment, the related discounted cash outflows are treated as a reduction of the headroom of the E&P operating segment.
For the determination of value in use, the estimated future cash flows are discounted using a rate that reflects a current market assessment of the time value of money and of the risks specific to the asset that are not reflected in the estimated future cash flows. In particular, the discount rate used is the Weighted Average Cost of Capital (WACC) adjusted for the specific country risk of the CGU. These adjustments are measured considering information from external parties. WACC differs considering the risk associated with each operating segment/business where the asset operates. In particular, for the assets belonging to the Global Gas & LNG Portfolio (GGP) operating segment, the Chemical business, the Power business and Plenitude business, the riskiness is determined on the basis of a sample of comparable companies. For the E&P operating segment and R&M business, the riskiness is determined, on a residual basis, as the difference between the risk of Eni as a whole and the risk of other operating segments/business. Value in use is calculated net of the tax effect as this method results in values similar to those resulting from discounting pre-tax cash flows at a pre-tax discount rate derived, through an iteration process, from a post-tax valuation.
| 19 For the recognition criteria of forestry certificates see the accounting policy for “Costs”. | |
When the carrying amount of the CGU, including goodwill allocated thereto, determined taking into account any impairment loss of the non-current assets belonging to the CGU, exceeds its recoverable amount, the excess is recognised as an impairment loss. The impairment loss is allocated first to reduce the carrying amount of goodwill; any remaining excess is allocated to the other assets of the unit pro-rata on the basis of the carrying amount of each asset in the CGU, up to the related recoverable amount.
When an impairment loss no longer exists or has decreased, a reversal of the impairment loss is recognised in the profit and loss account. The impairment reversal shall not exceed the carrying amount that would have been determined, net of depreciation, had no impairment loss been recognised for the asset in prior years. An impairment loss recognised for goodwill is not reversed in a subsequent period.20
Grants related to assets
Government grants related to assets are recognized by deducting them in calculating the carrying amount of the related assets when there is reasonable assurance that the Company will comply with the conditions attaching to them and the grants will be received.
Inventories
Inventories, including compulsory stock, are measured at the lower of purchase or production cost and net realisable value. Net realisable value is the estimated selling price in the ordinary course of business less the estimated costs of completion and the estimated costs necessary to make the sale, or, with reference to inventories of crude oil and petroleum products already included in binding sale contracts, the contractual selling price. Inventories which are principally acquired with the purpose of selling in the near future and generating a profit from fluctuations in price are measured at fair value less costs to sell and any subsequent changes in fair value are recognised in the profit and loss account. Materials and other supplies held for use in production are not written down below cost if the finished products in which they will be incorporated are expected to be sold at or above cost.
The cost of inventories of hydrocarbons (crude oil, condensates and natural gas) and petroleum products is determined by applying the weighted average cost method on a three-month basis, or on a different time period (e.g. monthly), when it is justified by the use and the turnover of inventories of crude oil and petroleum products; the cost of inventories of the Chemical business is determined by applying the weighted average cost on an annual basis.
When take-or-pay clauses are included in long-term gas purchase contracts, pre-paid gas volumes that are not withdrawn to fulfill minimum annual take obligations are measured using the pricing formulas contractually defined. They are recognised within “Other assets” as “Deferred costs”, as a contra to “Trade and other payables” or, after settlement, to “Cash and cash equivalents”. The allocated deferred costs are charged to the profit and loss account: (i) when natural gas is actually withdrawn, the related cost is included in the determination of the weighted average cost of inventories; and (ii) for the portion which is not recoverable, when it is not possible to withdraw the previously pre-paid gas within the contractually defined deadlines. Furthermore, the allocated deferred costs are tested for economic recoverability by comparing the related carrying amount and their net realisable value, determined adopting the same criteria described for inventories.
Significant accounting estimates and judgments: impairment of non-financial assets
The recoverability of non-financial assets is assessed whenever events or changes in circumstances indicate that carrying amounts of the assets may not be recoverable. Such impairment indicators include changes in the Group’s business plans, changes in commodity prices leading to unprofitable performance, a reduced capacity utilisation of plants and, for oil and gas properties, significant downward revisions of estimated reserve quantities or significant increase of the estimated development and production costs. Determination as to whether and how much an asset is impaired involves management estimates on highly uncertain and complex matters such as future commodity prices, future discount rates, future development costs and production costs, the effects of inflation and technology improvements on operating expenses, production profiles and the outlook for global or regional market supply-and-demand conditions also with reference to the decarbonization process and the effects of changes in regulatory requirements. The definition of CGUs and the identification of their appropriate grouping for the purpose of testing for impairment the carrying amount of goodwill, corporate assets as well as common facilities within the E&P operating segment, require judgment by management. In particular, CGUs are identified considering, inter alia, how management monitors the entity’s operations (such as by business lines) or how management makes decisions about continuing or disposing of the entity’s assets and operations.
| 20 Impairment losses recognised for goodwill in an interim period are not reversed also when, considering conditions existing in a subsequent interim period, they would have been recognised in a smaller amount or would not have been recognised. | |
Similar remarks are valid for assessing the physical recoverability of assets recognised on the balance sheet (deferred costs — see also the accounting policy for “Inventories”) related to natural gas volumes not withdrawn under long-term supply contracts with take-or-pay clauses.
The determination of the expected future cash flows used for impairment analyses takes into account the energy transition process and is based on judgmental assessments of future production volumes, prices and costs, considering available information at the date of review; the expected future cash flows are discounted using a rate which considers the risks specific to the asset.
For oil and natural gas properties, the expected future cash flows are estimated based on proved and probable reserves including, among other elements, production taxes and the costs to be incurred for the reserves yet to be developed. In limited cases (e.g. for mineral interests acquired from third parties as part of a business combination) the expected cash flows may take into account also the risk-adjusted possible reserves, if they are considered to determine the consideration transferred. The estimate of the future rates of production is based on assumptions related to future commodity prices, operating costs, lifting and development costs, field decline rates, market demand and other factors.
More details on the main assumptions underlying the determination of the recoverable amount of tangible, intangible and right-of-use assets are set out in note 15 – Reversals (Impairments) of tangible and intangible assets and right-of-use assets. Sensitivity of outcomes to alternative scenarios.
Financial instruments
Financial assets
Financial assets are classified, on the basis of both contractual cash flow characteristics and the entity’s business model for managing them, in the following categories: (i) financial assets measured at amortised cost; (ii) financial assets measured at fair value through other comprehensive income (hereinafter also OCI); (iii) financial assets measured at fair value through profit or loss (hereiafter also FVTPL).
At initial recognition, a financial asset is measured at its fair value plus, in the case of a financial asset not at FVTPL, transaction costs that are directly attributable; at initial recognition, trade receivables that do not have a significant financing component are measured at their transaction price.
After initial recognition, financial assets whose contractual terms give rise to cash flows that are solely payments of principal and interest on the principal amount outstanding are measured at amortised cost if they are held within a business model whose objective is to hold financial assets in order to collect contractual cash flows (the so-called hold to collect business model). For financial assets measured at amortised cost, interest income determined using the effective interest rate, foreign exchange differences and any impairment losses21 (see the accounting policy for “Impairment of financial assets”) are recognised in the profit and loss account.
Conversely, financial assets that are debt instruments are measured at fair value through OCI (hereinafter also FVTOCI) if they are held within a business model whose objective is achieved by both collecting contractual cash flows and selling financial assets (the so-called hold to collect and sell business model). In these cases: (i) interest income determined using the effective interest rate, foreign exchange differences and any impairment losses (see the accounting policy for “Impairment of financial assets”) are recognised in the profit and loss account; (ii) changes in fair value of the instruments are recognised in equity, within other comprehensive income. The accumulated changes in fair value, recognised in the equity reserve related to other comprehensive income, is reclassified to the profit and loss account when the financial asset is derecognised. Currently the Group does not have any financial assets measured at fair value through OCI.
| 21 Receivables and other financial assets measured at amortised cost are presented on the balance sheet net of their loss allowance. | |
A financial asset represented by a debt instrument that is neither measured at amortised cost nor at FVTOCI, is measured at FVTPL; financial assets held for trading, as well as the portfolios of financial assets managed and evaluated on a fair value basis, fall into this category. Interest income on such financial assets contributes to the related fair value measurement and is recognised in “Finance income (expense)”, within “Net finance income (expense) from financial assets at fair value through profit or loss”.
When the purchase or sale of a financial asset is under a contract whose terms require delivery of the asset within the time frame established generally by regulation or convention in the marketplace concerned, the transaction is accounted for on the settlement date.
Cash and cash equivalents
Cash and cash equivalents include cash on hand, demand deposits, as well as financial assets originally due, generally, up to three months, readily convertible to known amount of cash and subject to an insignificant risk of changes in value.
Impairment of financial assets
The expected credit loss model is adopted for the impairment of financial assets that are debt instruments, but are not measured at FVTPL.22
In particular, the expected credit losses are generally measured by multiplying: (i) the exposure to the counterparty’s credit risk net of any collateral held and other credit enhancements (Exposure At Default, EAD); (ii) the probability that the default of the counterparty occurs (Probability of Default, PD); and (iii) the percentage estimate of the exposure that will not be recovered in case of default (Loss Given Default, LGD), considering the past experiences and the range of recovery tools that can be activated (e.g. extrajudicial and/or legal proceedings, etc.).
With reference to trade and other receivables, Probabilities of Default of counterparties are determined by adopting the internal credit ratings already used for credit worthiness and are periodically reviewed using, inter alia, back-testing analyses; for government entities (e.g. National Oil Companies), the Probability of Default, represented essentially by the probability of a delayed payment, is determined by using, as input data, the country risk premium adopted to determine WACC for the impairment review of non-financial assets.
For customers without internal credit ratings, the expected credit losses are measured by using a provision matrix, defined by grouping, where appropriate, receivables into adequate clusters to which apply expected loss rates defined on the basis of their historical credit loss experiences, adjusted, where appropriate, to take into account forward-looking information on credit risk of the counterparty or clusters of counterparties.23
Considering the characteristics of the reference markets, financial assets with more than
The financing receivables held for operating purposes, granted to associates and joint ventures, for which settlement is neither planned nor likely to occur in the foreseeable future and which in substance form part of the entity’s net investment in these investees, are tested for impairment, first, on the basis of the expected credit loss model and, then, together with the carrying amount of the investment in the associate/joint venture, in accordance with the criteria indicated in the accounting policy for “The equity method of accounting”. In applying the expected credit loss model, any adjustments to the carrying amount of long-term interest that arise from applying the accounting policy for “The equity method of accounting” are not taken into account.
| 22 The expected credit loss model is also adopted for issued financial guarantee contracts not measured at FVTPL. Expected credit losses recognised on issued financial guarantees are not material. | |
| 23 For credit exposures arising from intragroup transactions, the recovery rate is normally assumed equal to 100% taking into account, inter alia, the Group central treasury function which supports both financial and capital needs of subsidiaries. | |
Significant accounting estimates and judgments: impairment of financial assets
Measuring impairment losses of financial assets requires management evaluation of complex and highly uncertain elements such as, for example, Probabilities of Default of counterparties, the assessment of any collateral or other credit enhancements, the expected exposure that will not be recovered in case of default, as well as the definition of customers' clusters to be adopted.
Further details on the main assumptions underlying the measurement of expected credit losses of financial assets are provided in note 8 – Trade and other receivables.
Investments in equity instruments
Investments in equity instruments that are not held for trading are measured at fair value through other comprehensive income, without subsequent transfer of fair value changes to profit or loss on derecognition of these investments; conversely, dividends from these investments are recognised in the profit and loss account, within the line item “Income (Expense) from investments”, unless they clearly represent a recovery of part of the cost of the investment. In limited circumstances, an investment in equity instruments can be measured at cost if it is an appropriate estimate of fair value.
Financial liabilities
At initial recognition, financial liabilities, other than derivative financial instruments, are measured at their fair value, minus transaction costs that are directly attributable, and are subsequently measured at amortised cost.
The sustainability-linked bonds, i.e. financial liabilities featuring a potential increase in the related interest rate to reflect the borrower’s performance relative to certain sustainability targets (the so-called ESG metrics), are measured at amortised cost.
Generally, changes in the interest rate result in an update of the effective interest rate to be used for the recognition of interest expense.
Significant judgments: financial liabilities
The Group’s companies can negotiate with suppliers an extension of payment terms, without the involvement of a financial institution. In such cases, management judges whether or not payables towards suppliers have to be re-classified as financial liabilities from trade/investing activity payables. In order to make such judgment, management considers if the payment terms differ from the ones that are customary in the industry, any additional security is provided as part of the arrangement as well as any other facts and circumstances. The classification as a financial liability determines: (i) upon reclassification/initial recognition of the liability, a non-monetary change in financial liabilities, with no impacts on the statement of cash flows; (ii) upon the settlement of the liability, the classification of the payment within net cash used in financing activities.
With reference to sustainability-linked bonds, management assesses whether the non-compliance with an ESG metric could adversely impact operations and, therefore, revenue generation and creditworthiness of the Company.
Derivative financial instruments and hedge accounting
Derivative financial instruments, including embedded derivatives (see below) that are separated from the host contract, are assets and liabilities measured at their fair value.
With reference to the defined risk management objectives and strategy, the qualifying criteria for hedge accounting requires: (i) the existence of an economic relationship between the hedged item and the hedging instrument in order to offset the related value changes and the effects of counterparty credit risk do not dominate the economic relationship between the hedged item and the hedging instrument; and (ii) the definition of the relationship between the quantity of the hedged item and the quantity of the hedging instrument (the so-called hedge ratio) consistent with the entity’s risk management objectives, under a defined risk management strategy; the hedge ratio is adjusted, where appropriate, after taking into account any adequate rebalancing. A hedging relationship is discontinued prospectively, in its entirety or a part of it, when it no longer meets the risk management objectives on the basis of which it qualified for hedge accounting, it ceases to meet the other qualifying criteria or after rebalancing it.
When derivatives hedge the risk of changes in the fair value of the hedged items (fair value hedge, e.g. hedging of the variability in the fair value of fixed interest rate assets/liabilities), the derivatives are measured at fair value through profit or loss. Consistently, the carrying amount of the hedged item is adjusted to reflect, in the profit and loss account, the changes in fair value of the hedged item attributable to the hedged risk; this applies even if the hedged item should be otherwise measured.
When derivatives hedge the exposure to variability in cash flows of the hedged items (cash flow hedge, e.g. hedging the variability in the cash flows of assets/liabilities as a result of the fluctuations of exchange rate), the effective changes in the fair value of the derivatives are initially recognised in the equity reserve related to other comprehensive income and then reclassified to the profit and loss account in the same period during which the hedged transaction affects the profit and loss account.
If a hedged forecast transaction subsequently results in the recognition of a non-financial asset or a non-financial liability, the accumulated changes in fair value of hedging derivatives, recognised in equity, are included directly in the carrying amount of the hedged non-financial asset/liability (commonly referred to as a “basis adjustment”).
The changes in the fair value of derivatives that are not designated as hedging instruments, including any ineffective portion of changes in fair value of hedging derivatives, are recognised in the profit and loss account. In particular, the changes in the fair value of non-hedging derivatives on interest rates and exchange rates are recognised in the profit and loss account line item “Finance income (expense)”; conversely, the changes in the fair value of non-hedging derivatives on commodities are recognised in the profit and loss account line item “Other operating (expense) income”. Derivatives embedded in financial assets are not accounted for separately; in such circumstances, the entire hybrid instrument is classified depending on the contractual cash flow characteristics of the financial instrument and the business model for managing it (see the accounting policy for “Financial assets”). Derivatives embedded in financial liabilities and/or non-financial assets are separated if: (i) the economic characteristics and risks of the embedded derivative are not closely related to the economic characteristics and risks of the host contract; (ii) a separate instrument with the same terms as the embedded derivative would meet the definition of a derivative; and (iii) the entire hybrid contract is not measured at FVTPL.
Eni assesses the existence of embedded derivatives to be separated when it becomes party to the contract and, afterwards, when a change in the terms of the contract that modifies its cash flows occurs.
Contracts to buy or sell commodities entered into and continued to be held for the purpose of their receipt or delivery in accordance with the Group’s expected purchase, sale or usage requirements are recognised on an accrual basis (the so-called normal sale and normal purchase exemption or own use exemption).
Offsetting of financial assets and liabilities
Financial assets and liabilities are set off on the balance sheet if the Group currently has a legally enforceable right to set off and intends to settle on a net basis (or to realise the asset and settle the liability simultaneously).
Derecognition of financial assets and liabilities
Transferred financial assets are derecognised when the contractual rights to receive the cash flows from the financial assets expire or are transferred to another party. Financial liabilities are derecognised when they are extinguished, or when the obligation specified in the contract is discharged, cancelled or expired.
Provisions, contingent liabilities and contingent assets
A provision is a liability of uncertain timing or amount on the balance sheet date. Provisions are recognised when: (i) there is a present obligation, legal or constructive, as a result of a past event; (ii) it is probable that an outflow of resources embodying economic benefits will be required to settle the obligation; and (iii) the amount of the obligation can be reliably estimated. The amount recognised as a provision is the best estimate of the expenditure required to settle the present obligation or to transfer it to third parties on the balance sheet date. The amount recognised for onerous contracts is the lower of the cost necessary to fulfill the obligations, net of expected economic benefits deriving from the contracts, and any compensation or penalties arising from failure to fulfill these obligations. Where the effect of the time value is material, and the payment date of the obligations can be reasonably estimated, provisions to be accrued are the present value of the expected cash outflows determined taking into account the risks associated with the obligation. The change in provisions due to the passage of time is recognised within “Finance income (expense)” in the profit and loss account.
A provision for restructuring costs is recognised only when the Company has a detailed formal plan for the restructuring and has raised a valid expectation in the affected parties that it will carry out the restructuring.
Provisions are periodically reviewed and adjusted to reflect changes in the estimates of costs, timing and discount rates. Changes in provisions are recognised in the same profit and loss account line item where the original provision was charged.
Contingent liabilities are: (i) possible obligations arising from past events, whose existence will be confirmed only by the occurrence or non-occurrence of one or more uncertain future events not wholly within the control of the Company; or (ii) present obligations arising from past events, whose amount cannot be reliably measured or whose settlement will probably not result in an outflow of resources embodying economic benefits. Contingent liabilities are not recognised in the financial statements but are disclosed.
Contingent assets, that are possible assets arising from past events and whose existence will be confirmed only by the occurrence or non-occurrence of one or more uncertain future events not wholly within the control of the Company, are not recognised in financial statements unless the realisation of economic benefits is virtually certain. Contingent assets are disclosed when an inflow of economic benefits is probable. Contingent assets are assessed periodically to ensure that developments are appropriately reflected in the financial statements.
Decommissioning and restoration liabilities
Liabilities for decommissioning and restoration costs are recognized, together with a corresponding amount as part of the related property, plant and equipment, when the conditions indicated in the accounting policy for “Provisions, contingent liabilities and contingent assets” are met.
Considering the long time span between the recognition of the obligation and its settlement, the amount recognised is the present value of the future expenditures expected to be required to settle the obligation. Any change due to the unwinding of discount on provisions is recognised within “Finance income (expense)”.
Such liabilities are reviewed regularly to take into account the changes in the expected costs to be incurred, contractual obligations, regulatory requirements and practices in force in the countries where the tangible assets are located.
The effects of any changes in the estimate of the liability are recognised generally as an adjustment to the carrying amount of the related property, plant and equipment; however, if the resulting decrease in the liability exceeds the carrying amount of the related asset, the excess is recognised in the profit and loss account.
Analogous approach is adopted for present obligations to realise social projects related to operating activities carried out by the Company.
Environmental liabilities
Environmental liabilities are recognised when the Group has a present obligation, legal or constructive, relating to environmental clean-up and remediation of soil and groundwater in areas owned or under concession where the Group performed in the past industrial operations that were progressively divested, shut down, dismantled or restructured. Liabilities for environmental costs are recognised when a clean-up is probable and the associated costs can be reliably estimated. The liability is measured on the basis of on the costs expected to be incurred in relation to the existing situation at the balance sheet date, considering virtually certain future developments in technology and legislation that are known.
Significant accounting estimates and judgments: decommissioning and restoration liabilities, environmental liabilities and other provisions
The Group holds provisions for dismantling and removing items of property, plant and equipment, and restoring land or seabed at the end of the oil and gas production activity. Estimating obligations to dismantle, remove and restore items of property, plant and equipment is complex. It requires management to make estimates and judgments with respect to removal obligations that will come to term many years into the future and contracts and regulations are often unclear as to what constitutes removal. In addition, the ultimate financial impact of environmental laws and regulations is not always clearly known as asset removal technologies and costs constantly evolve in the countries where Eni operates, as do political, environmental, safety and public expectations.
The estimates about the timing and amount of future cash outflows, any related update as well as the related discounting are based on complex managerial judgments.
Decommissioning and restoration provisions, recognised in the financial statements, include, essentially, the present value of the expected costs for decommissioning oil and natural gas facilities at the end of the economic lives of fields, well-plugging, abandonment and site restoration of the Exploration & Production operating segment. Any decommissioning and restoration provisions associated with the other operating segments’ assets, given their indeterminate settlement dates, also considering the strategy to reconvert plants in order to produce low carbon products, are recognised when it is possible to make a reliable estimate of the discounted abandonment costs. In this regard, Eni performs periodic reviews for any changes in facts and circumstances that might require recognition of a decommissioning and restoration provision.
Eni is subject to numerous EU, national, regional and local environmental laws and regulations concerning its oil and gas operations, production and other activities. They include legislations that implement international conventions or protocols. Environmental liabilities are recognised when it becomes probable that an outflow of resources will be required to settle the obligation and such obligation can be reliably estimated. With reference to groundwater treatment plants, during 2022, the enhancement of the know-how gained on water contamination trends, as well as the evolution of the positions of the competent authorities, have allowed the definition of a predictive model for estimating the time horizon within which the operations of those plants will be terminated and, therefore, for estimating the cost of managing and monitoring them.
The reliable determinability is verified on the basis of the available information such as, for example, the approval or filing of the environmental projects to the relevant administrative authorities or the making of a commitment to the relevant administrative authorities, where supported by adequate estimates.
Management, considering the actions already taken, insurance policies obtained to cover environmental risks and provisions already recognised, does not expect any material adverse effect on Eni’s consolidated results of operations and financial position as a result of such laws and regulations. However, there can be no assurance that there will not be a material adverse impact on Eni’s consolidated results of operations and financial position due to: (i) the possibility of an unknown contamination; (ii) the results of the ongoing surveys and other possible effects of statements required by applicable laws; (iii) the possible effects of future environmental legislations and rules; (iv) the effects of possible technological changes relating to future remediation; and (v) the possibility of litigation and the difficulty of determining Eni’s liability, if any, against other potentially responsible parties with respect to such litigations and the possible reimbursements.
In addition to environmental and decommissioning and restoration liabilities, Eni recognises provisions primarily related to legal and trade proceedings. These provisions are estimated on the basis of complex managerial judgments related to the amounts to be recognised and the timing of future cash outflows. After the initial recognition, provisions are periodically reviewed and adjusted to reflect the current best estimate.
Employee benefits
Employee benefits are considerations given by the Group in exchange for service rendered by employees or for the termination of employment.
Post-employment benefit plans, including informal arrangements, are classified as either defined contribution plans or defined benefit plans depending on the economic substance of the plan as derived from its principal terms and conditions. Under defined contribution plans, the Company’s obligation, which consists in making payments to the State or to a trust or a fund, is determined on the basis of contributions due.
The liabilities related to defined benefit plans, net of any plan assets, are determined on the basis of actuarial assumptions and charged on an accrual basis during the employment period required to obtain the benefits.
Net interest includes the return on plan assets and the interest cost. Net interest is measured by applying to the liability, net of any plan assets, the discount rate used to calculate the present value of the liability; net interest of defined benefit plans is recognised in “Finance income (expense)”.
Remeasurements of the net defined benefit liability, comprising actuarial gains and losses, resulting from changes in the actuarial assumptions used or from changes arising from experience adjustments, and the return on plan assets excluding amounts included in net interest, are recognised within the statement of comprehensive income. Remeasurements of the net defined benefit liability, recognised within other comprehensive income, are not reclassified subsequently to the profit and loss account.
Obligations for long-term benefits are determined by adopting actuarial assumptions. The effects of remeasurements are taken to profit and loss account in their entirety.
The liabilities for termination benefits are recognised at the earlier of the following dates: (a) when the entity can no longer withdraw the offer of those benefits; and (b) when the entity recognises costs for a restructuring that involves the payment of termination benefits. Such liabilities are measured in accordance with the nature of the employee benefit. Liabilities for termination benefits are determined applying the requirements: (i) for short-term employee benefits, if the termination benefits are expected to be settled wholly before twelve months after the end of the annual reporting period in which the termination benefits are recognised; or (ii) for long-term benefits if the termination benefits are not expected to be settled wholly before twelve months after the end of the annual reporting period.
| F-31 |
Share-based payments
The line item “Payroll and related costs” includes the cost of the share-based incentive plan, consistent with its actual remunerative nature. The cost of the share-based incentive plan is measured by reference to the fair value of the equity instruments granted and the estimate of the number of shares that eventually vest; the cost is recognised on an accrual basis pro rata temporis over the vesting period, that is the period between the grant date and the settlement date. The fair value of the shares underlying the incentive plan is measured at the grant date, taking into account the estimate of achievement of market conditions (e.g. Total Shareholder Return), and is not adjusted in subsequent periods; when the achievement is linked also to non-market conditions, the number of shares expected to vest is adjusted during the vesting period to reflect the updated estimate of these conditions. If, at the end of the vesting period, the incentive plan does not vest because of failure to satisfy the performance conditions, the portion of cost related to market conditions is not reversed to the profit and loss account.
Significant accounting estimates and judgments: employee benefits and share-based payments
Defined benefit plans are evaluated with reference to uncertain events and based upon actuarial assumptions including, among others, discount rates, expected rates of salary increases, mortality rates, estimated retirement dates and medical cost trends. The significant assumptions used to account for defined benefit plans are determined as follows: (i) discount and inflation rates are based on the market yields on high quality corporate bonds (or, in the absence of a deep market of these bonds, on the market yields on government bonds) and on the expected inflation rates in the reference currency area; (ii) the future salary levels of the individual employees are determined including an estimate of future changes attributed to general price levels (consistent with inflation rate assumptions), productivity, seniority and promotion; (iii) healthcare cost trend assumptions reflect an estimate of the actual future changes in the cost of the healthcare related benefits provided to the plan participants and are based on past and current healthcare cost trends, including healthcare inflation, changes in healthcare utilisation, changes in health status of the participants and the contributions paid to health funds; and (iv) demographic assumptions such as mortality, disability and turnover reflect the best estimate of these future events for individual employees involved.
Differences in the amount of the net defined benefit liability (asset), deriving from the remeasurements, comprising, among others, changes in the current actuarial assumptions, differences in the previous actuarial assumptions and what has actually occurred and differences in the return on plan assets, excluding amounts included in net interest, usually occur. Similar to the approach followed for the fair value measurement of financial instruments, the fair value of the shares underlying the incentive plans is measured by using complex valuation techniques and identifying, through structured judgments, the assumptions to be adopted.
Equity instruments
Treasury shares
Treasury shares, including shares held to meet the future requirements of the share-based incentive plans, are recognised as deductions from equity at cost. Any gain or loss resulting from subsequent sales is recognised in equity.
Hybrid bonds
The perpetual subordinated hybrid bonds are classified in the financial statements as equity instruments considering that the issuer has the unconditional right to defer, until the date of its own liquidation, the repayment of the principal amount and the payment of accrued interest25. Therefore, the issuer recognises the cash received from the bondholders, net of costs incurred in issuing the hybrid bonds, as an increase in Eni owners’ equity; differently, the repayments of the principal amount and the payments of accrued interest (upon the arising of the related contractual payment obligation) are accounted for as a decrease in Eni owners’ equity.
Revenue from contracts with customers
Revenue from contracts with customers is recognised on the basis of the following five steps: (i) identifying the contract with the customer; (ii) identifying the performance obligations, that are promises in a contract to transfer goods and/or services to a customer; (iii) determining the transaction price; (iv) allocating the transaction price to each performance obligation on the basis of the relative stand-alone selling prices of each good or service; and (v) recognising revenue when (or as) a performance obligation is satisfied, that is when a promised good or service is transferred to a customer. A promised good or service is transferred when (or as) the customer obtains control of it. Control can be transferred over time or at a point in time. With reference to the most important products sold by Eni, revenue is generally recognised for:
- crude oil, upon shipment;
- natural gas and electricity, upon delivery to the customer;
- petroleum products sold to retail distribution networks, upon delivery to the service stations, whereas all other sales of petroleum products are recognised upon shipment; and
- chemical products and other products, upon shipment.
Revenue from crude oil and natural gas production from properties in which Eni has an interest together with other producers is recognised on the basis of the quantities actually lifted and sold (sales method); costs are recognised on the basis of the quantities actually sold.
Revenue is measured at the fair value of the consideration to which the Company expects to be entitled in exchange for transferring promised goods and/or services to a customer, excluding amounts collected on behalf of third parties. In determining the transaction price, the promised amount of consideration is adjusted for the effects of the time value of money if the timing of payments agreed to by the parties to the contract provides the customer or the entity with a significant benefit of financing the transfer of goods or services to the customer. The promised amount of consideration is not adjusted for the effect of the significant financing component if, at contract inception, it is expected that the period between the transfer of a promised good or service to a customer and when the customer pays for that good or service will be one year or less. If the consideration promised in a contract includes a variable amount, the Company estimates the amount of consideration to which it will be entitled in exchange for transferring the promised goods and/or services to a customer; in particular, the amount of consideration can vary because of discounts, refunds, incentives, price concessions, performance bonuses, penalties or if the price is contingent on the occurrence or non-occurrence of future events.
If, in a contract, the Company grants a customer the option to acquire additional goods or services for free or at a discount (e.g. sales incentives, customer award points, etc.), this option gives rise to a separate performance obligation in the contract only if the option provides a material right to the customer that it would not receive without entering into that contract. When goods or services are exchanged for goods or services which are of a similar nature and value, the exchange is not regarded as a transaction which generates revenue.
Significant accounting estimates and judgments: revenue from contracts with customers
Revenue from sales of electricity and gas to retail customers includes the amount accrued for electricity and gas supplied between the date of the last invoiced meter reading (actual or estimated) of volumes consumed and the end of the year. These estimates consider information provided by the grid managers about the volumes allocated among the customers of the secondary distribution network, about the actual and estimated volumes consumed by customers, as well as internal estimates about volumes consumed by customers. Therefore, revenue is accrued as a result of a complex estimate based on the volumes distributed and allocated, communicated by third parties, likely to be adjusted, according to applicable regulations, within the fifth year following the one in which they are accrued, as well as on estimates about volumes consumed by customers. Considering the contractual obligations on the supply delivery points, revenue from sales of electricity and gas to retail customers includes costs for transportation and dispatching and in these cases the gross amount of consideration to which the Company is entitled is recognised.
Costs
Costs are recognised when the related goods and services are sold or consumed during the year, when they are allocated on a systematic basis or when their future economic benefits cannot be identified. Costs associated with emission quotas, incurred to meet the compliance requirements (e.g. Emission Trading Scheme) and determined on the basis of market prices, are recognised in relation to the amounts of the carbon dioxide emissions that exceed free allowances. Costs related to the purchase of the emission rights that exceed the amount necessary to meet regulatory obligations are recognised as intangible assets. Revenue related to emission quotas is recognised when they are sold. Emission rights held for trading are recognised within inventories. The costs incurred on a voluntary basis for the acquisition or production of forestry certificates, also taking into account the absence of an active market, are recognised in the profit and loss account when incurred.
The costs for the acquisition of new knowledge or discoveries, the study of products or alternative processes, new techniques or models, the planning and construction of prototypes or, in any case, costs incurred for other scientific research activities or technological development, which cannot be capitalised (see also the accounting policy for “Intangible assets”), are included in the profit and loss account when they are incurred.
Exchange differences
Revenues and costs associated with transactions in foreign currencies are translated into the functional currency by applying the exchange rate at the date of the transaction. Monetary assets and liabilities denominated in foreign currencies are translated into the functional currency at the spot exchange rate on the balance sheet date and any resulting exchange differences are included in the profit and loss account within “Finance income (expense)” or, if designated as hedging instruments for the foreign currency risk, in the same line item in which the economic effects of the hedged item are recognised. Non-monetary assets and liabilities denominated in foreign currencies, measured at cost, are not retranslated subsequent to initial recognition. Non-monetary items measured at fair value, recoverable amount or net realisable value are retranslated using the exchange rate at the date when the value is determined.
Dividends
Dividends are recognised when the right to receive payment of the dividend is established.
Dividends and interim dividends to owners are shown as changes in equity when the dividends are declared by, respectively, the shareholders’ meeting and the Board of Directors.
Income taxes
Current income taxes are determined on the basis of estimated taxable profit. Current income tax assets and liabilities are measured at the amount expected to be paid to (recovered from) the taxation authorities, using the tax rates and tax laws that have been enacted or substantively enacted by the end of the reporting period.
Deferred tax assets and liabilities are recognised for temporary differences arising between the carrying amounts of the assets and liabilities and their tax bases, based on tax rates and tax laws that are expected to apply to the period when the asset is realised or the liability is settled, based on tax rates and tax laws that have been enacted or substantively enacted by the end of the reporting period. Deferred tax assets are recognised when their recoverability is considered probable, i.e. when it is probable that sufficient taxable profit will be available in the same year as the reversal of the deductible temporary difference. Similarly, deferred tax assets for the carry-forward of unused tax credits and unused tax losses are recognised to the extent that their recoverability is probable. The carrying amount of the deferred tax assets is reviewed, at least, on an annual basis.
If there is uncertainty over income tax treatments, if the company concludes it is probable that the taxation authority will accept an uncertain tax treatment, it determines the (current and/or deferred) income taxes to be recognised in the financial statements consistent with the tax treatment used or planned to be used in its income tax filings. Conversely, if the company concludes it is not probable that the taxation authority will accept an uncertain tax treatment, the company reflects the effect of uncertainty in determining the (current and/or deferred) income taxes to be recognised in the financial statements.
Relating to the taxable temporary differences associated with investments in subsidiaries and associates, and interests in joint arrangements, the related deferred tax liabilities are not recognised if the investor is able to control the timing of the reversal of the temporary differences and it is probable that the temporary differences will not reverse in the foreseeable future. Deferred tax assets and liabilities are presented within non-current assets and liabilities and are offset at a single entity level if related to off-settable taxes. The balance of the offset, if positive, is recognised in the line item “Deferred tax assets” and, if negative, in the line item “Deferred tax liabilities”. When the results of transactions are recognised in other comprehensive income or directly in equity, the related current and deferred taxes are also recognised in other comprehensive income or directly in equity.
Significant accounting estimates and judgments: income taxes
The computation of income taxes involves the interpretation of applicable tax laws and regulations in many jurisdictions throughout the world. Although Eni aims to maintain a relationship with the taxation authorities characterised by transparency, dialogue and cooperation (e.g. by not using aggressive tax planning and by using, if available, procedures intended to eliminate or reduce tax litigations), there can be no assurance that there will not be a tax litigation with the taxation authorities where the legislation could be open to more than one interpretation. The resolution of tax disputes, through negotiations with relevant taxation authorities or through litigation, could take several years to complete. The estimate of liabilities related to uncertain tax treatments requires complex judgments by management. After the initial recognition, these liabilities are periodically reviewed for any changes in facts and circumstances.
Management makes complex judgments regarding mainly the assessment of the recoverability of deferred tax assets, related both to deductible temporary differences and unused tax losses, which requires estimates and evaluations about the amount and the timing of future taxable profits.
Assets held for sale and discontinued operations
Non-current assets and current and non-current assets included within disposal groups are classified as held for sale if their carrying amounts will be recovered principally through a sale transaction rather than through continuing use. This condition is regarded as met only when the sale is highly probable and the asset or the disposal group is available for immediate sale in its present condition. When there is a sale plan involving loss of control of a subsidiary, all the assets and liabilities of that subsidiary are classified as held for sale, regardless of whether a non-controlling interest in its former subsidiary will be retained after the sale.
Non-current assets held for sale, current and non-current assets included within disposal groups that have been classified as held for sale and the liabilities directly associated with them are recognised on the balance sheet separately from other assets and liabilities.
Immediately before the initial classification of a non-current asset and/or a disposal group as held for sale, the non-current asset and/or the assets and liabilities in the disposal group are measured in accordance with applicable IFRSs. Subsequently, non-current assets held for sale are not depreciated or amortised and they are measured at the lower of the fair value less costs to sell and their carrying amount. If an equity-accounted investment, or a portion of that investment meets the criteria to be classified as held for sale, it is no longer accounted for using the equity method and it is measured at the lower of its carrying amount at the date the equity method is discontinued, and its fair value less costs to sell. Any retained portion of the equity-accounted investment that has not been classified as held for sale is accounted for using the equity method until disposal of the portion that is classified as held for sale takes place.
Any difference between the carrying amount of the non-current assets and the fair value less costs to sell is taken to the profit and loss account as an impairment loss; any subsequent reversal is recognised up to the cumulative impairment losses, including those recognised prior to qualification of the asset as held for sale. Non-current assets classified as held for sale and disposal groups are considered a discontinued operation if they, alternatively: (i) represent a separate major line of business or geographical area of operations; (ii) are part of a disposal program of a separate major line of business or geographical area of operations; or (iii) are a subsidiary acquired exclusively with a view to resale. The results of discontinued operations, as well as any gain or loss recognised on the disposal, are indicated in a separate line item of the profit and loss account, net of the related tax effects; the economic figures of discontinued operations are indicated also for prior periods presented in the financial statements.
If events or circumstances occur that no longer allow to classify a non-current asset or a disposal group as held for sale, the non-current asset or the disposal group is reclassified into the original line items of the balance sheet and measured at the lower of: (i) its carrying amount at the date of classification as held for sale adjusted for any depreciation, amortisation, impairment losses and reversals that would have been recognised had the asset or disposal group not been classified as held for sale, and (ii) its recoverable amount at the date of the subsequent decision not to sell.
Fair value measurements
Fair value is the price that would be received to sell an asset or paid to transfer a liability in an orderly transaction between market participants (not in a forced liquidation or a distress sale) at the measurement date (exit price). Fair value measurement is based on the market conditions existing at the measurement date and on the assumptions of market participants (market-based measurement). A fair value measurement assumes that the transaction to sell the asset or transfer the liability takes place in the principal market for the asset or liability, or in the absence of a principal market, in the most advantageous market to which the entity has access, independently from the entity’s intention to sell the asset or transfer the liability to be measured.
A fair value measurement of a non-financial asset takes into account a market participant’s ability to generate economic benefits by using the asset in its highest and best use or by selling it to another market participant that would use the asset in its highest and best use. Highest and best use is determined from the perspective of market participants, even if the entity intends a different use; an entity’s current use of a non-financial asset is presumed to be its highest and best use, unless market or other factors suggest that a different use by market participants would maximise the value of the asset.
The fair value of a liability, both financial and non-financial, or of the Company’s own equity instrument, in the absence of a quoted price, is measured from the perspective of a market participant that holds the identical item as an asset at the measurement date. The fair value of financial instruments takes into account the counterparty’s credit risk for a financial asset (Credit Valuation Adjustment, CVA) and the Company’s own credit risk for a financial liability (Debit Valuation Adjustment, DVA). In the absence of available market quotation, fair value is measured by using valuation techniques that are appropriate in the circumstances, maximising the use of relevant observable inputs and minimising the use of unobservable inputs.
Assets and liabilities measured at fair value are categorized into the fair value hierarchy which is defined on the basis of the significance of the inputs used to measure fair value. In particular, on the basis of the features of the inputs used in the measurement, the fair value hierarchy provides for the following levels:
a) Level 1: quoted prices (unadjusted) in active markets for identical assets or liabilities;
b) Level 2: measurement based on inputs, other than quoted prices included within the previous point, that are observable for the asset or liability under measurement, either directly or indirectly;
c) Level 3: unobservable inputs for the asset or liability.
Significant accounting estimates and judgments: fair value
Fair value measurement, although based on the best available information and on the use of appropriate valuation techniques, is inherently uncertain, requires the use of professional judgment and could result in expected values other than the actual ones.
2 Primary financial statements
Assets and liabilities on the balance sheet are classified as current and non-current. Items in the profit and loss account are presented by nature.
The balance sheet and the profit and loss account are the same of the ones used in the previous reporting period, except for the retitling of the line items “Financial assets held for trading” and “Net finance income (expense) on financial assets held for trading”, respectively, “Financial assets at fair value through profit or loss” and “Net finance income (expense) from financial assets at fair value through profit or loss”; such line items include, respectively, the carrying amounts and the related profit and loss effects of the liquidity portfolio managed and evaluated on a fair value basis, as well as of the financial assets held for trading.
The statement of comprehensive income (loss) shows net profit integrated with income and expenses that are not recognised directly in the profit and loss account according to IFRSs.
The statement of changes in equity includes the total comprehensive income (loss) for the year, transactions with owners in their capacity as owners and other changes in equity.
The statement of cash flows is presented using the indirect method, whereby net profit (loss) is adjusted for the effects of non-cash transactions.
3 Changes in accounting policies
The amendments to IFRSs effective from January 1, 2022 did not have a material impact on the Consolidated Financial Statements.
4 IFRSs not yet adopted
On May 18, 2017, the IASB issued IFRS 17 “Insurance Contracts” (hereinafter IFRS 17), which replaces IFRS 4 “Insurance Contracts” and sets out the accounting for the insurance contracts issued and the reinsurance contracts held. IFRS 17 shall be applied for annual reporting periods beginning on or after January 1, 2023.
On January 23, 2020, the IASB issued the amendments to IAS 1 “Classification of Liabilities as Current or Non-current” (hereinafter the amendments to IAS 1), which clarify how to classify debt and other liabilities as current or non-current. Further clarifications about the classification, as current or non-current, of liabilities with covenants have been provided by the amendments issued on October 31, 2022 (“Non-current Liabilities with Covenants”). The amendments shall be applied for annual reporting periods beginning on or after January 1, 2024.
On February 12, 2021, the IASB issued:
- the amendments to IAS 1 “Disclosure of Accounting Policies” (hereinafter the amendments), aimed to provide clarifications on identifying the material accounting policies to be disclosed in the financial statements. The amendments shall be applied for annual reporting periods beginning on or after January 1, 2023;
- the amendments to IAS 8 “Definition of Accounting Estimates” (hereinafter the amendments), which introduce the definition of accounting estimates essentially to clarify how to distinguish changes in accounting policies from changes in accounting estimates. The amendments shall be applied for annual reporting periods beginning on or after January 1, 2023.
On May 7, 2021, the IASB issued the amendments to IAS 12 “Deferred Tax related to Assets and Liabilities arising from a Single Transaction” (hereinafter the amendments), aimed to require companies to recognise deferred tax on particular transactions that, on initial recognition, give rise to equal amounts of taxable and deductible temporary differences. The amendments shall be applied for annual reporting periods beginning on or after January 1, 2023.
On September 22, 2022, the IASB issued the amendments to IFRS 16 “Lease Liability in a Sale and Leaseback” (hereinafter the amendments), aimed to clarify the subsequent measurement of lease liabilities arising from sale and leaseback transactions. The amendments shall be applied for annual reporting periods beginning on or after January 1, 2024.
Eni is currently reviewing the IFRSs not yet adopted in order to determine the likely impact on the Consolidated Financial Statements.
5 Business combinations and other significant transactions
Acquisitions
In 2022 Eni finalized acquisitions for a total consideration of €
On January 12, 2022, Eni finalized the
On February 18, 2022, Eni finalized the acquisition of the Corazon I Solar plant with
On August 4, 2022, Eni finalized the acquisition of
On August 26, 2022, the acquisition of a
| F-37 |
On December 29, 2022, Eni finalized the acquisitions from Italian group PLT of PLT Energia Srl and SEF Srl, engaged in the production of electricity from renewables and in supplying energy to retail customers, with generation capacity of over
Balance sheet values at the acquisition date of the business combinations realized in 2022 are shown in the following table:
| SKGR Energy Single Member SA (now Eni Plenitude Renewables Hellas Single Member SA) | Corazon I / Guajillo | Energía Eólica Boreas SLU | Export LNG Ltd | PLT (PLT Energia Srl and SEF Srl) | Other acquisitions and business combinations |
Total | ||||||||||||||
| Cash and cash equivalents | ||||||||||||||||||||
| Current financial assets | ||||||||||||||||||||
| Other current assets | ||||||||||||||||||||
| Current assets | ||||||||||||||||||||
| Property, plant and equipment | ||||||||||||||||||||
| Goodwill | ||||||||||||||||||||
| Other non-current assets | ||||||||||||||||||||
| Non-current assets | ||||||||||||||||||||
| TOTAL ASSETS | ||||||||||||||||||||
| Current financial liabilities | ||||||||||||||||||||
| Other current liabilities | |
|||||||||||||||||||
| Current liabilities | |
|||||||||||||||||||
| Non-current financial liabilities | ||||||||||||||||||||
| Provisions | ||||||||||||||||||||
| Deferred tax liabilities | ||||||||||||||||||||
| Other non-current liabilities | ||||||||||||||||||||
| Non-current liabilities | |
|||||||||||||||||||
| TOTAL LIABILITIES | ||||||||||||||||||||
| Equity attributable to Eni | ||||||||||||||||||||
| Non-controlling interest | ||||||||||||||||||||
| TOTAL EQUITY | ||||||||||||||||||||
| TOTAL LIABILITIES AND EQUITY |
The qualitative factors that make up the goodwill recognized within the Plenitude business line are disclosed in Note 14 - Intangible assets.
For transactions where the purchase allocations are provisional as of December 31, 2022, not all relevant information has been obtained by the Company in order to finalize related estimates of the fair values of certain assets and liabilities acquired. Information about the definitive purchase price allocation of business combinations made in 2021 is provided in note 27 ‐ Other Information.
Divestments
In 2022 Eni finalized divestments for a total consideration of €
On August 1, 2022, bp and Eni finalized the establishment of Azule Energy Holdings Ltd, a
On October 14, 2022, Eni disposed of
On December 29, 2022, Eni disposed of the stakes in the Pakistan operations to Prime International Oil & Gas Company, the main Pakistan power producer. The assets sold consisted of investments in
Balance sheet values of the divestments and/or business combinations realized in 2022 are shown in the following table:
| Azule Energy Holdings Ltd | Vårgrønn AS | Assets in Pakistan | Other divestments | Total | ||||||||||
| Cash and cash equivalents | ||||||||||||||
| Current financial assets | ||||||||||||||
| Other current assets | ||||||||||||||
| Current assets | ||||||||||||||
| Property, plant and equipment | ||||||||||||||
| Other non-current assets | ||||||||||||||
| Non-current assets | ||||||||||||||
| TOTAL ASSETS | ||||||||||||||
| Current financial liabilities | ||||||||||||||
| Other current liabilities | ||||||||||||||
| Current liabilities | ||||||||||||||
| Non-current financial liabilities | ||||||||||||||
| Provisions | ||||||||||||||
| Deferred tax liabilities | ||||||||||||||
| Other non-current liabilities | ||||||||||||||
| Non-current liabilities | ||||||||||||||
| TOTAL LIABILITIES | ||||||||||||||
| Equity attributable to Eni | ( |
|||||||||||||
| TOTAL EQUITY | ( |
|||||||||||||
| TOTAL LIABILITIES AND EQUITY |
| F-39 |
6 Cash and cash equivalents
Cash and cash equivalents of €
Expected credit losses on deposits with banks and financial institutions measured at amortized cost were immaterial.
Cash and cash equivalents mainly consisted of deposits in euros (€
Restricted cash amounted to approximately €
The average maturity of financial assets originally due within 3 months was
7 Financial assets at fair value through profit or loss
| (€ million) | December 31, 2022 |
December 31, 2021 |
||||
| Bonds issued by sovereign states | ||||||
| Other | ||||||
| Financial assets held for trading | ||||||
| Other financial assets at fair value through profit or loss | ||||||
| Other | ||||||
| Total financial assets at fair value through profit or loss |
The Company has established a liquidity reserve as part of its internal targets and financial strategy with a view of ensuring an adequate level of flexibility to the Group development plans and of coping with unexpected fund requirements or difficulties in accessing financial markets. The management of this liquidity reserve is performed through trading activities with the aim of optimizing returns, within a predefined and authorized level of risk threshold, targeting the preservation of the invested capital and the ability to promptly convert it into cash.
Financial assets held for trading include securities subject to lending agreements of €
The breakdown by currency is provided below:
| (€ million) | December 31, 2022 |
December 31, 2021 |
||||
| Financial assets held for trading | ||||||
| Euro | ||||||
| U.S. dollars | ||||||
| Other currencies | ||||||
| Other financial assets at fair value through profit or loss | ||||||
| Euro | ||||||
| U.S. dollars | ||||||
The breakdown by issuing entity and credit rating is presented below:
|
Nominal value (€ million) |
Fair Value (€ million) |
Rating - Moody's | Rating - S&P | |||||||||
| Quoted bonds issued by sovereign states | ||||||||||||
| Fixed rate bonds | ||||||||||||
| Italy | ||||||||||||
| United States of America | ||||||||||||
| Spain | ||||||||||||
| Chile | ||||||||||||
| France | ||||||||||||
| Germany | ||||||||||||
| Other (*) | |
|||||||||||
| Floating rate bonds | ||||||||||||
| Italy | ||||||||||||
| Other | ||||||||||||
| Total quoted bonds issued by sovereign states | ||||||||||||
| Other Bonds | ||||||||||||
| Fixed rate bonds | ||||||||||||
| Quoted bonds issued by industrial companies | |
|||||||||||
| Quoted bonds issued by financial and insurance companies | |
|||||||||||
| Other bonds | |
|||||||||||
| Floating rate bonds | ||||||||||||
| Quoted bonds issued by industrial companies | |
|||||||||||
| Quoted bonds issued by financial and insurance companies | |
|||||||||||
| Other bonds | |
|
||||||||||
| Total other bonds | ||||||||||||
| Total other financial assets held for trading | ||||||||||||
| Other financial assets at fair value through profit or loss | ||||||||||||
(*) Amounts included herein are lower than €
Other financial assets at fair value through profit or loss consisted of investments in Money Market funds.
The fair value hierarchy is level 1 for €
8 Trade and other receivables
| (€ million) | December 31, 2022 |
December 31, 2021 |
|||
| Trade receivables | |||||
| Receivables from divestments | |||||
| Receivables from joint ventures in exploration and production activities | |||||
| Other receivables | |||||
| F-41 |
Generally, trade receivables do not bear interest and provide payment terms within
The increase in trade receivables of €
At December 31, 2022, Eni divested without recourse receivables due in 2023 with a nominal value of €
At December 31, 2022, a trade receivable for the supply of natural gas to the customer Acciaierie d'Italia (ex-ILVA) was outstanding for an amount of €
Receivables from joint ventures in exploration and production activities included amounts past due of €
In 2022, a cash call exposure towards a privately held Nigerian oil company amounted to €
Receivables from other counterparties comprised several miscellaneous items. The largest amounts were: (i) the recoverable amount of €
Trade and other receivables stated in euro and U.S. dollars amounted to €
| F-42 |
Credit risk exposure and expected losses relating to trade and other receivables has been prepared on the basis of internal ratings as follows:
| Performing receivables | Defaulted receivables | Plenitude customers | Total | ||||||||||||||
| (€ million) | Low risk | Medium Risk | High Risk | ||||||||||||||
| December 31, 2022 | |||||||||||||||||
| Business customers | |||||||||||||||||
| National Oil Companies and Public Administrations | |||||||||||||||||
| Other counterparties | |||||||||||||||||
| Gross amount | |||||||||||||||||
| Allowance for doubtful accounts | ( |
) | ( |
) | ( |
) | ( |
) | ( |
) | ( |
) | |||||
| Net amount | |||||||||||||||||
| Expected loss (% net of counterpart risk mitigation factors) | |||||||||||||||||
| December 31, 2021 | |||||||||||||||||
| Business customers | |||||||||||||||||
| National Oil Companies and Public Administrations | |||||||||||||||||
| Other counterparties | |||||||||||||||||
| Gross amount | |||||||||||||||||
| Allowance for doubtful accounts | ( |
) | ( |
) | ( |
) | ( |
) | ( |
) | ( |
) | |||||
| Net amount | |||||||||||||||||
| Expected loss (% net of counterpart risk mitigation factors) | |||||||||||||||||
The classification of the Company’s customers and counterparties and the definition of the classes of counterparty risk are disclosed in note 1 – Significant accounting policies, estimates and judgements.
The assessments of the recoverability of trade receivables for the supply of hydrocarbons, products and power to retail, business customers and national oil companies and of receivables towards joint operators of the Exploration & Production segment for cash calls (national oil companies, local private operators or international oil companies) are reviewed at each annual deadline to reflect the current economic environment and business trends, as well as any possible increase in the counterparty risks. The gradual recovery of worldwide economies from the fallout caused by COVID-19 crisis and the improvement in the oil scenario have lessened the debt burden of many state oil companies, with the exception of Venezuela due to specific factors relating to the sanctioning framework. On the other hand, the significant increase in the prices of natural gas and electricity significantly increased the Company’s exposures towards large industrial accounts, requiring an upward revision in the credit loss rate to incorporate an increased economic risk. With regard to customers of the Plenitude business line, the recoverability assessment was based on the most updated information relating the performance in credit collection and the ageing of overdue amounts.
The exposure to credit risk and expected losses relating to customers of Plenitude was assessed based on a provision matrix as follows:
| F-43 |
| Ageing | |||||||||||||||||
| (€ million) | Not-past due | from 0 to 3 months |
from 3 to 6 months |
from 6 to 12 months |
over 12 months |
Total | |||||||||||
| December 31, 2022 | |||||||||||||||||
| Plenitude customers: | |||||||||||||||||
| - Retail | |||||||||||||||||
| - Middle | |||||||||||||||||
| - Other | |||||||||||||||||
| Gross amount | |||||||||||||||||
| Allowance for doubtful accounts | ( |
) | ( |
) | ( |
) | ( |
) | ( |
) | ( |
) | |||||
| Net amount | |||||||||||||||||
| Expected loss (%) | |||||||||||||||||
| December 31, 2021 | |||||||||||||||||
| Plenitude customers: | |||||||||||||||||
| - Retail | |||||||||||||||||
| - Middle | |||||||||||||||||
| - Other | |||||||||||||||||
| Gross amount | |||||||||||||||||
| Allowance for doubtful accounts | ( |
) | ( |
) | ( |
) | ( |
) | ( |
) | ( |
) | |||||
| Net amount | |||||||||||||||||
| Expected loss (%) | |||||||||||||||||
The following table analyses the allowance for doubtful accounts for trade and other receivables.
| (€ million) | 2022 | 2021 | |||
| Allowance for doubtful accounts - beginning of the year | |||||
| Additions for trade and other performing receivables | |||||
| Additions for trade and other defaulted receivables | |||||
| Utilizations for trade and other performing receivables | ( |
) | ( |
) | |
| Utilizations for trade and other defaulted receivables | ( |
) | ( |
) | |
| Other changes | |||||
| Allowance for doubtful accounts - end of the year |
| F-44 |
The allowance for doubtful accounts was determined considering mitigation factors of the counterparty risk amounting to €
Additions to allowance for doubtful accounts for trade and other performing receivables related to: (i) the Global Gas & LNG Portfolio segment for €
Additions to allowance for doubtful accounts for trade and other defaulted receivables related to: (i) the Exploration & Production segment for €
Utilizations of allowance for doubtful accounts for trade and other performing and defaulted receivables amounted to €
Net (impairments) reversals of trade and other receivables are disclosed as follows:
| (€ million) | 2022 | 2021 | 2020 | |||||
| New or increased provisions | ( |
) | ( |
) | ( |
) | ||
| Net credit losses | ( |
) | ( |
) | ( |
) | ||
| Reversals | ||||||||
| Net (impairments) reversals of trade and other receivables | ( |
) | ( |
) |
Receivables with related parties are disclosed in note 36 – Transactions with related parties.
9 Current and non-current inventories
Current inventories are disclosed as follows:
| (€ million) | December 31, 2022 | December 31, 2021 | ||||
| Raw and auxiliary materials and consumables | ||||||
| Components and spare parts for drilling operations, plans and equipment | ||||||
| Finished products and goods | ||||||
| Other | ||||||
| Current inventories |
Raw and auxiliary materials and consumables include oil-based feedstock and other consumables pertaining to refining and chemical activities.
Components to be consumed in drilling activities and spare parts of the Exploration & Production segment amounted to €
Finished products and goods included natural gas and oil products for €
Inventories are stated net of write-down provisions of €
Non-current inventories of €
The increase in current and non-current inventories was essentially due to the recovery in oil and hydrocarbons prices.
Natural gas inventories of €
10 Income tax receivables and payables
| (€ million) | December 31, 2022 | December 31, 2021 | ||||||||||||||||||||||
| Receivables | Payables | Receivables | Payables | |||||||||||||||||||||
| Current | Non-current | Current | Non-current | Current | Non-current | Current | Non-current | |||||||||||||||||
| Income taxes | ||||||||||||||||||||||||
Income taxes are described in note 33 — Income taxes.
Non-current income tax payables include the likely outcome of pending litigation with tax authorities in relation to uncertain tax matters relating to foreign subsidiaries of the Exploration & Production segment for €
11 Other assets and liabilities
| December 31, 2022 | December 31, 2021 | |||||||||||||||||||||||
| (€ million) | Assets | Liabilities | Assets | Liabilities | ||||||||||||||||||||
| Current | Non-current | Current | Non-current | Current | Non-current | Current | Non-current | |||||||||||||||||
| Fair value of derivative financial instruments | ||||||||||||||||||||||||
| Contract liabilities | ||||||||||||||||||||||||
| Other Taxes | ||||||||||||||||||||||||
| Other | ||||||||||||||||||||||||
The fair value related to derivative financial instruments is disclosed in note 24 – Derivative financial instruments and hedge accounting.
Assets related to other taxes included VAT for €
Other assets include: (i) tax credit current of €
Contract liabilities included: (i) advances received from customers for future gas supplies for €
Revenues recognized during the year related to contract liabilities stated at December 31, 2022 are indicated in note 29 – Revenues and other income.
Other liabilities included: (i) non-current payables to factoring companies connected with the transfer of the abovementioned tax credit for €
Transactions with related parties are described in note 36 — Transactions with related parties.
12 Property, plant and equipment
| (€ million) | Land and buildings | E&P wells, plant and machinery | Other plant and machinery | E&P exploration assets and appraisal | E&P tangible assets in progress | Other tangible assets in progress and advances | Total | ||||||||||||||
| 2022 | |||||||||||||||||||||
| Net carrying amount - beginning of the year | |||||||||||||||||||||
| Additions | |||||||||||||||||||||
| Depreciation capitalized | |||||||||||||||||||||
| Depreciation (*) | ( |
) | ( |
) | ( |
) | ( |
) | |||||||||||||
| Reversals | |||||||||||||||||||||
| Impairments | ( |
) | ( |
) | ( |
) | ( |
) | ( |
) | ( |
) | |||||||||
| Write-off | ( |
) | ( |
( |
) | ( |
) | ( |
) | ||||||||||||
| Currency translation differences | |||||||||||||||||||||
| Initial recognition and changes in estimates | ( |
) | ( |
) | ( |
) | |||||||||||||||
| Changes in the scope of consolidation - included entities | |||||||||||||||||||||
| Changes in the scope of consolidation - excluded entities |
( |
) | ( |
) | ( |
) | ( |
) | ( |
) | ( |
) | |||||||||
| Transfers | ( |
) | ( |
) | ( |
) | |||||||||||||||
| Other changes | ( |
) | ( |
) | ( |
) | |||||||||||||||
| Net carrying amount - end of the year | |||||||||||||||||||||
| Gross carrying amount - end of the year | |||||||||||||||||||||
| Provisions for depreciation and impairments | |||||||||||||||||||||
| 2021 | |||||||||||||||||||||
| Net carrying amount - beginning of the year | |||||||||||||||||||||
| Additions | |||||||||||||||||||||
| Depreciation capitalized | |||||||||||||||||||||
| Depreciation (*) | ( |
) | ( |
) | ( |
) | ( |
) | |||||||||||||
| Reversals | |||||||||||||||||||||
| Impairments | ( |
) | ( |
) | ( |
) | ( |
) | ( |
) | ( |
) | |||||||||
| Write-off | ( |
) | ( |
) | ( |
) | ( |
) | ( |
) | |||||||||||
| Currency translation differences | |||||||||||||||||||||
| Initial recognition and changes in estimates | ( |
) | |||||||||||||||||||
| Changes in the scope of consolidation | ( |
) | ( |
) | ( |
) | |||||||||||||||
| Transfers | ( |
) | ( |
) | ( |
) | |||||||||||||||
| Other changes | ( |
) | ( |
) | ( |
) | |||||||||||||||
| Net carrying amount - end of the year | |||||||||||||||||||||
| Gross carrying amount - end of the year | |||||||||||||||||||||
| Provisions for depreciation and impairments | |||||||||||||||||||||
| (*) Before capitalization of depreciation of tangible assets |
|||||||||||||||||||||
Capital expenditures included capitalized finance expenses of €
Capital expenditures primarily related to the Exploration & Production segment for €
Expenditures to purchase plant and equipment from suppliers whose payment terms matched classification as financing payables, have been recognized among other changes (€
Capital expenditures by industry segment and geographical area of destination are reported in note 35 – Segment information and information by geographical area.
Depreciation other than that of Oil & Gas plants, relating to biorefineries, petrochemical plants, thermoelectric plants, photovoltaic or wind power systems, and other ancillary assets are calculated on a straight-line basis, based on their economic-technical lives. The main depreciation rates adopted are included in the following ranges and have remained unchanged compared to 2021:
| (%) | ||
| Buildings | ||
| Refining and chemical plants | ||
| Gas pipelines and compression stations | ||
| Power plants | ||
| Other plant and machinery | ||
| Industrial and commercial equipment | ||
| Other assets |
Plants and equipment used in the extraction and treatment of hydrocarbons were depreciated according to the UOP method, where depreciation depends on production of the estimated proved reserves according to the US Securities & Exchange Commission “SEC” criteria (see note 1 – Accounting standards, accounting estimates and significant judgements, section Valuation criteria – Mining activity – UOP depreciation). The production plans associated with the existing assets would gradually deplete the SEC proved reserves recorded at the balance sheet date, which are expected to be produced within about ten years.
Asset impairment losses were recognized at petrochemical plants for production of basic chemicals and intermediates (€
Currency translation differences related to subsidiaries utilizing the U.S. dollar as functional currency (€
Initial recognition and change in estimates include the decrease in the asset retirement cost of the tangible assets of the Exploration & Production sector, mainly due to discounting factors and the derecognition of the activities in Angola, partially offset by revised estimates of future decommissioning and restoration costs and recognition of social projects costs to be incurred in relation to the commitments undertaken between Eni SpA and the Basilicata region in relation to the oil development program in the Val d'Agri concession area.
Changes in the scope of consolidation related: (i) for €
Other changes in other tangible assets related for €
Transfers from E&P tangible assets in progress to E&P UOP wells, plant and equipment related for €
In 2022, exploration and appraisal activities decreased by €
Exploration and appraisal activities related for €
| (€ million) | 2022 | 2021 | 2020 | |||||
| Costs for exploratory wells suspended - beginning of the year | ||||||||
| Increases for which is ongoing the determination of proved reserves | ||||||||
| Amounts previously capitalized and expensed in the year | ( |
) | ( |
) | ( |
) | ||
| Reclassification to successful exploratory wells following the estimation of proved reserves | ( |
) | ( |
) | ( |
) | ||
| Disposals | ( |
) | ( |
) | ||||
| Changes in the scope of consolidation | ( |
) | ( |
) | ||||
| Currency translation differences | ( |
) | ||||||
| Other changes | ( |
) | ||||||
| Costs for exploratory wells suspended - end of the year |
The following information relates to the stratification of the suspended wells pending final determination (ageing):
| 2022 | 2021 | 2020 | |||||||||||||||
| (€ million) | (number of wells in Eni’s interest) | (€ million) | (number of wells in Eni’s interest) | (€ million) | (number of wells in Eni’s interest) | ||||||||||||
| Costs capitalized and suspended for exploratory well activity | |||||||||||||||||
| - within 1 year | |||||||||||||||||
| - between 1 and 3 years | |||||||||||||||||
| - beyond 3 years | |||||||||||||||||
| Costs capitalized for suspended wells | |||||||||||||||||
| - fields including wells drilled over the last 12 months | |||||||||||||||||
| - fields for which the delineation campaign is in progress | |||||||||||||||||
| - fields including commercial discoveries that proceeds to a FID | |||||||||||||||||
Suspended wells costs awaiting a final investment decision amounted to €
Unproved mineral interests, comprised in assets in progress of the Exploration & Production segment, include the purchase price allocated to unproved reserves following business combinations or acquisition of individual properties. Unproved mineral interests were as follows:
| (€ million) | Congo | Nigeria | Turkmenistan | USA | Algeria | Egypt | United Arab Emirates | Italy | Total | |||||||||||||||||
| 2022 | ||||||||||||||||||||||||||
| Carrying amount - beginning of the year | ||||||||||||||||||||||||||
| Additions | ( |
) | ||||||||||||||||||||||||
| Net (impairments) reversals | ( |
) | ( |
) | ||||||||||||||||||||||
| Reclassification to Proved Mineral Interest | ( |
) | ( |
) | ( |
) | ( |
) | ( |
) | ||||||||||||||||
| Currency translation differences | ( |
) | ||||||||||||||||||||||||
| Carrying amount - end of the year | ||||||||||||||||||||||||||
| 2021 | ||||||||||||||||||||||||||
| Carrying amount - beginning of the year | ||||||||||||||||||||||||||
| Additions | ||||||||||||||||||||||||||
| Net (impairments) reversals | ( |
) | ( |
) | ||||||||||||||||||||||
| Reclassification to Proved Mineral Interest | ( |
) | ( |
) | ( |
) | ( |
) | ||||||||||||||||||
| Currency translation differences | ||||||||||||||||||||||||||
| Carrying amount - end of the year |
| F-50 |
Unproved mineral interests comprised the Oil Prospecting License 245 property (“OPL 245”), offshore Nigeria, for €
Accumulated provisions for impairments amounted to €
Property, plant and equipment include assets subject to operating leases for €
As of December 31, 2022, Eni pledged property, plant and equipment for €
Government grants recorded as a decrease of property, plant and equipment amounted to €
Contractual commitments related to the purchase of property, plant and equipment are disclosed in note 28 – Guarantees, commitments and risks — Liquidity risk.
Property, plant and equipment under concession arrangements are described in note 28 – Guarantees, commitments and risks.
13 Right-of-use assets and lease liabilities
| (€ million) |
Floating production storage and offloading vessels (FPSO) |
Drilling rig |
Naval facilities and related logistic bases for oil and gas transportation |
Motorway concessions and service stations |
Oil and gas distribution facilities | Office buildings | Vehicles | Other | Total | ||||||||||||||||||
| 2022 | |||||||||||||||||||||||||||
| Net carrying amount - beginning of the year | |||||||||||||||||||||||||||
| Additions | |||||||||||||||||||||||||||
| Depreciation (a) | ( |
) | ( |
) | ( |
) | ( |
) | ( |
) | ( |
) | ( |
) | ( |
) | ( |
) | |||||||||
| Impairments | ( |
) | ( |
) | ( |
) | ( |
) | ( |
) | |||||||||||||||||
| Reversals | |||||||||||||||||||||||||||
| Currency translation differences | |||||||||||||||||||||||||||
| Changes in the scope of consolidaion | ( |
) | ( |
) | ( |
) | ( |
) | ( |
) | |||||||||||||||||
| Other changes | ( |
) | ( |
) | ( |
) | ( |
) | ( |
) | ( |
) | ( |
) | ( |
) | ( |
) | |||||||||
| Net carrying amount - end of the year | |||||||||||||||||||||||||||
| Gross carrying amount - end of the year | |||||||||||||||||||||||||||
| Provisions for depreciation and impairment | |||||||||||||||||||||||||||
| 2021 | |||||||||||||||||||||||||||
| Net carrying amount - beginning of the year | |||||||||||||||||||||||||||
| Additions | |||||||||||||||||||||||||||
| Depreciation (a) | ( |
) | ( |
) | ( |
) | ( |
) | ( |
) | ( |
) | ( |
) | ( |
) | ( |
) | |||||||||
| Impairments | ( |
) | ( |
) | ( |
) | ( |
) | ( |
) | |||||||||||||||||
| Currency translation differences | |||||||||||||||||||||||||||
| Changes in the scope of consolidaion | ( |
) | |||||||||||||||||||||||||
| Other changes | ( |
) | ( |
) | ( |
) | ( |
) | ( |
) | ( |
) | ( |
) | |||||||||||||
| Net carrying amount - end of the year | |||||||||||||||||||||||||||
| Gross carrying amount - end of the year | |||||||||||||||||||||||||||
| Provisions for depreciation and impairment |
(a) Before capitalization of depreciation of tangible assets
Right-of-use assets (RoU) of €
The increase recorded in 2022 mainly referred to: (i) the Exploration & Production segment for €
| F-52 |
Changes in the scope of consolidation referred for €
The main leasing contracts signed for which the asset is not yet available concern: (i) a contract with a nominal value of €
Main future cash outflows potentially due not reflected in the measurements of lease liabilities related to: (i) options for the extension or termination of lease for office buildings of €
Liabilities for leased assets were as follows:
| (€ million) | Current portion of long-term lease liabilities | Long-term lease liabilities | Total | ||||||
| 2022 | |||||||||
| Carrying amount - beginning of the year | |||||||||
| Additions | |||||||||
| Decreases | ( |
) | ( |
) | ( |
) | |||
| Currency translation differences | |||||||||
| Changes in the scope of consolidation | ( |
) | ( |
) | ( |
) | |||
| Other changes | ( |
) | ( |
) | |||||
| Carrying amount - end of the year | |||||||||
| 2021 | |||||||||
| Carrying amount - beginning of the year | |||||||||
| Additions | |||||||||
| Decreases | ( |
) | ( |
) | ( |
) | |||
| Currency translation differences | |||||||||
| Changes in the scope of consolidation | |||||||||
| Other changes | ( |
) | ( |
) | |||||
| Carrying amount - end of the year |
Lease liabilities related for €
Total cash outflows for leases consisted of the following: (i) cash payments for the principal portion of the lease liability for €
Lease liabilities stated in U.S. dollars and euro amounted to €
Other changes in right-of-use assets and lease liabilities essentially related to early termination or renegotiation of lease contracts.
Liabilities for leased assets with related parties are described in note 36 — Transactions with related parties.
The amounts recognised in the profit and loss account consist of the following:
| (€ million) | 2022 | 2021 | 2020 | ||||||
| Other income and revenues | |||||||||
| Income from remeasurement of lease liabilities | |||||||||
| Purchases, services and other | |||||||||
| Short-term leases | |||||||||
| Low-value leases | |||||||||
| Variable lease payments not included in the measurement of lease liabilities | |||||||||
| Capitalized direct cost associated with self-constructed assets - tangible assets | ( |
) | ( |
) | ( |
) | |||
| Depreciation and impairments | |||||||||
| Depreciation of RoU leased assets | |||||||||
| Capitalized direct cost associated with self-constructed assets - tangible assets | ( |
) | ( |
) | ( |
) | |||
| Impairments of RoU leased assets | |||||||||
| Reversals of RoU leased assets | ( |
) | |||||||
| Finance income (expense) from leases | |||||||||
| Interests on lease liabilities | ( |
) | ( |
) | ( |
) | |||
| Capitalized finance expense of RoU leased assets - tangible assets | |||||||||
| Net currency translation differences on lease liabilities | ( |
) | ( |
) | |||||
| ( |
) | ( |
) | ( |
) |
14 Intangible assets
| (€ million) | Exploration rights | Industrial patents and intellectual property rights | Other intangible assets with definite useful lives | Intangible assets with definite useful lives | Goodwill | Other intangible assets with indefinite useful lives | Total | |||||||||||||
| 2022 | ||||||||||||||||||||
| Net carrying amount - beginning of the year | ||||||||||||||||||||
| Additions | ||||||||||||||||||||
| Amortization | ( |
) | ( |
) | ( |
) | ( |
) | ( |
) | ||||||||||
| Impairments | ( |
) | ( |
) | ( |
) | ( |
) | ||||||||||||
| Write-off | ( |
) | ( |
) | ( |
) | ||||||||||||||
| Changes in the scope of consolidation | ( |
) | ||||||||||||||||||
| Currency translation differences | ||||||||||||||||||||
| Other changes | ( |
) | ( |
) | ||||||||||||||||
| Net carrying amount - end of the year | ||||||||||||||||||||
| Gross carrying amount - end of the year | ||||||||||||||||||||
| Provisions for amortization and impairment | ||||||||||||||||||||
| 2021 | ||||||||||||||||||||
| Net carrying amount - beginning of the year | ||||||||||||||||||||
| Additions | ||||||||||||||||||||
| Amortization | ( |
) | ( |
) | ( |
) | ( |
) | ( |
) | ||||||||||
| Impairment | ( |
) | ( |
) | ( |
) | ( |
) | ( |
) | ||||||||||
| Reversals | ||||||||||||||||||||
| Write-off | ( |
) | ( |
) | ( |
) | ||||||||||||||
| Changes in the scope of consolidation | ||||||||||||||||||||
| Currency translation differences | ||||||||||||||||||||
| Other changes | ( |
) | ||||||||||||||||||
| Net carrying amount - end of the year | ||||||||||||||||||||
| Gross carrying amount - end of the year | ||||||||||||||||||||
| Provisions for amortization and impairment |
| F-54 |
Exploration rights comprised the residual book value of signature bonuses and acquisition costs of exploration licenses relating to areas with proved reserves, which are amortized based on UOP criteria and are regularly reviewed for impairment. The costs of licenses with unproved reserves are also in this item and are suspended pending a final determination of the success of the exploration activity or until management confirms its commitment to the initiative. Additions for the year related to signature bonuses paid for the acquisition of new exploration acreage in Egypt, Mozambique, United Arab Emirates, Ivory Coast and Gabon.
The breakdown of exploration rights by type of asset was as follows:
| (€ million) | December 31, 2022 |
December 31, 2021 |
|||
| Proved licence and leasehold property acquisition costs | |||||
| Unproved licence and leasehold property acquisition costs | |||||
Industrial patents and intellectual property rights mainly regarded the acquisition and internal development of software and rights for the use of production processes and software.
Write-offs of €
Change in the scope of consolidation of assets with a finite useful life concerned: (i) for €
Other changes relating to intangible assets with a finite useful life related for €
Other intangible assets comprised: (i) concessions, licenses, trademarks and similar items for €
The main amortization rates used were substantially unchanged from the previous year and ranged as follows:
| (%) | ||
| Exploration rights | ||
| Other concessions, licenses, trademarks and similar items | ||
| Industrial patents and intellectual property rights | ||
| Capitalized costs for customer acquisition | ||
| Other intangible assets |
Cumulative impairments charges of goodwill at the end of the year amounted to €
The breakdown of goodwill by segment and business line is provided below:
| (€ million) | December 31, 2022 |
December 31, 2021 |
|||
| Plenitude | |||||
| Refining & Marketing | |||||
| Exploration & Production | |||||
| Chemical | |||||
| Corporate and Other activities | |||||
The impairment loss of goodwill for 2022 was essentially recorded in relation to the Exploration & Production segment.
Changes in the scope of consolidation of goodwill related: (i) for €
Information about the allocations of goodwill deriving from business combinations are provided in note 5 - Business combinations and other significant transactions.
Goodwill acquired through business combinations has been allocated to the CGUs that are expected to benefit from the synergies of the acquisition.
The Plenitude business line engaged in the retail sale of natural gas and electricity, in the electricity generation from renewable sources and in installing and managing a network of charging point for electric vehicles. Plenitude has closed several acquisitions in past reporting years and in 2022, those latter commented in note 5 – Business combinations and other significant transactions, leading to the recognition of significant amounts of goodwill in each of those activities.
Goodwill allocated to the activity of retail sale of natural gas and electricity amounted to €
The impairment review of the CGU Retail, including goodwill, was performed by comparing the carrying amount to the value in use of the CGU, which was estimated based on the cash flows of the plan approved by management and on a terminal value calculated as the perpetuity of the cash flow of the last year of the plan by assuming a nominal long-term growth rate equal to
In the renewable business of Plenitude, the CGUs have been identified at a significant project level, in some cases grouped at company level for projects/plants characterized by relevant synergies. Cash flows included both those relating to existing assets (acquired or build internally) and those associated with the repowering process in the case of acquired assets. For the acquisitions of 2022, the impairment was assessed by updating the valuation model used for the acquisition which confirmed the recoverability of the goodwill allocated to the complex of the CGUs.
Goodwill allocated to the business of renewables amounted to €
The impairment test was performed based on the discounted cash flows which comprised the financial projections of the industrial plan approved by management and subsequently the cash flows associated with the useful lives of the plants. Cash flows have been discounted at sector and country-specific WACC, which were comprised in a range of
Goodwill of the E-mobility business of Plentitude of €
The recoverability of the allocated goodwill was tested based on the discounted cash flows of the activity, which comprised the financial projections of the industrial plan approved by management and subsequently the perpetuity of the final year of the plan discounted at a WACC of
15 Reversals (Impairments) of tangible and intangible assets and right-of-use assets. Sensitivity of outcomes to alternative scenarios.
The recoverability test of carrying amounts of oil&gas cash genenerating units (CGUs) is the most important of the critical accounting estimates in the preparation of Eni’s consolidated financial statements. This owes to the relative weight of the invested capital in the sector on total consolidated assets.
Future expected cash flows associated with the use of oil&gas assets are based on management’s judgment and subjective evaluation about highly uncertain matters like future hydrocarbons prices, assets’ useful lives, projections of future operating and capital expenditures, including CO2 emission costs relating to geographies where legal obligations are present, the volumes of reserves that will ultimately be recovered and costs of decommissioning oil&gas assets at the end of their useful lives.
Forecasts of hydrocarbons prices adopted by Eni are based on the review of the fundamentals of supply and demand in the long term, considering the possible evolution of the global energy mix by 2050 in relation to the decarbonisation commitments of the countries and the EU in view of the achievement of the goals of the Paris Agreement, the pace of the energy transition, global economic and demographic growth, the evolution of technologies and the evolution in consumers’ preferences. These assumptions are reflected in the corporate strategies and investment decisions, as well as being used in recoverability assessments of the carrying amount of oil&gas projects.
In the short term, market forward prices are also considered as well as projections made by investment banks and other market observatories.
Eni recognizes and fully endorses the transition of the economy towards a low-carbon development model and the goals of the Paris COP21 agreements and based on this has designed a strategy to achieve the decarbonization of the Company’s products and industrial processes targeting carbon neutrality by 2050. Consistent with this long-term path and with the progressive evolution of the Company's product portfolio, management is assuming a mid-cycle scenario for the price of the Brent crude oil and other price benchmarks, which assumes a balance between global supply and demand, a moderation in economic growth and inflationary pressures and a gradual reduction in the consumption of crude oil in view of achieving the goals of the Paris agreement. The forecast prices of the mid-cycle scenario represent management's best estimate and form the basis for investment decisions, operational plans and recoverability tests of Eni's oil & gas assets.
Below are the main price assumptions for assessing the recoverability of oil & gas assets, expressed in 2021 real terms.
| 2023 | 2025 | 2030 | 2040 | 2050 | ||||||||||
| Brent $/bbl | ||||||||||||||
| TTF natural gas price $mmBtu |
This scenario does not differ significantly from the one adopted in the previous reporting year.
The discount rate of the future cash flows of the CGUs was estimated as the weighted average cost of equity (Ke) and net borrowings, based on the Capital Asset Pricing Model methodology. Specifically, the cost of equity considers both a premium for the non-diversifiable market risk measured on the basis of the long-term returns of the S&P500, and an additional premium that considers exposure to operational risks of the countries of activity and the risks of the energy transition. For 2022, a Group cost of capital “WACC” of approximately
The impairment test was performed at all of the Group’s oil&gas CGUs based on the price scenario of the management and the country WACCs described above, which substantially confirmed the carrying amounts of the properties, with the exception of few assets which were marked to their lower recoverable values due to downward reserves revisions and costs updates, recognizing €
The value in use (VIU) of the oil&gas CGUs under the management’s scenario assumptions displayed a headroom (difference between VIU and book values) of approximately
Considering the subjectivity of the assumptions underlying the estimates of the VIU, management has elaborated the following sensitivity analyses of the oil&gas CGUs values to different scenarios: (i) a linear cut of -10% of hydrocarbon prices in all the years of the cash flows projections; (ii) the projections of hydrocarbon prices and CO2 costs of the decarbonization scenario Net Zero Emission 2050 (NZE 2050) elaborated by IEA. Those sensitivity analysis included assets of all consolidated entities, joint ventures and associates, excluding Vår Energi ASA, Azule Energy Holdings Ltd and an asset under arbitration procedure.
The results of the sensitivity test in terms of changes in the cumulated headroom of oil&gas CGUs and potential pre-tax income statement impacts are provided below:
| Value in use of the O&G CGUs Headroom vs Carrying amounts |
Assumption at 2050 in real terms USD 2021 | |||||||||||||
| tax-deductible CO2 charges |
non tax-deductible CO2 charges |
Brent price | European gas price | Cost of CO2 | ||||||||||
| Eni's scenario | > |
% | - | CO2 costs projections in the EU/ETS + projections of forestry costs |
||||||||||
| 10% haircut of Eni's prices assumptions | % | - | CO2 costs projections in the EU/ETS + projections of forestry costs |
|||||||||||
| IEA NZE 2050 scenario | % | % | ||||||||||||
| (*) Prices relating to advanced/emerging economies |
||||||||||||||
| Sensitivity - 10% to Eni prices assumptions | |||
| (€ billion) | Sensitivity | ||
| Exploration & Production assets | ( |
) | |
| Hydrocarbon prices and CO2 costs of the IEA NZE 2050 scenario | ||||||
| (€ billion) | Sensitivity | |||||
| Tax-deductible CO2 charges |
Non tax-deductible CO2 charges |
|||||
| Exploration & Production assets | ( |
) | ( |
) | ||
These sensitivities do not consider possible actions to mitigate a changed price environment, such as rescheduling and/or cancellation of planned development activities, contractual renegotiations, costs efficiencies or actions aimed at accelerating the pay-back period.
The sensitivity was not applied to the Chemical business and to the gas-fired power generation business considering the immateriality of the residual book values of property, plant and equipment (€
16 Investments
Equity-accounted investments
| 2022 | 2021 | ||||||||||||||||||||||
| (€ million) | Investments in unconsolidated entities controlled by Eni | Joint ventures | Associates | Total | Investments in unconsolidated entities controlled by Eni | Joint ventures | Associates | Total | |||||||||||||||
| Carrying amount - beginning of the year | |||||||||||||||||||||||
| Additions and subscriptions | |||||||||||||||||||||||
| Divestments and reimbursements | ( |
) | ( |
) | ( |
) | ( |
) | ( |
) | ( |
) | ( |
) | ( |
) | |||||||
| Share of profit of equity-accounted investments | |||||||||||||||||||||||
| Share of loss of equity-accounted investments | ( |
) | ( |
) | ( |
) | ( |
) | ( |
) | ( |
) | ( |
) | ( |
) | |||||||
| Deduction for dividends | ( |
) | ( |
) | ( |
) | ( |
) | ( |
) | ( |
) | ( |
) | ( |
) | |||||||
| Changes in the scope of consolidation | ( |
) | ( |
) | ( |
) | |||||||||||||||||
| Currency translation differences | ( |
) | |||||||||||||||||||||
| Other changes | ( |
) | ( |
) | ( |
) | ( |
) | ( |
) | |||||||||||||
| Carrying amount - end of the year | |||||||||||||||||||||||
Acquisitions and share capital increases mainly related for: (i) €
Divestments and reimbursement related to: (i) a capital repayment made by Angola LNG Ltd for €
Eni’s share of the results of entities accounted for under the equity method mainly comprised a profit at: (i) Vår Energi ASA for €
Losses of equity-accounted investments included: (i) Saipem SpA for €
Reduction for dividends related for €
Changes in the scope of consolidation referred for €
Other changes included the inclusion of the joint venture Azule Energy Holdings Ltd for €
Net carrying amounts related to the following companies:
| F-59 |
| December 31, 2022 | December 31, 2021 | ||||||||||
| (€ million) | Net carrying amount | % of the investment |
Net carrying amount | % of the investment |
|||||||
| Investments in unconsolidated entities controlled by Eni | |||||||||||
| Eni BTC Ltd | |||||||||||
| Other | |||||||||||
| Joint ventures | |||||||||||
| Azule Energy Holdings Ltd | |||||||||||
| Saipem SpA | |||||||||||
| Cardón IV SA | |||||||||||
| Vårgrønn AS | |||||||||||
| Mozambique Rovuma Venture SpA | |||||||||||
| GreenIT SpA | |||||||||||
| Lotte Versalis Elastomers Co Ltd | |||||||||||
| Hergo Renewables SpA | |||||||||||
| Società Oleodotti Meridionali - SOM SpA | |||||||||||
| Vår Energi AS | |||||||||||
| Doggerbank Offshore Wind Farm Project 1 Holdco Ltd | |||||||||||
| Doggerbank Offshore Wind Farm Project 2 Holdco Ltd | |||||||||||
| Other | |||||||||||
| Associates | |||||||||||
| Abu Dhabi Oil Refining Company (Takreer) | |||||||||||
| Vår Energi ASA | |||||||||||
| Coral FLNG SA | |||||||||||
| Qatar Liquefied Gas Company Limited (9) | |||||||||||
| Novamont SpA | |||||||||||
| ADNOC Global Trading Ltd | |||||||||||
| Novis Renewables Holdings Llc | |||||||||||
| Bluebell Solar Class A Holdings II Llc | |||||||||||
| United Gas Derivatives Co | |||||||||||
| Angola LNG Ltd | |||||||||||
| Other | |||||||||||
The stake held in Vår Energi ASA was reclassified from joint venture to associate following the listing through an IPO at the Oslo stock exchange. The investment in Novamont SpA was reclassified from other investment to associate following the agreement reached between Eni and Novamont which settled all pending disputes over the management of the Matrìca joint venture, engaged in the development of renewable chemical feedstocks, with an increase in Eni equity investment in Novamont.
The results of equity-accounted investments by segment are disclosed in note 35 – Segment information and information by geographical area.
The carrying amounts of equity-accounted investments included differences between the purchase price of acquired interests and their underlying book value of net assets amounting to €
As at 31 December 2022, the book and market values of Saipem SpA and Vår Energi ASA, listed on the Italian and the Norwegian stock exchange, respectively, were as follows:
| Saipem SpA | Vår Energi ASA | ||||
| Number of ordinary shares held | |||||
| % of the investment | |||||
| Share price (€) | |||||
| Market value (€ million) | |||||
| Book value (€ million) |
| F-60 |
At December 31, 2022, the market capitalization of Saipem share exceeded the book value of the investment by €
At December 31, 2022, the market capitalization of the Vår Energi ASA share for Eni's stake is €
Additional information is included in note 37 – Other information about investments.
Other investments
| (€ million) | 2022 | 2021 | |||
| Carrying amount - beginning of the year | |||||
| Additions and subscriptions | |||||
| Change in the fair value with effect to OCI | |||||
| Currency translation differences | |||||
| Other changes | ( |
) | |||
| Carrying amount - end of the year |
The fair value of the main non-controlling interests in non-listed investees on regulated markets, classified within level 3 of the fair value hierarchy, was estimated based on a methodology that combines future expected earnings and the sum-of-the-parts methodology (so-called residual income approach) and takes into account, inter alia, the following inputs: (i) expected net profits, as a gauge of the future profitability of the investees, derived from the business plans, but adjusted, where appropriate, to include the assumptions that market participants would incorporate; (ii) the cost of capital, adjusted to include the risk premium of the specific country in which each investee operates. A stress test based on a
Dividend income from these investments is disclosed in note 32 – Income (expense) from investments.
Other changes comprised the reclassification to associates of Novamont SpA for €
The investment book value as of December 31, 2022 primarily related to Nigeria LNG Ltd for €
17 Other financial assets
| December 31, 2022 | December 31, 2021 | ||||||||||
| (€ million) | Current | Non-current | Current | Non-current | |||||||
| Long-term financing receivables held for operating purposes | |||||||||||
| Short-term financing receivables held for operating purposes | |||||||||||
| Financing receivables held for non-operating purposes | |||||||||||
| Securities held for operating purposes | |||||||||||
Changes in allowance for doubtful accounts were as follows:
| (€ million) | 2022 | 2021 | |||
| Carrying amount at the beginning of the year | |||||
| Additions | |||||
| Deductions | ( |
) | ( |
) | |
| Currency translation differences | |||||
| Other changes | ( |
) | |||
| Carrying amount at the end of the year |
| F-61 |
Financing receivables held for operating purposes related principally to funds provided to joint ventures and associates in the Exploration & Production segment (€
Financing receivables held for operating purposes due beyond five years amounted to €
The fair value of non-current financing receivables held for operating purposes of €
The recoverability of other long-term financial assets was assessed by considering the expected probability default in the next twelve months only, as the creditworthiness suffered no significant deterioration in the reporting period.
Financing receivables held for non-operating purposes related for €
Financing receivables were denominated in euro and U.S. dollar for €
Securities held for operating purposes related to listed bonds issued by sovereign states.
Securities for €
The following table analyses securities per issuing entity:
| Amortized cost (€ million) | Nominal value (€ million) |
Fair Value (€ million) | Nominal rate of return (%) | Maturity date | Rating - Moody's | Rating - S&P | |||||||||||||||
| Sovereign states | |||||||||||||||||||||
| Fixed rate bonds | |||||||||||||||||||||
| Italy | from |
|
|||||||||||||||||||
| Others (*) | from |
|
|
||||||||||||||||||
| Floating rate bonds | |||||||||||||||||||||
| Italy | from |
|
|||||||||||||||||||
| Total sovereign states |
(*) Amounts included herein are lower than €
All securities have maturity within
The fair value of securities was derived from quoted market prices.
Receivables with related parties are described in note 36 – Transactions with related parties.
18 Trade and other payables
| (€ million) | December 31, 2022 | December 31, 2021 | |||
| Trade payables | |||||
| Down payments and advances from joint ventures in exploration & production activities | |||||
| Payables for purchase of non-current assets | |||||
| Payables due to partners in exploration & production activities | |||||
| Other payables | |||||
The increase in trade payables of €
Other payables included: (i) the amounts still due to the triggering of the take-or-pay clause of the long-term supply contracts for €
Trade and other payables were denominated in euro for €
Because of the short-term maturity and conditions of remuneration of trade payables, the fair values approximated the carrying amounts.
Trade and other payables due to related parties are described in note 36 – Transactions with related parties.
19 Finance debt
| December 31, 2022 | December 31, 2021 | |||||||||||||||||||||
| Short-term debt | Current portion of long-term debt | Long-term debt |
Total | Short-term debt | Current portion of long-term debt | Long-term debt |
Total | |||||||||||||||
| (€ million) | ||||||||||||||||||||||
| Banks | ||||||||||||||||||||||
| Ordinary bonds | ||||||||||||||||||||||
| Convertible bonds | ||||||||||||||||||||||
| Sustainability-Linked Bond | ||||||||||||||||||||||
| Commercial papers | ||||||||||||||||||||||
| Other financial institutions | ||||||||||||||||||||||
Finance debt decreased by €
As of December 31, 2022, finance debt included €
Eni entered into long-term borrowing facilities with the European Investment Bank. These borrowing facilities are subject to the retention of a minimum level of credit rating. According to the agreements, should the Company lose the minimum credit rating, new guarantees could be required to be agreed upon with the European Investment Bank. At December 31, 2022, debts subjected to restrictive covenants amounted to €
Eni has in place a program for the issuance of Euro Medium Term Notes up to €
Ordinary bonds consisted of bonds issued within the Euro Medium Term Notes Program for a total of €
As of December 31, 2022, ordinary bonds maturing within 18 months amounted to €
| F-63 |
The following table provides a breakdown of ordinary bonds by issuing entity, maturity date, interest rate and currency as of December 31, 2022:
| (€ million) |
Amount |
Discount on bond issue and accrued expense |
Total |
Currency |
Maturity | Rate % | |||||||||||||||||
| from | to | from | to | ||||||||||||||||||||
| Issuing entity | |||||||||||||||||||||||
| Euro Medium Term Notes | |||||||||||||||||||||||
| Eni SpA | |||||||||||||||||||||||
| Eni SpA | |||||||||||||||||||||||
| Eni SpA | |||||||||||||||||||||||
| Eni SpA | |||||||||||||||||||||||
| Eni SpA | |||||||||||||||||||||||
| Eni SpA | |||||||||||||||||||||||
| Eni SpA | |||||||||||||||||||||||
| Eni SpA | |||||||||||||||||||||||
| Eni SpA | |||||||||||||||||||||||
| Eni SpA | |||||||||||||||||||||||
| Eni SpA | |||||||||||||||||||||||
| Eni SpA | ( |
) | |||||||||||||||||||||
| Eni SpA | |||||||||||||||||||||||
| Eni SpA | ( |
) | |||||||||||||||||||||
| Eni Finance International SA | |||||||||||||||||||||||
| Eni Finance International SA | |||||||||||||||||||||||
| Other bonds | |||||||||||||||||||||||
| Eni SpA | |||||||||||||||||||||||
| Eni SpA | |||||||||||||||||||||||
| Eni SpA | |||||||||||||||||||||||
| Eni SpA | |||||||||||||||||||||||
| Eni USA Inc | |||||||||||||||||||||||
| PLT Wind 2022 SpA | |||||||||||||||||||||||
| SEF Srl | |||||||||||||||||||||||
As part of the Euro Medium Term Notes program, during 2021 Eni issued a sustainability-linked bond for a nominal amount of €
Information relating to the sustainability-linked bonds issued by Eni SpA is as follows:
| (€ million) | Amount | Discount on bond issue and accrued expense | Total | Currency | Maturity | Rate % | |||||||||||
| Eni SpA | ( |
) |
The following table provides a breakdown by currency of finance debt and the related weighted average interest rates:
| December 31, 2022 | December 31, 2021 | ||||||||||||||||||||||
| Short-term debt (€ million) |
Average rate (%) |
Long-term debt and current portion of long term debt (€ million) |
Average rate (%) |
Short-term debt (€ million) |
Average rate (%) |
Long-term debt and current portion of long term debt (€ million) |
Average rate (%) |
||||||||||||||||
| Euro | |||||||||||||||||||||||
| U.S. dollar | |||||||||||||||||||||||
| Other currencies | ( |
) | |||||||||||||||||||||
As of December 31, 2022, Eni retained committed borrowing facilities of €
| (€ million) | December 31, 2022 | December 31, 2021 | |||
| Undrawn long-term Sustainability-Linked bonds | |||||
| Other undrawn long-term borrowing facilities | |||||
| Drawn long-term Sustainability-Linked bonds | |||||
| Other drawn long-term borrowing facilities | |||||
| Long-term borrowing facilities | |||||
| Other undrawn short-term borrowing facilities | |||||
| Other drawn short-term borrowing facilities | |||||
| Short-term borrowing facilities | |||||
As of December 31, 2022, Eni was in compliance with covenants and other contractual provisions in relation to borrowing facilities.
Fair value of long-term debt, including the current portion of long-term debt is described below:
| (€ million) | December 31, 2022 |
December 31, 2021 |
|||
| Ordinary bonds and Sustainability-Linked Bond | |||||
| Convertible bonds | |||||
| Banks | |||||
| Other financial institutions | |||||
Fair value of finance debts was calculated by discounting the expected future cash flows at discount rates ranging from
Because of the short-term maturity and conditions of remuneration of short-term debt, the fair value approximated the carrying amount.
| F-65 |
Changes in liabilities arising from financing activities
| (€ million) | Long-term debt and current portion of long-term debt | Short-term debt | Long-term and current portion of long-term lease liabilietis | Total | |||||||
| Carrying amount at December 31, 2021 | |||||||||||
| Cash flows | ( |
) | ( |
) | ( |
) | |||||
| Currency translation differences | |||||||||||
| Changes in the scope of consolidation | ( |
) | ( |
) | ( |
) | |||||
| Other non-monetary changes | |||||||||||
| Carrying amount at December 31, 2022 | |||||||||||
| Carrying amount at December 31, 2020 | |||||||||||
| Cash flows | ( |
) | ( |
) | ( |
) | |||||
| Currency translation differences | |||||||||||
| Changes in the scope of consolidation | |||||||||||
| Other non-monetary changes | |||||||||||
| Carrying amount at December 31, 2021 |
Changes in the scope of consolidation referred to the Exploration & Production segment for €
Other non-monetary changes include €
Transactions with related parties are described in note 36 – Transactions with related parties
20 Information on net borrowings
In assessing its capital structure, Eni uses net borrowings before the accounting effects of IFRS 16 (lease obligations), which is a non-GAAP financial measure. Eni calculates net borrowings as total finance debt (short-term and long-term debt) derived from its Consolidated Financial Statements prepared in accordance with IFRS less: cash and cash equivalents, held-for-trading securities and certain marketable investments not related to operations including, among others, non-operating financing receivables. Held-for-trading securities are part of a strategic reserve of liquidity that management has established by reinvesting proceeds from the Group disposal plans and is intended to provide a certain degree of financial flexibility in case of a prolonged price downturn, tight financial markets or in view of other Company’s purposes. Non-operating financing receivables consist mainly of deposits with banks and other financing institutions and deposits in escrow. These assets are generally intended to absorb temporary surpluses of cash as part of the Company’s ordinary management of financing activities.
Management believes that net borrowings is a useful measure of Eni’s financial condition as it provides insight about the soundness of Eni’s capital structure and the ways by which Eni’s operating assets are financed.
| (€ million) | December 31, 2022 | December 31, 2021 | ||||
| A. Cash | ||||||
| B. Cash equivalents | ||||||
| C. Other current financial assets | ||||||
| D Liquidity (A+B+C) | ||||||
| E. Current financial debt | ||||||
| F. Current portion of non-current financial debt | ||||||
| G. Current financial indebtedness (E+F) | ||||||
| H. Net current financial indebtedness (G-D) | ( |
) | ( |
) | ||
| I. Non-current financial debt | ||||||
| J. Debt instruments | ||||||
| K. Non‐current trade and other payables | ||||||
| L. Non-current financial indebtedness (I+J+K) | ||||||
| M. Total financial indebtedness (H+L) |
Cash and cash equivalent include approximately €
Other current financial assets include: (i) financial assets at fair value through profit or loss, disclosed in note 7 – Financial assets at fair value through profit or loss; (ii) financing receivables, disclosed in note 17 – Other financial assets.
Finance debts are disclosed in note 19 – Finance debts.
Current portion of non-current financial debt and non-current financial debt include lease liabilities of €
21 Provisions
| (€ million) | Provisions for site restoration, abandonment and social projects | Environmental provisions | Provisions for litigations | Provisions for taxes other than income taxes | Loss adjustments and actuarial provisions for Eni's insurance companies | Provisions for losses on investments | Provisions for Everen (ex OIL) insurance cover | Other | Total | ||||||||||||||||||
| Carrying amount at December 31, 2021 | |||||||||||||||||||||||||||
| New or increased provisions | |||||||||||||||||||||||||||
| Initial recognition and changes in estimates | ( |
) | ( |
) | |||||||||||||||||||||||
| Accretion discount | ( |
) | ( |
) | |||||||||||||||||||||||
| Reversal of utilized provisions | ( |
) | ( |
) | ( |
) | ( |
) | ( |
) | ( |
) | ( |
) | |||||||||||||
| Reversal of unutilized provisions | ( |
) | ( |
) | ( |
) | ( |
) | ( |
) | ( |
) | |||||||||||||||
| Currency translation differences | |||||||||||||||||||||||||||
| Changes in scope of consolidation | ( |
) | ( |
) | ( |
) | |||||||||||||||||||||
| Other changes | ( |
) | ( |
) | ( |
) | ( |
) | |||||||||||||||||||
| Carrying amount at December 31, 2022 |
Provisions for site restoration, abandonment and social projects include: (i) for €
Provisions for environmental risks included the estimated costs for environmental clean-up and remediation of soil and groundwater in areas owned or under concession where the Group performed in the past industrial operations that were progressively divested, shut down, dismantled or restructured. The provision was accrued because at the balance sheet date there is a legal or constructive obligation for Eni to carry out environmental clean-up and remediation and the expected costs can be estimated reliably. The provision included the expected charges associated with strict liability related to obligations of cleaning up and remediating polluted areas that met the parameters set by law at the time when the pollution occurred but presently are no more in compliance with current environmental laws and regulations, or because Eni assumed the liability borne by other operators when the Company acquired or otherwise took over site operations. Those environmental provisions are recognized when an environmental project is approved by or filed with the relevant administrative authorities or a constructive obligation has arisen whereby the Company commits itself to performing certain cleaning-up and restoration projects and a reliable cost estimation is available. In 2022, a provision of €
Litigation provisions comprised expected liabilities associated with legal proceedings and other matters arising from contractual claims, including arbitrations, fines and penalties due to antitrust proceedings and administrative matters. The provision was allocated on the basis of the best estimate of the existing liability at the balance sheet date and refers to the Global Gas & LNG Portfolio segment for €
Provisions for uncertain taxes matters related to the estimated losses that the Company expects to incur to settle tax litigations and tax claims pending with tax authorities in relation to uncertainties in applying rules in force were in respect of the Exploration & Production segment for €
Loss adjustments and actuarial provisions of Eni’s insurance company Eni Insurance DAC represented the estimated liabilities accrued on the basis for third party claims. Against such liability was recorded receivables of €
Provisions for losses on investments included provisions relating to investments whose loss exceeds the equity and primarily related to Industria Siciliana Acido Fosforico - ISAF - SpA (in liquidation) for €
Provisions for the Everen (ex OIL) insurance coverage included insurance premiums which will be charged to Eni in the next
22 Provisions for employee benefits
| (€ million) | December 31, 2022 | December 31, 2021 | ||||
| Italian defined benefit plans | ||||||
| Foreign defined benefit plans | ||||||
| FISDE, foreign medical plans and other | ||||||
| Defined benefit plans | ||||||
| Other benefit plans | ||||||
| Provision for employee benefits |
The liability relating to Eni's commitment to cover the healthcare costs of personnel is determined based on the contributions paid by the Company.
Other employee benefit plans related to deferred monetary incentive plans for €
Present value of employee benefits, estimated by applying actuarial techniques, consisted of the following:
| 2022 | 2021 | ||||||||||||||||||||||||||||||||||||
| (€ million) | Italian defined benefit plans | Foreign defined benefit plans | FISDE, foreign medical plans and other | Defined benefit plans | Other benefit plans | Total | Italian defined benefit plans | Foreign defined benefit plans | FISDE, foreign medical plans and other | Defined benefit plans | Other benefit plans | Total | |||||||||||||||||||||||||
| Present value of benefit liabilities at beginning of year | |||||||||||||||||||||||||||||||||||||
| Current service cost | |||||||||||||||||||||||||||||||||||||
| Interest cost | |||||||||||||||||||||||||||||||||||||
| Remeasurements: | ( |
) | ( |
) | ( |
) | ( |
) | ( |
) | ( |
) | ( |
) | ( |
) | ( |
) | ( |
) | ( |
) | |||||||||||||||
| - actuarial (gains) losses due to changes in demographic assumptions | ( |
) | ( |
) | ( |
) | ( |
) | ( |
) | ( |
) | ( |
) | |||||||||||||||||||||||
| - actuarial (gains) losses due to changes in financial assumptions | ( |
) | ( |
) | ( |
) | ( |
) | ( |
) | ( |
) | ( |
) | ( |
) | ( |
) | ( |
) | |||||||||||||||||
| - experience (gains) losses | ( |
) | ( |
) | ( |
) | ( |
) | ( |
) | ( |
) | |||||||||||||||||||||||||
| Past service cost and (gain) loss on settlements | |||||||||||||||||||||||||||||||||||||
| Plan contributions: | |||||||||||||||||||||||||||||||||||||
| - employee contributions | |||||||||||||||||||||||||||||||||||||
| Benefits paid | ( |
) | ( |
) | ( |
) | ( |
) | ( |
) | ( |
) | ( |
) | ( |
) | ( |
) | ( |
) | ( |
) | ( |
) | |||||||||||||
| Currency translation differences and other changes | ( |
) | ( |
) | ( |
) | ( |
) | ( |
) | ( |
) | ( |
) | ( |
) | ( |
) | |||||||||||||||||||
| Present value of benefit liabilities at end of year (a) | |||||||||||||||||||||||||||||||||||||
| Plan assets at beginning of year | |||||||||||||||||||||||||||||||||||||
| Interest income | |||||||||||||||||||||||||||||||||||||
| Return on plan assets | ( |
) | ( |
) | ( |
) | ( |
) | ( |
) | ( |
) | |||||||||||||||||||||||||
| Past service cost and (gains) losses settlements | ( |
) | ( |
) | ( |
) | |||||||||||||||||||||||||||||||
| Plan contributions: | |||||||||||||||||||||||||||||||||||||
| - employee contributions | |||||||||||||||||||||||||||||||||||||
| - employer contributions | |||||||||||||||||||||||||||||||||||||
| Benefits paid | ( |
) | ( |
) | ( |
) | ( |
) | ( |
) | ( |
) | |||||||||||||||||||||||||
| Currency translation differences and other changes | ( |
) | ( |
) | ( |
) | ( |
) | ( |
) | ( |
) | |||||||||||||||||||||||||
| Plan assets at end of year (b) | |||||||||||||||||||||||||||||||||||||
| Asset ceiling at beginning of year | |||||||||||||||||||||||||||||||||||||
| Change in asset ceiling | |||||||||||||||||||||||||||||||||||||
| Asset ceiling at end of year (c) | |||||||||||||||||||||||||||||||||||||
| Net liability recognized at end of year (a-b+c) | |||||||||||||||||||||||||||||||||||||
Employee benefit plans included the actuarial liability, net of plan assets, attributable to partners operating in exploration and production activities of €
| (€ million) | Italian defined benefit plans | Foreign defined benefit plans | FISDE, foreign medical plans and other | Defined benefit plans | Other benefit plans |
Total | ||||||||||||
| 2022 | ||||||||||||||||||
| Current service cost | ||||||||||||||||||
| Past service cost and (gains) losses on settlements | ||||||||||||||||||
| Interest cost (income), net: | ||||||||||||||||||
| - interest cost on liabilities | ||||||||||||||||||
| - interest income on plan assets | ( |
) | ( |
) | ( |
) | ||||||||||||
| Total interest cost (income), net | ||||||||||||||||||
| - of which recognized in "Payroll and related cost" | ||||||||||||||||||
| - of which recognized in "Financial income (expense)" | ||||||||||||||||||
| Remeasurements for long-term plans | ( |
) | ( |
) | ||||||||||||||
| Administrative fees paid | ||||||||||||||||||
| Total | ||||||||||||||||||
| - of which recognized in "Payroll and related cost" | ||||||||||||||||||
| - of which recognized in "Financial income (expense)" | ||||||||||||||||||
| 2021 | ||||||||||||||||||
| Current service cost | ||||||||||||||||||
| Past service cost and (gains) losses on settlements | ||||||||||||||||||
| Interest cost (income), net: | ||||||||||||||||||
| - interest cost on liabilities | ||||||||||||||||||
| - interest income on plan assets | ( |
) | ( |
) | ( |
) | ||||||||||||
| Total interest cost (income), net | ||||||||||||||||||
| - of which recognized in "Payroll and related cost" | ||||||||||||||||||
| - of which recognized in "Financial income (expense)" | ||||||||||||||||||
| Remeasurements for long-term plans | ( |
) | ( |
) | ||||||||||||||
| Total | ||||||||||||||||||
| - of which recognized in "Payroll and related cost" | ||||||||||||||||||
| - of which recognized in "Financial income (expense)" |
Costs of defined benefit plans recognized in other comprehensive income consisted of the following:
| 2022 | 2021 | ||||||||||||||||||||||||
| (€ million) | Italian defined benefit plans | Foreign defined benefit plans | FISDE, foreign medical plans and other | Total | Italian defined benefit plans | Foreign defined benefit plans | FISDE, foreign medical plans and other | Total | |||||||||||||||||
| Actuarial (gains)/losses due to changes in demographic assumptions | ( |
) | ( |
) | ( |
) | ( |
) | |||||||||||||||||
| Actuarial (gains)/losses due to changes in financial assumptions | ( |
) | ( |
) | ( |
) | ( |
) | ( |
) | ( |
) | ( |
) | |||||||||||
| Experience (gains) losses | ( |
) | ( |
) | ( |
) | |||||||||||||||||||
| Return on plan assets | |||||||||||||||||||||||||
| Remeasurements | ( |
) | ( |
) | ( |
) | ( |
) | ( |
) | ( |
) | ( |
) | |||||||||||
Plan assets consisted of the following:
| (€ million) | Cash and cash equivalents | Equity securities | Debt securities | Real estate | Derivatives | Investment funds | Assets held by insurance company | Other | Total | ||||||||||
| December 31, 2022 | |||||||||||||||||||
| Plan assets with a quoted market price | |||||||||||||||||||
| Plan assets without a quoted market price | |||||||||||||||||||
| December 31, 2021 | |||||||||||||||||||
| Plan assets with a quoted market price | |||||||||||||||||||
| Plan assets without a quoted market price | |||||||||||||||||||
The main actuarial assumptions used in the measurement of the liabilities at year-end and in the estimate of costs expected for 2023 consisted of the following:
| Italian defined benefit plans | Foreign defined benefit plans | FISDE, foreign medical plans and other |
Other benefit plans | |||||||||||
| 2022 | ||||||||||||||
| Discount rate | (%) | |||||||||||||
| Rate of compensation increase | (%) | |||||||||||||
| Rate of price inflation | (%) | |||||||||||||
| Life expectations on retirement at age 65 | (years) | |||||||||||||
| 2021 | ||||||||||||||
| Discount rate | (%) | |||||||||||||
| Rate of compensation increase | (%) | |||||||||||||
| Rate of price inflation | (%) | |||||||||||||
| Life expectations on retirement at age 65 | (years) |
The following is an analysis by geographical area related to the main actuarial assumptions used in the valuation of the principal foreign defined benefit plans:
| Euro area |
Rest of Europe |
Africa | Other areas |
Foreign defined benefit plans | |||||||||||||
| 2022 | |||||||||||||||||
| Discount rate | (%) | ||||||||||||||||
| Rate of compensation increase | (%) | ||||||||||||||||
| Rate of price inflation | (%) | ||||||||||||||||
| Life expectations on retirement at age 65 | (years) | ||||||||||||||||
| 2021 | |||||||||||||||||
| Discount rate | (%) | ||||||||||||||||
| Rate of compensation increase | (%) | ||||||||||||||||
| Rate of price inflation | (%) | ||||||||||||||||
| Life expectations on retirement at age 65 | (years) |
The effects of a possible change in the main actuarial assumptions at the end of the year are listed below:
| Discount rate | Rate of price inflation | Rate of increases in pensionable salaries | Healthcare cost trend rate | Rate of increases to pensions in payment | ||||||||||||||
| (€ million) | 0.5% Increase | 0.5% Increase | 0.5% Increase | 0.5% Increase | ||||||||||||||
| December 31, 2022 | ||||||||||||||||||
| Italian defined benefit plans | ( |
) | ||||||||||||||||
| Foreign defined benefit plans | ( |
) | ||||||||||||||||
| FISDE, foreign medical plans and other | ( |
) | ||||||||||||||||
| Other benefit plans | ( |
) | ||||||||||||||||
| December 31, 2021 | ||||||||||||||||||
| Italian defined benefit plans | ( |
) | ||||||||||||||||
| Foreign defined benefit plans | ( |
) | ||||||||||||||||
| FISDE, foreign medical plans and other | ( |
) | ||||||||||||||||
| Other benefit plans | ( |
) | ||||||||||||||||
The sensitivity analysis was performed based on the results for each plan through assessments calculated considering modified parameters.
The amount of contributions expected to be paid for employee benefit plans in the next year amounted to €
The following is an analysis by maturity date of the liabilities for employee benefit plans and their relative weighted average duration:
| (€ million) | Italian defined benefit plans | Foreign defined benefit plans | FISDE, foreign medical plans and other | Other benefit plans | ||||||||
| December 31, 2022 | ||||||||||||
| 2023 | ||||||||||||
| 2024 | ||||||||||||
| 2025 | ||||||||||||
| 2026 | ||||||||||||
| 2027 | ||||||||||||
| 2028 and thereafter | ( |
) | ||||||||||
| Weighted average duration (years) | ||||||||||||
| December 31, 2021 | ||||||||||||
| 2022 | ||||||||||||
| 2023 | ||||||||||||
| 2024 | ||||||||||||
| 2025 | ||||||||||||
| 2026 | ||||||||||||
| 2027 and thereafter | ||||||||||||
| Weighted average duration (years) |
23 Deferred tax assets and liabilities
| (€ million) | December 31, 2022 | December 31, 2021 | ||||
| Deferred tax liabilities before offsetting | ||||||
| Deferred tax assets available for offset | ( |
) | ( |
) | ||
| Deferred tax liabilities | ||||||
| Deferred tax assets before offsetting (net of accumulated write-down provisions) | ||||||
| Deferred tax liabilities available for offset | ( |
) | ( |
) | ||
| Deferred tax assets |
The most significant temporary differences giving rise to net deferred tax assets and liabilities are disclosed below:
| (€ million) | Carrying amount at December 31, 2022 | Carrying amount at December 31, 2021 | ||||
| Deferred tax liabilities | ||||||
| Accelerated tax depreciation | ||||||
| Derivative financial instruments | ||||||
| Difference between the fair value and the carrying amount of assets acquired | ||||||
| Site restoration and abandonment (tangible assets) | ||||||
| Leasing | ||||||
| Application of the weighted average cost method in evaluation of inventories | ||||||
| Other | ||||||
| Deferred tax assets, gross | ||||||
| Carry-forward tax losses | ( |
) | ( |
) | ||
| Site restoration and abandonment (provisions for contingencies) | ( |
) | ( |
) | ||
| Timing differences on depreciation and amortization | ( |
) | ( |
) | ||
| Impairment losses | ( |
) | ( |
) | ||
| Accruals for impairment losses and provisions for contingencies | ( |
) | ( |
) | ||
| Leasing | ( |
) | ( |
) | ||
| Employee benefits | ( |
) | ( |
) | ||
| Unrealized intercompany profits | ( |
) | ( |
) | ||
| Derivative financial instruments | ( |
) | ( |
) | ||
| Over/Under lifting | ( |
) | ( |
) | ||
| Other | ( |
) | ( |
) | ||
| ( |
) | ( |
) | |||
| Accumulated write-downs of deferred tax assets | ||||||
| Deferred tax assets, net | ( |
) | ( |
) |
The following table summarizes the changes in deferred tax liabilities and assets:
| (€ million) | Deferred tax liabilities before offsetting | Deferred tax assets before offsetting, gross |
Accumulated write-downs of deferred tax assets |
Deferred tax assets before offsetting net of accumulated write-down provisions | ||||||||
| Carrying amount at December 31, 2021 | ( |
) | ( |
) | ||||||||
| Additions | ( |
) | ( |
) | ||||||||
| Deductions | ( |
) | ( |
) | ||||||||
| Changes with effect to OCI | ( |
) | ( |
) | ||||||||
| Currency translation differences | ( |
) | ( |
) | ||||||||
| Changes in the scope of consolidation | ( |
) | ( |
) | ||||||||
| Other changes | ( |
) | ( |
) | ||||||||
| Carrying amount at December 31, 2022 | ( |
) | ( |
) | ||||||||
| Carrying amount at December 31, 2020 | ( |
) | ( |
) | ||||||||
| Additions | ( |
) | ( |
) | ||||||||
| Deductions | ( |
) | ( |
) | ||||||||
| Currency translation differences | ( |
) | ( |
) | ||||||||
| Other changes | ( |
) | ( |
) | ( |
) | ||||||
| Carrying amount at December 31, 2021 | ( |
) | ( |
) |
Carry-forward tax losses amounted to €
Italian taxation law allows the carry-forward of tax losses indefinitely. Foreign taxation laws generally allow the carry-forward of tax losses over a period longer than five years, and in many cases, indefinitely. A tax rate of
Accumulated write-downs of deferred tax assets related to Italian companies for €
The reduction of accumulated write-downs of €
Taxes are also described in note 33 – Income taxes.
24 Derivative financial instruments and hedge accounting
| December 31, 2022 | December 31, 2021 | ||||||||||||||||
| (€ million) | Fair value asset |
Fair value liability |
Level of Fair value | Fair value asset |
Fair value liability |
Level of Fair value | |||||||||||
| Non-hedging derivatives | |||||||||||||||||
| Derivatives on exchange rate | |||||||||||||||||
| - Currency swap | 2 | 2 | |||||||||||||||
| - Interest currency swap | 2 | 2 | |||||||||||||||
| - Outright | 2 | 2 | |||||||||||||||
| Derivatives on interest rate | |||||||||||||||||
| - Interest rate swap | 2 | 2 | |||||||||||||||
| Derivatives on commodities | |||||||||||||||||
| - Over the counter | 2 | 2 | |||||||||||||||
| - Future | 1 | 1 | |||||||||||||||
| - Options | 1 | ||||||||||||||||
| - Other | 2 | 2 | |||||||||||||||
| Cash flow hedge derivatives | |||||||||||||||||
| Derivatives on commodities | |||||||||||||||||
| - Over the counter | 2 | ||||||||||||||||
| - Future | 1 | 1 | |||||||||||||||
| Derivatives on interest rate | |||||||||||||||||
| - Interest rate swap | 2 | 2 | |||||||||||||||
| Options | |||||||||||||||||
| - Other options | 3 | 3 | |||||||||||||||
| Gross amount | |||||||||||||||||
| Offsetting | ( |
) | ( |
) | ( |
) | ( |
) | |||||||||
| Net amount | |||||||||||||||||
| Of which: | |||||||||||||||||
| - current | |||||||||||||||||
| - non-current | |||||||||||||||||
Eni is exposed to the market risk, which is the risk that changes in prices of energy commodities, exchange rates and interest rates could reduce the expected cash flows or the fair value of the assets. Eni enters into financial and commodities derivatives traded on organized markets (like MTF and OTF) and into commodities derivatives traded over the counter (swaps, forward, contracts for differences and options on commodities) to reduce this risk in relation to the underlying commodities, currencies or interest rates and, to a limited extent, in compliance with internal authorization thresholds, with speculative purposes to profit from expected market trends.
Derivatives fair values were estimated based on market quotations provided by primary info-provider or, alternatively, appropriate valuation techniques generally adopted in the marketplace.
Fair values of non-hedging derivatives essentially comprised forward sale contracts of natural gas for physical delivery which were not entitled to the own use exemption, as well as derivatives for proprietary trading activities.
Fair value of cash flow hedge derivatives essentially related to commodity hedges were entered into by the Global Gas & LNG Portfolio segment. These derivatives were entered into to hedge variability in future cash flows associated with highly probable future trade transactions of gas or electricity or on already contracted trades due to different indexation mechanisms of supply costs versus selling prices. A similar scheme applies to exchange rate hedging derivatives. The existence of a relationship between the hedged item and the hedging derivative is checked at inception to verify eligibility for hedge accounting by observing the offset in changes of the fair values at both the underlying commodity and the derivative. The hedging relationship is also stress-tested against the level of credit risk of the counterparty in the derivative transaction. The hedge ratio is defined consistently with the Company’s risk management objectives, under a defined risk management strategy. The hedging relationship is discontinued when it ceases to meet the qualifying criteria and the risk management objectives on the basis of which hedge accounting has initially been applied.
The effects of the measurement at fair value of cash flow hedge derivatives are given in note 26 – Equity. Information on hedged risks and hedging policies is disclosed in note 28 – Guarantees, commitments and risks - Risk factors.
During 2021, Eni entered into sustainability-linked interest currency swaps with leading banking institutions which provide for a cost adjustment mechanism linked to the achievement of certain sustainability targets. At December 31, 2022, the fair value of these contracts amounted to positive €
In 2022, the exposure to the exchange rate risk deriving from securities denominated in U.S. dollars included in the strategic liquidity portfolio amounting to €
The offsetting of financial derivatives related to Eni Global Energy Markets SpA.
During 2022, there were no transfers between the different hierarchy levels of fair value.
Hedging derivative instruments are disclosed below:
| December 31, 2022 | December 31, 2021 | ||||||||||||||||
| (€ million) | Nominal amount of the hedging instrument |
Change in fair value (effective hedge) |
Change in fair value (ineffective hedge) |
Nominal amount of the hedging instrument |
Change in fair value (effective hedge) |
Change in fair value (ineffective hedge) |
|||||||||||
| Cash flow hedge derivatives | |||||||||||||||||
| Derivatives on commodity | |||||||||||||||||
| - Over the counter | ( |
) | ( |
) | ( |
) | ( |
) | |||||||||
| - Future | ( |
) | ( |
) | ( |
) | |||||||||||
| - Other |
|||||||||||||||||
| ( |
) | ( |
) | ( |
) | ( |
) | ||||||||||
| Derivatives on interest rate | |||||||||||||||||
| - Interest rate swap | |||||||||||||||||
| ( |
) | ( |
) | ( |
) | ( |
) | ||||||||||
The breakdown of the underlying asset or liability by type of risk hedged under cash flow hedge is provided below:
| December 31, 2022 | December 31, 2021 | ||||||||||||||||
| (€ million) | Change of the underlying asset used for the calculation of hedging ineffectiveness | CFH reserve | Reclassification adjustments | Change of the underlying asset used for the calculation of hedging ineffectiveness | CFH reserve | Reclassification adjustments | |||||||||||
| Cash flow hedge derivatives | |||||||||||||||||
| Commodity price risk | |||||||||||||||||
| - Planned sales | ( |
) | ( |
) | ( |
) | ( |
) | |||||||||
| ( |
) | ( |
) | ( |
) | ( |
) | ||||||||||
| Derivatives on interest rate | |||||||||||||||||
| - hedged flows | ( |
) | ( |
) | ( |
) | |||||||||||
| ( |
) | ( |
) | ( |
) | ||||||||||||
| ( |
) | ( |
) | ( |
) | ( |
) | ||||||||||
More information is reported in note 28 — Guarantees, Commitments and Risks — Financial risks.
Effects recognized in other operating profit (loss)
Other operating profit (loss) related to derivative financial instruments on commodity was as follows:
| (€ million) | 2022 | 2021 | 2020 | |||||
| Net income (loss) on cash flow hedging derivatives | ( |
) | ( |
) | ||||
| Net income (loss) on other derivatives | ( |
) | ( |
) | ||||
| ( |
) | ( |
) |
Net income (loss) on cash flow hedging derivatives related to the ineffective portion of the hedging relationship on commodity derivatives was recognized through profit and loss.
Net income (loss) on other derivatives included the fair value measurement and settlement of commodity derivatives which could not be elected for hedge accounting under IFRS because they related to net exposure to commodity risk and derivatives for trading purposes and proprietary trading.
Effects recognized in finance income (loss)
| (€ million) | 2022 | 2021 | 2020 | |||||
| Derivatives on exchange rate | ( |
) | ( |
) | ||||
| Derivatives on interest rate | ( |
) | ||||||
| Options | ||||||||
| ( |
) |
Net financial income from derivative financial instruments was recognized in connection with the fair value valuation of certain derivatives which lacked the formal criteria to be treated in accordance with hedge accounting under IFRS, as they were entered into for amounts equal to the net exposure to exchange rate risk and interest rate risk, and as such, they cannot be referred to specific trade or financing transactions. Exchange rate derivatives were entered into in order to manage exposures to foreign currency exchange rates arising from the pricing formulas of commodities.
More information is disclosed in note 36 – Transactions with related parties.
25 Assets held for sale and liabilities directly associated with assets held for sale
As of December 31, 2022, assets held for sale of €
During the year, assets indicated in the 2021 financial statements have been sold, and related to: (i) assets in Pakistan described in note 5 – Business combinations and other significant transactions; (ii) the investment Gas Distribution Company of Thessaloniki – Thessaly SA (EDA Thess) operating in the gas distribution business in Greece, sold to Depa Infrastructure, a company of Italgas Group for €
26 Equity
Non-controlling interest
| Net Profit | Equity | |||||||||||
| (€ million) | 2022 | 2021 | December 31, 2022 | December 31, 2021 | ||||||||
| EniPower Group | ||||||||||||
| Others | ||||||||||||
Equity attributable to equity holders of Eni
| (€ million) | December 31, 2022 |
December 31, 2021 |
|||
| Share capital | |||||
| Retained earnings | |||||
| Cumulative currency translation differences | |||||
| Other reserves and equity instruments: | |||||
| - Perpetual subordinated bonds | |||||
| - Legal reserve | |||||
| - Reserve for treasury shares | |||||
| - Reserve for OCI on cash flow hedging derivatives net of tax effect | ( |
) | ( |
) | |
| - Reserve for OCI on defined benefit plans net of tax effect | ( |
) | ( |
) | |
| - Reserve for OCI on equity-accounted investments | |||||
| - Reserve for OCI on other investments valued at fair value | |||||
| - Other reserves | |||||
| Treasury shares | ( |
) | ( |
) | |
| Profit for the year | |||||
Share capital
As of December 31, 2022, the parent company’s issued share capital consisted of €
On May 11, 2022, Eni’s Shareholders’ Meeting resolved: (i) to distribute a dividend of €
Retained earnings
Retained earnings included the interim dividend distribution for 2022 amounting to €
Cumulative foreign currency translation differences
The cumulative foreign currency translation differences arose from the translation of financial statements denominated in currencies other than euro.
Perpetual subordinated hybrid bonds
The hybrid bonds are governed by English law and are traded on the regulated market of the Luxembourg Stock Exchange. As of December 31, 2022, hybrid bonds amounted to €
The key characteristics of the two bonds are: (i) an issue of €
Legal reserve
This reserve represents earnings restricted from the payment of dividends pursuant to Article 2430 of the Italian Civil Code. The legal reserve has reached the maximum amount required by the Italian Law.
Reserve for treasury shares
The reserve for treasury shares represents the reserve that was established in previous reporting periods to repurchase the Company shares in accordance with resolutions at Eni’s Shareholders’ Meetings.
Reserves for Other Comprehensive Income
| Reserve for OCI on cash flow hedge derivatives | Reserve for OCI on defined benefit plans |
Reserve for OCI on equity-accounted investments(*) | Reserve for OCI on investments valued at fair value | ||||||||||||||||||||
| (€ million) | Gross reserve | Deferred tax liabilities | Net reserve | Gross reserve | Deferred tax liabilities | Net reserve | |||||||||||||||||
| Reserve as of December 31, 2021 | ( |
) | ( |
) | ( |
) | ( |
) | ( |
) | |||||||||||||
| Changes of the year | ( |
) | ( |
) | ( |
) | |||||||||||||||||
| Currency translation differences | |||||||||||||||||||||||
| Reversal to inventories adjustments | ( |
) | ( |
) | |||||||||||||||||||
| Reclassification to retained earnings | ( |
) | |||||||||||||||||||||
| Changes in scope of consolidation | |||||||||||||||||||||||
| Reclassification adjustments | ( |
) | ( |
) | |||||||||||||||||||
| Reserve as of December 31, 2022 | ( |
( |
) | ( |
) | ( |
) | ( |
) | ||||||||||||||
| Reserve as of December 31, 2020 | ( |
) | ( |
) | ( |
) | ( |
) | |||||||||||||||
| Changes of the year | ( |
) | ( |
) | ( |
) | ( |
) | |||||||||||||||
| Currency translation differences | ( |
) | ( |
) | |||||||||||||||||||
| Reversal to inventories adjustments | ( |
) | |||||||||||||||||||||
| Reclassification adjustments | ( |
) | |||||||||||||||||||||
| Reserve as of December 31, 2021 | ( |
) | ( |
) | ( |
) | ( |
) | ( |
) | |||||||||||||
(*) Reserve for OCI on equity-accounted investments at December 31, 2022 includes €
Other reserves
Other reserves related to a reserve of €
Treasury shares
A total of
Distributable reserves
As of December 31, 2022, equity attributable to Eni included distributable reserves of approximately €
Reconciliation of profit and equity of the parent company Eni SpA to the consolidated profit and equity
| Profit | Shareholders’ equity | ||||||||||
| (€ million) | 2022 | 2021 | December 31, 2022 | December 31, 2021 | |||||||
| As recorded in Eni SpA's Financial Statements | |||||||||||
| Excess of net equity stated in the separate accounts of consolidated subsidiaries over the corresponding carrying amounts of the parent company | ( |
) | ( |
) | ( |
) | |||||
| Consolidation adjustments: | |||||||||||
| - difference between purchase cost and underlying carrying amounts of net equity | |||||||||||
| - adjustments to comply with Group accounting policies | |||||||||||
| - elimination of unrealized intercompany profits | ( |
) | ( |
) | ( |
) | |||||
| - deferred taxation | ( |
) | ( |
) | ( |
) | |||||
| Non-controlling interest | ( |
) | ( |
) | ( |
) | ( |
) | |||
| As recorded in Consolidated Financial Statements | |||||||||||
27 Other information
Supplemental cash flow information
| (€ million) | 2022 | 2021 | 2020 | |||||
| Investment in consolidated subsidiaries and businesses | ||||||||
| Current assets | ||||||||
| Non-current assets | ||||||||
| Net borrowings | ( |
) | ( |
) | ( |
) | ||
| Current and non-current liabilities | ( |
) | ( |
) | ( |
) | ||
| Net effect of investments | ||||||||
| Fair value of investments held before the acquisition of control | ( |
) | ( |
) | ||||
| Non-controlling interests | ( |
) | ( |
) | ( |
) | ||
| Purchase price | ||||||||
| Cash and cash equivalents acquired | ( |
) | ( |
) | ( |
) | ||
| Consolidated subsidiaries and businesses net of cash and cash equivalent acquired | ||||||||
| Disposal of consolidated subsidiaries and businesses | ||||||||
| Current assets | ||||||||
| Non-current assets | ||||||||
| Net borrowings | ( |
) | ||||||
| Current and non-current liabilities | ( |
) | ||||||
| Net effect of disposals | ||||||||
| Current value of the stake held for business combinations | ( |
) | ||||||
| Reclassification among other items of OCI | ( |
) | ||||||
| Gain on disposal of business combinations | ||||||||
| Credits for divestments | ( |
) | ||||||
| Selling price | ||||||||
| Cash and cash equivalents sold | ( |
) | ||||||
| Consolidated subsidiaries and businesses net of cash and cash equivalent disposed of | ( |
) | ||||||
| Business combination Unión Fenosa Gas | ||||||||
| Investment in Unión Fenosa Gas sold | ||||||||
| Investments and businesses acquired | ||||||||
| Current assets | ||||||||
| Non-current assets | ||||||||
| Net borrowings | ( |
) | ||||||
| Long-term and short-term liabilities | ( |
) | ||||||
| Total investments and businesses acquired | ||||||||
| Total net disposals | ||||||||
| Cash and cash equivalents acquired | ||||||||
| Business combination Unión Fenosa Gas net of cash and cash equivalent acquired | ||||||||
| Consolidated subsidiaries and businesses net of cash and cash equivalent disposed of | ( |
) |
Investments and disposals in 2022 are disclosed in note 5 – Business Combinations and other significant transactions.
| F-82 |
Investments in 2021 concerned: (i) the acquisition of a
Disposals in 2021 related to the restructuring of the joint venture Unión Fenosa Gas SA following the agreements with the authorities of the Arab Republic of Egypt (ARE) and the Spanish partner Naturgy for the resolution of all outstanding issues of the joint venture with Egyptian partners which resulted in an overall cash adjustment for the benefit of Eni, represented in the disposals.
Investments in 2020 related to the acquisition by Eni gas e luce SpA Società Benefit (now Eni Plenitude SpA Società Benefit) of a
Business combinations and other significant transactions
The provisional and definitive price allocation of the net assets acquired in 2021 is shown below:
| (€ million) | FRI‐EL Biogas Holding (now EniBioCh4in SpA) Provisional allocation |
FRI‐EL Biogas
Holding (now EniBioCh4in SpA) Definitive allocation |
Portfolio of thirteen on-shore wind facilities Provisional allocation |
Portfolio of thirteen on-shore wind facilities Definitive allocation |
Dhamma Energy Group Provisional allocation |
Dhamma Energy Group Definitive allocation |
Portfolio of nine renewable energy projects Provisional allocation |
Portfolio of nine renewable energy projects Definitive allocation |
Be Power Provisional allocation |
Be Power Definitive allocation |
|||||||||||||||||||
| Current assets | |||||||||||||||||||||||||||||
| Property, plant and equipement | |||||||||||||||||||||||||||||
| Goodwill | |||||||||||||||||||||||||||||
| Current and non current assets | |||||||||||||||||||||||||||||
| Cash and cash equivalent (Net borrowings) |
( |
) | ( |
) | ( |
) | ( |
) | ( |
) | ( |
) | ( |
) | ( |
) | |||||||||||||
| Current and non current liabilities | ( |
) | ( |
) | ( |
) | ( |
) | ( |
) | ( |
) | ( |
) | ( |
) | ( |
) | ( |
) | |||||||||
| Net effects of investments | |||||||||||||||||||||||||||||
| Non-controlling interests | ( |
) | ( |
) | ( |
) | ( |
) | |||||||||||||||||||||
| Total purchase price |
Following the definitive allocation of the 2021 Business Combinations, financial statements were not restated taking into account the irrelevance of the changes.
| F-83 |
28 Guarantees, commitments and risks
Guarantees
| (€ million) | December 31, 2022 | December 31, 2021 | |||
| Consolidated subsidiaries | |||||
| Unconsolidated subsidiaries | |||||
| Joint ventures and associates | |||||
| Others | |||||
Guarantees issued on behalf of consolidated subsidiaries primarily consisted of: (i) autonomous guarantee contracts given to third parties relating to bid bonds and performance bonds for €
Guarantees issued on behalf of joint ventures and associates primarily consisted of: (i) autonomous guarantee contracts and other personal guarantees given to the Azule Group for €
As provided by the contract that regulates the petroleum activities in Area 4 offshore Mozambique, Eni SpA in its capacity as parent company of the operator has provided concurrently with the approval of the development plan of the reserves which are located exclusively within the concession area, an irrevocable and unconditional parent company guarantee in respect of any possible claims or any contractual breaches in connection with the petroleum activities to be carried out in the contractual area, including those activities in charge of the special purpose entities like Coral FLNG SA, to the benefit of the Government of Mozambique and third parties. The obligations of the guarantor towards the Government of Mozambique are unlimited (non-quantifiable commitments), whereas they provide a maximum liability of €
Guarantees issued on behalf of third parties consisted of: (i) a guarantee issued in favor of Gulf LNG Energy and Gulf LNG Pipeline on behalf of Angola LNG Supply Service Llc (Eni’s interest
| F-84 |
| (€ million) | December 31,2022 | December 31,2021 | |||
| Commitments | |||||
| Risks | |||||
Commitments related to: (i) parent company guarantees that were issued in connection with certain contractual commitments for hydrocarbon exploration and production activities and quantified, based on the capital expenditures to be incurred, to be €
Risks relate to potential risks associated with: (i) contractual assurances given to acquirers of certain investments and businesses of Eni for €
Other commitments and risks
A parent company guarantee was issued on behalf of Cardón IV SA (Eni’s interest
Other commitments include the agreements entered into for forestry initiatives, implemented within the low carbon strategy defined by the Company, concerning the commitments for the purchase, until 2038, of carbon credits produced and certified according to international standards by subjects specialized in forest conservation programs.
On February 5, 2021, EniServizi SpA (EniServizi) signed on behalf of Eni SpA (Eni) an addendum to the lease contract of a property to be built signed between Eni and the management company of the real estate investment fund owner of the new complex under construction in San Donato Milanese (the Property), including the postponement of the delivery date of the property from July 28, 2020 to December 31, 2021. As of December 31, 2022, the real estate complex was not yet available to Eni which, therfore, claimed penalties for late delivery of approximately €
In addition, Eni, subsequent to the divestiture of certain Eni assets, including businesses and investments, is liable for certain non-quantifiable risks related to contractual guarantees against certain contingent liabilities deriving from tax, social security contributions, environmental issues and other matters applicable to periods during which such assets were operated by Eni or as a result of the loss of control in subsidiaries. Eni believes such matters will not have a material adverse effect on Eni’s results of operations and cash flow.
| F-85 |
Risk factors
The following is the description of financial risks and their management and control. With reference to the issues related to credit risk, the parameters adopted for the determination of expected losses and the estimates of the probability of default and the loss given default have been updated to take into account the impacts associated with the conflict between Russia and Ukraine and the current energy crisis.
As of December 31, 2022, the Company retains liquidity reserves that management deems enough to meet the financial obligations due in the next
Financial risks
Financial risks are managed in respect of the guidelines issued by the Board of Directors of Eni SpA in its role of directing and setting the risk limits, targeting to align and centrally coordinate Group companies’ policies on financial risks (“Guidelines on financial risks management and control”). The “Guidelines” define for each financial risk the key components of the management and control process, such as the target of the risk management, the valuation methodology, the structure of limits, the relationship model and the hedging and mitigation instruments.
Market risk
Market risk is the possibility that changes in currency exchange rates, interest rates or commodity prices will adversely affect the value of the Group’s financial assets, liabilities or expected future cash flows. The Company actively manages market risk in accordance with a set of policies and guidelines that provide a centralized model of handling finance, treasury and risk management transactions based on the Company’s departments of operational finance: the parent company’s (Eni SpA) finance department, Eni Finance International SA and Banque Eni SA, which is subject to certain bank regulatory restrictions preventing the Group’s exposure to concentrations of credit risk, and Eni Trade & Biofuels SpA and Eni Global Energy Markets SpA that are in charge to execute certain activities relating to commodity derivatives. In particular, Eni Corporate finance department and Eni Finance International SA manage subsidiaries’ financing requirements in and outside Italy, respectively, covering funding requirements and using available surpluses. All transactions concerning currencies and derivative contracts on interest rates and currencies different from commodities of Eni are managed by Eni Corporate finance department, while Eni Trade & Biofuels SpA and Eni Global Energy Markets SpA execute the negotiation of commodity derivatives over the market. Eni SpA, Eni Trade & Biofuels SpA and Eni Global Energy Markets SpA (also through the subsidiary Eni Trading & Shipping Inc) perform trading activities in financial derivatives on external trading venues, such as European and non-European regulated markets, Multilateral Trading Facility (MTF), Organized Trading Facility (OTF), or similar and brokerage platforms (i.e. SEF), and over the counter on a bilateral basis with external counterparties. Other legal entities belonging to Eni that require financial derivatives enter into these transactions through Eni Trade & Biofuels SpA, Eni Global Energy Markets SpA and Eni SpA based on the relevant asset class expertise. Eni uses derivative financial instruments (derivatives) in order to minimize exposure to market risks related to fluctuations in exchange rates relating to those transactions denominated in a currency other than the functional currency (the euro) and interest rates, as well as to optimize exposure to commodity prices fluctuations taking into account the currency in which commodities are quoted. Eni monitors every activity in derivatives classified as risk-reducing directly or indirectly related to covered industrial assets, so as to effectively optimize the risk profile to which Eni is exposed or could be exposed. If the result of the monitoring shows those derivatives should not be considered as risk reducing, these derivatives are reclassified in proprietary trading. As proprietary trading is considered separately from the other activities in specific portfolios of Eni Trade & Biofuels SpA and Eni Global Energy Markets SpA, their exposure is subject to specific controls, both in terms of Value at Risk (VaR) and Stop Loss and in terms of nominal gross value. For Eni, the gross nominal value of proprietary trading activities is compared with the limits set by the relevant international standards. The framework defined by Eni’s policies and guidelines provides that the valuation and control of market risk is performed on the basis of maximum tolerable levels of risk exposure defined in terms of limits of Stop Loss, which expresses the maximum tolerable amount of losses associated with a certain portfolio of assets over a pre-defined time horizon; limits of revision strategy, which consist in the triggering of a revision process of the strategy in the event of exceeding the level of profit and loss given and VaR, which measures the maximum potential loss of the portfolio, given a certain confidence level and holding period, assuming adverse changes in market variables and taking into account the correlation among the different positions held in the portfolio. Eni’s finance department defines the maximum tolerable levels of risk exposure to changes in interest rates and foreign currency exchange rates in terms of VaR, pooling Group companies’ risk positions maximizing, when possible, the benefits of the netting activity. Eni’s calculation and valuation techniques for interest rate and foreign currency exchange rate risks are in accordance with banking standards, as established by the Basel Committee for bank activities surveillance. Tolerable levels of risk are based on a conservative approach, considering the industrial nature of the Company. Eni’s guidelines prescribe that Eni Group companies minimize such kinds of market risks by transferring risk exposure to the parent company finance department. Eni’s guidelines define rules to manage the commodity risk aiming at optimizing core activities and pursuing preset targets of stabilizing industrial and commercial margins. The maximum tolerable level of risk exposure is defined in terms of VaR, limits of revision strategy, Stop Loss and volumes in connection with exposure deriving from commercial activities, as well as exposure deriving from proprietary trading, exclusively managed by Eni Trade & Biofuels SpA and Eni Global Energy Markets SpA. Internal mandates to manage the commodity risk provide for a mechanism of allocation of the Group maximum tolerable risk level to each business unit. In this framework, Eni Trade & Biofuels SpA and Eni Global Energy Markets SpA, in addition to managing risk exposure associated with their own commercial activity and proprietary trading, pool the requests for negotiating commodity derivatives and execute them in the marketplace.
| F-86 |
According to the targets of financial structure included in the financial plan approved by the Board of Directors, Eni decided to retain a cash reserve to face any extraordinary requirement. Eni’s finance department, with the aim of optimizing the efficiency and ensuring maximum protection of capital, manages such reserve and its immediate liquidity within the limits assigned. The management of strategic cash is part of the asset management pursued through transactions on own risk in view of optimizing financial returns, while respecting authorized risk levels, safeguarding the Company’s assets and retaining quick access to liquidity. The four different market risks, whose management and control have been summarized above, are described below.
Market risk - Exchange rate
Exchange rate risk derives from the fact that Eni’s operations are conducted in currencies other than euro (mainly U.S. dollar). Revenues and expenses denominated in foreign currencies may be significantly affected by exchange rate fluctuations due to conversion differences on single transactions arising from the time lag existing between execution and definition of relevant contractual terms (economic risk) and conversion of foreign currency-denominated trade and financing payables and receivables (transactional risk). Exchange rate fluctuations affect the Group’s reported results and net equity as financial statements of subsidiaries denominated in currencies other than euro are translated from their functional currency into euro. Generally, an appreciation of U.S. dollar versus euro has a positive impact on Eni’s results of operations, and vice versa. Eni’s foreign exchange risk management policy is to minimize transactional exposures arising from foreign currency movements and to optimize exposures arising from commodity risk. Eni does not undertake any hedging activity for risks deriving from the translation of foreign currency denominated profits or assets and liabilities of subsidiaries, which prepare financial statements in a currency other than euro, except for single transactions to be evaluated on a case-by-case basis.
Effective management of exchange rate risk is performed within Eni’s finance departments, which pool Group companies’ positions, hedging the Group net exposure by using certain derivatives, such as currency swaps, forwards and options. Such derivatives are evaluated at fair value based on market prices provided by specialized info-providers. The VaR techniques are based on variance/covariance simulation models and are used to monitor the risk exposure arising from possible future changes in market values over a 24-hour period within a
Market risk - Interest rate
Changes in interest rates affect the market value of financial assets and liabilities of the Company and the level of finance charges.
Eni’s interest rate risk management policy is to minimize risk with the aim to achieve financial structure objectives defined and approved in management’s “Finance plan”. The Group’s central departments pool borrowing requirements of the Group companies in order to manage net positions and fund portfolio developments consistent with management plan, thereby maintaining a level of risk exposure within prescribed limits. Eni enters into interest rate derivative transactions, in particular interest rate swaps, to effectively manage the balance between fixed and floating rate debt. Such derivatives are evaluated at fair value based on market prices provided from specialized sources. VaR deriving from interest rate exposure is measured daily based on a variance/covariance model, with a
| F-87 |
Market risk - Commodity
Price risk of commodities is identified as the possibility that fluctuations in the price of materials and basic products produce significant changes in Eni’s operating margins, determining an impact on the economic result such as to compromise the targets defined in the four-year plan and in the budget. The commodity price risk arises in connection with the following exposures: (i) strategic exposure: exposures directly identified by the Board of Directors as a result of strategic investment decisions or outside the planning horizon of risk management. These exposures include, for example, exposures associated with the program for the production of Oil & Gas reserves, long-term gas supply contracts for the portion not balanced by sales contracts (already stipulated or expected), the margin deriving from the chemical transformation process, the refining margin and long-term storage functional to the logistic-industrial activities; (ii) commercial exposure: concerns the exposures related to components underlying the contractual arrangements of industrial and commercial (contracted exposure) activities normally related to the time horizon of the four-year plan and budget, components not yet under contract but which will be with reasonable certainty (commitment exposure) and the relevant activities of risk management. Commercial exposures are characterized by a systematic risk management activity conducted based on risk/return assumptions by implementing one or more strategies and subjected to specific risk limits (VaR, revision strategy limits and stop loss). In particular, the commercial exposures include exposures subjected to asset-backed hedging activities, arising from the flexibility/optionality of assets; (iii) proprietary trading exposure: transactions carried out autonomously for speculative purposes in the short term and normally not aimed at delivery with the intention of exploiting favorable price movements, spreads and/or volatility implemented autonomously and carried out regardless of the exposures of the commercial portfolio or physical and contractual assets. They are usually carried out in the short term, not necessarily aimed at the delivery and carried out by using financial or similar instruments in accordance with specific limits of authorized risk (VaR, Stop Loss). Strategic risk is not subject to systematic activity of management/coverage that is eventually carried out only in case of specific market or business conditions. Because of the extraordinary nature, hedging activities related to strategic risks are delegated to the top management, previously authorized by the Board of Directors. With prior authorization from the Board of Directors, the exposures related to strategic risk can be used in combination with other commercial exposures in order to exploit opportunities for natural compensation between the risks (natural hedge) and consequently reduce the use of financial derivatives (by activating logics of internal market). With regard to exposures of a commercial nature, Eni's risk management target is to optimize the "core" activities and preserve the economic/financial results. Eni manages the commodity risk through the trading units (Eni Trade & Biofuels SpA and Eni Global Energy Markets SpA) and the exposure to commodity prices through the Group’s finance departments by using financial derivatives traded on the regulated markets MTF, OTF and financial derivatives traded over the counter (swaps, forward, contracts for differences and options on commodities) with the underlying commodities being crude oil, gas, refined products, power or emission certificates. Such financial derivatives are valued at fair value based on market prices provided from specialized sources or, absent market prices, based on estimates provided by brokers or suitable valuation techniques. VaR deriving from commodity exposure is measured daily based on a historical simulation technique, with a
Market risk - Strategic liquidity
Market risk deriving from liquidity management is identified as the possibility that changes in prices of financial instruments (bonds, money market instruments and mutual funds) affect the value of these instruments in case of sale or when they are valued at fair value in the financial statements. The setting up and maintenance of the liquidity reserve are mainly aimed to guarantee a proper financial flexibility. Liquidity should allow Eni to fund any extraordinary need (such as difficulty in access to credit, exogenous shock, macroeconomic environment, as well as merger and acquisitions) and must be dimensioned to provide a coverage of short-term debts and of medium and long-term finance debts due within a time horizon of
The following tables show amounts in terms of VaR, recorded in 2022 (compared with 2021), relating to interest rate and exchange rate risks in the first section and commodity risk (aggregated by type of exposure). Regarding the management of strategic liquidity, the table reports the sensitivity to changes in interest rate.
| F-88 |
(Value at Risk - parametric method variance/covariance; holding period:
| 2022 | 2021 | ||||||||||||||||||||||
| (€ million) | High | Low | Average | At year end | High | Low | Average | At year end | |||||||||||||||
| Interest rate (a) | |||||||||||||||||||||||
| Exchange rate (a) | |||||||||||||||||||||||
| (a) | Value at risk deriving from interest and exchange rates exposures include the following finance departments: Eni Corporate Finance Department, Eni Finance International SA and Banque Eni SA. |
| (Value at Risk - Historic simulation method; holding period: 1 day; confidence level: |
|||||||||||||||||||||||
| 2022 | 2021 | ||||||||||||||||||||||
| (€ million) | High | Low | Average | At year end | High | Low | Average | At year end | |||||||||||||||
| Commercial exposures - Management Portfolio (a) | |||||||||||||||||||||||
| Trading (b) | |||||||||||||||||||||||
| (a) | Refers to Global Gas & LNG Portfolio business area, Power Generation & Marketing, Green\Traditional Refining & Marketing, Plenitude, Eni Trading & Biofuels, Eni Global Energy Markets (commercial portfolio). VaR is calculated on the so-called Statutory view, with a time horizon that coincides with the year considering all the volumes delivered in the year and the relevant financial hedging derivatives. Consequently, during the year the VaR pertaining to GGP, Power G&M, GTR&M and Plenitude during the year presents a decreasing trend following the progressive reaching of the maturity of the positions within the annual horizon. | |||||||||||||||||||||||
| (b) | Cross-commodity proprietary trading, through financial instruments, refers to Eni Trading & Biofuels SpA and Eni Global Energy Markets SpA (London-Bruxelles-Singapore) and Eni Trading & Shipping Inc (Houston). | |||||||||||||||||||||||
| (Sensitivity - Dollar Value of 1 basis point - DVBP) | |||||||||||||||||||||||
| 2022 | 2021 | ||||||||||||||||||||||
| (€ million) | High | Low | Average | At year end | High | Low | Average | At year end | |||||||||||||||
| Strategic liquidity - € Portfolio (a) | |||||||||||||||||||||||
| (a) | Management of strategic liquidity portfolio starting from July 2013. | |||||||||||||||||||||||
| (Sensitivity - Dollar value of 1 basis point - DVBP) | |||||||||||||||||||||||
| 2022 | 2021 | ||||||||||||||||||||||
| ($ million) | High | Low | Average | At year end | High | Low | Average | At year end | |||||||||||||||
| Strategic liquidity - US dollar Portfolio (b) | |||||||||||||||||||||||
| (a) | Management of strategic liquidity portfolio in US dollar currency starting from August 2017. | ||||||||
Credit risk
Credit risk is the potential exposure of the Group to losses in case counterparties fail to perform or pay amounts due. Eni defined credit risk management policies consistent with the nature and characteristics of the counterparties of commercial and financial transactions regarding the centralized finance model.
The Company adopted a model to quantify and control the credit risk based on the evaluation of the expected loss which represents the probability of default and the capacity to recover credits in default that is estimated through the so-called Loss Given Default.
In the credit risk management and control model, credit exposures are distinguished by commercial nature, in relation to sales contracts on commodities related to Eni’s businesses, and by financial nature, in relation to the financial instruments used by Eni, such as deposits, derivatives and securities.
Credit risk for commercial exposures
Credit risk arising from commercial counterparties is managed by the business units and by the specialized corporate finance and dedicated administration departments and is operated based on formal procedures for the assessment of commercial counterparties, the monitoring of credit exposures, credit recovery activities and disputes. At a corporate level, the general guidelines and methodologies for quantifying and controlling customer risk are defined, in particular the riskiness of commercial counterparties is assessed through an internal rating model that combines different default factors deriving from economic variables, financial indicators, payment experiences and information from specialized primary info providers. The probability of default related to State Entities or their closely related counterparties (e.g. National Oil Company), essentially represented by the probability of late payments, is determined by using the country risk premiums adopted for the purposes of the determination of the WACCs for the impairment of non-financial assets. Finally, for retail positions without specific ratings, risk is determined by distinguishing customers in homogeneous risk clusters based on historical series of data relating to payments, periodically updated.
Credit risk for financial exposures
With regard to credit risk arising from financial counterparties deriving from current and strategic use of liquidity, derivative contracts and transactions with underlying financial assets valued at fair value, Eni has established internal policies providing exposure control and concentration through maximum credit risk limits corresponding to different classes of financial counterparties defined by the Company’s Board of Directors and based on ratings provided for by primary credit rating agencies. Credit risk arising from financial counterparties is managed by the Eni’s operating finance departments, Eni Global Energy Markets SpA (EGEM), Eni Trade & Biofuels SpA (ETB) and Eni Trading & Shipping Inc (ETS Inc)specifically for commodity derivatives transactions, as well as by companies and business areas limitedly to physical transactions with financial counterparties, consistently with the Group centralized finance model. Eligible financial counterparties are closely monitored by each counterpart and by group of belonging to check exposures against the limits assigned daily and the expected loss analysis and the concentration periodically.
Liquidity risk
Liquidity risk is the risk that suitable sources of funding for the Group may not be available, or the Group is unable to sell its assets in the marketplace in order to meet short-term finance requirements and to settle obligations. Such a situation would negatively affect Group results, as it would result in the Company incurring higher borrowing expenses to meet its obligations or under the worst of conditions the inability of the Company to continue as a going concern.
Eni’s risk management targets include the maintaining of an adequate level of financial resources readily available to deal with external shocks (drastic changes in the scenario, restrictions on access to capital markets, etc.) or to ensure an adequate level of operational flexibility for the development projects of the Company. The strategic liquidity reserve is employed in short-term marketable financial assets, favoring investments with very low risk profile. At present, the Group believes to have access to more than sufficient funding to meet the current foreseeable borrowing requirements due to available cash on hand financial assets and lines of credit and the access to a wide range of funding opportunities which can be activated through the credit system and capital markets.
| F-90 |
Due to the increased volatility of commodity markets and the related higher financial commitment linked to the margin of commodity derivatives, Eni has further strengthened its financial flexibility through the activation of new financing lines.
Eni has in place a program for the issuance of Euro Medium Term Notes up to €
During 2022 Eni renegotiated and expanded its portfolio of committed credit lines through the stipulation of a sustainability-linked bond facility agreed with a pool of banks for €
Expected payments for financial debts and lease liabilities
The table below summarizes the Group main contractual obligations for finance debt and lease liability repayments, including expected payments for interest charges and liabilities for derivative financial instruments.
| Maturity year | ||||||||||||||||||||
| (€ million) | 2023 | 2024 | 2025 | 2026 | 2027 | 2028 and thereafter | Total | |||||||||||||
| December 31, 2022 | ||||||||||||||||||||
| Non-current financial liabilities (including the current portion) | ||||||||||||||||||||
| Current financial liabilities | ||||||||||||||||||||
| Lease liabilities | ||||||||||||||||||||
| Fair value of derivative instruments | ||||||||||||||||||||
| Interest on finance debt | ||||||||||||||||||||
| Interest on lease liabilities | ||||||||||||||||||||
| Financial guarantees | ||||||||||||||||||||
| Maturity year | ||||||||||||||||||||
| (€ million) | 2022 | 2023 | 2024 | 2025 | 2026 | 2027 and thereafter | Total | |||||||||||||
| December 31, 2021 | ||||||||||||||||||||
| Non-current financial liabilities (including the current portion) | ||||||||||||||||||||
| Current financial liabilities | ||||||||||||||||||||
| Lease liabilities | ||||||||||||||||||||
| Fair value of derivative instruments | ||||||||||||||||||||
| Interest on finance debt | ||||||||||||||||||||
| Interest on lease liabilities | ||||||||||||||||||||
| Financial guarantees | ||||||||||||||||||||
Liabilities for leased assets including interest charges for €
| F-91 |
Expected payments for trade and other payables
The table below presents the timing of the expenditures for trade and other payables.
| Maturity year | |||||||||||
| (€ million) | 2023 | 2024 - 2027 | 2028 and thereafter | Total | |||||||
| December 31, 2022 | |||||||||||
| Trade payables | |||||||||||
| Other payables and advances | |||||||||||
| Maturity year | |||||||||||
| (€ million) | 2022 | 2023 - 2026 | 2027 and thereafter | Total | |||||||
| December 31, 2021 | |||||||||||
| Trade payables | |||||||||||
| Other payables and advances | |||||||||||
Expected payments under contractual obligations25
In addition to lease, financial, trade and other liabilities represented in the balance sheet, the Company is subject to non-cancellable contractual obligations or obligations, the cancellation of which requires the payment of a penalty. These obligations will require cash settlements in future reporting periods. These liabilities are valued based on the net cost for the company to fulfill the contract, which consists of the lowest amount between the costs for the fulfillment of the contractual obligation and the contractual compensation/penalty in the event of non-performance.
The Company’s main contractual obligations at the balance sheet date comprise take-or-pay clauses contained in the Company’s gas supply contracts or shipping arrangements, whereby the Company obligations consist of off-taking minimum quantities of product or service or, in case of failure, paying the corresponding cash amount that entitles the Company the right to collect the product or the service in future years. The amounts due were calculated on the basis of the assumptions for gas prices and services included in the four-year industrial plan approved by the Company’s management and for subsequent years on the basis of management’s long-term assumptions.
The table below summarizes the Group principal contractual obligations for the main existing contractual obligations as of the balance sheet date, shown on an undiscounted basis. Amounts expected to be paid in 2023 for decommissioning oil & gas assets and for environmental clean-up and remediation are based on management’s estimates and do not represent financial obligations at the closing date.
| Maturity year | ||||||||||||||||||||
| (€ million) | 2023 | 2024 | 2025 | 2026 | 2027 | 2028 and thereafter | Total | |||||||||||||
| Decommissioning liabilities (a) | ||||||||||||||||||||
| Environmental liabilities | ||||||||||||||||||||
| Purchase obligations (b) | ||||||||||||||||||||
| - Gas | ||||||||||||||||||||
| . take-or-pay contracts | ||||||||||||||||||||
| . ship-or-pay contracts | ||||||||||||||||||||
| - Other purchase obligations | ||||||||||||||||||||
| Other obligations | ||||||||||||||||||||
| - Memorandum of intent - Val d’Agri | ||||||||||||||||||||
| Total | ||||||||||||||||||||
| (a) | Represents the estimated future costs for the decommissioning of oil and natural gas production facilities at the end of the producing lives of fields, well-plugging, abandonment and site restoration. | |||||||||||||||||||
| (b) | Represents any agreement to purchase goods or services that is enforceable and legally binding and that specifies all significant terms. | |||||||||||||||||||
Capital investment and capital expenditure commitments
In the next four years, Eni expects capital investments and capital expenditures of €
The amounts shown in the table below include committed expenditures to execute certain environmental projects.
| Maturity year | |||||||||||||||||
| (€ million) | 2023 | 2024 | 2025 | 2026 | 2027 and thereafter | Total | |||||||||||
| Committed projects | |
|
|
|
|
|
|||||||||||
Other information about financial instruments
| 2022 | 2021 | ||||||||||||||||
| Carrying amount | Income (expense) recognized in | Carrying amount | Income (expense) recognized in | ||||||||||||||
| (€ million) | Profit and loss account | OCI | Profit and loss account | OCI | |||||||||||||
|
Financial instruments at fair value with effects recognized in profit and loss account |
|||||||||||||||||
| Financial assets at fair value through profit or loss (a) | ( |
) | |||||||||||||||
| Non-hedging and trading derivatives (b) | ( |
) | ( |
) | |||||||||||||
| Other investments valued at fair value (c) | |||||||||||||||||
|
Receivables and payables and other assets/liabilities valued at amortized cost |
|||||||||||||||||
| Trade receivables and other (d) | ( |
) | |||||||||||||||
| Financing receivables (e) | ( |
) | |||||||||||||||
| Securities (a) | |||||||||||||||||
| Trade payables and other (a) | ( |
) | |||||||||||||||
| Financing payables (f) | ( |
) | ( |
) | |||||||||||||
| Net assets (liabilities) for hedging derivatives (g) | ( |
) | ( |
) | ( |
) | ( |
) | |||||||||
| (a) | Income or expense were recognized in the profit and loss account within "Finance income (expense)". | ||||||||||||||||
| (b) | In the profit and loss account, economic effects were recognized as loss within "Other operating income (loss)" for € |
||||||||||||||||
| (c) | Income or expense were recognized in the profit and loss account within "Income (expense) from investments - Dividends". | ||||||||||||||||
| (d) | Income or expense were recognized in the profit and loss account as net reversals within "Net (impairments) reversals of trade and other receivables" for € |
||||||||||||||||
| (e) | In the profit and loss account, income or expense were recognized as income within "Finance income (expense)", including interest income calculated on the basis of the effective interest rate of € |
||||||||||||||||
| (f) | In the profit and loss account, income or expense were recognized as expense within "Finance income (expense)", including interest expense calculated on the basis of the effective interest rate of € |
||||||||||||||||
| (g) | In the profit and loss account, income or expense were recognized within "Sales from operations" and "Purchase, services and other". | ||||||||||||||||
| F-93 |
Disclosures about the offsetting of financial instruments
| (€ million) | Gross amount of financial assets and liabilities | Gross amount of financial assets and liabilities subject to offsetting | Net amount of financial assets and liabilities | |||||
| December 31, 2022 | ||||||||
| Financial assets | ||||||||
| Trade and other receivables | ||||||||
| Other current assets | ||||||||
| Other non-current assets | ||||||||
| Financial liabilities | ||||||||
| Trade and other liabilities | ||||||||
| Other current liabilities | ||||||||
| Other non-current liabilities | ||||||||
| December 31, 2021 | ||||||||
| Financial assets | ||||||||
| Trade and other receivables | ||||||||
| Other current assets | ||||||||
| Other non-current assets | ||||||||
| Financial liabilities | ||||||||
| Trade and other liabilities | ||||||||
| Other current liabilities | ||||||||
| Other non-current liabilities |
The offsetting of financial assets and liabilities related to: (i) receivables and payables pertaining to the Exploration & Production segment towards state entities for €
Legal Proceedings
Eni is a party in a number of civil actions and administrative arbitral and other judicial proceedings arising in the ordinary course of business. Based on information available to date, taking into account the existing risk provisions disclosed in note 21 — Provisions and that in some instances it is not possible to make a reliable estimate of contingency losses, Eni believes that the foregoing will likely not have a material adverse effect on the Group Consolidated Financial Statements.
In addition to proceedings arising in the ordinary course of business referred to above, Eni is party to other proceedings, and a description of the most significant proceedings currently pending is provided in the following paragraphs. Generally, and unless otherwise indicated, these legal proceedings have not been provisioned because Eni believes a negative outcome to be unlikely or because the amount of the provision cannot be estimated reliably.
1. Environment, health and safety
1.1 Criminal proceedings in the matters of environment, health and safety
(i) Eni Rewind SpA (company incorporating EniChem Agricoltura SpA — Agricoltura SpA in liquidation — EniChem Augusta Industriale Srl — Fosfotec Srl) — Proceeding about the industrial site of Crotone. In 2010 a criminal proceeding started before the Public Prosecutor of Crotone relating to allegations of environmental disaster, poisoning of substances used in the food chain and omitted clean-up due to the activity at a landfill site which was taken over by Eni in 1991. Subsequently to Eni’s takeover, any activity for waste conferral was stopped.
The defendants are certain managers of Eni Group companies, that have managed the landfill since 1991. The Municipality of Crotone is acting as plaintiff. In March 2019, the public prosecutor requested the acquittal of all defendants. The proceeding is ongoing. Although the public prosecutor requested the acquittal of all the defendants, on January 17, 2020, the Court asked the Public Prosecutor to amend the charges in order to clarify the modalities and timing of each alleged conduct. At the preliminary hearing of July 1, 2020, the Court acquitted all the defendants, some for not having committed the alleged crime and others for expiration of the statute of limitations. The Company has decided to appeal the decision to obtain an acquittal on the merits. The decision on the appeal is pending.
(ii) Eni Rewind SpA – Crotone omitted clean-up. In April 2017, a new criminal case was opened by the Public Prosecutor of Crotone relating to reclamation activities at the Crotone site. Meanwhile, in the first half of 2018, the new clean-up project presented by the Company was deemed feasible by the Italian Ministry for the Environment. Pending the decision of the Public Prosecutor, a defense brief was filed to summarize the activity carried out by the subsidiary Eni Rewind SpA (former Syndial SpA) in terms of reclamation, pointing to willingness of executing a decisive plan of action, and to obtain the dismissal of the criminal proceedings. On March 3, 2020, the Ministerial Decree approving the POB Phase 2 was issued. The Public Prosecutor has submitted a filing request and the judge for the preliminary investigations has set a chamber hearing. By a court order of January 10, 2022, the judge of the preliminary hearing of Crotone ordered the execution of a CTU following which it was ascertained how Eni Rewind carried out the environmental activities in its own areas in compliance with the authorizations. A decision of the Public Prosecutor is awaiting following the filing of this supplementary consultancy.
(iii) Eni Rewind SpA and Versalis SpA — Porto Torres dock. In 2012, following a request of the Public Prosecutor of Sassari, an Italian court ordered presentation of evidence relating to the functioning of the hydraulic barrier of Porto Torres site (ran by Eni Rewind SpA) and its capacity to avoid the dispersion of contamination released by the site into the nearby sea. Eni Rewind and Versalis were notified that its chief executive officers and certain other managers were being investigated. The Public Prosecutor of the Municipality of Sassari requested that these individuals stand trial. The plaintiffs, the Ministry for Environment and the Sardinia Region claimed environmental damage in an amount of €
(iv) Eni Rewind SpA - The illegal landfill in Minciaredda area, Porto Torres site. The Court of Sassari, on request of the Public Prosecutor, seized the Minciaredda landfill area, near the western border of the Porto Torres site (Minciaredda area). All the indicted have been served a notice of investigation for alleged crimes of carrying out illegal waste disposal and environmental disaster. The seizure order also involved Eni Rewind pursuant to Legislative Decree No. 231/01, whereby companies are liable for the crimes committed by their employees when performing their duties. The court determined that Eni Rewind can be sued for civil liability and resolved that all defendants and the Eni subsidiary be put on trial before the Court of Sassari. Upon start of the trial, the Italian Ministry for Energy Transition (MITE) was allowed to enter the judgment as plaintiff and the Court, partially accepting the grievances of the defense, declared invalid the indictment decree against Eni Rewind as entity liable pursuant to Legislative Decree No. 231/01, returning the case to the judge, who subsequently proceeded to celebrate a new preliminary hearing. In the following hearing held on March 31, 2022, Eni Rewind was acquitted due to the inability to proceed with the action against it pursuant to Legislative Decree No. 231/01 and definitively excluded from the criminal trial.
In the context of the criminal proceedings against the managers of Eni Rewind, however, on November 13, 2022, the Court of Sassari pronounced an acquittal sentence for the non-existence of the crime of illegal waste and for not having committed the crime of environmental disaster.
Due to the effects of the acquittal, the requests for compensation made by the civil parties against the defendants and Eni Rewind were not accepted as plaintiff. Since the public prosecutor and the civil parties have filed an appeal against the first instance sentence, the judgement is still pending against the Second Instance Court.
(v) Eni Rewind SpA — The Phosphate deposit at Porto Torres site. In 2015, the Court of Sassari, accepting a request of the Public Prosecutor of Sassari, seized — as a preventive measure — the area of “Palte Fosfatiche” (phosphates deposit) located on the territory of Porto Torres site, in relation to alleged crimes of environmental disaster, carrying out of unauthorized disposal of hazardous wastes and other environmental crimes. Eni Rewind SpA is being investigated pursuant to Legislative Decree No. 231/01. In November 2019, a request for referral to trial was served on the Eni subsidiary. The preliminary hearing was held on September 9, 2020. At the outcome of the preliminary hearing, during which the municipality of Porto Torres filed a civil action, the Judge pronounced against all the defendants a sentence of no place to proceed due to the statute of limitation in relation to the crimes of unauthorized management of landfills and disposal of hazardous wastes as well as against Eni Rewind SpA in relation to the liability pursuant to Legislative Decree No. 231/01. The Judge also ordered the indictment of the defendants before the Court of Sassari in 2021, limited to the alleged crime of environmental disaster. Upon start of the trial, the MITE was allowed to enter the judgment as plaintiff. The Court, accepting the defense's objections, declared the indictment invalid and returned the case that is ongoing to the judge of the preliminary hearing of Sassari, identified as the competent judge to decide.
(vi) Raffineria di Gela SpA and Eni Mediterranea Idrocarburi SpA — Alleged environmental disaster. A criminal proceeding is pending in relation to crimes allegedly committed by the managers of the Raffineria di Gela SpA and Eni Mediterranea Idrocarburi SpA relating to environmental disaster, unauthorized waste disposal and unauthorized spill of industrial wastewater. The Gela Refinery has been prosecuted for administrative offence pursuant to Legislative Decree No. 231/01. This criminal proceeding initially regarded soil pollution allegedly caused by spills from 14 tanks of the refinery storage, which had not been provided with double bottoms, and pollution of the sea water near the coastal area adjacent to the site due to the failure of the barrier system implemented as part of the clean-up activities conducted at the site. At the closing of the preliminary investigation, the Public Prosecutor of Gela merged into this proceeding the other investigations related to the pollution that occurred at the other sites of the Gela refinery as well as hydrocarbon spills at facilities of Eni Mediterranea Idrocarburi SpA. The proceeding is still ongoing.
(vii) Val d’Agri. In March 2016, the Public Prosecutors of Potenza started a criminal investigation into alleged illegal handling of waste material produced at the Viggiano oil center (COVA), part of the Eni operated Val d’Agri oil complex. After a two-year investigation, the Prosecutors ordered the house arrest of 5 Eni employees and the seizure of certain plants functional to the production activity of the Val d’Agri complex which, consequently, was shut down. From the commencement of the investigation, Eni has carried out several technical and environmental surveys, with the support of independent experts of international standing, who found a full compliance of the plant and the industrial process with the requirements of the applicable laws, as well as with best available technologies and international best practices. The Company implemented certain corrective measures to upgrade plants which were intended to address the claims made by the Public Prosecutor about an alleged operation of blending which would have occurred during normal plant functioning. Those corrective measures were favorably reviewed by the Public Prosecutor. The Company restarted the plant in August 2016. In relation to the criminal proceeding, the Public Prosecutor’s Office requested the indictment of all the defendants for alleged illegal trafficking of waste, violation of the prohibition of mixing waste, unauthorized management of waste and other violations, and the Company for administrative offenses pursuant to Legislative Decree No. 231/01. The trial started in November 2017. At the conclusion of the preliminary hearings, the Court of Potenza, on March 10, 2021, acquitted all the defendants in relation to the allegation of false statements in an administrative deed, while in relation to the alleged administrative offenses, the Court found that there was no need to proceed due to the statute of limitations. Finally, in relation to the alleged crime of illegal trafficking of waste, the Court acquitted two former employees of the Southern District for not having committed the crime, convicted six former officials of the same District with suspension of the sentence and sentenced Eni pursuant to Legislative Decree No. 231/01 to pay a fine of €
Following the filing of the merits of the sentence by the Court, an appeal was promptly filed against all the condemnations. An analysis was carried out on the profiles of the first instance sentence, concluding, in agreement with the lawyers in charge, for the reasonable expectation in the subsequent revocation of the sentence itself; the setting of the appeal judgment is pending.
(viii) Eni SpA - Health investigation related to the COVA center. Beside the criminal proceeding for illegal trafficking of waste, the Public Prosecutor of Potenza started another investigation in relation to alleged health violations. The Public Prosecutor requested the formal opening of an investigation with respect to nine people in relation to alleged violations of the rules providing for the preparation of a Risk Assessment Document of the working conditions at the Val d’Agri Oil Center (COVA). In March 2017, following the request of the consultant of the Prosecutor, the Labor Inspectorate of Potenza issued a fine against the employers of the COVA for omitted and incomplete assessment of the chemical risks for the COVA center. In October 2017, the Prosecutor’s Office changed the criminal allegations to disaster, murder and negligent personal injury, also alleging breaches of health and safety regulations. The proceeding is ongoing.
(ix) Proceeding Val d’Agri — Tank spill. In February 2017, the Italian police department of Potenza found a stream of water contaminated by hydrocarbon traces of unknown origin, flowing inside a small shaft located outside the COVA. Eni carried out activities at the COVA aimed at determining the origin of the contamination and identified the cause in a failure of a tank (the "D" tank) outside of the COVA, that presented a risk of extension of the contamination in the downstream area of the plant. In executing these activities, Eni performed all the communications provided for by Legislative Decree No. 152/06 and started certain emergency safe-keeping operations at the areas subject to potential contamination outside the COVA. Furthermore, the characterization plan of the areas inside and outside the COVA was approved by the relevant authorities, to which the Risk Analysis document was subsequently submitted. Following this event, a criminal investigation was initiated in order to ascertain whether there had been illegal environmental disaster by the former COVA officers, the Operation Managers in charge since 2011 and the HSE Manager in charge at the time of the accident, and also against Eni in relation to the same offense pursuant to Legislative Decree No. 231/01 and of some public officials belonging to local administrations for official misconduct, false and fraudulent public statements committed in 2014 and of the crime for environmental disaster and of culpable conduct committed in February 2017. The Company has paid damages of an immaterial amount almost to all the landlords of areas close to the COVA, which were affected by a spillover. Discussions are ongoing with other claimants. The likely disbursements relating to these transactions have been provisioned. Furthermore, Eni is carrying out all the necessary remediation and safety measures.
In February 2018, Eni contested the reports presented in October and in December 2017 by the Italian Fire Department stating that it does not consider itself obliged to carry out the integration required, considering that the data acquired in the area affected by the event indicate, according to Eni’s assessments, that the loss was promptly and efficiently controlled and there were no situations of serious danger to human health and the environment. In April 2019, precautionary measures were ordered against three Eni employees at the COVA which, following an appeal, were canceled by the Third Instance Court. In September 2019, the Public Prosecutor requested one of those employees to be put on trial with expedited proceeding, accepted by the Judge for preliminary investigations. The judgment is currently pending in the preliminary stages of the hearing.
As part of the concomitant procedure against the remaining employees and Eni as the legal entity being held liable pursuant to Legislative Decree No. 231/01, the Public Prosecutor, after issuing a notice of conclusion of the preliminary investigations, made a request for indictment. At the outcome of the preliminary hearing, with reference to the imputation to Eni pursuant to Legislative Decree No. 231/01, the judge of the preliminary issued a sentence not to prosecute the Company for the events up to 2015 because the fact was not envisaged by the law as a crime to claim a legal entity liable for. With reference to the events subsequent to 2015, the judge acknowledged the nullity of the request for indictment, thus returning the documents to the Public Prosecutor.
Finally, the judge of the preliminary hearing approved to put on trial two Eni employees before the Court of Potenza, with the allegation of unnamed disaster, rejecting the request of the Public Prosecutor for qualifying the alleged crime as a new type of legal offence (environmental disaster). In the context of this proceeding, several parties filed an application to bring a civil action and, pending assessment of the requests for exclusion presented by the defense with respect to the latter, the Court issued a summons decree from Eni, as civil liability. The proceedings against natural persons, both pending in the preliminary stages of the hearing, will be combined by the Court in a single hearing process. With regards to Eni SpA as entity pursuant to Legislative Decree No. 231/01, the Public Prosecutor has issued a new notice of conclusion of the preliminary investigations.
(x) Raffineria di Gela SpA and Eni Mediterranea Idrocarburi SpA — Waste management of the landfill Camastra. In June 2018, the Public Prosecutor of Palermo (Sicily) notified Eni’s subsidiaries Raffineria di Gela SpA and Eni Mediterranea Idrocarburi SpA of a criminal proceeding relating to allegations of unlawful disposal of industrial waste resulting from the reclaiming activities of soil, which were discharged at a landfill owned by a third party. The Prosecutor charged the then chief executive officers of the two subsidiaries, and the legal entities have been charged with the liability pursuant to Legislative Decree No. 231/01. The alleged wrongdoing related to the willful falsification of the waste certification for purpose of discharging at the landfill. The charges against the CEO of the Refinery of Gela SpA and the company itself were dismissed, while a request to put on trial the CEO of Eni Mediterranea Idrocarburi SpA and the company was approved. The proceeding is in progress before the Court of Agrigento, to which the proceeding has been transferred due to territorial jurisdiction.
(xi) Versalis SpA — Preventive seizure at the Priolo Gargallo plant. In February 2019, the Court of Syracuse at the request of the Public Prosecutor of Siracusa ordered the seizure of the Priolo/Gargallo plant as part of an ongoing investigation concerning the offenses of dangerous disposal of materials and environmental pollution, by the former plant manager of Versalis, pursuant to Legislative Decree No. 231/01. The Public Prosecutor’s thesis, according to the consultants, is that the seized plants have points of emissions that do not comply with the Best Available Techniques (BAT), therefore resulting in violation of the applicable legislation. Versalis has already implemented certain plant upgrades designed to comply with measures requested by the Public Prosecutor and its consultants. Based on this, an appeal was filed against the measure of precautionary seizure of the plant, which determined the revocation of the seizure of the plants on March 26, 2019. In March 2021, a notice of conclusion of the preliminary investigations was notified, with the formulation by the Public Prosecutor of the allegations already previously stated.
(xii) Versalis SpA. Seizure of the treatment plant managed by IAS SpA- Priolo Gargallo. On 3 February 2022, Versalis was notified of a request to extend the deadline for the preliminary investigations by the Public Prosecutor of Syracuse which - in relation to the industrial waste discharge system of the Versalis plant in the Priolo treatment plant managed by IAS SpA - hypothesized the crimes of environmental disaster and violation of the legislation on discharges, against two former directors of the Versalis plant in Priolo, as well as an employee of Versalis, having then a managerial role in Priolo Servizi.
Similar disputes were hypothesized against other employees of the companies co-located at the industrial site of Priolo Gargallo as well as of IAS SpA, while the legal entities Versalis, Priolo Servizi and the other co-located companies were under investigation pursuant to Legislative Decree 231/01.
On June 15, 2022, the order for a precautionary measure and the preventive seizure decree were notified with which the Judge for Preliminary Investigations ordered the seizure of the purification plant and the company shares of IAS SpA, with the appointment of a judicial administrator of the assets subject to seizure.
With the same deed, the interdictive measure of the ban on carrying out duties in the companies involved in the investigations as well as in competing companies or in any case operating in the same production sector was also ordered against various subjects under investigation, including a former Versalis director of the Priolo plant and the former Technical Director of Priolo Servizi, for a 12-month period, subsequently revoked. In the same date, Versalis was also notified of a "Request for Delivery" issued by the Public Prosecutor's Office in relation to the implementation protocols of the organizational models as well as any relevant related documentation on the subject of Legislative Decree 231/01; Versalis promptly delivered the required documents. The company presented a technical note demonstrating that Versalis SpA's contribution to the purification plant managed by IAS was fully compliant with the regulations and in any case irrelevant with respect to the indictment.
On September 23, 2022, a request for an evidentiary hearing was notified by the Public Prosecutor of Syracuse, extended to the current Director of the Versalis plant and to the CEO of Priolo Servizi. The assignment is ongoing.
On October 31, 2022, Versalis appealed the AIA issued to IAS before the Regional Administrative Court for the part in which the provision is interpreted as imposing new and different limits on discharges with respect to those contained in the authorizations in head of the company. In the meantime, the AIA issued for the management, by IAS, of the purifier has been suspended by the Region. The judgment is still pending in the investigation stage.
(xiii) Eni SpA - Fatal accident Ancona offshore platform. On March 5, 2019, a fatal accident occurred at the Barbara F platform in the offshore of Ancona. During the unloading phase of a tank from the platform to a supply vessel, there was a sudden failure of a part of the structure on which a crane was installed, causing the death of an Eni employee who was inside the control cabin of the crane and injuries to two other workers. Two contract workers and the family of the Eni employee were all fully compensated. The Public Prosecutor of Ancona initially opened an investigation against unknown persons and ordered further technical appraisals relating to the crane. As part of the technical assessment of the incident, the Public Prosecutor resolved to put under investigation two Eni employees who were in charge of safety standards at the involved facility. Also, the Company has been put under investigation as entity liable pursuant to Legislative Decree No. 231/01, and two employees of the contractor company that owned the boat. In May 2021 the Public Prosecutor Office of Ancona issued a notice of conclusion of the preliminary investigations and, following the subsequent formulation of the request for indictment, a preliminary hearing was set. At the outcome of the preliminary hearing, the Judge ordered the indictment for all the defendants and Eni as an entity pursuant to Legislative Decree No. 231/01 before the Court of Ancona for the hearing on February 6, 2023. The proceeding is currently pending in the preliminary hearing phase.
(xiv) Raffineria di Gela SpA and Eni Rewind SpA - Groundwater pollution survey and reclamation process of the Gela site. Following complaints made by former contractors, the Public Prosecutor of Gela ordered an inspection and seizure of the area called Isola 32 within the refinery of Gela, where old and new monitored landfills are located. The proceeding concerns criminal allegations of environmental pollution, omitted clean-up, negligent personal injury and illegal waste management, as part of the execution of clean-up of soil and groundwater as well as decommissioning activities in the area currently managed by Eni Rewind SpA, also on behalf of the companies Raffineria di Gela SpA, ISAF SpA (in liquidation) and Versalis SpA with respect to the efficiency and efficacy of the barrier system. The Public Prosecutor acquired documents and evidence at the Syndial office in Gela and at the refinery of Gela, which, during the period January 1, 2017 – March 20, 2019, managed the facilities involved in cleaning up the groundwater area (TAF Syndial, site TAF-TAS and pumping wells and hydraulic barrier). Subsequently a decree was issued for the seizure of 11 piezometers of the hydraulic barrier system with contextual guarantee notice, issued by the Public Prosecutor of Gela against nine employees of the Gela Refinery and four employees of Syndial SpA. Upon conclusion of unrepeatable technical investigations and analyses both on the piezometers placed under seizure, and on the TAF and TAS plants, on October 11, 2021, a preventive seizure order was notified by the judge of the preliminary investigations of Gela, at the request of the Public Prosecutor's Office, with reference to the plants used for the remediation of the site's underground water (groundwater extraction wells and TAF treatment) managed today by Eni Rewind as well as the plant areas intended for the implementation of the groundwater remediation project. A judicial administrator was appointed to manage those facilities. Eni companies are collaborating with the Judge to continue the remediation activities and to provide a clear picture of the correctness of their actions.
The Public Prosecutor's Office of Gela also served the notice of conclusion of the preliminary investigations, challenging the suspects only with the crime of failure to clean up. At the same time, the judicial administrator in charge filed an initial technical report in which he confirms that the clean-up activities are continuing in compliance with the legislation and with a series of implementation improvements by the company in agreement with other parties in charge. The Public Prosecutor's Office also issued the summons decree and the proceeding is now pending in the hearing phase.
(xv) Eni Rewind SpA and Versalis SpA - Mantua. Environmental crime investigation. With regard to the Mantua site, the company is proceeding with all the appropriate environmental activities. In August and September 2020, the Public Prosecutor notified the conclusion of the preliminary investigations relating to several criminal proceedings. Several employees of the Eni’s subsidiaries Versalis SpA and Eni Rewind SpA as well as of the third-party company Edison SpA were notified of being under investigation. Furthermore, the above-mentioned entities were being investigated pursuant to Legislative Decree No. 231/01. The Public Prosecutor is alleging, with respect to some specific areas related to the Mantua industrial hub, the crimes of unauthorized waste management, environmental damage and pollution, omitted communication of environmental contamination and omitted clean-up. Following the filing of defense briefs addressed to the investigating authority, the case has been dismissed against some individuals and archived. The Public Prosecutor’s Office then requested the indictment of the remaining defendants. During the Preliminary Hearing, the MITE, the Province of Mantua, the Municipality of Mantua and Mincio Regional Park were allowed in the trial as plaintiffs, while the companies Eni Rewind, Versalis and Edison were instead sued as civil parties and therefore they appeared in court. The Preliminary Hearing Phase ended with the provision of GUP, which ordered the indictment of all the defendants and of the abovementioned companies, with the exception of a former employee of Versalis and of two Edison employees. The proceeding is on the trial phase.
(xvi) Eni SpA R&M Depot of Civitavecchia - Criminal proceedings for groundwater pollution. In the period in which Eni was in charge of the Civitavecchia storage hub (2008-2018), pending the approval of a characterization plan of the environmental status of the site, the Company, in coordination with public authorities, adopted measures to preserve the safety of the groundwaters and to pursue the clean-up process of the site until its disposal.
The Public Prosecutor of Civitavecchia issued a notice of conclusion of the preliminary investigations, contesting, among others, the former manager of the Eni fuel storage hub of Civitavecchia, the alleged crime of environmental pollution in relation to the mismanagement of the hydraulic barrier placed over the site aimed at putting under emergency safety the contaminated groundwater, as part of the clean-up process in progress. This circumstance would have been reported by officials of a local authority (ARPA), to whom technical feedback has been provided several times over the years. Eni is under investigation pursuant to Legislative Decree No. 231/01. The prosecutor made a request for indictment.
At the preliminary hearing a procedural defect was detected, and the documents were again sent to the Public Prosecutor's Office. Following the renewed preliminary hearing, the judge ordered the indictment of the people involved, setting the hearing for June 2023, and declared the nullity of the request for indictment for legal persons, due to lack of notification committal for trial, thus returning the documents to the Public Prosecutor for its renewal.
(xvii) Eni SpA R&M Refinery of Livorno - Criminal proceedings for accidents at work. On October 20, 2020, a notice was served at the Livorno refinery for Eni as entity subjected to preliminary investigations in the context of a criminal proceeding pending before the Public Prosecutor's Office of Livorno, in relation to an accident at work occurred in summer of 2019 at an electrical substation of the Refinery and as consequence two employees were injured. The company provided compensation to the employee who suffered the greatest consequences of the accident. The allegation is of aggravated personal injury while the Company is accused of being the entity liable pursuant to Legislative Decree No. 231/01.
The Judicial Police, delegated by the Public Prosecutor's Office, has made requests for documentary presentation in order to acquire useful elements for assessing whether the company has adopted a suitable 231 model with the related procedures and management and organization systems to prevent the alleged crime.
The Company collected and promptly provided the required documentation. In September 2021, the Public Prosecutor's Office issued a notice of conclusion of the preliminary investigations. Subsequently, the summons order was notified and the proceeding is now pending in the hearing phase.
(xviii) Eni SpA R&M Genoa Pegli depot - Criminal proceeding for crude oil spill September 2022. Following the incidental event that occurred at the Genoa Pegli depot on September 27, 2022, an event which generated the loss of crude oil from a pipeline inside the depot itself and which partly also affected areas outside the production site, the Public Prosecutor's Office of Genoa instituted criminal proceedings in which was initially ordered the seizure of part of the plant subjected to the disservice, subsequently released. On October 12, 2022, the notice of unrepeatable technical investigations was served, aimed at ascertaining the causes and dynamics of the accident. In the context of the proceeding, the crime being prosecuted is that of a culpable environmental disaster, charged against four Eni employees, while the Company is charged with an administrative offense pursuant Legislative Decree No. 231/01. The proceeding is pending in the preliminary investigation phase.
1.2 Civil and administrative proceedings in the matters of environment, health and safety
(i) Eni Rewind SpA — Versalis SpA — Eni SpA (R&M) — Augusta Harbor. The Italian Ministry for the Environment with various administrative acts required companies that were operating plants in the petrochemical site of Priolo to perform safety and environmental remediation works in the Augusta harbor. Companies involved include Eni subsidiaries Versalis, Eni Rewind and Eni’s Refining & Marketing Division. Pollution has been detected in this area primarily due to a high mercury concentration that is allegedly attributed to the industrial activity of the Priolo petrochemical site. The above-mentioned companies contested these administrative actions, objecting in particular to the nature of the remediation works decided and the methods whereby information on the pollutant’s concentration has been gathered. A number of administrative proceedings started on this matter were subsequently merged before the Regional Administrative Court. In October 2012, the Court ruled in favor of Eni’s subsidiaries against the Ministry’s requirements for the removal of the pollutants and the construction of a physical barrier. In September 2017, the Ministry served all the companies involved with a formal notice for the start of remediation and environmental restoration of the Augusta harbor within 90 days, basing its request on an alleged ascertainment of liability on the basis of the 2012 provision of Regional Administrative Court. In June 2019, the Italian Ministry for the Environment set up a permanent technical committee to review the matter of the clean-up and reclamation of the Augusta harbor. The report, recalling the warning of 2017, confirmed the thesis of the parties on the responsibility of the companies co-located for the contamination of the Rada and affirmed a breach of the aforementioned warning by the companies, also communicated to the Public Prosecutor's Office. In agreement with all the other companies involved, this report and other parallel internal technical investigations were challenged for defensive purposes. Eni’s subsidiaries proposed to the Italian Environmental Ministry to start a collaboration with other interested parties to find remediation measures based on new available environmental data collected by independent agencies, without prejudice to the need for the parties to correctly identify the legal entity responsible for the contamination detected. In the meantime, the Company requested, in full compliance with applicable environmental laws, to establish a roadmap for identifying the companies accountable for the environmental pollution and their respective shares of responsibility in order to implement a clean-up and remediation project.
In September 2020, the Company took part in the Investigation Services Conference convened by the Ministry of the Environment on the results of the technical investigations and exhibited, together with its consultants, the in-depth analyzes on the environmental state of the Rada and its observations to the report which would lead to the exclusion of any involvement of the Group companies in the contamination detected. On September 23, 2020, the company took part to a preliminary investigation with the Italian MITE and the competent bodies, and presented, together with the technical consultants in charge, important insights on the issue of the environmental state of the Augusta harbor. In January 2021, the Company, having received communication of the calling of a second environmental review of the same subject to the first scheduled for February 10, 2021, requested also to take part to this second review and to be able to view the technical documents subject to discussion.
However, in February 2021, the General Directorate for Environmental Remediation of the Ministry deemed the request unacceptable. Following a decision-making conference, in April 2021, the Ministry decided that it could intervene in the procedure aimed at identifying any reclamation and clean-up activities to be carried out in the harbor which costs are to be charged to the companies operating in the area, on the basis of questionable assumptions, such as the alleged non-compliance of those companies with the formal notice of September 7, 2017 which had ordered those companies to commence reclamation and clean-up activities. The company filed an appeal and urged the Free Consortium of Syracuse (LCCS) to start the process of identifying the responsible for the pollution, which, in June 2022, was found, postponing the investigation until the conclusion of the technical investigations on the contamination.
(ii) Eni SpA – Eni Rewind SpA – Priolo – Malformation civil lawsuits. In February 2022 Eni Rewind received two writs of summons from two citizens of Augusta, who, stating that they were born with serious malformations due to mercury spills deriving from the mercury cell chlor-alkali plant in Priolo, summoned the company before the Court of Syracuse, asking for the liability of the latter and, as a result, the sentence to pay damages quantified in a total of €
Eni Rewind filed an appearance in court filing a claim and indemnification against Edison, taking into account that the chlor-soda plant was received by Eni group as part of the Enimont transaction, therefore in a period following the alleged exposure to the mercury by the actors, which necessarily occurred between 1972 and 1975 (years of birth of the actors). The proceeding is pending.
(iii) Eni SpA – Eni Rewind SpA (former Syndial SpA) – Raffineria di Gela SpA – Claim for preventive technical inquiry and judgments on the merits. In February 2012, Eni’s subsidiaries Raffineria di Gela SpA and Eni Rewind SpA and the parent company Eni SpA (involved in this matter through the operations of the Refining & Marketing Division) were notified of a claim issued by the parents of children with birth defects in the Municipality of Gela between 1992 and 2007. The claim called for an inquiry aimed at determining any causality between the birth defects suffered by these children and any environmental pollution caused by the Gela site, quantifying the alleged damages suffered and eventually identifying the terms and conditions to settle the claim. The same issue was the subject of previous criminal proceedings, of which one closed without determining any illegal behavior on the part of Eni or its subsidiaries, while a further criminal proceeding is still pending. In December 2015, the three companies involved were sued in relation to a total of 30 cases of compensation for damages in civil proceedings. In May 2018, the Court issued a first instance judgment concerning one case. The Judge rejected the claim for damages, acknowledging the arguments of the defendant companies in relation to the absence of evidence concerning the existence of a causal link between the birth defects and the alleged industrial pollution. The judgment has been appealed by the claimants.
In June 2021 the Civil Court of Gela issued a second judgment rejecting the claim for compensation, recognizing the validity of the arguments of the defendant companies regarding the lack of evidence on the existence of a cause between the pathology and the alleged industrial pollution. The counterparties filed an appeal and a hearing was set for March 17, 2022, then postponed to April 20, 2022. The trial was postponed to October 31, 2024, for the clarification of the conclusions.
(iv) Environmental claim relating to the Municipality of Cengio. Since 2008 a brought by the Italian Ministry for the Environment and the Delegated Commissioner for Environmental Emergency in the territory of the Municipality of Cengio is pending before the Court of Genoa. Those parties summoned Eni Rewind before a Civil Court and demanded that Eni’s subsidiary compensate for the environmental damage relating to the site of Cengio. The request for environmental damage amounted to €
Between 2014 and 2021, Eni and the Ministry of the Environment tried to settle the proceeding, without however reaching a definitive agreement. The Judge restarted the proceeding with the filing, on December 30, 2021, of the definitive technical review from an appointed consultant. This review is particularly positive for Eni Rewind as it highlighted the story of the contamination, setting the baseline at 1989/1990 (date of Enimont transfer) and considering there was no subsequent deterioration. The appraisal, among other things, highlighted the Ministry's negligence towards the settlement proposals advanced by Eni and which would have brought benefits to the territory. At the hearing of February 24, 2022, following a request for filing of documentation received by the plaintiff, the judge ordered the admission of part of the documentation and withheld the case for decision, allowing the parties 60 days for the filing of final briefs and 20 days for the reply notes.
With a sentence of June 21, 2022, the Court of Genoa rejected all the plaintiffs' claims, fully accepting the defense's arguments and ordering the plaintiffs to compensate the company for the costs of the litigation. In particular, the sentence excludes that Eni Rewind can be identified as the successor of Enimont, then owner of the Cengio site.
In October 2022, the Ministry filed an appeal against the sentence. Eni Rewind will appeal the judgement.
(v) Val d’Agri - Eni / Vibac. In September 2019 a claim was brought in the Court of Potenza against Eni. The plaintiffs are 80 people, living in different municipalities of the Val d’Agri area, who are complaining of economic, non-economic, biological and moral damages, all deriving from the presence of Eni’s oil facilities in the territory. In particular, the claim refers to certain events which allegedly caused damage to the local community and the territory (such as a 2017 spill, flaring events since 2014, smelly and noisy emissions). The Judge has been asked to ascertain Eni's responsibility for causing emissions of polluting substances into the atmosphere. The plaintiffs have also requested that Eni be ordered to interrupt any polluting activity and be allowed to resume industrial activities on condition that all the necessary remediation measures be implemented to eliminate all of the alleged dangerous situations. Finally, they are asking that Eni compensate all direct and indirect property damages, current and future, to an extent that will be quantified in the course of the case. At the end of the trial phase, the Judge submitted to the parties the proposal for an extra-judicial settlement, fixing a deadline to present further proposals on the matter.
The parties did not adhere to the conciliatory proposal. During the last hearing on February 19, 2021, the Judge set the hearing for the clarification of the conclusions on June 30, 2023.
(vi) Eni SpA - Climate change. In 2017 and 2018, local government authorities and a fishing association brought in the courts of the State of California seven proceedings against Eni subsidiary Eni Oil & Gas Inc. and other companies. These proceedings claim compensation for the damages attributable to the increase in sea level and temperature, as well as to hydrogeological instability. The cases have been transferred, by request of the defendants, from the State Courts to the Federal Courts. A specific request has been filed, highlighting the lack of jurisdiction of the State Courts.
In 2019, the Federal Court referred the cases to the State Courts. The defendants then appealed to the Ninth Circuit Court of Appeals, challenging the order for postponement. All proceedings were suspended pending the appeal before the Ninth Circuit Court. On May 26, 2020, the proceedings resumed in the State Courts. On July 9, 2020, Eni Oil & Gas Inc, together with other defendants, signed a petition for rehearing “en banc” to request a review of the postponement decision by the competent 9th Circuit Court. The dispute was suspended until a decision is made on the petition for rehearing. The Court rejected the petition for rehearing en banc but, at the request of the defendants, granted a suspension of the proceedings for 120 days (until January 2021) to allow the defendants to present a petition for certiorari to the Supreme Court of the United States in order to obtain the revision of the rejection. The petition was then presented in January 2021. The Supreme Court, accepting the petition, ordered the Ninth Circuit Court to reconsider the question of jurisdiction by evaluating all the legal arguments in favor of federal jurisdiction.
In June 2021, defendants filed a motion ("Consent Motion") in the Ninth Circuit Court setting out arguments in favor of federal jurisdiction in addition to the initial defenses.
In early July 2021, Consent Motion was rejected by the Ninth Circuit Court which, in April 2022, then confirmed its previous referral order to the Court. Eni Oil & Gas Inc., together with the other defendants, therefore presented another petition for rehearing en banc to the same Ninth Circuit in May 2022, in order to request the revision of the postponement decision. In June 2022, the Ninth Circuit Court rejected the petition. The defendants therefore presented to the Ninth Circuit Court a so-called ‘Motion to Stay’, trying to suspend the referral order to state courts. With orders of June 30, 2022, and August 31, 2022, a suspension was granted until November 24, 2022, for the purpose of filing a petition for certiorari to the Supreme Court for further review of the decision, which was followed on February 14, 2023, by the filing of a further brief in support of their positions. The proceeding is ongoing.
(vii) Eni Rewind SpA / Province of Vicenza – Clean-up process for Trissino site. On May 7, 2019, the Province of Vicenza issued a warning, imposing on certain individuals and companies as MITENI SpA in bankruptcy, Mitsubishi and ICI the obligation to clean-up the Trissino site where MITENI carried out its industrial activity. Based on the analysis carried out by administrative parties, significant concentrations of substances considered highly toxic and carcinogenic were allegedly discovered in groundwater and in surface water at this site. The analysis carried out by the Province of Vicenza with the direct involvement of the Istituto Superiore di Sanità reported the presence of these substances in the blood of about 53,000 people in the area. The action of health analysis and monitoring by the institutions is expected to increase. The Province warned some individuals, including a former employee who served between 1988 and 1996 as CEO of a company that was subsequently acquired by Eni Rewind.
In an initial phase of the administrative procedure, there were no references to former company EniChem Synthesis, which Eni Rewind acquired, therefore the legal assistance and the defense strategy were concentrated supporting only the persons involved. However, Eni Rewind was called into question as the “successor” of EniChem in several appeals before the Regional Administrative Court as the majority shareholder of MITENI. In February 2020, the Province extended the proceeding also to Eni Rewind, which filed a counterclaim for having its position taken out of the procedure.
However, on October 5, 2020, the Province summoned Eni Rewind to take part in the remediation interventions on the site, including participation in technical meetings and at the conferences that would be convened by the public entities in relation to the site remediation activities.
Eni Rewind appealed to a Regional Administrative Court against the Province claims and orders. Eni Rewind is participating in these meetings, carrying out the environmental interventions and has made itself available to carry out - as part of the project approved by the territorial administrations in charge- further anti-pollution interventions on a voluntary basis and without giving any acquiescence with respect to the liability charges for the pollution by chemical agents.
2. Proceedings concerning criminal/administrative corporate responsibility
(i) Block OPL 245 — Nigeria. A first-degree judgment of acquittal was issued by a tribunal in Milan in March 2021 in a criminal case pending against certain of Eni's employees and the Company itself as entity liable as per Italian Legislative Decree No. 231/01 for alleged international corruption in connection with the acquisition in 2011 of the OPL 245 exploration block in Nigeria. The case dates back to July 2014, when the Public Prosecutor of Milan served Eni with a notice of investigation pursuant to Italian Legislative Decree No. 231/01. The proceeding was commenced following a claim filed by NGO ReCommon relating to alleged corruptive practices which, according to the Public Prosecutor, allegedly involved the Resolution Agreement made on April 29, 2011, relating to the so-called Oil Prospecting License of the offshore oilfield that was discovered in OPL 245. Eni fully cooperated with the Public Prosecutor and promptly filed the requested documentation. Furthermore, Eni voluntarily reported the matter to the US Department of Justice ("DoJ") and the US SEC. In July 2014, Eni’s Board of Statutory Auditors jointly with the Eni Watch Structure resolved to engage an independent, US-based law firm, expert in anticorruption, to conduct a forensic, independent review of the matter, upon informing the Judicial Authorities. After reviewing the matter, the US lawyers concluded that they detected no evidence of wrongdoing by Eni in relation to the 2011 transaction with the Nigerian government for the acquisition of the OPL 245 license.
In December 2016, the Public Prosecutor of Milan notified Eni of the conclusion of the preliminary investigation and requested Eni’s CEO, the Chief Development, Operations and Technology Officer and the Executive Vice President for international negotiations to stand trial, as well as Eni’s former CEO and Eni SpA, pursuant to Italian Legislative Decree No. 231/01.
Upon the notification to Eni of the conclusion of the preliminary investigation by the Public Prosecutor, the independent US-based law firm was requested to assess whether the new documentation made available from Italian prosecutors could modify the conclusions of the prior review. The US law firm was also provided with the documentation filed in the Nigerian proceeding mentioned below. The independent US law firm concluded that the reappraisal of the matter in light of the new documentation available did not alter the outcome of the prior review. In September 2019, the DoJ notified Eni that based on the information it currently possessed, the DoJ was closing its investigation of Eni in connection with OPL 245 without the filing of any charges. In December 2017, the Judge for preliminary investigation ordered the indictment of all the parties mentioned above, and other parties under investigation by the Public Prosecutor, before the Court of Milan. The request of the Federal Government of Nigeria (FGN) for admission as a civil claimant in the proceedings was granted in July 2018. The first instance trial of the Milan Prosecutor's OPL 245 charges began before the Court of Milan on June 20, 2018. Following the discussion of the parties, in response to the Milan Prosecutor’s request for conviction for all of the individuals and companies involved, at the hearing of March 17, 2021, the judge fully acquitted all the defendants, on the ground that there was no case.
In June 2021, the Second Instance Court of Milan also acquitted on the same ground certain third-party defendant unrelated to Eni who had opted for a shortened procedure and had been convicted in the first acquittal. This latter decision has become final.
On July 29, 2021, the Public Prosecutor of Milan and the plaintiff, Government of Nigeria, filed an appeal against the first-degree acquittal of March 17, 2021.
At the hearing of July 19, 2022, the Attorney General withdrew the appeal of the first instance sentence. Consequently, the acquittal due to baseless allegations has become definitive for all the defendants, individuals and legal entities. The first instance judgment has therefore become final.
On November 11, 2022, the Second Instance Court confirmed the first instance acquittal, thus rejecting the FGN’s appeal of its civil claims. On March 24, 2023, the FGN appealed the abovementioned sentence before a Third Instance Court with a view of pursuing the claim of damage compensation. Furthermore, the only pending proceeding against Eni or any of its affiliates regarding OPL 245 that remains pending is a proceeding in Nigeria which is discussed next.
On January 20, 2020, Eni's subsidiary in Nigeria (“NAE”) was notified of the beginning of a new criminal case before the Federal High Court of Abuja.
The proceeding, mainly focused on the accusations against Nigerian individuals (including the Minister of Justice in office in 2011, at the time of the disputed facts), has involved NAE and SNEPCO as co-holders of the OPL 245 license. These Nigerian individuals were accused in 2011 of illicit corruption, which NAE and SNEPCO allegedly unlawfully facilitated. The beginning of the trial, originally scheduled for the end of March 2020, was postponed as a result of the closure of judicial offices in Nigeria due to the COVID-19 emergency and resumed at the beginning of 2021. The proceeding is pending.
3. Other proceedings concerning criminal matters
(i) Eni SpA (R&M) — Criminal proceedings on fuel excise tax. A criminal proceeding is currently pending, relating to alleged evasion of excise taxes in the context of retail sales in the fuel market. In particular, the claim states that the quantity of oil products marketed by Eni was larger than the quantity subjected to the excise tax. This proceeding (No. 7320/2014 RGNR) concerns the combination of distinct investigations: (i) a first proceeding, opened by the Public Prosecutor’s Office of Frosinone involved a company (Turrizziani Petroli) purchaser of Eni’s fuel. This investigation was subsequently extended to Eni. The Company fully cooperated and provided all data and information concerning the excise tax obligations for the quantities of fuel coming from the storage sites of Gaeta, Naples and Livorno. Such proceeding referred to quantities of oil products sold by Eni, allegedly larger than the quantity subjected to the excise tax; (ii) a second proceeding concerning an investigation by the Public Prosecutor’s Office of Prato, commenced in regard to the deposit of Calenzano and relates to abduction of fuel through manipulation of the fuel dispensers, subsequently extended also to the Refinery of Stagno (Livorno); (iii) a third proceeding, opened by the Public Prosecutor’s Office of Rome, concerns alleged missing payment of excise tax on the surplus of the unloading products, as the quantity of such products was larger than he quantity reported in the supporting fiscal documents. This proceeding represents a development of the first proceeding mentioned above and substantially concerns similar facts presenting, however, some differences with regard to the nature of the alleged crimes and the responsibility.
The Public Prosecutor’s Office of Rome has alleged the existence of a criminal conspiracy aimed at habitual abduction of oil products at all of the 22 storage sites which are operated by Eni in Italy. Eni is cooperating with the Prosecutor in order to defend the correctness of its operation. In September 2014, a search was conducted at the office of the former chief of the R&M Division in Rome. The reasons for the search are the same as the above-mentioned proceeding as the ongoing investigations also relate to a period of time when the officer was in charge at Eni’s R&M Division. In March 2015, the Prosecutor of Rome ordered a search at all the storage sites of Eni’s network in Italy as part of the same proceeding. The search was intended to verify the existence of fraudulent practices aimed at tampering with measuring systems functional to the tax compliance of excise duties in relation to fuel handling at the storage sites. In September 2015, the Public Prosecutor of Rome requested a one-off technical appraisal aimed to verify the compliance of the software installed at certain metric heads previously seized with those lodged by the manufacturer at the Ministry for Economic Development. The technical appraisal verified the compliance of the software tested. The proceeding was then extended to a large number of employees and former employees of the Company. Eni has continued to provide full cooperation to the authorities.
During 2018, as part of the proceeding no. 7320/2014, the Public Prosecutor of Rome notified the conclusion of the preliminary investigations in relation to the criminal proceeding concerning the Calenzano, Pomezia, Naples, Gaeta and Ortona storage sites and the Livorno and Sannazzaro refineries. Based on the outcome of the investigations, as far as Eni is concerned, the proceeding involves former managers and directors of the logistic sites and refineries indicated above concerning alleged aggravated and continuous non-payment of excise duties, alteration and removal of seals, use and possession of false measures and weights instruments. In addition, for the Calenzano site, three employees and their manager of the storage site were accused of alleged procedural fraud.
In September 2018, Eni received, as injured party, the notification of the schedule of hearing issued by the Court of Rome, in relation to criminal association and other minor claims, against numerous persons under investigation — including over forty Eni employees — subject of a separated proceeding (No. 22066/17 RGNR), for which, in May 2017, the Public Prosecutor’s Office had requested the dismissal. At the end of the hearing in December 2018, the Judge accepted the request for dismissal for several persons under investigation, including 13 Eni employees. The Judge also initially rejected the request of indictment for criminal association relating to 28 Eni employees (including the former managers of the R&M Division). Following the preliminary hearing, a sentence not to prosecute was achieved in December 2019 for all the defendants.
During 2019, also in relation to tax pending, a definition was reached, and Eni made the payments for the higher excise duties and other taxes for which it was not possible to reconstruct the related justification.
For the main proceedings (no.7320/2014 RGNR), in 2019 a detailed preliminary hearing was held before the Judge of the preliminary hearing of Rome who, following the outcome of the discussions, ordered the indictment for all the defendants.
Since 2020, the first instance judgment has been held before the Monocratic Court of Rome for offenses relating to excise duties, forgery, and procedural fraud.
At the hearing of November 21, 2022, the Court ordered the early closure of the ongoing hearing, ascertaining the statute of limitations, requesting a ruling not to proceed with an immediate extinction of the offence. For a single position of Eni, while not renouncing the statute of limitation, the defense requested acquittal on the merits. At the hearing of January 31, 2023, the Monocratic Court of Rome issued an acquittal sentence, acknowledging the statute of limitations against all employees and former employees of Eni accused in the proceeding. At the same time, the judge ordered the release from seizure of all assets still subject to the precautionary bond for probative purposes.
(ii) Eni SpA (R&M) – Taranto Refinery - Criminal proceedings for breach of excise assessment. The proceeding relates to the alleged lack of tax assessment of an energy product moved, under excise duty suspension, from a tank of the Taranto refinery.
At the end of the preliminary investigation phase, the former manager of the refinery and three other employees resulted under investigation for an alleged continued hypothesis of subtraction from the assessment of excise duties, due to multiple movements that took place in the period from June 30 to September 9, 2021, from the tank under investigation, the meter of which has been seized since October 13, 2021. The proceeding is in ongoing.
(iii) Eni SpA — Public Prosecutor of Milan — Criminal proceeding no. 12333/2017. In February 2018, Eni was notified of a search and seizure decree in relation to allegations of associative crime aimed at slander and at reporting false information to a Public Prosecutor. In the decree, the Prosecutor of Milan included, among the other persons under investigation, a former external lawyer and a former Eni manager, at the time of the facts holding a strategic position with the Company. According to the decree, the association was allegedly aimed at interfering with the judicial activity in certain criminal proceedings involving, among others, Eni and some of its directors and managers. Eni's Control and Risks Committee, having consulted the Board of Statutory Auditors, and together with the Watch Structure, agreed to engage an auditing firm to perform an internal audit of relevant facts and circumstances and records and documentation relating to the matter with respect to the events of the aforementioned proceeding, including a forensic review. The final report, submitted to the Control and Risks Committee, the Watch Structure and the Board of Statutory Auditors on September 12, 2018, concluded that following the review carried out with respect to the allegations made by the Public Prosecutor of Milan, there was not sufficient factual evidence to prove the involvement of the aforementioned former manager of Eni in the alleged crimes. On April 19, 2018, the Board of Directors appointed two external consultants, a criminal lawyer and a civil lawyer to provide independent legal advice in relation to the facts under investigation. Their report, dated November 22, 2018, did not find facts that could suggest any involvement of any Eni employees in the crimes alleged by the Public Prosecutor. On June 4, 2018, Consob, the Italian markets regulator, requested to be informed about the above-mentioned proceeding. The request was addressed to the Company and to its Board of Statutory Auditors.
Specifically, Consob asked about the outcome of the forensic review and to be updated about any other audit action taken in relation to the matter by the Company and by its Board of Statutory Auditors. The Board of Statutory Auditors was also requested to report about the findings of the additional audit program agreed with an external auditor regarding the matter and to keep Consob updated about any further initiatives adopted. The Company answered the request on June 11, 2018. Subsequently, the Company finalized its response by sending further documentation including the final report of the independent third party and the reports of the consultants of the Board of Directors. The Board of Statutory Auditors has periodically updated Consob on the initiatives taken as part of the Board’s monitoring responsibilities with several communications, the last of which was on July 25, 2018. On June 13, 2018, Eni was notified of a request from the Prosecutor’s Office to transmit certain documentation in accordance with the Italian Code of Criminal Procedure. The request targeted evidence and documents relating to the internal audit performed by the Company and any possible external review concerning certain tasks that had been assigned to the former external lawyer with respect to Eni. This lawyer appears to be under investigation as part of this proceeding. The reports of the independent third party and of the consultant of the Board of Directors were also sent to the Public Prosecutor.
In May and June 2019, in the context of the same proceeding, the Court of Milan notified Eni and three of its subsidiaries (ETS SpA, Versalis SpA, Ecofuel SpA) of various requests for documentation in accordance with the Italian Code of Criminal Procedure. At the same time, on May 23, 2019, Eni was served a notice that the Company was being investigated for administrative offences pursuant to Legislative Decree No. 231/01, with reference to the crime sanctioned by the Italian Penal Code concerning “inducement not to make statements or to make false statements to the judicial authority”.
The object of the aforementioned requests particularly concerned the relations with two business partners, access to Eni offices of certain third parties, also on behalf of one of the above-mentioned business partners, the mailbox of some employees and former employees, the documentation concerning the relations (and the interruption of those relations) with the former external lawyer investigated in the proceeding, the internal audit reports and the reports of the Company’s bodies that dealt with assessing these relationships. Following internal audits, on June 21, 2019, the Company sued for fraud a former employee at its subsidiary ETS, who was fired on May 28, 2019, and also filed a complaint before the Judicial Authority to ascertain possible complicity in fraud of other third parties. On August 14, 2019, the Italian tax police sent a new request for information to Eni, concerning the economic relations between Eni Group companies and an external professional.
In November 2019, Eni received a notice of extension of the preliminary investigations. The notice also covered the investigations of the alleged breach by Eni of certain provisions of Legislative Decree No. 231/01 until May 2020. Furthermore, certain former Eni employees have been charged with various criminal allegations. Those employees were a former manager of Eni’s legal department, the former Chief Upstream Officer of Eni and an employee that was fired in 2013. A number of third parties have also been indicted, among them, two former legal consultants of Eni. On January 23, 2020, a search decree and an indictment were notified to the Company’s Chief Services & Stakeholder Relations Officer, the Senior Vice President for Security and a manager of the legal department. Following the requests for review of the aforementioned decree, the material deposited by the Public Prosecutor's Office was made available to the Company, which requested its examination by the same consultants appointed in 2018 to examine the documentation. Subsequently, in June, July and September 2020, Eni was notified by the Public Prosecutor of Milan of several requests for documentation concerning, in particular: the results of the inquiries carried out by the internal audit department following an anonymous report relating to a hospitality event in 2017; some clarifications regarding an invoice issued by an external law firm; the internal audit report on relations with a commercial third party; work commitments of the Chief Services & Stakeholder Relations Officer relating to certain dates of 2014 and 2016; and the documentation concerning the dismissal of a former Eni employee. All the required documentation has been produced over time to the Judicial Authority.
On November 9, 2020, the Company was informed that Eni's CEO was notified about his right to participate, through its technical consultant, in the scheduled technical review of the content of a telephone device seized from a former Eni employee. In relation to what was previously requested by the Judicial Authorities in July 2020 and to supplement the already produced information, in the period January - March 2021 all the additional documentation concerning an ongoing dispute with a commercial counterpart was delivered over time.
On December 10, 2021, a notice of conclusion of the preliminary investigations was sent against twelve individuals and five companies. A former Eni executive fired in 2013 and a former external Eni lawyer are accused of having slandered the Chief Executive Officer and the Human Capital Director & Procurement Coordination of Eni. The Chief Executive Officer, the Human Capital Director & Procurement Coordination, the Senior Vice President for Security and Eni SpA itself, however, do not appear in the request for indictment. The Eni subsidiary ETS SpA (ETS) has been charged as entity liable in connection with the crime of inducement at omitting to provide information and/or rendering misleading information to the judicial authority, for which also the former top manager is being investigated. ETS has already been placed in voluntary liquidation with a resolution of Eni's Board of Directors of July 2020 which became effective on January 1, 2021.
With respect to the Public Prosecutor’s allegations against ETS SpA (ETS) of administrative responsibility pursuant to Legislative Decree No. 231/01, ETS and the Public Prosecutor negotiated a settlement of a penalty and a hearing was set for October 2022 for the assessment of the settlement terms.
As a result of the delayed discovery of further investigative documents, not known at the time of the request for a settlement, ETS' counsel filed an application for revocation of the settlement, in view of the hearing. At the hearing of October 5, 2022, the Judge consequently rejected the plea deal.
On June 30, 2022, the Public Prosecutor requested the excerpted dismissal of the proceeding, in favor of the Chief Executive Officer, the Human Capital Director & Procurement Coordination, the Senior Vice President for Security and the legal entity Eni SpA, the latter for its alleged liability of legal entities in relation to the crimes committed by employees as per Legislative Decree 231/01. The Public Prosecutor's confirmed the non-involvement of the above-mentioned individuals and entities in the disputes as already stated in the notice of conclusions of the investigations of December 2021. A request of dismissal was also filed in relation to the allegations of corruption between private parties relating to Eni representatives and to some external lawyers who had been registered following Piero Amara's statements.
Subsequently the proceeding was transferred to the Public Prosecutor's Office of Brescia following the decision of the General Prosecutor at the Third Instance Court on the basis of the request presented by certain suspects' defense counsel. The Public Prosecutor of Brescia, having received the documents, ordered the dismissal of allegations of slander and defamation and sent the proceeding back to the Milan Public Prosecutor for jurisdiction about the remaining allegations. The Public Prosecutor's Office requested the dismissal in favor of the Chief Executive Officer, the Human Capital Director & Procurement Coordination and the Senior Vice President for Security and also requested the dismissal of the Company, ordering the other plaintiffs to stand trial.
The dismissal decree of Eni SpA defined that the alleged inducement to make false statements by Vincenzo Armanna in the context of the criminal proceeding "OPL 245" was based solely on personal statements (Mr. Amara, Mr. Armanna and Mr. Calafiore) who lacked independence and whose statements had been proved to be groundless. Therefore, their statements were found to be false, leading to the indictment of the aforementioned natural persons due to the statements made against the Chief Executive Officer and the Human Capital Director & Procurement Coordination of the Company.
4. Tax proceedings
(i) Dispute for omitted payment of a property tax for some oil offshore platforms located in territorial waters. Tax disputes are pending with some Italian local authorities regarding whether oil&gas offshore platforms located within territorial boundaries should be subject to a property tax in the period 2016-2019.
In 2016 the tax regulatory framework changed due to enactment of law no. 208/2015, which excluded from the scope of the property tax the value of plants instrumental to specific production processes. In addition, the Finance Department recognized that offshore platforms met the requirements for classification as instrumental plants and consequently are excluded from the scope of the property tax (resolution no. 3 of June 1, 2016). Based on this interpretation, Eni did not pay any property tax for the years 2016-2019. However, the ruling of the Department of Finance is not binding for local authorities with taxing powers as recognized by the Third Instance Court and some of these have issued assessment notices for 2016-2019. The Company filed an appeal against these notices. Although Eni believes that oil platforms located in the territorial sea should be excluded from the tax base of the property tax on the base of the interpretation of the law in the light of the resolution of the Department of Finance, having assessed the risks of losing in pending disputes, the Company accrued a risk provision, the amount of which excludes fines since Eni's conduct was based on the administrative resolution, as well as taking into account the reduction of the tax base excluding the "plant component" as provided by the law. The proceeding is still ongoing.
Law Decree 124/19 (enacted with Law 157/19) has established, starting from 2020, that marine platforms are subject to a new property tax that will replace and supersede any other ordinary local property tax eventually levied on these plants up to 2019. This rule has therefore sanctioned, starting from 2020, the existence of the tax requirement for these plants.
5. Settled proceedings
(i) Congo. The proceeding concerned investigations by the Public Prosecutor's of Milan into alleged crimes of international corruption in relation to Eni's oil activities in Congo, with reference to the contracts awarded in the years 2013-2015. The proceeding involved some former Eni employees. The Company was investigated pursuant to Legislative Decree no.231/01. As part of the proceedings, the prosecution had also made a request for restrictive measures relating to the activities covered by oil contracts under investigation. Following the reclassification of the hypothesis of international corruption into the statute of undue induction to give or promise benefits, in 2021 Eni approved a settlement amounting to €
In March 2023, following the dismissal request presented by the Public Prosecutor's Office, the GUP ordered the dismissal of the proceedings for all natural persons under investigation. The dismissal concerned both the hypothesis of undue induction to give or promise benefits, which had concerned, among others, the former Chief Development, Operations & Technology Officer of Eni; and the hypothesis of omitted declaration of a conflict of interest. The Judge excluded any evidence of a potential interest of the CEO with reference to the commercial transactions between (not Eni SpA but) the subsidiaries of Eni SpA and the third-party supplier, since the CEO is not in any position of conflict of interests which could give rise to the obligation to report at the time he assumed the position of Chief Executive Officer of Eni in May 2014.
(ii) Eni Rewind SpA — Proceeding relating to the asbestos at the Ravenna site. A criminal proceeding is pending before the Tribunal of Ravenna relating to the crimes of culpable manslaughter, injuries and environmental disaster, which have been allegedly committed by former Eni Rewind employees at the site of Ravenna. The site was acquired by Eni Rewind following a number of corporate mergers and acquisitions. The alleged crimes date back to 1991. In the proceeding there are 75 alleged victims. The plaintiffs include relatives of the alleged victims, various local administrations, and other institutional bodies, including local trade unions. Eni Rewind asserted the statute of limitations as a defense to the instance of environmental disaster for certain instances of diseases and deaths. The court at Ravenna decided that all defendants would stand trial and held that the statute of limitations only applied with reference to certain instances of crime of culpable injury. Eni Rewind reached some settlements. In November 2016, the Judge acquitted the defendants in all the contested cases except for one, an asbestos case, for which a conviction was handed down. The defendants, the Prosecutor and the plaintiffs appealed the decision; the second instance judge ordered a complex inquiry. Eni’s defenders recused a member of the expert panel who conducted the inquiry, and the Second Instance Court rejected the request for recusal with an order subsequently canceled by the Third Instance Court. On the referral, at the request of Eni’s lawyers, the Court of Appeals of Bologna, given the different composition of the judging panel, ordered the renewal of the appeal trial and, consequently, the subsequent revocation of the order with which it had initially ordered the inquiry. On May 25, 2020, the Court acquitted the defendants and the persons sued for damages in relation to 74 cases of mesothelioma, lung cancer, pleural plaques and asbestosis, took note of the res judicata with regards to the acquittal for the disaster complaint while confirming the conviction for one case of asbestosis. The Court also declared inadmissible the appeal of several claimants. The Company filed an appeal with the Third Instance Court against the conviction for asbestosis; some claimants challenged the acquittal for the other pathologies.
On November 24, 2021, the Third Instance Court: (i) annulled, without postponement, the contested sentence against a defendant for extinction of the crime; (ii) annulled without referral to the criminal effects the sentence contested for the crime of negligent injury in relation to the case of asbestosis because it fell under statute of limitations, rejecting the appeals of Eni’s lawyers for civil purposes; (iii) rejected the appeals of the civil parties. Therefore, the criminal proceeding is closed. At the moment there is no information on the activation of any civil disputes.
(iii) Versalis SpA– Brindisi - criminal proceedings on plant factory flares and odor emissions. On May 18, 2018, the manager of the Versalis plant in Brindisi and two other employees were summoned in order to provide information regarding two episodes that occurred in April 2018 which led to the activation of the plant torches. The company cooperated with the judicial authorities to provide information and exclude that such events had a negative impact on air quality.
At the end of May 2020, in conjunction with a scheduled shutdown of the plant, anomalous concentrations of benzene and toluene were detected; on that basis, the mayor of Brindisi ordered the plant shutdown. From these events, a criminal case was instituted, as a result of which the two pro-tempore directors of the plant and the Operations manager for the crimes referred to the disposal of hazardous wastes.
On May 19, 2022, the judge, in acceptance of the request made by the Public Prosecutor's Office, ordered the dismissal of the proceeding, highlighting that the lighting of torches that took place starting from 2018 were due to disservices or momentary failures, again in compliance with the AIA requirements and specifying that the consultants' assessments did not reveal any violations of the constraints imposed by the legislation in force.
Assets under concession arrangements
Eni operates under concession arrangements mainly in the Exploration & Production segment and the Refining & Marketing business line. In the Exploration & Production segment, contractual clauses governing mineral concessions, licenses and exploration permits regulate the access of Eni to hydrocarbon reserves. Such clauses can differ in each country. In particular, mineral concessions, licenses and permits are granted by the legal owners and, generally, entered into with government entities, State oil companies and, in some legal contexts, private owners. Pursuant to the assignment of mineral concessions, Eni sustains all the operational risks and costs related to the exploration and development activities and it is entitled to the productions realized. In respect of the mining concessions received, Eni pays royalties in accordance with the tax legislation in force in the country and is required to pay the income taxes deriving from the exploitation of the concession. In production sharing agreement and service contracts, realized productions are defined based on contractual agreements with State oil companies, which hold the concessions. Such contractual agreements regulate the recovery of costs incurred for the exploration, development and operating activities (Cost Oil) and give entitlement to the own portion of the realized productions (Profit Oil). In the Refining & Marketing business line, several service stations and other auxiliary assets of the distribution service are located in the motorway areas and they are granted by the motorway concession operators following a public tender for the sub-concession of the supplying of oil products distribution service and other auxiliary services. In exchange for the granting of the services described above, Eni provides to the motorway companies fixed and variable royalties based on quantities sold. At the end of the concession period, all non-removable assets are transferred to the grantor of the concession for no consideration.
Environmental regulations
In the future, Eni will sustain significant expenses in relation to compliance with environmental, health and safety laws and regulations and for reclaiming, safety and remediation works of areas previously used for industrial production and dismantled sites. In particular, regarding the environmental risk, management does not currently expect any material adverse effect upon Eni’s Consolidated Financial Statements, taking account of ongoing remediation actions, existing insurance policies and the environmental risk provision accrued in the Consolidated Financial Statements. However, management believes that it is possible that Eni may incur material losses and liabilities in future years in connection with environmental matters due to: (i) the possibility of as yet unknown contamination; (ii) the results of ongoing surveys and other possible effects of statements required by Legislative Decree 152/2006; (iii) new developments in environmental regulation (i.e. Law No. 68/2015 on crimes against the environment and European Directive 2015/2193 on medium combustion plants); (iv) the effect of possible technological changes relating to future remediation; and (v) the possibility of litigation and the difficulty of determining Eni’s liability, if any, as against other potentially responsible parties with respect to such litigation and the possible insurance recoveries.
Emission trading
From 2021, the fourth phase of the European Union Emissions Trading Scheme (EU-ETS) came in force. The award of free emission allowances is performed based on emission benchmarks defined at European level specific to each industrial segment, except for the electric power generation sector that is not eligible for allocations for no consideration. This regulatory scheme implies for Eni’s plants subject to emission trading a lower assignment of emission permits compared to the emissions recorded in the relevant year and, consequently, the necessity of covering the amounts in excess by purchasing the relevant emission allowances on the open market. In 2022, the emissions of carbon dioxide from Eni’s plants were higher than the free allowances assigned to Eni. Against emissions of carbon dioxide amounting to approximately
29 Revenues and other income
Sales from operations
| (€ million) | Exploration & Production |
Global Gas & LNG Portfolio | Refining & Marketing and Chemical | Plenitude & Power | Corporate and Other activities | Total | |||||||||||
| 2022 | |||||||||||||||||
| Sales from operations | |||||||||||||||||
| Products sales and service revenues | |||||||||||||||||
| Sales of crude oil | |||||||||||||||||
| Sales of oil products | |||||||||||||||||
| Sales of natural gas and LNG | |||||||||||||||||
| Sales of petrochemical products | |||||||||||||||||
| Sales of power | |||||||||||||||||
| Sales of other products | |||||||||||||||||
| Services | |||||||||||||||||
| Products sales and service revenues | |||||||||||||||||
| Transfer of goods/services | |||||||||||||||||
| Goods/Services transferred in a specific moment | |||||||||||||||||
| Goods/Services transferred over a period of time | |||||||||||||||||
| 2021 | |||||||||||||||||
| Sales from operations | |||||||||||||||||
| Products sales and service revenues | |||||||||||||||||
| Sales of crude oil | |||||||||||||||||
| Sales of oil products | |||||||||||||||||
| Sales of natural gas and LNG | |||||||||||||||||
| Sales of petrochemical products | |||||||||||||||||
| Sales of power | |||||||||||||||||
| Sales of other products | |||||||||||||||||
| Services | |||||||||||||||||
| Transfer of goods/services | |||||||||||||||||
| Goods/Services transferred in a specific moment | |||||||||||||||||
| Goods/Services transferred over a period of time | |||||||||||||||||
| 2020 | |||||||||||||||||
| Sales from operations | |||||||||||||||||
| Products sales and service revenues | |||||||||||||||||
| Sales of crude oil | |||||||||||||||||
| Sales of oil products | |||||||||||||||||
| Sales of natural gas and LNG | |||||||||||||||||
| Sales of petrochemical products | |||||||||||||||||
| Sales of power |
|||||||||||||||||
| Sales of other products | ( |
) | |||||||||||||||
| Services | |||||||||||||||||
| Transfer of goods/services | |||||||||||||||||
| Goods/Services transferred in a specific moment | |||||||||||||||||
| Goods/Services transferred over a period of time |
| (€ million) | 2022 | 2021 | 2020 | |||||
| Revenues associated with contract liabilities at the beginning of the period | ||||||||
| Revenues associated with performance obligations totally or partially satisfied in previous years |
Sales from operations by industry segment and geographical area of destination are disclosed in note 35 – Segment information and information by geographical area.
Sales from operations with related parties are disclosed in note 36 – Transactions with related parties.
Other income and revenues
| (€ million) | 2022 | 2021 | 2020 | |||||
| Gains from sale of assets and businesses | ||||||||
| Other proceeds | ||||||||
Other proceeds include €
Other income and revenues with related parties are disclosed in note 36 – Transactions with related parties.
30 Costs
Purchase, services and other charges
| (€ million) | 2022 | 2021 | 2020 | ||||||
| Production costs - raw, ancillary and consumable materials and goods | |||||||||
| Production costs - services | |||||||||
| Lease expense and other | |||||||||
| Net provisions for contingencies | |||||||||
| Other expenses | |||||||||
| less: | |||||||||
| - capitalized direct costs associated with self-constructed assets - tangible assets | ( |
) | ( |
) | ( |
) | |||
| - capitalized direct costs associated with self-constructed assets - intangible assets | ( |
) | ( |
) | ( |
) | |||
Purchase, services and other charges included prospecting costs, geological and geophysical studies of exploration activities for €
Costs incurred in connection with research and development activities expensed through profit and loss, as they did not meet the requirements to be recognized as long-lived assets, amounted to €
Royalties on the extraction rights of hydrocarbons amounted to €
Additions to provisions net of reversal of unused provisions related to net additions for environmental liabilities amounting to €
Information about leases is disclosed in note 13 – Right-of-use assets and lease liabilities.
Payroll and related costs
| (€ million) | 2022 | 2021 | 2020 | ||||||
| Wages and salaries | |||||||||
| Social security contributions | |||||||||
| Cost related to employee benefit plans | |||||||||
| Other costs | |||||||||
| less: | |||||||||
| - capitalized direct costs associated with self-constructed assets - tangible assets | ( |
) | ( |
) | ( |
) | |||
| - capitalized direct costs associated with self-constructed assets - intangible assets | ( |
) | ( |
) | ( |
) | |||
Other costs comprised provisions for redundancy incentives of €
Cost related to employee benefit plans are described in note 22 – Provisions for employee benefits.
Costs with related parties are disclosed in note 36 – Transactions with related parties.
Average number of employees
The Group average number and breakdown of employees by category is reported below:
| 2022 | 2021 | 2020 |
||||||||||||||||
| (number) | Subsidiaries | Joint operations | Subsidiaries | Joint operations | Subsidiaries | Joint operations | ||||||||||||
| Senior managers | ||||||||||||||||||
| Junior managers | ||||||||||||||||||
| Employees | ||||||||||||||||||
| Workers | ||||||||||||||||||
The average number of employees was calculated as the average between the number of employees at the beginning and the end of the period. The average number of senior managers included managers employed in foreign countries, whose position is comparable to a senior manager’s status.
Long-term monetary incentive plan for the managers of Eni
On April 13, 2017 and on May 13, 2020, the Shareholders Meeting approved the Long-Term Monetary Incentive Plan 2017-2019 and 2020-2022 and empowered the Board of Directors to execute the Plan by authorizing it to dispose up to a maximum of
The Long-Term Monetary Incentive plans provide for
With reference to the 2017-2019 Plan, the number of shares that will be granted at the end of the vesting period will depend: (i) for
26 The Peer Group consists of the following oil companies: Apache, bp, Chevron, ConocoPhillips, Equinor, ExxonMobil, Marathon Oil, Occidental, Royal Dutch Shell and Total.
27 The performance condition connected with the TSR in accordance with the international accounting standards represents a so-called market
With reference to the 2020-2022 Plan, the number of shares that will be granted at the end of the vesting period will depend on the aiming of the following objectives defined over a three-year performance period, as follows: (i) for
Depending on the performance of the parameters mentioned above, the number of shares that will vest free of charge after three years may range between
The number of shares awarded at the grant date was: (i)
The estimation of the fair value was calculated by adopting specific valuation techniques regarding the different performance parameters provided by the plan (the stochastic method for the component related to the TSR and the Black-Scholes model for the component related to the NPV of the reserves, for the 2017-2019 Plan; the stochastic method for the 2020-2022 Plan), taking into account the fair value of the Eni share at the grant date (between €
In 2022, the costs related to the long-term monetary incentive plan, recognized as a component of the payroll cost, amounted to €
Compensation, including contributions and collateral expenses, of personnel holding key positions in planning, directing and controlling the Eni Group subsidiaries, including executive and non-executive officers, general managers and managers with strategic responsibilities in office during the year consisted of the following:
| (€ million) | 2022 | 2021 | 2020 | ||||||
| Wages and salaries | |||||||||
| Post-employment benefits | |||||||||
| Other long-term benefits | |||||||||
| Indemnities upon termination of employment | |||||||||
Compensation of Directors and Statutory Auditors of Eni SpA
Compensation of Directors amounted to €
Compensation included emoluments and social security benefits due for the office as Director or Statutory Auditor held at the parent company Eni SpA or other Group subsidiaries, which was recognized as a cost to the Group, even if not subject to personal income tax.
31 Finance income (expense)
| (€ million) | 2022 | 2021 | 2020 | ||||||
| Finance income | |||||||||
| Finance expense | ( |
) | ( |
) | ( |
) | |||
| Net finance income (expense) from financial assets at fair value through profit or loss | ( |
) | |||||||
| Income (expense) from derivative financial instruments | ( |
) | |||||||
| Finance income (expense) | ( |
) | ( |
) | ( |
) |
The analysis of finance income (expense) was as follows:
| (€ million) | 2022 | 2021 | 2020 | ||||||
| Finance income (expense) related to net borrowings | |||||||||
| Interest and other finance expense on ordinary bonds | ( |
) | ( |
) | ( |
) | |||
| Net finance income (expense) on financial assets held for trading | ( |
) | |||||||
| Net expenses on other financial assets valued at fair value with effects on profit and loss | ( |
) | |||||||
| Interest and other expense due to banks and other financial institutions | ( |
) | ( |
) | ( |
) | |||
| Interest on lease liabilities | ( |
) | ( |
) | ( |
) | |||
| Interest from banks | |||||||||
| Interest and other income on financial receivables and securities held for non-operating purposes | |||||||||
| ( |
) | ( |
) | ( |
) | ||||
| Exchange differences | ( |
) | |||||||
| Income (expense) from derivative financial instruments | ( |
) | |||||||
| Other finance income (expense) | |||||||||
| Interest and other income on financing receivables and securities held for operating purposes | |||||||||
| Capitalized finance expense | |||||||||
| Finance expense due to the passage of time (accretion discount) (a) | ( |
) | ( |
) | ( |
) | |||
| Other finance income (expense) | ( |
) | ( |
) | ( |
) | |||
| ( |
) | ( |
) | ( |
) | ||||
| ( |
) | ( |
) | ( |
) |
(a) The item related to the increase in provisions for contingencies that are show n at present value in non-current liabilities.
Information about leases is disclosed in note 13 – Right-of-use assets and lease liabilities.
The analysis of derivative financial income (expense) is disclosed in note 24 – Derivative financial instruments and hedge accounting.
Finance income (expense) with related parties are disclosed in note 36 – Transactions with related parties.
32 Income (expense) from investments
Share of profit (loss) of equity-accounted investments
More information is provided in note 16 – Investments.
Share of profit or loss of equity accounted investments by industry segment is disclosed in note 35 – Segment information and information by geographical area.
Other gain (loss) from investments
| (€ million) | 2022 | 2021 | 2020 | ||||||
| Dividends | |||||||||
| Net gain (loss) on disposals | |||||||||
| Other net income (expense) | ( |
) | ( |
) | |||||
Dividend income primarily related to Nigeria LNG Ltd for €
Gains on disposals referred for €
Other net income refers for €
33 Income taxes
| (€ million) | 2022 | 2021 | 2020 | ||||||
| Current taxes: | |||||||||
| - Italian subsidiaries | |||||||||
| - subsidiaries of the Exploration & Production segment - outside Italy | |||||||||
| - other subsidiaries - outside Italy | |||||||||
| Net deferred taxes: | |||||||||
| - Italian subsidiaries | ( |
) | ( |
) | |||||
| - subsidiaries of the Exploration & Production segment - outside Italy | |||||||||
| - other subsidiaries - outside Italy | ( |
) | |||||||
| ( |
) | ||||||||
Current income taxes payable by Italian subsidiaries include foreign taxes for €
Income taxes included an extraordinary solidarity tax for the year 2022 (€
The reconciliation between the statutory tax charge calculated by applying the Italian statutory tax rate of
| (€ million) | 2022 | 2021 | 2020 | ||||||
| Profit (loss) before taxation | ( |
) | |||||||
| Tax rate (IRES) (%) | |||||||||
| Statutory corporation tax charge (credit) on profit or loss | ( |
) | |||||||
| Increase (decrease) resulting from: | |||||||||
| - higher tax charges related to subsidiaries outside Italy | |||||||||
| - extraordinary contributions for Italian companies in energy sector | |||||||||
| - impact pursuant to foreign tax effects of italian entities | |||||||||
| - effect of the valuation of the investments under the equity method | |||||||||
| - effect due to the tax regime provided for intercompany dividends | |||||||||
| - Italian regional income tax (IRAP) | ( |
) | |||||||
| - tax effects related to previous years | ( |
) | ( |
) | |||||
| - effect of reversals (impairments) of deferred tax assets | ( |
) | |||||||
| - impact pursuant to (reversal) impairment of deferred tax assets | ( |
) | ( |
) | |||||
| - other adjustments | ( |
) | ( |
) | |||||
| Effective tax charge |
The higher tax charges at non-Italian subsidiaries related to the Exploration & Production segment for €
In 2020, the Group incurred income taxes, despite a pre-tax loss of €
34 Earnings (loss) per share
Basic earnings (loss) per ordinary share are calculated by dividing net profit (loss) for the period attributable to Eni’s shareholders by the weighted average number of ordinary shares issued and outstanding during the period, excluding treasury shares.
Diluted earnings (loss) per share are calculated by dividing the net profit (loss) of the period attributable to Eni’s shareholders by the weighted average number of shares fully-diluted, excluding treasury shares, and including the number of potential shares to be issued.
As of December 31, 2022, the shares that could be potentially issued related the estimation of new shares that will vest in connection with the 2020-2022 long-term monetary incentive plans.
In determining basic and diluted earnings (loss) per share, the net profit (loss) for the period attributable to Eni is adjusted to take into account the remuneration of perpetual subordinated bonds, net of tax effect, calculated by using the amortized cost method.
Reconciliation of the weighted average number of shares used for the calculation for both basic and diluted earnings (loss) per share was as follows:
| 2022 | 2021 | 2020 | ||||||||
| Weighted average number of shares used for basic earnings (loss) per share | ||||||||||
| Potential shares to be issued for ILT incentive plan | ||||||||||
| Weighted average number of shares used for diluted earnings (loss) per share | ||||||||||
| Eni’s profit (loss) | (€ million) | ( |
) | |||||||
| Remunaration of subordinated perpetual bonds net of tax effect | (€ million) | ( |
) | ( |
) | |||||
| Eni’s profit (loss) for basic and diluted earnings (loss) per share | (€ million) | ( |
) | |||||||
| Basic earnings (loss) per share | (€ per share) | ( |
) | |||||||
| Diluted earnings (loss) per share | (€ per share) | ( |
) |
Segment information
Eni’s segmental reporting reflects the Group’s operating segments, whose results are regularly reviewed by the Chief Operating Decision Maker (the CEO) to assess segment performance and to make decisions about resources to be allocated to each segment.
The organization is based on
- Natural Resources, to build up the value of Eni’s oil&gas upstream portfolio, with the objective of reducing its carbon footprint by scaling up energy efficiency and expanding production in the natural gas business, and its position in the wholesale market. Furthermore, it will focus its actions on the development of carbon capture and compensation projects. The General Department incorporates the Company’s oil&gas exploration, development and production activities, natural gas wholesale via pipeline and LNG, forests conservation (REDD+) and CO2 storage projects.
- Energy Evolution, focused on the evolution of the businesses of power generation, transformation and marketing of products from fossil to bio and blue. The responsibility of this Department include the growth of power generation from renewable energy and biomethane, the coordination of the bio and circular evolution of the Company’s refining system and chemical business, and the development of Eni’s retail portfolio, providing increasingly more decarbonized products for mobility, household consumption and small enterprises. The General Department incorporates the activities of power generation from natural gas and renewables, the refining and chemicals businesses, Retail Gas&Power and mobility Marketing. The companies Versalis (chemical products), Eni Rewind (environmental activities) and Eni Plenitude, in their current structure, are consolidated in this General Department.
In relation to financial reporting purposes, management evaluated that the components of the Company whose operating results are regularly reviewed by the Chief Operating Decision Maker (CEO) to make decisions about the allocation of resources and to assess performances would continue being the single business units which are comprised in the two newly-established General Departments, rather than the two groups themselves. Therefore, in order to comply with the provisions of the international reporting standard that regulates the segment reporting (IFRS 8), the new reportable segments of Eni, substantially confirming the pre-existing setup, are identified as follows:
- Exploration & Production: research, development and production of oil, condensates and natural gas, forestry conservation (REDD+) and CO2 capture and storage projects.
- Global Gas &LNG Portfolio (GGP): supply and sale of wholesale natural gas via pipeline, international transport and purchase and marketing of LNG. It includes gas trading activities finalized to hedging and stabilizing the trade margins, as well as optimising the gas asset portfolio.
- Refining & Marketing and Chemicals: supply, processing, distribution and marketing of fuels and chemicals. The results of the Chemicals segment were aggregated with the Refining & Marketing performance in a single reportable segment, because these
- Plenitude & Power: retail sales of gas, electricity and related services, production and wholesale sales of electricity from thermoelectric and renewable plants, services for E-mobility. It includes trading activities of CO2 emission certificates and forward sale of electricity with a view to hedging/optimising the margins of the electricity.
- Corporate and Other activities: includes the main business support functions, in particular holding, central treasury, IT, human resources, real estate services, captive insurance activities, research and development, new technologies, business digitalization and the environmental activity developed by the subsidiary Eni Rewind.
Segment information presented to the CEO (i.e. the Chief Operating Decision Maker, ex IFRS 8) includes: revenues, operating profit and directly attributable assets and liabilities.
Segment Information
| (€ million) | Exploration & Production |
Global Gas & LNG Portfolio |
Refining & Marketing and Chemicals |
Plenitude & Power | Corporate and Other activities | Adjustments of intragroup profits | Total | ||||||||||||||
| 2022 | |||||||||||||||||||||
| Sales from operations including intersegment sales | |||||||||||||||||||||
| Less: intersegment sales | ( |
) | ( |
) | ( |
) | ( |
) | ( |
) | |||||||||||
| Sales from operations | |||||||||||||||||||||
| Operating profit | ( |
) | ( |
) | |||||||||||||||||
| Net provisions for contingencies | ( |
) | ( |
) | ( |
) | ( |
) | ( |
) | ( |
) | |||||||||
| Depreciation and amortization | ( |
) | ( |
) | ( |
) | ( |
) | ( |
) | ( |
) | |||||||||
| Impairments of tangible and intangible assets and right-of-use assets | ( |
) | ( |
) | ( |
) | ( |
) | ( |
) | ( |
) | |||||||||
| Reversals of tangible and intangible assets and right-of-use assets | |||||||||||||||||||||
| Write-off of tangible and intangible assets and right-of-use assets | ( |
) | ( |
) | ( |
) | ( |
) | |||||||||||||
| Share of profit (loss) of equity-accounted investments | ( |
) | ( |
) | |||||||||||||||||
| Identifiable assets (a) | ( |
) | |||||||||||||||||||
| Unallocated assets (b) | |||||||||||||||||||||
| Equity-accounted investments | |||||||||||||||||||||
| Identifiable liabilities (a) | ( |
||||||||||||||||||||
| Unallocated liabilities (b) | |||||||||||||||||||||
| Capital expenditure in tangible and intangible assets | ( |
||||||||||||||||||||
| 2021 | |||||||||||||||||||||
| Sales from operations including intersegment sales | |||||||||||||||||||||
| Less: intersegment sales | ( |
) | ( |
) | ( |
) | ( |
) | ( |
) | |||||||||||
| Sales from operations | |||||||||||||||||||||
| Operating profit | ( |
) | ( |
) | |||||||||||||||||
| Net provisions for contingencies | ( |
) | ( |
) | ( |
) | ( |
) | ( |
) | ( |
) | ( |
) | |||||||
| Depreciation and amortization | ( |
) | ( |
) | ( |
) | ( |
) | ( |
) | ( |
) | |||||||||
| Impairments of tangible and intangible assets and right-of-use assets | ( |
) | ( |
) | ( |
) | ( |
) | ( |
) | ( |
) | |||||||||
| Reversals of tangible and intangible assets | |||||||||||||||||||||
| Write-off of tangible and intangible assets | ( |
) | ( |
) | ( |
) | ( |
) | |||||||||||||
| Share of profit (loss) of equity-accounted investments | ( |
) | ( |
) | ( |
) | |||||||||||||||
| Identifiable assets (a) | ( |
) | |||||||||||||||||||
| Unallocated assets (b) | |||||||||||||||||||||
| Equity-accounted investments | |||||||||||||||||||||
| Identifiable liabilities (a) | ( |
) | |||||||||||||||||||
| Unallocated liabilities (b) | |||||||||||||||||||||
| Capital expenditure in tangible and intangible assets | ( |
) | |||||||||||||||||||
| 2020 | |||||||||||||||||||||
| Sales from operations including intersegment sales | |||||||||||||||||||||
| Less: intersegment sales | ( |
) | ( |
) | ( |
) | ( |
) | ( |
) | |||||||||||
| Sales from operations | |||||||||||||||||||||
| Operating profit | ( |
) | ( |
) | ( |
) | ( |
) | ( |
) | |||||||||||
| Net provisions for contingencies | ( |
) | ( |
) | ( |
) | ( |
) | ( |
) | ( |
) | |||||||||
| Depreciation and amortization | ( |
) | ( |
) | ( |
) | ( |
) | ( |
) | ( |
) | |||||||||
| Impairments of tangible and intangible assets and right-of-use assets | ( |
) | ( |
) | ( |
) | ( |
) | ( |
) | ( |
) | |||||||||
| Reversals of tangible and intangible assets | |||||||||||||||||||||
| Write-off of tangible and intangible assets | ( |
) | ( |
) | ( |
) | |||||||||||||||
| Share of profit (loss) of equity-accounted investments | ( |
) | ( |
) | ( |
) | ( |
) | ( |
) | |||||||||||
| Identifiable assets (a) | ( |
) | |||||||||||||||||||
| Unallocated assets (b) | |||||||||||||||||||||
| Equity-accounted investments | |||||||||||||||||||||
| Identifiable liabilities (a) | ( |
) | |||||||||||||||||||
| Unallocated liabilities (b) | |||||||||||||||||||||
| Capital expenditure in tangible and intangible assets | ( |
) |
| (a) Include assets/liabilities directly associated with the generation of operating profit. |
| (b) Include assets/liabilities not directly associated with the generation of operating profit. |
Information by geographical area
Identifiable assets and investments by geographical area of origin
| (€ million) | Italy |
Other European Union |
Rest of Europe | Americas | Asia | Africa | Other areas | Total | ||||||||||||||||
| 2022 | ||||||||||||||||||||||||
| Identifiable assets (a) | ||||||||||||||||||||||||
| Capital expenditure in tangible and intangible assets | ||||||||||||||||||||||||
| 2021 | ||||||||||||||||||||||||
| Identifiable assets (a) | ||||||||||||||||||||||||
| Capital expenditure in tangible and intangible assets | ||||||||||||||||||||||||
| 2020 | ||||||||||||||||||||||||
| Identifiable assets (a) | ||||||||||||||||||||||||
| Capital expenditure in tangible and intangible assets |
| (a) Include assets directly associated with the generation of operating profit. |
Sales from operations by geographical area of destination
| € million) | 2022 | 2021 | 2020 | ||||||
| Italy | |||||||||
| Other European Union | |||||||||
| Rest of Europe | |||||||||
| Americas | |||||||||
| Asia | |||||||||
| Africa | |||||||||
| Other areas | |||||||||
36 Transactions with related parties
In the ordinary course of its business, Eni enters into transactions mainly regarding:
| a) |
purchase/supply of goods and services and the provision of financing to joint ventures, associates and non-consolidated subsidiaries; |
| b) |
purchase/supply of goods and services to entities controlled by the Italian Government; |
| c) |
purchase/supply of goods and services to companies related to Eni SpA through members of the Board of Directors. Most of these transactions are exempt from the application of the Eni internal procedure “Transactions involving interests of Directors and Statutory Auditors and transactions with related parties” pursuant to the Consob Regulation, since they relate to ordinary transactions conducted at market or standard conditions, or because they fall below the materiality threshold provided for by the procedure; |
| d) |
contributions to non-profit entities correlated to Eni with the aim to develop solidarity, culture and research initiatives. In particular these related to: (i) Eni Foundation, established by Eni as a non-profit entity with the aim of pursuing exclusively solidarity initiatives in the fields of social assistance, health, education, culture and environment, as well as scientific and technological research; and (ii) Eni Enrico Mattei Foundation, established by Eni with the aim of enhancing, through studies, research and training initiatives, knowledge enrichment in the fields of economics, energy and environment, both at the national and international level. |
Transactions with related parties were conducted in the interest of Eni companies and, with exception of those with entities whose aim is to develop charitable, cultural and research initiatives, are related to the ordinary course of Eni’s business.
Transactions and balances with related parties
| (€ million) | ||||||||||||||||||
| December 31, 2022 | 2022 | |||||||||||||||||
| Name | Receivables and other assets | Payables and other liabilities | Guarantees | Revenues | Costs | Other operating (expense) income | ||||||||||||
| Joint ventures and associates | ||||||||||||||||||
| Agiba Petroleum Co | ||||||||||||||||||
| Angola LNG Ltd | ||||||||||||||||||
| Coral FLNG SA | ||||||||||||||||||
| Azule Group | ||||||||||||||||||
| Saipem Group | ||||||||||||||||||
| Vårgrønn Group | ||||||||||||||||||
| Karachaganak Petroleum Operating BV | ||||||||||||||||||
| Mellitah Oil & Gas BV | ||||||||||||||||||
| Petrobel Belayim Petroleum Co | ||||||||||||||||||
| Société Centrale Electrique du Congo SA | ||||||||||||||||||
| Società Oleodotti Meridionali SpA | ||||||||||||||||||
| Vår Energi ASA | ( |
) | ||||||||||||||||
| Other (*) | ||||||||||||||||||
| ( |
) | |||||||||||||||||
| Unconsolidated entities controlled by Eni | ||||||||||||||||||
| Eni BTC Ltd | ||||||||||||||||||
| Industria Siciliana Acido Fosforico - ISAF SpA (in liquidation) | ||||||||||||||||||
| Other | ||||||||||||||||||
| ( |
) | |||||||||||||||||
| Entities controlled by the Government | ||||||||||||||||||
| Cassa Depositi e Prestiti Group | ||||||||||||||||||
| Enel Group | ||||||||||||||||||
| Italgas Group | ||||||||||||||||||
| Snam Group | ||||||||||||||||||
| Terna Group | ( |
) | ||||||||||||||||
| GSE - Gestore Servizi Energetici | ||||||||||||||||||
| ITA Airways - Italia Trasporto Aereo SpA | ||||||||||||||||||
| Other | ||||||||||||||||||
| Other related parties | ||||||||||||||||||
| Groupement Sonatrach – Eni «GSE» | ||||||||||||||||||
(*) Each individual amount included herein was lower than €
| (€ million) | ||||||||||||||||||
| December 31, 2021 | 2021 | |||||||||||||||||
| Name | Receivables and other assets | Payables and other liabilities | Guarantees | Revenues | Costs | Other operating (expense) income | ||||||||||||
| Joint ventures and associates | ||||||||||||||||||
| Agiba Petroleum Co | ||||||||||||||||||
| Angola LNG Ltd | ||||||||||||||||||
| Angola LNG Supply Services Llc | ||||||||||||||||||
| Coral FLNG SA | ||||||||||||||||||
| Saipem Group | ||||||||||||||||||
| Karachaganak Petroleum Operating BV | ||||||||||||||||||
| Mellitah Oil & Gas BV | ||||||||||||||||||
| Petrobel Belayim Petroleum Co | ||||||||||||||||||
| Société Centrale Electrique du Congo SA | ||||||||||||||||||
| Societa' Oleodotti Meridionali SpA | ||||||||||||||||||
| Vår Energi AS | ( |
) | ||||||||||||||||
| Other (*) | ||||||||||||||||||
| ( |
) | |||||||||||||||||
| Unconsolidated entities controlled by Eni | ||||||||||||||||||
| Eni BTC Ltd | ||||||||||||||||||
| Industria Siciliana Acido Fosforico - ISAF SpA (in liquidation) | ||||||||||||||||||
| Other | ||||||||||||||||||
| ( |
) | |||||||||||||||||
| Entities controlled by the Government | ||||||||||||||||||
| Enel Group | ||||||||||||||||||
| Italgas Group | ||||||||||||||||||
| Snam Group | ||||||||||||||||||
| Terna Group | ||||||||||||||||||
| GSE - Gestore Servizi Energetici | ||||||||||||||||||
| Other (*) | ||||||||||||||||||
| Other related parties | ||||||||||||||||||
| Groupement Sonatrach – Agip «GSA» and Organe Conjoint des Opérations «OC SH/FCP» | ||||||||||||||||||
(*) Each individual amount included herein was lower than €
| (€ million) | ||||||||||||||||||
| December 31, 2020 |
2020 |
|||||||||||||||||
| Name | Receivables and other assets | Payables and other liabilities | Guarantees | Revenues | Costs | Other operating (expense) income | ||||||||||||
| Joint ventures and associates | ||||||||||||||||||
| Agiba Petroleum Co | ||||||||||||||||||
| Angola LNG Supply Services Llc | ||||||||||||||||||
| Coral FLNG SA | ||||||||||||||||||
| Gas Distribution Company of Thessaloniki - Thessaly SA | ||||||||||||||||||
| Saipem Group | ||||||||||||||||||
| Karachaganak Petroleum Operating BV | ||||||||||||||||||
| Mellitah Oil & Gas BV | ||||||||||||||||||
| Petrobel Belayim Petroleum Co | ||||||||||||||||||
| Societa Oleodotti Meridionali SpA | ||||||||||||||||||
| Société Centrale Electrique du Congo SA | ||||||||||||||||||
| Unión Fenosa Gas SA | ( |
) | ||||||||||||||||
| Vår Energi AS | ( |
) | ||||||||||||||||
| Other (*) | ||||||||||||||||||
| ( |
) | |||||||||||||||||
| Unconsolidated entities controlled by Eni | ||||||||||||||||||
| Eni BTC Ltd | ||||||||||||||||||
| Industria Siciliana Acido Fosforico - ISAF SpA (in liquidation) | ||||||||||||||||||
| Other | ||||||||||||||||||
| ( |
) | |||||||||||||||||
| Entities controlled by the Government | ||||||||||||||||||
| Enel Group | ||||||||||||||||||
| Italgas Group | ||||||||||||||||||
| Snam Group | ||||||||||||||||||
| Terna Group | ||||||||||||||||||
| GSE - Gestore Servizi Energetici | ||||||||||||||||||
| Other (*) | ||||||||||||||||||
| Other related parties | ||||||||||||||||||
| Groupement Sonatrach – Agip «GSA» and Organe Conjoint des Opérations «OC SH/FCP» | ||||||||||||||||||
(*) Each individual amount included herein was lower than €
The most significant transactions with joint ventures, associates and unconsolidated subsidiaries concerned:
• Eni’s share of expenses incurred to develop oil fields from Agiba Petroleum Co, Karachaganak Petroleum Operating BV, Mellitah Oil & Gas BV, Petrobel Belayim Petroleum Co, Groupement Sonatrach - Agip «GSE» and, only for Karachaganak Petroleum Operating BV, purchase of crude oil by Eni Trade & Biofuels SpA; services charged to Eni’s associates are invoiced on the basis of incurred costs;
• purchase of LNG from Angola LNG Ltd;
• supply of upstream specialist services and a guarantee issued on a pro-quota basis granted to Coral FLNG SA on behalf of the Consortium TJS for the contractual obligations assumed following the award of the EPCIC contract for the construction of a floating gas liquefaction plant (for more information see note 28 – Guarantees, commitments and risks);
• receivables for divestment activities linked to the contribution of Eni’s former subsidiaries in Angola, in exchange of a participating interest in Azule Holdings, the purchase of crude oils and the issue of guarantees against leasing contracts of FPSO vessels from the Azule Group;
• engineering, construction and drilling services by Saipem Group mainly for the Exploration & Production segment;
• a guarantee issued to Vårgrønn Group in relation to the participation in the Dogger Bank offshore wind project;
• the sale of gas to Société Centrale Electrique du Congo SA;
• advance received from Società Oleodotti Meridionali SpA for the infrastructure upgrade of the crude oil transport system at the Taranto refinery;
• guarantees issued in compliance with contractual agreements in the interest of Vår Energi ASA, the supply of upstream specialist services and maritime transport, the purchase of crude oil, condensates and gas and the realized part of the forward contracts for the purchase of gas;
• a guarantee issued in relation to Eni BTC Ltd for the construction of an oil pipeline; and
• services for environmental restoration to Industria Siciliana Acido Fosforico - ISAF SpA (in liquidation).
The most significant transactions with entities controlled by the Italian Government concerned:
• activities aimed at guaranteeing the operation, upgrading and efficiency of the plants for the Ansaldo group of Cassa Depositi e Prestiti;
• sale of fuel, sale and purchase of gas, purchase of LNG, acquisition of power distribution services and fair value of derivative financial instruments with Enel Group;
• acquisition of natural gas transportation, distribution and storage services with Snam Group and Italgas Group on the basis of the tariffs set by the Italian Regulatory Authority for Energy, Networks and Environment and purchase and sale with Snam Group of natural gas for granting the system balancing on the basis of prices referred to the quotations of the main energy commodities;
• acquisition of domestic electricity transmission service and sale and purchase of electricity for granting the system balancing based on prices referred to the quotations of the main energy commodities, and derivatives on commodities entered to hedge the price risk related to the utilization of transport capacity rights with Terna Group;
• sale and purchase of electricity, gas, environmental certificates, fair value of derivative financial instruments, sale of oil products and storage capacity with GSE - Gestore Servizi Energetici for the setting-up of a specific stock held by the Organismo Centrale di Stoccaggio Italiano (OCSIT) according to the Legislative Decree No. 249/12; the contribution to cover the charges deriving from the performance of OCSIT functions and activities and the contribution paid to GSE for the use of biomethane and other advanced biofuels in the transport sector;
• the sale of jet fuel to ITA Airways - Italia Trasporto Aereo SpA.
Transactions with other related parties concerned:
• provisions to pension funds managed by Eni of €
• contributions and service provisions to Eni Enrico Mattei Foundation for €
Financing transactions and balances with related parties
| (€ million) | ||||||||||||||||||
| December 31, 2022 |
2022 |
|||||||||||||||||
| Name | Receivables and cash and cash equivalents | Payables | Guarantees | Finance incomes and derivative financial instruments | Finance Expense | Gain on disposals | ||||||||||||
| Joint ventures and associates | ||||||||||||||||||
| Coral FLNG SA | ||||||||||||||||||
| Coral South FLNG DMCC | ||||||||||||||||||
| Mozambique Rovuma Venture SpA | ||||||||||||||||||
| Saipem Group | ||||||||||||||||||
| Other (*) | ||||||||||||||||||
| Unconsolidated entities controlled by Eni | ||||||||||||||||||
| Other | ||||||||||||||||||
| Entities controlled by the Government | ||||||||||||||||||
| Enel Group | ||||||||||||||||||
| Italgas Group | ||||||||||||||||||
| Other | ||||||||||||||||||
(*) Each individual amount included herein was lower than €
| (€ million) | |||||||||||||||
| December 31, 2021 |
2021 |
||||||||||||||
| Name | Receivables and cash and cash equivalents | Payables | Guarantees | Finance incomes | Finance expenses | ||||||||||
| Joint ventures and associates | |||||||||||||||
| Cardón IV SA | |||||||||||||||
| Coral FLNG SA | |||||||||||||||
| Coral South FLNG DMCC | |||||||||||||||
| Mozambique Rovuma Venture SpA | |||||||||||||||
| Other (*) | |||||||||||||||
| Unconsolidated entities controlled by Eni | |||||||||||||||
| Other | |||||||||||||||
| Entities controlled by the Government | |||||||||||||||
| Enel Group | |||||||||||||||
| Other | |||||||||||||||
(*) Each individual amount included herein was lower than €
| (€ million) | |||||||||||||||
| December 31, 2020 |
2020 |
||||||||||||||
| Name | Receivables | Payables | Guarantees | Finance incomes | Finance expenses | ||||||||||
| Joint ventures and associates | |||||||||||||||
| Angola LNG Ltd | |||||||||||||||
| Cardón IV SA | |||||||||||||||
| Coral FLNG SA | |||||||||||||||
| Coral South FLNG DMCC | |||||||||||||||
| Saipem Group | |||||||||||||||
| Société Centrale Electrique du Congo SA | |||||||||||||||
| Other | |||||||||||||||
| Unconsolidated entities controlled by Eni | |||||||||||||||
| Other | |||||||||||||||
| Entities controlled by the Government | |||||||||||||||
| Other | |||||||||||||||
The most significant transactions with joint ventures, associates and unconsolidated subsidiaries concerned:
• the financing loan granted to Coral FLNG SA for the construction of a floating gas liquefaction plant in Area 4 offshore Mozambique;
• a bank debt guarantee issued on behalf of Coral South FLNG DMCC as part of the project financing of the Coral FLNG development project (for more information see note 28 – Guarantees, commitments and risks);
• the loan granted to Mozambique Rovuma Venture SpA for the development of gas reserves offshore Mozambique;
• liabilities for leased assets towards Saipem Group related to long-term contracts for the use of drilling rigs.
The most significant transactions with entities controlled by the Italian Government concerned:
• financial debts towards Enel group for margins on derivative contracts;
• capital gain from the sale of the Gas Distribution Company of Thessaloniki – Thessaly SA to the Italgas Group.
Impact of transactions and positions with related parties on the balance sheet, profit and loss account and statement of cash flows
The impact of transactions and positions with related parties on the balance sheet accounts consisted of the following:
| (€ million) | ||||||||||||||||||
| December 31, 2022 |
December 31, 2021 |
|||||||||||||||||
| Total | Related parties |
Impact % | Total | Related parties |
Impact % | |||||||||||||
| Cash and cash equivalents | ||||||||||||||||||
| Other current financial assets | ||||||||||||||||||
| Trade and other receivables | ||||||||||||||||||
| Other current assets | ||||||||||||||||||
| Other non-current financial assets | ||||||||||||||||||
| Other non-current assets | ||||||||||||||||||
| Short-term debt | ||||||||||||||||||
| Current portion of long-term debt | ||||||||||||||||||
| Current portion of non-current lease liabilities | ||||||||||||||||||
| Trade and other payables | ||||||||||||||||||
| Other current liabilities | ||||||||||||||||||
| Long-term debt | ||||||||||||||||||
| Non-current lease liabilities | ||||||||||||||||||
| Other non-current liabilities | ||||||||||||||||||
The impact of transactions with related parties on the profit and loss accounts consisted of the following:
| (€ million) |
|||||||||||||||||||||||||||
| 2022 | 2021 | 2020 |
|||||||||||||||||||||||||
| Total |
Related parties |
Impact % | Total |
Related parties |
Impact % | Total |
Related parties |
Impact % | |||||||||||||||||||
| Sales from operations | |||||||||||||||||||||||||||
| Other income and revenues | |||||||||||||||||||||||||||
| Purchases, services and other | ( |
) | ( |
) | ( |
) | ( |
) | ( |
) | ( |
) | |||||||||||||||
| Net (impairments) reversals of trade and other receivables | ( |
) | … | ( |
) | ( |
) | ( |
) | ( |
) | ||||||||||||||||
| Payroll and related costs | ( |
) | ( |
) | ( |
) | ( |
) | ( |
) | ( |
) | |||||||||||||||
| Other operating income (expense) | ( |
) | … | ( |
) | .. | |||||||||||||||||||||
| Finance income | |||||||||||||||||||||||||||
| Finance expense | ( |
) | ( |
) | ( |
) | ( |
) | ( |
) | ( |
) | |||||||||||||||
| Derivative financial instruments | ( |
) | |||||||||||||||||||||||||
| Other income (expense) from investments | |||||||||||||||||||||||||||
Main cash flows with related parties are provided below:
| (€ million) | 2022 | 2021 | 2020 | ||||||
| Revenues and other income | |||||||||
| Costs and other expenses | ( |
) | ( |
) | ( |
) | |||
| Other operating income (loss) | |||||||||
| Net change in trade and other receivables and payables | ( |
) | ( |
) | ( |
) | |||
| Net interests | |||||||||
| Net cash provided from operating activities | ( |
) | ( |
) | |||||
| Capital expenditure in tangible and intangible assets | ( |
) | ( |
) | ( |
) | |||
| Disposal of investments | |||||||||
| Net change in accounts payable and receivable in relation to investments | ( |
) | ( |
) | |||||
| Change in financial receivables | ( |
) | ( |
) | ( |
) | |||
| Net cash used in investing activities | ( |
) | ( |
) | ( |
) | |||
| Change in financial and lease liabilities | ( |
) | ( |
) | |||||
| Net cash used in financing activities | ( |
) | ( |
) | |||||
| Change in cash and cash equivalents | |||||||||
| Total financial flows to related parties | ( |
) | ( |
) |
The impact of cash flows with related parties consisted of the following:
| (€ million) | |||||||||||||||||||||||||||
| 2022 | 2021 | 2020 |
|||||||||||||||||||||||||
| Total | Related parties | Impact % |
Total | Related parties | Impact % |
Total | Related parties | Impact % |
|||||||||||||||||||
| Net cash provided from operating activities | ( |
) | .. | ( |
) | .. | |||||||||||||||||||||
| Net cash used in investing activities | ( |
) | ( |
( |
) | ( |
) | ( |
) | ( |
) | ||||||||||||||||
| Net cash used in financing activities | ( |
) | ( |
) | ( |
) | ( |
) | |||||||||||||||||||
37 Other information about investments
Information on Eni’s investments as of December 31, 2022
The following section provides information about Eni’s subsidiaries, joint arrangements, associates and other significant investments as of December 31, 2022. Unless otherwise indicated, share capital is represented by ordinary shares directly held by the Group, while ownership interest corresponds to voting rights.
| PARENT COMPANY |
| Company name | Registered office | Country of operation | Currency | Share Capital | Shareholders | % Ownership | |||||||
| Eni SpA (#) | EUR | Cassa Depositi e Prestiti SpA | |||||||||||
| Ministero dell’Economia e delle Finanze | |||||||||||||
| Eni SpA | |||||||||||||
| Other shareholders | |||||||||||||
|
SUBSIDIARIES EXPLORATION & PRODUCTION IN ITALY |
| Company name | Registered office | Country of operation | Currency | Share Capital | Shareholders | % Ownership | % Equity ratio | Consolidation or valutation method (*) |
|||||||||
| EUR | Eni SpA | ||||||||||||||||
| EUR | Eni SpA | ||||||||||||||||
| EUR | Eni SpA | ||||||||||||||||
| EUR | Eni SpA | ||||||||||||||||
| EUR | Eni SpA | ||||||||||||||||
| EUR | Eni SpA | ||||||||||||||||
| EUR | Eni SpA | ||||||||||||||||
| EUR | Eni SpA | ||||||||||||||||
| Third parties |
| (*) F.C. = full consolidation, J.O. = joint operation, Eq. = equity-accounted, Co. = valued at cost, F.V. = valued at fair value | |||||||||||
| (#) Company with shares quoted on regulated market of Italy or of other EU countries. | |||||||||||
| OUTSIDE ITALY |
| Company name | Registered office | Country of operation | Currency | Share Capital | Shareholders | % Ownership | % Equity ratio |
Consolidation or valutation method (*) |
|||||||||
| EUR | Eni International BV | ||||||||||||||||
|
|
NGN | Eni International BV | |||||||||||||||
| Eni Oil Holdings BV | |||||||||||||||||
| EUR | Eni International BV | ||||||||||||||||
| USD | Burren Energy Plc | ||||||||||||||||
| GBP | Burren Energy Plc | ||||||||||||||||
| USD | Burren En. (Berm) Ltd | ||||||||||||||||
| GBP | Burren Energy Plc | ||||||||||||||||
| GBP | Eni UK Holding Plc | ||||||||||||||||
| Eni UK Ltd | (..) | ||||||||||||||||
| USD | Burren En. India Ltd | ||||||||||||||||
| EUR | Eni International BV | ||||||||||||||||
| EUR | Eni International BV | ||||||||||||||||
| EUR | Eni International BV | ||||||||||||||||
| USD | Eni Oil Holdings BV | ||||||||||||||||
| EUR | Eni International BV | ||||||||||||||||
| GBP | Eni Indonesia Ltd | ||||||||||||||||
| USD | Eni UHL Ltd | ||||||||||||||||
|
|
ARS | Eni International BV | |||||||||||||||
| Eni Oil Holdings BV | |||||||||||||||||
| GBP | Eni Indonesia Ltd | ||||||||||||||||
| EUR | Eni International BV | ||||||||||||||||
| GBP | Eni International BV | ||||||||||||||||
| EUR | Eni International BV | ||||||||||||||||
| USD | Eni Petroleum Co Inc |
| (*) F.C. = full consolidation, J.O. = joint operation, Eq. = equity-accounted, Co. = valued at cost, F.V. = valued at fair value. |
| Company name | Registered office | Country of operation | Currency | Share Capital | Shareholders | % Ownership | % Equity ratio | Consolidation or valutatio method(*) | |||||||||
| GBP | Eni International BV | ||||||||||||||||
| GBP | Eni Indonesia Ltd | ||||||||||||||||
| USD | Eni International BV | ||||||||||||||||
| USD | Eni Lasmo Plc | ||||||||||||||||
| EUR | Eni International BV | ||||||||||||||||
| USD | Eni E&P Holding BV | ||||||||||||||||
| GBP | Eni Lasmo Plc | ||||||||||||||||
| EUR | Eni International BV | ||||||||||||||||
| BRL | Eni International BV | ||||||||||||||||
| Eni Oil Holdings BV | (..) | ||||||||||||||||
| GBP | Eni Indonesia Ltd | ||||||||||||||||
| GBP | Eni Indonesia Ltd | ||||||||||||||||
| GBP | Eni UK Ltd | ||||||||||||||||
| EUR | Eni International BV | ||||||||||||||||
| EUR | Eni International BV | ||||||||||||||||
| XAF | Eni International BV | ||||||||||||||||
| GBP | Eni Indonesia Ltd | ||||||||||||||||
| EUR | Eni International BV | ||||||||||||||||
|
|
GHS | Eni International BV | |||||||||||||||
| GBP | Eni UK Ltd | ||||||||||||||||
| GBP | Eni Lasmo Plc | ||||||||||||||||
| GBP | Eni Lasmo Plc | ||||||||||||||||
| GBP | Eni ULX Ltd | ||||||||||||||||
| USD | Eni Indonesia Ltd | ||||||||||||||||
| USD | Eni International BV | ||||||||||||||||
| GBP | Eni SpA | ||||||||||||||||
| Eni UK Ltd | (..) |
| (*) F.C. = full consolidation, J.O. = joint operation, Eq. = equity-accounted, Co. = valued at cost, F.V. = valued at fair value. |
| Company name | Registered office | Country of operation | Currency | Share Capital | Shareholders | % Ownership | % Equity ratio | Consolidation or valutation method(*) |
|||||||||
| EUR | Eni International BV | ||||||||||||||||
| EUR | Eni International BV | ||||||||||||||||
| EUR | Eni International BV | ||||||||||||||||
| EUR | Eni International BV | ||||||||||||||||
| GBP | Eni International BV | ||||||||||||||||
| AUD | Eni International BV | ||||||||||||||||
| EUR | Eni International BV | ||||||||||||||||
| EUR | Eni International BV | ||||||||||||||||
| GBP | Eni Indonesia Ltd | ||||||||||||||||
| GBP | Eni Investments Plc | ||||||||||||||||
| Eni UK Ltd | (..) | ||||||||||||||||
| EUR | Eni International BV | ||||||||||||||||
| GBP | Eni UK Ltd | ||||||||||||||||
| GBP | Eni UK Ltd | ||||||||||||||||
| USD | Eni Petroleum Co Inc | ||||||||||||||||
| EUR | Eni International BV | ||||||||||||||||
| MXN | Eni International BV | ||||||||||||||||
| Eni Oil Holdings BV | |||||||||||||||||
| GBP | Eni ULT Ltd | ||||||||||||||||
| GBP | Eni Lasmo Plc | ||||||||||||||||
| Eni LNS Ltd | (..) | ||||||||||||||||
| EUR | Eni International BV | ||||||||||||||||
| GBP | Eni Lasmo Plc | ||||||||||||||||
| EUR | Eni International BV | ||||||||||||||||
| EUR | Eni International BV | ||||||||||||||||
| EUR | Eni International BV | ||||||||||||||||
| EGP | Eni International BV | ||||||||||||||||
| Ieoc Exploration BV | |||||||||||||||||
| Ieoc Production BV | |||||||||||||||||
| (*) F.C. = full consolidation, J.O. = joint operation, Eq. = equity-accounted, Co. = valued at cost, F.V. = valued at fair value. | |||||||||||
| (a) Shares without nominal value. | |||||||||||
| Company name | Registered office | Country of operation | Currency | Share Capital | Shareholders | % Ownership | % Equity ratio |
Consolidation or valutatio method (*) |
|||||||||
| EUR | Eni International BV | ||||||||||||||||
| GBP | Eni Indonesia Ltd | ||||||||||||||||
| USD | Eni America Ltd | ||||||||||||||||
| GBP | Eni Lasmo Plc | ||||||||||||||||
| EUR | Eni ULX Ltd | ||||||||||||||||
| EUR | Eni International BV | ||||||||||||||||
| USD | Eni SpA | ||||||||||||||||
| Eni International BV | |||||||||||||||||
| USD | Eni BB Petroleum Inc | ||||||||||||||||
| EUR | Eni International BV | ||||||||||||||||
| EUR | Eni International BV | ||||||||||||||||
| GBP | Eni Indonesia Ltd | ||||||||||||||||
|
|
CDF | Eni International BV | |||||||||||||||
| Eni Oil Holdings BV | (..) | ||||||||||||||||
| EUR | Eni Mozamb. LNG H. BV | ||||||||||||||||
| EUR | Eni International BV | ||||||||||||||||
| EUR | Eni International BV | ||||||||||||||||
| USD | Eni International BV | ||||||||||||||||
| GBP | Eni UK Ltd | ||||||||||||||||
| EUR | Eni International BV | ||||||||||||||||
| USD | Burren En. (Berm) Ltd | ||||||||||||||||
| GBP | Eni ULT Ltd | ||||||||||||||||
| GBP | Eni Lasmo Plc | ||||||||||||||||
| Eni UK Ltd | (..) | ||||||||||||||||
| GBP | Eni International BV | ||||||||||||||||
| GBP | Eni UK Ltd |
| (*) F.C. = full consolidation, J.O. = joint operation, Eq. = equity-accounted, Co. = valued at cost, F.V. = valued at fair value. |
| Company name | Registered office | Country of operation | Currency | Share Capital | Shareholders | % Ownership | % Equity ratio | Consolidation or valutation method (*) |
|||||||||
| EUR | Eni International BV | ||||||||||||||||
| UAH | Eni Ukraine Hold. BV | ||||||||||||||||
| Eni International BV | |||||||||||||||||
| GBP | Eni Lasmo Plc | ||||||||||||||||
| GBP | Eni ULT Ltd | ||||||||||||||||
| USD | Eni Petroleum Co Inc | ||||||||||||||||
| USD | Eni Marketing Inc | ||||||||||||||||
| USD | Eni Oil & Gas Inc | ||||||||||||||||
| EUR | Eni Venezuela E&P H. | ||||||||||||||||
| USD | Eni International BV | ||||||||||||||||
| Eni Oil Holdings BV | (..) | ||||||||||||||||
| EUR | Eni International BV | ||||||||||||||||
| GBP | Eni Indonesia Ltd | ||||||||||||||||
| GBP | Eni Indonesia Ltd | ||||||||||||||||
| GBP | Burren Energy Plc | ||||||||||||||||
| DZD | Eni Algeria Ltd Sàrl | ||||||||||||||||
| USD | Eni SpA | ||||||||||||||||
| USD | Eni Canada Hold. Ltd | ||||||||||||||||
| FCP Partner Co ULC | |||||||||||||||||
| CAD | Eni Canada Hold. Ltd | ||||||||||||||||
| EUR | Eni International BV | ||||||||||||||||
| EUR | Eni International BV | ||||||||||||||||
| USD | Eni Lasmo Plc | ||||||||||||||||
| GBP | Eni UK Ltd | ||||||||||||||||
| USD | Eni ULX Ltd | ||||||||||||||||
| RUB | Eni Energy Russia BV | ||||||||||||||||
| Eni Oil Holdings BV | |||||||||||||||||
| MXN | Eni US Op. Co Inc | ||||||||||||||||
| Eni Petroleum Co Inc |
(*) F.C. = full consolidation, J.O. = joint operation, Eq. = equity-accounted, Co. = valued at cost, F.V. = valued at fair value.
| Company name | Registered office | Country of operation | Currency | Share Capital | Shareholders | % Ownership | % Equity ratio | Consolidation or valutation method (*) |
|||||||||
| NGN | NAOC Ltd | ||||||||||||||||
| Agip En Nat Res. Ltd | |||||||||||||||||
| Nigerian Agip E. Ltd | |||||||||||||||||
| NGN | Eni International BV | ||||||||||||||||
| Eni Oil Holdings BV | |||||||||||||||||
| NGN | Eni International BV | ||||||||||||||||
| Eni Oil Holdings BV | |||||||||||||||||
| USD | Eni Congo SA | ||||||||||||||||
| Burren En. Congo Ltd | |||||||||||||||||
| USD | Eni Congo SA | ||||||||||||||||
| Burren En. Congo Ltd | |||||||||||||||||
| Third parties |
(*) F.C. = full consolidation, J.O. = joint operation, Eq. = equity-accounted, Co. = valued at cost, F.V. = valued at fair value.
|
GLOBAL GAS & LNG PORTFOLIO IN ITALY |
| Company name | Registered office | Country of operation | Currency | Share Capital | Shareholders | % Ownership | % Equity ratio | Consolidation or valutation method (*) |
||||||||||||||||
| EUR | Eni SpA | |||||||||||||||||||||||
| EUR | Eni SpA | |||||||||||||||||||||||
| EUR | Eni SpA | |||||||||||||||||||||||
| |
EUR | Eni SpA | ||||||||||||||||||||||
| EUR | Eni Corridor Srl |
| OUTSIDE ITALY |
| Company name | Registered office | Country of operation | Currency | Share Capital | Shareholders | % Ownership | % Equity ratio | Consolidation or valutation method (*) |
||||||||||||||||
| EUR | Eni SpA | |||||||||||||||||||||||
| EUR | Eni International BV | |||||||||||||||||||||||
| EUR | Eni International BV | |||||||||||||||||||||||
| TND | Eni Corridor Srl | |||||||||||||||||||||||
| Third parties | ||||||||||||||||||||||||
| TND | Eni Corridor Srl |
|||||||||||||||||||||||
| Trans Tunis. P. Co SpA |
| (*) F.C. = full consolidation, J.O. = joint operation, Eq. = equity-accounted, Co. = valued at cost, F.V. = valued at fair value. |
|
REFINING & MARKETING AND CHEMICAL Refining & Marketing IN ITALY |
| Company name | Registered office | Country of operation | Currency | Share Capital | Shareholders | % Ownership | % Equity ratio | Consolidation or valutation method (*) |
||||||||||||||||
| EUR | Eni SpA | |||||||||||||||||||||||
| EUR | EniBioCh4in SpA | |||||||||||||||||||||||
| Third parties | ||||||||||||||||||||||||
| EUR | EniBioCh4in SpA | |||||||||||||||||||||||
| EUR | EniBioCh4in SpA | |||||||||||||||||||||||
| Third parties | ||||||||||||||||||||||||
| EUR | EniBioCh4in SpA | |||||||||||||||||||||||
| EUR | EniBioCh4in SpA | |||||||||||||||||||||||
| Third parties | ||||||||||||||||||||||||
| EUR | EniBioCh4in SpA | |||||||||||||||||||||||
| EUR | EniBioCh4in SpA | |||||||||||||||||||||||
| EUR | EniBioCh4in SpA | |||||||||||||||||||||||
| EUR | EniBioCh4in SpA | |||||||||||||||||||||||
| EUR | Eni Sust. Mobility SpA | |||||||||||||||||||||||
| EUR | |
Eni SpA | ||||||||||||||||||||||
| EUR | Eni SpA | |||||||||||||||||||||||
| EUR | |
Eni SpA | ||||||||||||||||||||||
| EUR | Ecofuel SpA | |||||||||||||||||||||||
| EUR | EniBioCh4in SpA | |||||||||||||||||||||||
| EUR | Eni SpA | |||||||||||||||||||||||
| EUR | Ecofuel SpA | |||||||||||||||||||||||
| Third parties | ||||||||||||||||||||||||
| EUR | Eni SpA |
| (*) F.C. = full consolidation, J.O. = joint operation, Eq. = equity-accounted, Co. = valued at cost, F.V. = valued at fair value. |
| OUTSIDE ITALY |
| Company name | Registered office | Country of operation | Currency | Share Capital | Shareholders | % Ownership | % Equity ratio | Consolidation or valutation method (*) |
||||||||||||||||
| EUR | Eni International BV | |||||||||||||||||||||||
| EUR | Eni Abu Dhabi R&T BV | |||||||||||||||||||||||
| EUR | Eni Sust. Mobility SpA | |||||||||||||||||||||||
| Eni Deutsch. GmbH |
||||||||||||||||||||||||
| EUR | Eni Sust. Mobility SpA | |||||||||||||||||||||||
| EUR | Eni International BV | |||||||||||||||||||||||
| Eni Oil Holdings BV | ||||||||||||||||||||||||
| USD | Eni International BV | |||||||||||||||||||||||
| Esain SA | ||||||||||||||||||||||||
| EUR | Eni International BV | |||||||||||||||||||||||
| EUR | Eni International BV | |||||||||||||||||||||||
| EUR | Eni Sust. Mobility SpA | |||||||||||||||||||||||
| EUR | Eni Mineralölh. GmbH | |||||||||||||||||||||||
| Eni Sust. Mobility SpA | (..) | |||||||||||||||||||||||
| EUR | Eni Austria GmbH | |||||||||||||||||||||||
| EUR | Eni Deutsch. GmbH | |||||||||||||||||||||||
| CHF | Eni International BV | |||||||||||||||||||||||
| USD | ET&B SpA | |||||||||||||||||||||||
| MXN | Eni International BV | |||||||||||||||||||||||
| Eni Oil Holdings BV | ||||||||||||||||||||||||
| USD | Eni International BV | |||||||||||||||||||||||
| USD | Eni Ecuador SA | |||||||||||||||||||||||
| Third parties | ||||||||||||||||||||||||
| USD | Eni Ecuador SA | |||||||||||||||||||||||
| Tecnoesa SA | (..) | |||||||||||||||||||||||
| CHF | Eni International BV | |||||||||||||||||||||||
| USD | Eni Ecuador SA | |||||||||||||||||||||||
| Esain SA | (..) |
| (*) F.C. = full consolidation, J.O. = joint operation, Eq. = equity-accounted, Co. = valued at cost, F.V. = valued at fair value. |
|
Chemical IN ITALY |
| Company name | Registered office | Country of operation | Currency | Share Capital | Shareholders | % Ownership | % Equity ratio | Consolidation or valutation method (*) |
||||||||||||||||
| EUR | Eni SpA | |||||||||||||||||||||||
| EUR | Versalis SpA |
| OUTSIDE ITALY |
| Company name | Registered office | Country of operation | Currency | Share Capital | Shareholders | % Ownership | % Equity ratio | Consolidation or valutation method (*) |
||||||||||||||||
| HKD | Finproject Asia Ltd | |||||||||||||||||||||||
| HUF | Versalis SpA | |||||||||||||||||||||||
| Versalis Deutsch. GmbH | ||||||||||||||||||||||||
| Versalis International SA | ||||||||||||||||||||||||
| USD | Finproject SpA | |||||||||||||||||||||||
| BRL | Finproject SpA | |||||||||||||||||||||||
| USD | Finproject SpA | |||||||||||||||||||||||
| INR | Asian Compounds Ltd | |||||||||||||||||||||||
| Finproject Asia Ltd | ||||||||||||||||||||||||
| RON | Finproject SpA | |||||||||||||||||||||||
| SGD | Finproject Asia Ltd | |||||||||||||||||||||||
| VND | Finproject Asia Ltd | |||||||||||||||||||||||
| CAD | Finproject SpA | |||||||||||||||||||||||
| MXN | Foam Creations (2008) | |||||||||||||||||||||||
| Finproject SpA | (..) | |||||||||||||||||||||||
| USD | Finproject SpA | |||||||||||||||||||||||
| EUR | Finproject SpA | |||||||||||||||||||||||
| USD | Versalis International SA | |||||||||||||||||||||||
|
|
XAF | Versalis International SA | ||||||||||||||||||||||
| EUR | Versalis SpA |
| (*) F.C. = full consolidation, J.O. = joint operation, Eq. = equity-accounted, Co. = valued at cost, F.V. = valued at fair value. |
| Company name | Registered office | Country of operation | Currency | Share Capital | Shareholders | % Ownership | % Equity ratio | Consolidation or valutation method (*) |
||||||||||||||||
| EUR | Versalis SpA | |||||||||||||||||||||||
| EUR | Versalis SpA | |||||||||||||||||||||||
| Versalis Deutsch. GmbH | ||||||||||||||||||||||||
| Dunastyr Zrt | ||||||||||||||||||||||||
| Versalis France | ||||||||||||||||||||||||
| TRY | Versalis International SA | |||||||||||||||||||||||
| MXN | Versalis International SA | |||||||||||||||||||||||
| Versalis SpA | ||||||||||||||||||||||||
| INR | Versalis Singapore P. Ltd | |||||||||||||||||||||||
| Third parties | (..) | |||||||||||||||||||||||
| CNY | Versalis SpA | |||||||||||||||||||||||
| SGD | Versalis SpA | |||||||||||||||||||||||
| GBP | Versalis SpA | |||||||||||||||||||||||
| GHS | Versalis International SA | |||||||||||||||||||||||
| Third parties |
| (*) F.C. = full consolidation, J.O. = joint operation, Eq. = equity-accounted, Co. = valued at cost, F.V. = valued at fair value. | |||||||||||
|
PLENITUDE & POWER Plenitude IN ITALY |
| Company name | Registered office | Country of operation | Currency | Share Capital | Shareholders | % Ownership |
% Equity ratio |
Consolidation or valutatio method (*) |
|||||||||
| EUR | Eni Plenitude SpA SB | ||||||||||||||||
| EUR | SEF Solar Srl | ||||||||||||||||
| EUR | Be Power SpA | ||||||||||||||||
| EUR | Be Charge Srl | ||||||||||||||||
| EUR | Eni Plenitude SpA SB | (a) | |||||||||||||||
| Third parties | |||||||||||||||||
| EUR | PLT Wind 2020 Srl | ||||||||||||||||
| EUR | Eni New Energy SpA | ||||||||||||||||
| EUR | Eni New Energy SpA | ||||||||||||||||
| EUR | Eni New Energy SpA | ||||||||||||||||
| EUR | SEF Srl | ||||||||||||||||
| EUR | PLT Wind 2022 SpA | ||||||||||||||||
| EUR | PLT Energia Srl | ||||||||||||||||
| EUR | PLT Wind 2022 SpA | ||||||||||||||||
| EUR | PLT Energia Srl | ||||||||||||||||
| EUR | Eni Plenitude SpA SB | ||||||||||||||||
| EUR | Eni SpA | ||||||||||||||||
| EUR | PLT Energia Srl | ||||||||||||||||
| EUR | PLT Wind 2022 SpA | ||||||||||||||||
| EUR | PLT Wind 2020 Srl | ||||||||||||||||
| EUR | Eni Plenitude SpA SB | ||||||||||||||||
| Third parties | |||||||||||||||||
| EUR | Evolvere SpA Soc.Ben. | ||||||||||||||||
| EUR | SEF Green Srl |
| (*) F.C. = full consolidation, J.O. = joint operation, Eq. = equity-accounted, Co. = valued at cost, F.V. = valued at fair value. | |||||||||||
| (a) Controlling interest: | Eni Plenitude SpA SB | 100.00 | |||||||||
| Company name | Registered office | Country of operation | Currency | Share Capital | Shareholders | % Ownership | % Equity ratio | Consolidation or valutation method (*) |
|||||||||
| EUR | PLT Energia Srl | ||||||||||||||||
| EUR | Eni New Energy SpA | ||||||||||||||||
| EUR | SEF Srl | ||||||||||||||||
| EUR | SEF Srl | ||||||||||||||||
| EUR | SEF Srl | ||||||||||||||||
| EUR | SEF Srl | ||||||||||||||||
| EUR | SEF Srl | ||||||||||||||||
| EUR | PLT Energia Srl | ||||||||||||||||
| EUR | SEF Solar Srl | ||||||||||||||||
| EUR | SEF Solar Srl | ||||||||||||||||
| EUR | SEF Solar Srl | ||||||||||||||||
| EUR | SEF Srl | ||||||||||||||||
| EUR | PLT Wind 2022 SpA | ||||||||||||||||
| EUR | PLT Wind 2020 Srl | ||||||||||||||||
| EUR | Faren Srl | ||||||||||||||||
| EUR | SEF Srl | ||||||||||||||||
| EUR | SEF Srl | ||||||||||||||||
| EUR | PLT Wind 2020 Srl | ||||||||||||||||
| EUR | PLT Wind 2022 SpA | ||||||||||||||||
| EUR | PLT Wind 2020 Srl | ||||||||||||||||
| EUR | SEF Solar Srl | ||||||||||||||||
| EUR | Eni New Energy SpA | ||||||||||||||||
| EUR | PLT Energia Srl | ||||||||||||||||
| EUR | PLT Energia Srl | ||||||||||||||||
| EUR | PLT Energia Srl | ||||||||||||||||
| EUR | PLT Energia Srl |
| (*) F.C. = full consolidation, J.O. = joint operation, Eq. = equity-accounted, Co. = valued at cost, F.V. = valued at fair value. |
| Company name | Registered office | Country of operation | Currency | Share Capital | Shareholders | % Ownership | % Equity ratio | Consolidation or valutation method (*) |
|||||||||
| EUR | SEF Srl | ||||||||||||||||
| EUR | SEF Srl | ||||||||||||||||
| EUR | SEF Srl | ||||||||||||||||
| EUR | SEF Srl | ||||||||||||||||
| EUR | PLT Energia Srl | ||||||||||||||||
| EUR | PLT Wind 2022 SpA | ||||||||||||||||
| EUR | Eni Plenitude SpA SB | ||||||||||||||||
| EUR | SEF Srl | ||||||||||||||||
| EUR | SEF Srl | ||||||||||||||||
| EUR | SEF Srl | ||||||||||||||||
| EUR | SEF Srl | ||||||||||||||||
| EUR | SEF Srl | ||||||||||||||||
| EUR | Eni New Energy SpA | ||||||||||||||||
| EUR | SEF Solar Srl | ||||||||||||||||
| EUR | SEF Srl | ||||||||||||||||
| EUR | Soc. Agr. Agricentro Srl | ||||||||||||||||
| EUR | SEF Solar Srl | ||||||||||||||||
| EUR | Soc. Agr. Agricentro Srl | ||||||||||||||||
| EUR | SEF Srl | ||||||||||||||||
| EUR | SER SpA | ||||||||||||||||
| CEF 3 Wind Energy | |||||||||||||||||
| EUR | CEF 3 Wind Energy | ||||||||||||||||
| EUR | PLT Energia Srl | ||||||||||||||||
| Third parties | |||||||||||||||||
| EUR | SEF Srl | ||||||||||||||||
| EUR | PLT Energia Srl | ||||||||||||||||
| EUR | PLT Wind 2022 SpA | ||||||||||||||||
| EUR | PLT Energia Srl |
| (*) F.C. = full consolidation, J.O. = joint operation, Eq. = equity-accounted, Co. = valued at cost, F.V. = valued at fair value. |
| Company name | Registered office | Country of operation | Currency | Share Capital | Shareholders | % Ownership | % Equity ratio | Consolidation or valutation method (*) |
|||||||||
|
|
EUR | Eni New Energy SpA | |||||||||||||||
| EUR | PLT Wind 2020 Srl | ||||||||||||||||
| EUR | PLT Wind 2020 Srl | ||||||||||||||||
| EUR | PLT Wind 2020 Srl |
OUTSIDE ITALY
| Company name | Registered office | Country of operation | Currency | Share Capital | Shareholders | % Ownership | % Equity ratio | Consolidation or valutation method (*) |
|||||||||
| EUR | Eni Plenitude SpA SB | ||||||||||||||||
| Third parties | |||||||||||||||||
|
|
EUR | Eni Plen. Op. Fr. SAS | |||||||||||||||
| EUR | Eni Plen. Ren. Lux. Sàrl | ||||||||||||||||
| EUR | PLT Eng. Spagna SLU | ||||||||||||||||
|
|
EUR | Eni Plen. Op. Fr. SAS | |||||||||||||||
|
|
KZT | Eni Energy Solutions BV | |||||||||||||||
|
|
EUR | Krypton SAS | |||||||||||||||
|
|
EUR | Krypton SAS | |||||||||||||||
|
|
EUR | Krypton SAS | |||||||||||||||
|
|
EUR | Xenon SAS | |||||||||||||||
|
|
EUR | Xenon SAS | |||||||||||||||
|
|
EUR | Eni Plen. Op. Fr. SAS | |||||||||||||||
| EUR | Eni Plen. Ren. Lux. Sàrl | ||||||||||||||||
| USD | Eni New Energy US Inc | ||||||||||||||||
| USD | Brazoria HoldCo Llc | ||||||||||||||||
| USD | Brazoria Class B | ||||||||||||||||
| Third parties | |||||||||||||||||
| EUR | Eni Plen. Ren. Lux. Sàrl | ||||||||||||||||
| EUR | Eni Plen. Ren. Lux. Sàrl |
| (*) F.C. = full consolidation, J.O. = joint operation, Eq. = equity-accounted, Co. = valued at cost, F.V. = valued at fair value. |
| Company name | Registered office | Country of operation | Currency | Share Capital | Shareholders | % Ownership | % Equity ratio | Consolidation or valutation metho (*) |
|||||||||
| USD | Eni New Energy US Inc | ||||||||||||||||
| USD | Corazon Tax Eq. Part. Llc | ||||||||||||||||
| USD | Eni New Energy US Inc | ||||||||||||||||
| USD | Corazon En. Class B Llc | ||||||||||||||||
| Third parties | |||||||||||||||||
| EUR | PLT Eng. Spagna SLU | ||||||||||||||||
| EUR | Eni Plen. Ren. Lux. Sàrl | ||||||||||||||||
| EUR | Eni Plenitude SpA SB | ||||||||||||||||
| Energías Amb. Outes | |||||||||||||||||
| EUR | Eni Plenitude SpA SB | ||||||||||||||||
| EUR | PLT Eng. Spagna SLU | ||||||||||||||||
| EUR | Eni Plenitude SpA SB | ||||||||||||||||
| EUR | Eni Plenitude SpA SB | ||||||||||||||||
| EUR | Eni Plenitude SpA SB | ||||||||||||||||
| Desarrollos Energéticos |
|||||||||||||||||
| EUR | Eni Plenitude SpA SB | ||||||||||||||||
| EUR | Eni Plenitude SpA SB | ||||||||||||||||
| Third parties | (..) | ||||||||||||||||
| AUD | Eni Plenitude SpA SB | ||||||||||||||||
| AUD | Eni New En. Aus. Pty Ltd | ||||||||||||||||
| AUD | Eni New En. Aus. Pty Ltd | ||||||||||||||||
| AUD | Eni New En. Aus. Pty Ltd | ||||||||||||||||
| USD | Eni New Energy US Inc | ||||||||||||||||
| Eni New Energy US Inv. Inc | |||||||||||||||||
| USD | Eni Plenitude SpA SB | ||||||||||||||||
| USD | Eni New Energy US Inc | ||||||||||||||||
| EUR | Eni Plenitude SpA SB | ||||||||||||||||
| EUR | Eni Plen. Ren. Lux. Sàrl | ||||||||||||||||
| EUR | Eni Plen. Ren. Lux. Sàrl |
| (*) F.C. = full consolidation, J.O. = joint operation, Eq. = equity-accounted, Co. = valued at cost, F.V. = valued at fair value. |
| Company name | Registered office | Country of operation | Currency | Share Capital | Shareholders | % Ownership | % Equity ratio | Consolidation or valutation method (*) |
|||||||||
| EUR | Eni Plenitude SpA SB | ||||||||||||||||
| |
EUR | Eni Plenitude SpA SB | |||||||||||||||
| EUR | Eni Plen. Ren. Lux. Sàrl | ||||||||||||||||
| EUR | Eni Plen. Ren. Lux. Sàrl | ||||||||||||||||
| EUR | PLT Spagna SL | ||||||||||||||||
| EUR | Eni Plen. Ren. Lux. Sàrl | ||||||||||||||||
| EUR | Eni Plen. Ren. Lux. Sàrl | ||||||||||||||||
| EUR | Eni Plenitude SpA SB | ||||||||||||||||
| USD | Eni New Energy US H. Llc | ||||||||||||||||
| EUR | PLT Eng. Spagna SLU | ||||||||||||||||
| EUR | Eni Plen. Op. Fr. SAS | ||||||||||||||||
| COP | PLT Colombia SAS | ||||||||||||||||
| Third parties | |||||||||||||||||
| EUR | Eni Plen. Ren. Lux. Sàrl | ||||||||||||||||
| EUR | Eni Plen. Op. Fr. SAS | ||||||||||||||||
| EUR | Holding Lanas Solar Sàrl | ||||||||||||||||
| EUR | Eni Plen. Ren. Lux. Sàrl | ||||||||||||||||
| EUR | PLT Eng. Spagna SLU | ||||||||||||||||
| EUR | Eni Plen. Ren. Lux. Sàrl | ||||||||||||||||
| EUR | Eni Plen. Ren. Lux. Sàrl | ||||||||||||||||
| EUR | Eni Plen. Ren. Lux. Sàrl | ||||||||||||||||
| COP | PLT Energia Srl | ||||||||||||||||
| Third parties | |||||||||||||||||
| COP | PLT Engineering Srl | ||||||||||||||||
| Third parties | |||||||||||||||||
| RON | PLT Engineering Srl | ||||||||||||||||
| Micropower Srl | |||||||||||||||||
| EUR | PLT Engineering Srl | ||||||||||||||||
| EUR | PLT Energia Srl | ||||||||||||||||
| Third parties |
| (*) F.C. = full consolidation, J.O. = joint operation, Eq. = equity-accounted, Co. = valued at cost, F.V. = valued at fair value. |
| Company name | Registered office | Country of operation | Currency | Share Capital | Shareholders | % Ownership | % Equity ratio | Consolidation or valutation method (*) |
|||||||||
| EUR | Eni Plen. Ren. Lux. Sàrl | ||||||||||||||||
| EUR | PLT Eng. Spagna SLU | ||||||||||||||||
| EUR | Eni Plen. Renew. Hellas | ||||||||||||||||
| EUR | Eni Plen. Renew. Hellas | ||||||||||||||||
| EUR | Eni Plen. Renew. Hellas | ||||||||||||||||
| EUR | Eni Plen. Renew. Hellas | ||||||||||||||||
| EUR | Eni Plen. Renew. Hellas | ||||||||||||||||
| EUR | Eni Plen. Renew. Hellas | ||||||||||||||||
| EUR | Eni Plen. Renew. Hellas | ||||||||||||||||
| EUR | Eni Plen. Renew. Hellas | ||||||||||||||||
| EUR | Eni Plen. Renew. Hellas | ||||||||||||||||
| EUR | Eni Plen. Renew. Hellas | ||||||||||||||||
| EUR | Eni Plen. Renew. Hellas | ||||||||||||||||
| EUR | Eni Plen. Renew. Hellas | ||||||||||||||||
| EUR | Eni Plen. Renew. Hellas | ||||||||||||||||
| EUR | Eni Plen. Renew. Hellas | ||||||||||||||||
| EUR | Eni Plen. Renew. Hellas | ||||||||||||||||
| EUR | Eni Plen. Renew. Hellas | ||||||||||||||||
| EUR | Eni Plen. Renew. Hellas | ||||||||||||||||
| EUR | Eni Plen. Renew. Hellas | ||||||||||||||||
| EUR | Eni Plen. Renew. Hellas | ||||||||||||||||
| EUR | Eni Plen. Renew. Hellas | ||||||||||||||||
| EUR | Eni Plen. Ren. Lux. Sàrl | ||||||||||||||||
| EUR | Eni Plen. Op. Fr. SAS | (a) | |||||||||||||||
| Third parties | |||||||||||||||||
| EUR | Eni Plen. Ren. Lux. Sàrl |
| (*) F.C. = full consolidation, J.O. = joint operation, Eq. = equity-accounted, Co. = valued at cost, F.V. = valued at fair value. | |||||||||||
| (a) Controlling interest: | Eni Plenitude Operations France SAS | 100.00 | |||||||||
|
Power IN ITALY |
| Company name | Registered office | Country of operation | Currency | Share Capital | Shareholders | % Ownership | % Equity ratio | Consolidation or valutation method (*) |
|||||||||
| EUR | EniPower SpA | ||||||||||||||||
| Third parties | |||||||||||||||||
| EUR | Eni SpA | ||||||||||||||||
| Third parties |
| (*) F.C. = full consolidation, J.O. = joint operation, Eq. = equity-accounted, Co. = valued at cost, F.V. = valued at fair value. |
CORPORATE AND OTHER ACTIVITIES
Corporate and financial companies
IN ITALY
| Company name | Registered office | Country of operation | Currency | Share Capital | Shareholders | % Ownership | % Equity ratio | Consolidation or valutation method (*) |
||||||||
| EUR | Eni SpA | |||||||||||||||
| EUR | AGI SpA | |||||||||||||||
| EUR | Eni SpA | |||||||||||||||
| EUR | Eni SpA | |||||||||||||||
| EUR | Eni SpA | |||||||||||||||
| EUR | Eni SpA | |||||||||||||||
| EUR | Eni SpA | |||||||||||||||
| EUR | Eni SpA | |||||||||||||||
| EUR | Eni SpA | |||||||||||||||
| EUR | Eni SpA |
OUTSIDE ITALY
| Company name | Registered office | Country of operation | Currency | Share Capital | Shareholders | % Ownership | % Equity ratio | Consolidation or valutation method (*) |
||||||||
| EUR | Eni International BV | |||||||||||||||
| Eni Oil Holdings BV | ||||||||||||||||
| USD | Eni International BV | |||||||||||||||
| Eni SpA | ||||||||||||||||
| USD | Eni Petroleum Co Inc | |||||||||||||||
| EUR | Eni SpA | |||||||||||||||
| EUR | Eni SpA | |||||||||||||||
| GBP | Eni SpA | |||||||||||||||
| Eni UK Ltd | (..) | |||||||||||||||
| USD | Eni Petroleum Co Inc | |||||||||||||||
| EGP | EniProgetti SpA | |||||||||||||||
| Eni SpA |
Other activities
IN ITALY
| Company name | Registered office | Country of operation | Currency | Share Capital | Shareholders | % Ownership | % Equity ratio | Consolidation or valutation method (*) |
||||||||
| EUR | Eni SpA | |||||||||||||||
| Third parties | (..) | |||||||||||||||
| EUR | Eni Rewind SpA | |||||||||||||||
| Third parties |
OUTSIDE ITALY
| Company name | Registered office | Country of operation | Currency | Share Capital | Shareholders | % Ownership | % Equity ratio | Consolidation or valutation method (*) |
||||||||
| EUR | Eni International BV | |||||||||||||||
| CHF | Eni Rewind SpA |
JOINT ARRANGEMENTS AND ASSOCIATES
EXPLORATION & PRODUCTION
IN ITALY
| Company name | Registered office | Country of operation | Currency | Share Capital | Shareholders | % Ownership | % Equity ratio | Consolidation or valutation method (*) |
||||||||
| EUR | Eni Natural Energies SpA | |||||||||||||||
| Third parties | ||||||||||||||||
| EUR | Azule Energy Hold. Ltd | |||||||||||||||
| EUR | Eni SpA | |||||||||||||||
| Third parties |
OUTSIDE ITALY
| Company name | Registered office | Country of operation | Currency | Share Capital | Shareholders | % Ownership | % Equity ratio | Consolidation or valutation method (*) |
||||||||
| EGP | Ieoc Production BV | |||||||||||||||
| Third parties | ||||||||||||||||
| USD | Azule Energy Hold. Ltd | |||||||||||||||
| EGP | Ieoc Production BV | |||||||||||||||
| Third parties | ||||||||||||||||
| USD | Azule Energy Hold. Ltd | |||||||||||||||
| USD | Eni International BV | |||||||||||||||
| Third parties | ||||||||||||||||
| USD | Eni Energy Russia BV | |||||||||||||||
| Third parties | ||||||||||||||||
| EUR | Angola JVCO Ltd | |||||||||||||||
|
|
USD | Angola JVCO Ltd | ||||||||||||||
| USD | Angola JVCO Ltd | |||||||||||||||
| USD | Azule En. Gas Sup. S. Inc | |||||||||||||||
| MZN | Eni Mozamb. LNG H. BV | |||||||||||||||
| Third parties | ||||||||||||||||
| VED | Eni Venezuela BV | |||||||||||||||
| Third parties | ||||||||||||||||
| VED | Eni Venezuela BV | |||||||||||||||
| Third parties | ||||||||||||||||
| MZN | Eni Mozamb. LNG H. BV | |||||||||||||||
| Third parties |
(*) F.C. = full consolidation, J.O. = joint operation, Eq. = equity-accounted, Co. = valued at cost, F.V. = valued at fair value.
(†) Jointly controlled entity.
OUTSIDE ITALY
| Company name | Registered office | Country of operation | Currency | Share Capital | Shareholders | % Ownership | % Equity ratio | Consolidation or valutation method (*) |
||||||||
|
|
|
AED | Eni Mozamb. LNG H. BV | |||||||||||||
| Third parties | ||||||||||||||||
| EGP | Ieoc Production BV | |||||||||||||||
| Third parties | ||||||||||||||||
| EGP | Ieoc Production BV | |||||||||||||||
| Third parties | ||||||||||||||||
| EGP | Ieoc Production BV | |||||||||||||||
| Third parties | ||||||||||||||||
| EGP | Ieoc Production BV | |||||||||||||||
| Third parties | ||||||||||||||||
| EGP | Ieoc Exploration BV | |||||||||||||||
| Third parties | ||||||||||||||||
|
|
EUR | Azule Energy Hold. Ltd | ||||||||||||||
|
|
EUR | Azule Energy Hold. Ltd | ||||||||||||||
|
|
USD | Eni Energy Russia BV | ||||||||||||||
| Third parties | ||||||||||||||||
|
|
KZT | Eni Isatay | ||||||||||||||
| Third parties | ||||||||||||||||
|
|
EUR | Agip Karachaganak BV | ||||||||||||||
| Third parties | ||||||||||||||||
| KWD | Eni Middle E. Ltd | |||||||||||||||
| Third parties | ||||||||||||||||
| USD | (a) | Eni Oil & Gas Inc | ||||||||||||||
| Third parties | ||||||||||||||||
| EGP | Ieoc Production BV | |||||||||||||||
| Third parties | ||||||||||||||||
| EGP | Ieoc Production BV | |||||||||||||||
| Third parties | ||||||||||||||||
|
|
EUR | Eni North Africa BV | ||||||||||||||
| Third parties | ||||||||||||||||
| EGP | Ieoc Production BV | |||||||||||||||
| Third parties | ||||||||||||||||
|
|
GBP | Eni SpA | ||||||||||||||
| Third parties | ||||||||||||||||
| EGP | Ieoc Exploration BV | |||||||||||||||
| Third parties | ||||||||||||||||
| EGP | Ieoc Production BV | |||||||||||||||
| Third parties | ||||||||||||||||
| EGP | Ieoc Production BV | |||||||||||||||
| Third parties | ||||||||||||||||
| VED | Eni Lasmo Plc | |||||||||||||||
| Third parties | ||||||||||||||||
| VED | Eni Lasmo Plc | |||||||||||||||
| Third parties |
(*) F.C. = full consolidation, J.O. = joint operation, Eq. = equity-accounted, Co. = valued at cost, F.V. = valued at fair value.
(†) Jointly controlled entity.
(a) Shares without nominal value.
| Company name | Registered office | Country of operation | Currency | Share Capital | Shareholders | % Ownership | % Equity ratio | Consolidation or valutation method (*) |
||||||||
| VED | Eni Venezuela BV | |||||||||||||||
| Third parties | ||||||||||||||||
| EGP | Ieoc Production BV | |||||||||||||||
| Third parties | ||||||||||||||||
| EGP | Ieoc Production BV | |||||||||||||||
| Third parties | ||||||||||||||||
| USD | Eni Qatar BV | |||||||||||||||
| Third parties | ||||||||||||||||
| EGP | Ieoc Production BV | |||||||||||||||
| Third parties | ||||||||||||||||
| EGP | Ieoc Production BV | |||||||||||||||
| Third parties | ||||||||||||||||
| USD | Eni Mozamb. LNG H. BV | |||||||||||||||
| Third parties | ||||||||||||||||
| MZN | Eni Mozamb. LNG H. BV | |||||||||||||||
| Third parties | ||||||||||||||||
| EGP | Ieoc Production BV | |||||||||||||||
| Third parties | ||||||||||||||||
|
|
|
XAF | Eni Congo SA | |||||||||||||
| Third parties | ||||||||||||||||
| TND | Eni Tunisia BV | |||||||||||||||
| Third parties | ||||||||||||||||
| TND | Eni Tunisia BV | |||||||||||||||
| Third parties | ||||||||||||||||
| USD | Eni E&P Holding BV | |||||||||||||||
| Third parties | ||||||||||||||||
| EGP | Ieoc Exploration BV | |||||||||||||||
| Third parties | ||||||||||||||||
| USD | Eni International BV | |||||||||||||||
| Third parties | ||||||||||||||||
| NOK | Eni International BV | |||||||||||||||
| Third parties | ||||||||||||||||
| USD | Eni Lasmo Plc | |||||||||||||||
| Third parties | ||||||||||||||||
| USD | Eni Lasmo Plc | |||||||||||||||
| Third parties | ||||||||||||||||
| |
EGP | Ieoc Exploration BV | ||||||||||||||
| Third parties |
(#) Company with shares quoted on regulated market of extra-EU countries.
(†) Jointly controlled entity.
|
F-152 |
IN ITALY
| Company name | Registered office | Country of operation | Currency | Share Capital | Shareholders | % Ownership | % Equity ratio | Consolidation or valutation method (*) |
||||||||
| EUR | Eni Corridor Srl | |||||||||||||||
| Third parties | ||||||||||||||||
| EUR | Eni Corridor Srl | |||||||||||||||
| Third parties |
OUTSIDE ITALY
| Company name | Registered office | Country of operation | Currency | Share Capital | Shareholders | % Ownership | % Equity ratio | Consolidation or valutation method (*) |
||||||||
|
|
USD | Eni International BV | (a) | |||||||||||||
| Third parties | ||||||||||||||||
|
|
USD | Eni Gas Liquef. BV | ||||||||||||||
| Third parties | ||||||||||||||||
|
|
USD | Damietta LNG | ||||||||||||||
| Eni Gas Liquef. BV | ||||||||||||||||
| Third parties | ||||||||||||||||
|
|
EUR | Eni North Africa BV | ||||||||||||||
| Third parties | ||||||||||||||||
|
|
TND | Sergaz SA | ||||||||||||||
| Third parties | ||||||||||||||||
|
|
CHF | Transmed. Pip. Co Ltd | ||||||||||||||
| Eni Corridor Srl | ||||||||||||||||
| Third parties | ||||||||||||||||
|
|
|
TND | Eni International BV | |||||||||||||
| Third parties | ||||||||||||||||
|
|
|
USD | Eni Corridor Srl | |||||||||||||
| Third parties |
(*) F.C. = full consolidation, J.O. = joint operation, Eq. = equity-accounted, Co. = valued at cost, F.V. = valued at fair value.
(†) Jointly controlled entity.
(a) Equity ratio equal to the Eni's working interest.
REFINING & MARKETING AND CHEMICAL
Refining & Marketing
IN ITALY
| Company name | Registered office | Country of operation | Currency | Share Capital | Shareholders | % Ownership | % Equity ratio | Consolidation or valutation method (*) |
||||||||
| EUR | Ecofuel SpA | |||||||||||||||
| Third parties | ||||||||||||||||
| EUR | Ecofuel SpA | |||||||||||||||
| Third parties | ||||||||||||||||
| EUR | Ecofuel SpA | |||||||||||||||
| Third parties | ||||||||||||||||
| EUR | Ecofuel SpA | |||||||||||||||
| Third parties | ||||||||||||||||
| EUR | Ecofuel SpA | |||||||||||||||
| Third parties | ||||||||||||||||
| EUR | Ecofuel SpA | |||||||||||||||
| Third parties | ||||||||||||||||
| EUR | Eni SpA | |||||||||||||||
| Third parties | ||||||||||||||||
| EUR | Eni SpA | |||||||||||||||
| Third parties | ||||||||||||||||
|
|
EUR | Ecofuel SpA | ||||||||||||||
| Third parties | ||||||||||||||||
| EUR | Eni SpA | |||||||||||||||
| Third parties | ||||||||||||||||
| EUR | Eni SpA | |||||||||||||||
| Third parties |
OUTSIDE ITALY
| Company name | Registered office | Country of operation | Currency | Share Capital | Shareholders | % Ownership | % Equity ratio | Consolidation or valutation method (*) |
||||||||
|
|
AED | Eni Abu Dhabi R&T | ||||||||||||||
| Third parties | ||||||||||||||||
|
|
|
USD | Eni Abu Dhabi R&T | |||||||||||||
| Third parties | ||||||||||||||||
| EUR | Eni Deutsch. GmbH | |||||||||||||||
| Third parties | ||||||||||||||||
| EUR | Eni Deutsch. GmbH | |||||||||||||||
| Third parties | ||||||||||||||||
|
|
CHF | Eni Suisse SA | ||||||||||||||
| Third parties | ||||||||||||||||
| EGP | Eni International BV | |||||||||||||||
| Third parties |
(*) F.C. = full consolidation, J.O. = joint operation, Eq. = equity-accounted, Co. = valued at cost, F.V. = valued at fair value.
(†) Jointly controlled entity.
| Company name | Registered office | Country of operation | Currency | Share Capital | Shareholders | % Ownership | % Equity ratio | Consolidation or valutation method (*) |
||||||||
|
|
SGD | Eni International BV | ||||||||||||||
| Third parties | ||||||||||||||||
|
|
EUR | Eni France Sàrl | ||||||||||||||
| Third parties | ||||||||||||||||
| TND | Eni International BV | |||||||||||||||
| Third parties | ||||||||||||||||
| EUR | Eni Sust. Mobility SpA | (a) | ||||||||||||||
| Routex BV | ||||||||||||||||
| Third parties | ||||||||||||||||
| CHF | Eni Suisse SA | |||||||||||||||
| Third parties | ||||||||||||||||
|
|
VED | Ecofuel SpA | (b) | |||||||||||||
| Supermetanol CA | ||||||||||||||||
| Third parties | ||||||||||||||||
|
|
EUR | Eni Marketing A. GmbH | ||||||||||||||
| Third parties | ||||||||||||||||
| EUR | Eni Deutsch. GmbH | |||||||||||||||
| Third parties |
| (*) F.C. = full consolidation, J.O. = joint operation, Eq. = equity-accounted, Co. = valued at cost, F.V. = valued at fair value. | |||||||||||
| (†) Jointly controlled entity. | |||||||||||
| (a) Controlling interest: | Eni Sustainable Mobility SpA | 25.00 | |||||||||
| Third parties | 75.00 | ||||||||||
| (b) Equity ratio equal to the Eni's working interest. | |||||||||||
| F-155 |
Chemical
IN ITALY
| Company name | Registered office | Country of operation | Currency | Share Capital | Shareholders | % Ownership | % Equity ratio | Consolidation or valutation method (*) |
||||||||
| EUR | Versalis SpA | |||||||||||||||
| Eni Rewind SpA | ||||||||||||||||
| EniPower SpA | ||||||||||||||||
| Third parties | ||||||||||||||||
| EUR | Versalis SpA | |||||||||||||||
| Eni Rewind SpA | ||||||||||||||||
| S.E.F. Srl | ||||||||||||||||
| Third parties | ||||||||||||||||
| EUR | Versalis SpA | |||||||||||||||
| Third parties | ||||||||||||||||
| EUR | Versalis SpA | |||||||||||||||
| Third parties | ||||||||||||||||
| EUR | Versalis SpA | |||||||||||||||
| Eni Rewind SpA | ||||||||||||||||
| Third parties | ||||||||||||||||
| EUR | Versalis SpA | |||||||||||||||
| EniPower SpA | ||||||||||||||||
| Ecofuel SpA | ||||||||||||||||
| Third parties | ||||||||||||||||
| |
EUR | Versalis SpA | ||||||||||||||
| Eni Rewind SpA | ||||||||||||||||
| Third parties |
OUTSIDE ITALY
| Company name | Registered office | Country of operation | Currency | Share Capital | Shareholders | % Ownership | % Equity ratio | Consolidation or valutation method (*) |
||||||||
|
|
KRW | Versalis SpA | ||||||||||||||
| Third parties | ||||||||||||||||
|
|
KZT | Versalis International SA | ||||||||||||||
| Third parties | ||||||||||||||||
|
|
AED | Versalis International SA | ||||||||||||||
| Third parties |
(†) Jointly controlled entity.
|
PLENITUDE & POWER Plenitude IN ITALY |
| Company name | Registered office | Country of operation | Currency | Share Capital | Shareholders | % Ownership | % Equity ratio | Consolidation or valutation method (*) |
|||||||||
| EUR | Eni Plenitude SpA SB | ||||||||||||||||
| Third parties | |||||||||||||||||
| EUR | Evolvere Venture SpA | ||||||||||||||||
| Third parties | |||||||||||||||||
| EUR | Evolvere Venture SpA | ||||||||||||||||
| Third parties | |||||||||||||||||
| EUR | Eni Plenitude SpA SB | ||||||||||||||||
| Third parties | |||||||||||||||||
| EUR | Eni Plenitude SpA SB | ||||||||||||||||
| Third parties | |||||||||||||||||
| EUR | Evolvere Venture SpA | ||||||||||||||||
| Third parties | |||||||||||||||||
| EUR | SEF Srl | ||||||||||||||||
| Third parties | |||||||||||||||||
| EUR | Evolvere Venture SpA | ||||||||||||||||
| Third parties |
| OUTSIDE ITALY |
| Company name | Registered office | Country of operation | Currency | Share Capital | Shareholders | % Ownership | % Equity ratio | Consolidation or valutationbmethod(*) | |||||||||
| USD | Eni New Energy US Inc | ||||||||||||||||
| Third parties | |||||||||||||||||
| EUR | Eni Plen. Op. Fr. SAS | ||||||||||||||||
| Third parties | |||||||||||||||||
| EUR | Eni G&P France SA | ||||||||||||||||
| Third parties | |||||||||||||||||
| EUR | Eni Plenitude SpA SB | ||||||||||||||||
| Third parties | |||||||||||||||||
| USD | Eni New Energy US Inc | ||||||||||||||||
| Third parties | |||||||||||||||||
| USD | Eni New Energy US Inc | ||||||||||||||||
| Third parties | |||||||||||||||||
| PLN | Eni En. Solutions BV | ||||||||||||||||
| Third parties | |||||||||||||||||
| NOK | Eni En. Solutions BV | ||||||||||||||||
| Third parties |
| (*) F.C. = full consolidation, J.O. = joint operation, Eq. = equity-accounted, Co. = valued at cost, F.V. = valued at fair value. | |||||||||||
| (†) Jointly controlled entity. | |||||||||||
| F-157 |
|
Power IN ITALY |
| Company name | Registered office | Country of operation | Currency | Share Capital | Shareholders | % Ownership | % Equity ratio | Consolidation or valutation method (*) |
|||||||||
| EUR | EniPower SpA | ||||||||||||||||
| Third parties |
|
|
CORPORATE AND OTHER ACTIVITIES Corporate and financial companies IN ITALY |
| Company name | Registered office | Country of operation | Currency | Share Capital | Shareholders | % Ownership | % Equity ratio | Consolidation or valutation method (*) |
|||||||||
| EUR | |
Eni SpA | |||||||||||||||
| Third parties | |||||||||||||||||
| EUR | |
Eni SpA | (a) | ||||||||||||||
| Saipem SpA | |||||||||||||||||
| Third parties |
| (*) F.C. = full consolidation, J.O. = joint operation, Eq. = equity-accounted, Co. = valued at cost, F.V. = valued at fair value. | |||||||||||
| (†) Jointly controlled entity. | |||||||||||
| (a) Controlling interest: | Eni SpA | 31.20 | |||||||||
| Third parties | 68.80 | ||||||||||
| F-158 |
| OUTSIDE ITALY |
| Company name | Registered office | Country of operation | Currency | Share Capital | Shareholders | % Ownership | % Equity ratio | Consolidation or valutation method (*) |
|||||||||
| USD | Eni Next Llc | ||||||||||||||||
| Third parties | |||||||||||||||||
| USD | Eni Next Llc | ||||||||||||||||
| Third parties | |||||||||||||||||
|
GBP
|
Eni Next Llc | ||||||||||||||||
| Third parties | |||||||||||||||||
| USD | Eni Next Llc | ||||||||||||||||
| Third parties | |||||||||||||||||
| USD | Eni Next Llc | ||||||||||||||||
| Third parties | |||||||||||||||||
| USD | Eni Next Llc | ||||||||||||||||
| Third parties | |||||||||||||||||
| USD | Eni Next Llc | ||||||||||||||||
| Third parties | |||||||||||||||||
| KZT | EniProgetti SpA | ||||||||||||||||
| Third parties | |||||||||||||||||
| USD | Eni Next Llc | ||||||||||||||||
| Third parties |
| Other activities |
| IN ITALY |
| Company name | Registered office | Country of operation | Currency | Share Capital | Shareholders | % Ownership | % Equity ratio | Consolidation or valutation method(*) | |||||||||
| EUR | |
Eni Rewind SpA | |||||||||||||||
| Third parties | |||||||||||||||||
| EUR | |
Eni Rewind SpA | |||||||||||||||
| Third parties |
| (*) F.C. = full consolidation, J.O. = joint operation, Eq. = equity-accounted, Co. = valued at cost, F.V. = valued at fair value. | |||||||||||
| (#) Company with shares quoted on regulated market of Italy or of other EU countries. | |||||||||||
| (b) The information relating to the share capital refers to ordinary shares. | |||||||||||
| F-159 |
|
OTHER SIGNIFICANT INVESTMENTS EXPLORATION & PRODUCTION |
|
IN ITALY |
| Company name | Registered office | Country of operation | Currency | Share Capital | Shareholders | % Ownership | Consolidation or valutation method (*) |
||||||||
| EUR | Eni Natural Energies SpA | ||||||||||||||
| Third parties | |||||||||||||||
| EUR | Eni SpA | ||||||||||||||
| Third parties |
| OUTSIDE ITALY |
| Company name | Registered office | Country of operation | Currency | Share Capital | Shareholders | % Ownership | Consolidation or valutation method (*) |
||||||||
| VED | Eni Venezuela BV | ||||||||||||||
| Third parties | |||||||||||||||
| USD | Eni Int. NA NV Sàrl | ||||||||||||||
| Third parties | |||||||||||||||
| AUD | Eni G&P LNG Aus. BV | ||||||||||||||
| Third parties | |||||||||||||||
| USD | (a) | Eni Oil & Gas Inc | |||||||||||||
| Third parties | |||||||||||||||
| USD | Eni Int. NA NV Sàrl | ||||||||||||||
| Third parties | |||||||||||||||
| EUR | Agip Caspian Sea BV | ||||||||||||||
| Third parties | |||||||||||||||
| VED | Eni Venezuela BV | ||||||||||||||
| Third parties | |||||||||||||||
| EGP | Ieoc Production BV | ||||||||||||||
| Third parties |
| (*) F.C. = full consolidation, J.O. = joint operation, Eq. = equity-accounted, Co. = valued at cost, F.V. = valued at fair value. | |||||||||||
| (#) Company with shares quoted on regulated market of Italy or of other EU countries. | |||||||||||
| (a) Shares without nominal value. | |||||||||||
| F-160 |
|
GLOBAL GAS & LNG PORTFOLIO |
|
OUTSIDE ITALY |
| Company name | Registered office | Country of operation | Currency | Share Capital | Shareholders | % Ownership | Consolidation or valutation method (*) |
||||||||
| EUR | Eni International BV | ||||||||||||||
| Third parties |
| (*) F.C. = full consolidation, J.O. = joint operation, Eq. = equity-accounted, Co. = valued at cost, F.V. = valued at fair value. |
| F-161 |
|
REFINING & MARKETING AND CHEMICAL |
|
Refining & Marketing OUTSIDE ITALY |
| Company name | Registered office | Country of operation | Currency | Share Capital | Shareholders | % Ownership | Consolidation or valutation method (*) |
||||||||
| EUR | Eni Deutsch. GmbH | ||||||||||||||
| Third parties | |||||||||||||||
| USD | Eni Ecuador SA | ||||||||||||||
| Third parties | |||||||||||||||
| EUR | Eni France Sàrl | ||||||||||||||
| Third parties | |||||||||||||||
| EUR | Eni France Sàrl | ||||||||||||||
| Third parties | |||||||||||||||
| GBP | (a) | Eni SpA | |||||||||||||
| Third parties | |||||||||||||||
| SAR | Ecofuel SpA | ||||||||||||||
| Third parties | |||||||||||||||
| EUR | Eni France Sàrl | ||||||||||||||
| Third parties | |||||||||||||||
| EUR | Eni Iberia SLU | ||||||||||||||
| Third parties | |||||||||||||||
| EUR | Eni Deutsch. GmbH | ||||||||||||||
| Third parties | |||||||||||||||
| CHF | Eni Suisse SA | ||||||||||||||
| Third parties | |||||||||||||||
| GHS | Eni International BV | ||||||||||||||
| Third parties |
| (*) F.C. = full consolidation, J.O. = joint operation, Eq. = equity-accounted, Co. = valued at cost, F.V. = valued at fair value. | |||||||||||
| (a) Shares without nominal value. | |||||||||||
| F-162 |
|
CORPORATE AND OTHER ACTIVITIES |
|
Corporate and financial companies OUTSIDE ITALY |
| Company name | Registered office | Country of operation | Currency | Share Capital | Shareholders | % Ownership | Consolidation or valutation method (*) |
||||||||
| GBP | Eni International BV | ||||||||||||||
| Third parties |
| Other activities IN ITALY |
| Company name | Registered office | Country of operation | Currency | Share Capital | Shareholders | % Ownership | Consolidation or valutation method (*) |
||||||||
| EUR | |
Eni Rewind SpA | |||||||||||||
| Third parties |
| (*) F.C. = full consolidation, J.O. = joint operation, Eq. = equity-accounted, Co. = valued at cost, F.V. = valued at fair value. | |||||||||||
| (#) Company with shares quoted on regulated market of extra-EU countries. | |||||||||||
The following section provides information about economic, equity and financial data, gross of intragroup elisions, relating to the EniPower group
| 2022 | |||
| (€ million) | EniPower Group | ||
| Non controlling interest (%) | |||
| Current assets | |||
| Non-current assets | |||
| Current liabilities | |||
| Non-current liabilities | |||
| Revenues | |||
| Profit | |||
| Total comprehensive income | |||
| Net cash provided by operating activities | |||
| Net cash used in investing activities | ( |
) | |
| Net cash used in financing activities | ( |
) | |
| Net increase (decrease) in cash and cash equivalents | ( |
) | |
| Profit attributable to non-controlling interest | |||
| Dividends paid to minority interest |
Equity pertaining to non-controlling interests as of December 31, 2022, amounted to €
Changes in the ownership interest without loss of control
In 2022,
In 2021 Eni did not report any changes in ownership interest without loss or acquisition of control.
Principal joint ventures, joint operations and associates as of December 31, 2022
| Company name | Registered office | Country of operation | Segment | % ownership | % equity ratio | ||||||
| Joint venture | |||||||||||
| Joint Operation | |||||||||||
|
|
|||||||||||
| Associates | |||||||||||
Main line items of profit and loss and balance sheet related to the principal joint ventures, represented by the amounts included in the reports accounted under IFRS of each company, are provided in the table below:
| 2022 | |||||||||||
| (€ million) | Azule Energy Holdings Ltd | Cardón IV SA | Saipem SpA | Other joint ventures |
|||||||
| Current assets | |||||||||||
| - of which cash and cash equivalent | |||||||||||
| Non-current assets | |||||||||||
| Total assets | |||||||||||
| Current liabilities | |||||||||||
| - current financial liabilities | |
||||||||||
| Non-current liabilities | |||||||||||
| - non-current financial liabilities | |||||||||||
| Total liabilities | |||||||||||
| Net equity | |||||||||||
| Eni’s % of the investment | |||||||||||
| Book value of the investment | |||||||||||
| Revenues and other income | |||||||||||
| Operating expense | ( |
) | ( |
) | ( |
) | ( |
) | |||
| Other operating profit (loss) | |||||||||||
| Depreciation, amortization and impairments | ( |
) | ( |
) | ( |
) | ( |
) | |||
| Operating profit (loss) | ( |
) | |||||||||
| Finance income (expense) | ( |
) | ( |
) | ( |
) | |||||
| Income (expense) from investments | ( |
) | ( |
) | |||||||
| Profit (loss) before income taxes | ( |
) | ( |
) | |||||||
| Income taxes | ( |
) | ( |
) | ( |
) | |||||
| Profit (loss) - discontinued operations | |||||||||||
| Profit (loss) | ( |
) | ( |
) | |||||||
| Other comprehensive income (loss) | ( |
) | |||||||||
| Total other comprehensive income (loss) | ( |
) | ( |
) | |||||||
| Profit (loss) attributable to Eni | ( |
) | |||||||||
| Dividends received from the joint venture |
The results for the year and the comprehensive income of the significant joint ventures are shown below:
| 2022 |
|||||
| (€ million) | Mozambique Rovuma Venture SpA | Vårgrønn AS | |||
| Profit (loss) | ( |
) | ( |
) | |
| Other comprehensive income (loss) | ( |
) | |||
| Total other comprehensive income (loss) | ( |
) | ( |
) | |
| F-166 |
|
2021 |
|||||||||||
| (€ million) | Cardón IV SA |
Saipem SpA |
Vår Energi AS | Other joint ventures |
|||||||
| Current assets | |||||||||||
| - of which cash and cash equivalent | |||||||||||
| Non-current assets | |||||||||||
| Total assets | |||||||||||
| Current liabilities | |||||||||||
| - current financial liabilities | |||||||||||
| Non-current liabilities | |||||||||||
| - non-current financial liabilities | |||||||||||
| Total liabilities | |||||||||||
| Net equity | |||||||||||
| Eni’s % of the investment | |||||||||||
| Book value of the investment | |||||||||||
| Revenues and other income | |||||||||||
| Operating expense | ( |
) | ( |
) | ( |
) | ( |
) | |||
| Other operating profit (loss) | ( |
) | |||||||||
| Depreciation, amortization and impairments | ( |
) | ( |
) | ( |
) | ( |
) | |||
| Operating profit (loss) | ( |
) | ( |
) | |||||||
| Finance income (expense) | ( |
) | ( |
) | ( |
) | ( |
) | |||
| Income (expense) from investments | |||||||||||
| Profit (loss) before income taxes | ( |
) | ( |
) | ( |
) | |||||
| Income taxes | ( |
) | ( |
) | ( |
) | ( |
) | |||
| Profit (loss) | ( |
) | ( |
) | ( |
) | |||||
| Other comprehensive income (loss) | ( |
) | |||||||||
| Total other comprehensive income (loss) | ( |
) | ( |
) | ( |
) | |||||
| Profit (loss) attributable to Eni | ( |
) | ( |
) | ( |
) | |||||
| Dividends received from the joint venture |
| 2021 |
|||||
| (€ million) | Doggerbank Offshore Wind Farm Project 1 Holdco Ltd | Doggerbank Offshore Wind Farm Project 2 Holdco Ltd | |||
| Profit (loss) | ( |
) | ( |
) | |
| Other comprehensive income (loss) | ( |
) | |||
| Total other comprehensive income (loss) | ( |
) | |||
| F-167 |
Main line items of profit and loss and balance sheet related to the principal associates represented by the amounts included in the reports accounted under IFRS of each company are provided in the table below:
| 2022 | |||||||||||
| (€ million) | Abu Dhabi Oil Refining Company (TAKREER) | Vår Energi ASA | Coral FLNG SA | Other associates |
|||||||
| Current assets | |||||||||||
| - of which cash and cash equivalent | |||||||||||
| Non-current assets | |||||||||||
| Total assets | |||||||||||
| Current liabilities | |||||||||||
| - current financial liabilities | |||||||||||
| Non-current liabilities | |||||||||||
| - non-current financial liabilities | |||||||||||
| Total liabilities | |||||||||||
| Net equity | |||||||||||
| Eni’s % of the investment | |||||||||||
| Book value of the investment | |||||||||||
| Revenues and other income | |||||||||||
| Operating expense | ( |
) | ( |
) | ( |
) | ( |
) | |||
| Other operating income (expense) | ( |
) | ( |
) | |||||||
| Depreciation, amortization and impairments | ( |
) | ( |
) | ( |
) | ( |
) | |||
| Operating profit (loss) | |||||||||||
| Finance income (expense) | ( |
) | ( |
) | ( |
) | |||||
| Income (expense) from investments | |||||||||||
| Profit (loss) before income taxes | |||||||||||
| Income taxes | ( |
) | ( |
) | |||||||
| Profit (loss) | |||||||||||
| Other comprehensive income (loss) | ( |
) | ( |
) | |||||||
| Total other comprehensive income (loss) | |||||||||||
| Profit (loss) attributable to Eni | |||||||||||
| Dividends received from the joint venture |
The results for the year and the comprehensive income of the significant associates are shown below:
| 2022 | ||||||||
| (€ million) | Qatar Liquefied Gas Company Limited (9) | Novamont SpA | ADNOC Global Trading Ltd | |||||
| Profit (loss) | ( |
) | ||||||
| Other comprehensive income (loss) | ( |
) | ( |
) | ||||
| Total other comprehensive income (loss) | ( |
) | ( |
) | ||||
| F-168 |
| 2021 | |||||||||||
| (€ million) | Abu Dhabi Oil Refining Company (TAKREER) | Angola LNG Ltd | Coral FLNG SA |
Other associates |
|||||||
| Current assets | |||||||||||
| - of which cash and cash equivalent | |||||||||||
| Non-current assets | |||||||||||
| Total assets | |||||||||||
| Current liabilities | |||||||||||
| - current financial liabilities | |||||||||||
| Non-current liabilities | |||||||||||
| - non-current financial liabilities | |||||||||||
| Total liabilities | |||||||||||
| Net equity | |||||||||||
| Eni’s % of the investment | |||||||||||
| Book value of the investment | |||||||||||
| Revenues and other income | |||||||||||
| Operating expense | ( |
) | ( |
) | ( |
) | |||||
| Other operating income (expense) | ( |
) | |||||||||
| Depreciation, amortization and impairments | ( |
) | ( |
) | |||||||
| Operating profit (loss) | ( |
) | |||||||||
| Finance income (expense) | ( |
) | ( |
) | ( |
) | |||||
| Income (expense) from investments | |||||||||||
| Profit (loss) before income taxes | ( |
) | |||||||||
| Income taxes | ( |
) | |||||||||
| Profit (loss) | ( |
) | |||||||||
| Other comprehensive income (loss) | |||||||||||
| Total other comprehensive income (loss) | ( |
) | |||||||||
| Profit (loss) attributable to Eni | ( |
) | |||||||||
| Dividends received from the joint venture |
38 Significant non-recurring events and operations
In 2022, in 2021 and 2020, Eni did not report any non-recurring events and operations.
39 Positions or transactions deriving from atypical and/or unusual operations
In 2022, in 2021 and 2020, no transactions deriving from atypical and/or unusual operations were reported.
40 Subsequent events
Extraordinary solidarity contributions levied in 2022 on energy companies are disclosed in note 33 – Income taxes.
Apart from being a systemic risk, the Russia-Ukraine war does not pose specific risks to the Company going forward in addition to what has been already disclosed in these notes.
On March 28, 2023, the so-called Law Decree “Energy” was approved by the Italian Government, which has established a change to the taxable income for the purpose of determining the solidarity contribution enacted by Law 197/2022 (the Italian 2023 Budget Law), to partially exclude the effects related to the utilization of the revaluations reserves of the parent company. This change will determine a reduction in the amount of the levy accrued in the 2022 consolidated financial statements, which will be recognized in the 2023 accounts for an amount which is currently being determined.
Supplemental oil and gas information (unaudited)
The following information prepared in accordance with “International Financial Reporting Standards” (IFRS) is presented based on the disclosure rules of the FASB Extractive Activities - Oil and Gas (Topic 932). Amounts related to minority interests are immaterial.
Capitalized costs
Capitalized costs represent the total expenditures for proved and unproved mineral properties and related support equipment and facilities utilized in oil and gas exploration and production activities, together with related accumulated depreciation, depletion and amortization.
Capitalized costs by geographical area consist of the following:
|
(€ million) |
|
|
|
|
|
|
|
|
|
|
|||||||||
|
2022 |
Italy |
Rest of Europe |
North |
Egypt |
Sub - Saharan Africa |
Kazakhstan |
Rest |
America |
Australia and Oceania |
Total |
|||||||||
|
Consolidated subsidiaries |
|
|
|
|
|
|
|
|
|
|
|||||||||
|
Proved property |
18,687 |
6,629 |
17,490 |
22,969 |
29,784 |
13,705 |
12,846 |
19,192 |
1,480 |
142,782 |
|||||||||
|
Unproved property |
22 |
330 |
613 |
44 |
2,411 |
7 |
1,462 |
931 |
204 |
6,024 |
|||||||||
|
Support equipment and facilities |
309 |
24 |
1,645 |
270 |
1,128 |
132 |
13 |
24 |
12 |
3,557 |
|||||||||
|
Incomplete wells and other |
767 |
237 |
1,282 |
543 |
1,970 |
936 |
1,457 |
379 |
115 |
7,686 |
|||||||||
|
Gross Capitalized Costs |
19,785 |
7,220 |
21,030 |
23,826 |
35,293 |
14,780 |
15,778 |
20,526 |
1,811 |
160,049 |
|||||||||
|
Accumulated depreciation, depletion and amortization |
(15,677) |
(6,214) |
(15,949) |
(16,212) |
(25,024) |
(4,147) |
(10,133) |
(15,341) |
(1,001) |
(109,698) |
|||||||||
|
Net Capitalized Costs consolidated subsidiaries (a) |
4,108 |
1,006 |
5,081 |
7,614 |
10,269 |
10,633 |
5,645 |
5,185 |
810 |
50,351 |
|||||||||
|
Equity-accounted entities |
|
|
|
|
|
|
|
|
|
|
|||||||||
|
Proved property |
|
7,387 |
118 |
|
27,959 |
|
287 |
2,100 |
|
37,851 |
|||||||||
|
Unproved property |
|
996 |
|
|
91 |
|
|
|
|
1,087 |
|||||||||
|
Support equipment and facilities |
|
31 |
8 |
|
262 |
|
|
8 |
|
309 |
|||||||||
|
Incomplete wells and other |
|
3,872 |
9 |
|
1,530 |
|
48 |
241 |
|
5,700 |
|||||||||
|
Gross Capitalized Costs |
|
12,286 |
135 |
|
29,842 |
|
335 |
2,349 |
|
44,947 |
|||||||||
|
Accumulated depreciation, depletion and amortization |
|
(3,492) |
(68) |
|
(20,280) |
|
|
(1,466) |
|
(25,306) |
|||||||||
|
Net Capitalized Costs equity-accounted entities (a) (b) |
|
8,794 |
67 |
|
9,562 |
|
335 |
883 |
|
19,641 |
|
2021 |
|
|
|
|
|
|
|
|
|
|
|||||||||
|
Consolidated subsidiaries |
|
|
|
|
|
|
|
|
|
|
|||||||||
|
Proved property |
18,644 |
6,953 |
16,218 |
21,125 |
43,947 |
12,606 |
12,947 |
16,407 |
1,413 |
150,260 |
|||||||||
|
Unproved property |
20 |
322 |
492 |
34 |
2,306 |
11 |
1,518 |
878 |
193 |
5,774 |
|||||||||
|
Support equipment and facilities |
308 |
22 |
1,552 |
248 |
1,342 |
121 |
38 |
21 |
12 |
3,664 |
|||||||||
|
Incomplete wells and other |
735 |
133 |
1,293 |
237 |
1,562 |
958 |
1,073 |
719 |
53 |
6,763 |
|||||||||
|
Gross Capitalized Costs |
19,707 |
7,430 |
19,555 |
21,644 |
49,157 |
13,696 |
15,576 |
18,025 |
1,671 |
166,461 |
|||||||||
|
Accumulated depreciation, depletion and amortization |
(15,506) |
(6,194) |
(14,244) |
(14,209) |
(36,317) |
(3,514) |
(10,443) |
(13,874) |
(902) |
(115,203) |
|||||||||
|
Net Capitalized Costs consolidated subsidiaries (a) |
4,201 |
1,236 |
5,311 |
7,435 |
12,840 |
10,182 |
5,133 |
4,151 |
769 |
51,258 |
|||||||||
|
Equity-accounted entities |
|
|
|
|
|
|
|
|
|
|
|||||||||
|
Proved property |
|
11,483 |
128 |
|
1,517 |
|
|
1,987 |
|
15,115 |
|||||||||
|
Unproved property |
|
2,235 |
|
|
|
|
12 |
|
|
2,247 |
|||||||||
|
Support equipment and facilities |
|
36 |
8 |
|
3 |
|
|
7 |
|
54 |
|||||||||
|
Incomplete wells and other |
|
3,179 |
9 |
|
1,323 |
|
|
227 |
|
4,738 |
|||||||||
|
Gross Capitalized Costs |
|
16,933 |
145 |
|
2,843 |
|
12 |
2,221 |
|
22,154 |
|||||||||
|
Accumulated depreciation, depletion and amortization |
|
(7,387) |
(63) |
|
(313) |
|
|
(1,324) |
|
(9,087) |
|||||||||
|
Net Capitalized Costs equity-accounted entities (a) |
|
9,546 |
82 |
|
2,530 |
|
12 |
897 |
|
13,067 |
|
|
|
|||
|
(a) The amounts include net capitalized financial charges totalling €725 million in 2022 and €767 million in 2021 for the consolidates subsidiaries and €565 million in 2022 and €360 million in 2021 for equity-accounted entities. |
||||
|
(b) Includes allocation at fair value of the assets of Azule Energy Holdings Ltd |
||||
Costs incurred
Costs incurred represent amounts both capitalized and expensed in connection with oil and gas producing activities. Costs incurred by geographical area consist of the following:
|
(€ million) |
|
|
|
|
|
|
|
|
|
|
|||||||||
|
2022 |
Italy |
Rest of Europe |
North |
Egypt |
Sub - Saharan Africa |
Kazakhstan |
Rest |
America |
Australia and Oceania |
Total |
|||||||||
|
Consolidated subsidiaries |
|
|
|
|
|
|
|
|
|
|
|||||||||
|
Proved property acquisitions |
4 |
|
51 |
|
|
|
|
82 |
|
137 |
|||||||||
|
Unproved property acquisitions |
2 |
|
111 |
|
11 |
|
|
|
|
124 |
|||||||||
|
Exploration |
12 |
101 |
68 |
179 |
295 |
4 |
253 |
26 |
1 |
939 |
|||||||||
|
Development (a) |
216 |
(129) |
343 |
795 |
1,458 |
277 |
835 |
1,292 |
117 |
5,204 |
|||||||||
|
Total costs incurred consolidated subsidiaries |
234 |
(28) |
573 |
974 |
1,764 |
281 |
1,088 |
1,400 |
118 |
6,404 |
|||||||||
|
Equity-accounted entities |
|
|
|
|
|
|
|
|
|
|
|||||||||
|
Proved property acquisitions |
|
|
|
|
|
|
291 |
|
|
291 |
|||||||||
|
Unproved property acquisitions |
|
|
|
|
|
|
|
|
|
|
|||||||||
|
Exploration |
|
73 |
|
|
13 |
|
|
|
|
86 |
|||||||||
|
Development (b) |
|
1,690 |
(8) |
|
125 |
|
49 |
(9) |
|
1,847 |
|||||||||
|
Total costs incurred equity-accounted entities |
|
1,763 |
(8) |
|
138 |
|
340 |
(9) |
|
2,224 |
|
2021 |
|
|
|
|
|
|
|
|
|
|
|||||||||
|
Consolidated subsidiaries |
|
|
|
|
|
|
|
|
|
|
|||||||||
|
Proved property acquisitions |
|
|
|
|
|
|
|
8 |
|
8 |
|||||||||
|
Unproved property acquisitions |
|
|
6 |
|
|
|
|
3 |
|
9 |
|||||||||
|
Exploration |
16 |
96 |
33 |
57 |
136 |
3 |
188 |
83 |
1 |
613 |
|||||||||
|
Development (a) |
182 |
|
497 |
452 |
842 |
185 |
785 |
657 |
27 |
3,627 |
|||||||||
|
Total costs incurred consolidated subsidiaries |
198 |
96 |
536 |
509 |
978 |
188 |
973 |
751 |
28 |
4,257 |
|||||||||
|
Equity-accounted entities |
|
|
|
|
|
|
|
|
|
|
|||||||||
|
Proved property acquisitions |
|
|
|
|
|
|
|
|
|
|
|||||||||
|
Unproved property acquisitions |
|
|
|
|
|
|
|
|
|
|
|||||||||
|
Exploration |
|
92 |
|
|
|
|
|
|
|
92 |
|||||||||
|
Development (b) |
|
936 |
59 |
|
4 |
|
|
2 |
|
1,001 |
|||||||||
|
Total costs incurred equity-accounted entities |
|
1,028 |
59 |
|
4 |
|
|
2 |
|
1,093 |
|
2020 |
|
|
|
|
|
|
|
|
|
|
|||||||||
|
Consolidated subsidiaries |
|
|
|
|
|
|
|
|
|
|
|||||||||
|
Proved property acquisitions |
|
|
|
|
|
|
|
|
|
|
|||||||||
|
Unproved property acquisitions |
|
|
55 |
2 |
|
|
|
|
|
57 |
|||||||||
|
Exploration |
19 |
20 |
69 |
67 |
61 |
7 |
176 |
63 |
1 |
483 |
|||||||||
|
Development (a) |
472 |
235 |
278 |
422 |
620 |
196 |
1,024 |
437 |
10 |
3,694 |
|||||||||
|
Total costs incurred consolidated subsidiaries |
491 |
255 |
402 |
491 |
681 |
203 |
1,200 |
500 |
11 |
4,234 |
|||||||||
|
Equity-accounted entities |
|
|
|
|
|
|
|
|
|
|
|||||||||
|
Proved property acquisitions |
|
|
|
|
|
|
|
|
|
|
|||||||||
|
Unproved property acquisitions |
|
|
|
|
|
|
|
|
|
|
|||||||||
|
Exploration |
|
47 |
|
|
|
|
|
|
|
47 |
|||||||||
|
Development (b) |
|
1,481 |
3 |
|
6 |
|
|
14 |
|
1,504 |
|||||||||
|
Total costs incurred equity-accounted entities |
|
1,528 |
3 |
|
6 |
|
|
14 |
|
1,551 |
|
|
|
|
||
|
(a) Includes the abandonment decrease of the assets for €307 million in 2022, costs €62 million in 2021 and costs €516 million in 2020. |
||||
|
(b) Includes the abandonment decrease of the assets for €111 million in 2022, decrease for €464 million in 2021 and costs for €424 million in 2020. |
||||
Results of operations from oil and gas producing activities
Results of operations from oil and gas producing activities represent only those revenues and expenses directly associated with such activities, including operating overheads. These amounts do not include any allocation of interest expenses or general corporate overheads and, therefore, are not necessarily indicative of the contributions to consolidated net earnings of Eni. Related income taxes are calculated by applying the local income tax rates to the pre-tax income from production activities. Eni is party to certain Production Sharing Agreements (PSAs), whereby a portion of Eni’s share of oil and gas production is withheld and sold by its joint venture partners which are state owned entities, with proceeds being remitted to the state to fulfil Eni’s PSA related tax liabilities. Revenue and income taxes include such taxes owed by Eni but paid by state-owned entities out of Eni’s share of oil and gas production. Results of operations from oil and gas producing activities by geographical area consist of the following:
| (€ million) | |||||||||||||||||||
| 2022 | Italy | Rest of Europe | North | Egypt | Sub - Saharan Africa | Kazakhstan | Rest | America | Australia and Oceania | Total | |||||||||
| Africa | of Asia | ||||||||||||||||||
| Consolidated subsidiaries | |||||||||||||||||||
| Revenues: | |||||||||||||||||||
| - sales to consolidated entities | 1,952 | 1,854 | 2,095 | 4,434 | 1,602 | 2,982 | 1,683 | 3 | 16,605 | ||||||||||
| - sales to third parties | 329 | 23 | 3,946 | 4,897 | 1,216 | 1,001 | 837 | 307 | 72 | 12,628 | |||||||||
| Total revenues | 2,281 | 1,877 | 6,041 | 4,897 | 5,650 | 2,603 | 3,819 | 1,990 | 75 | 29,233 | |||||||||
| Production costs | (387) | (189) | (486) | (484) | (871) | (241) | (326) | (410) | (21) | (3,415) | |||||||||
| Transportation costs | (3) | (42) | (50) | (5) | (29) | (147) | (3) | (16) | (295) | ||||||||||
| Production taxes | (286) | (330) | (478) | (421) | (63) | (1,578) | |||||||||||||
| Exploration expenses | (11) | (25) | (162) | (106) | (150) | (6) | (123) | (21) | (1) | (605) | |||||||||
| D.D. & A. and Provision for abandonment (a) | (449) | (158) | (839) | (1,156) | (1,488) | (434) | (727) | (707) | (90) | (6,048) | |||||||||
| Other income (expenses) | (1,987) | (98) | 1,955 | (378) | (196) | (127) | (292) | 2 | (4) | (1,125) | |||||||||
| Pretax income from producing activities | (842) | 1,365 | 6,129 | 2,768 | 2,438 | 1,648 | 1,927 | 775 | (41) | 16,167 | |||||||||
| Income taxes | 337 | (665) | (2,740) | (1,192) | (979) | (524) | (1,457) | (41) | 47 | (7,214) | |||||||||
| Results of operations from E&P activities of consolidated subsidiaries | (505) | 700 | 3,389 | 1,576 | 1,459 | 1,124 | 470 | 734 | 6 | 8,953 | |||||||||
| Equity-accounted entities | |||||||||||||||||||
| Revenues: | |||||||||||||||||||
| - sales to consolidated entities | 2,937 | 572 | 3,509 | ||||||||||||||||
| - sales to third parties | 3,039 | 14 | 1,327 | 533 | 4,913 | ||||||||||||||
| Total revenues | 5,976 | 14 | 1,899 | 533 | 8,422 | ||||||||||||||
| Production costs | (567) | (6) | (244) | (24) | (841) | ||||||||||||||
| Transportation costs | (131) | (1) | (9) | (141) | |||||||||||||||
| Production taxes | (2) | (15) | (123) | (140) | |||||||||||||||
| Exploration expenses | (44) | (7) | (13) | (64) | |||||||||||||||
| D.D. & A. and Provision for abandonment | (1,121) | (6) | (628) | (1) | (63) | (1,819) | |||||||||||||
| Other income (expenses) | (64) | (271) | 1 | (234) | (568) | ||||||||||||||
| Pretax income from producing activities | 4,049 | (1) | 725 | (13) | 89 | 4,849 | |||||||||||||
| Income taxes | (3,076) | 3 | (21) | (105) | (3,199) | ||||||||||||||
| Results of operations from E&P activities of equity-accounted entities | 973 | 2 | 704 | (13) | (16) | 1,650 |
| (a) Includes asset net impairment amounting to €279 million. |
||||||||||||||||||||
| 2021 | Italy | Rest of Europe | North | Egypt | Sub - Saharan Africa | Kazakhstan | Rest | America | Australia and Oceania | Total | |||||||||
| Africa | of Asia | ||||||||||||||||||
| Consolidated subsidiaries | |||||||||||||||||||
| Revenues: | |||||||||||||||||||
| - sales to consolidated entities | 1,680 | 790 | 1,133 | 3,782 | 1,391 | 2,020 | 734 | 4 | 11,534 | ||||||||||
| - sales to third parties | 36 | 2,602 | 3,637 | 930 | 704 | 380 | 351 | 108 | 8,748 | ||||||||||
| Total revenues | 1,680 | 826 | 3,735 | 3,637 | 4,712 | 2,095 | 2,400 | 1,085 | 112 | 20,282 | |||||||||
| Production costs | (326) | (147) | (581) | (399) | (816) | (211) | (251) | (288) | (17) | (3,036) | |||||||||
| Transportation costs | (4) | (35) | (45) | (10) | (20) | (150) | (5) | (11) | (280) | ||||||||||
| Production taxes | (128) | (192) | (379) | (230) | (28) | (957) | |||||||||||||
| Exploration expenses | (16) | (72) | (27) | (47) | (238) | (1) | (135) | (21) | (1) | (558) | |||||||||
| D.D. & A. and Provision for abandonment (a) | (31) | (196) | (357) | (990) | (1,468) | (431) | (665) | (243) | (69) | (4,450) | |||||||||
| Other income (expenses) | (395) | 11 | 557 | (310) | (330) | (120) | (173) | (132) | (2) | (894) | |||||||||
| Pretax income from producing activities | 780 | 387 | 3,090 | 1,881 | 1,461 | 1,182 | 941 | 362 | 23 | 10,107 | |||||||||
| Income taxes | (198) | (156) | (1,450) | (848) | (708) | (394) | (739) | (17) | (15) | (4,525) | |||||||||
| Results of operations from E&P activities of consolidated subsidiaries | 582 | 231 | 1,640 | 1,033 | 753 | 788 | 202 | 345 | 8 | 5,582 | |||||||||
| Equity-accounted entities | |||||||||||||||||||
| Revenues: | |||||||||||||||||||
| - sales to consolidated entities | 1,831 | 1,831 | |||||||||||||||||
| - sales to third parties | 1,756 | 12 | 365 | 367 | 2,500 | ||||||||||||||
| Total revenues | 3,587 | 12 | 365 | 367 | 4,331 | ||||||||||||||
| Production costs | (388) | (6) | (25) | (15) | (434) | ||||||||||||||
| Transportation costs | (140) | (1) | (12) | (153) | |||||||||||||||
| Production taxes | (2) | (112) | (88) | (202) | |||||||||||||||
| Exploration expenses | (35) | (35) | |||||||||||||||||
| D.D. & A. and Provision for abandonment | (879) | (3) | 42 | (154) | (994) | ||||||||||||||
| Other income (expenses) | (287) | (158) | (1) | (197) | (643) | ||||||||||||||
| Pretax income from producing activities | 1,858 | 100 | (1) | (87) | 1,870 | ||||||||||||||
| Income taxes | (1,237) | (66) | (1,303) | ||||||||||||||||
| Results of operations from E&P activities of equity-accounted entities | 621 | 100 | (1) | (153) | 567 |
| (a) Includes asset net reversal amounting to €1,263 million. |
| 2020 | Italy | Rest of Europe | North | Egypt | Sub - Saharan Africa | Kazakhstan | Rest | America | Australia and Oceania | Total | |||||||||
| Africa | of Asia | ||||||||||||||||||
| Consolidated subsidiaries | |||||||||||||||||||
| Revenues: | |||||||||||||||||||
| - sales to consolidated entities | 799 | 334 | 616 | 2,315 | 788 | 1,333 | 434 | 1 | 6,620 | ||||||||||
| - sales to third parties | 53 | 1,610 | 2,478 | 784 | 547 | 179 | 204 | 109 | 5,964 | ||||||||||
| Total revenues | 799 | 387 | 2,226 | 2,478 | 3,099 | 1,335 | 1,512 | 638 | 110 | 12,584 | |||||||||
| Production costs | (332) | (139) | (371) | (367) | (782) | (246) | (236) | (272) | (17) | (2,762) | |||||||||
| Transportation costs | (4) | (30) | (39) | (11) | (21) | (164) | (4) | (12) | (285) | ||||||||||
| Production taxes | (111) | (135) | (295) | (133) | (13) | (687) | |||||||||||||
| Exploration expenses | (19) | (14) | (124) | (56) | (77) | (3) | (104) | (112) | (1) | (510) | |||||||||
| D.D. & A. and Provision for abandonment (a) | (1,149) | (252) | (1,158) | (848) | (2,187) | (454) | (1,070) | (678) | (65) | (7,861) | |||||||||
| Other income (expenses) | (255) | (45) | (360) | (204) | 25 | (153) | (90) | (71) | 6 | (1,147) | |||||||||
| Pretax income from producing activities | (1,071) | (93) | 39 | 992 | (238) | 315 | (125) | (520) | 33 | (668) | |||||||||
| Income taxes | 219 | 69 | (671) | (519) | (33) | (134) | (193) | 86 | (11) | (1,187) | |||||||||
| Results of operations from E&P activities of consolidated subsidiaries | (852) | (24) | (632) | 473 | (271) | 181 | (318) | (434) | 22 | (1,855) | |||||||||
| Equity-accounted entities | |||||||||||||||||||
| Revenues: | |||||||||||||||||||
| - sales to consolidated entities | 862 | 862 | |||||||||||||||||
| - sales to third parties | 782 | 10 | 131 | 307 | 1,230 | ||||||||||||||
| Total revenues | 1,644 | 10 | 131 | 307 | 2,092 | ||||||||||||||
| Production costs | (350) | (7) | (23) | (18) | (398) | ||||||||||||||
| Transportation costs | (161) | (1) | (11) | (173) | |||||||||||||||
| Production taxes | (2) | (3) | (76) | (81) | |||||||||||||||
| Exploration expenses | (35) | (35) | |||||||||||||||||
| D.D. & A. and Provision for abandonment | (1,163) | (1) | (69) | (50) | (1,283) | ||||||||||||||
| Other income (expenses) | (90) | (1) | (35) | (2) | (146) | (274) | |||||||||||||
| Pretax income from producing activities | (155) | (2) | (10) | (2) | 17 | (152) | |||||||||||||
| Income taxes | 469 | 1 | (29) | 441 | |||||||||||||||
| Results of operations from E&P activities of equity-accounted entities | 314 | (1) | (10) | (2) | (12) | 289 |
| (a) Includes asset net impairment amounting to €1,865 million. |
Proved reserves of oil and natural gas
Eni’s criteria concerning evaluation and classification of proved developed and undeveloped reserves comply with Regulation S-X 4-10 of the U.S. Securities and Exchange Commission and have been disclosed in accordance with FASB Extractive Activities - Oil and Gas (Topic 932).
Proved oil and gas reserves are those quantities of oil and gas, which, by analysis of geoscience and engineering data, can be estimated with reasonable certainty to be economically producible, from a given date forward, from known reservoirs, and under existing economic conditions, operating methods, and government regulations, prior to the time at which contracts providing the right to operate expire, unless evidence indicates that renewal is reasonably certain, regardless of whether deterministic or probabilistic methods are used for the estimation. The project to extract the hydrocarbons must have commenced or the operator must be reasonably certain that it will commence the project within a reasonable time. Existing economic conditions include prices and costs at which economic producibility from a reservoir is to be determined. The price shall be the average price during the 12-month period prior to the ending date of the period covered by the report, determined as an un-weighted arithmetic average of the first-day-of-the-month price for each month within such period, unless prices are defined by contractual arrangements, excluding escalations based upon future conditions.
In 2022, the average price for the marker Brent crude oil was $101 per barrel. Net proved reserves exclude interests and royalties owned by others.
Proved reserves are classified as either developed or undeveloped.
Developed oil and gas reserves are reserves that can be expected to be recovered through existing wells with existing equipment and operating methods or in which the cost of the required equipment is relatively minor compared to the cost of a new well.
Undeveloped oil and gas reserves are reserves of any category that are expected to be recovered from new wells on undrilled acreage, or from existing wells where a relatively major expenditure is required for recompletion. Eni has its proved reserves evaluted on a rotational basis by independent oil engineering companies1. The description of qualifications of the person primarily responsible of the reserves audit is included in the third-party audit report2 In the preparation of their reports, independent evaluators rely, without independent verification, upon data furnished by Eni with respect to property interest, production, current costs of operation and development, sale agreements, prices and other factual information and data that were accepted as represented by the independent evaluators. These data, equally used by Eni in its internal process, include logs, directional surveys, core and PVT (Pressure Volume Temperature) analysis, maps, oil/gas/water production/injection data of wells, reservoir studies and technical analysis relevant to field performance, long-term development plans, future capital and operating costs.
In order to calculate the economic value of Eni equity reserves, actual prices applicable to hydrocarbon sales, price adjustments required by applicable contractual arrangements, and other pertinent information are provided. In 2022, Ryder Scott Company and Sproule provided an independent evaluation of about 27% of Eni’s total proved reserves as of December 31, 2022, confirming, as in previous years, the reasonableness of Eni’s internal evaluations3.
In the three-year period from 2020 to 2022, 90% of Eni’s total proved reserves were subject to independent evaluation. As of December 31, 2022, the principal assets which did not undergo an independent evaluation in the last three years were Nené e Litchendjli in Congo.
Eni operates under production sharing agreements in several of the foreign jurisdictions where it has oil and gas exploration and production activities. Reserves of oil and natural gas to which Eni is entitled under PSA arrangements are shown in accordance with Eni’s economic interest in the volumes of oil and natural gas estimated to be recoverable in future years. Such reserves include estimated quantities allocated to Eni for recovery of costs, income taxes owed by Eni but settled by its joint venture partners (which are state-owned entities) out of Eni’s share of production and Eni’s net equity share after cost recovery. Proved oil and gas reserves associated with PSAs represented 54%, 58% and 57% of total proved reserves as of December 31, 2022, 2021 and 2020 respectively, on an oil-equivalent basis. Similar effects as PSAs apply to service contracts; proved reserves associated with such contracts represented 2%, 3%, and 4% of total proved reserves on an oil-equivalent basis as of December 31, 2022, 2021 and 2020, respectively.
1For the past three years we have availed of the independent certification service of DeGolyer and Mac Naughton, Ryder Scott, Societè Generale de Surveillance and Sproule.
2The reports of independent engineers are available on Eni website eni.com section Publications/Annual Report 2022.
3Includes Eni’s share of proved reserves of equity accounted entities.
Oil and gas reserves quantities include: (i) oil and natural gas quantities in excess of cost recovery which the company has an obligation to purchase under certain PSAs with governments or authorities, whereby the company serves as producer of reserves. Reserves volumes associated with oil and gas deriving from such obligation represent 3%, 4% and 3% of total proved reserves as of December 31, 2022, 2021 and 2020, respectively, on an oil equivalent basis; (ii) volumes of proved reserves of natural gas to be consumed in operations amounted to approximately 2,389 BCF at 2022 year-end (2,335 BCF and 2,337 BCF respectively at 2021 and 2020 year-end); (iii) the quantities of hydrocarbons related to the Angola LNG plant owned by the JV Azule set up 50% with bp during the year.
Numerous uncertainties are inherent in estimating quantities of proved reserves, in projecting future productions and development costs. The accuracy of any reserve estimate is a function of the quality of available data and engineering and geological interpretation and evaluation. The results of drilling, testing and production after the date of the estimate may require substantial upward or downward revisions. In addition, changes in oil and natural gas prices have an effect on the quantities of Eni’s proved reserves since estimates of reserves are based on prices and costs relevant to the date when such estimates are made. Consequently, the evaluation of reserves could also significantly differ from actual oil and natural gas volumes that will be produced.
Proved undeveloped reserves as of December 31, 2022 were 2,423 mmboe, of which 1,104 mmbbl of liquids and 6,943 BCF of natural gas. Proved undeveloped reserves of consolidated subsidiaries amounted to 727 mmbbl of liquids and 4,759 BCF of natural gas. Changes in proved undeveloped reserves were as follows:
|
(mmboe) |
|
|
Proved undeveloped reserves as of December 31, 2021 |
2,020 |
|
Transfers to proved developed reserves |
(317) |
|
Extensions and discoveries |
152 |
|
Revisions of previous estimates |
227 |
|
Improved recovery |
4 |
|
Net effect of sales and purchases |
337 |
|
Proved undeveloped reserves as of December 31, 2022 |
2,423 |
In 2022, total proved undeveloped reserves increased by 403 mmboe (proved undeveloped reserves of consolidated companies increased by 76 mmboe, while those of joint ventures and associates increased by 327 mmboe).
Main changes derived from:
| (i) | proved undeveloped reserves matured to proved developed reserves amounted to -317 mmboe, and were driven by progress in development activities, production start-ups and project revisions. The main reclassifications to proved developed reserves were related to: the Coral LNG project in Mozambique (-172 mmboe) due to the commissioning of a floating production vessel, Egypt (-24 mmboe) at the Zohr field, mainly Snorre field in Vår Energi in Norway (-22 mmboe), the Kashagan field in Kazakhstan (-19 mmboe), the Amoca project in Mexico (-15 mmboe), USA (-10 mmboe) and UAE (-10 mmboe); | |
| (ii) | new discoveries and extensions of 152 mmboe: (i) an increase of 121 million barrels of liquids, mainly related to the investment decision for the Baleine projects in Ivory Coast (59 mmboe), and in the Azule JV in Angola (54 mmboe); (ii) an increase of 165 BCF of gas (31 mmboe), mainly related to Baleine in Ivory Coast; | |
| (iii) | revisions of previous estimates were positive for 227 mmboe, of which 37 mmbbl of oil and 995 BCF (190 mmboe) of natural gas. Positive revisions mainly related to progress of development activities at Zohr in Egypt (131 mmboe), Nené in Congo (85 mmboe) and in Structure E in Libya (+51 mmboe). Negative revisions mainly in Nigeria (-126 million boe) and Iraq (-24 million boe). Azule and Vår Energi contributed +51 mmboe and +13 mmboe, respectively; | |
| (iv) |
improved recoveries of 4 mmboe referred to Azule in Angola; | |
| (v) | net effect of purchases and sales related to the establishment of the Azule JV with BP. |
Proved reserves of crude oil (including condensate and natural gas liquids)
|
(million barrels) |
||||||||||||||||||||
|
2022 |
Italy |
Rest of Europe |
North |
Egypt |
Sub - Saharan Africa |
Kazakhstan |
Rest |
America |
Australia and Oceania |
Total |
||||||||||
|
Consolidated subsidiaries |
|
|
|
|
|
|
|
|
|
|
||||||||||
|
Reserves at December 31, 2021 |
197 |
34 |
393 |
210 |
589 |
710 |
476 |
237 |
1 |
2,847 |
||||||||||
|
of which: developed |
146 |
34 |
225 |
164 |
435 |
641 |
262 |
164 |
1 |
2,072 |
||||||||||
|
undeveloped |
51 |
|
168 |
46 |
154 |
69 |
214 |
73 |
|
775 |
||||||||||
|
Purchase of Minerals in Place |
1 |
|
17 |
|
|
|
|
2 |
|
20 |
||||||||||
|
Revisions of Previous Estimates |
3 |
6 |
(8) |
(16) |
(62) |
(34) |
(15) |
13 |
|
(113) |
||||||||||
|
Improved Recovery |
|
|
2 |
|
|
|
|
4 |
|
6 |
||||||||||
|
Extensions and Discoveries |
|
3 |
5 |
1 |
61 |
|
|
|
|
70 |
||||||||||
|
Production |
(13) |
(7) |
(45) |
(28) |
(51) |
(32) |
(28) |
(22) |
|
(226) |
||||||||||
|
Sales of Minerals in Place |
|
|
|
|
(170) |
|
|
|
|
(170) |
||||||||||
|
Reserves at December 31, 2022 |
188 |
36 |
364 |
167 |
367 |
644 |
433 |
234 |
1 |
2,434 |
||||||||||
|
Equity-accounted entities |
|
|
|
|
|
|
|
|
|
|
||||||||||
|
Reserves at December 31, 2021 |
|
378 |
9 |
|
21 |
|
|
6 |
|
414 |
||||||||||
|
of which: developed |
|
175 |
9 |
|
9 |
|
|
6 |
|
199 |
||||||||||
|
undeveloped |
|
203 |
|
|
12 |
|
|
|
|
215 |
||||||||||
|
Purchase of Minerals in Place |
|
|
|
|
132 |
|
100 |
|
|
232 |
||||||||||
|
Revisions of Previous Estimates |
|
38 |
|
|
37 |
|
|
22 |
|
97 |
||||||||||
|
Improved Recovery |
|
|
|
|
4 |
|
|
|
|
4 |
||||||||||
|
Extensions and Discoveries |
|
4 |
|
|
54 |
|
|
|
|
58 |
||||||||||
|
Production |
|
(33) |
(1) |
|
(13) |
|
|
(1) |
|
(48) |
||||||||||
|
Sales of Minerals in Place |
|
(37) |
|
|
|
|
|
|
|
(37) |
||||||||||
|
Reserves at December 31, 2022 |
|
350 |
8 |
|
235 |
|
100 |
27 |
|
720 |
||||||||||
|
Reserves at December 31, 2022 |
188 |
386 |
372 |
167 |
602 |
644 |
533 |
261 |
1 |
3,154 |
||||||||||
|
Developed |
139 |
205 |
209 |
135 |
347 |
585 |
231 |
198 |
1 |
2,050 |
||||||||||
|
consolidated subsidiaries |
139 |
32 |
201 |
135 |
212 |
585 |
231 |
171 |
1 |
1,707 |
||||||||||
|
equity-accounted entities |
|
173 |
8 |
|
135 |
|
|
27 |
|
343 |
||||||||||
|
Undeveloped |
49 |
181 |
163 |
32 |
255 |
59 |
302 |
63 |
|
1,104 |
||||||||||
|
consolidated subsidiaries |
49 |
4 |
163 |
32 |
155 |
59 |
202 |
63 |
|
727 |
||||||||||
|
equity-accounted entities |
|
177 |
|
|
100 |
|
100 |
|
|
377 |
|
2021 |
Italy |
Rest of Europe |
North |
Egypt |
Sub - Saharan Africa |
Kazakhstan |
Rest |
America |
Australia and Oceania |
Total |
||||||||||
|
Consolidated subsidiaries |
|
|
|
|
|
|
|
|
|
|
||||||||||
|
Reserves at December 31, 2020 |
178 |
34 |
383 |
227 |
624 |
805 |
579 |
224 |
1 |
3,055 |
||||||||||
|
of which: developed |
146 |
31 |
243 |
172 |
469 |
716 |
297 |
143 |
1 |
2,218 |
||||||||||
|
undeveloped |
32 |
3 |
140 |
55 |
155 |
89 |
282 |
81 |
|
837 |
||||||||||
|
Purchase of Minerals in Place |
|
|
|
|
|
|
|
1 |
|
1 |
||||||||||
|
Revisions of Previous Estimates |
32 |
8 |
49 |
11 |
21 |
(58) |
(74) |
21 |
|
10 |
||||||||||
|
Improved Recovery |
|
|
|
|
2 |
|
|
10 |
|
12 |
||||||||||
|
Extensions and Discoveries |
|
(1) |
6 |
2 |
16 |
|
|
|
|
23 |
||||||||||
|
Production |
(13) |
(7) |
(45) |
(30) |
(72) |
(37) |
(29) |
(19) |
|
(252) |
||||||||||
|
Sales of Minerals in Place |
|
|
|
|
(2) |
|
|
|
|
(2) |
||||||||||
|
Reserves at December 31, 2021 |
197 |
34 |
393 |
210 |
589 |
710 |
476 |
237 |
1 |
2,847 |
||||||||||
|
Equity-accounted entities |
|
|
|
|
|
|
|
|
|
|
||||||||||
|
Reserves at December 31, 2020 |
|
400 |
12 |
|
18 |
|
|
30 |
|
460 |
||||||||||
|
of which: developed |
|
176 |
12 |
|
15 |
|
|
30 |
|
233 |
||||||||||
|
undeveloped |
|
224 |
|
|
3 |
|
|
|
|
227 |
||||||||||
|
Purchase of Minerals in Place |
|
|
|
|
|
|
|
|
|
|
||||||||||
|
Revisions of Previous Estimates |
|
17 |
(2) |
|
4 |
|
|
(23) |
|
(4) |
||||||||||
|
Improved Recovery |
|
|
|
|
|
|
|
|
|
|
||||||||||
|
Extensions and Discoveries |
|
2 |
|
|
|
|
|
|
|
2 |
||||||||||
|
Production |
|
(41) |
(1) |
|
(1) |
|
|
(1) |
|
(44) |
||||||||||
|
Sales of Minerals in Place |
|
|
|
|
|
|
|
|
|
|
||||||||||
|
Reserves at December 31, 2021 |
|
378 |
9 |
|
21 |
|
|
6 |
|
414 |
||||||||||
|
Reserves at December 31, 2021 |
197 |
412 |
402 |
210 |
610 |
710 |
476 |
243 |
1 |
3,261 |
||||||||||
|
Developed |
146 |
209 |
234 |
164 |
444 |
641 |
262 |
170 |
1 |
2,271 |
||||||||||
|
consolidated subsidiaries |
146 |
34 |
225 |
164 |
435 |
641 |
262 |
164 |
1 |
2,072 |
||||||||||
|
equity-accounted entities |
|
175 |
9 |
|
9 |
|
|
6 |
|
199 |
||||||||||
|
Undeveloped |
51 |
203 |
168 |
46 |
166 |
69 |
214 |
73 |
|
990 |
||||||||||
|
consolidated subsidiaries |
51 |
|
168 |
46 |
154 |
69 |
214 |
73 |
|
775 |
||||||||||
|
equity-accounted entities |
|
203 |
|
|
12 |
|
|
|
|
215 |
|
2020 |
Italy |
Rest of Europe |
North |
Egypt |
Sub - Saharan Africa |
Kazakhstan |
Rest |
America |
Australia and Oceania |
Total |
||||||||||
|
Consolidated subsidiaries |
|
|
|
|
|
|
|
|
|
|
||||||||||
|
Reserves at December 31, 2019 |
194 |
41 |
468 |
264 |
694 |
746 |
491 |
225 |
1 |
3,124 |
||||||||||
|
of which: developed |
137 |
37 |
301 |
149 |
519 |
682 |
245 |
148 |
1 |
2,219 |
||||||||||
|
undeveloped |
57 |
4 |
167 |
115 |
175 |
64 |
246 |
77 |
|
905 |
||||||||||
|
Purchase of Minerals in Place |
|
|
|
|
|
|
|
|
|
|
||||||||||
|
Revisions of Previous Estimates |
1 |
1 |
(44) |
(14) |
10 |
100 |
114 |
16 |
|
184 |
||||||||||
|
Improved Recovery |
|
|
|
|
|
|
5 |
|
|
5 |
||||||||||
|
Extensions and Discoveries |
|
|
|
|
|
|
1 |
4 |
|
5 |
||||||||||
|
Production |
(17) |
(8) |
(41) |
(23) |
(80) |
(41) |
(32) |
(21) |
|
(263) |
||||||||||
|
Sales of Minerals in Place |
|
|
|
|
|
|
|
|
|
|
||||||||||
|
Reserves at December 31, 2020 |
178 |
34 |
383 |
227 |
624 |
805 |
579 |
224 |
1 |
3,055 |
||||||||||
|
Equity-accounted entities |
|
|
|
|
|
|
|
|
|
|
||||||||||
|
Reserves at December 31, 2019 |
|
424 |
12 |
|
10 |
|
|
31 |
|
477 |
||||||||||
|
of which: developed |
|
219 |
12 |
|
7 |
|
|
31 |
|
269 |
||||||||||
|
undeveloped |
|
205 |
|
|
3 |
|
|
|
|
208 |
||||||||||
|
Purchase of Minerals in Place |
|
|
|
|
|
|
|
|
|
|
||||||||||
|
Revisions of Previous Estimates |
|
(11) |
|
|
9 |
|
|
|
|
(2) |
||||||||||
|
Improved Recovery |
|
|
|
|
|
|
|
|
|
|
||||||||||
|
Extensions and Discoveries |
|
30 |
|
|
|
|
|
|
|
30 |
||||||||||
|
Production |
|
(43) |
|
|
(1) |
|
|
(1) |
|
(45) |
||||||||||
|
Sales of Minerals in Place |
|
|
|
|
|
|
|
|
|
|
||||||||||
|
Reserves at December 31, 2020 |
|
400 |
12 |
|
18 |
|
|
30 |
|
460 |
||||||||||
|
Reserves at December 31, 2020 |
178 |
434 |
395 |
227 |
642 |
805 |
579 |
254 |
1 |
3,515 |
||||||||||
|
Developed |
146 |
207 |
255 |
172 |
484 |
716 |
297 |
173 |
1 |
2,451 |
||||||||||
|
consolidated subsidiaries |
146 |
31 |
243 |
172 |
469 |
716 |
297 |
143 |
1 |
2,218 |
||||||||||
|
equity-accounted entities |
|
176 |
12 |
|
15 |
|
|
30 |
|
233 |
||||||||||
|
Undeveloped |
32 |
227 |
140 |
55 |
158 |
89 |
282 |
81 |
|
1,064 |
||||||||||
|
consolidated subsidiaries |
32 |
3 |
140 |
55 |
155 |
89 |
282 |
81 |
|
837 |
||||||||||
|
equity-accounted entities |
|
224 |
|
|
3 |
|
|
|
|
227 |
Main changes in proved reserves of crude oil (including condensates and natural gas liquids) reported in the tables above for the period 2022, 2021 and 2020 are discussed below.
Consolidated subsidiaries
Purchase of Minerals in Place
In 2020, no purchases were made.
In 2021, there are two acquisitions (totaling 1 mmboe) of Lucius fields in the U.S. and Conwy in the U.K.
In 2022, 20 mmbbl were booked, mainly for the acquisition of the BHP share in Algeria and a share in some fields in the United States Gulf of Mexico.
Revisions of Previous Estimates
In 2020, revisions of previous estimates amounted to an increase of 184 mmbbl. Positive revisions of 100 mmbbl reported in Kazakhstan were driven by higher entitlements and progress in development activities. In the rest of Asia, positive revisions of 114 mmbbl were due to higher entitlements in Iraq (74 mmbbl) and progress at a few projects, among which the most important was the Umm Shaif/Nasr concession in the United Arab Emirates. In the Sub-Saharan Africa positive revisions of 10 mmbbl were due to higher entitlements in Nigeria (14 mmbbl), Angola (8 mmbbl ) and Ghana (3 mmbbl), partly offset by negative revisions due to the debooking of the Loango and Zatchi fields reserves in Congo (-18 mmbbl). In America, positive revisions of 16 mmbbl were due to higher entitlements in Mexico (25 mmbbl), partially offset by the removal of uneconomic reserves at various fields in the United States. In Egypt, negative revisions of 14 mmbbl were mainly due to the Abu Rudeis project. In North Africa negative revisions of 44 mmbbl were driven by price effects and capital expenditures curtailments in Libya (-30 mmbbl) and Algeria (-17 mmbbl).
In 2021, revisions of previous estimates were 10 mmbbl detailed as follows. In Italy there were positive revisions of 32 mmbbl mainly due to the Val d’Agri project. In the Rest of Europe 8 mmbbl of positive revisions were registered, mainly in the United Kingdom. In the Rest of North Africa revisions totaled 49 mmbbl, comprising positive revisions (+62 mmbbl) of which +42 mmbbl in Libya (mainly in Area D) and +18 mmbbl in Algeria (BRN +5 mmbbl and other minor fields) and negative revisions (-13 mmbbl) mainly in Algeria (BRW -4 mmbbl) and other minor fields. In Egypt there were revisions of 11 mmbbl, consisting of positive revisions (21 mmbbl) mainly in Meleiha and negative revisions (-10 mmbbl) mainly in Belayim. In Sub-Saharan Africa, revisions totaled +21 mmbbl, consisting of positive revisions (+74 mmbbl) primarily in Nigeria (+42 mmbbl) and Angola (+22 mmbbl) and negative revisions (-53 mmbbl) including -23 mmbbl in Congo and -13 mmbbl in Nigeria. In Kazakhstan, revisions were negative 58 mmbbl, mainly related to the Karachaganak field. In the Rest of Asia revisions (-74 mmbbl) were due to positive revisions (+21 mmbbl) in the United Arab Emirates and negative revisions (-95 mmbbl) mainly in Iraq. In the Americas there were total revisions of 21 mmbbl, comprising positive revisions (+38 mmbbl) in the United States and negative revisions (-17 mmbbl) in Mexico.
In 2022, revisions of previous estimates were negative of 113 mmbbl. The main positive revisions were in the United Arab Emirates (+23 mmbbl) particularly of the Umm Shaif field (19 mmbbl) due to better field performance, the United States (+16 mmbbl) mainly at the Triton and Allegheny fields, and Libya (15 mmbbl) at the Wafa and Structure E fields. The main negative changes were in Nigeria (-70 mmbbl) due to lower expected production, Iraq (-39 mmbbl) and Kazakhstan (-34 mmbbl) mainly due to price effects and Algeria (-23 mmbbl).
Improved Recovery
In 2020, improved recoveries of 5 mmbbl related to the Burun project in Turkmenistan.
In 2021, 12 mmbbl were totaled from recovery-assisted improvements primarily on the Oooguruk field in the U.S.
In 2022, 6 mmbbl were booked due to improved recovery mainly at the Mizton field in Mexico and the BRW field in Algeria.
Extensions and Discoveries
In 2020, new discoveries and extensions added 5 mmbbl related to the Pegasus and Front Runner fields in the United States and the Mahani field in the United Arab Emirates.
In 2021, new discoveries and extensions total 23 million barrels, primarily related to Cuica and Ndungu in Block 15/06 and the New Gas Consortium project in Angola and the BKNEP, Zas and Ret projects in Algeria.
In 2022, 70 mmbbl were booked in connection with discoveries and extensions driven by the final investment decision on the development of the Baleine field in Ivory Coast (59 mmbbl), the NAHE project in Algeria and the Talbot field in the United Kingdom.
Sales of Minerals in Place
In 2020, no sales of oil properties were reported.
In 2021, there was a sale of OML 17 in Nigeria for 2 mmbbl.
In 2022, 170 mmbbl were de-booked in connection to the contribution of Eni’s assets in Angola to the JV Azule set up 50% with bp and the sale of OML 11 in Nigeria.
Equity-accounted entities
Purchase of Minerals in Place
In 2020 and 2021, no purchases of proved reserves were made.
In 2022, 232 mmbbl were booked in connection with the acquisition of a 50% stake in the JV Azule in Angola (132 mmbbl) and to Eni's joining the NFE project in Qatar (100 mmbbl).
Revisions of Previous Estimates
In 2020, negative revisions of previous estimates amounted to 2 mmbbl. In the Rest of Europe negative revisions for 11 mmbbl were reported mainly at the Ringhorne East and Ekofisk fields in Norway driven by price effects. These were partially offset by positive revisions reported in the Sub-Saharan Africa up by 9 mmbbl driven by an improved performance at the Angola LNG project.
In 2021, revisions were negative 4 mmbbl, mainly located in the Rest of Europe (+17 mmbbl) in Norway and the Americas (-23 mmbbl in Venezuela). Minor revisions in Angola, Tunisia and Mozambique.
In 2022, revisions were a positive 97 mmbbl, located mainly in Azule in Angola (+38 mmbbl, including the contractual extensions and better performances for Block 0, Block 1 and Block 17 and better performances for Block 15/06) ), Var Energi in Norway (+37 mmbbl due to better performance at several fields) and Venezuela (+21 mmbbl).
Extensions and Discoveries
In 2020, extensions and new discoveries of 30 mmbbl were reported as a result of the final investment decision for the Bredaiblikk project in Norway.
In 2021, extensions and new discoveries total 2 mmbbl and were located in Norway.
In 2022, extensions and new discoveries of 58 mmbbl were reported by Azule in Angola and Vår Energi in Norway.
Sales of Minerals in Place
In 2020 and 2021, no sales of proved reserves were made.
In 2022, sales of 37 mmbbl related to the IPO of Vår Energi in Norway.
Proved reserves of natural gas
|
(billion cubic feet) |
||||||||||||||||||||
|
2022 |
Italy |
Rest of Europe |
North |
Egypt |
Sub - Saharan Africa |
Kazakhstan |
Rest of |
America |
Australia and Oceania |
Total |
||||||||||
|
Consolidated subsidiaries |
|
|
|
|
|
|
|
|
|
|
||||||||||
|
Reserves at December 31, 2021 |
918 |
247 |
2,272 |
4,152 |
2,953 |
1,705 |
1,522 |
274 |
428 |
14,471 |
||||||||||
|
of which: developed |
729 |
242 |
781 |
3,656 |
1,759 |
1,705 |
971 |
210 |
266 |
10,319 |
||||||||||
|
undeveloped |
189 |
5 |
1,491 |
496 |
1,194 |
|
551 |
64 |
162 |
4,152 |
||||||||||
|
Purchase of Minerals in Place |
|
|
6 |
|
|
|
|
2 |
|
8 |
||||||||||
|
Revisions of Previous Estimates |
39 |
15 |
280 |
193 |
(285) |
(73) |
(53) |
17 |
(1) |
132 |
||||||||||
|
Improved Recovery |
|
|
1 |
|
|
|
|
|
|
1 |
||||||||||
|
Extensions and Discoveries |
|
7 |
37 |
52 |
154 |
|
|
|
|
250 |
||||||||||
|
Production(a) |
(88) |
(46) |
(273) |
(516) |
(176) |
(72) |
(185) |
(29) |
(19) |
(1,404) |
||||||||||
|
Sales of Minerals in Place |
|
|
|
|
(305) |
|
(3) |
|
|
(308) |
||||||||||
|
Reserves at December 31, 2022 |
869 |
223 |
2,323 |
3,881 |
2,341 |
1,560 |
1,281 |
264 |
408 |
13,150 |
||||||||||
|
Equity-accounted entities |
|
|
|
|
|
|
|
|
|
|
||||||||||
|
Reserves at December 31, 2021 |
|
654 |
10 |
|
1,285 |
|
|
1,460 |
|
3,409 |
||||||||||
|
of which: developed |
|
457 |
10 |
|
165 |
|
|
1,460 |
|
2,092 |
||||||||||
|
undeveloped |
|
197 |
|
|
1,120 |
|
|
|
|
1,317 |
||||||||||
|
Purchase of Minerals in Place |
|
|
|
|
194 |
|
1,490 |
|
|
1,684 |
||||||||||
|
Revisions of Previous Estimates |
|
144 |
|
|
127 |
|
|
(10) |
|
261 |
||||||||||
|
Improved Recovery |
|
|
|
|
|
|
|
|
|
|
||||||||||
|
Extensions and Discoveries |
|
19 |
|
|
|
|
|
|
|
19 |
||||||||||
|
Production(b) |
|
(108) |
(1) |
|
(44) |
|
|
(95) |
|
(248) |
||||||||||
|
Sales of Minerals in Place |
|
(63) |
|
|
|
|
|
|
|
(63) |
||||||||||
|
Reserves at December 31, 2022 |
|
646 |
9 |
|
1,562 |
|
1,490 |
1,355 |
|
5,062 |
||||||||||
|
Reserves at December 31, 2022 |
869 |
869 |
2,332 |
3,881 |
3,903 |
1,560 |
2,771 |
1,619 |
408 |
18,212 |
||||||||||
|
Developed |
695 |
658 |
679 |
2,732 |
2,376 |
1,560 |
796 |
1,550 |
223 |
11,269 |
||||||||||
|
consolidated subsidiaries |
695 |
214 |
670 |
2,732 |
1,306 |
1,560 |
796 |
195 |
223 |
8,391 |
||||||||||
|
equity-accounted entities |
|
444 |
9 |
|
1,070 |
|
|
1,355 |
|
2,878 |
||||||||||
|
Undeveloped |
174 |
211 |
1,653 |
1,149 |
1,527 |
|
1,975 |
69 |
185 |
6,943 |
||||||||||
|
consolidated subsidiaries |
174 |
9 |
1,653 |
1,149 |
1,035 |
|
485 |
69 |
185 |
4,759 |
||||||||||
|
equity-accounted entities |
|
202 |
|
|
492 |
|
1,490 |
|
|
2,184 |
|
(a) It includes production volumes consumed in operations equal to 208 Bcf. |
|||
|
(b) It includes production volumes consumed in operations equal to 27 Bcf. |
|
(billion cubic feet) |
||||||||||||||||||||
|
2021 |
Italy |
Rest of Europe |
North |
Egypt |
Sub - Saharan Africa |
Kazakhstan |
Rest of |
America |
Australia and Oceania |
Total |
||||||||||
|
Consolidated subsidiaries |
|
|
|
|
|
|
|
|
|
|
||||||||||
|
Reserves at December 31, 2020 |
348 |
208 |
2,201 |
4,692 |
3,864 |
2,003 |
1,589 |
175 |
474 |
15,554 |
||||||||||
|
of which: developed |
280 |
194 |
1,014 |
4,511 |
1,751 |
2,003 |
674 |
109 |
315 |
10,851 |
||||||||||
|
undeveloped |
68 |
14 |
1,187 |
181 |
2,113 |
|
915 |
66 |
159 |
4,703 |
||||||||||
|
Purchase of Minerals in Place |
|
|
|
|
|
|
|
1 |
|
1 |
||||||||||
|
Revisions of Previous Estimates |
661 |
78 |
321 |
(2) |
(903) |
(213) |
120 |
125 |
(15) |
172 |
||||||||||
|
Improved Recovery |
|
|
|
|
|
|
|
|
|
|
||||||||||
|
Extensions and Discoveries |
|
5 |
13 |
|
186 |
|
2 |
|
|
206 |
||||||||||
|
Production(a) |
(91) |
(44) |
(263) |
(538) |
(179) |
(85) |
(189) |
(27) |
(31) |
(1,447) |
||||||||||
|
Sales of Minerals in Place |
|
|
|
|
(15) |
|
|
|
|
(15) |
||||||||||
|
Reserves at December 31, 2021 |
918 |
247 |
2,272 |
4,152 |
2,953 |
1,705 |
1,522 |
274 |
428 |
14,471 |
||||||||||
|
Equity-accounted entities |
|
|
|
|
|
|
|
|
|
|
||||||||||
|
Reserves at December 31, 2020 |
|
510 |
14 |
|
364 |
|
|
1,559 |
|
2,447 |
||||||||||
|
of which: developed |
|
415 |
14 |
|
170 |
|
|
1,559 |
|
2,158 |
||||||||||
|
undeveloped |
|
95 |
|
|
194 |
|
|
|
|
289 |
||||||||||
|
Purchase of Minerals in Place |
|
|
|
|
|
|
|
|
|
|
||||||||||
|
Revisions of Previous Estimates |
|
234 |
(3) |
|
952 |
|
|
(12) |
|
1,171 |
||||||||||
|
Improved Recovery |
|
|
|
|
|
|
|
|
|
|
||||||||||
|
Extensions and Discoveries |
|
28 |
|
|
|
|
|
|
|
28 |
||||||||||
|
Production(b) |
|
(118) |
(1) |
|
(31) |
|
|
(87) |
|
(237) |
||||||||||
|
Sales of Minerals in Place |
|
|
|
|
|
|
|
|
|
|
||||||||||
|
Reserves at December 31, 2021 |
|
654 |
10 |
|
1,285 |
|
|
1,460 |
|
3,409 |
||||||||||
|
Reserves at December 31, 2021 |
918 |
901 |
2,282 |
4,152 |
4,238 |
1,705 |
1,522 |
1,734 |
428 |
17,880 |
||||||||||
|
Developed |
729 |
699 |
791 |
3,656 |
1,924 |
1,705 |
971 |
1,670 |
266 |
12,411 |
||||||||||
|
consolidated subsidiaries |
729 |
242 |
781 |
3,656 |
1,759 |
1,705 |
971 |
210 |
266 |
10,319 |
||||||||||
|
equity-accounted entities |
|
457 |
10 |
|
165 |
|
|
1,460 |
|
2,092 |
||||||||||
|
Undeveloped |
189 |
202 |
1,491 |
496 |
2,314 |
|
551 |
64 |
162 |
5,469 |
||||||||||
|
consolidated subsidiaries |
189 |
5 |
1,491 |
496 |
1,194 |
|
551 |
64 |
162 |
4,152 |
||||||||||
|
equity-accounted entities |
|
197 |
|
|
1,120 |
|
|
|
|
1,317 |
|
(a) It includes production volumes consumed in operations equal to 208 Bcf. |
|||
|
(b) It includes production volumes consumed in operations equal to 15 Bcf. |
|
2020 |
Italy |
Rest of Europe |
North |
Egypt |
Sub - Saharan Africa |
Kazakhstan |
Rest of |
America |
Australia and Oceania |
Total |
||||||||||
|
Consolidated subsidiaries |
|
|
|
|
|
|
|
|
|
|
||||||||||
|
Reserves at December 31, 2019 |
752 |
262 |
2,738 |
5,191 |
4,103 |
1,969 |
1,349 |
240 |
507 |
17,111 |
||||||||||
|
of which: developed |
657 |
242 |
1,374 |
4,777 |
1,858 |
1,969 |
685 |
186 |
322 |
12,070 |
||||||||||
|
undeveloped |
95 |
20 |
1,364 |
414 |
2,245 |
|
664 |
54 |
185 |
5,041 |
||||||||||
|
Purchase of Minerals in Place |
|
|
|
|
|
|
|
|
|
|
||||||||||
|
Revisions of Previous Estimates |
(288) |
5 |
(259) |
(65) |
9 |
138 |
356 |
(33) |
|
(137) |
||||||||||
|
Improved Recovery |
|
|
|
|
|
|
|
|
|
|
||||||||||
|
Extensions and Discoveries |
|
|
|
6 |
|
|
54 |
4 |
|
64 |
||||||||||
|
Production(a) |
(116) |
(59) |
(278) |
(440) |
(248) |
(104) |
(170) |
(36) |
(33) |
(1,484) |
||||||||||
|
Sales of Minerals in Place |
|
|
|
|
|
|
|
|
|
|
||||||||||
|
Reserves at December 31, 2020 |
348 |
208 |
2,201 |
4,692 |
3,864 |
2,003 |
1,589 |
175 |
474 |
15,554 |
||||||||||
|
Equity-accounted entities |
|
|
|
|
|
|
|
|
|
|
||||||||||
|
Reserves at December 31, 2019 |
|
772 |
14 |
|
287 |
|
|
1,648 |
|
2,721 |
||||||||||
|
of which: developed |
|
597 |
14 |
|
88 |
|
|
1,648 |
|
2,347 |
||||||||||
|
undeveloped |
|
175 |
|
|
199 |
|
|
|
|
374 |
||||||||||
|
Purchase of Minerals in Place |
|
|
|
|
|
|
|
|
|
|
||||||||||
|
Revisions of Previous Estimates |
|
(128) |
1 |
|
113 |
|
|
(12) |
|
(26) |
||||||||||
|
Improved Recovery |
|
|
|
|
|
|
|
|
|
|
||||||||||
|
Extensions and Discoveries |
|
|
|
|
|
|
|
|
|
|
||||||||||
|
Production(b) |
|
(134) |
(1) |
|
(36) |
|
|
(77) |
|
(248) |
||||||||||
|
Sales of Minerals in Place |
|
|
|
|
|
|
|
|
|
|
||||||||||
|
Reserves at December 31, 2020 |
|
510 |
14 |
|
364 |
|
|
1,559 |
|
2,447 |
||||||||||
|
Reserves at December 31, 2020 |
348 |
718 |
2,215 |
4,692 |
4,228 |
2,003 |
1,589 |
1,734 |
474 |
18,001 |
||||||||||
|
Developed |
280 |
609 |
1,028 |
4,511 |
1,921 |
2,003 |
674 |
1,668 |
315 |
13,009 |
||||||||||
|
consolidated subsidiaries |
280 |
194 |
1,014 |
4,511 |
1,751 |
2,003 |
674 |
109 |
315 |
10,851 |
||||||||||
|
equity-accounted entities |
|
415 |
14 |
|
170 |
|
|
1,559 |
|
2,158 |
||||||||||
|
Undeveloped |
68 |
109 |
1,187 |
181 |
2,307 |
|
915 |
66 |
159 |
4,992 |
||||||||||
|
consolidated subsidiaries |
68 |
14 |
1,187 |
181 |
2,113 |
|
915 |
66 |
159 |
4,703 |
||||||||||
|
equity-accounted entities |
|
95 |
|
|
194 |
|
|
|
|
289 |
|
(a) It includes production volumes consumed in operations equal to 223 Bcf. |
|||||
|
(b) It includes production volumes consumed in operations equal to 16 Bcf. |
Main changes in proved reserves of natural gas reported in the tables above for the period 2020, 2021 and 2022 are discussed below.
Consolidated subsidiaries
Purchase of Minerals in Place
In 2020, no purchases were made.
In 2021, 1 BCF of acquisition related to the Lucius field in the United States is recorded.
In 2022, acquisitions of 8 BCF cubic meters were made, mainly for the acquisition of the BHP assets in Algeria (6 BCF) and an interest in some fields in the United States Gulf of Mexico.
Revisions of Previous Estimates
In 2020, revisions of previous estimates were a net negative of 137 BCF. In Italy, 288 BCF of negative revisions were reported mainly at the Hera Lacina-Linda, Cervia-Arianna, Luna, Annamaria, Val d’Agri and Porto Garibaldi-Agostino projects and other gas fields in the Adriatic sea due to price effects. In North Africa, 259 BCF of negative revisions were driven by price effects in Libya (-287 BCF) in particular at Bahr Essalam and Area E fields and in various fields in Algeria (+18 BCF). In Egypt, 65 BCF of negative revisions were recorded at the Tuna due to performance revision and at Zohr field due to price effect. In America, 33 BCF of negative revision were due to price effects at various US gas fields (-78 BCF), mainly Alliance fields, partially offset by Area 1 in Mexico (46 BCF ). Revisions were positive for 356 BCF in the Rest of Asia driven by a better performance at the Merakes projects in Indonesia (227 BCF) and at the Zubair field in Iraq (97 BCF) due to improved production expectations. In Kazakhstan, positive revisions of 138 BCF were reported at the Karachaganak project due to technical appraisal and higher entitlements.
In 2021, total revisions were 172 BCF as follows: Italy (661 BCF) mainly due to recovery of non-economic cutoffs; Rest of Europe (78 BCF) in the United Kingdom mainly due to recovery of non-economic cutoffs; Rest of North Africa (321 BCF) mainly in Libya due to price effect; Egypt (-2 BCF), consisting of positive revisions of 110 BCF meters mainly in Baltim SW and negative revisions 112 BCF mainly in Port Fouad; Sub-Saharan Africa total revisions of -903 BCF, primarily linked to the reclassification of the Mozambique project from a consolidated company to a equity-accounted company (-993 BCF) and positive revisions of 274 BCF, primarily in Nigeria. In Kazakhstan, reductions of 213 BCF were recorded mainly in Karachaganak due to the PSA effect; in the Rest of Asia, positive revisions of 120 BCF meters were mainly located in Indonesia (Merakes); in the Americas, revisions of 125 BCF occurred mainly in the United States due to the recovery of non-economic cutoffs; in Australia and Oceania, revisions totaled -15 BCF mainly related to the Blacktip project.
In 2022, total revisions were 132 BCF. The main positive revisions were in Congo (469 BCF) mainly at the Nené field, Libya (357 BCF) and Egypt (193 BCF) due to progress of development activities at the Wafa and Zohr fields, respectively. The main negative revisions were in Nigeria (-764 BCF), Algeria (-74 BCF) due to lower expected production and Kazakhstan (-73 BCF) due to price effects.
Improved Recovery
In 2020 and 2021, no material improved recoveries were recorded.
In 2022, we had 1 BCF of improved recoveries in Algeria on the BRW and BKNE Alpha fields.
Extensions and Discoveries
In 2020, new discoveries and extensions of 64 BCF mainly related to the Rest of Asia (with an upward revision of 54 BCF) following the final investment decision for the Mahani field in the United Arab Emirates, with production started-up in January 2021, and Egypt for the near-field discoveries in the Bashrush and Abu Madi West concessions.
In 2021, new discoveries and extensions totaled 206 BCF and related primarily to the New Gas Consortium project in Angola and to a lesser extent the Berkine North project in Algeria.
In 2022, new discoveries and extensions amounted to 250 BCF and mainly referred to the final investment decision in Baleine in Ivory Coast and Bashrush in Egypt.
Sales of Minerals in Place
In 2020, no sales were made.
In 2021, there were divestments of 15 BCF related to the exit from OML 17 in Nigeria.
In 2022, sales were 308 BCF in relation to the contribution of Eni's assets in Angola to the JV Azule and 3 BFC related to Pakistan.
Equity-accounted entities
Purchase of Minerals in Place
In 2020, no sales were made.
In 2021, there were divestments of 15 BCF related to the exit from OML 17 in Nigeria.
In 2022, 1,684 BCF were booked driven by Eni's entry into the NFE project in Qatar and the acquisition of a 50% stake in the JV Azule in Angola set up 50% with bp.
Revisions of Previous Estimates
In 2020, negative revisions of previous estimates of 26 BCF essentially related to the Rest of Europe (128 BCF) mainly in relation to the Grane and Midgard projects in Norway. In Sub-Saharan Africa, 113 BCF of positive revisions were reported at Azule in relation to the Angola LNG project due to a better performance.
In 2021, revisions to previous estimates were 1,171 BCF, primarily due to the reclassification of the Mozambique project from a consolidated company to a equity-accounted company.
In 2022, revisions of previous estimates were 261 BCF, mainly due to Azule in Angola (A-LNG and Block 1), better performance at several fields of Var Energi in Norway, and Coral in Mozambique.
Extensions and Discoveries
In 2020, there were no extensions or new relevant discoveries.
In 2021, 28 BCF of extensions and new discoveries were recorded, mainly due to the investment decision in Tommeliten Alpha in Norway.
In 2022, extensions and new discoveries were 19 BCF due to Vår Energi in Norway.
Sales of Minerals in Place
In 2020 and 2021, no sales were made.
In 2022, sales of 63 BCF were due to the IPO of Vår Energi in Norway.
Standardized measure of discounted future net cash flows
Estimated future cash inflows represent the revenues that would be received from production and are determined by applying the year-end average prices during the years ended.
Future price changes are considered only to the extent provided by contractual arrangements. Estimated future development and production costs are determined by estimating the expenditures to be incurred in developing and producing the proved reserves at the end of the year. Neither the effects of price and cost escalations nor expected future changes in technology and operating practices have been considered.
The standardized measure is calculated as the excess of future cash inflows from proved reserves less future costs of producing and developing the reserves, future income taxes and a yearly 10% discount factor.
Future production costs include the estimated expenditures related to the production of proved reserves plus any production taxes without consideration of future inflation. Future development costs include the estimated costs of drilling development wells and installation of production facilities, plus the net costs associated with dismantlement and abandonment of wells and facilities, under the assumption that year-end costs continue without considering future inflation. Future income taxes were calculated in accordance with the tax laws of the countries in which Eni operates.
The standardized measure of discounted future net cash flows, related to the preceding proved oil and gas reserves, is calculated in accordance with the requirements of FASB Extractive Activities - Oil and Gas (Topic 932). The standardized measure does not purport to reflect realizable values or fair market value of Eni’s proved reserves. An estimate of fair value would also take into account, among other things, hydrocarbon resources other than proved reserves, anticipated changes in future prices and costs and a discount factor representative of the risks inherent in the oil and gas exploration and production activity.
The standardized measure of discounted future net cash flows by geographical area consists of the following:
|
(€ million) |
|
|
|
|
|
|
|
|
|
|
||||||||||
|
December 31, 2022 |
Italy |
Rest of Europe |
North |
Egypt |
Sub - Saharan Africa |
Kazakhstan |
Rest |
America |
Australia and Oceania |
Total |
||||||||||
|
Consolidated subsidiaries |
|
|
|
|
|
|
|
|
|
|
||||||||||
|
Future cash inflows |
38,968 |
7,609 |
50,838 |
34,198 |
48,292 |
53,529 |
45,179 |
21,233 |
1,525 |
301,371 |
||||||||||
|
Future production costs |
(10,267) |
(1,752) |
(6,675) |
(11,171) |
(15,823) |
(7,844) |
(12,181) |
(5,950) |
(230) |
(71,893) |
||||||||||
|
Future development and abandonment costs |
(4,484) |
(1,296) |
(4,894) |
(2,941) |
(10,057) |
(1,873) |
(4,562) |
(3,063) |
(377) |
(33,547) |
||||||||||
|
Future net inflow before income tax |
24,217 |
4,561 |
39,269 |
20,086 |
22,412 |
43,812 |
28,436 |
12,220 |
918 |
195,931 |
||||||||||
|
Future income tax |
(6,388) |
(3,087) |
(23,766) |
(7,119) |
(7,990) |
(11,568) |
(21,227) |
(4,903) |
(81) |
(86,129) |
||||||||||
|
Future net cash flows |
17,829 |
1,474 |
15,503 |
12,967 |
14,422 |
32,244 |
7,209 |
7,317 |
837 |
109,802 |
||||||||||
|
10 % discount factor |
(7,141) |
(344) |
(7,176) |
(4,562) |
(6,456) |
(16,087) |
(2,980) |
(3,443) |
(357) |
(48,546) |
||||||||||
|
Standardized measure of discounted future net cash flows |
10,688 |
1,130 |
8,327 |
8,405 |
7,966 |
16,157 |
4,229 |
3,874 |
480 |
61,256 |
||||||||||
|
Equity-accounted entities |
|
|
|
|
|
|
|
|
|
|
||||||||||
|
Future cash inflows |
|
50,468 |
265 |
|
42,450 |
|
33,075 |
8,133 |
|
134,391 |
||||||||||
|
Future production costs |
|
(7,628) |
(123) |
|
(10,579) |
|
(9,749) |
(2,083) |
|
(30,162) |
||||||||||
|
Future development and abandonment costs |
|
(6,458) |
(57) |
|
(3,508) |
|
(560) |
(178) |
|
(10,761) |
||||||||||
|
Future net inflow before income tax |
|
36,382 |
85 |
|
28,363 |
|
22,766 |
5,872 |
|
93,468 |
||||||||||
|
Future income tax |
|
(27,333) |
(3) |
|
(8,117) |
|
(19,393) |
(2,469) |
|
(57,315) |
||||||||||
|
Future net cash flows |
|
9,049 |
82 |
|
20,246 |
|
3,373 |
3,403 |
|
36,153 |
||||||||||
|
10 % discount factor |
|
(2,501) |
(15) |
|
(9,058) |
|
(2,462) |
(1,416) |
|
(15,452) |
||||||||||
|
Standardized measure of discounted future net cash flows |
|
6,548 |
67 |
|
11,188 |
|
911 |
1,987 |
|
20,701 |
||||||||||
|
Total consolidated subsidiaries and equity-accounted entities |
10,688 |
7,678 |
8,394 |
8,405 |
19,154 |
16,157 |
5,140 |
5,861 |
480 |
81,957 |
|
December 31, 2021 |
Italy |
Rest of Europe |
North |
Egypt |
Sub - Saharan Africa |
Kazakhstan |
Rest |
America |
Australia and Oceania |
Total |
||||||||||
|
Consolidated subsidiaries |
|
|
|
|
|
|
|
|
|
|
||||||||||
|
Future cash inflows |
18,933 |
4,679 |
33,142 |
31,344 |
40,929 |
36,430 |
32,594 |
13,607 |
1,511 |
213,169 |
||||||||||
|
Future production costs |
(6,929) |
(1,496) |
(6,325) |
(9,726) |
(13,196) |
(7,343) |
(9,578) |
(4,189) |
(251) |
(59,033) |
||||||||||
|
Future development and abandonment costs |
(4,104) |
(865) |
(4,688) |
(2,036) |
(5,117) |
(1,750) |
(4,278) |
(2,298) |
(288) |
(25,424) |
||||||||||
|
Future net inflow before income tax |
7,900 |
2,318 |
22,129 |
19,582 |
22,616 |
27,337 |
18,738 |
7,120 |
972 |
128,712 |
||||||||||
|
Future income tax |
(2,037) |
(1,001) |
(12,345) |
(6,736) |
(8,372) |
(6,301) |
(12,899) |
(2,386) |
(75) |
(52,152) |
||||||||||
|
Future net cash flows |
5,863 |
1,317 |
9,784 |
12,846 |
14,244 |
21,036 |
5,839 |
4,734 |
897 |
76,560 |
||||||||||
|
10 % discount factor |
(2,112) |
(170) |
(4,516) |
(4,211) |
(5,608) |
(10,703) |
(2,295) |
(1,980) |
(350) |
(31,945) |
||||||||||
|
Standardized measure of discounted future net cash flows |
3,751 |
1,147 |
5,268 |
8,635 |
8,636 |
10,333 |
3,544 |
2,754 |
547 |
44,615 |
||||||||||
|
Equity-accounted entities |
|
|
|
|
|
|
|
|
|
|
||||||||||
|
Future cash inflows |
|
28,037 |
230 |
|
8,884 |
|
|
5,971 |
|
43,122 |
||||||||||
|
Future production costs |
|
(8,316) |
(120) |
|
(1,590) |
|
|
(1,454) |
|
(11,480) |
||||||||||
|
Future development and abandonment costs |
|
(6,566) |
(85) |
|
(95) |
|
|
(77) |
|
(6,823) |
||||||||||
|
Future net inflow before income tax |
|
13,155 |
25 |
|
7,199 |
|
|
4,440 |
|
24,819 |
||||||||||
|
Future income tax |
|
(8,591) |
(9) |
|
(1,286) |
|
|
(1,309) |
|
(11,195) |
||||||||||
|
Future net cash flows |
|
4,564 |
16 |
|
5,913 |
|
|
3,131 |
|
13,624 |
||||||||||
|
10 % discount factor |
|
(1,462) |
16 |
|
(3,498) |
|
|
(1,399) |
|
(6,343) |
||||||||||
|
Standardized measure of discounted future net cash flows |
|
3,102 |
32 |
|
2,415 |
|
|
1,732 |
|
7,281 |
||||||||||
|
Total consolidated subsidiaries and equity-accounted entities |
3,751 |
4,249 |
5,300 |
8,635 |
11,051 |
10,333 |
3,544 |
4,486 |
547 |
51,896 |
|
December 31, 2020 |
Italy |
Rest of Europe |
North |
Egypt |
Sub - Saharan Africa |
Kazakhstan |
Rest |
America |
Australia and Oceania |
Total |
||||||||||
|
Consolidated subsidiaries |
|
|
|
|
|
|
|
|
|
|
||||||||||
|
Future cash inflows |
6,120 |
1,737 |
19,780 |
26,003 |
26,901 |
21,519 |
22,528 |
6,638 |
1,599 |
132,825 |
||||||||||
|
Future production costs |
(3,587) |
(753) |
(5,431) |
(7,515) |
(10,909) |
(6,224) |
(7,241) |
(3,382) |
(265) |
(45,307) |
||||||||||
|
Future development and abandonment costs |
(1,925) |
(756) |
(4,378) |
(1,638) |
(4,257) |
(1,743) |
(4,511) |
(1,786) |
(246) |
(21,240) |
||||||||||
|
Future net inflow before income tax |
608 |
228 |
9,971 |
16,850 |
11,735 |
13,552 |
10,776 |
1,470 |
1,088 |
66,278 |
||||||||||
|
Future income tax |
(170) |
(61) |
(4,946) |
(5,320) |
(2,988) |
(2,313) |
(6,774) |
(441) |
(140) |
(23,153) |
||||||||||
|
Future net cash flows |
438 |
167 |
5,025 |
11,530 |
8,747 |
11,239 |
4,002 |
1,029 |
948 |
43,125 |
||||||||||
|
10 % discount factor |
(33) |
108 |
(2,413) |
(4,101) |
(3,714) |
(6,040) |
(1,681) |
(482) |
(383) |
(18,739) |
||||||||||
|
Standardized measure of discounted future net cash flows |
405 |
275 |
2,612 |
7,429 |
5,033 |
5,199 |
2,321 |
547 |
565 |
24,386 |
||||||||||
|
Equity-accounted entities |
|
|
|
|
|
|
|
|
|
|
||||||||||
|
Future cash inflows |
|
15,306 |
251 |
|
1,253 |
|
|
6,291 |
|
23,101 |
||||||||||
|
Future production costs |
|
(5,942) |
(98) |
|
(982) |
|
|
(1,641) |
|
(8,663) |
||||||||||
|
Future development and abandonment costs |
|
(6,244) |
(29) |
|
(46) |
|
|
(137) |
|
(6,456) |
||||||||||
|
Future net inflow before income tax |
|
3,120 |
124 |
|
225 |
|
|
4,513 |
|
7,982 |
||||||||||
|
Future income tax |
|
(576) |
(54) |
|
(3) |
|
|
(1,375) |
|
(2,008) |
||||||||||
|
Future net cash flows |
|
2,544 |
70 |
|
222 |
|
|
3,138 |
|
5,974 |
||||||||||
|
10 % discount factor |
|
(1,055) |
(43) |
|
(110) |
|
|
(1,460) |
|
(2,668) |
||||||||||
|
Standardized measure of discounted future net cash flows |
|
1,489 |
27 |
|
112 |
|
|
1,678 |
|
3,306 |
||||||||||
|
Total consolidated subsidiaries and equity-accounted entities |
405 |
1,764 |
2,639 |
7,429 |
5,145 |
5,199 |
2,321 |
2,225 |
565 |
27,692 |
Changes in standardized measure of discounted future net cash flows
Changes in standardized measure of discounted future net cash flows for the years ended December 31, 2022, 2021 and 2020, are as follows:
|
(€ million) |
||||||
|
2022 |
Consolidated subsidiaries |
Equity-accounted entities |
Total |
|||
|
Standardized measure of discounted future net cash flows at December 31, 2021 |
44,615 |
7,281 |
51,896 |
|||
|
Increase (Decrease): |
|
|
|
|||
|
- sales, net of production costs |
(25,987) |
(4,912) |
(30,899) |
|||
|
- net changes in sales and transfer prices, net of production costs |
56,002 |
24,343 |
80,345 |
|||
|
- extensions, discoveries and improved recovery, net of future production and development costs |
1,519 |
2,139 |
3,658 |
|||
|
- changes in estimated future development and abandonment costs |
(7,046) |
(3,169) |
(10,215) |
|||
|
- development costs incurred during the period that reduced future development costs |
3,821 |
2,000 |
5,821 |
|||
|
- revisions of quantity estimates |
(1,295) |
7,134 |
5,839 |
|||
|
- accretion of discount |
7,226 |
1,510 |
8,736 |
|||
|
- net change in income taxes |
(18,393) |
(21,676) |
(40,069) |
|||
|
- purchase of reserves in-place |
765 |
10,200 |
10,965 |
|||
|
- sale of reserves in-place |
(6,436) |
|
(6,436) |
|||
|
- changes in production rates (timing) and other |
6,465 |
(4,149) |
2,316 |
|||
|
Net increase (decrease) |
16,641 |
13,420 |
30,061 |
|||
|
Standardized measure of discounted future net cash flows at December 31, 2022 |
61,256 |
20,701 |
81,957 |
|
2021 |
Consolidated subsidiaries |
Equity-accounted entities |
Total |
|||
|
Standardized measure of discounted future net cash flows at December 31, 2020 |
24,386 |
3,306 |
27,692 |
|||
|
Increase (Decrease): |
|
|
|
|||
|
- sales, net of production costs |
(16,402) |
(3,381) |
(19,783) |
|||
|
- net changes in sales and transfer prices, net of production costs |
40,864 |
9,256 |
50,120 |
|||
|
- extensions, discoveries and improved recovery, net of future production and development costs |
1,304 |
142 |
1,446 |
|||
|
- changes in estimated future development and abandonment costs |
(2,737) |
(734) |
(3,471) |
|||
|
- development costs incurred during the period that reduced future development costs |
2,877 |
1,385 |
4,262 |
|||
|
- revisions of quantity estimates |
1,963 |
1,665 |
3,628 |
|||
|
- accretion of discount |
3,810 |
514 |
4,324 |
|||
|
- net change in income taxes |
(14,022) |
(5,216) |
(19,238) |
|||
|
- purchase of reserves in-place |
27 |
|
27 |
|||
|
- sale of reserves in-place |
(28) |
|
(28) |
|||
|
- changes in production rates (timing) and other |
2,573 |
344 |
2,917 |
|||
|
Net increase (decrease) |
20,229 |
3,975 |
24,204 |
|||
|
Standardized measure of discounted future net cash flows at December 31, 2021 |
44,615 |
7,281 |
51,896 |
|
2020 |
Consolidated subsidiaries |
Equity-accounted entities |
Total |
|||
|
Standardized measure of discounted future net cash flows at December 31, 2019 |
45,487 |
5,410 |
50,897 |
|||
|
Increase (Decrease): |
|
|
|
|||
|
- sales, net of production costs |
(10,046) |
(1,490) |
(11,536) |
|||
|
- net changes in sales and transfer prices, net of production costs |
(34,188) |
(5,324) |
(39,512) |
|||
|
- extensions, discoveries and improved recovery, net of future production and development costs |
123 |
142 |
265 |
|||
|
- changes in estimated future development and abandonment costs |
792 |
(834) |
(42) |
|||
|
- development costs incurred during the period that reduced future development costs |
4,147 |
1,192 |
5,339 |
|||
|
- revisions of quantity estimates |
36 |
(285) |
(249) |
|||
|
- accretion of discount |
7,136 |
1,065 |
8,201 |
|||
|
- net change in income taxes |
13,336 |
3,814 |
17,150 |
|||
|
- purchase of reserves in-place |
|
|
|
|||
|
- sale of reserves in-place |
|
|
|
|||
|
- changes in production rates (timing) and other |
(2,437) |
(384) |
(2,821) |
|||
|
Net increase (decrease) |
(21,101) |
(2,104) |
(23,205) |
|||
|
Standardized measure of discounted future net cash flows at December 31, 2020 |
24,386 |
3,306 |
27,692 |
| F-191 |