UNITED STATES
SECURITIES AND EXCHANGE COMMISSION
Washington, D.C. 20549
FORM 8-K
CURRENT REPORT
PURSUANT TO SECTION 13 OR 15(d) OF THE
SECURITIES EXCHANGE ACT OF 1934
DATE OF REPORT (DATE OF EARLIEST EVENT REPORTED): February 27, 2012
Commission File Number |
Registrant; State of Incorporation; Address; and Telephone Number |
IRS Employer Identification Number | ||
1-13739 | UNISOURCE ENERGY CORPORATION | 86-0786732 | ||
(An Arizona Corporation) One South Church Avenue, Suite 100 Tucson, AZ 85701 (520) 571-4000 |
||||
1-5924 | TUCSON ELECTRIC POWER COMPANY | 86-0062700 | ||
(An Arizona Corporation) One South Church Avenue, Suite 100 Tucson, AZ 85701 (520) 571-4000 |
Check the appropriate box below if the Form 8-K filing is intended to simultaneously satisfy the filing obligation of the registrant under any of the following provisions:
¨ | Written communications pursuant to Rule 425 under the Securities Act (17 CFR 230.425) |
¨ | Soliciting material pursuant to Rule 14a-12 under the Exchange Act (17 CFR 240.14a-12) |
¨ | Pre-commencement communications pursuant to Rule 14d-2(b) under the Exchange Act (17 CFR 240.14d-2(b)) |
¨ | Pre-commencement communications pursuant to Rule 13e-4(c) under the Exchange Act (17 CFR 240.13e-4(c)) |
Item 2.02 Results of Operations and Financial Condition
On February 27, 2012, UniSource Energy Corporation (UniSource Energy) issued a press release announcing earnings for the quarter and 12 months ended December 31, 2011 for UniSource Energy and Tucson Electric Power Company. A copy of the press release is attached hereto as Exhibit 99.1. UniSource Energy also posted supplemental information accessible from a link on its website, www.uns.com. A copy of the supplemental information is attached hereto as Exhibit 99.2 and Exhibit 99.3.
The Companys press releases and other communications may include certain non-Generally Accepted Accounting Principles (GAAP) financial measures. A non-GAAP financial measure is defined as a numerical measure of a companys financial performance, financial position or cash flows that excludes (or includes) amounts that are included in (or excluded from) the most directly comparable measure calculated and presented in accordance with GAAP in the Companys financial statements.
Non-GAAP financial measures utilized by the Company include presentations of revenues, operating expenses, operating income and earnings (loss) per share. The Company uses these non-GAAP measures to evaluate the operations of the Company. Certain non-GAAP financial measures utilized by the Company exclude: the impact of non-recurring items: the effect of accounting changes or adjustments; expenses that are reimbursed by third parties; and other items. The Companys management believes that these non-GAAP financial measures provide useful information to investors by removing the effect of variances in GAAP reported results of operations that are not indicative of fundamental changes in the earnings or cash flow capacity of the Companys operations. Management also believes that the presentation of the non-GAAP financial measures is largely consistent with its past practice, as well as industry practice in general, and will enable investors and analysts to compare current non-GAAP measures with non-GAAP measures with respect to prior periods.
Item 9.01 Financial Statements and Exhibits
Exhibit 99.1 | UniSource Energy Corporation Press Release, dated February 27, 2012. | |||
Exhibit 99.2 | Supplemental earnings information posted on UniSource Energys website, dated February 27, 2012. | |||
Exhibit 99.3 | Conference call presentation slides posted on UniSource Energys website, dated February 27, 2012. |
SIGNATURES
Pursuant to the requirements of the Securities Exchange Act of 1934, each registrant has duly caused this report to be signed on its behalf by the undersigned thereunto duly authorized.
Date: February 27, 2012 | UNISOURCE ENERGY CORPORATION | |||||
(Registrant) | ||||||
/s/ Kevin P. Larson | ||||||
Kevin P. Larson Senior Vice President and Principal Financial Officer | ||||||
Date: February 27, 2012 | TUCSON ELECTRIC POWER COMPANY | |||||
(Registrant) | ||||||
/s/ Kevin P. Larson | ||||||
Kevin P. Larson Senior Vice President and Principal Financial Officer |
Exhibit 99.1
FOR IMMEDIATE RELEASE | February 27, 2012 | |
Media Contact: Art McDonald, (520) 884-3628 | Page 1 of 9 | |
Financial Analyst Contact: Chris Norman, (520) 884-3649 |
UNISOURCE ENERGY REPORTS 2011 EARNINGS, INCREASES QUARTERLY DIVIDEND, AND
ISSUES EARNINGS GUIDANCE FOR 2012
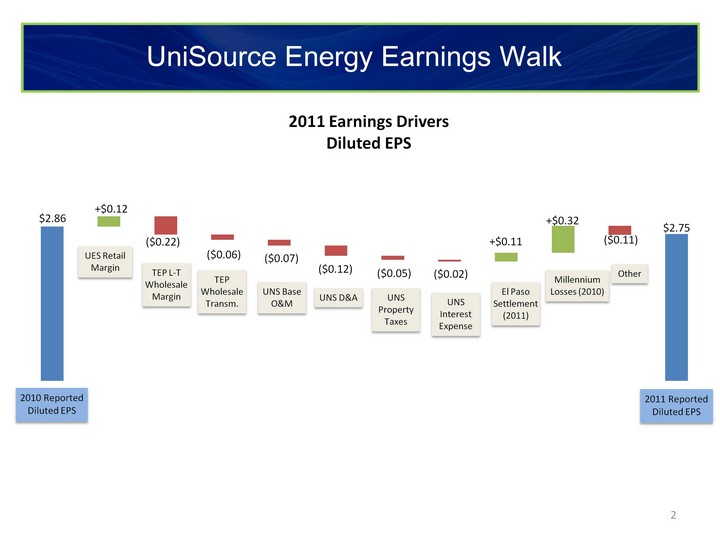
| UniSource Energys net income for 2011 was $110 million, or $2.75 per share of common stock on a fully diluted basis, compared with net income of $113 million, or $2.86 per diluted share in 2010. Financial results in 2011 include a $4 million after-tax gain related to the settlement of a transmission dispute involving Tucson Electric Power (TEP), UniSource Energy's primary subsidiary. Results in 2010 included $13 million of after-tax charges at Millennium Energy Holdings (Millennium), a subsidiary that holds UniSource Energy's unregulated energy investments. |
| The Board of Directors of UniSource Energy declared a first quarter 2012 dividend for common shareholders of 43 cents per share. |
| Earnings at UniSource Energys primary subsidiary, Tucson Electric Power Company (TEP), were $85 million in 2011 compared with $108 million in 2010. Lower margins on long-term wholesale sales, higher scheduled generating plant maintenance expense, and an increase in depreciation and amortization expense contributed to lower earnings at TEP. |
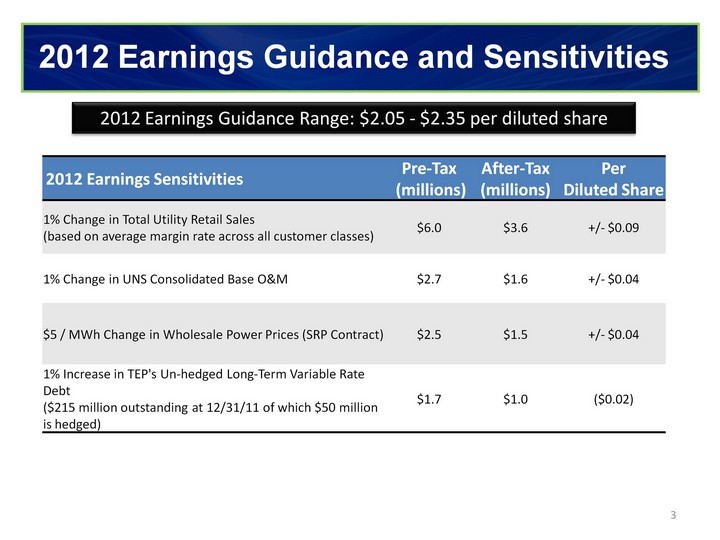
| UniSource Energy estimates its 2012 diluted earnings per share will be between $2.05 and $2.35. |
Tucson, Ariz. UniSource Energy Corporation (NYSE: UNS) today reported 2011 net income of $110 million, or $2.75 per share of common stock on a fully diluted basis, compared with $113 million, or $2.86 per diluted share in 2010.
Our financial results in 2011 were consistent with our expectations, said Paul Bonavia, UniSource Energys Chairman and CEO. Providing safe, reliable service to our customers remains our number one priority, and we took several important steps during the year to strengthen the operational performance and improve the long-term financial position of our utility companies.
UniSource Energy and its utility subsidiaries completed various financing activities during 2011 that strengthened the companies balance sheets, enhanced liquidity, and reduced exposure to variable rate debt. The companies invested in infrastructure improvements that will enhance reliability and increase operational flexibility.
TEP is in the fourth year of a base-rate freeze, said Bonavia. Frozen rates and an economy in the very early stages of recovery will constrain our financial performance in 2012, Bonavia said. We will continue to focus on operational efficiencies to maintain tight control of our costs.
UniSource Energys earnings for 2012 are estimated to be in the range of $2.05 to $2.35 per diluted share. The mid-point of the range assumes consolidated base operations and maintenance (O&M) expense of $270 million, which is the same level of base O&M expense recorded in 2011. TEPs estimated retail kWh sales in 2012, which assume normal weather patterns, are expected to be approximately 0.7 percent below 2011 sales. Cooling degree days during 2011 were 3.7 percent above normal.
Under the terms of TEPs last settlement agreement, approved by the Arizona Corporation Commission (ACC) in November 2008, the company can file a rate case on or after July 1, 2012. The parties to the 2008 settlement committed to using best efforts to implement new rates within 13 months of the filing date.
We are focusing our efforts on completing TEPs rate case application, which we intend to file with the ACC this summer. We look forward to working with the commission, its staff, and our community to reach an outcome that enhances the long-term financial and operating stability of TEP, Bonavia said.
Common Stock Dividend
UniSource Energys board of directors declared a first quarter dividend for common shareholders of 43 cents per share. The dividend will be paid on March 22, 2012 to common shareholders of record as of March 12, 2012. In 2011, the companys quarterly dividend was 42 cents per share.
The boards long-term targeted dividend payout ratio range is 60 percent to 70 percent of UniSource Energys net income.
The declaration of dividend payments is at the boards sole discretion and is subject to numerous factors that ordinarily affect dividend policy, including the results of UniSource Energys operations and its financial position as well as general economic and business conditions.
Tucson Electric Power
Retail kWh Sales and Revenues
TEPs retail kilowatt-hour (kWh) sales in 2011 increased 0.4 percent from 2010 levels. Although the weather in TEPs service area was hotter than normal, there were 1.0 percent fewer cooling degree days than in 2010. Sales volumes to residential customers increased 0.5 percent, while kWh sales to TEPs commercial and industrial customers increased by 0.5 percent and 0.3 percent, respectively. Sales to TEPs mining customers increased by 0.3 percent in 2011 compared with 2010. TEPs retail customer base grew by 0.4 percent, or approximately 1,500 customers, during 2011.
Despite the increase in retail sales volumes, TEPs retail margin revenues did not change compared with 2010. The sluggish economy led some of TEPs large industrial customers to alter their energy usage patterns in order to reduce the demand charge on their electric bills. Retail margin revenues do not include customer surcharges used to fund renewable energy and energy efficiency programs or charges to cover fuel and purchased power costs.
Long-Term Wholesale and Transmission Revenues
In 2011, the margin on long-term wholesale sales of electricity was $13 million compared with $28 million in 2010. The decrease reflects a pricing change in TEPs largest wholesale contract that took effect in June 2011. Wholesale revenues from the sale of transmission services were $16 million in 2011 compared with $21 million in 2010. The decrease is related to the sale of short-term transmission services in 2010 that did not recur in 2011.
Other Operating Expenses
TEPs 2011 base O&M expense of $237 million increased by $9 million compared with 2010. Base O&M excludes costs directly offset by customer surcharges and third-party reimbursements. The increase reflects the impact of higher planned generation maintenance outage expense.
2
Depreciation and amortization expense increased by $8 million primarily due to new plant additions.
Other Items
TEPs 2011 results include a $4 million after-tax gain related to the settlement of a transmission dispute.
Results in 2010 include a $2 million after-tax loss related to the settlement of a dispute over transactions with the California Power Exchange.
UNS Gas
UNS Gas reported net income of $10 million in 2011 compared with $9 million in 2010. The increase resulted from colder winter weather in 2011 as well as the full-year impact of a 2 percent non-fuel base-rate increase that took effect in April 2010.
Hearings before an ACC administrative law judge regarding UNS Gas pending rate case concluded in February 2012. UNS Gas supports the ACC staffs proposal, which includes a base-rate increase of $2.7 million and a fixed-cost recovery rate mechanism designed to mitigate the erosion of revenues resulting from the ACCs energy efficiency rules. UNS Gas expects the ACC to issue a final ruling on this case in the second quarter of this year.
UNS Electric
UNS Electric reported net income of $18 million in 2011 compared with $16 million in 2010. The increase is due primarily to the full-year impact of a 4 percent non-fuel base-rate increase that took effect October 1, 2010.
UNS Electrics 2010 results include a $2 million after-tax gain related to a settlement with Arizona Public Service related to transactions with the California Power Exchange.
Millennium
Millennium recorded net income of approximately $2 million due in part to interest on a note receivable. In 2010, Millennium recorded a $13 million net loss related to the write-off of deferred tax assets and impairment losses related to its investments.
Seasonality of Earnings
The net income and results of operations of TEP as well as of UNS Gas and UNS Electric operating subsidiaries of UniSource Energy Services (UES) are seasonal in nature. TEP and UNS Electric typically record the majority of their net income during the second and third quarters when hot weather contributes to higher energy consumption. TEPs retail prices, which include higher rates for higher levels of energy use, also shift a larger share of the companys earnings into those periods.
Energy demand from UNS Gas customers typically peaks during the winter. Accordingly, UNS Gas records the majority of its net income during the first and fourth quarters.
3
Net Income and Earnings Per Share Summary
4th Quarter | Full Year | |||||||||||||||
Net Income |
2011 | 2010 | 2011 | 2010 | ||||||||||||
-Millions- | -Millions- | |||||||||||||||
Tucson Electric Power |
$ | 1.6 | $ | 10.1 | $ | 85.3 | $ | 108.3 | ||||||||
UNS Gas |
4.3 | 3.3 | 10.2 | 8.6 | ||||||||||||
UNS Electric |
3.3 | 3.4 | 17.7 | 15.5 | ||||||||||||
Other Non-Reportable Segments and Adjustments (1) |
(1.0 | ) | (5.5 | ) | (3.2 | ) | (19.4 | ) | ||||||||
|
|
|
|
|
|
|
|
|||||||||
Net Income |
$ | 8.2 | $ | 11.3 | $ | 110.0 | $ | 113.0 | ||||||||
|
|
|
|
|
|
|
|
|||||||||
Avg. Basic Shares Outstanding (millions) |
37.1 | 36.7 | 37.0 | 36.4 | ||||||||||||
Avg. Diluted Shares Outstanding (millions) |
37.4 | 41.4 | 41.6 | 41.0 | ||||||||||||
4th Quarter | Full Year | |||||||||||||||
Earnings Per UniSource Energy Share |
2011 | 2010 | 2011 | 2010 | ||||||||||||
Tucson Electric Power |
$ | 0.04 | $ | 0.28 | $ | 2.31 | $ | 2.97 | ||||||||
UNS Gas |
0.12 | 0.09 | 0.27 | 0.24 | ||||||||||||
UNS Electric |
0.09 | 0.09 | 0.48 | 0.43 | ||||||||||||
Other Non-Reportable Segments and Adjustments (1) |
(0.03 | ) | (0.15 | ) | (0.08 | ) | (0.54 | ) | ||||||||
|
|
|
|
|
|
|
|
|||||||||
Net Income per Basic Share |
$ | 0.22 | $ | 0.31 | $ | 2.98 | $ | 3.10 | ||||||||
|
|
|
|
|
|
|
|
|||||||||
Net Income per Diluted Share |
$ | 0.22 | $ | 0.30 | $ | 2.75 | $ | 2.86 | ||||||||
|
|
|
|
|
|
|
|
(1) | Includes: UniSource Energy on a stand-alone basis; consolidating adjustments; and results from Millennium and UniSource Energy Development. |
UniSource Energy believes the presentation of TEP, UNS Gas, UNS Electric, and Millennium net income or loss on a per basic UniSource Energy share basis (which are non-GAAP financial measures) provides useful information to investors by disclosing the results of operations of its business segments on a basis consistent with UniSource Energy's reported earnings or losses.
Conference Call and Webcast
The company will host a conference call on Monday, February 27 at 11 am EST to discuss the financial results and outlook. To participate in the call, please dial in 5 to 10 minutes prior to the start time.
Dial-in number: (877) 582-0446
Reference code: 55207232
The conference call can be heard live on UniSource Energys website. The webcast can be accessed at uns.com and will be available for replay for seven days.
Replay number: (800) 642-1687
Reference code: 55207232
In conjunction with this earnings announcement, UniSource Energy has provided detailed information on its performance during 2011 and outlook for 2012. These materials have been filed with the Securities and Exchange Commission and are also available at uns.com.
4
UniSource Energy is a Tucson, Arizona-based company with consolidated assets of approximately $4.0 billion. UniSource Energy's primary subsidiaries include Tucson Electric Power, which serves
more than 404,000 customers in southern Arizona; and UniSource Energy Services, provider of natural gas and electric service for about 239,000 customers in northern and southern Arizona. For more information about UniSource Energy and its subsidiaries, visit uns.com.
This release contains forward-looking information that involves risks and uncertainties, including factors that could affect UniSource Energy's ability to reach 2012 earnings guidance. These factors include: state and federal regulatory and legislative decisions and actions, including environmental legislation and renewable energy requirements; regional economic and market conditions that could affect customer growth and energy usage; weather variations affecting energy usage; the cost of debt and equity capital and access to capital markets; the performance of the stock market and changing interest rate environment, which affect the value of the companys pension and other postretirement benefit plan assets and the related contribution requirements and expense; unexpected increases in O&M expense; resolution of pending litigation matters; changes in accounting standards; changes in critical accounting estimates; changes to long-term contracts; the cost of fuel and energy supplies; performance of TEP's generating plants; and other factors listed in UniSource Energy's Form 10-K and 10-Q filings with the Securities and Exchange Commission. The preceding factors may cause future results to differ materially from outcomes currently expected by UniSource Energy.
5
UNISOURCE ENERGY 2011 RESULTS
UniSource Energy Corporation
Consolidated Statements of Income
(in thousands of dollars, except per share amounts)
Years Ended | ||||||||||||||||
December 31, | Increase / (Decrease) | |||||||||||||||
(UNAUDITED) |
2011 | 2010 | Amount | Percent | ||||||||||||
Operating Revenues |
||||||||||||||||
Electric Retail Sales |
$ | 1,085,822 | $ | 1,051,002 | $ | 34,820 | 3.3 | |||||||||
Electric Wholesale Sales |
163,159 | 151,962 | 11,197 | 7.4 | ||||||||||||
California Power Exchange (CPX) Provision for Wholesale Refunds |
| (2,970 | ) | 2,970 | N/M | |||||||||||
Gas Revenue |
145,053 | 141,036 | 4,017 | 2.8 | ||||||||||||
Other Revenues |
115,481 | 112,936 | 2,545 | 2.3 | ||||||||||||
|
|
|
|
|
|
|
|
|||||||||
Total Operating Revenues |
1,509,515 | 1,453,966 | 55,549 | 3.8 | ||||||||||||
|
|
|
|
|
|
|
|
|||||||||
Operating Expenses |
||||||||||||||||
Fuel |
324,520 | 295,652 | 28,868 | 9.8 | ||||||||||||
Purchased Energy |
307,423 | 307,288 | 135 | 0.0 | ||||||||||||
Transmission |
7,334 | 10,945 | (3,611 | ) | (33.0 | ) | ||||||||||
Decrease to Reflect PPFAC/PGA Recovery Treatment |
(4,932 | ) | (29,622 | ) | 24,690 | 83.4 | ||||||||||
|
|
|
|
|
|
|
|
|||||||||
Total Fuel and Purchased Energy |
634,345 | 584,263 | 50,082 | 8.6 | ||||||||||||
Other Operations and Maintenance |
379,220 | 370,037 | 9,183 | 2.5 | ||||||||||||
Depreciation |
133,832 | 128,215 | 5,617 | 4.4 | ||||||||||||
Amortization |
30,983 | 28,094 | 2,889 | 10.3 | ||||||||||||
Taxes Other Than Income Taxes |
49,463 | 46,243 | 3,220 | 7.0 | ||||||||||||
|
|
|
|
|
|
|
|
|||||||||
Total Operating Expenses |
1,227,843 | 1,156,852 | 70,991 | 6.1 | ||||||||||||
|
|
|
|
|
|
|
|
|||||||||
Operating Income |
281,672 | 297,114 | (15,442 | ) | (5.2 | ) | ||||||||||
|
|
|
|
|
|
|
|
|||||||||
Other Income (Deductions) |
||||||||||||||||
Interest Income |
4,568 | 7,779 | (3,211 | ) | (41.3 | ) | ||||||||||
Other Income |
8,293 | 11,038 | (2,745 | ) | (24.9 | ) | ||||||||||
Other Expense |
(5,249 | ) | (15,202 | ) | 9,953 | 65.5 | ||||||||||
|
|
|
|
|
|
|
|
|||||||||
Total Other Income (Deductions) |
7,612 | 3,615 | 3,997 | N/M | ||||||||||||
|
|
|
|
|
|
|
|
|||||||||
Interest Expense |
||||||||||||||||
Long-Term Debt |
73,217 | 65,020 | 8,197 | 12.6 | ||||||||||||
Capital Leases |
40,359 | 46,740 | (6,381 | ) | (13.7 | ) | ||||||||||
Other Interest Expense |
2,535 | 1,651 | 884 | 53.5 | ||||||||||||
Interest Capitalized |
(3,753 | ) | (2,587 | ) | (1,166 | ) | (45.1 | ) | ||||||||
|
|
|
|
|
|
|
|
|||||||||
Total Interest Expense |
112,358 | 110,824 | 1,534 | 1.4 | ||||||||||||
|
|
|
|
|
|
|
|
|||||||||
Income Before Income Taxes |
176,926 | 189,905 | (12,979 | ) | (6.8 | ) | ||||||||||
Income Tax Expense |
66,951 | 76,921 | (9,970 | ) | (13.0 | ) | ||||||||||
|
|
|
|
|
|
|
|
|||||||||
Net Income |
$ | 109,975 | $ | 112,984 | $ | (3,009 | ) | (2.7 | ) | |||||||
|
|
|
|
|
|
|
|
|||||||||
Weighted-Average Shares of Common Stock Outstanding (000) |
||||||||||||||||
Basic |
36,962 | 36,415 | 547 | 1.5 | ||||||||||||
|
|
|
|
|
|
|
|
|||||||||
Diluted |
41,609 | 41,041 | 568 | 1.4 | ||||||||||||
|
|
|
|
|
|
|
|
|||||||||
Earnings per Share |
||||||||||||||||
Basic |
$ | 2.98 | $ | 3.10 | $ | (0.12 | ) | (3.9 | ) | |||||||
|
|
|
|
|
|
|
|
|||||||||
Diluted |
$ | 2.75 | $ | 2.86 | $ | (0.11 | ) | (3.8 | ) | |||||||
|
|
|
|
|
|
|
|
|||||||||
Dividends Declared per Share |
$ | 1.68 | $ | 1.56 | $ | 0.12 | 7.7 | |||||||||
|
|
|
|
|
|
|
|
N/MNot Meaningful
Reclassifications have been made to prior periods to conform to the current periods presentation.
6
UNISOURCE ENERGY 2011 RESULTS
UniSource Energy Corporation
Consolidated Statements of Income
(in thousands of dollars, except per share amounts)
Three Months Ended | ||||||||||||||||
December 31, | Increase / (Decrease) | |||||||||||||||
(UNAUDITED) |
2011 | 2010 | Amount | Percent | ||||||||||||
Operating Revenues |
||||||||||||||||
Electric Retail Sales |
$ | 229,606 | $ | 226,288 | $ | 3,318 | 1.5 | |||||||||
Electric Wholesale Sales |
41,653 | 49,565 | (7,912 | ) | (16.0 | ) | ||||||||||
Gas Revenue |
46,012 | 44,438 | 1,574 | 3.5 | ||||||||||||
Other Revenues |
26,857 | 36,882 | (10,025 | ) | (27.2 | ) | ||||||||||
|
|
|
|
|
|
|
|
|||||||||
Total Operating Revenues |
344,128 | 357,173 | (13,045 | ) | (3.7 | ) | ||||||||||
|
|
|
|
|
|
|
|
|||||||||
Operating Expenses |
||||||||||||||||
Fuel |
72,417 | 76,460 | (4,043 | ) | (5.3 | ) | ||||||||||
Purchased Energy |
74,079 | 64,003 | 10,076 | 15.7 | ||||||||||||
Transmission |
2,722 | 2,257 | 465 | 20.6 | ||||||||||||
Increase to Reflect PPFAC/PGA Recovery Treatment |
242 | 4,638 | (4,396 | ) | (94.8 | ) | ||||||||||
|
|
|
|
|
|
|
|
|||||||||
Total Fuel and Purchased Energy |
149,460 | 147,358 | 2,102 | 1.4 | ||||||||||||
Other Operations and Maintenance |
97,332 | 111,058 | (13,726 | ) | (12.4 | ) | ||||||||||
Depreciation |
34,179 | 32,442 | 1,737 | 5.4 | ||||||||||||
Amortization |
8,470 | 7,297 | 1,173 | 16.1 | ||||||||||||
Taxes Other Than Income Taxes |
12,884 | 10,684 | 2,200 | 20.6 | ||||||||||||
|
|
|
|
|
|
|
|
|||||||||
Total Operating Expenses |
302,325 | 308,839 | (6,514 | ) | (2.1 | ) | ||||||||||
|
|
|
|
|
|
|
|
|||||||||
Operating Income |
41,803 | 48,334 | (6,531 | ) | (13.5 | ) | ||||||||||
|
|
|
|
|
|
|
|
|||||||||
Other Income (Deductions) |
||||||||||||||||
Interest Income |
829 | 1,888 | (1,059 | ) | (56.1 | ) | ||||||||||
Other Income |
1,138 | 1,704 | (566 | ) | (33.2 | ) | ||||||||||
Other Expense |
(2,420 | ) | (5,842 | ) | 3,422 | 58.6 | ||||||||||
|
|
|
|
|
|
|
|
|||||||||
Total Other Income (Deductions) |
(453 | ) | (2,250 | ) | 1,797 | 79.9 | ||||||||||
|
|
|
|
|
|
|
|
|||||||||
Interest Expense |
||||||||||||||||
Long-Term Debt |
18,977 | 18,036 | 941 | 5.2 | ||||||||||||
Capital Leases |
10,251 | 11,616 | (1,365 | ) | (11.8 | ) | ||||||||||
Other Interest Expense |
607 | 1,281 | (674 | ) | (52.6 | ) | ||||||||||
Interest Capitalized |
(707 | ) | (1,004 | ) | 297 | 29.6 | ||||||||||
|
|
|
|
|
|
|
|
|||||||||
Total Interest Expense |
29,128 | 29,929 | (801 | ) | (2.7 | ) | ||||||||||
|
|
|
|
|
|
|
|
|||||||||
Income Before Income Taxes |
12,222 | 16,155 | (3,933 | ) | (24.3 | ) | ||||||||||
Income Tax Expense |
4,035 | 4,903 | (868 | ) | (17.7 | ) | ||||||||||
|
|
|
|
|
|
|
|
|||||||||
Net Income |
$ | 8,187 | $ | 11,252 | $ | (3,065 | ) | (27.2 | ) | |||||||
|
|
|
|
|
|
|
|
|||||||||
Weighted-Average Shares of Common Stock Outstanding (000) |
||||||||||||||||
Basic |
37,055 | 36,696 | 359 | 1.0 | ||||||||||||
|
|
|
|
|
|
|
|
|||||||||
Diluted |
37,381 | 41,396 | 307 | 0.7 | ||||||||||||
|
|
|
|
|
|
|
|
|||||||||
Earnings per Share |
||||||||||||||||
Basic |
$ | 0.22 | $ | 0.31 | $ | (0.09 | ) | (29.0 | ) | |||||||
|
|
|
|
|
|
|
|
|||||||||
Diluted |
$ | 0.22 | $ | 0.30 | $ | (0.08 | ) | (26.7 | ) | |||||||
|
|
|
|
|
|
|
|
|||||||||
Dividends Declared per Share |
$ | 0.42 | $ | 0.39 | $ | 0.03 | 7.7 | |||||||||
|
|
|
|
|
|
|
|
N/MNot Meaningful
Reclassifications have been made to prior periods to conform to the current period's presentation.
7
TUCSON ELECTRIC POWER COMPANY 2011 RESULTS
TUCSON ELECTRIC POWER COMPANY
Consolidated Statements of Income
(in thousands of dollars)
Years Ended | ||||||||||||||||
December 31, | Increase / (Decrease) | |||||||||||||||
(UNAUDITED) |
2011 | 2010 | Amount | Percent | ||||||||||||
Operating Revenues |
||||||||||||||||
Electric Retail Sales |
$ | 903,930 | $ | 868,188 | $ | 35,742 | 4.1 | |||||||||
Electric Wholesale Sales |
129,861 | 141,103 | (11,242 | ) | (8.0 | ) | ||||||||||
California Power Exchange (CPX) Provision for Wholesale Refunds |
| (2,970 | ) | 2,970 | N/M | |||||||||||
Other Revenues |
122,595 | 118,946 | 3,649 | 3.1 | ||||||||||||
|
|
|
|
|
|
|
|
|||||||||
Total Operating Revenues |
1,156,386 | 1,125,267 | 31,119 | 2.8 | ||||||||||||
|
|
|
|
|
|
|
|
|||||||||
Operating Expenses |
||||||||||||||||
Fuel |
318,268 | 284,744 | 33,524 | 11.8 | ||||||||||||
Purchased Power |
105,766 | 118,716 | (12,950 | ) | (10.9 | ) | ||||||||||
Transmission |
(1,435 | ) | 3,254 | (4,689 | ) | N/M | ||||||||||
Decrease to Reflect PPFAC Recovery Treatment |
(6,165 | ) | (21,541 | ) | 15,376 | 71.4 | ||||||||||
|
|
|
|
|
|
|
|
|||||||||
Total Fuel and Purchased Energy |
416,434 | 385,173 | 31,261 | 8.1 | ||||||||||||
Other Operations and Maintenance |
330,801 | 316,625 | 14,176 | 4.5 | ||||||||||||
Depreciation |
104,894 | 99,510 | 5,384 | 5.4 | ||||||||||||
Amortization |
34,650 | 32,196 | 2,454 | 7.6 | ||||||||||||
Taxes Other Than Income Taxes |
40,226 | 37,732 | 2,494 | 6.6 | ||||||||||||
|
|
|
|
|
|
|
|
|||||||||
Total Operating Expenses |
927,005 | 871,236 | 55,769 | 6.4 | ||||||||||||
|
|
|
|
|
|
|
|
|||||||||
Operating Income |
229,381 | 254,031 | (24,650 | ) | (9.7 | ) | ||||||||||
|
|
|
|
|
|
|
|
|||||||||
Other Income (Deductions) |
||||||||||||||||
Interest Income |
3,567 | 6,707 | (3,140 | ) | (46.8 | ) | ||||||||||
Other Income |
5,693 | 6,629 | (936 | ) | (14.1 | ) | ||||||||||
Other Expense |
(12,037 | ) | (11,506 | ) | (531 | ) | (4.6 | ) | ||||||||
|
|
|
|
|
|
|
|
|||||||||
Total Other Income (Deductions) |
(2,777 | ) | 1,830 | (4,607 | ) | N/M | ||||||||||
|
|
|
|
|
|
|
|
|||||||||
Interest Expense |
||||||||||||||||
Long-Term Debt |
49,858 | 42,378 | 7,480 | 17.7 | ||||||||||||
Capital Leases |
40,358 | 46,734 | (6,376 | ) | (13.6 | ) | ||||||||||
Other Interest Expense |
1,127 | 433 | 694 | N/M | ||||||||||||
Interest Capitalized |
(2,073 | ) | (1,880 | ) | (193 | ) | (10.3 | ) | ||||||||
|
|
|
|
|
|
|
|
|||||||||
Total Interest Expense |
89,270 | 87,665 | 1,605 | 1.8 | ||||||||||||
|
|
|
|
|
|
|
|
|||||||||
Income Before Income Taxes |
137,334 | 168,196 | (30,862 | ) | (18.3 | ) | ||||||||||
Income Tax Expense |
52,000 | 59,936 | (7,936 | ) | (13.2 | ) | ||||||||||
|
|
|
|
|
|
|
|
|||||||||
Net Income |
$ | 85,334 | $ | 108,260 | $ | (22,926 | ) | (21.2 | ) | |||||||
|
|
|
|
|
|
|
|
|||||||||
Electric MWh Sales: |
||||||||||||||||
Retail Sales |
9,332,107 | 9,291,788 | 40,319 | 0.4 | ||||||||||||
Long-Term Wholesale Sales |
902,139 | 987,957 | (85,818 | ) | (8.7 | ) |
N/MNot Meaningful
Reclassifications | have been made to prior periods to conform to the current period's presentation. |
8
TUCSON ELECTRIC POWER COMPANY 2011 RESULTS
TUCSON ELECTRIC POWER COMPANY
Consolidated Statements of Income
(in thousands of dollars)
Three Months Ended | ||||||||||||||||
December 31, | Increase / (Decrease) | |||||||||||||||
(UNAUDITED) |
2011 | 2010 | Amount | Percent | ||||||||||||
Operating Revenues |
||||||||||||||||
Electric Retail Sales |
$ | 189,652 | $ | 182,866 | $ | 6,786 | 3.7 | |||||||||
Electric Wholesale Sales |
33,238 | 44,106 | (10,868 | ) | (24.6 | ) | ||||||||||
Other Revenues |
28,829 | 37,880 | (9,051 | ) | (23.9 | ) | ||||||||||
|
|
|
|
|
|
|
|
|||||||||
Total Operating Revenues |
251,719 | 264,852 | (13,133 | ) | (5.0 | ) | ||||||||||
|
|
|
|
|
|
|
|
|||||||||
Operating Expenses |
||||||||||||||||
Fuel |
71,705 | 74,901 | (3,196 | ) | (4.3 | ) | ||||||||||
Purchased Power |
21,577 | 12,816 | 8,761 | 68.4 | ||||||||||||
Transmission |
904 | 436 | 468 | N/M | ||||||||||||
Increase (Decrease) to Reflect PPFAC Recovery Treatment |
(1,019 | ) | 1,482 | (2,501 | ) | N/M | ||||||||||
|
|
|
|
|
|
|
|
|||||||||
Total Fuel and Purchased Energy |
93,167 | 89,635 | 3,532 | 3.9 | ||||||||||||
Other Operations and Maintenance |
84,378 | 96,961 | (12,583 | ) | (13.0 | ) | ||||||||||
Depreciation |
26,770 | 25,367 | 1,403 | 5.5 | ||||||||||||
Amortization |
9,368 | 8,233 | 1,135 | 13.8 | ||||||||||||
Taxes Other Than Income Taxes |
10,423 | 8,829 | 1,594 | 18.1 | ||||||||||||
|
|
|
|
|
|
|
|
|||||||||
Total Operating Expenses |
224,106 | 229,025 | (4,919 | ) | (2.1 | ) | ||||||||||
|
|
|
|
|
|
|
|
|||||||||
Operating Income |
27,613 | 35,827 | (8,214 | ) | (22.9 | ) | ||||||||||
|
|
|
|
|
|
|
|
|||||||||
Other Income (Deductions) |
||||||||||||||||
Interest Income |
584 | 1,596 | (1,012 | ) | (63.4 | ) | ||||||||||
Other Income |
1,096 | 2,278 | (1,182 | ) | (51.9 | ) | ||||||||||
Other Expense |
(4,285 | ) | (4,154 | ) | (131 | ) | (3.2 | ) | ||||||||
|
|
|
|
|
|
|
|
|||||||||
Total Other Income (Deductions) |
(2,605 | ) | (280 | ) | (2,325 | ) | N/M | |||||||||
|
|
|
|
|
|
|
|
|||||||||
Interest Expense |
||||||||||||||||
Long-Term Debt |
13,365 | 12,123 | 1,242 | 10.2 | ||||||||||||
Capital Leases |
10,251 | 11,616 | (1,365 | ) | (11.8 | ) | ||||||||||
Other Interest Expense |
381 | 867 | (486 | ) | (56.1 | ) | ||||||||||
Interest Capitalized |
(446 | ) | (673 | ) | 227 | 33.7 | ||||||||||
|
|
|
|
|
|
|
|
|||||||||
Total Interest Expense |
23,551 | 23,933 | (382 | ) | (1.6 | ) | ||||||||||
|
|
|
|
|
|
|
|
|||||||||
Income Before Income Taxes |
1,457 | 11,614 | (10,157 | ) | (87.5 | ) | ||||||||||
Income Tax Expense (Benefit) |
(104 | ) | 1,489 | (1,593 | ) | N/M | ||||||||||
|
|
|
|
|
|
|
|
|||||||||
Net Income |
$ | 1,561 | $ | 10,125 | $ | (8,564 | ) | (84.6 | ) | |||||||
|
|
|
|
|
|
|
|
|||||||||
Electric MWh Sales: |
||||||||||||||||
Retail Sales |
2,060,016 | 2,042,740 | 17,276 | 0.8 | ||||||||||||
Long-Term Wholesale Sales |
233,144 | 260,487 | (27,343 | ) | (10.5 | ) |
N/MNot Meaningful
Reclassifications | have been made to prior periods to conform to the current period's presentation. |
9
Exhibit 99.2
UniSource Energy Corporation
Supplemental Earnings & Outlook Information
February 27, 2012
TABLE OF CONTENTS |
||
Safe Harbor and Non-GAAP Measures |
1 | |
Earnings Outlook & Assumptions |
2-3 | |
4th Quarter Earnings Variance |
4 | |
Year-End Earnings Variance |
5 | |
UniSource Energy and TEP O&M |
6 | |
TEP Operating Statistics |
7 | |
TEP Margin Revenues |
8 | |
UNS Electric Operating Statistics |
9 | |
UNS Gas Operating Statistics |
10 | |
Basic & Diluted Shares Outstanding |
11 |
SAFE HARBOR AND NON-GAAP MEASURES
This document contains forward-looking information that involves risks and uncertainties, which include, but are not limited to: state and federal regulatory and legislative decisions and actions; regional economic and market conditions which could affect customer growth and energy usage; weather variations affecting energy usage; the cost of debt and equity capital and access to capital markets; the performance of the stock market and changing interest rate environment, which affect the value of the companys pension and other postretirement benefit plan assets and the related contribution requirements and expense; unexpected increases in O&M expense; resolution of pending litigation matters; changes in accounting standards; changes in critical accounting estimates; the ongoing restructuring of the electric industry; changes to long-term contracts; the cost of fuel and power supplies; performance of TEPs generating plants; and other factors listed in UniSource Energys Form 10-K and 10-Q filings with the Securities and Exchange Commission. The preceding factors may cause future results to differ materially from historical results or from outcomes currently expected by UniSource Energy. The forecast assumptions and estimates below are not intended to be a full list of factors which could cause UniSource Energys future results to differ from current expectations. Please refer to UniSource Energys SEC filings for more information regarding risks and other uncertainties that could cause current expectations to differ from future results.
The Companys press releases and other communications may include certain non-Generally Accepted Accounting Principles (GAAP) financial measures. A non-GAAP financial measure is defined as a numerical measure of a company's financial performance, financial position or cash flows that excludes (or includes) amounts that are included in (or excluded from) the most directly comparable measure calculated and presented in accordance with GAAP in the Company's financial statements.
Non-GAAP financial measures utilized by the Company include presentations of revenues, operating expenses, operating income and earnings (loss) per share. The Company uses these non-GAAP measures to evaluate the operations of the Company. Certain non-GAAP financial measures utilized by the Company exclude: the impact of non-recurring items: the effect of accounting changes or adjustments; expenses that are reimbursed by third parties; and other items. The Company's management believes that these non-GAAP financial measures provide useful information to investors by removing the effect of variances in GAAP reported results of operations that are not indicative of fundamental changes in the earnings or cash flow capacity of the Company's operations. Management also believes that the presentation of the non-GAAP financial measures is largely consistent with its past practice, as well as industry practice in general, and will enable investors and analysts to compare current non-GAAP measures with non-GAAP measures with respect to prior periods.
UNISOURCE ENERGY 2012 EARNINGS OUTLOOK & ASSUMPTIONS
The table below provides key assumptions related to UniSource Energys estimated 2012 earnings of $2.05 to $2.35 per diluted share, as of February 27, 2012.
Actual | Estimated | |||||||||||||||
Key Assumptions |
2011 | 2012 | 2013 | 2014 | ||||||||||||
UniSource Consolidated |
||||||||||||||||
Base O&M ($ millions) |
$ | 270 | $ | 270 | ||||||||||||
Change vs. Prior Year |
1.8 | % | 0.0 | % | ||||||||||||
Effective Income Tax Rate |
38.0 | % | 39.7 | % | ||||||||||||
Avg. Basic Shares Outstanding (millions) |
37.0 | 38.0 | ||||||||||||||
Avg. Diluted Shares Outstanding (millions) |
41.6 | 41.7 | ||||||||||||||
TEP |
||||||||||||||||
Retail Sales(GWh) |
9,332 | 9,267 | ||||||||||||||
Change vs. Prior Year |
0.4 | % | -0.7 | % | approx. 1.5%/yr | |||||||||||
Retail SalesWeather Normalized (GWh) |
9,226 | |||||||||||||||
Retail Customers (Yr End) |
404,299 | 406,135 | ||||||||||||||
Change vs. Prior Year |
0.4 | % | 0.5 | % | approx. 1%/yr | |||||||||||
Long-Term Wholesale Sales (GWh) |
||||||||||||||||
Salt River Project (SRP) |
779 | 500 | ||||||||||||||
Navajo Tribal Utility Authority (NTUA) |
218 | 245 | ||||||||||||||
Long-Term Wholesale SalesPre-Tax Margin ($millions) |
$ | 13 | $ | 8 | ||||||||||||
Other Expenses ($ millions) |
||||||||||||||||
Capital Lease Amortization |
$ | 14 | $ | 14 | $ | 15 | $ | 16 | ||||||||
Capital Lease Interest Expense (Net of Interest Income on Investment in Lease Debt) |
$ | 38 | $ | 34 | $ | 25 | $ | 10 | ||||||||
Interest Expense on Long-Term and Short-Term Debt (Excluding Capital Lease Interest Expense) |
$ | 51 | $ | 54 |
2
Actual | Estimated | |||||||||||
Key Assumptions |
2011 | 2012 | 2013 | 2014 | ||||||||
UES |
||||||||||||
UNS Gas Retail Sales (Millions of Therms) |
114 | 112 | ||||||||||
Avg. Change vs. Prior Year |
1.9 | % | -1.8 | % | approx. 1.7% | |||||||
UNS Electric Retail Sales (GWh) |
1,853 | 1,766 | ||||||||||
Avg. Change vs. Prior Year |
-0.2 | % | -4.7 | % | approx. 1% |
TEP Long-Term Wholesale Sales
In 2011 and 2010, TEPs margin on long-term wholesale sales was $13 million and $28 million, respectively. TEPs two primary long-term wholesale contracts are with SRP and NTUA.
Salt River Project
Prior to June 1, 2011, under the terms of the SRP contract, TEP received a monthly demand charge of approximately $1.8 million, or $22 million annually, and sold the energy at a price based on TEPs average fuel cost. From June 1, 2011 to December 31, 2011, SRP was required to purchase 73,000 MWh per month. From January 1, 2012 through the end of the contract in May 2016, SRP is required to purchase 500,000 MWh of on-peak energy per year. TEP does not receive a demand charge and the price of energy is based on a discount to the price of on-peak power on Palo Verde Market Index. As of February 21, 2012, the average around-the-clock forward price of on-peak power on the Palo Verde Market Index for the calendar year 2012 was $30.33 MWh.
Navajo Tribal Utility Authority
TEP serves the portion of NTUAs load that is not served from NTUAs allocation of federal hydroelectric power. Over the last three years, sales to NTUA averaged 225,000 MWh. Since 2010, the price of 50% of the MWh sales from June to September has been based on the Palo Verde Market Index. In 2011, approximately 12% of the total energy sold to NTUA was priced based on the Palo Verde Market Index. The remaining power sales occur at a fixed price under TEPs contract with NTUA.
UNISOURCE ENERGY 2012 EARNINGS ESTIMATE SENSITIVITIES
Pre-Tax | After-Tax | Per Diluted | ||||||||||
2012 Sensitivities |
(millions) | (millions) | Share | |||||||||
1% Change in Total Utility Retail Sales (Based on average margin rate across all customer classes) |
$ | 6.0 | $ | 3.6 | $ | 0.09 | ||||||
1% Change in UNS Consolidated Base O&M |
$ | 2.7 | $ | 1.6 | $ | 0.04 | ||||||
$5 / MWh Change in Wholesale Power Prices SRP Contract |
$ | 2.5 | $ | 1.5 | $ | 0.04 | ||||||
1% Increase in Rate on TEP's Un-hedged Long-Term Variable Rate Debt ($215 million outstanding at 12/31/11 of which $50 million is hedged) |
$ | (1.7 | ) | $ | (1.0 | ) | $ | (0.02 | ) |
3
UNISOURCE ENERGY 4TH QUARTER EARNINGS VARIANCE EXPLANATION
4th Quarter 2010 UniSource Energy Net Income | $ | 11.3 | ||||||||||||||||||
4th Quarter | Change | |||||||||||||||||||
TEP |
2011 | 2010 | Pre-Tax | After Tax | ||||||||||||||||
-millions of dollars- | ||||||||||||||||||||
Utility Gross Margin Components: |
||||||||||||||||||||
Retail Margin Revenues* |
$ | 118.1 | $ | 117.4 | $ | 0.7 | $ | 0.5 | ||||||||||||
L-T Wholesale Margin Revenues* |
1.4 | 8.0 | (6.6 | ) | (4.4 | ) | ||||||||||||||
Transmission Revenues |
4.1 | 5.3 | (1.2 | ) | (0.8 | ) | ||||||||||||||
|
|
|
|
|
|
|
|
|||||||||||||
Total |
123.6 | 130.7 | (7.1 | ) | (4.8 | ) | ||||||||||||||
Other Income Sources: |
||||||||||||||||||||
Operating synergiesSpringerville Units 3&4 |
5.9 | 5.8 | 0.1 | 0.1 | ||||||||||||||||
Expenses: |
||||||||||||||||||||
Base O&M* |
63.9 | 65.4 | (1.5 | ) | (1.0 | ) | ||||||||||||||
Depreciation |
26.8 | 25.4 | 1.4 | 0.9 | ||||||||||||||||
Amortization |
9.4 | 8.2 | 1.2 | 0.8 | ||||||||||||||||
Total Other Deductions |
2.6 | 0.3 | 2.3 | 1.5 | ||||||||||||||||
Total Interest Expense |
23.6 | 23.9 | (0.3 | ) | (0.2 | ) | ||||||||||||||
Other Line Item Changes |
1.7 | 1.7 | 0.0 | 0.0 | ||||||||||||||||
Income Tax Expense (Benefit) |
(0.1 | ) | 1.5 | NM | (1.6 | ) | ||||||||||||||
|
|
|
|
|
|
|
|
|||||||||||||
TEP Net Income (GAAP) |
$ | 1.6 | $ | 10.1 | NM | $ | (8.5 | ) | ||||||||||||
|
|
|
|
|
|
|
|
|||||||||||||
Change in TEP Net Income | (8.5 | ) | ||||||||||||||||||
Other Business SegmentsAfter Tax Amounts |
||||||||||||||||||||
UNS Electric Net Income |
$ | 3.3 | $ | 3.4 | NM | $ | (0.1 | ) | ||||||||||||
UNS Gas Net Income |
4.3 | 3.3 | NM | 1.0 | ||||||||||||||||
Millennium Energy Holdings Net Income/(Loss) |
0.3 | (4.2 | ) | NM | 4.5 | |||||||||||||||
Other and Consolidating Adj. |
(1.3 | ) | (1.3 | ) | NM | 0.0 | ||||||||||||||
|
|
|
|
|
|
|
|
|||||||||||||
Total Income (Loss) from Other Business Segments and Consolidating Adjustments |
$ | 6.6 | $ | 1.2 | NM | $ | 5.4 | |||||||||||||
|
|
|
|
|
|
|
|
|||||||||||||
Change in UNS Electric, UNS Gas and Other | 5.4 | |||||||||||||||||||
4th Quarter 2011 UniSource Energy Net Income | $ | 8.2 |
* | Retail Margin Revenues, Long-Term Wholesale Margin and Base O&M are all non-GAAP measures. See pages 6 and 8 for are conciliation of these non-GAAP measures. |
Q4 Variance Explanation
4
UNISOURCE ENERGY YEAR OVER YEAR EARNINGS VARIANCE EXPLANATION
December 31, 2010 UniSource Energy Net Income | $ | 113.0 | ||||||||||||||||||
Year End | Change | |||||||||||||||||||
TEP |
2011 | 2010 | Pre-Tax | After Tax |
||||||||||||||||
-millions of dollars- | ||||||||||||||||||||
Utility Gross Margin Components: |
||||||||||||||||||||
Retail Margin Revenues* |
$ | 550.6 | $ | 550.6 | $ | 0.0 | $ | 0.0 | ||||||||||||
L-T Wholesale Margin Revenues* |
13.1 | 28.3 | (15.2 | ) | (9.4 | ) | ||||||||||||||
Transmission Revenues |
16.4 | 20.9 | (4.5 | ) | (2.8 | ) | ||||||||||||||
|
|
|
|
|
|
|
|
|||||||||||||
Total |
580.1 | 599.8 | (19.7 | ) | (12.2 | ) | ||||||||||||||
Other Income Sources: |
||||||||||||||||||||
El Paso Settlement |
7.4 | 0.0 | 7.4 | 4.6 | ||||||||||||||||
Operating synergiesSpringerville Units 3&4 |
24.1 | 23.8 | 0.3 | 0.2 | ||||||||||||||||
Expenses: |
||||||||||||||||||||
Loss related to the settlement of a dispute over transactions with the California Power Exchange (CPX) |
0.0 | 3.0 | (3.0 | ) | (1.9 | ) | ||||||||||||||
Base O&M* |
236.5 | 227.8 | 8.7 | 5.4 | ||||||||||||||||
Depreciation |
104.9 | 99.5 | 5.4 | 3.3 | ||||||||||||||||
Amortization |
34.7 | 32.2 | 2.5 | 1.6 | ||||||||||||||||
Total Other (Income) / Deductions |
2.8 | (1.8 | ) | 4.6 | 2.9 | |||||||||||||||
Total Interest Expense |
89.3 | 87.7 | 1.6 | 1.0 | ||||||||||||||||
Other Line Item Changes |
6.1 | 7.0 | (0.9 | ) | (0.6 | ) | ||||||||||||||
Income Tax Expense |
52.0 | 59.9 | NM | (7.9 | ) | |||||||||||||||
|
|
|
|
|
|
|
|
|||||||||||||
TEP Net Income (GAAP) |
$ | 85.3 | $ | 108.3 | NM | $ | (23.0 | ) | ||||||||||||
|
|
|
|
|
|
|
|
|||||||||||||
Change in TEP Net Income | (23.0 | ) | ||||||||||||||||||
Other Business SegmentsAfter Tax Amounts |
||||||||||||||||||||
UNS Electric Net Income** |
$ | 17.7 | $ | 15.5 | NM | $ | 2.2 | |||||||||||||
UNS Gas Net Income |
10.2 | 8.6 | NM | 1.6 | ||||||||||||||||
Millennium Energy Holdings Net Income/(Loss) |
2.3 | (13.5 | ) | NM | 15.8 | |||||||||||||||
Other and Consolidating Adj. |
(5.5 | ) | (5.9 | ) | NM | 0.4 | ||||||||||||||
|
|
|
|
|
|
|
|
|||||||||||||
Total Other Income and Consolidating Adjustments |
$ | 24.7 | $ | 4.7 | NM | $ | 20.0 | |||||||||||||
|
|
|
|
|
|
|
|
|||||||||||||
Change in UNS Electric, UNS Gas and Other | 20.0 | |||||||||||||||||||
December 31, 2011 UniSource Energy Net Income | $ | 110.0 |
* | Retail Margin Revenues, Long-Term Wholesale Margin and Base O&M are all non-GAAP measures. See pages 7 and 9 for are conciliation of these non-GAAP measures. |
** | UNS Electrics results in 2010 include a after-tax gain of $1.8 million related to the settlement of a dispute over transactions with |
YE Variance Explanation
5
UNISOURCE ENERGY AND TEP O&M
UniSource Energy | 4th Quarter | Year End | ||||||||||||||
O&M Components |
2011 | 2010 | 2011 | 2010 | ||||||||||||
-millions of dollars- | -millions of dollars- | |||||||||||||||
TEP Base O&M (Non-GAAP) |
$ | 63.9 | $ | 65.4 | $ | 236.5 | $ | 227.8 | ||||||||
UNS Gas Base O&M (Non-GAAP) |
6.2 | 6.7 | 23.9 | 24.6 | ||||||||||||
UNS Electric Base O&M (Non-GAAP) |
5.6 | 5.6 | 20.6 | 21.1 | ||||||||||||
Consolidating Adjustments & Other |
(3.9 | ) | (1.9 | ) | (11.2 | ) | (8.4 | ) | ||||||||
|
|
|
|
|
|
|
|
|||||||||
UniSource Energy Base O&M (Non-GAAP) |
$ | 71.8 | $ | 75.8 | $ | 269.8 | $ | 265.1 | ||||||||
Reimbursed O&M Related to Springerville Units 3 and 4 |
14.4 | 24.0 | 62.9 | 64.5 | ||||||||||||
O&M Related to Customer-funded Renewable Energy and DSM Programs |
11.1 | 11.3 | 46.5 | 40.4 | ||||||||||||
|
|
|
|
|
|
|
|
|||||||||
UniSource Energy O&M (GAAP) |
$ | 97.3 | $ | 111.1 | $ | 379.2 | $ | 370.0 | ||||||||
|
|
|
|
|
|
|
|
|||||||||
TEP | 4th Quarter | Year End | ||||||||||||||
O&M Components |
2011 | 2010 | 2011 | 2010 | ||||||||||||
-millions of dollars- | -millions of dollars- | |||||||||||||||
TEP Base O&M (Non-GAAP) |
$ | 63.9 | $ | 65.4 | $ | 236.5 | $ | 227.8 | ||||||||
O&M Recorded in Other Expense |
(2.8 | ) | (2.2 | ) | (8.0 | ) | (7.1 | ) | ||||||||
Reimbursed O&M Related to Springerville Units 3 and 4 |
14.4 | 24.0 | 62.9 | 64.5 | ||||||||||||
O&M Related to Customer-funded Renewable Energy and DSM Programs |
8.9 | 9.8 | 39.4 | 31.4 | ||||||||||||
|
|
|
|
|
|
|
|
|||||||||
TEP O&M (GAAP) |
$ | 84.4 | $ | 97.0 | $ | 330.8 | $ | 316.6 | ||||||||
|
|
|
|
|
|
|
|
Base O&M, a non-GAAP financial measure, should not be considered as an alternative to Other O&M, which is determined in accordance with GAAP. We believe Base O&M provides useful information to investors because it represents the fundamental level of operating and maintenance expense related to our core utility business. Base O&M excludes expenses that are directly offset by revenues collected from customers and other third parties.
O&M
6
TEP - OPERATING STATISTICS
Three Months Ended December 31, | Year End | |||||||||||||||||||||||||||||||
2011 | 2010 | Incr (Decr) | % Change | 2011 | 2010 | Incr (Decr) | % Change | |||||||||||||||||||||||||
AVG. ELECTRIC CUSTOMERS |
||||||||||||||||||||||||||||||||
Residential |
367,083 | 366,174 | 909 | 0.2 | % | 366,582 | 365,768 | 814 | 0.2 | % | ||||||||||||||||||||||
Commercial |
36,174 | 35,885 | 289 | 0.8 | % | 36,058 | 35,860 | 198 | 0.6 | % | ||||||||||||||||||||||
Industrial |
636 | 637 | (1 | ) | -0.2 | % | 636 | 633 | 3 | 0.5 | % | |||||||||||||||||||||
Mining |
3 | 3 | | 0.0 | % | 2 | 2 | | 0.0 | % | ||||||||||||||||||||||
Other |
62 | 62 | | 0.0 | % | 62 | 62 | | 0.0 | % | ||||||||||||||||||||||
|
|
|
|
|
|
|
|
|
|
|
|
|
|
|
|
|||||||||||||||||
Total |
403,958 | 402,761 | 1,197 | 0.3 | % | 403,340 | 402,325 | 1,015 | 0.3 | % | ||||||||||||||||||||||
|
|
|
|
|
|
|
|
|
|
|
|
|
|
|
|
|||||||||||||||||
RETAIL SALESMWH |
||||||||||||||||||||||||||||||||
Residential |
779,550 | 760,533 | 19,017 | 2.5 | % | 3,888,011 | 3,869,540 | 18,471 | 0.5 | % | ||||||||||||||||||||||
Commercial |
455,688 | 447,568 | 8,120 | 1.8 | % | 1,972,526 | 1,963,469 | 9,057 | 0.5 | % | ||||||||||||||||||||||
Industrial |
491,555 | 499,249 | (7,694 | ) | -1.5 | % | 2,145,163 | 2,138,749 | 6,414 | 0.3 | % | |||||||||||||||||||||
Mining |
272,138 | 272,755 | (617 | ) | -0.2 | % | 1,083,071 | 1,079,327 | 3,744 | 0.3 | % | |||||||||||||||||||||
Other |
61,086 | 62,635 | (1,549 | ) | -2.5 | % | 243,337 | 240,703 | 2,634 | 1.1 | % | |||||||||||||||||||||
|
|
|
|
|
|
|
|
|
|
|
|
|
|
|
|
|||||||||||||||||
Total |
2,060,017 | 2,042,740 | 17,277 | 0.8 | % | 9,332,108 | 9,291,788 | 40,320 | 0.4 | % | ||||||||||||||||||||||
|
|
|
|
|
|
|
|
|
|
|
|
|
|
|
|
|||||||||||||||||
RETAIL USAGEKWH/CUSTOMER |
||||||||||||||||||||||||||||||||
Residential |
2,124 | 2,077 | 47 | 2.3 | % | 10,606 | 10,579 | 27 | 0.3 | % | ||||||||||||||||||||||
Commercial |
12,597 | 12,472 | 125 | 1.0 | % | 54,704 | 54,754 | (50 | ) | -0.1 | % | |||||||||||||||||||||
Industrial |
772,885 | 783,750 | (10,865 | ) | -1.4 | % | 3,372,898 | 3,378,750 | (5,852 | ) | -0.2 | % | ||||||||||||||||||||
Mining |
90,712,667 | 90,918,333 | (205,666 | ) | -0.2 | % | 541,535,500 | 539,663,500 | 1,872,000 | 0.3 | % | |||||||||||||||||||||
Other |
985,258 | 1,010,242 | (24,984 | ) | -2.5 | % | 3,924,790 | 3,882,306 | 42,484 | 1.1 | % | |||||||||||||||||||||
|
|
|
|
|
|
|
|
|
|
|
|
|
|
|
|
|||||||||||||||||
Total |
5,100 | 5,072 | 28 | 0.6 | % | 23,137 | 23,095 | 42 | 0.2 | % | ||||||||||||||||||||||
|
|
|
|
|
|
|
|
|
|
|
|
|
|
|
|
|||||||||||||||||
WEATHER -COOLING DEGREE DAYS |
||||||||||||||||||||||||||||||||
Actual |
49 | 53 | (4 | ) | -7.5 | % | 1,528 | 1,543 | (15 | ) | -1.0 | % | ||||||||||||||||||||
10-Year Average |
38 | 36 | 1,473 | 1,468 | ||||||||||||||||||||||||||||
% Change Actual vs. 10-Year Avg. |
28.9 | % | 47.2 | % | 3.7 | % | 5.1 | % | ||||||||||||||||||||||||
WEATHERHEATING DEGREE DAYS |
||||||||||||||||||||||||||||||||
Actual |
694 | 500 | 194 | 38.8 | % | 1,597 | 1,469 | 128 | 8.7 | % | ||||||||||||||||||||||
10-Year Average |
566 | 559 | 1,417 | 1,430 | ||||||||||||||||||||||||||||
% Change Actual vs. 10-Year Avg. |
22.6 | % | -10.6 | % | 12.7 | % | 2.7 | % | ||||||||||||||||||||||||
ENERGY MARKET INDICATORS |
||||||||||||||||||||||||||||||||
Avg. Wholesale Power Prices |
||||||||||||||||||||||||||||||||
Palo Verde Index$/MWh |
||||||||||||||||||||||||||||||||
On Peak |
$ | 33.28 | $ | 34.49 | $ | (1.21 | ) | -3.5 | % | $ | 36.23 | $ | 38.93 | $ | (2.70 | ) | -6.9 | % | ||||||||||||||
Off Peak |
$ | 24.55 | $ | 26.21 | $ | (1.66 | ) | -6.3 | % | $ | 21.60 | $ | 28.00 | $ | (6.40 | ) | -22.9 | % | ||||||||||||||
Avg. Natural Gas Prices |
||||||||||||||||||||||||||||||||
Permian Index$/MMBtu |
$ | 3.43 | $ | 3.58 | $ | (0.15 | ) | -4.2 | % | $ | 3.89 | $ | 4.18 | $ | (0.29 | ) | -6.9 | % |
TEP Operating Stats
7
TEP - RETAIL AND WHOLESALE MARGIN REVENUES
Three Months Ended December 31, | Year End | |||||||||||||||||||||||||||||||
2011 | 2010 | Incr (Decr) | % Change | 2011 | 2010 | Incr (Decr) | % Change | |||||||||||||||||||||||||
RETAIL REVENUES$ MILLIONS |
||||||||||||||||||||||||||||||||
Margin Revenues: |
||||||||||||||||||||||||||||||||
Residential |
$ | 49.3 | $ | 48.1 | $ | 1.2 | 2.5 | % | $ | 251.9 | $ | 251.5 | $ | 0.4 | 0.2 | % | ||||||||||||||||
Commercial |
36.4 | 35.7 | 0.7 | 2.0 | % | 160.0 | 159.1 | 0.9 | 0.6 | % | ||||||||||||||||||||||
Industrial |
21.6 | 22.7 | (1.1 | ) | -4.8 | % | 94.8 | 96.8 | (2.0 | ) | -2.1 | % | ||||||||||||||||||||
Mining |
7.7 | 7.8 | (0.1 | ) | -1.3 | % | 31.6 | 31.0 | 0.6 | 1.9 | % | |||||||||||||||||||||
Other |
3.1 | 3.1 | | 0.0 | % | 12.3 | 12.2 | 0.1 | 0.8 | % | ||||||||||||||||||||||
|
|
|
|
|
|
|
|
|
|
|
|
|
|
|
|
|||||||||||||||||
Total |
$ | 118.1 | $ | 117.4 | $ | 0.7 | 0.6 | % | $ | 550.6 | $ | 550.6 | | 0.0 | % | |||||||||||||||||
DSM / REST |
10.5 | 8.0 | 2.5 | 31.3 | % | 46.6 | 37.8 | 8.8 | 23.3 | % | ||||||||||||||||||||||
Fuel Revenues: |
||||||||||||||||||||||||||||||||
Recovered from Customers |
61.1 | 57.5 | 3.6 | 6.3 | % | 306.7 | 279.8 | 26.9 | 9.6 | % | ||||||||||||||||||||||
|
|
|
|
|
|
|
|
|
|
|
|
|
|
|
|
|||||||||||||||||
Total Retail Revenues |
$ | 189.7 | $ | 182.9 | $ | 6.8 | 3.7 | % | $ | 903.9 | $ | 868.2 | $ | 35.7 | 4.1 | % | ||||||||||||||||
|
|
|
|
|
|
|
|
|
|
|
|
|
|
|
|
|||||||||||||||||
RETAIL REVENUESCENTS / KWH |
||||||||||||||||||||||||||||||||
Margin Revenues: |
||||||||||||||||||||||||||||||||
Residential |
6.32 | 6.32 | | 0.0 | % | 6.48 | 6.50 | (0.02 | ) | -0.3 | % | |||||||||||||||||||||
Commercial |
7.99 | 7.98 | 0.01 | 0.1 | % | 8.11 | 8.10 | 0.01 | 0.1 | % | ||||||||||||||||||||||
Industrial |
4.39 | 4.55 | (0.16 | ) | -3.5 | % | 4.42 | 4.53 | (0.11 | ) | -2.4 | % | ||||||||||||||||||||
Mining |
2.83 | 2.86 | (0.03 | ) | -1.0 | % | 2.92 | 2.87 | 0.05 | 1.7 | % | |||||||||||||||||||||
Other |
5.07 | 4.95 | 0.12 | 2.4 | % | 5.05 | 5.07 | (0.02 | ) | -0.4 | % | |||||||||||||||||||||
|
|
|
|
|
|
|
|
|
|
|
|
|
|
|
|
|||||||||||||||||
Total |
5.73 | 5.75 | (0.02 | ) | -0.3 | % | 5.90 | 5.93 | (0.03 | ) | -0.5 | % | ||||||||||||||||||||
DSM / REST |
0.51 | 0.39 | 0.12 | 30.8 | % | 0.50 | 0.41 | 0.09 | 22.0 | % | ||||||||||||||||||||||
Fuel Revenues: |
||||||||||||||||||||||||||||||||
Recovered from Customers |
2.97 | 2.81 | 0.16 | 5.7 | % | 3.29 | 3.01 | 0.28 | 9.3 | % | ||||||||||||||||||||||
|
|
|
|
|
|
|
|
|
|
|
|
|
|
|
|
|||||||||||||||||
Total Retail Revenues |
9.21 | 8.95 | 0.26 | 2.9 | % | 9.69 | 9.34 | 0.35 | 3.7 | % | ||||||||||||||||||||||
|
|
|
|
|
|
|
|
|
|
|
|
|
|
|
|
|||||||||||||||||
LONG-TERM WHOLESALE MARGIN (Non-GAAP)$ MILLIONS |
||||||||||||||||||||||||||||||||
Long-Term Wholesale Margin Revenues (Non-GAAP) |
$ | 1.4 | $ | 8.0 | $ | (6.6 | ) | -82.5 | % | $ | 13.1 | $ | 28.3 | $ | (15.2 | ) | -53.7 | % | ||||||||||||||
Fuel and Purchased Power Expense Allocated to Long- |
||||||||||||||||||||||||||||||||
Term Wholesale Revenues |
6.8 | 5.9 | 0.9 | 15.3 | % | 28.0 | 27.4 | 0.6 | 2.2 | % | ||||||||||||||||||||||
|
|
|
|
|
|
|
|
|
|
|
|
|
|
|
|
|||||||||||||||||
Long-Term Wholesale Revenues |
$ | 8.2 | $ | 13.9 | $ | (5.7 | ) | -41.0 | % | $ | 41.1 | $ | 55.7 | $ | (14.6 | ) | -26.2 | % | ||||||||||||||
Wholesale Transmission Revenues |
4.1 | 5.3 | (1.2 | ) | -22.6 | % | 16.4 | 20.9 | (4.5 | ) | -21.5 | % | ||||||||||||||||||||
Short-term Wholesale Revenues |
20.9 | 24.9 | (4.0 | ) | -16.1 | % | 72.4 | 64.5 | 7.9 | 12.2 | % | |||||||||||||||||||||
|
|
|
|
|
|
|
|
|
|
|
|
|
|
|
|
|||||||||||||||||
Electric Wholesale Sales (GAAP) |
$ | 33.2 | $ | 44.1 | $ | (10.9 | ) | -24.7 | % | $ | 129.9 | $ | 141.1 | $ | (11.2 | ) | -7.9 | % | ||||||||||||||
|
|
|
|
|
|
|
|
|
|
|
|
|
|
|
|
Retail Margin Revenues, a non-GAAP financial measure, should not be considered as an alternative to Net Electric Retail Sales, which is determined in accordance with GAAP. Retail Margin Revenues excludes: (i) revenues collected from retail customers that are directly offset by expenses recorded in other line items; and (ii) revenues collected from third parties that are unrelated to kWh sales to retail customers. We believe the change in Retail Margin Revenues between periods provides useful information to investors because it demonstrates the underlying revenue trend and performance of our core utility business. Retail Margin Revenues represents the portion of retail operating revenues available to cover the operating expenses of our core utility business.
Long-Term Wholesale Margin Revenues, a non-GAAP financial measure, should not be considered as an alternative to Electric Wholesale Sales, which is determined in accordance with GAAP. We believe the change in Long-Term Wholesale Margin Revenues between periods provides useful information to investors because it demonstrates the underlying profitability of TEPs long-term wholesale sales contracts. Long-Term Wholesale Margin Revenues represents the portion of long-term wholesale revenues available to cover the operating expenses of our core utility business.
TEP Margin Revenues
8
UNS ELECTRIC - OPERATING STATISTICS
Three Months Ended December 31, | Year End | |||||||||||||||||||||||||||||||
2011 | 2010 | Incr (Decr) | % Change | 2011 | 2010 | Incr (Decr) | % Change | |||||||||||||||||||||||||
AVG. ELECTRIC CUSTOMERS |
||||||||||||||||||||||||||||||||
Residential |
80,596 | 80,224 | 372 | 0.5 | % | 80,576 | 80,168 | 408 | 0.5 | % | ||||||||||||||||||||||
Commercial |
10,406 | 10,343 | 63 | 0.6 | % | 10,387 | 10,345 | 42 | 0.4 | % | ||||||||||||||||||||||
Industrial |
21 | 22 | (1 | ) | -4.5 | % | 22 | 23 | (1 | ) | -4.3 | % | ||||||||||||||||||||
Mining |
2 | 2 | | 0.0 | % | 2 | 2 | | 0.0 | % | ||||||||||||||||||||||
Other |
325 | 258 | 67 | 26.0 | % | 268 | 264 | 4 | 1.5 | % | ||||||||||||||||||||||
|
|
|
|
|
|
|
|
|
|
|
|
|
|
|
|
|||||||||||||||||
Total |
91,350 | 90,849 | 501 | 0.6 | % | 91,255 | 90,802 | 453 | 0.5 | % | ||||||||||||||||||||||
|
|
|
|
|
|
|
|
|
|
|
|
|
|
|
|
|||||||||||||||||
RETAIL SALES MWH |
||||||||||||||||||||||||||||||||
Residential |
175,800 | 167,895 | 7,905 | 4.7 | % | 827,795 | 820,352 | 7,443 | 0.9 | % | ||||||||||||||||||||||
Commercial |
139,126 | 136,381 | 2,745 | 2.0 | % | 601,871 | 606,241 | (4,370 | ) | -0.7 | % | |||||||||||||||||||||
Industrial |
53,498 | 53,770 | (272 | ) | -0.5 | % | 220,930 | 219,241 | 1,689 | 0.8 | % | |||||||||||||||||||||
Mining |
28,146 | 60,054 | (31,908 | ) | -53.1 | % | 200,619 | 209,307 | (8,688 | ) | -4.2 | % | ||||||||||||||||||||
Other |
506 | 498 | 8 | 1.6 | % | 1,689 | 2,018 | (329 | ) | -16.3 | % | |||||||||||||||||||||
|
|
|
|
|
|
|
|
|
|
|
|
|
|
|
|
|||||||||||||||||
Total |
397,076 | 418,598 | (21,522 | ) | -5.1 | % | 1,852,904 | 1,857,159 | (4,255 | ) | -0.2 | % | ||||||||||||||||||||
|
|
|
|
|
|
|
|
|
|
|
|
|
|
|
|
|||||||||||||||||
RETAIL USAGE KWH/CUSTOMER |
||||||||||||||||||||||||||||||||
Residential |
2,181 | 2,093 | 88 | 4.2 | % | 10,273 | 10,233 | 40 | 0.4 | % | ||||||||||||||||||||||
Commercial |
13,370 | 13,186 | 184 | 1.4 | % | 57,945 | 58,602 | (657 | ) | -1.1 | % | |||||||||||||||||||||
Industrial |
2,547,524 | 2,444,091 | 103,433 | 4.2 | % | 10,042,273 | 9,532,217 | 510,056 | 5.4 | % | ||||||||||||||||||||||
Mining |
NM | NM | NM | N/M | NM | NM | NM | N/M | ||||||||||||||||||||||||
Other |
1,557 | 1,930 | (373 | ) | -19.3 | % | 6,302 | 7,644 | (1,342 | ) | -17.6 | % | ||||||||||||||||||||
|
|
|
|
|
|
|
|
|
|
|
|
|
|
|
|
|||||||||||||||||
Total |
4,347 | 4,608 | (261 | ) | -5.7 | % | 20,305 | 20,453 | (148 | ) | -0.7 | % | ||||||||||||||||||||
|
|
|
|
|
|
|
|
|
|
|
|
|
|
|
|
|||||||||||||||||
RETAIL REVENUES MILLIONS |
||||||||||||||||||||||||||||||||
Margin Revenues: |
||||||||||||||||||||||||||||||||
Residential |
$ | 6.8 | $ | 6.4 | $ | 0.4 | 6.2 | % | $ | 31.2 | $ | 27.4 | $ | 3.8 | 13.9 | % | ||||||||||||||||
Commercial |
6.9 | 7.0 | (0.1 | ) | -1.4 | % | 28.9 | 27.3 | 1.6 | 5.9 | % | |||||||||||||||||||||
Industrial |
2.3 | 2.3 | | 0.0 | % | 9.0 | 8.6 | 0.4 | 4.7 | % | ||||||||||||||||||||||
Mining |
1.7 | 1.6 | 0.1 | 6.2 | % | 6.6 | 5.4 | 1.2 | 22.2 | % | ||||||||||||||||||||||
Other |
0.1 | | 0.1 | N/M | 0.3 | 0.4 | (0.1 | ) | -25.0 | % | ||||||||||||||||||||||
|
|
|
|
|
|
|
|
|
|
|
|
|
|
|
|
|||||||||||||||||
Total Margin Revenues |
$ | 17.8 | $ | 17.3 | $ | 0.5 | 2.9 | % | $ | 76.0 | $ | 69.1 | $ | 6.9 | 10.0 | % | ||||||||||||||||
DSM / REST |
2.2 | 1.7 | 0.5 | 29.4 | % | 6.6 | 8.5 | (1.9 | ) | -22.4 | % | |||||||||||||||||||||
Fuel Revenues: |
||||||||||||||||||||||||||||||||
Recovered from Customers |
20.0 | 24.4 | (4.4 | ) | -18.0 | % | 99.3 | 105.2 | (5.9 | ) | -5.6 | % | ||||||||||||||||||||
|
|
|
|
|
|
|
|
|
|
|
|
|
|
|
|
|||||||||||||||||
Total Retail Revenues |
$ | 40.0 | $ | 43.4 | $ | (3.4 | ) | -7.8 | % | $ | 181.9 | $ | 182.8 | $ | (0.9 | ) | -0.5 | % | ||||||||||||||
|
|
|
|
|
|
|
|
|
|
|
|
|
|
|
|
|||||||||||||||||
WEATHER COOLING DEGREE DAYS |
||||||||||||||||||||||||||||||||
Actual |
579 | 587 | (8 | ) | -1.4 | % | 9,092 | 8,821 | 271 | 3.1 | % | |||||||||||||||||||||
10-Year Average |
560 | 569 | 8,994 | 9,031 | ||||||||||||||||||||||||||||
% Change Actual vs. 10-Year Avg. |
3.4 | % | 3.2 | % | 1.1 | % | -2.3 | % | ||||||||||||||||||||||||
WEATHER HEATING DEGREE DAYS |
||||||||||||||||||||||||||||||||
Actual |
2,801 | 2,410 | 391 | 16.2 | % | 6,794 | 6,629 | 165 | 2.5 | % | ||||||||||||||||||||||
10-Year Average |
2,559 | 2,532 | 6,399 | 6,418 | ||||||||||||||||||||||||||||
% Change Actual vs. 10-Year Avg. |
9.5 | % | -4.8 | % | 6.2 | % | 3.3 | % |
Retail Margin Revenues, a non-GAAP financial measure, should not be considered as an alternative to Total Retail Revenues, which is determined in accordance with GAAP. Retail Margin Revenues exclude revenues collected from retail customers that are directly offset by expenses recorded in other line items. We believe the change in Retail Margin Revenues between periods provides useful information to investors because it demonstrates the underlying revenue trend and performance of our core utility business. Retail Margin Revenues represents the portion of retail operating revenues available to cover the operating expenses of our core utility business.
UNS Electric Op. Stats
9
UNS GAS - OPERATING STATISTICS
Three Months Ended December 31 | Year End | |||||||||||||||||||||||||||||||
2011 | 2010 | Incr (Decr) | % Change | 2011 | 2010 | Incr (Decr) | % Change | |||||||||||||||||||||||||
AVG. GAS CUSTOMERS |
||||||||||||||||||||||||||||||||
Residential |
134,673 | 133,729 | 944 | 0.7 | % | 134,227 | 133,337 | 890 | 0.7 | % | ||||||||||||||||||||||
Commercial |
11,282 | 11,178 | 104 | 0.9 | % | 11,243 | 11,231 | 12 | 0.1 | % | ||||||||||||||||||||||
Industrial |
22 | 22 | | 0.0 | % | 22 | 23 | (1 | ) | -4.3 | % | |||||||||||||||||||||
Other |
1,122 | 1,105 | 17 | 1.5 | % | 1,117 | 1,095 | 22 | 2.0 | % | ||||||||||||||||||||||
|
|
|
|
|
|
|
|
|
|
|
|
|
|
|
|
|||||||||||||||||
Total |
147,099 | 146,034 | 1,065 | 0.7 | % | 146,609 | 145,686 | 923 | 0.6 | % | ||||||||||||||||||||||
|
|
|
|
|
|
|
|
|
|
|
|
|
|
|
|
|||||||||||||||||
RETAIL SALESTHOUSANDS OF THERMS |
||||||||||||||||||||||||||||||||
Residential |
25,830 | 23,434 | 2,396 | 10.2 | % | 73,925 | 73,083 | 842 | 1.2 | % | ||||||||||||||||||||||
Commercial |
10,208 | 9,273 | 935 | 10.1 | % | 31,091 | 30,209 | 882 | 2.9 | % | ||||||||||||||||||||||
Industrial |
719 | 575 | 144 | 25.0 | % | 2,374 | 1,932 | 442 | 22.9 | % | ||||||||||||||||||||||
Other |
2,349 | 2,163 | 186 | 8.6 | % | 6,614 | 6,628 | (14 | ) | -0.2 | % | |||||||||||||||||||||
|
|
|
|
|
|
|
|
|
|
|
|
|
|
|
|
|||||||||||||||||
Total |
39,106 | 35,445 | 3,661 | 10.3 | % | 114,004 | 111,852 | 2,152 | 1.9 | % | ||||||||||||||||||||||
|
|
|
|
|
|
|
|
|
|
|
|
|
|
|
|
|||||||||||||||||
RETAIL USAGETHERMS/CUSTOMER |
||||||||||||||||||||||||||||||||
Residential |
192 | 175 | 17 | 9.7 | % | 551 | 548 | 3 | 0.5 | % | ||||||||||||||||||||||
Commercial |
905 | 830 | 75 | 9.0 | % | 2,765 | 2,690 | 75 | 2.8 | % | ||||||||||||||||||||||
Industrial |
32,682 | 26,136 | 6,546 | 25.0 | % | 107,909 | 84,000 | 23,909 | 28.5 | % | ||||||||||||||||||||||
Other |
2,094 | 1,957 | 137 | 7.0 | % | 5,921 | 6,053 | (132 | ) | -2.2 | % | |||||||||||||||||||||
|
|
|
|
|
|
|
|
|
|
|
|
|
|
|
|
|||||||||||||||||
Total |
266 | 243 | 23 | 9.5 | % | 778 | 768 | 10 | 1.3 | % | ||||||||||||||||||||||
|
|
|
|
|
|
|
|
|
|
|
|
|
|
|
|
|||||||||||||||||
RETAIL REVENUESMILLIONS |
||||||||||||||||||||||||||||||||
Margin Revenues: |
||||||||||||||||||||||||||||||||
Residential |
$ | 12.3 | $ | 11.4 | $ | 0.9 | 7.9 | % | $ | 39.7 | $ | 38.7 | $ | 1.0 | 2.6 | % | ||||||||||||||||
Commercial |
3.4 | 3.1 | 0.3 | 9.7 | % | 10.7 | 10.2 | 0.5 | 4.9 | % | ||||||||||||||||||||||
Other |
0.7 | 0.7 | | 0.0 | % | 2.2 | 2.1 | 0.1 | 4.8 | % | ||||||||||||||||||||||
|
|
|
|
|
|
|
|
|
|
|
|
|
|
|
|
|||||||||||||||||
Total Margin Revenues |
$ | 16.4 | $ | 15.2 | $ | 1.2 | 7.9 | % | $ | 52.6 | $ | 51.0 | $ | 1.6 | 3.1 | % | ||||||||||||||||
DSM Revenues |
0.3 | 0.3 | | 0.0 | % | 1.1 | 1.0 | 0.1 | 10.0 | % | ||||||||||||||||||||||
Transport/NSP Revenues |
4.0 | 4.2 | (0.2 | ) | -4.8 | % | 16.6 | 17.4 | (0.8 | ) | -4.6 | % | ||||||||||||||||||||
Fuel Revenues: |
||||||||||||||||||||||||||||||||
Recovered from Customers |
25.8 | 25.4 | 0.4 | 1.6 | % | 77.3 | 76.5 | 0.8 | 1.0 | % | ||||||||||||||||||||||
|
|
|
|
|
|
|
|
|
|
|
|
|
|
|
|
|||||||||||||||||
Total Gas Revenues |
$ | 46.5 | $ | 45.1 | $ | 1.4 | 3.1 | % | $ | 147.6 | $ | 145.9 | $ | 1.7 | 1.2 | % | ||||||||||||||||
|
|
|
|
|
|
|
|
|
|
|
|
|
|
|
|
|||||||||||||||||
WEATHERHEATING DEGREE DAYS |
||||||||||||||||||||||||||||||||
Actual |
10,080 | 9,138 | 942 | 10.3 | % | 25,794 | 25,457 | 337 | 1.3 | % | ||||||||||||||||||||||
10-Year Average |
9,622 | 9,545 | 24,894 | 24,828 | ||||||||||||||||||||||||||||
% Change Actual vs. 10-Year Avg. |
4.8 | % | -4.3 | % | 3.6 | % | 2.5 | % |
Retail Margin Revenues, a non-GAAP financial measure, should not be considered as an alternative to Total Gas Revenues, which is determined in accordance with GAAP. Retail Margin Revenues excludes revenues collected from retail customers that are directly offset by expenses recorded in other line items. We believe the change in Retail Margin Revenues between periods provides useful information to investors because it demonstrates the underlying revenue trend and performance of our core utility business. Retail Margin Revenues represents the portion of retail operating revenues available to cover the operating expenses of our core utility
UNS Gas Op. Stats
10
BASIC AND DILUTED SHARES OUTSTANDING
Years Ended December 31, | ||||||||||||
2011 | 2010 | 2009 | ||||||||||
-In Thousands- | ||||||||||||
Numerator: |
||||||||||||
Net Income |
$ | 109,975 | $ | 112,984 | $ | 105,901 | ||||||
Income from Assumed Conversion of Convertible Senior Notes |
4,390 | 4,390 | 4,390 | |||||||||
|
|
|
|
|
|
|||||||
Adjusted Numerator |
$ | 114,365 | $ | 117,374 | $ | 110,291 | ||||||
|
|
|
|
|
|
|||||||
Denominator: |
||||||||||||
Weighted-average Shares of Common Stock Outstanding |
||||||||||||
Common Shares Issued |
36,780 | 36,200 | 35,653 | |||||||||
Participating Securities |
53 | 92 | 100 | |||||||||
Fully Vested Deferred Stock Units |
129 | 123 | 105 | |||||||||
|
|
|
|
|
|
|||||||
Total Weighted-average Shares of Common Stock Outstanding and Participating SecuritiesBasic |
36,962 | 36,415 | 35,858 | |||||||||
Effect of Diluted Securities |
||||||||||||
Convertible Senior Notes |
4,281 | 4,178 | 4,093 | |||||||||
Options and Stock Issuable under Employee Benefit Plans and the Directors Plan |
366 | 448 | 499 | |||||||||
|
|
|
|
|
|
|||||||
Total Shares |
41,609 | 41,041 | 40,450 | |||||||||
|
|
|
|
|
|
The following table shows the number of stock options excluded from the diluted EPS computation because the stock options exercise price was greater than the average market price of the Common Stock:
Years Ended December 31, | ||||||||||||
2011 | 2010 | 2009 | ||||||||||
-In Thousands- | ||||||||||||
Stock Options Excluded from the Diluted EPS Computation |
153 | 212 | 395 |
Diluted Share Count
11
Exhibit 99.3
2011 Year-End Earnings Call Feb. 27, 2012 |
UniSource Energy Safe Harbor Safe Harbor and Non-GAAP Measures This document contains forward-looking information that involves risks and uncertainties, that include, but are not limited to: state and federal regulatory and legislative decisions and actions; regional economic and market conditions which could affect customer growth and energy usage; weather variations affecting energy usage; the cost of debt and equity capital and access to capital markets; the performance of the stock market and changing interest rate environment, which affect the value of the company's pension and other postretirement benefit plan assets and the related contribution requirements and expense; unexpected increases in O&M expense; resolution of pending litigation matters; changes in accounting standards; changes in critical accounting estimates; the ongoing restructuring of the electric industry; changes to long-term contracts; the cost of fuel and power supplies; performance of TEP's generating plants; and other factors listed in UniSource Energy's Form 10-K and 10-Q filings with the Securities and Exchange Commission. The preceding factors may cause future results to differ materially from historical results or from outcomes currently expected by UniSource Energy. The Company's press releases and other communications may include certain non-Generally Accepted Accounting Principles (GAAP) financial measures. A "non-GAAP financial measure" is defined as a numerical measure of a company's financial performance, financial position or cash flows that excludes (or includes) amounts that are included in (or excluded from) the most directly comparable measure calculated and presented in accordance with GAAP in the Company's financial statements. Non-GAAP financial measures utilized by the Company include presentations of revenues, operating expenses, operating income and earnings (loss) per share. The Company uses these non-GAAP measures to evaluate the operations of the Company. Certain non- GAAP financial measures utilized by the Company exclude: the impact of non-recurring items: the effect of accounting changes or adjustments; expenses that are reimbursed by third parties; and other items. The Company's management believes that these non- GAAP financial measures provide useful information to investors by removing the effect of variances in GAAP reported results of operations that are not indicative of fundamental changes in the earnings or cash flow capacity of the Company's operations. Management also believes that the presentation of the non-GAAP financial measures is largely consistent with its past practice, as well as industry practice in general, and will enable investors and analysts to compare current non-GAAP measures with non-GAAP measures with respect to prior periods. Please refer to Exhibit 99.2 of the 8-K filed on February 27, 2012, for a reconciliation of non-GAAP measures with the most comparable GAAP measure. 1 |
(CHART) UniSource Energy Earnings Walk 2010 Reported Diluted EPS 2011 Reported Diluted EPS TEP L-T Wholesale Margin UNS Base O&M Millennium Losses (2010) UES Retail Margin UNS D&A El Paso Settlement (2011) Other TEP Wholesale Transm. UNS Interest Expense UNS Property Taxes 2 |
2012 Earnings Guidance and Sensitivities 2012 Earnings Guidance and Sensitivities 3 2012 Earnings Guidance Range: $2.05 - $2.35 per diluted share |
B)&^*9G'3%*%D5K;2#K%=&%4SI2J45G<[BE`WJL M@3AN13TBD2,FBMC[:ZT@F.;3MO1T)IB$T8#PJT78QZ$;@FCH1G%#0G-26T[= M:NHBSF/0FI+2>_%#0G.U24)[J.!$W:/0GQ%&;&2>E,2/G1TC:C*(JQCDBBI\ M*8@9^-%!QL.M$$6:.2,9H@VSZ4WNI0?/%$@C'@X%(3Y4F<#-)G/=TJ+R)Q)Q MX4BCUIJE$]=J:3@567`G$]]#6JN4J@K5BJDPH$1:]Z$I6*51Q0B:"S0ZB(I6 M.M"6NN6H4%1S2S-&%6(3F@N+YMNZG+7W"@*5M2[&T841JU8'F:`X=_.E6KSQ MY4%2M\TJQC2K$4K?TH:ETJCDT%:\FE':'`C%KSN:&32DY)IBL@;"E6,9`B*5 M@''44$FG*.33"1F@$PRB-)IJNII2=J8HG(I=C"B-)R::1GN-.[Z:H4(RXB*V M%,ZTY2LFFT,RXBTAI:;G>J'2=..](3O7&NH)-Y,0UP%=G!Z4@V%5EA.7L*92 MJ5D8[Z2JR\ZNKJZNG3J3-*-^F]=RGPKIT4()\J[D\Z[)QG;Y4HR.N_I4&=+$ MIIO38T_I2$9KZX5B4"M.]#/6I!&V#0EIH)$(#&]]>_:*TG>.)GL?:BL&E+;* MU#?[1KB+>95JMK*GY28:X#C`?2TD%2D!S"5%(.,C.U>`$[4^'/EVN2F3!ER( M,E.0E^*ZIIQ(/7"DD$?.LW&X=L13LAL001X&,T7"-<[3[6L$:1P\)+CRW%*6O(P>91.3D= F^^A"0EUQ(1S 8;D>JV9RU MF-_7->W9\7I-#\0HL`-!/KW1NFM97;AUPOMMYX1PN/NBY=M:3:KWIYN7'N5F M"W%*=@*F,[(6RX5JY7TE`YLA7*35M.TYJ_AKI_5\7V>7INL;Y#U]/MMYOMMA MMW2ZJAI98,!"R4+/8*<,I*U@!"UM^\<8%?&4*ZW"UQ9$>#<)D)B0.5YJ-)6T MAT=,*2D@*V\:#;9\RRN+ 6RHI/5)*2,CRZ4)^2ZQ).86ZM; M'6^HOIX;G67&(332?8W'?A7+UKI7B7:=`:59N]\M^M+._=+=I:*)'T)YVR+3 M,"$M@E#`FEU.WN)4,;8%6?'+5-YX&VOC-/TL(=FO\?4>EK2)L>&PXMAM=B=4 M^AI100`M30YBGZPSUS7Q#"F2[673#F2(9>06G#&>4T5H/5*N4C(/@=JBNJ6I M)"G7%))!(4LD$@8'?W#8>`I9N3*]@KO=1_\`SV]GK+\^FX&L^X>)T;B9]+U! MIW3FGH"_9W1IAF3#FS;:VFS-P1%:69C @\ >7/GC--=ND^1;6K _E9*=X>7A+=A"7 M5??!15'PQADI-T]PA7@:TVD-`Z@C\<^#C][]G8\*[0=:6N._/7$NG8S"Y( M0`POZ8ZXC?"B``"<'J*^36'GHBN=AYQA>, 5/;2MJW]ARK?:6QSI+;7.V$A"SC`)_.=M)[(M 8X41G!([^I^=6$NYS[BW%;EW"7);B#$=#\A;@9'@@*)Y>@Z8JAY)J%@4>P' MIM\YWXA0#<3[;3K_`%_K/5W'AK1G)-XBZ:O7WMTO;;;;XYE6ZR"?(3,3`9#> MZDE$0*("EA"E$8RHU;:TTU/UWQ+A\)=1VVTV;6&MN&MK6VIJ,Q'1'U#'=?D( M)+:0E"G.5]ISEVYG".X8^0>&G$=/#TW=$O2]CU?`NB&Q(B7QMWF0M"BI#C3[ M+C;S2\E0)0L P\=.#>MN.?$W3>K>'^G M;CJ/3&HK)9V;=-M;)
?.BQ9$:+/EQ8\@8?98D+;;='3WTI("OB#7J%P%7FJ34R,R@C74&]K^.DRVQ M"YF#;'JGU9I^SZ[T/P^U0.#=P7KG7,;6S]OU#J/3\/[XSGHJ8[1BE':)<7]' M\`I(4L#"U-I"E <<:@&@UGWKK) MC7#&H+C:KQ8$1.!7^YXW,DROO6TB"I\65*FY!D!O/TSZ8&D)'-SGW1C!WC18 M^J_Y7M6-=F;'LS?R13) YK[U&/][`M *U&0OLU*(YRAE))\2<8&U42G)2K<+>9 ,TO2Y%Q)07(!ZNW^K?I#@9+8VD&VO[V[I]?V"_ZF MU!Q.X2:%MCMNB62'H2U:C-L58VIWTF 1I2PLMAP\^>=0^WCD=2X0I&.G*0 E*<#JGW7UJ<*P M,!143DJ'0'.15JO(-9LMG&QOIUWOYWU[IR <)`&^*T6@Y&J9DOAM>>+- MF#G$%,[41AMZBMC;,R;:F;(\Z#)8*$E;290PA2TYW6!L*^(9#C\F3](?DOOO M%9=+KKREKYR02KF))SD#?KL*Z9(E7":J9+FRI4I2>0OOOK<<*<8QSJ).,$C& M:AN1:Y!^,:W\+WT'9KK[MWXZF/T^]/6>R<2-?7SBA[-6B-2ZHDM72_LZJN-K M1<3%:9=^B"#$>2P2VE(*$K6LI!'N@X&U>*D[4WLOP:6^979I)4E.3@'O./A3 MO3I6[@\.V%0IPO<=E^$SZ]456#3J6D%*!31-XK.WIR=ZX=13DCI7"1%2,]U' M1@"F-8WHP3FIO!,8Y`VHZ$]^,4-`R?*CH'PJPWB[&$0G<5(0DYH;2=\U(0DF MC"*,T*VCO^0H[::&@;T=`R<491$V,(A.*(@>--2,)HC?2C19C")%/0=Z8!M3 MDG!'>:N($PO=75P.U<=A4WE8A.,TWFQ2$Y)--)Q47DVG$XIBE5RE4%:\9JD* M!%6L"@E6WC7*5\Z&I6?2A,T,HG*-!4K.:5:LT!2L]U+LT858A._7-#6K`I5* MQWT!2N^EV,.HB*.*`H_*E4K/E0'%8\Z58QI5B+/3%#)WKE&AJ4!M2SM&`)RS MMBHZCYTY2R=S0^IWI1C#J)PH;AW%/4H"@&EV,,!$)WIAVQWTN ^EI*6J&6B&N[JXTW.U# M;>=.KJX5U#G1#7`5W?7"JF$$:I.:;RGPHM(<"HEHPH^%+V8_\&G9%=FND1I2 M<['[*6ES78/?72"8@&/*EQ3N6GI3FN@R9-*<^=-SO1B,TQ2*^PVB@,&1FAK' M2BD8IBAO0F6$!D<]]-HBA\J&>M+$6AA!D9&/.F'I@'-$5[O784(]=J78:0HB M*IA%/)S3"=Z5 E'=0YTM$415S"-IWJ0TG:A(1C MTJ0E.!1Q$W,(@?91FT]]"`V&]';&1\*.L68QV-\41'[J8D41!&*M`F/@< M$4S(S7`X[ZM!6A%*[J3/=W4WFVZ4W/?73K1RCC%#4JN4JAJ/RJLN!$6O`H:E M'&^]*M0]<4)2\]-J&S6AP(BCOM0UJQ7+4/CX4$K.:79H=5G+.10B:4F@K4 E/-OW4Y+8^-%2G/2K@09-H:N.]-*J2OL M-B8"T:K`IJAFB'>F'?TJI$N(%8QO0EC%'4,[4%0I9Q#+!*3GTH)V.]'(\:$L M;TFPTAE@CD"F&GJZ4PFDWAA&]U"5UHM"4-Z4;40BP2AFDZXI](12)%X: ^G*.,4,[DTLQM"`3N MM+75PZT`F6G#:GA-(G<4\"J&08YL;^E&2.M#;&,^=%2,8KH!MX]'<:,D`X/C M0T#NZ4=`S10(%C"(&:D(`H;:=^E2&Q1EVTBC&$:`%2$"A(V%'0*,.N)L8Y() M-&"<#RH:,YZ9HO7RH\`8Y/2G)%(-A2I%=!&.P:XFNZ@[4BCBNO*SJ:3FD)\3 M3.N]=+@3B '`B+705FN62:$HYI=C#J(Q2L4)9SN:5P[[;BAJ-+$\8R!$4K'F M:$LXQ3B>N:"I7C2K&&41JCXT,;XI5'?%-&PI8F,`13L*`M?,: :.AO)/=3THQ1D-$]*,%@&>5R5"G E9]06AQ&T$T572A$4FT*L3&*3KFN)IR?#QI0B$)CT#KM1V MTY53$IH[2:+376+L9(:1DXJ:RC;84!A&:GLIK7I),ZHT(ANI+;=-:'7;>I*$ MX%:2+,]VG)1FBI;VI4(IX&^*:&D6)C>2FD8'3XT0#-(1FN,@&!7M0E8VHJAF MA*\?"@$PHC'",8H/=OU-/6 3X4=***%B M[/&(;[ZD(;]=Z5*=Z,A&*O:*LTR"544*P-ZB( ;K+)25#%$& M*C)5W9ZT9*]J:!O`D6CE9H:DXHH--6,U,B1G!\J"H8J2L;=-Z`L8I:HO&&4R M,X-Z"K:I+@V]*CK%9E41E3>#4:$:*1O0CU%(-&%C3W49`VH8%%32UIS1Z1O4 MQM..G2HS8WJ _A4>.G&*L&6]\UL4ETF55:$;3G M%26TD]:1I&1M1TH-:"+,YVC4IQFG8\J(&R!U!I%)P!FB[0.:\$10UJY>ZC$4 M%8!.]#:$4P*CO0C1%4!1ZTHYC"P6<`T-1VIZCBAD_.DW,9$2EI*6ER983J[O M%(:X9R#0KRT(FB(&:&.E&;VWJ8)H4#>C-#>A)HR,[4018PS8Q1VQC?OH*>^I M".E,*(HV\,VG>CH&U!11T=*((H\(D44#I0QU%/!.!1QO`&%2,"GXH258]*(# M1)2=BN.!35KQTI"K(\:Z=%*QX9IBU9I%*QO0U*SZ50GJE@+Q5JSYTPFD)Q0R MO/2@DP@$Y2L]#0EJKE*S0RK?K06,.!%SCRH*U\WI7*5G.^:$XO%`)AE6 EV:,*(CBLG-"4JE)IBC2[&T,!$6<#-!)IRU9-#4=J58PP$ M:H[G>DQFNQFN)P*`QAA&+5B@] ZN%4,F=75U=59TZD)\J M6NQ4$7G1@&?2EY11`V?"GA``W%4L9UX(()HJ48Q2A(!HB49-2%ZX,M&8HB6Z M>EO!HB6\^56`ZH(M&I11`W3DIVH@&:(!`EHT)HJ6_&G(2/G14IJP@2TY*,41 M" TI M/?2>I824A>-Z,E6:C`T5/CWUI(_`Q9A)`5DBG]U!!H@WVZTR(&-4,'[:"M.U M2%#W:&H;55A>6!L9$6G.W=4=::EJ&V]1W$;YK,JK&4,C&AJ22>E'4.ZAXWK+ M<:QD&-3@$[4](]ZFXWVIZ10P)QDAE-3XX&RB0D=,DXJ$R`,J/0;U^O/!#@UP MP]CWV6&.*>KM.QM1:D5;6+A-EN,-R7TN/E'918X7[K8!<0DD8)/,HG&`%<9C MUP"J P&\_*:.E*B>525>/* FL)RW2:G6;$(4:ETAOW6Z_P"T MS\1@G#(*9N'V,^;FPD; !B=!04Q5K:M MKDIJ!&^A,R'4@H9+93E0/,A)5W*5W[FOCWV^/9NM7`OB);;CIJ-]#TUJ%IQU MF&,E$60V1VK2/!!"T*2.[*AT`ICD_EX8O$)AZU$TRXS+ Y_=1=-VNQ<(]$IMUMB0$IO1;`C1T-^Z(SF$[#IT^5% MJ\OX<8^G@*/QEK@D'1?N>OJE$Y.JG#-B7T`V'7/S-(J,XI(/UDA7<"1GY5[; M[/WLK:W]HVYK_D_&:AV*.^&9M[F*`8CG`44A(/,XOE(/*D=XR0#FOT;XM<"] M*\%_8EUKINRPF7Q;M/2B9\AE!D//$%2W5*QD**B=AT&`.@H7*7+V'P59,,OQ MNQ`(!VOQ._E"X3D^I71JIT4#SGXXK-1G<`94H)]3BI#IPH^M:/A;Q"?X6\0; M+JB/!BW40'PMVWS6DNLRF3LXTI*@1[R20#C(.".E:E9V52R"YZMKP%(`D`FP MF-*TJSRJ2KT(.*:3XD;=]?K'[5O`O1_M->R[;]?\,[1!;N4&,;S;_O;$;9 ]PT2M(Z6*'W&WD!34N8H M999(.RDI'X10\D`[*KRE/EJC5PM3$N,I30J=[\!XS8;`NM5:0-[\9\BA:%*& M%I4?!*@:4$^&*^U_NE'%[35PULUPST9:+1!@V)WM;Q,M\%EI;TS&S'.A(/*T M">89W6K!^I7RG8>$FN=3VH7.RZ,U#=[:02)D&U/O,D#P6E!!^!IG#8SGZ"UZ MBY,VP)_MO`U:.1RB&]IE<[TY(ITB,]#D.1Y#+C#[2BAQIU!0M"AU"DG<'R-6 M.G=,7C5MP3!L=IGWF:1S"-;HJY#N/'E0"<>=/9E`S$Z1>QO:T@)%'0G&U:'4 M?"K6NBX8EZ@T??K%$)Q](N5L?8;SX