Exhibit 99.1

FOR IMMEDIATE RELEASE
|
May 2, 2011 | |
Media Contact: Joe Salkowski, (520) 884-3625
|
Page 1 of 6 | |
Financial Analyst Contact: Jo Smith, (520) 884-3650 |
UNISOURCE ENERGY REPORTS FIRST QUARTER 2011 EARNINGS,
MAINTAINS 2011 EARNINGS GUIDANCE RANGE
MAINTAINS 2011 EARNINGS GUIDANCE RANGE
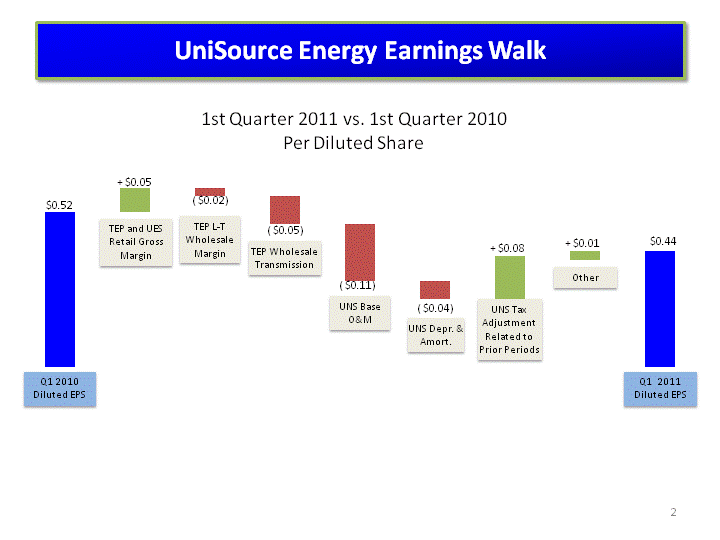
| • | UniSource Energy’s net income for the first quarter of 2011 was $17.0 million, or $0.44 per share of common stock on a fully-diluted basis, compared with net income of $20.0 million, or $0.52 per diluted share in the first quarter of 2010. Financial results for the first quarter of 2011 included a $3.5 million after-tax gain related to adjustments to deferred taxes recorded in prior periods. |
| • | Earnings at UniSource Energy’s primary subsidiary, Tucson Electric Power Company (TEP), were $7.0 million in the first quarter of 2011 compared with $10.3 million in the first quarter of 2010. Planned generating plant maintenance expense, higher depreciation and amortization expense and lower wholesale transmission revenues resulted in lower earnings at TEP. |
| • | Retail kilowatt-hour (kWh) sales at both TEP and UNS Electric increased compared with the first quarter of 2010. |
| • | Operating results for the first quarter were in-line with expectations. UniSource Energy is maintaining its estimates for 2011 base operating and maintenance expense of $272 million and 2011 earnings range of $2.60 to $2.90 per diluted share. |
Tucson, Ariz. — UniSource Energy Corporation (NYSE: UNS) today reported first quarter 2011 net
income of $17.0 million, or $0.44 per share of common stock on a fully-diluted basis, compared with
$20.0 million, or $0.52 per diluted share in the same period last year.
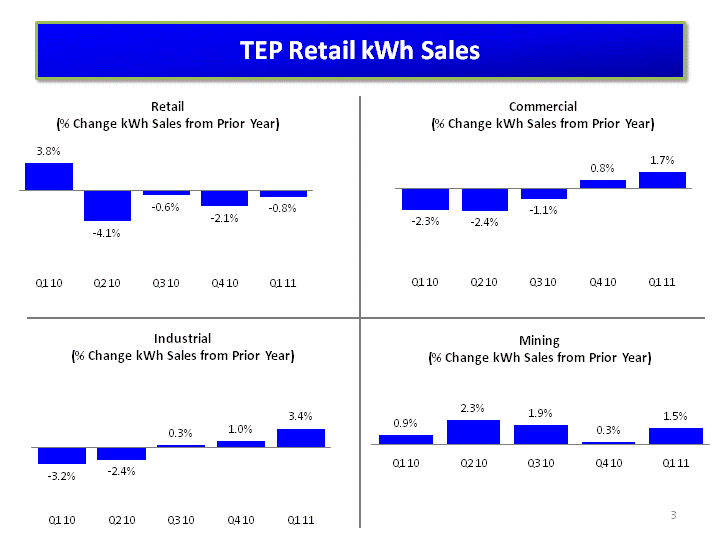
TEP’s retail kWh sales in the first three months of 2011 increased 1.3 percent compared with the
first quarter of 2010. After nearly three years of declining sales, kWh sales to TEP’s commercial
and industrial customers increased year-over-year for the second consecutive quarter.
Sales volumes to TEP’s commercial, industrial and mining customers were strong, increasing by 2.3
percent over the first quarter of 2010. Sales to TEP’s residential customers declined 0.8 percent
compared with the same period last year amid mild weather that led to a 2.8 percent year-over-year
decrease in first-quarter heating degree days.
Slightly higher revenues at TEP were offset by anticipated increases in operations and maintenance
costs (O&M) and depreciation associated with investments in transmission, distribution and
generating systems. Over the last four years, TEP has invested nearly $1 billion in system
improvements, high voltage transmission assets, environmental upgrades to generating plants and new
solar generating stations.
“Our first-quarter results reflect the challenges of operating in the third year of a four year
rate freeze,” said Paul Bonavia, UniSource Energy’s Chairman, President and CEO. “Our O&M costs
increased due to planned maintenance of generating units we’ll rely on this summer, while our
depreciation was driven higher by the capital we’ve invested to meeting our customers’ energy
needs.”
Tucson Electric Power
Retail kWh Sales and Revenues
TEP’s retail kWh sales grew by 1.3 percent in the first quarter, which resulted in an increase in retail
margin revenues of less than $1 million, or 0.3 percent, compared with the first three months of
2010. Margin revenues do not include a $7 million increase in customer surcharges used to fund
renewable energy and energy efficiency programs or a $1 million decrease in charges to cover fuel
and purchased power costs.
Long-Term Wholesale and Transmission Revenues
TEP’s first-quarter margin on long-term wholesale kWh sales fell to $7 million from $8 million in
the first quarter of 2010. The decrease reflects lower sales to the Navajo Tribal Utility
Authority, which experienced mild winter weather compared with last year. Wholesale revenues from
the sale of transmission services were $4 million in the first quarter of 2011 compared with $8
million last year. In the first quarter of 2010, TEP provided temporary transmission capacity to
Salt River Project.
Other Operating Expenses
TEP’s base O&M expense of $62 million increased by $8 million compared with the first quarter of
2010. Base O&M excludes costs directly offset by customer surcharges and third-party
reimbursements. The increase is due primarily to higher planned generating plant maintenance
outage expense. In the first quarter of 2011, depreciation expense increased by $2 million as a
result of additional plant-in-service compared with the same period last year.
Income Taxes
In the first quarter of 2011, TEP recognized after-tax income of $2.3 million related to an
accounting change for deferred taxes on Allowance for Funds Used During Construction — Equity
recorded in prior periods.
UNS Gas
UNS Gas reported net income of $6 million in the first quarter of 2011, an increase of
approximately $1 million compared with the same period in 2010. A 2-percent base-rate increase that
took effect in April 2010 contributed to a $1 million increase in first-quarter margin revenues
that was partially offset by higher O&M costs. Retail therm sales were down 1.8 percent compared to
the same period last year partly due to warmer weather.
UNS Gas filed a new request last month for a base rate increase of $5.6 million, or 4 percent. The
company’s current rates reflect costs from late 2007 and early 2008, and the proposed rates would
help recover higher operating and capital costs incurred since that time.
UNS Electric
UNS Electric reported net income of $3 million in the first quarters of both 2011 and 2010. This
year’s results include a deferred tax adjustment that resulted in after-tax income of $1 million.
In the first quarter of 2010, UNS Electric’s financial results included after-tax income of $2
million from a settlement related to previous transactions with the California Power Exchange.
UNS Electric’s retail kWh sales increased 4 percent compared with the first quarter of 2010 due
primarily to higher usage by its two mining customers and a 0.7 percent increase in the number of
residential customers.
2
Millennium
Millennium recorded no net income or loss in the first quarter of 2011, compared with net income of
$1 million in the first quarter of 2010.
On March 31, 2011, Millennium had assets of $23 million, including a $15 million note receivable,
land and buildings of $2 million, deferred tax assets of $3 million and $3 million cash.
Seasonality of Earnings
The net income and results of operations of TEP as well as of UNS Gas and UNS Electric — operating
subsidiaries of UniSource Energy Services (UES) — are seasonal in nature. TEP and UNS Electric
typically record the majority of their net income during the second and third quarters when hot
weather contributes to higher energy consumption. TEP’s retail rates, which include higher charges
for higher levels of energy use, also shift a larger share of the company’s earnings into those
periods.
Energy demand from UNS Gas customers typically peaks during the winter. Accordingly, UNS Gas
typically records the majority of its net income during the first and fourth quarters.
Net Income and Earnings Per Share Summary
| 1st Quarter | ||||||||
| Net Income | 2011 | 2010 | ||||||
| -Millions- | ||||||||
Tucson Electric Power |
$ | 7.0 | $ | 10.3 | ||||
UNS Gas |
6.4 | 5.8 | ||||||
UNS Electric |
3.1 | 2.9 | ||||||
Other (1) |
0.5 | 1.0 | ||||||
Net Income |
$ | 17.0 | $ | 20.0 | ||||
Avg. Basic Shares Outstanding (millions) |
36.8 | 36.1 | ||||||
Avg. Diluted Shares Outstanding (millions) |
41.4 | 40.7 | ||||||
| 1st Quarter | ||||||||
| Earnings Per UniSource Energy Share | 2011 | 2010 | ||||||
Tucson Electric Power |
$ | 0.19 | $ | 0.29 | ||||
UNS Gas |
0.17 | 0.16 | ||||||
UNS Electric |
0.08 | 0.08 | ||||||
Other (1) |
0.02 | 0.02 | ||||||
Net Income per Basic Share |
$ | 0.46 | $ | 0.55 | ||||
Net Income per Diluted Share |
$ | 0.44 | $ | 0.52 | ||||
| (1) | Includes UniSource Energy on a stand-alone basis and results from Millennium Energy Holdings, Inc. and UniSource Energy Development, wholly-owned subsidiaries of UniSource Energy. |
3
UniSource Energy believes the presentation of TEP, UNS Gas and UNS Electric net income or loss on a
per basic UniSource Energy share basis (which are non-GAAP financial measures) provides useful
information to investors by disclosing the results of operations of its business segments on a
basis consistent with UniSource Energy’s reported earnings or losses.
Conference Call and Webcast
The company will host a conference call on Monday, May 2 at 1 p.m. EDT to discuss the financial
results and outlook. To participate in the call, please dial in 5 to 10 minutes prior to the start
time.
Dial-in number: (877) 582-0446
Reference code: 61114303
Reference code: 61114303
The conference call can be heard live on UniSource Energy’s website. The webcast can be accessed
at uns.com and will be available for replay for seven days.
Replay number: (800) 642-1687
Reference code: 61114303
Reference code: 61114303
In conjunction with this earnings announcement, UniSource Energy has provided detailed information
on its performance during the first quarter of 2011. These materials have been filed with the
Securities and Exchange Commission and are also available at uns.com.
UniSource Energy is a Tucson, Arizona-based company with consolidated assets of approximately $3.7
billion. UniSource Energy’s primary subsidiaries include Tucson Electric Power, which serves more
than 402,000 customers in southern Arizona, and UniSource Energy Services, provider of natural gas
and electric service for about 237,000 customers in northern and southern Arizona.
Visit uns.com for more information about UniSource Energy and its subsidiaries.
This release contains forward-looking information that involves risks and uncertainties, including
factors that could affect UniSource Energy’s ability to reach the 2011 earnings guidance. These
risks and uncertainties include, but are not limited to: state and federal regulatory and
legislative decisions and actions; regional economic and market conditions, which could affect
customer growth and energy usage; weather variations affecting energy usage; the cost of debt and
equity capital and access to capital markets; the performance of the stock market and changing
interest rate environment, which affect the value of the company’s pension and other postretirement
benefit plan assets and the related contribution requirements and expense; unexpected increases in
O&M expense; resolution of pending litigation matters; changes in accounting standards; changes in
critical accounting estimates; changes to long-term contracts; the cost of fuel and power supplies;
performance of TEP’s generating plants; and other factors listed in UniSource Energy’s Form 10-K
and 10-Q filings with the Securities and Exchange Commission. The preceding factors may cause
future results to differ materially from outcomes currently expected by UniSource Energy.
4
UNISOURCE ENERGY 2011 RESULTS
UniSource Energy Corporation
Comparative Condensed Consolidated Statements of Income
Comparative Condensed Consolidated Statements of Income
| Three Months Ended | ||||||||||||||||
| (in thousands of dollars, except per share amounts) | March 31, | Increase / (Decrease) | ||||||||||||||
| (UNAUDITED) | 2011 | 2010 | Amount | Percent | ||||||||||||
Operating Revenues |
||||||||||||||||
Electric Retail Sales |
$ | 217,215 | $ | 204,746 | $ | 12,469 | 6.1 | |||||||||
Electric Wholesale Sales |
40,781 | 37,064 | 3,717 | 10.0 | ||||||||||||
California Power Exchange (CPX) Provision for Wholesale Refunds |
— | (2,970 | ) | 2,970 | N/M | |||||||||||
Gas Revenue |
57,189 | 55,781 | 1,408 | 2.5 | ||||||||||||
Other Revenues |
29,448 | 24,200 | 5,248 | 21.7 | ||||||||||||
Total Operating Revenues |
344,633 | 318,821 | 25,812 | 8.1 | ||||||||||||
Operating Expenses |
||||||||||||||||
Fuel |
72,137 | 60,448 | 11,689 | 19.3 | ||||||||||||
Purchased Energy |
77,640 | 82,805 | (5,165 | ) | (6.2 | ) | ||||||||||
Transmission |
2,502 | 2,430 | 72 | 3.0 | ||||||||||||
Decrease to Reflect PPFAC/PGA Recovery Treatment |
(5,793 | ) | (12,631 | ) | 6,838 | 54.1 | ||||||||||
Total Fuel and Purchased Energy |
146,486 | 133,052 | 13,434 | 10.1 | ||||||||||||
Other Operations and Maintenance |
101,022 | 82,908 | 18,114 | 21.8 | ||||||||||||
Depreciation |
32,790 | 31,099 | 1,691 | 5.4 | ||||||||||||
Amortization |
7,377 | 6,572 | 805 | 12.2 | ||||||||||||
Taxes Other Than Income Taxes |
12,144 | 12,273 | (129 | ) | (1.1 | ) | ||||||||||
Total Operating Expenses |
299,819 | 265,904 | 33,915 | 12.8 | ||||||||||||
Operating Income |
44,814 | 52,917 | (8,103 | ) | (15.3 | ) | ||||||||||
Other Income (Deductions) |
||||||||||||||||
Interest Income |
994 | 1,927 | (933 | ) | (48.4 | ) | ||||||||||
Other Income |
2,856 | 6,059 | (3,203 | ) | (52.9 | ) | ||||||||||
Other Expense |
(663 | ) | (844 | ) | 181 | 21.4 | ||||||||||
Total Other Income (Deductions) |
3,187 | 7,142 | (3,955 | ) | (55.4 | ) | ||||||||||
Interest Expense |
||||||||||||||||
Long-Term Debt |
18,092 | 15,240 | 2,852 | 18.7 | ||||||||||||
Capital Leases |
9,929 | 12,083 | (2,154 | ) | (17.8 | ) | ||||||||||
Other Interest Expense, Net of Interest Capitalized |
(921 | ) | 329 | (1,250 | ) | N/M | ||||||||||
Total Interest Expense |
27,100 | 27,652 | (552 | ) | (2.0 | ) | ||||||||||
Income Before Income Taxes |
20,901 | 32,407 | (11,506 | ) | (35.5 | ) | ||||||||||
Income Tax Expense |
3,909 | 12,435 | (8,526 | ) | (68.6 | ) | ||||||||||
Net Income |
$ | 16,992 | $ | 19,972 | $ | (2,980 | ) | (14.9 | ) | |||||||
Weighted-Average Shares of Common Stock Outstanding (000) |
36,789 | 36,052 | 737 | 2.0 | ||||||||||||
Basic Earnings per Share |
$ | 0.46 | $ | 0.55 | $ | (0.09 | ) | (16.4 | ) | |||||||
Diluted Earnings per Share |
$ | 0.44 | $ | 0.52 | $ | (0.08 | ) | (15.4 | ) | |||||||
Dividends Declared per Share |
$ | 0.42 | $ | 0.39 | $ | 0.03 | 7.7 | |||||||||
N/M — Not Meaningful
Reclassifications have been made to prior periods to conform to the current period’s presentation.
5
TUCSON ELECTRIC POWER COMPANY 2011 RESULTS
TUCSON ELECTRIC POWER COMPANY
Comparative Condensed Consolidated Statements of Income
Comparative Condensed Consolidated Statements of Income
| Three Months Ended | ||||||||||||||||
| (in thousands of dollars) | March 31, | Increase / (Decrease) | ||||||||||||||
| (UNAUDITED) | 2011 | 2010 | Amount | Percent | ||||||||||||
Operating Revenues |
||||||||||||||||
Electric Retail Sales |
$ | 173,702 | $ | 167,419 | $ | 6,283 | 3.8 | |||||||||
Electric Wholesale Sales |
35,122 | 40,962 | (5,840 | ) | (14.3 | ) | ||||||||||
California Power Exchange (CPX) Provision for Wholesale Refunds |
— | (2,970 | ) | 2,970 | N/M | |||||||||||
Other Revenues |
30,630 | 25,643 | 4,987 | 19.4 | ||||||||||||
Total Operating Revenues |
239,454 | 231,054 | 8,400 | 3.6 | ||||||||||||
Operating Expenses |
||||||||||||||||
Fuel |
71,315 | 58,351 | 12,964 | 22.2 | ||||||||||||
Purchased Power |
16,601 | 24,654 | (8,053 | ) | (32.7 | ) | ||||||||||
Transmission |
695 | 796 | (101 | ) | (12.7 | ) | ||||||||||
Decrease to Reflect PPFAC Recovery Treatment |
(9,342 | ) | (3,118 | ) | (6,224 | ) | N/M | |||||||||
Total Fuel and Purchased Energy |
79,269 | 80,683 | (1,414 | ) | (1.8 | ) | ||||||||||
Other Operations and Maintenance |
88,492 | 70,365 | 18,127 | 25.8 | ||||||||||||
Depreciation |
25,733 | 24,060 | 1,673 | 7.0 | ||||||||||||
Amortization |
8,304 | 7,786 | 518 | 6.7 | ||||||||||||
Taxes Other Than Income Taxes |
9,904 | 9,951 | (47 | ) | (0.5 | ) | ||||||||||
Total Operating Expenses |
211,702 | 192,845 | 18,857 | 9.8 | ||||||||||||
Operating Income |
27,752 | 38,209 | (10,457 | ) | (27.4 | ) | ||||||||||
Other Income (Deductions) |
||||||||||||||||
Interest Income |
734 | 1,690 | (956 | ) | (56.6 | ) | ||||||||||
Other Income |
1,372 | 948 | 424 | 44.7 | ||||||||||||
Other Expense |
(1,230 | ) | (2,216 | ) | 986 | 44.5 | ||||||||||
Total Other Income (Deductions) |
876 | 422 | 454 | N/M | ||||||||||||
Interest Expense |
||||||||||||||||
Long-Term Debt |
12,255 | 9,878 | 2,377 | 24.1 | ||||||||||||
Capital Leases |
9,929 | 12,081 | (2,152 | ) | (17.8 | ) | ||||||||||
Other Interest Expense, Net of Interest Capitalized |
(747 | ) | (25 | ) | (722 | ) | N/M | |||||||||
Total Interest Expense |
21,437 | 21,934 | (497 | ) | (2.3 | ) | ||||||||||
Income Before Income Taxes |
7,191 | 16,697 | (9,506 | ) | (56.9 | ) | ||||||||||
Income Tax Expense |
208 | 6,348 | (6,140 | ) | (96.7 | ) | ||||||||||
Net Income |
$ | 6,983 | $ | 10,349 | $ | (3,366 | ) | (32.5 | ) | |||||||
| Three Months Ended | ||||||||||||||||
| Tucson Electric Power | March 31, | Increase / (Decrease) | ||||||||||||||
| Electric MWh Sales: | 2011 | 2010 | Amount | Percent | ||||||||||||
Retail Sales |
1,954,737 | 1,928,812 | 25,925 | 1.3 | ||||||||||||
Long-Term Wholesale Sales |
230,338 | 287,806 | (57,468 | ) | (20.0 | ) | ||||||||||
N/M — Not Meaningful
Reclassifications have been made to prior periods to conform to the current period’s presentation.
6