Royal Bank of Canada second quarter 2024 results |
Net income $4.0 Billion Up 7% YoY |
Diluted EPS 1 $2.74 Up 5% YoY |
Total PCL 1 $920 Million PCL on loans ratio 1 Up 4 bps 1 QoQ |
ROE 1, 2 14.5% Down 40 bps YoY |
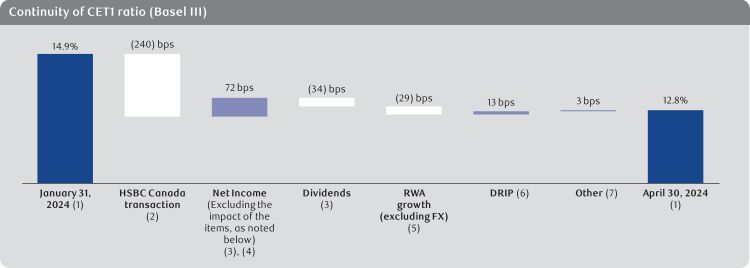
CET1 Ratio 1 12.8% Above regulatory requirements | ||||||||||||
Adjusted net income 3 $4.2 Billion Up 11% YoY |
Adjusted diluted EPS 3 $2.92 Up 9% YoY |
Total ACL 1 $6.1 Billion ACL on loans ratio 1 down 2 bps |
Adjusted ROE 3 15.5% Up 20 bps YoY |
LCR 1 128% Down from 132% last quarter |
“ This quarter marked a pivotal milestone in RBC’s long-term growth story as we completed our acquisition of HSBC Bank Canada, welcoming thousands of colleagues and clients from across the country. This historic acquisition, along with our solid results driven by our strong balance sheet, expense control and volume growth across our premium franchises, shows that RBC has the right strategy in place to continue building the bank of the future and our position as a global competitor. We’re confident in our ability to build on this momentum and keep delivering sustainable, long-term value to our clients, communities and shareholders. – Dave McKay, President and Chief Executive Officer of Royal Bank of Canada |
Q2 2024 Compared to Q2 2023 |
Reported: • Net income of $3,950 million • Diluted EPS of $2.74 • ROE of 14.5% • CET1 ratio of 12.8% |
h h i i |
Adjusted 1 , 3 :• Net income of $4,198 million • Diluted EPS of $2.92 • ROE of 15.5% |
h h h | ||||||
Q2 2024 Compared to Q1 2024 |
• Net income of $3,950 million • Diluted EPS • ROE of 14.5% • CET1 ratio of 12.8% |
h h h i |
• Net income of $4,198 million • Diluted EPS • ROE of 15.5% |
h h h | ||||||
YTD 2024 Compared to YTD 2023 |
• Net income of $7,532 million • Diluted EPS • ROE of 13.8% |
h h h |
• Net income of $8,264 million • Diluted EPS • ROE of 15.2% |
h h i | ||||||
(1) | See Glossary section of this Q2 2024 |
(2) | Return on equity (ROE). This measure does not have a standardized meaning under generally accepted accounting principles (GAAP). For further information, refer to the Key performance and non-GAAP measures section of this Q2 2024 |
(3) | These are non-GAAP measures. For further information, including a reconciliation, refer to the Key performance and non-GAAP measures section of this Q2 2024 |
(4) | When we say “we”, “us”, “our”, “the bank” or “RBC”, we mean Royal Bank of Canada and its subsidiaries, as applicable. |
(5) | HSBC Canada results reflect revenue, PCL, non-interest expenses and income taxes associated with the acquired operations and clients, which include the acquired assets, assumed liabilities and employees with the exception of assets and liabilities relating to treasury and liquidity management activities. For further details, refer to the Key corporate events section of this Q2 2024 Report to Shareholders. |
(6) | Pre-provision, pre-tax (PPPT) earnings is calculated as income (April 30, 2024: $3,950 million; January 31, 2024: $3,582 million; April 30, 2023: $3,680 million) before income taxes (April 30, 2024: $976 million; January 31, 2024: $766 million; April 30, 2023: $765 million) and PCL (April 30, 2024: $920 million; January 31, 2024: $813 million; April 30, 2023: $600 million). This is a non-GAAP measure. PPPT earnings do not have a standardized meaning under GAAP and may not be comparable to similar measures disclosed by other financial institutions. We use PPPT earnings to assess our ability to generate sustained earnings growth outside of credit losses, which are impacted by the cyclical nature of a credit cycle. We believe that certain non-GAAP measures are more reflective of our ongoing operating results and provide readers with a better understanding of management’s perspective on our performance. |
2 | Royal Bank of Canada |
45 |
||||
45 | Summary of accounting policies and estimates | |||
45 | Changes in accounting policies and disclosures | |||
46 | Controls and procedures | |||
46 |
||||
47 |
||||
50 |
||||
51 |
(unaudited) | |||
57 |
(unaudited) | |||
85 |
Management’s Discussion and Analysis |
Caution regarding forward-looking statements |
Royal Bank of Canada |
3 |
Overview and outlook |
About Royal Bank of Canada |
4 | Royal Bank of Canada |
Selected financial and other highlights |
As at or for the three months ended | As at or for the six months ended | |||||||||||||||||||||
(Millions of Canadian dollars, except per share, number of and percentage amounts) |
April 30 2024 (1) |
January 31 2024 |
April 30 2023 (2) |
April 30 2024 (1) |
April 30 2023 (2) |
|||||||||||||||||
Total revenue |
$ |
14,154 |
$ | 13,485 | $ | 12,445 | $ |
27,639 |
$ | 25,802 | ||||||||||||
Provision for credit losses (PCL) |
920 |
813 | 600 | 1,733 |
1,132 | |||||||||||||||||
Non-interest expense |
8,308 |
8,324 | 7,400 | 16,632 |
14,989 | |||||||||||||||||
Income before income taxes |
4,926 |
4,348 | 4,445 | 9,274 |
9,681 | |||||||||||||||||
Net income |
$ |
3,950 |
$ | 3,582 | $ | 3,680 | $ |
7,532 |
$ | 6,813 | ||||||||||||
Net income adjusted (3), (4) |
$ |
4,198 |
$ | 4,066 | $ | 3,789 | $ |
8,264 |
$ | 8,051 | ||||||||||||
Segments – net income |
||||||||||||||||||||||
Personal & Commercial Banking |
$ |
2,051 |
$ | 2,061 | $ | 1,915 | $ |
4,112 |
$ | 4,041 | ||||||||||||
Wealth Management (5) |
769 |
606 | 719 | 1,375 |
1,549 | |||||||||||||||||
Insurance |
177 |
220 | 170 | 397 |
237 | |||||||||||||||||
Capital Markets (5) |
1,262 |
1,154 | 962 | 2,416 |
2,203 | |||||||||||||||||
Corporate Support |
(309 |
) |
(459 | ) | (86 | ) | (768 |
) |
(1,217 | ) | ||||||||||||
Net income |
$ |
3,950 |
$ | 3,582 | $ | 3,680 | $ |
7,532 |
$ | 6,813 | ||||||||||||
Selected information |
||||||||||||||||||||||
Earnings per share (EPS) – basic |
$ |
2.75 |
$ | 2.50 | $ | 2.60 | $ |
5.25 |
$ | 4.83 | ||||||||||||
– diluted |
2.74 |
2.50 | 2.60 | 5.25 |
4.83 | |||||||||||||||||
Earnings per share (EPS) – basic adjusted (3), (4) |
2.92 |
2.85 | 2.68 | 5.77 |
5.73 | |||||||||||||||||
– diluted adjusted (3), (4) |
2.92 |
2.85 | 2.68 | 5.77 |
5.72 | |||||||||||||||||
Return on common equity (ROE) (4), (6) |
14.5% |
13.1% | 14.9% | 13.8% |
13.7% | |||||||||||||||||
Return on common equity (ROE) adjusted (3), (4) |
15.5% |
14.9% | 15.3% | 15.2% |
16.3% | |||||||||||||||||
Average common equity (6) |
$ |
108,650 |
$ | 107,100 | $ | 99,450 | $ |
107,850 |
$ | 98,350 | ||||||||||||
Net interest margin (NIM) – on average earning assets, net (4) |
1.50% |
1.41% | 1.53% | 1.45% |
1.50% | |||||||||||||||||
PCL on loans as a % of average net loans and acceptances |
0.41% |
0.37% | 0.30% | 0.39% |
0.27% | |||||||||||||||||
PCL on performing loans as a % of average net loans and acceptances |
0.11% |
0.06% | 0.09% | 0.08% |
0.08% | |||||||||||||||||
PCL on impaired loans as a % of average net loans and acceptances |
0.30% |
0.31% | 0.21% | 0.31% |
0.19% | |||||||||||||||||
Gross impaired loans (GIL) as a % of loans and acceptances |
0.55% |
0.48% | 0.34% | 0.55% |
0.34% | |||||||||||||||||
Liquidity coverage ratio (LCR) (4), (7) |
128% |
132% | 135% | 128% |
135% | |||||||||||||||||
Net stable funding ratio (NSFR) (4), (7) |
111% |
113% | 113% | 111% |
113% | |||||||||||||||||
Capital, Leverage and Total loss absorbing capacity (TLAC) ratios (4), (8), (9) |
||||||||||||||||||||||
Common Equity Tier 1 (CET1) ratio |
12.8% |
14.9% | 13.7% | 12.8% |
13.7% | |||||||||||||||||
Tier 1 capital ratio |
14.1% |
16.3% | 14.9% | 14.1% |
14.9% | |||||||||||||||||
Total capital ratio |
16.1% |
18.1% | 16.8% | 16.1% |
16.8% | |||||||||||||||||
Leverage ratio |
4.2% |
4.4% | 4.2% | 4.2% |
4.2% | |||||||||||||||||
TLAC ratio |
27.5% |
31.4% | 31.0% | 27.5% |
31.0% | |||||||||||||||||
TLAC leverage ratio |
8.1% |
8.5% | 8.7% | 8.1% |
8.7% | |||||||||||||||||
Selected balance sheet and other information (10) |
||||||||||||||||||||||
Total assets |
$ |
2,031,050 |
$ | 1,974,405 | $ | 1,942,223 | $ |
2,031,050 |
$ | 1,942,223 | ||||||||||||
Securities, net of applicable allowance |
412,553 |
405,813 | 319,828 | 412,553 |
319,828 | |||||||||||||||||
Loans, net of allowance for loan losses |
960,539 |
858,316 | 831,187 | 960,539 |
831,187 | |||||||||||||||||
Derivative related assets |
130,199 |
105,038 | 124,149 | 130,199 |
124,149 | |||||||||||||||||
Deposits |
1,327,603 |
1,241,168 | 1,210,053 | 1,327,603 |
1,210,053 | |||||||||||||||||
Common equity |
112,065 |
108,360 | 101,528 | 112,065 |
101,528 | |||||||||||||||||
Total risk-weighted assets (RWA) (4), (8), (9) |
653,702 |
590,257 | 593,533 | 653,702 |
593,533 | |||||||||||||||||
Assets under management (AUM) (4) |
1,223,300 |
1,150,100 | 1,083,600 | 1,223,300 |
1,083,600 | |||||||||||||||||
Assets under administration (AUA) (4), (11), (12) |
4,546,200 |
4,490,100 | 5,915,300 | 4,546,200 |
5,915,300 | |||||||||||||||||
Common share information |
||||||||||||||||||||||
Shares outstanding (000s) – average basic |
1,412,651 |
1,406,324 | 1,388,388 | 1,409,452 |
1,385,525 | |||||||||||||||||
– average diluted |
1,414,166 |
1,407,641 | 1,390,149 | 1,410,842 |
1,387,295 | |||||||||||||||||
– end of period |
1,414,304 |
1,408,257 | 1,389,730 | 1,414,304 |
1,389,730 | |||||||||||||||||
Dividends declared per common share |
$ |
1.38 |
$ | 1.38 | $ | 1.32 | $ |
2.76 |
$ | 2.64 | ||||||||||||
Dividend yield (4) |
4.1% |
4.5% | 4.0% | 4.4% |
4.0% | |||||||||||||||||
Dividend payout ratio (4) |
50% |
55% | 51% | 53% |
55% | |||||||||||||||||
Common share price (RY on TSX) (13) |
$ |
133.19 |
$ | 131.21 | $ | 134.51 | $ |
133.19 |
$ | 134.51 | ||||||||||||
Market capitalization (TSX) (13) |
188,371 |
184,777 | 186,933 | 188,371 |
186,933 | |||||||||||||||||
Business information |
||||||||||||||||||||||
Employees (full-time equivalent) (FTE) |
94,480 |
90,166 | 94,398 | 94,480 |
94,398 | |||||||||||||||||
Bank branches |
1,348 |
1,248 | 1,258 | 1,348 |
1,258 | |||||||||||||||||
Automated teller machines (ATMs) |
4,447 |
4,341 | 4,357 | 4,447 |
4,357 | |||||||||||||||||
Period average US$ equivalent of C$1.00 (14) |
0.734 |
0.745 | 0.737 | 0.740 |
0.741 | |||||||||||||||||
Period-end US$ equivalent of C$1.00 |
0.727 |
0.744 | 0.738 | 0.727 |
0.738 |
(1) | On March 28, 2024, we completed the HSBC Canada transaction. HSBC Canada results have been consolidated from the closing date, and are included in our Personal & Commercial Banking, Wealth Management and Capital Markets segments. For further details, refer to the Key corporate events section. |
(2) | Amounts have been restated from those previously presented as part of the adoption of IFRS 17, effective November 1, 2023. For further details on the impacts of the adoption of IFRS 17 including the description of accounting policies selected, refer to Note 2 of our Condensed Financial Statements. |
(3) | These are non-GAAP measures. For further details, including a reconciliation, refer to the Key performance and non-GAAP measures section. |
(4) | See Glossary for composition of these measures. |
(5) | Effective the fourth quarter of 2023, we moved the Investor Services lending business from our Wealth Management segment to our Capital Markets segment. Therefore, comparative results for the three and six month periods ended April 30, 2023 have been revised from those previously presented. |
(6) | Average amounts are calculated using methods intended to approximate the average of the daily balances for the period. This includes average common equity used in the calculation of ROE. For further details, refer to the Key performance and non-GAAP measures section. |
(7) | The LCR and NSFR are calculated in accordance with the Office of the Superintendent of Financial Institutions’ (OSFI) Liquidity Adequacy Requirements (LAR) guideline. LCR is the average for the three months ended for each respective period. For further details, refer to the Liquidity and funding risk section. |
(8) | Capital ratios and RWA are calculated using OSFI’s Capital Adequacy Requirements (CAR) guideline, the Leverage ratio is calculated using OSFI’s Leverage Requirements (LR) guideline, and both the TLAC and TLAC leverage ratios are calculated using OSFI’s TLAC guideline. The periods ended April 30, 2024 and January 31, 2024 reflect our adoption of the revised market risk and credit valuation adjustment (CVA) frameworks that came into effect on November 1, 2023. For further details, refer to the Capital management section. |
(9) | As prior period restatements are not required by OSFI, there was no impact from the adoption of IFRS 17 on regulatory capital, RWA, capital ratios, leverage ratio, TLAC available and TLAC ratios for periods prior to November 1, 2023. |
(10) | Represents period-end spot balances. |
(11) | AUA includes $16 billion and $6 billion (January 31, 2024 – $14 billion and $6 billion; April 30, 2023 – $15 billion and $8 billion) of securitized residential mortgages and credit card loans, respectively. |
(12) | Comparative amounts for April 30, 2023 have been revised from those previously presented. |
(13) | Based on TSX closing market price at period-end. |
(14) | Average amounts are calculated using month-end spot rates for the period. |
Royal Bank of Canada |
5 |
Economic, market and regulatory review and outlook – data as at May 29, 2024 |
1 |
Annualized rate |
6 | Royal Bank of Canada |
Key corporate events |
Royal Bank of Canada |
7 |
For the three months ended April 30, 2024 |
||||||||||||||||||||||||||||
Segment results – Personal & Commercial Banking |
Consolidated results |
|||||||||||||||||||||||||||
(Millions of Canadian dollars) | Excluding HSBC Canada |
HSBC Canada |
Total |
Excluding HSBC Canada |
HSBC Canada |
Total |
||||||||||||||||||||||
Net interest income |
$ |
4,229 |
$ |
171 |
$ |
4,400 |
$ |
6,444 |
$ |
179 |
$ |
6,623 |
||||||||||||||||
Non-interest income |
1,555 |
35 |
1,590 |
7,465 |
66 |
7,531 |
||||||||||||||||||||||
Total revenue |
5,784 |
206 |
5,990 |
13,909 |
245 |
14,154 |
||||||||||||||||||||||
PCL (1) |
552 |
202 |
754 |
703 |
217 |
920 |
||||||||||||||||||||||
Non-interest expense |
2,339 |
89 |
2,428 |
8,209 |
99 |
8,308 |
||||||||||||||||||||||
Income (loss) before income taxes |
2,893 |
(85 |
) |
2,808 |
4,997 |
(71 |
) |
4,926 |
||||||||||||||||||||
Income taxes (recoveries) |
781 |
(24 |
) |
757 |
996 |
(20 |
) |
976 |
||||||||||||||||||||
Net income |
$ |
2,112 |
$ |
(61 |
) |
$ |
2,051 |
$ |
4,001 |
$ |
(51 |
) |
$ |
3,950 |
(1) | Segment results – Personal & Commercial Banking include initial PCL on purchased performing financial assets of $186 million, of which $181 million relates to purchased performing loans. Consolidated results include initial PCL on purchased performing financial assets of $200 million, of which $193 million relates to purchased performing loans. |
Financial performance |
Overview |
For the three months ended | For the six months ended | |||||||||||||
(Millions of Canadian dollars, except per share amounts) |
Q2 2024 vs. Q2 2023 |
Q2 2024 vs. Q1 2024 |
Q2 2024 vs. Q2 2023 |
|||||||||||
Increase (decrease): |
||||||||||||||
Total revenue |
$ |
45 |
$ |
98 |
$ |
80 |
||||||||
PCL |
1 |
2 |
3 |
|||||||||||
Non-interest expense |
28 |
54 |
56 |
|||||||||||
Income taxes |
1 |
4 |
– |
|||||||||||
Net income |
15 |
38 |
21 |
|||||||||||
Impact on EPS |
||||||||||||||
Basic |
$ |
0.01 |
$ |
0.03 |
$ |
0.01 |
||||||||
Diluted |
0.01 |
0.03 |
0.01 |
For the three months ended | For the six months ended | |||||||||||||||||||||
(Average foreign currency equivalent of C$1.00) (1) |
April 30 2024 |
January 31 2024 |
April 30 2023 |
April 30 2024 |
April 30 2023 |
|||||||||||||||||
U.S. dollar |
0.734 |
0.745 | 0.737 | 0.740 |
0.741 | |||||||||||||||||
British pound |
0.583 |
0.588 | 0.599 | 0.586 |
0.605 | |||||||||||||||||
Euro |
0.682 |
0.683 | 0.681 | 0.683 |
0.690 |
(1) | Average amounts are calculated using month-end spot rates for the period. |
For the three months ended | For the six months ended | |||||||||||||||||||||
(Millions of Canadian dollars, except percentage amounts) |
April 30 2024 |
January 31 2024 |
April 30 2023 (1) |
April 30 2024 |
April 30 2023 (1) |
|||||||||||||||||
Interest and dividend income |
$ |
25,754 |
$ | 25,609 | $ | 20,318 | $ |
51,363 |
$ | 39,655 | ||||||||||||
Interest expense |
19,131 |
19,277 | 14,219 | 38,408 |
27,354 | |||||||||||||||||
Net interest income |
$ |
6,623 |
$ | 6,332 | $ | 6,099 | $ |
12,955 |
$ | 12,301 | ||||||||||||
NIM |
1.50% |
1.41% | 1.53% | 1.45% |
1.50% | |||||||||||||||||
Insurance service result |
$ |
203 |
$ | 187 | $ | 225 | $ |
390 |
$ | 417 | ||||||||||||
Insurance investment result (2) |
59 |
141 | 14 | 200 |
(59 | ) | ||||||||||||||||
Trading revenue |
633 |
804 | 430 | 1,437 |
1,499 | |||||||||||||||||
Investment management and custodial fees |
2,257 |
2,185 | 2,083 | 4,442 |
4,139 | |||||||||||||||||
Mutual fund revenue |
1,067 |
1,030 | 1,000 | 2,097 |
2,015 | |||||||||||||||||
Securities brokerage commissions |
431 |
388 | 377 | 819 |
738 | |||||||||||||||||
Service charges |
557 |
554 | 511 | 1,111 |
1,022 | |||||||||||||||||
Underwriting and other advisory fees |
734 |
606 | 458 | 1,340 |
970 | |||||||||||||||||
Foreign exchange revenue, other than trading |
287 |
262 | 322 | 549 |
755 | |||||||||||||||||
Card service revenue |
291 |
326 | 279 | 617 |
604 | |||||||||||||||||
Credit fees |
434 |
395 | 357 | 829 |
736 | |||||||||||||||||
Net gains on investment securities |
59 |
70 | 111 | 129 |
164 | |||||||||||||||||
Share of profit in joint ventures and associates |
18 |
12 | 12 | 30 |
41 | |||||||||||||||||
Other |
501 |
193 | 167 | 694 |
460 | |||||||||||||||||
Non-interest income |
7,531 |
7,153 | 6,346 | 14,684 |
13,501 | |||||||||||||||||
Total revenue |
$ |
14,154 |
$ | 13,485 | $ | 12,445 | $ |
27,639 |
$ | 25,802 | ||||||||||||
Additional trading information |
||||||||||||||||||||||
Net interest income (3) |
$ |
403 |
$ | 344 | $ | 469 | $ |
747 |
$ | 655 | ||||||||||||
Non-interest income |
633 |
804 | 430 | 1,437 |
1,499 | |||||||||||||||||
Total trading revenue |
$ |
1,036 |
$ | 1,148 | $ | 899 | $ |
2,184 |
$ | 2,154 |
(1) | Amounts have been restated from those previously presented as part of the adoption of IFRS 17, effective November 1, 2023. Refer to Note 2 of our Condensed Financial Statements for further details on these changes. |
(2) | The 2023 restated results may not be fully comparable to the current period as we were not managing our asset and liability portfolios under IFRS 17. |
(3) | Reflects net interest income arising from trading-related positions, including assets and liabilities that are classified or designated at fair value through profit or loss (FVTPL). |
For the three months ended | For the six months ended | |||||||||||||||||||||||
(Millions of Canadian dollars, except percentage amounts) |
April 30 2024 |
January 31 2024 |
April 30 2023 |
April 30 2024 |
April 30 2023 |
|||||||||||||||||||
Personal & Commercial Banking |
$ |
243 |
$ | 149 | $ | 124 | $ |
392 |
$ | 264 | ||||||||||||||
Wealth Management |
(19 |
) |
(27 | ) | 2 | (46 |
) |
26 | ||||||||||||||||
Capital Markets |
19 |
10 | 47 | 29 |
56 | |||||||||||||||||||
Corporate Support and other (2) |
1 |
1 | – | 2 |
– | |||||||||||||||||||
PCL on performing loans |
244 |
133 | 173 | 377 |
346 | |||||||||||||||||||
Personal & Commercial Banking |
$ |
511 |
$ | 486 | $ | 302 | $ |
997 |
$ | 564 | ||||||||||||||
Wealth Management |
46 |
38 | 26 | 84 |
68 | |||||||||||||||||||
Capital Markets |
115 |
161 | 113 | 276 |
166 | |||||||||||||||||||
PCL on impaired loans |
672 |
685 | 441 | 1,357 |
798 | |||||||||||||||||||
PCL – Loans |
916 |
818 | 614 | 1,734 |
1,144 | |||||||||||||||||||
PCL – Other (3) |
4 |
(5 | ) | (14 | ) | (1 |
) |
(12 | ) | |||||||||||||||
Total PCL |
$ |
920 |
$ | 813 | $ | 600 | $ |
1,733 |
$ | 1,132 | ||||||||||||||
PCL on loans is comprised of: |
||||||||||||||||||||||||
Retail |
$ |
107 |
$ | 137 | $ | 97 | $ |
244 |
$ | 231 | ||||||||||||||
Wholesale |
137 |
(4 | ) | 76 | 133 |
115 | ||||||||||||||||||
PCL on performing loans |
244 |
133 | 173 | 377 |
346 | |||||||||||||||||||
Retail |
396 |
359 | 249 | 755 |
488 | |||||||||||||||||||
Wholesale |
276 |
326 | 192 | 602 |
310 | |||||||||||||||||||
PCL on impaired loans |
672 |
685 | 441 | 1,357 |
798 | |||||||||||||||||||
PCL – Loans |
$ |
916 |
$ | 818 | $ | 614 | $ |
1,734 |
$ | 1,144 | ||||||||||||||
PCL on loans as a % of average net loans and acceptances |
0.41% |
0.37% | 0.30% | 0.39% |
0.27% | |||||||||||||||||||
PCL on impaired loans as a % of average net loans and acceptances |
0.30% |
0.31% | 0.21% | 0.31% |
0.19% |
(1) | Information on loans represents loans, acceptances and commitments. |
(2) | Includes PCL recorded in Corporate Support and Insurance. |
(3) | PCL – Other includes amounts related to debt securities measured at fair value through other comprehensive income (FVOCI) and amortized cost, accounts receivable, and financial and purchased guarantees. |
For the three months ended | For the six months ended | |||||||||||||||||||||||
(Millions of Canadian dollars, except percentage amounts) |
April 30 2024 |
January 31 2024 |
April 30 2023 (1) |
April 30 2024 |
April 30 2023 (1) |
|||||||||||||||||||
Salaries |
$ |
2,145 |
$ | 2,078 | $ | 2,069 | $ |
4,223 |
$ | 4,079 | ||||||||||||||
Variable compensation |
2,161 |
2,083 | 1,811 | 4,244 |
3,837 | |||||||||||||||||||
Benefits and retention compensation |
606 |
605 | 561 | 1,211 |
1,105 | |||||||||||||||||||
Share-based compensation |
179 |
397 | 132 | 576 |
402 | |||||||||||||||||||
Human resources |
5,091 |
5,163 | 4,573 | 10,254 |
9,423 | |||||||||||||||||||
Equipment |
615 |
619 | 589 | 1,234 |
1,158 | |||||||||||||||||||
Occupancy |
441 |
407 | 405 | 848 |
809 | |||||||||||||||||||
Communications |
358 |
321 | 318 | 679 |
596 | |||||||||||||||||||
Professional fees |
697 |
624 | 506 | 1,321 |
888 | |||||||||||||||||||
Amortization of other intangibles |
373 |
352 | 383 | 725 |
745 | |||||||||||||||||||
Other |
733 |
838 | 626 | 1,571 |
1,370 | |||||||||||||||||||
Non-interest expense |
$ |
8,308 |
$ | 8,324 | $ | 7,400 | $ |
16,632 |
$ | 14,989 | ||||||||||||||
Efficiency ratio (2) |
58.7% |
61.7% | 59.5% | 60.2% |
58.1% | |||||||||||||||||||
Adjusted efficiency ratio (3) |
56.0% |
57.9% | 58.4% | 57.0% |
57.2% |
(1) | Amounts have been restated from those previously presented as part of the adoption of IFRS 17, effective November 1, 2023. Refer to Note 2 of our Condensed Financial Statements for further details on these changes. |
(2) | Efficiency ratio is calculated as Non-interest expense divided by Total revenue. |
(3) | This is a non-GAAP ratio. For further details, refer to the Key performance and non-GAAP measures section. |
For the three months ended | For the six months ended | |||||||||||||||||||||||
(Millions of Canadian dollars, except percentage amounts) |
April 30 2024 |
January 31 2024 |
April 30 2023 (1) |
April 30 2024 |
April 30 2023 (1) |
|||||||||||||||||||
Income taxes |
$ |
976 |
$ | 766 | $ | 765 | $ |
1,742 |
$ | 2,868 | ||||||||||||||
Income before income taxes |
4,926 |
4,348 | 4,445 | 9,274 |
9,681 | |||||||||||||||||||
Effective income tax rate |
19.8% |
17.6% | 17.2% | 18.8% |
29.6% | |||||||||||||||||||
Adjusted results (2), (3) |
||||||||||||||||||||||||
Adjusted income taxes |
$ |
1,037 |
$ | 913 | $ | 794 | $ |
1,950 |
$ | 1,865 | ||||||||||||||
Adjusted income before income taxes |
5,235 |
4,979 | 4,583 | 10,214 |
9,916 | |||||||||||||||||||
Adjusted effective income tax rate |
19.8% |
18.3% | 17.3% | 19.1% |
18.8% |
(1) | Amounts have been restated from those previously presented as part of the adoption of IFRS 17, effective November 1, 2023. Refer to Note 2 of our Condensed Financial Statements for further details on these changes. |
(2) | These are non-GAAP measures. For further details, including a reconciliation, refer to the Key performance and non-GAAP measures section. |
(3) | See Glossary for composition of these measures. |
Business segment results |
How we measure and report our business segments |
Key performance and non-GAAP measures |
For the three months ended | ||||||||||||||||||||||||||||||||||||
April 30 2024 |
January 31 2024 |
April 30 2023 |
||||||||||||||||||||||||||||||||||
(Millions of Canadian dollars, except percentage amounts) |
Personal & Commercial Banking |
Wealth Management |
Insurance |
Capital Markets |
Corporate Support |
Total |
Total | Total (2) | ||||||||||||||||||||||||||||
Net income available to common shareholders |
$ |
2,029 |
$ |
755 |
$ |
177 |
$ |
1,244 |
$ |
(324 |
) |
$ |
3,881 |
$ | 3,522 | $ | 3,612 | |||||||||||||||||||
Total average common equity (3), (4) |
35,600 |
22,700 |
2,050 |
30,950 |
17,350 |
108,650 |
107,100 | 99,450 | ||||||||||||||||||||||||||||
ROE (5) |
23.2% |
13.5% |
34.7% |
16.3% |
n.m. |
14.5% |
13.1% | 14.9% | ||||||||||||||||||||||||||||
For the six months ended | ||||||||||||||||||||||||||||||||||||
April 30 2024 |
April 30 2023 |
|||||||||||||||||||||||||||||||||||
(Millions of Canadian dollars, except percentage amounts) |
Personal & Commercial Banking |
Wealth Management |
Insurance |
Capital Markets |
Corporate Support |
Total |
Total (2) | |||||||||||||||||||||||||||||
Net income available to common shareholders |
$ |
4,071 |
$ |
1,350 |
$ |
396 |
$ |
2,381 |
$ |
(795 |
) |
$ |
7,403 |
$ | 6,699 | |||||||||||||||||||||
Total average common equity (3), (4) |
33,400 |
22,600 |
2,100 |
31,000 |
18,750 |
107,850 |
98,350 | |||||||||||||||||||||||||||||
ROE (5) |
24.5% |
12.0% |
37.9% |
15.4% |
n.m. |
13.8% |
13.7% |
(1) | Effective November 1, 2023, our attributed capital methodology incorporates leverage requirements to allocate capital to our business segments. For further details on changes to our attributed capital methodology, refer to the How we measure and report our business segments section. |
(2) | Amounts have been restated from those previously presented as part of the adoption of IFRS 17, effective November 1, 2023. Refer to Note 2 of our Condensed Financial Statements for further details on these changes. |
(3) | Total average common equity represents rounded figures. |
(4) | The amounts for the segments are referred to as attributed capital. |
(5) | ROE is based on actual balances of average common equity before rounding. |
n.m. | not meaningful |
• | HSBC Canada transaction and integration costs. |
• | Management of closing capital volatility related to the HSBC Canada transaction. For further details, refer to the Key corporate events section. |
• | CRD and other tax related adjustments: reflects the impact of the CRD and the 1.5% increase in the Canadian corporate tax rate applicable to fiscal 2022, net of deferred tax adjustments, which were announced in the Government of Canada’s 2022 budget and enacted in the first quarter of 2023. |
As at or for the three months ended | As at or for the six months ended | |||||||||||||||||||||
(Millions of Canadian dollars, except per share, number of and percentage amounts) |
April 30 2024 |
January 31 2024 |
April 30 2023 (1) |
April 30 2024 |
April 30 2023 (1) |
|||||||||||||||||
Total revenue |
$ |
14,154 |
$ | 13,485 | $ | 12,445 | $ |
27,639 |
$ | 25,802 | ||||||||||||
PCL |
920 |
813 | 600 | 1,733 |
1,132 | |||||||||||||||||
Non-interest expense |
8,308 |
8,324 | 7,400 | 16,632 |
14,989 | |||||||||||||||||
Income before income taxes |
4,926 |
4,348 | 4,445 | 9,274 |
9,681 | |||||||||||||||||
Income taxes |
976 |
766 | 765 | 1,742 |
2,868 | |||||||||||||||||
Net income |
$ |
3,950 |
$ | 3,582 | $ | 3,680 | $ |
7,532 |
$ | 6,813 | ||||||||||||
Net income available to common shareholders |
$ |
3,881 |
$ | 3,522 | $ | 3,612 | $ |
7,403 |
$ | 6,699 | ||||||||||||
Average number of common shares (thousands) |
1,412,651 |
1,406,324 | 1,388,388 | 1,409,452 |
1,385,525 | |||||||||||||||||
Basic earnings per share (in dollars) |
$ |
2.75 |
$ | 2.50 | $ | 2.60 | $ |
5.25 |
$ | 4.83 | ||||||||||||
Average number of diluted common shares (thousands) |
1,414,166 |
1,407,641 | 1,390,149 | 1,410,842 |
1,387,295 | |||||||||||||||||
Diluted earnings per share (in dollars) |
$ |
2.74 |
$ | 2.50 | $ | 2.60 | $ |
5.25 |
$ | 4.83 | ||||||||||||
ROE (2) |
14.5% |
13.1% | 14.9% | 13.8% |
13.7% | |||||||||||||||||
Effective income tax rate |
19.8% |
17.6% | 17.2% | 18.8% |
29.6% | |||||||||||||||||
Total adjusting items impacting net income (before-tax) |
$ |
309 |
$ | 631 | $ | 138 | $ |
940 |
$ | 235 | ||||||||||||
Specified item: HSBC Canada transaction and integration costs (3), (4) |
358 |
265 | 56 | 623 |
67 | |||||||||||||||||
Specified item: Management of closing capital volatility related to the HSBC Canada transaction (3), (5) |
(155 |
) |
286 | – | 131 |
– | ||||||||||||||||
Amortization of acquisition-related intangibles (6) |
106 |
80 | 82 | 186 |
168 | |||||||||||||||||
Total income taxes for adjusting items impacting net income |
$ |
61 |
$ | 147 | $ | 29 | $ |
208 |
$ | (1,003 | ) | |||||||||||
Specified item: HSBC Canada transaction and integration costs (3) |
76 |
47 | 13 | 123 |
16 | |||||||||||||||||
Specified item: Management of closing capital volatility related to the HSBC Canada transaction (3), (5) |
(43 |
) |
79 | – | 36 |
– | ||||||||||||||||
Specified item: CRD and other tax related adjustments (3), (7) |
– |
– | – | – |
(1,050 | ) | ||||||||||||||||
Amortization of acquisition-related intangibles (6) |
28 |
21 | 16 | 49 |
31 | |||||||||||||||||
Adjusted results (8) |
||||||||||||||||||||||
Income before income taxes – adjusted |
$ |
5,235 |
$ | 4,979 | $ | 4,583 | $ |
10,214 |
$ | 9,916 | ||||||||||||
Income taxes – adjusted |
1,037 |
913 | 794 | 1,950 |
1,865 | |||||||||||||||||
Net income – adjusted (8) |
$ |
4,198 |
$ | 4,066 | $ | 3,789 | $ |
8,264 |
$ | 8,051 | ||||||||||||
Net income available to common shareholders – adjusted (8) |
$ |
4,129 |
$ | 4,006 | $ | 3,721 | $ |
8,135 |
$ | 7,937 | ||||||||||||
Average number of common shares (thousands) |
1,412,651 |
1,406,324 | 1,388,388 | 1,409,452 |
1,385,525 | |||||||||||||||||
Basic earnings per share (in dollars) – adjusted (8) |
$ |
2.92 |
$ | 2.85 | $ | 2.68 | $ |
5.77 |
$ | 5.73 | ||||||||||||
Average number of diluted common shares (thousands) |
1,414,166 |
1,407,641 | 1,390,149 | 1,410,842 |
1,387,295 | |||||||||||||||||
Diluted earnings per share (in dollars) – adjusted (8) |
$ |
2.92 |
$ | 2.85 | $ | 2.68 | $ |
5.77 |
$ | 5.72 | ||||||||||||
ROE – adjusted (8) |
15.5% |
14.9% | 15.3% | 15.2% |
16.3% | |||||||||||||||||
Adjusted effective income tax rate (8) |
19.8% |
18.3% | 17.3% | 19.1% |
18.8% | |||||||||||||||||
Adjusted efficiency ratio (8) |
||||||||||||||||||||||
Total revenue |
$ |
14,154 |
$ | 13,485 | $ | 12,445 | $ |
27,639 |
$ | 25,802 | ||||||||||||
Add specified item: Management of closing capital volatility related to the HSBC Canada transaction (before-tax) (3), (5) |
(155 |
) |
286 | – | 131 |
– | ||||||||||||||||
Total revenue – adjusted |
$ |
13,999 |
$ | 13,771 | $ | 12,445 | $ |
27,770 |
$ | 25,802 | ||||||||||||
Non-interest expense |
$ |
8,308 |
$ | 8,324 | $ | 7,400 | $ |
16,632 |
$ | 14,989 | ||||||||||||
Less specified item: HSBC Canada transaction and integration costs (before-tax) (3) |
358 |
265 | 56 | 623 |
67 | |||||||||||||||||
Less: Amortization of acquisition-related intangibles (before-tax) (6) |
106 |
80 | 82 | 186 |
168 | |||||||||||||||||
Non-interest expense – adjusted |
$ |
7,844 |
$ | 7,979 | $ | 7,262 | $ |
15,823 |
$ | 14,754 | ||||||||||||
Efficiency ratio |
58.7% |
61.7% | 59.5% | 60.2% |
58.1% | |||||||||||||||||
Efficiency ratio – adjusted |
56.0% |
57.9% | 58.4% | 57.0% |
57.2% |
(1) | Amounts have been restated from those previously presented as part of the adoption of IFRS 17, effective November 1, 2023. Refer to Note 2 of our Condensed Financial Statements for further details on these changes. |
(2) | ROE is based on actual balances of average common equity before rounding. |
(3) | These amounts have been recognized in Corporate Support. |
(4) | As at April 30, 2024, the cumulative HSBC Canada transaction and integration costs (before-tax) incurred were $1 billion and it is currently estimated that an additional $0.5 billion will be incurred, for a total of approximately $1.5 billion. |
(5) | Beginning the first quarter of 2024, we included management of closing capital volatility related to the HSBC Canada transaction as a specified item for non-GAAP measures and non-GAAP ratios. Refer to the Key corporate events section for further details. |
(6) | Represents the impact of amortization of acquisition-related intangibles (excluding amortization of software), and any goodwill impairment. |
(7) | The impact of the CRD and other tax related adjustments does not include $0.2 billion recognized in other comprehensive income. |
(8) | See Glossary for composition of these measures. |
Personal & Commercial Banking |
As at or for the three months ended | As at or for the six months ended | |||||||||||||||||||||
(Millions of Canadian dollars, except percentage amounts and as otherwise noted) |
April 30 2024 (1) |
January 31 2024 |
April 30 2023 |
April 30 2024 (1) |
April 30 2023 |
|||||||||||||||||
Net interest income |
$ |
4,400 |
$ | 4,216 | $ | 3,817 | $ |
8,616 |
$ | 7,824 | ||||||||||||
Non-interest income |
1,590 |
1,578 | 1,481 | 3,168 |
3,015 | |||||||||||||||||
Total revenue |
5,990 |
5,794 | 5,298 | 11,784 |
10,839 | |||||||||||||||||
PCL on performing assets |
245 |
150 | 122 | 395 |
263 | |||||||||||||||||
PCL on impaired assets |
509 |
484 | 300 | 993 |
560 | |||||||||||||||||
PCL |
754 |
634 | 422 | 1,388 |
823 | |||||||||||||||||
Non-interest expense |
2,428 |
2,339 | 2,257 | 4,767 |
4,486 | |||||||||||||||||
Income before income taxes |
2,808 |
2,821 | 2,619 | 5,629 |
5,530 | |||||||||||||||||
Net income |
$ |
2,051 |
$ | 2,061 | $ | 1,915 | $ |
4,112 |
$ | 4,041 | ||||||||||||
Revenue by business |
||||||||||||||||||||||
Canadian Banking |
$ |
5,704 |
$ | 5,516 | $ | 5,040 | $ |
11,220 |
$ | 10,324 | ||||||||||||
Caribbean & U.S. Banking |
286 |
278 | 258 | 564 |
515 | |||||||||||||||||
Selected balance sheet and other information |
||||||||||||||||||||||
ROE (2) |
23.2% |
26.0% | 26.5% | 24.5% |
28.2% | |||||||||||||||||
NIM |
2.82% |
2.77% | 2.70% | 2.79% |
2.73% | |||||||||||||||||
Efficiency ratio (3) |
40.5% |
40.4% | 42.6% | 40.5% |
41.4% | |||||||||||||||||
Operating leverage (3) |
5.5% |
(0.3)% | (0.2)% | 2.4% |
2.5% | |||||||||||||||||
Average total earning assets, net |
$ |
634,900 |
$ | 605,500 | $ | 579,800 | $ |
620,000 |
$ | 577,800 | ||||||||||||
Average loans and acceptances, net |
643,500 |
614,100 | 586,700 | 628,600 |
584,300 | |||||||||||||||||
Average deposits |
664,800 |
630,600 | 588,000 | 647,600 |
583,800 | |||||||||||||||||
AUA (4), (5) |
405,400 |
362,700 | 355,300 | 405,400 |
355,300 | |||||||||||||||||
Average AUA |
385,700 |
357,200 | 347,900 | 371,300 |
345,600 | |||||||||||||||||
PCL on impaired loans as a % of average net loans and acceptances |
0.32% |
0.31% | 0.21% | 0.32% |
0.19% | |||||||||||||||||
Other selected information – Canadian Banking |
||||||||||||||||||||||
Net income |
$ |
1,959 |
$ | 1,967 | $ | 1,825 | $ |
3,926 |
$ | 3,881 | ||||||||||||
NIM |
2.76% |
2.72% | 2.65% | 2.74% |
2.69% | |||||||||||||||||
Efficiency ratio |
39.3% |
39.2% | 41.4% | 39.3% |
40.2% | |||||||||||||||||
Operating leverage |
5.8% |
(0.7)% | (0.6)% | 2.5% |
2.3% |
(1) | On March 28, 2024, we completed the HSBC Canada transaction. HSBC Canada results have been consolidated from the closing date, which impacted results, balances and ratios for the three months and six months ended April 30, 2024. For further details, refer to the Key corporate events section. |
(2) | Effective November 1, 2023, our attributed capital methodology incorporates leverage requirements to allocate capital to our business segments. For further details on changes to our attributed capital methodology, refer to the How we measure and report our business segments section. |
(3) | See Glossary for composition of this measure. |
(4) | AUA represents period-end spot balances and includes securitized residential mortgages and credit card loans as at April 30, 2024 of $16 billion and $6 billion, respectively (January 31, 2024 – $14 billion and $6 billion; April 30, 2023 – $15 billion and $8 billion). |
(5) | Comparative amounts for the three months and six months ended April 30, 2023 have been revised from those previously presented. |
Wealth Management |
As at or for the three months ended | As at or for the six months ended | |||||||||||||||||||||
(Millions of Canadian dollars, except number of, percentage amounts and as otherwise noted) |
April 30 2024 (1) |
January 31 2024 |
April 30 2023 (2) |
April 30 2024 (1) |
April 30 2023 (2) |
|||||||||||||||||
Net interest income (3) |
$ |
1,136 |
$ | 1,150 | $ | 1,089 | $ |
2,286 |
$ | 2,305 | ||||||||||||
Non-interest income (3) |
3,482 |
3,387 | 3,305 | 6,869 |
6,649 | |||||||||||||||||
Total revenue |
4,618 |
4,537 | 4,394 | 9,155 |
8,954 | |||||||||||||||||
PCL on performing assets |
(19 |
) |
(27 | ) | 2 | (46 |
) |
26 | ||||||||||||||
PCL on impaired assets |
46 |
38 | 26 | 84 |
68 | |||||||||||||||||
PCL |
27 |
11 | 28 | 38 |
94 | |||||||||||||||||
Non-interest expense |
3,653 |
3,768 | 3,447 | 7,421 |
6,881 | |||||||||||||||||
Income before income taxes |
938 |
758 | 919 | 1,696 |
1,979 | |||||||||||||||||
Net income |
$ |
769 |
$ | 606 | $ | 719 | $ |
1,375 |
$ | 1,549 | ||||||||||||
Revenue by business |
||||||||||||||||||||||
Canadian Wealth Management |
$ |
1,222 |
$ | 1,177 | $ | 1,094 | $ |
2,399 |
$ | 2,205 | ||||||||||||
U.S. Wealth Management (including City National) |
2,211 |
2,158 | 2,005 | 4,369 |
4,133 | |||||||||||||||||
U.S. Wealth Management (including City National) (US$ millions) |
1,622 |
1,609 | 1,477 | 3,231 |
3,062 | |||||||||||||||||
Global Asset Management |
705 |
725 | 634 | 1,430 |
1,317 | |||||||||||||||||
International Wealth Management |
300 |
317 | 323 | 617 |
611 | |||||||||||||||||
Investor Services (4) |
180 |
160 | 338 | 340 |
688 | |||||||||||||||||
Selected balance sheet and other information |
||||||||||||||||||||||
ROE (5) |
13.5% |
10.5% | 11.9% | 12.0% |
12.6% | |||||||||||||||||
NIM |
3.06% |
3.07% | 2.53% | 3.06% |
2.63% | |||||||||||||||||
Pre-tax margin (6) |
20.3% |
16.7% | 20.9% | 18.5% |
22.1% | |||||||||||||||||
Number of advisors (7) |
6,128 |
6,125 | 6,246 | 6,128 |
6,246 | |||||||||||||||||
Average total earning assets, net |
$ |
151,100 |
$ | 149,000 | $ | 176,600 | $ |
150,000 |
$ | 177,000 | ||||||||||||
Average loans and acceptances, net |
112,400 |
111,900 | 114,200 | 112,200 |
114,200 | |||||||||||||||||
Average deposits (4) |
156,700 |
155,400 | 158,600 | 156,100 |
172,400 | |||||||||||||||||
AUA (4), (8) |
4,120,600 |
4,108,400 | 5,540,900 | 4,120,600 |
5,540,900 | |||||||||||||||||
U.S. Wealth Management (including City National) (8) |
840,700 |
803,400 | 737,500 | 840,700 |
737,500 | |||||||||||||||||
U.S. Wealth Management (including City National) (US$ millions) (8) |
610,800 |
597,800 | 544,300 | 610,800 |
544,300 | |||||||||||||||||
Investor Services (8) |
2,456,300 |
2,508,700 | 4,067,800 | 2,456,300 |
4,067,800 | |||||||||||||||||
AUM (8) |
1,214,100 |
1,141,200 | 1,074,900 | 1,214,100 |
1,074,900 | |||||||||||||||||
Average AUA (4) |
4,159,400 |
4,065,000 | 5,499,000 | 4,111,700 |
5,460,500 | |||||||||||||||||
Average AUM |
1,200,000 |
1,122,100 | 1,060,300 | 1,160,600 |
1,043,600 | |||||||||||||||||
PCL on impaired loans as a % of average net loans and acceptances |
0.17% |
0.14% | 0.10% | 0.15% |
0.11% |
Estimated impact of U.S. dollar, British pound and Euro translation on key income statement items (Millions of Canadian dollars, except percentage amounts) |
For the three months ended |
For the six months ended |
||||||||||||
Q2 2024 vs. Q2 2023 |
Q2 2024 vs. Q1 2024 |
Q2 2024 vs. Q2 2023 |
||||||||||||
Increase (decrease): |
||||||||||||||
Total revenue |
$ |
21 |
$ |
41 |
$ |
39 |
||||||||
PCL |
– |
– |
– |
|||||||||||
Non-interest expense |
17 |
33 |
34 |
|||||||||||
Net income |
4 |
7 |
5 |
|||||||||||
Percentage change in average U.S. dollar equivalent of C$1.00 |
–% |
(1)% |
–% |
|||||||||||
Percentage change in average British pound equivalent of C$1.00 |
(3)% |
(1)% |
(3)% |
|||||||||||
Percentage change in average Euro equivalent of C$1.00 |
–% |
–% |
(1)% |
(1) | On March 28, 2024, we completed the HSBC Canada transaction. HSBC Canada results have been consolidated from the closing date, which impacted results, balances and ratios for the three months and six months ended April 30, 2024. For further details, refer to the Key corporate events section. |
(2) | Effective the fourth quarter of 2023, we moved the Investor Services lending business from our Wealth Management segment to our Capital Markets segment. Therefore, comparative results for the three months and six months ended April 30, 2023 have been revised from those previously presented. |
(3) | Amounts for the three months and six months ended April 30, 2023 have been revised from those previously presented. |
(4) | We completed the sale of RBC Investor Services operations in Europe, Jersey and the U.K. to CACEIS on July 3, 2023, December 1, 2023 and March 25, 2024, respectively (the sale of RBC Investor Services operations). For further details, refer to Note 6 of our Condensed Financial Statements. |
(5) | Effective November 1, 2023, our attributed capital methodology incorporates leverage requirements to allocate capital to our business segments. For further details on changes to our attributed capital methodology, refer to How we measure and report our business segments section. |
(6) | Pre-tax margin is defined as Income before income taxes divided by Total revenue. |
(7) | Represents client-facing advisors across all of our Wealth Management businesses. |
(8) | Represents period-end spot balances. |
Insurance |
As at or for the three months ended | As at or for the six months ended | |||||||||||||||||||||
(Millions of Canadian dollars, except percentage amounts and as otherwise noted) |
April 30 2024 |
January 31 2024 |
April 30 2023 (1), (2) |
April 30 2024 |
April 30 2023 (1), (2) |
|||||||||||||||||
Non-interest income |
||||||||||||||||||||||
Insurance service result |
$ |
203 |
$ | 187 | $ | 225 | $ |
390 |
$ | 417 | ||||||||||||
Insurance investment result |
59 |
141 | 14 | 200 |
(59 | ) | ||||||||||||||||
Other income |
36 |
35 | 33 | 71 |
68 | |||||||||||||||||
Total revenue |
298 |
363 | 272 | 661 |
426 | |||||||||||||||||
PCL |
– |
1 | – | 1 |
– | |||||||||||||||||
Non-interest expense |
69 |
71 | 65 | 140 |
135 | |||||||||||||||||
Income before income taxes |
229 |
291 | 207 | 520 |
291 | |||||||||||||||||
Net income |
$ |
177 |
$ | 220 | $ | 170 | $ |
397 |
$ | 237 | ||||||||||||
Selected balances and other information |
||||||||||||||||||||||
ROE |
34.7% |
40.5% | 32.7% | 37.9% |
22.7% | |||||||||||||||||
Premiums and deposits (3) |
$ |
1,610 |
$ | 1,346 | $ | 1,419 | $ |
2,956 |
$ | 2,658 | ||||||||||||
Contractual service margin (CSM) (4) |
1,980 |
1,977 | 1,804 | 1,980 |
1,804 |
(1) | Amounts have been restated from those previously presented as part of the adoption of IFRS 17, effective November 1, 2023. Refer to Note 2 of our Condensed Financial Statements for further details on these changes. |
(2) | The 2023 restated results may not be fully comparable to the current period as we were not managing our asset and liability portfolios under IFRS 17. |
(3) | Premiums and deposits include premiums on risk-based individual and group insurance and annuity products as well as segregated fund deposits, consistent with insurance industry practices. |
(4) | Represents the CSM of insurance contract assets and liabilities net of reinsurance contract held assets and liabilities. For insurance contracts, the CSM represents the unearned profit (net inflows) for providing insurance coverage. For reinsurance contracts held, the CSM represents the net cost or net gain of purchasing reinsurance. The CSM is not applicable to contracts measured using the premium allocation approach. |
Capital Markets |
As at or for the three months ended | As at or for the six months ended | |||||||||||||||||||||||
(Millions of Canadian dollars, except percentage amounts and as otherwise noted) |
April 30 2024 (1) |
January 31 2024 |
April 30 2023 (2) |
April 30 2024 (1) |
April 30 2023 (2) |
|||||||||||||||||||
Net interest income (3) |
$ |
764 |
$ | 661 | $ | 951 | $ |
1,425 |
$ | 1,743 | ||||||||||||||
Non-interest income (3) |
2,390 |
2,290 | 1,711 | 4,680 |
4,065 | |||||||||||||||||||
Total revenue (3) |
3,154 |
2,951 | 2,662 | 6,105 |
5,808 | |||||||||||||||||||
PCL on performing assets |
22 |
6 | 37 | 28 |
49 | |||||||||||||||||||
PCL on impaired assets |
115 |
161 | 113 | 276 |
166 | |||||||||||||||||||
PCL |
137 |
167 | 150 | 304 |
215 | |||||||||||||||||||
Non-interest expense |
1,722 |
1,642 | 1,510 | 3,364 |
3,211 | |||||||||||||||||||
Income before income taxes |
1,295 |
1,142 | 1,002 | 2,437 |
2,382 | |||||||||||||||||||
Net income |
$ |
1,262 |
$ | 1,154 | $ | 962 | $ |
2,416 |
$ | 2,203 | ||||||||||||||
Revenue by business |
||||||||||||||||||||||||
Corporate & Investment Banking |
$ |
1,672 |
$ | 1,369 | $ | 1,363 | $ |
3,041 |
$ | 2,686 | ||||||||||||||
Global Markets |
1,498 |
1,742 | 1,393 | 3,240 |
3,278 | |||||||||||||||||||
Other |
(16 |
) |
(160 | ) | (94 | ) | (176 |
) |
(156 | ) | ||||||||||||||
Selected balance sheet and other information |
||||||||||||||||||||||||
ROE (4) |
16.3% |
14.6% | 13.9% | 15.4% |
14.8% | |||||||||||||||||||
Average total assets |
$ |
1,154,300 |
$ | 1,194,900 | $ | 1,002,200 | $ |
1,174,800 |
$ | 1,099,100 | ||||||||||||||
Average trading securities |
179,200 |
204,100 | 143,000 | 191,800 |
149,100 | |||||||||||||||||||
Average loans and acceptances, net |
149,900 |
142,100 | 146,400 | 145,900 |
146,600 | |||||||||||||||||||
Average deposits |
294,100 |
292,500 | 296,800 | 293,300 |
301,900 | |||||||||||||||||||
PCL on impaired loans as a % of average net loans and acceptances |
0.31% |
0.45% | 0.32% | 0.38% |
0.24% |
Estimated impact of U.S. dollar, British pound and Euro translation on key income statement items (Millions of Canadian dollars, except percentage amounts) |
For the three months ended |
For the six months ended |
||||||||||||||||||
Q2 2024 vs. Q2 2023 |
Q2 2024 vs. Q1 2024 |
Q2 2024 vs. Q2 2023 |
||||||||||||||||||
Increase (decrease): |
||||||||||||||||||||
Total revenue |
$ |
22 |
$ |
46 |
$ |
42 |
||||||||||||||
PCL |
1 |
2 |
2 |
|||||||||||||||||
Non-interest expense |
11 |
17 |
22 |
|||||||||||||||||
Net income |
10 |
24 |
17 |
|||||||||||||||||
Percentage change in average U.S. dollar equivalent of C$1.00 |
–% |
(1)% |
–% |
|||||||||||||||||
Percentage change in average British pound equivalent of C$1.00 |
(3)% |
(1)% |
(3)% |
|||||||||||||||||
Percentage change in average Euro equivalent of C$1.00 |
–% |
–% |
(1)% |
(1) | On March 28, 2024, we completed the HSBC Canada transaction. HSBC Canada results have been consolidated from the closing date, which impacted results, balances and ratios for the three months and six months ended April 30, 2024. For further details, refer to the Key corporate events section. |
(2) | Effective the fourth quarter of 2023, we moved the Investor Services lending business from our Wealth Management segment to our Capital Markets segment. Therefore, comparative results for the three months and six months ended April 30, 2023 have been revised from those previously presented. |
(3) | The taxable equivalent basis (teb) adjustment for the three months ended April 30, 2024 was $(4) million (January 31, 2024 – $54 million; April 30, 2023 – $213 million) and for the six months ended April 30, 2024 was $50 million (April 30, 2023 – $329 million). For further discussion, refer to the How we measure and report our business segments section of our 2023 Annual Report. |
(4) | Effective November 1, 2023, our attributed capital methodology incorporates leverage requirements to allocate capital to our business segments. For further details on changes to our attributed capital methodology, refer to the How we measure and report our business segments section. |
Corporate Support |
For the three months ended | For the six months ended | |||||||||||||||||||||||
(Millions of Canadian dollars) |
April 30 2024 |
January 31 2024 |
April 30 2023 |
April 30 2024 |
April 30 2023 |
|||||||||||||||||||
Net interest income (loss) (1), (2) |
$ |
323 |
$ | 305 | $ | 242 | $ |
628 |
$ | 429 | ||||||||||||||
Non-interest income (loss) (1), (2), (3) |
(229 |
) |
(465 | ) | (423 | ) | (694 |
) |
(654 | ) | ||||||||||||||
Total revenue (1), (3) |
94 |
(160 | ) | (181 | ) | (66 |
) |
(225 | ) | |||||||||||||||
PCL |
2 |
– | – | 2 |
– | |||||||||||||||||||
Non-interest expense (3) |
436 |
504 | 121 | 940 |
276 | |||||||||||||||||||
Income (loss) before income taxes (1) |
(344 |
) |
(664 | ) | (302 | ) | (1,008 |
) |
(501 | ) | ||||||||||||||
Income taxes (recoveries) (1) |
(35 |
) |
(205 | ) | (216 | ) | (240 |
) |
716 | |||||||||||||||
Net income (loss) |
$ |
(309 |
) |
$ | (459 | ) | $ | (86 | ) | $ |
(768 |
) |
$ | (1,217 | ) |
(1) | Teb adjusted. |
(2) | Amounts for the three and six months ended April 30, 2023 have been revised from those previously presented. |
(3) | Revenue for the three months ended April 30, 2024 included gains of $64 million (January 31, 2024 and April 30, 2023 – gains of $222 million and gains of $11 million, respectively) on economic hedges of our U.S. Wealth Management (including City National) share-based compensation plans, and non-interest expense included $60 million (January 31, 2024 and April 30, 2023 – $206 million and $19 million, respectively) of share-based compensation expense driven by changes in the fair value of liabilities relating to our U.S. Wealth Management (including City National) share-based compensation plans. Revenue for the six months ended April 30, 2024 included gains of $286 million (April 30, 2023 – gains of $132 million) on economic hedges of our U.S. Wealth Management (including City National) share-based compensation plans, and non-interest expense included $266 million (April 30, 2023 – $119 million) of share-based compensation expense driven by changes in the fair value of liabilities relating to our U.S. Wealth Management (including City National) share-based compensation plans. |
Quarterly results and trend analysis |
2024 |
2023 (3) |
2022 | ||||||||||||||||||||||||||||||||||||||||||
(Millions of Canadian dollars, except per share and percentage amounts) |
Q2 (4) |
Q1 | Q4 | Q3 | Q2 | Q1 | Q4 | Q3 | ||||||||||||||||||||||||||||||||||||
Personal & Commercial Banking |
$ |
5,990 |
$ | 5,794 | $ | 5,718 | $ | 5,563 | $ | 5,298 | $ | 5,541 | $ | 5,419 | $ | 5,182 | ||||||||||||||||||||||||||||
Wealth Management (5) |
4,618 |
4,537 | 4,188 | 4,402 | 4,394 | 4,560 | 4,287 | 3,997 | ||||||||||||||||||||||||||||||||||||
Insurance (2) |
298 |
363 | 248 | 336 | 272 | 154 | 644 | 1,233 | ||||||||||||||||||||||||||||||||||||
Capital Markets (5), (6) |
3,154 |
2,951 | 2,564 | 2,679 | 2,662 | 3,146 | 2,505 | 1,889 | ||||||||||||||||||||||||||||||||||||
Corporate Support (6) |
94 |
(160 | ) | (33 | ) | (3 | ) | (181 | ) | (44 | ) | (288 | ) | (169 | ) | |||||||||||||||||||||||||||||
Total revenue |
14,154 |
13,485 | 12,685 | 12,977 | 12,445 | 13,357 | 12,567 | 12,132 | ||||||||||||||||||||||||||||||||||||
PCL |
920 |
813 | 720 | 616 | 600 | 532 | 381 | 340 | ||||||||||||||||||||||||||||||||||||
PBCAE (7) |
n.a. |
n.a. | n.a. | n.a. | n.a. | n.a. | 116 | 850 | ||||||||||||||||||||||||||||||||||||
Non-interest expense |
8,308 |
8,324 | 8,059 | 7,765 | 7,400 | 7,589 | 7,209 | 6,386 | ||||||||||||||||||||||||||||||||||||
Income before income taxes |
4,926 |
4,348 | 3,906 | 4,596 | 4,445 | 5,236 | 4,861 | 4,556 | ||||||||||||||||||||||||||||||||||||
Income taxes |
976 |
766 | (33 | ) | 736 | 765 | 2,103 | 979 | 979 | |||||||||||||||||||||||||||||||||||
Net income |
$ |
3,950 |
$ | 3,582 | $ | 3,939 | $ | 3,860 | $ | 3,680 | $ | 3,133 | $ | 3,882 | $ | 3,577 | ||||||||||||||||||||||||||||
EPS – basic |
$ |
2.75 |
$ | 2.50 | $ | 2.77 | $ | 2.73 | $ | 2.60 | $ | 2.23 | $ | 2.75 | $ | 2.52 | ||||||||||||||||||||||||||||
– diluted |
2.74 |
2.50 | 2.76 | 2.73 | 2.60 | 2.23 | 2.74 | 2.51 | ||||||||||||||||||||||||||||||||||||
Effective income tax rate |
19.8% |
17.6% | (0.8)% | 16.0% | 17.2% | 40.2% | 20.1% | 21.5% | ||||||||||||||||||||||||||||||||||||
Period average US$ equivalent of C$1.00 |
$ |
0.734 |
$ | 0.745 | $ | 0.732 | $ | 0.750 | $ | 0.737 | $ | 0.745 | $ | 0.739 | $ | 0.783 |
(1) | Fluctuations in the Canadian dollar relative to other foreign currencies have affected our consolidated results over the period. |
(2) | Effective November 1, 2023, we adopted IFRS 17. The quarterly trend for the Insurance segment will not be fully comparable across the periods presented as they have been prepared under a different basis of accounting. The 2023 results have been restated as part of our adoption of IFRS 17 while results for the fiscal 2022 periods are reported in accordance with IFRS 4 Insurance Contracts |
(3) | Amounts have been restated from those previously presented as part of the adoption of IFRS 17, effective November 1, 2023. Refer to Note 2 of our Condensed Financial Statements for further details on these changes. |
(4) | On March 28, 2024, we completed the HSBC Canada transaction. HSBC Canada results have been consolidated from the closing date, and are included in our Personal & Commercial Banking, Wealth Management and Capital Markets segments. For further details, refer to the Key corporate events section. |
(5) | Effective the fourth quarter of 2023, we moved the Investor Services lending business from our Wealth Management segment to our Capital Markets segment. Therefore, comparative results have been revised from those previously presented. |
(6) | Teb adjusted. For further discussion, refer to the How we measure and report our business segments section of our 2023 Annual Report. |
(7) | As part of our adoption of IFRS 17, Insurance policyholder benefits, claims and acquisition expense (PBCAE) is no longer applicable. 2023 amounts have been restated from those previously presented. |
n.a. | not applicable |
Financial condition |
Condensed balance sheets |
As at | ||||||||
(Millions of Canadian dollars) |
April 30 2024 |
October 31 2023 (1) |
||||||
Assets |
||||||||
Cash and due from banks |
$ |
61,373 |
$ | 61,989 | ||||
Interest-bearing deposits with banks |
38,459 |
71,086 | ||||||
Securities, net of applicable allowance (2) |
412,553 |
409,730 | ||||||
Assets purchased under reverse repurchase agreements and securities borrowed |
301,797 |
340,191 | ||||||
Loans |
||||||||
Retail |
612,687 |
569,951 | ||||||
Wholesale |
353,567 |
287,826 | ||||||
Allowance for loan losses |
(5,715 |
) |
(5,004 | ) | ||||
Other – Derivatives |
130,199 |
142,450 | ||||||
– Other |
126,130 |
128,312 | ||||||
Total assets |
$ |
2,031,050 |
$ | 2,006,531 | ||||
Liabilities |
||||||||
Deposits |
$ |
1,327,603 |
$ | 1,231,687 | ||||
Other – Derivatives |
136,568 |
142,629 | ||||||
– Other |
431,811 |
505,682 | ||||||
Subordinated debentures |
13,464 |
11,386 | ||||||
Total liabilities |
1,909,446 |
1,891,384 | ||||||
Equity attributable to shareholders |
121,504 |
115,048 | ||||||
Non-controlling interests |
100 |
99 | ||||||
Total equity |
121,604 |
115,147 | ||||||
Total liabilities and equity |
$ |
2,031,050 |
$ | 2,006,531 |
(1) | Amounts have been restated from those previously presented as part of the adoption of IFRS 17, effective November 1, 2023. Refer to Note 2 of our Condensed Financial Statements for further details on these changes. |
(2) | Securities are comprised of trading and investment securities. |
Off-balance sheet arrangements |
Risk management |
Credit risk |
As at April 30, 2024 |
||||||||||||||||||||||||||||||
(Millions of Canadian dollars, except percentage amounts) |
Residential mortgages |
Home equity lines of credit |
||||||||||||||||||||||||||||
Insured |
Uninsured |
Total |
Total |
|||||||||||||||||||||||||||
Region (4) |
||||||||||||||||||||||||||||||
Canada |
||||||||||||||||||||||||||||||
Atlantic provinces |
$ |
8,484 |
43 |
% |
$ |
11,094 |
57 |
% |
$ |
19,578 |
$ |
1,659 |
||||||||||||||||||
Quebec |
12,107 |
26 |
34,488 |
74 |
46,595 |
3,251 |
||||||||||||||||||||||||
Ontario |
32,467 |
15 |
183,690 |
85 |
216,157 |
17,773 |
||||||||||||||||||||||||
Alberta |
19,246 |
45 |
23,656 |
55 |
42,902 |
4,465 |
||||||||||||||||||||||||
Saskatchewan and Manitoba |
8,542 |
41 |
12,050 |
59 |
20,592 |
1,752 |
||||||||||||||||||||||||
B.C. and territories |
13,040 |
15 |
74,466 |
85 |
87,506 |
7,861 |
||||||||||||||||||||||||
Total Canada (5) |
93,886 |
22 |
339,444 |
78 |
433,330 |
36,761 |
||||||||||||||||||||||||
U.S. |
– |
– |
32,893 |
100 |
32,893 |
2,119 |
||||||||||||||||||||||||
Other International |
– |
– |
3,152 |
100 |
3,152 |
1,521 |
||||||||||||||||||||||||
Total International |
– |
– |
36,045 |
100 |
36,045 |
3,640 |
||||||||||||||||||||||||
Total |
$ |
93,886 |
20 |
% |
$ |
375,489 |
80 |
% |
$ |
469,375 |
$ |
40,401 |
||||||||||||||||||
As at January 31, 2024 | ||||||||||||||||||||||||||||||
(Millions of Canadian dollars, except percentage amounts) |
Residential mortgages | Home equity lines of credit (2) |
||||||||||||||||||||||||||||
Insured (3) | Uninsured | Total | Total | |||||||||||||||||||||||||||
Region (4) |
||||||||||||||||||||||||||||||
Canada |
||||||||||||||||||||||||||||||
Atlantic provinces |
$ | 8,448 | 44 | % | $ | 10,840 | 56 | % | $ | 19,288 | $ | 1,637 | ||||||||||||||||||
Quebec |
11,708 | 27 | 31,778 | 73 | 43,486 | 3,137 | ||||||||||||||||||||||||
Ontario |
30,167 | 15 | 169,410 | 85 | 199,577 | 16,744 | ||||||||||||||||||||||||
Alberta |
18,714 | 45 | 22,602 | 55 | 41,316 | 4,352 | ||||||||||||||||||||||||
Saskatchewan and Manitoba |
8,473 | 42 | 11,846 | 58 | 20,319 | 1,741 | ||||||||||||||||||||||||
B.C. and territories |
11,737 | 16 | 62,374 | 84 | 74,111 | 7,083 | ||||||||||||||||||||||||
Total Canada (5) |
89,247 | 22 | 308,850 | 78 | 398,097 | 34,694 | ||||||||||||||||||||||||
U.S. |
– | – | 32,374 | 100 | 32,374 | 1,986 | ||||||||||||||||||||||||
Other International |
– | – | 3,093 | 100 | 3,093 | 1,582 | ||||||||||||||||||||||||
Total International |
– | – | 35,467 | 100 | 35,467 | 3,568 | ||||||||||||||||||||||||
Total |
$ | 89,247 | 21 | % | $ | 344,317 | 79 | % | $ | 433,564 | $ | 38,262 |
(1) | Disclosure is provided in accordance with the requirements of OSFI’s Guideline B-20 (Residential Mortgage Underwriting Practices and Procedures). |
(2) | Includes $40,383 million and $18 million of uninsured and insured home equity lines of credit, respectively (January 31, 2024 – $38,242 million and $20 million, respectively), reported within the personal loan category. The amounts in U.S. and Other International include term loans collateralized by residential properties. |
(3) | Insured residential mortgages are mortgages whereby our exposure to default is mitigated by insurance through the Canadian Mortgage and Housing Corporation or other private mortgage default insurers. |
(4) | Region is based upon the address of the property mortgaged. The Atlantic provinces are comprised of Newfoundland and Labrador, Prince Edward Island, Nova Scotia and New Brunswick; B.C. and territories are comprised of British Columbia, Nunavut, Northwest Territories and Yukon. |
(5) | Total consolidated residential mortgages in Canada of $433 billion (January 31, 2024 – $398 billion) includes $12 billion (January 31, 2024 – $12 billion) of mortgages with commercial clients in Canadian Banking, of which $9 billion (January 31, 2024 – $9 billion) are insured, and $18 billion (January 31, 2024 – $18 billion) of residential mortgages in Capital Markets, of which $18 billion (January 31, 2024 – $18 billion) are held for securitization purposes. All of the residential mortgages held for securitization purposes are insured (January 31, 2024 – all insured). |
As at | ||||||||||||||||||||||||||
April 30 2024 |
January 31 2024 | |||||||||||||||||||||||||
Canada |
U.S. and other International |
Total |
Canada (2) | U.S. and other International |
Total | |||||||||||||||||||||
Amortization period |
||||||||||||||||||||||||||
≤ 25 years |
58 |
% |
28 |
% |
56 |
% |
58 | % | 27 | % | 55 | % | ||||||||||||||
> 25 years ≤ 30 years |
21 |
72 |
25 |
21 | 73 | 25 | ||||||||||||||||||||
> 30 years ≤ 35 years |
2 |
– |
1 |
1 | – | 1 | ||||||||||||||||||||
> 35 years |
19 |
– |
18 |
20 | – | 19 | ||||||||||||||||||||
Total |
100 |
% |
100 |
% |
100 |
% |
100 | % | 100 | % | 100 | % |
(1) | Disclosure is provided in accordance with the requirements of OSFI’s Guideline B-20 (Residential Mortgage Underwriting Practices and Procedures). |
(2) | Our policy is to originate mortgages with amortization periods of 30 years or less. Amortization periods greater than 30 years reflect the impact of increases in interest rates on our variable rate mortgage portfolios. For these loans, the amortization period resets to the original amortization schedule upon renewal. We do not originate mortgage products with a structure that would result in negative amortization, as payments on variable rate mortgages automatically increase to ensure accrued interest is covered. |
For the three months ended | For the six months ended | |||||||||||||||||||||||||||
April 30 2024 |
January 31 2024 |
April 30 2024 |
||||||||||||||||||||||||||
Uninsured |
Uninsured | Uninsured |
||||||||||||||||||||||||||
Residential mortgages |
RBC Homeline Plan products |
Residential mortgages (2) |
RBC Homeline Plan products (3) |
Residential mortgages |
RBC Homeline Plan products | |||||||||||||||||||||||
Average of newly originated and acquired for the period, by region (4) |
||||||||||||||||||||||||||||
Atlantic provinces |
61 |
% |
66 |
% |
70 | % | 69 | % | 65 |
% |
67 |
% | ||||||||||||||||
Quebec |
55 |
60 |
69 | 68 | 58 |
63 |
||||||||||||||||||||||
Ontario |
56 |
56 |
70 | 62 | 58 |
57 |
||||||||||||||||||||||
Alberta |
59 |
61 |
72 | 68 | 60 |
63 |
||||||||||||||||||||||
Saskatchewan and Manitoba |
62 |
66 |
71 | 71 | 65 |
68 |
||||||||||||||||||||||
B.C. and territories |
45 |
46 |
67 | 61 | 47 |
49 |
||||||||||||||||||||||
U.S. |
71 |
n.m. |
72 | n.m. | 72 |
n.m. |
||||||||||||||||||||||
Other International |
69 |
n.m. |
73 | n.m. | 71 |
n.m. |
||||||||||||||||||||||
Average of newly originated and acquired for the period (5), (6), (7) |
52 |
% |
53 |
% |
70 | % | 64 | % | 55 |
% |
56 |
% | ||||||||||||||||
Total Canadian Banking residential mortgages portfolio (8), (9) |
57 |
% |
49 |
% |
58 | % | 48 | % | 57 |
% |
49 |
% |
(1) | Disclosure is provided in accordance with the requirements of OSFI’s Guideline B-20 (Residential Mortgage Underwriting Practices and Procedures). |
(2) | Residential mortgages exclude residential mortgages within the RBC Homeline Plan products. |
(3) | RBC Homeline Plan products are comprised of both residential mortgages and home equity lines of credit. |
(4) | Region is based upon the address of the property mortgaged. The Atlantic provinces are comprised of Newfoundland and Labrador, Prince Edward Island, Nova Scotia and New Brunswick; B.C. and territories are comprised of British Columbia, Nunavut, Northwest Territories and Yukon. |
(5) | The average LTV ratios for newly originated and acquired uninsured residential mortgages and RBC Homeline Plan products are calculated on a weighted basis by mortgage amounts at origination. |
(6) | For newly originated mortgages and RBC Homeline Plan products, LTV is calculated based on the total facility amount for the residential mortgage and RBC Homeline Plan product divided by the value of the related residential property. |
(7) | Includes the acquired HSBC Canada portfolio. Excluding the acquired HSBC Canada portfolio, the average of newly originated and acquired residential mortgages and RBC Homeline Plan products for the three months ended April 30, 2024 was 70% and 65%, respectively, and for the six months ended April 30, 2024 was 70% and 64%, respectively. |
(8) | Weighted by mortgage balances and adjusted for property values based on the Teranet-National Bank House Price Index ‡ |
(9) | Includes the acquired HSBC Canada portfolio. Excluding the acquired HSBC Canada portfolio, the total Canadian Banking residential mortgages portfolio for residential mortgages and RBC Homeline Plan products for the three months ended April 30, 2024 was 58% and 49%, respectively, and for the six months ended April 30, 2024 was 58% and 49%, respectively. |
n.m. | not meaningful |
As at | ||||||||||||||||||||||||||||||||||||||||||
April 30 2024 |
January 31 2024 |
|||||||||||||||||||||||||||||||||||||||||
Asset type |
Client type |
|||||||||||||||||||||||||||||||||||||||||
(Millions of Canadian dollars) | Loans Outstanding |
Securities |
Repo-style transactions |
Derivatives |
Financials |
Sovereign |
Corporate |
Total |
Total | |||||||||||||||||||||||||||||||||
Europe (excluding U.K.) |
$ |
14,380 |
$ |
28,137 |
$ |
6,048 |
$ |
4,005 |
$ |
21,838 |
$ |
13,471 |
$ |
17,261 |
$ |
52,570 |
$ | 48,913 | ||||||||||||||||||||||||
U.K. |
10,458 |
12,018 |
5,777 |
2,888 |
16,113 |
4,960 |
10,068 |
31,141 |
44,991 | |||||||||||||||||||||||||||||||||
Caribbean |
6,834 |
12,144 |
1,887 |
1,784 |
10,372 |
4,293 |
7,984 |
22,649 |
20,092 | |||||||||||||||||||||||||||||||||
Asia-Pacific |
5,509 |
30,688 |
3,052 |
1,458 |
16,735 |
19,821 |
4,151 |
40,707 |
49,585 | |||||||||||||||||||||||||||||||||
Other (4) |
1,763 |
1,638 |
2,164 |
23 |
2,182 |
1,546 |
1,860 |
5,588 |
6,800 | |||||||||||||||||||||||||||||||||
Net International exposure (5), (6) |
$ |
38,944 |
$ |
84,625 |
$ |
18,928 |
$ |
10,158 |
$ |
67,240 |
$ |
44,091 |
$ |
41,324 |
$ |
152,655 |
$ | 170,381 |
(1) | Geographic profile is based on country of risk, which reflects our assessment of the geographic risk associated with a given exposure. Typically, this is the residence of the borrower. |
(2) | Exposures are calculated on a fair value basis and net of collateral, which includes $362 billion against repo-style transactions (January 31, 2024 – $383 billion) and $16 billion against derivatives (January 31, 2024 – $15 billion). |
(3) | Securities include $14 billion of trading securities (January 31, 2024 – $14 billion), $31 billion of deposits (January 31, 2024 – $50 billion), and $40 billion of investment securities (January 31, 2024 – $41 billion). |
(4) | Includes exposures in the Middle East, Africa and Latin America. |
(5) | Excludes $6,846 million (January 31, 2024 – $5,789 million) of exposures to supranational agencies. |
(6) | Reflects $3,788 million of mitigation through credit default swaps, which are largely used to hedge single name exposures and market risk (January 31, 2024 – $2,211 million). |
As at and for the three months ended | ||||||||||||
(Millions of Canadian dollars, except percentage amounts) |
April 30 2024 |
January 31 2024 |
October 31 2023 |
|||||||||
Personal & Commercial Banking |
$ |
2,908 |
$ | 2,402 | $ | 1,905 | ||||||
Wealth Management |
586 |
554 | 514 | |||||||||
Capital Markets |
1,838 |
1,242 | 1,285 | |||||||||
Total GIL |
$ |
5,332 |
$ | 4,198 | $ | 3,704 | ||||||
Impaired loans, beginning balance |
$ |
4,198 |
$ | 3,704 | $ | 3,284 | ||||||
Classified as impaired during the period (new impaired) (1) |
1,712 |
1,494 | 1,063 | |||||||||
Net repayments (1) |
(146 |
) |
(165 | ) | (166 | ) | ||||||
Amounts written off |
(546 |
) |
(610 | ) | (466 | ) | ||||||
Other (2) |
114 |
(225 | ) | (11 | ) | |||||||
Impaired loans, balance at end of period |
$ |
5,332 |
$ | 4,198 | $ | 3,704 | ||||||
GIL as a % of related loans and acceptances |
||||||||||||
Total GIL as a % of related loans and acceptances |
0.55% |
0.48% | 0.42% | |||||||||
Personal & Commercial Banking |
0.42% |
0.39% | 0.31% | |||||||||
Canadian Banking |
0.38% |
0.35% | 0.26% | |||||||||
Caribbean Banking |
3.27% |
3.29% | 3.45% | |||||||||
Wealth Management |
0.51% |
0.50% | 0.44% | |||||||||
Capital Markets |
1.17% |
0.85% | 0.89% |
(1) | Certain GIL movements for Canadian Banking retail and wholesale portfolios are generally allocated to new impaired, as Net repayments and certain Other movements are not reasonably determinable. Certain GIL movements for Caribbean Banking retail and wholesale portfolios are generally allocated to Net repayments and new impaired, as Net repayments and certain Other movements are not reasonably determinable. |
(2) | Includes return to performing status during the period, recoveries of loans and advances previously written off, sold, and foreign exchange translation and other movements. |
As at | ||||||||||||
(Millions of Canadian dollars) |
April 30 2024 |
January 31 2024 |
October 31 2023 |
|||||||||
Personal & Commercial Banking |
$ |
4,390 |
$ | 3,980 | $ | 3,718 | ||||||
Wealth Management |
563 |
548 | 618 | |||||||||
Capital Markets |
1,119 |
1,101 | 1,012 | |||||||||
Corporate Support and other |
2 |
1 | – | |||||||||
ACL on loans |
6,074 |
5,630 | 5,348 | |||||||||
ACL on other financial assets (1) |
23 |
20 | 18 | |||||||||
Total ACL |
$ |
6,097 |
$ | 5,650 | $ | 5,366 | ||||||
ACL on loans is comprised of: |
||||||||||||
Retail |
$ |
2,837 |
$ | 2,725 | $ | 2,591 | ||||||
Wholesale |
1,732 |
1,605 | 1,609 | |||||||||
ACL on performing loans |
$ |
4,569 |
$ | 4,330 | $ | 4,200 | ||||||
ACL on impaired loans |
1,505 |
1,300 | 1,148 |
(1) | ACL on other financial assets mainly represents allowances on debt securities measured at FVOCI and amortized cost, accounts receivable and financial guarantees. |
Market risk |
April 30, 2024 |
January 31, 2024 | April 30, 2023 (1) | ||||||||||||||||||||||||||||||||||
For the three months ended |
||||||||||||||||||||||||||||||||||
(Millions of Canadian dollars) | As at |
Average |
High |
Low |
As at | Average | As at | Average | ||||||||||||||||||||||||||||
Equity |
$ |
12 |
$ |
10 |
$ |
16 |
$ |
6 |
$ | 10 | $ | 9 | $ | 10 | $ | 11 | ||||||||||||||||||||
Foreign exchange |
3 |
4 |
6 |
2 |
3 | 4 | 2 | 3 | ||||||||||||||||||||||||||||
Commodities |
7 |
5 |
7 |
5 |
5 | 5 | 4 | 5 | ||||||||||||||||||||||||||||
Interest rate (2) |
36 |
26 |
36 |
22 |
30 | 34 | 28 | 31 | ||||||||||||||||||||||||||||
Credit specific (3) |
7 |
7 |
9 |
7 |
8 | 7 | 5 | 5 | ||||||||||||||||||||||||||||
Diversification (4) |
(33 |
) |
(24 |
) |
n.m. |
n.m. |
(31 | ) | (29 | ) | (30 | ) | (33 | ) | ||||||||||||||||||||||
Trading VaR |
$ |
32 |
$ |
28 |
$ |
41 |
$ |
20 |
$ | 25 | $ | 30 | $ | 19 | $ | 22 | ||||||||||||||||||||
Total VaR |
$ |
45 |
$ |
86 |
$ |
121 |
$ |
35 |
$ | 123 | $ | 122 | $ | 41 | $ | 47 | ||||||||||||||||||||
April 30, 2024 |
April 30, 2023 (1) | |||||||||||||||||||||||||||||||||||
For the six months ended |
|||||||||||||||||||||||||||||||||||
(Millions of Canadian dollars) | As at |
Average |
High |
Low |
As at | Average | ||||||||||||||||||||||||||||||
Equity |
$ |
12 |
$ |
9 |
$ |
16 |
$ |
6 |
$ | 10 | $ | 13 | ||||||||||||||||||||||||
Foreign exchange |
3 |
4 |
7 |
2 |
2 | 3 | ||||||||||||||||||||||||||||||
Commodities |
7 |
5 |
7 |
4 |
4 | 6 | ||||||||||||||||||||||||||||||
Interest rate (2) |
36 |
30 |
44 |
22 |
28 | 31 | ||||||||||||||||||||||||||||||
Credit specific (3) |
7 |
7 |
9 |
7 |
5 | 5 | ||||||||||||||||||||||||||||||
Diversification (4) |
(33 |
) |
(26 |
) |
n.m. |
n.m. |
(30 | ) | (34 | ) | ||||||||||||||||||||||||||
Trading VaR |
$ |
32 |
$ |
29 |
$ |
41 |
$ |
20 |
$ | 19 | $ | 24 | ||||||||||||||||||||||||
Total VaR |
$ |
45 |
$ |
104 |
$ |
138 |
$ |
35 |
$ | 41 | $ | 51 |
(1) | Amounts have been revised from those previously presented to align with a trading VaR view. |
(2) | General credit spread risk and funding spread risk associated with uncollateralized derivatives are included under interest rate VaR. |
(3) | Credit specific risk captures issuer-specific credit spread volatility. |
(4) | Trading VaR is less than the sum of the individual risk factor VaR results due to risk factor diversification. |
n.m. | not meaningful |
(1) | Trading revenue (teb) in the chart above excludes the impact of loan underwriting commitments. |
(2) | In Q4 2023, VaR amounts in the chart above were revised from those previously presented to reflect Trading VaR corresponding to our trading portfolios. |
April 30 2024 |
January 31 2024 |
April 30 2023 |
||||||||||||||||||||||||||||||||||||||||||||
EVE risk |
NII risk |
|||||||||||||||||||||||||||||||||||||||||||||
(Millions of Canadian dollars) | Canadian dollar impact |
U.S. dollar impact |
Total |
Canadian dollar impact |
U.S. dollar impact |
Total |
EVE risk | NII risk (1) | EVE risk | NII risk (1) | ||||||||||||||||||||||||||||||||||||
Before-tax impact of: |
||||||||||||||||||||||||||||||||||||||||||||||
100 bps increase in rates |
$ |
(1,879 |
) |
$ |
(270 |
) |
$ |
(2,149 |
) |
$ |
134 |
$ |
191 |
$ |
325 |
$ | (1,649 | ) | $ | 535 | $ | (1,726 | ) | $ | 824 | |||||||||||||||||||||
100 bps decrease in rates |
1,801 |
2 |
1,803 |
(190 |
) |
(268 |
) |
(458 |
) |
1,309 | (622 | ) | 1,507 | (894 | ) |
(1) | Represents the 12-month NII exposure to an instantaneous and sustained shift in interest rates. |
1 |
Amounts have been restated from those previously presented as part of the adoption of IFRS 17, effective November 1, 2023. Refer to Note 2 of our Condensed Financial Statements for further details on these changes. |
As at April 30, 2024 | ||||||||||||||
Market risk measure |
||||||||||||||
(Millions of Canadian dollars) | Balance sheet amount |
Traded risk |
Non-traded risk |
Non-traded riskprimary risk sensitivity | ||||||||||
Assets subject to market risk |
||||||||||||||
Cash and due from banks |
$ |
61,373 |
$ |
– |
$ |
61,373 |
Interest rate | |||||||
Interest-bearing deposits with banks |
38,459 |
1 |
38,458 |
Interest rate | ||||||||||
Securities |
||||||||||||||
Trading |
173,566 |
151,456 |
22,110 |
Interest rate, credit spread | ||||||||||
Investment, net of applicable allowance |
238,987 |
– |
238,987 |
Interest rate, credit spread, equity | ||||||||||
Assets purchased under reverse repurchase agreements and securities borrowed |
301,797 |
266,802 |
34,995 |
Interest rate | ||||||||||
Loans |
||||||||||||||
Retail |
612,687 |
– |
612,687 |
Interest rate | ||||||||||
Wholesale |
353,567 |
16,297 |
337,270 |
Interest rate | ||||||||||
Allowance for loan losses |
(5,715 |
) |
– |
(5,715 |
) |
Interest rate | ||||||||
Other |
||||||||||||||
Derivatives |
130,199 |
127,529 |
2,670 |
Interest rate, foreign exchange | ||||||||||
Other assets |
110,346 |
11,197 |
99,149 |
Interest rate | ||||||||||
Assets not subject to market risk (3) |
15,784 |
|||||||||||||
Total assets |
$ |
2,031,050 |
$ |
573,282 |
$ |
1,441,984 |
||||||||
Liabilities subject to market risk |
||||||||||||||
Deposits |
$ |
1,327,603 |
$ |
57,145 |
$ |
1,270,458 |
Interest rate | |||||||
Other |
||||||||||||||
Obligations related to securities sold short |
31,487 |
31,219 |
268 |
Interest rate, equity | ||||||||||
Obligations related to assets sold under repurchase agreements and securities loaned |
279,721 |
258,589 |
21,132 |
Interest rate | ||||||||||
Derivatives |
136,568 |
126,473 |
10,095 |
Interest rate, foreign exchange | ||||||||||
Other liabilities |
95,744 |
14,203 |
81,541 |
Interest rate | ||||||||||
Subordinated debentures |
13,464 |
– |
13,464 |
Interest rate | ||||||||||
Liabilities not subject to market risk (4) |
24,859 |
|||||||||||||
Total liabilities |
$ |
1,909,446 |
$ |
487,629 |
$ |
1,396,958 |
||||||||
Total equity |
121,604 |
|||||||||||||
Total liabilities and equity |
$ |
2,031,050 |
(1) | Traded risk includes positions that are classified or designated as FVTPL and positions whose revaluation gains and losses are reported in revenue within our trading portfolios. Market risk measures of VaR and stress tests are used as risk controls for traded risk. |
(2) | Non-traded risk includes positions used in the management of IRRBB and other non-trading portfolios. Other material non-trading portfolios include positions from RBC Insurance and investment securities, net of applicable allowance, not included in IRRBB. |
(3) | Assets not subject to market risk include physical and other assets. |
(4) | Liabilities not subject to market risk include payroll related and other liabilities. |
As at January 31, 2024 | ||||||||||||||
Market risk measure | ||||||||||||||
(Millions of Canadian dollars) | Balance sheet amount |
Traded risk (1) | Non-traded risk (2) |
Non-traded riskprimary risk sensitivity | ||||||||||
Assets subject to market risk |
||||||||||||||
Cash and due from banks |
$ | 74,347 | $ | – | $ | 74,347 | Interest rate | |||||||
Interest-bearing deposits with banks |
61,080 | 1 | 61,079 | Interest rate | ||||||||||
Securities |
||||||||||||||
Trading |
193,597 | 171,135 | 22,462 | Interest rate, credit spread | ||||||||||
Investment, net of applicable allowance |
212,216 | – | 212,216 | Interest rate, credit spread, equity | ||||||||||
Assets purchased under reverse repurchase agreements and securities borrowed |
347,871 | 312,834 | 35,037 | Interest rate | ||||||||||
Loans |
||||||||||||||
Retail |
569,894 | 2 | 569,892 | Interest rate | ||||||||||
Wholesale |
293,721 | 7,144 | 286,577 | Interest rate | ||||||||||
Allowance for loan losses |
(5,299 | ) | – | (5,299 | ) | Interest rate | ||||||||
Other |
||||||||||||||
Derivatives |
105,038 | 101,688 | 3,350 | Interest rate, foreign exchange | ||||||||||
Other assets |
106,130 | 9,017 | 97,113 | Interest rate | ||||||||||
Assets not subject to market risk (3) |
15,810 | |||||||||||||
Total assets |
$ | 1,974,405 | $ | 601,821 | $ | 1,356,774 | ||||||||
Liabilities subject to market risk |
||||||||||||||
Deposits |
$ | 1,241,168 | $ | 56,202 | $ | 1,184,966 | Interest rate | |||||||
Other |
||||||||||||||
Obligations related to securities sold short |
35,012 | 35,007 | 5 | Interest rate, equity | ||||||||||
Obligations related to assets sold under repurchase agreements and securities loaned |
334,490 | 313,197 | 21,293 | Interest rate | ||||||||||
Derivatives |
106,974 | 98,998 | 7,976 | Interest rate, foreign exchange | ||||||||||
Other liabilities |
107,065 | 13,166 | 93,899 | Interest rate | ||||||||||
Subordinated debentures |
11,525 | – | 11,525 | Interest rate | ||||||||||
Liabilities not subject to market risk (4) |
21,683 | |||||||||||||
Total liabilities |
$ | 1,857,917 | $ | 516,570 | $ | 1,319,664 | ||||||||
Total equity |
116,488 | |||||||||||||
Total liabilities and equity |
$ | 1,974,405 |
(1) | Traded risk includes positions that are classified or designated as FVTPL and positions whose revaluation gains and losses are reported in revenue within our trading portfolios. Market risk measures of VaR and stress tests are used as risk controls for traded risk. |
(2) | Non-traded risk includes positions used in the management of IRRBB and other non-trading portfolios. Other material non-trading portfolios include positions from RBC Insurance and investment securities, net of applicable allowance, not included in IRRBB. |
(3) | Assets not subject to market risk include physical and other assets. |
(4) | Liabilities not subject to market risk include payroll related and other liabilities. |
Liquidity and funding risk |
As at April 30, 2024 |
||||||||||||||||||||||||
(Millions of Canadian dollars) | Bank-owned liquid assets |
Securities received as collateral from securities financing and derivative transactions |
Total liquid assets |
Encumbered liquid assets |
Unencumbered liquid assets |
|||||||||||||||||||
Cash and deposits with banks |
$ |
99,832 |
$ |
– |
$ |
99,832 |
$ |
3,395 |
$ |
96,437 |
||||||||||||||
Securities issued or guaranteed by sovereigns, central banks or multilateral development banks (1) |
313,620 |
327,290 |
640,910 |
384,177 |
256,733 |
|||||||||||||||||||
Other securities |
146,643 |
124,589 |
271,232 |
158,033 |
113,199 |
|||||||||||||||||||
Other liquid assets (2) |
33,214 |
– |
33,214 |
28,047 |
5,167 |
|||||||||||||||||||
Total liquid assets |
$ |
593,309 |
$ |
451,879 |
$ |
1,045,188 |
$ |
573,652 |
$ |
471,536 |
||||||||||||||
As at January 31, 2024 |
||||||||||||||||||||||||
(Millions of Canadian dollars) | Bank-owned liquid assets |
Securities received as collateral from securities financing and derivative transactions |
Total liquid assets |
Encumbered liquid assets |
Unencumbered liquid assets |
|||||||||||||||||||
Cash and deposits with banks |
$ | 137,887 | $ | – | $ | 137,887 | $ | 3,075 | $ | 134,812 | ||||||||||||||
Securities issued or guaranteed by sovereigns, central banks or multilateral development banks (1) |
320,261 | 373,167 | 693,428 | 438,250 | 255,178 | |||||||||||||||||||
Other securities |
138,801 | 126,761 | 265,562 | 157,158 | 108,404 | |||||||||||||||||||
Other liquid assets (2) |
27,886 | – | 27,886 | 24,768 | 3,118 | |||||||||||||||||||
Total liquid assets |
$ | 624,835 | $ | 499,928 | $ | 1,124,763 | $ | 623,251 | $ | 501,512 | ||||||||||||||
As at | ||||||||||||||||||||||||
(Millions of Canadian dollars) |
April 30 2024 |
January 31 2024 |
||||||||||||||||||||||
Royal Bank of Canada |
$ |
228,869 |
$ | 215,036 | ||||||||||||||||||||
Foreign branches |
50,871 |
76,053 | ||||||||||||||||||||||
Subsidiaries |
191,796 |
210,423 | ||||||||||||||||||||||
Total unencumbered liquid assets |
$ |
471,536 |
$ | 501,512 |
(1) | Includes liquid securities issued by provincial governments and U.S. government-sponsored entities working under U.S. Federal government’s conservatorship (e.g., Federal National Mortgage Association and Federal Home Loan Mortgage Corporation). |
(2) | Encumbered liquid assets amount represents cash collateral and margin deposit amounts pledged related to over-the-counter |
As at | ||||||||||||||||||||||||||||||||||||||||||||||||
April 30 2024 |
January 31 2024 |
|||||||||||||||||||||||||||||||||||||||||||||||
Encumbered |
Unencumbered |
Encumbered | Unencumbered | |||||||||||||||||||||||||||||||||||||||||||||
(Millions of Canadian dollars) | Pledged as collateral |
Other |
Available as collateral |
Other |
Total |
Pledged as collateral |
Other (1) | Available as collateral (2) |
Other (3) | Total | ||||||||||||||||||||||||||||||||||||||
Cash and deposits with banks |
$ |
– |
$ |
3,395 |
$ |
96,437 |
$ |
– |
$ |
99,832 |
$ | – | $ | 3,075 | $ | 134,812 | $ | – | $ | 137,887 | ||||||||||||||||||||||||||||
Securities |
||||||||||||||||||||||||||||||||||||||||||||||||
Trading |
80,608 |
– |
100,152 |
2,400 |
183,160 |
94,705 | – | 108,905 | 2,302 | 205,912 | ||||||||||||||||||||||||||||||||||||||
Investment, net of applicable allowance |
15,584 |
– |
223,403 |
– |
238,987 |
7,850 | – | 204,366 | – | 212,216 | ||||||||||||||||||||||||||||||||||||||
Assets purchased under reverse repurchase agreements and securities borrowed (4) |
470,479 |
29,326 |
9,980 |
1,541 |
511,326 |
512,994 | 27,480 | 10,936 | 1,986 | 553,396 | ||||||||||||||||||||||||||||||||||||||
Loans |
||||||||||||||||||||||||||||||||||||||||||||||||
Retail |
||||||||||||||||||||||||||||||||||||||||||||||||
Mortgage securities |
28,729 |
– |
29,559 |
– |
58,288 |
26,090 | – | 28,879 | – | 54,969 | ||||||||||||||||||||||||||||||||||||||
Mortgage loans |
74,336 |
– |
39,948 |
296,803 |
411,087 |
72,716 | – | 34,489 | 271,390 | 378,595 | ||||||||||||||||||||||||||||||||||||||
Non-mortgage loans |
6,272 |
– |
– |
137,040 |
143,312 |
5,997 | – | – | 130,333 | 136,330 | ||||||||||||||||||||||||||||||||||||||
Wholesale |
– |
– |
27,476 |
326,091 |
353,567 |
– | – | 24,279 | 269,716 | 293,995 | ||||||||||||||||||||||||||||||||||||||
Allowance for loan losses |
– |
– |
– |
(5,715 |
) |
(5,715 |
) |
– | – | – | (5,299 | ) | (5,299 | ) | ||||||||||||||||||||||||||||||||||
Segregated fund net assets |
– |
– |
– |
– |
– |
– | – | – | – | – | ||||||||||||||||||||||||||||||||||||||
Other |
||||||||||||||||||||||||||||||||||||||||||||||||
Derivatives |
– |
– |
– |
130,199 |
130,199 |
– | – | – | 105,038 | 105,038 | ||||||||||||||||||||||||||||||||||||||
Others (5) |
28,047 |
– |
5,167 |
92,916 |
126,130 |
24,768 | – | 3,118 | 91,320 | 119,206 | ||||||||||||||||||||||||||||||||||||||
Total assets |
$ |
704,055 |
$ |
32,721 |
$ |
532,122 |
$ |
981,275 |
$ |
2,250,173 |
$ | 745,120 | $ | 30,555 | $ | 549,784 | $ | 866,786 | $ | 2,192,245 |
(1) | Includes assets restricted from use to generate secured funding due to legal or other constraints. |
(2) | Represents assets that are immediately available for use as collateral, including National Housing Act Mortgage-Backed Securities (NHA MBS), our unencumbered mortgage loans that qualify as eligible collateral at Federal Home Loan Banks (FHLB), as well as loans that qualify as eligible collateral for discount window facility available to us and lodged at the Federal Reserve Bank of New York (FRBNY). |
(3) | Other unencumbered assets are not subject to any restrictions on their use to secure funding or as collateral but would not be considered immediately available. |
(4) | Includes bank-owned liquid assets and securities received as collateral from off-balance sheet securities financing, derivative transactions, and margin lending. Includes $29 billion (January 31, 2024 – $27 billion) of collateral received through reverse repurchase transactions that cannot be rehypothecated in its current legal form. |
(5) | The Pledged as collateral amount represents cash collateral and margin deposit amounts pledged related to OTC and exchange-traded derivative transactions. |
Programs by geography |
Canada |
U.S. |
Europe/Asia | ||
• Canadian Shelf Program – $25 billion |
• U.S. Shelf Program – US$75 billion |
• European Debt Issuance Program – US$75 billion | ||
• Global Covered Bond Program – € 75 billion | ||||
• Japanese Issuance Programs – ¥1 trillion |
(1) Includes unsecured and secured long-term funding and subordinated debentures with an original term to maturity greater than 1 year |
(1) Includes unsecured and secured long-term funding and subordinated debentures with an original term to maturity greater than 1 year | |
(2) Mortgage-backed securities and Canada Mortgage Bonds |
As at April 30, 2024 |
||||||||||||||||||||||||||||||||
(Millions of Canadian dollars) | Less than 1 month |
1 to 3 months |
3 to 6 months |
6 to 12 months |
Less than 1 year sub-total |
1 year to 2 years |
2 years and greater |
Total |
||||||||||||||||||||||||
Deposits from banks (2) |
$ |
3,947 |
$ |
312 |
$ |
– |
$ |
116 |
$ |
4,375 |
$ |
– |
$ |
– |
$ |
4,375 |
||||||||||||||||
Certificates of deposit and commercial paper (3) |
12,883 |
19,008 |
18,663 |
15,599 |
66,153 |
– |
– |
66,153 |
||||||||||||||||||||||||
Asset-backed commercial paper (4) |
4,329 |
3,873 |
8,101 |
1,069 |
17,372 |
– |
– |
17,372 |
||||||||||||||||||||||||
Senior unsecured medium-term notes (5) |
2,589 |
11,435 |
5,007 |
20,148 |
39,179 |
15,666 |
53,963 |
108,808 |
||||||||||||||||||||||||
Senior unsecured structured notes (6) |
858 |
1,822 |
2,347 |
5,812 |
10,839 |
3,980 |
17,470 |
32,289 |
||||||||||||||||||||||||
Mortgage securitization |
– |
1,066 |
405 |
1,815 |
3,286 |
1,307 |
12,720 |
17,313 |
||||||||||||||||||||||||
Covered bonds/asset-backed securities (7) |
– |
– |
1,720 |
3,620 |
5,340 |
13,401 |
47,647 |
66,388 |
||||||||||||||||||||||||
Subordinated liabilities |
– |
1,500 |
– |
1,500 |
3,000 |
3,273 |
7,698 |
13,971 |
||||||||||||||||||||||||
Other (8) |
4,794 |
268 |
1,706 |
1,890 |
8,658 |
16,945 |
145 |
25,748 |
||||||||||||||||||||||||
Total |
$ |
29,400 |
$ |
39,284 |
$ |
37,949 |
$ |
51,569 |
$ |
158,202 |
$ |
54,572 |
$ |
139,643 |
$ |
352,417 |
||||||||||||||||
Of which: |
||||||||||||||||||||||||||||||||
– Secured |
$ |
9,019 |
$ |
5,023 |
$ |
10,975 |
$ |
6,504 |
$ |
31,521 |
$ |
14,708 |
$ |
60,367 |
$ |
106,596 |
||||||||||||||||
– Unsecured |
20,381 |
34,261 |
26,974 |
45,065 |
126,681 |
39,864 |
79,276 |
245,821 |
As at January 31, 2024 | ||||||||||||||||||||||||||||||||
(Millions of Canadian dollars) | Less than 1 month |
1 to 3 months |
3 to 6 months |
6 to 12 months |
Less than 1 year sub-total |
1 year to 2 years |
2 years and greater |
Total | ||||||||||||||||||||||||
Deposits from banks (2) |
$ | 6,568 | $ | 136 | $ | 344 | $ | 20 | $ | 7,068 | $ | – | $ | – | $ | 7,068 | ||||||||||||||||
Certificates of deposit and commercial paper (3) |
7,850 | 12,466 | 26,019 | 22,190 | 68,525 | – | – | 68,525 | ||||||||||||||||||||||||
Asset-backed commercial paper (4) |
4,466 | 5,417 | 6,025 | 1,666 | 17,574 | – | – | 17,574 | ||||||||||||||||||||||||
Senior unsecured medium-term notes (5) |
43 | 691 | 13,797 | 16,683 | 31,214 | 17,205 | 56,171 | 104,590 | ||||||||||||||||||||||||
Senior unsecured structured notes (6) |
1,483 | 1,362 | 1,980 | 3,205 | 8,030 | 5,726 | 16,270 | 30,026 | ||||||||||||||||||||||||
Mortgage securitization |
– | 362 | 1,065 | 841 | 2,268 | 2,243 | 10,297 | 14,808 | ||||||||||||||||||||||||
Covered bonds/asset-backed securities (7) |
– | – | – | 3,831 | 3,831 | 11,780 | 45,799 | 61,410 | ||||||||||||||||||||||||
Subordinated liabilities |
– | – | 1,500 | 1,500 | 3,000 | 3,266 | 5,700 | 11,966 | ||||||||||||||||||||||||
Other (8) |
6,637 | 2,223 | 1,728 | 1,612 | 12,200 | 15,658 | 133 | 27,991 | ||||||||||||||||||||||||
Total |
$ | 27,047 | $ | 22,657 | $ | 52,458 | $ | 51,548 | $ | 153,710 | $ | 55,878 | $ | 134,370 | $ | 343,958 | ||||||||||||||||
Of which: |
||||||||||||||||||||||||||||||||
– Secured |
$ | 10,998 | $ | 7,811 | $ | 8,553 | $ | 6,338 | $ | 33,700 | $ | 14,023 | $ | 56,096 | $ | 103,819 | ||||||||||||||||
– Unsecured |
16,049 | 14,846 | 43,905 | 45,210 | 120,010 | 41,855 | 78,274 | 240,139 |
(1) | Excludes bankers’ acceptances and repos. |
(2) | Excludes deposits associated with services we provide to banks (e.g., custody, cash management). |
(3) | Includes bearer deposit notes (unsecured). |
(4) | Only includes consolidated liabilities, including our collateralized commercial paper program. |
(5) | Includes deposit notes and floating rate notes (unsecured). |
(6) | Includes notes where the payout is tied to movements in foreign exchange, commodities and equities. |
(7) | Includes covered bonds collateralized with residential mortgages and securities backed by credit card receivables. |
(8) | Includes tender option bonds (secured) of $4,835 million (January 31, 2024 – $4,987 million), other long-term structured deposits (unsecured) of $20,022 million (January 31, 2024 – $17,774 million), FHLB advances (secured) of $688 million (January 31, 2024 – $5,040 million) and wholesale guaranteed interest certificates of $203 million (January 31, 2024 – $190 million). |
As at May 29, 2024 |
||||||||||||||||
Short-term debt |
Legacy senior long-term debt |
Senior long- term debt |
Outlook |
|||||||||||||
Moody’s ‡ (4) |
P-1 |
Aa1 |
A1 |
stable |
||||||||||||
Standard & Poor’s ‡ (5) |
A-1+ |
AA- |
A |
stable |
||||||||||||
Fitch Ratings ‡ (6) |
F1+ |
AA |
AA- |
stable |
||||||||||||
DBRS ‡ (7) |
R-1 (high) |
AA (high) |
AA |
stable |
(1) | Credit ratings are not recommendations to purchase, sell or hold a financial obligation in as much as they do not comment on market price or suitability for a particular investor. Ratings are determined by the rating agencies based on criteria established from time to time by them and are subject to revision or withdrawal at any time by the rating organization. |
(2) | Includes senior long-term debt issued prior to September 23, 2018 and senior long-term debt issued on or after September 23, 2018 which is excluded from the Bail-in regime. |
(3) | Includes senior long-term debt issued on or after September 23, 2018 which is subject to conversion under the Bail-in regime. |
(4) | On November 6, 2023, Moody’s affirmed our ratings with stable outlook. |
(5) | On May 25, 2023, Standard & Poor’s affirmed our ratings with a stable outlook. |
(6) | On June 20, 2023, Fitch Ratings affirmed our ratings with a stable outlook. |
(7) | On May 10, 2024, DBRS affirmed our ratings with a stable outlook. |
As at | ||||||||||||||||||||||||||
April 30 2024 |
January 31 2024 |
|||||||||||||||||||||||||
(Millions of Canadian dollars) | One-notch downgrade |
Two-notch downgrade |
Three-notch downgrade |
One-notch downgrade |
Two-notch downgrade |
Three-notch downgrade |
||||||||||||||||||||
Contractual derivatives funding or margin requirements |
$ |
228 |
$ |
137 |
$ |
218 |
$ | 327 | $ | 90 | $ | 186 | ||||||||||||||
Other contractual funding or margin requirements (1) |
44 |
46 |
87 |
45 | 55 | 50 |
(1) | Includes Guaranteed Investment Certificates (GICs) issued by our municipal markets business out of New York. |
For the three months ended | ||||||||
April 30 2024 |
||||||||
(Millions of Canadian dollars, except percentage amounts) | Total unweighted value (average) |
Total weighted value (average) |
||||||
High-quality liquid assets |
||||||||
Total high-quality liquid assets (HQLA) |
$ |
382,663 |
||||||
Cash outflows |
||||||||
Retail deposits and deposits from small business customers, of which: |
$ |
375,052 |
$ |
36,853 |
||||
Stable deposits (3) |
125,024 |
3,751 |
||||||
Less stable deposits |
250,028 |
33,102 |
||||||
Unsecured wholesale funding, of which: |
422,454 |
207,964 |
||||||
Operational deposits (all counterparties) and deposits in networks of cooperative banks (4) |
153,638 |
36,134 |
||||||
Non-operational deposits |
237,238 |
140,252 |
||||||
Unsecured debt |
31,578 |
31,578 |
||||||
Secured wholesale funding |
43,768 |
|||||||
Additional requirements, of which: |
361,291 |
80,486 |
||||||
Outflows related to derivative exposures and other collateral requirements |
63,479 |
17,733 |
||||||
Outflows related to loss of funding on debt products |
11,706 |
11,706 |
||||||
Credit and liquidity facilities |
286,106 |
51,047 |
||||||
Other contractual funding obligations (5) |
29,721 |
29,721 |
||||||
Other contingent funding obligations (6) |
757,701 |
12,680 |
||||||
Total cash outflows |
$ |
411,472 |
||||||
Cash inflows |
||||||||
Secured lending (e.g., reverse repos) |
$ |
358,940 |
$ |
56,626 |
||||
Inflows from fully performing exposures |
18,300 |
10,761 |
||||||
Other cash inflows |
44,832 |
44,832 |
||||||
Total cash inflows |
$ |
112,219 |
||||||
Total adjusted value |
||||||||
Total HQLA |
$ |
382,663 |
||||||
Total net cash outflows |
299,253 |
|||||||
Liquidity coverage ratio |
128% |
|||||||
January 31 2024 |
||||||||
(Millions of Canadian dollars, except percentage amounts) | Total adjusted value |
|||||||
Total HQLA |
$ | 392,630 | ||||||
Total net cash outflows |
298,384 | |||||||
Liquidity coverage ratio |
132% |
(1) | The LCR is calculated in accordance with OSFI’s LAR guideline, which, in turn, reflects liquidity-related requirements issued by the BCBS. The LCR for the quarter ended April 30, 2024 is calculated as an average of 62 daily positions. |
(2) | With the exception of other contingent funding obligations, unweighted inflow and outflow amounts are items maturing or callable in 30 days or less. Other contingent funding obligations also include debt securities with remaining maturity greater than 30 days. |
(3) | As defined by the BCBS, stable deposits from retail and small business customers are deposits that are insured and are either held in transactional accounts or the bank has an established relationship with the client making the withdrawal unlikely. |
(4) | Operational deposits from customers other than retail and small and medium-sized enterprises, are deposits which clients need to keep with the bank in order to facilitate their access and ability to use payment and settlement systems primarily for clearing, custody and cash management activities. |
(5) | Other contractual funding obligations primarily include outflows from unsettled securities trades and outflows from obligations related to securities sold short. |
(6) | Other contingent funding obligations include outflows related to other off-balance sheet facilities that carry low LCR runoff factors (0% – 5%). |
As at April 30, 2024 |
||||||||||||||||||||
Unweighted value by residual maturity |
||||||||||||||||||||
(Millions of Canadian dollars, except percentage amounts) | No maturity |
< 6 months |
6 months to < 1 year |
≥ 1 year |
Weighted value |
|||||||||||||||
Available Stable Funding (ASF) Item |
||||||||||||||||||||
Capital: |
$ |
122,644 |
$ |
– |
$ |
– |
$ |
12,910 |
$ |
135,554 |
||||||||||
Regulatory Capital |
122,644 |
– |
– |
12,910 |
135,554 |
|||||||||||||||
Other Capital Instruments |
– |
– |
– |
– |
– |
|||||||||||||||
Retail deposits and deposits from small business customers: |
323,265 |
128,497 |
51,898 |
66,906 |
521,010 |
|||||||||||||||
Stable deposits (3) |
97,366 |
55,906 |
26,913 |
31,536 |
202,711 |
|||||||||||||||
Less stable deposits |
225,899 |
72,591 |
24,985 |
35,370 |
318,299 |
|||||||||||||||
Wholesale funding: |
317,433 |
431,839 |
64,348 |
154,611 |
372,138 |
|||||||||||||||
Operational deposits (4) |
181,621 |
– |
– |
– |
90,810 |
|||||||||||||||
Other wholesale funding |
135,812 |
431,839 |
64,348 |
154,611 |
281,328 |
|||||||||||||||
Liabilities with matching interdependent assets (5) |
89 |
2,946 |
2,431 |
22,540 |
– |
|||||||||||||||
Other liabilities: |
48,251 |
238,518 |
16,317 |
|||||||||||||||||
NSFR derivative liabilities |
35,119 |
|||||||||||||||||||
All other liabilities and equity not included in the above categories |
48,251 |
186,199 |
1,766 |
15,434 |
16,317 |
|||||||||||||||
Total ASF |
$ |
1,045,019 |
||||||||||||||||||
Required Stable Funding (RSF) Item |
||||||||||||||||||||
Total NSFR high-quality liquid assets (HQLA) |
$ |
49,954 |
||||||||||||||||||
Deposits held at other financial institutions for operational purposes |
– |
1,485 |
– |
– |
743 |
|||||||||||||||
Performing loans and securities: |
253,430 |
300,032 |
126,107 |
551,901 |
762,474 |
|||||||||||||||
Performing loans to financial institutions secured by Level 1 HQLA |
– |
116,034 |
10,929 |
6 |
11,772 |
|||||||||||||||
Performing loans to financial institutions secured by non-Level 1 HQLA and unsecured performing loans to financial institutions |
4,979 |
89,984 |
31,479 |
22,587 |
54,497 |
|||||||||||||||
Performing loans to non-financial corporate clients, loans to retail and small business customers, and loans to sovereigns, central banks and PSEs, of which: |
167,619 |
53,963 |
36,221 |
175,374 |
337,049 |
|||||||||||||||
With a risk weight of less than or equal to 35% under the Basel II standardized approach for credit risk |
– |
811 |
628 |
2,640 |
2,435 |
|||||||||||||||
Performing residential mortgages, of which: |
39,115 |
37,262 |
46,031 |
318,384 |
291,361 |
|||||||||||||||
With a risk weight of less than or equal to 35% under the Basel II standardized approach for credit risk |
39,115 |
37,239 |
45,997 |
317,201 |
290,327 |
|||||||||||||||
Securities that are not in default and do not qualify as HQLA, including exchange-traded equities |
41,717 |
2,789 |
1,447 |
35,550 |
67,795 |
|||||||||||||||
Assets with matching interdependent liabilities (5) |
89 |
2,946 |
2,431 |
22,540 |
– |
|||||||||||||||
Other assets: |
5,167 |
338,333 |
94,620 |
|||||||||||||||||
Physical traded commodities, including gold |
5,167 |
4,392 |
||||||||||||||||||
Assets posted as initial margin for derivative contracts and contributions to default funds of CCPs |
21,248 |
18,061 |
||||||||||||||||||
NSFR derivative assets |
33,793 |
– |
||||||||||||||||||
NSFR derivative liabilities before deduction of variation margin posted |
66,853 |
3,343 |
||||||||||||||||||
All other assets not included in the above categories |
– |
150,421 |
67 |
65,951 |
68,824 |
|||||||||||||||
Off-balance sheet items |
849,009 |
32,610 |
||||||||||||||||||
Total RSF |
$ |
940,401 |
||||||||||||||||||
Net Stable Funding Ratio (%) |
111% |
|||||||||||||||||||
As at January 31, 2024 | ||||||||||||||||||||
(Millions of Canadian dollars, except percentage amounts) | Weighted value |
|||||||||||||||||||
Total ASF |
$ | 974,825 | ||||||||||||||||||
Total RSF |
862,347 | |||||||||||||||||||
Net Stable Funding Ratio (%) |
113% |
(1) | The NSFR is calculated in accordance with OSFI’s LAR guideline, which, in turn, reflects liquidity-related requirements issued by the BCBS. |
(2) | Totals for the following rows encompass the residual maturity categories of less than 6 months, 6 months to less than 1 year, and greater than or equal to 1 year in accordance with the requirements of the common disclosure template prescribed by OSFI: Other liabilities, NSFR derivative liabilities, Other assets, Assets posted as initial margin for derivative contracts and contributions to default funds of central counterparties (CCPs), NSFR derivative assets, NSFR derivative liabilities before deduction of variation margin posted and Off-balance sheet items. |
(3) | As defined by the BCBS, stable deposits from retail and small business customers are deposits that are insured and are either held in transactional accounts or the bank has an established relationship with the client making the withdrawal unlikely. |
(4) | Operational deposits from customers other than retail and small- and medium-sized enterprises, are deposits which clients need to keep with the bank in order to facilitate their access and ability to use payment and settlement systems primarily for clearing, custody and cash management activities. |
(5) | Interdependent assets and liabilities represent NHA MBS liabilities, including liabilities arising from transactions involving the Canada Mortgage Bond program and their corresponding encumbered mortgages. |
As at April 30, 2024 |
||||||||||||||||||||||||||||||||||||||||
(Millions of Canadian dollars) | Less than 1 month |
1 to 3 months |
3 to 6 months |
6 to 9 months |
9 to 12 months |
1 year to 2 years |
2 years to 5 years |
5 years and greater |
With no specific maturity |
Total |
||||||||||||||||||||||||||||||
Assets |
||||||||||||||||||||||||||||||||||||||||
Cash and deposits with banks |
$ |
97,580 |
$ |
11 |
$ |
– |
$ |
– |
$ |
– |
$ |
– |
$ |
– |
$ |
– |
$ |
2,241 |
$ |
99,832 |
||||||||||||||||||||
Securities |
||||||||||||||||||||||||||||||||||||||||
Trading (1) |
87,638 |
225 |
300 |
191 |
29 |
57 |
686 |
10,782 |
73,658 |
173,566 |
||||||||||||||||||||||||||||||
Investment, net of applicable allowance |
5,158 |
8,386 |
4,412 |
5,188 |
7,599 |
45,901 |
76,182 |
85,011 |
1,150 |
238,987 |
||||||||||||||||||||||||||||||
Assets purchased under reverse repurchase agreements and securities borrowed (2) |
124,533 |
71,600 |
39,967 |
28,174 |
17,906 |
1 |
– |
– |
19,616 |
301,797 |
||||||||||||||||||||||||||||||
Loans, net of applicable allowance |
48,164 |
32,869 |
41,487 |
51,113 |
50,861 |
243,493 |
313,973 |
77,250 |
101,329 |
960,539 |
||||||||||||||||||||||||||||||
Other |
||||||||||||||||||||||||||||||||||||||||
Customers’ liability under acceptances |
6,560 |
2,543 |
– |
2 |
– |
– |
5 |
– |
(51 |
) |
9,059 |
|||||||||||||||||||||||||||||
Derivatives |
10,115 |
12,843 |
7,860 |
8,177 |
6,419 |
15,184 |
27,909 |
41,692 |
– |
130,199 |
||||||||||||||||||||||||||||||
Other financial assets |
38,392 |
3,200 |
1,820 |
709 |
966 |
164 |
671 |
1,987 |
3,881 |
51,790 |
||||||||||||||||||||||||||||||
Total financial assets |
418,140 |
131,677 |
95,846 |
93,554 |
83,780 |
304,800 |
419,426 |
216,722 |
201,824 |
1,965,769 |
||||||||||||||||||||||||||||||
Other non-financial assets |
8,062 |
2,333 |
1,791 |
159 |
131 |
2,745 |
2,612 |
9,598 |
37,850 |
65,281 |
||||||||||||||||||||||||||||||
Total assets |
$ |
426,202 |
$ |
134,010 |
$ |
97,637 |
$ |
93,713 |
$ |
83,911 |
$ |
307,545 |
$ |
422,038 |
$ |
226,320 |
$ |
239,674 |
$ |
2,031,050 |
||||||||||||||||||||
Liabilities and equity |
||||||||||||||||||||||||||||||||||||||||
Deposits (3) |
||||||||||||||||||||||||||||||||||||||||
Unsecured borrowing |
$ |
91,143 |
$ |
80,798 |
$ |
83,610 |
$ |
80,978 |
$ |
64,877 |
$ |
59,440 |
$ |
79,604 |
$ |
33,161 |
$ |
638,515 |
$ |
1,212,126 |
||||||||||||||||||||
Secured borrowing |
4,802 |
6,893 |
9,644 |
2,105 |
2,245 |
6,683 |
16,086 |
9,966 |
– |
58,424 |
||||||||||||||||||||||||||||||
Covered bonds |
– |
– |
1,722 |
2,154 |
1,427 |
11,876 |
34,979 |
4,895 |
– |
57,053 |
||||||||||||||||||||||||||||||
Other |
||||||||||||||||||||||||||||||||||||||||
Acceptances |
6,560 |
2,543 |
– |
2 |
– |
– |
5 |
– |
– |
9,110 |
||||||||||||||||||||||||||||||
Obligations related to securities sold short |
31,487 |
– |
– |
– |
– |
– |
– |
– |
– |
31,487 |
||||||||||||||||||||||||||||||
Obligations related to assets sold under repurchase agreements and securities loaned (2) |
192,996 |
43,991 |
12,306 |
40 |
8,596 |
5 |
– |
– |
21,787 |
279,721 |
||||||||||||||||||||||||||||||
Derivatives |
9,432 |
15,297 |
8,632 |
10,408 |
7,561 |
15,926 |
28,281 |
41,031 |
– |
136,568 |
||||||||||||||||||||||||||||||
Other financial liabilities |
39,024 |
2,925 |
3,320 |
1,852 |
2,073 |
1,067 |
2,378 |
16,393 |
1,507 |
70,539 |
||||||||||||||||||||||||||||||
Subordinated debentures |
– |
– |
– |
– |
– |
1,947 |
– |
11,517 |
– |
13,464 |
||||||||||||||||||||||||||||||
Total financial liabilities |
375,444 |
152,447 |
119,234 |
97,539 |
86,779 |
96,944 |
161,333 |
116,963 |
661,809 |
1,868,492 |
||||||||||||||||||||||||||||||
Other non-financial liabilities |
2,347 |
982 |
98 |
4,597 |
199 |
1,264 |
1,260 |
19,574 |
10,633 |
40,954 |
||||||||||||||||||||||||||||||
Equity |
– |
– |
– |
– |
– |
– |
– |
– |
121,604 |
121,604 |
||||||||||||||||||||||||||||||
Total liabilities and equity |
$ |
377,791 |
$ |
153,429 |
$ |
119,332 |
$ |
102,136 |
$ |
86,978 |
$ |
98,208 |
$ |
162,593 |
$ |
136,537 |
$ |
794,046 |
$ |
2,031,050 |
||||||||||||||||||||
Off-balance sheet items |
||||||||||||||||||||||||||||||||||||||||
Financial guarantees |
$ |
1,075 |
$ |
2,340 |
$ |
3,858 |
$ |
4,073 |
$ |
4,657 |
$ |
987 |
$ |
7,699 |
$ |
843 |
$ |
19 |
$ |
25,551 |
||||||||||||||||||||
Commitments to extend credit |
4,261 |
12,228 |
14,509 |
17,925 |
22,640 |
62,144 |
208,876 |
25,822 |
4,685 |
373,090 |
||||||||||||||||||||||||||||||
Other credit-related commitments |
29,105 |
1,992 |
2,383 |
2,353 |
2,437 |
572 |
1,026 |
109 |
83,484 |
123,461 |
||||||||||||||||||||||||||||||
Other commitments |
6 |
11 |
16 |
17 |
18 |
62 |
152 |
193 |
965 |
1,440 |
||||||||||||||||||||||||||||||
Total off-balance sheet items |
$ |
34,447 |
$ |
16,571 |
$ |
20,766 |
$ |
24,368 |
$ |
29,752 |
$ |
63,765 |
$ |
217,753 |
$ |
26,967 |
$ |
89,153 |
$ |
523,542 |
(1) | With the exception of debt securities within the Insurance segment, trading debt securities classified as FVTPL have been included in the less than 1 month category as there is no expectation to hold these assets to their contractual maturity. |
(2) | Open reverse repo and repo contracts, which have no set maturity date and are typically short-term, have been included in the with no specific maturity category. |
(3) | A major portion of relationship-based deposits are repayable on demand or at short notice on a contractual basis while, in practice, these customer balances form a core base for our operations and liquidity needs, as explained in the preceding Deposit and funding profile section. |
As at January 31, 2024 | ||||||||||||||||||||||||||||||||||||||||
(Millions of Canadian dollars) | Less than 1 month |
1 to 3 months |
3 to 6 months |
6 to 9 months |
9 to 12 months |
1 year to 2 years |
2 years to 5 years |
5 years and greater |
With no specific maturity |
Total | ||||||||||||||||||||||||||||||
Assets |
||||||||||||||||||||||||||||||||||||||||
Cash and deposits with banks |
$ | 132,774 | $ | 5 | $ | – | $ | – | $ | – | $ | – | $ | – | $ | – | $ | 2,648 | $ | 135,427 | ||||||||||||||||||||
Securities |
||||||||||||||||||||||||||||||||||||||||
Trading (1) |
116,462 | 317 | 224 | 45 | 42 | 65 | 644 | 11,155 | 64,643 | 193,597 | ||||||||||||||||||||||||||||||
Investment, net of applicable allowance |
3,568 | 5,477 | 5,230 | 2,497 | 5,256 | 43,151 | 67,090 | 78,731 | 1,216 | 212,216 | ||||||||||||||||||||||||||||||
Assets purchased under reverse repurchase agreements and securities borrowed (2) |
153,149 | 81,540 | 55,243 | 16,142 | 20,274 | 294 | – | – | 21,229 | 347,871 | ||||||||||||||||||||||||||||||
Loans, net of applicable allowance |
33,721 | 25,246 | 35,402 | 40,527 | 48,927 | 206,339 | 302,877 | 75,492 | 89,785 | 858,316 | ||||||||||||||||||||||||||||||
Other |
||||||||||||||||||||||||||||||||||||||||
Customers’ liability under acceptances |
12,613 | 4,216 | – | – | 2 | – | 5 | – | (43 | ) | 16,793 | |||||||||||||||||||||||||||||
Derivatives |
7,533 | 8,518 | 5,694 | 4,695 | 6,271 | 13,128 | 26,658 | 32,541 | – | 105,038 | ||||||||||||||||||||||||||||||
Other financial assets |
35,206 | 5,883 | 2,703 | 324 | 622 | 229 | 268 | 2,387 | 3,669 | 51,291 | ||||||||||||||||||||||||||||||
Total financial assets |
495,026 | 131,202 | 104,496 | 64,230 | 81,394 | 263,206 | 397,542 | 200,306 | 183,147 | 1,920,549 | ||||||||||||||||||||||||||||||
Other non-financial assets |
6,335 | 2,510 | 2,035 | 155 | 123 | 2,087 | 2,410 | 9,506 | 28,695 | 53,856 | ||||||||||||||||||||||||||||||
Total assets |
$ | 501,361 | $ | 133,712 | $ | 106,531 | $ | 64,385 | $ | 81,517 | $ | 265,293 | $ | 399,952 | $ | 209,812 | $ | 211,842 | $ | 1,974,405 | ||||||||||||||||||||
Liabilities and equity |
||||||||||||||||||||||||||||||||||||||||
Deposits (3) |
||||||||||||||||||||||||||||||||||||||||
Unsecured borrowing |
$ | 97,982 | $ | 59,352 | $ | 91,861 | $ | 64,454 | $ | 73,303 | $ | 58,648 | $ | 77,653 | $ | 35,045 | $ | 576,489 | $ | 1,134,787 | ||||||||||||||||||||
Secured borrowing |
4,208 | 7,152 | 8,936 | 2,455 | 1,321 | 6,997 | 13,421 | 8,881 | – | 53,371 | ||||||||||||||||||||||||||||||
Covered bonds |
– | – | – | 1,705 | 2,130 | 10,465 | 33,778 | 4,932 | – | 53,010 | ||||||||||||||||||||||||||||||
Other |
||||||||||||||||||||||||||||||||||||||||
Acceptances |
12,613 | 4,216 | – | – | 2 | – | 5 | – | – | 16,836 | ||||||||||||||||||||||||||||||
Obligations related to securities sold short |
35,012 | – | – | – | – | – | – | – | – | 35,012 | ||||||||||||||||||||||||||||||
Obligations related to assets sold under repurchase agreements and securities loaned (2) |
223,426 | 66,813 | 21,780 | 5 | 46 | 290 | – | – | 22,130 | 334,490 | ||||||||||||||||||||||||||||||
Derivatives |
6,992 | 10,924 | 6,126 | 5,134 | 8,001 | 13,373 | 25,702 | 30,722 | – | 106,974 | ||||||||||||||||||||||||||||||
Other financial liabilities |
39,291 | 8,200 | 3,021 | 1,551 | 1,695 | 983 | 2,289 | 15,209 | 1,460 | 73,699 | ||||||||||||||||||||||||||||||
Subordinated debentures |
– | – | – | – | – | 1,920 | – | 9,605 | – | 11,525 | ||||||||||||||||||||||||||||||
Total financial liabilities |
419,524 | 156,657 | 131,724 | 75,304 | 86,498 | 92,676 | 152,848 | 104,394 | 600,079 | 1,819,704 | ||||||||||||||||||||||||||||||
Other non-financial liabilities |
1,096 | 1,013 | 175 | 134 | 3,679 | 940 | 1,574 | 19,502 | 10,100 | 38,213 | ||||||||||||||||||||||||||||||
Equity |
– | – | – | – | – | – | – | – | 116,488 | 116,488 | ||||||||||||||||||||||||||||||
Total liabilities and equity |
$ | 420,620 | $ | 157,670 | $ | 131,899 | $ | 75,438 | $ | 90,177 | $ | 93,616 | $ | 154,422 | $ | 123,896 | $ | 726,667 | $ | 1,974,405 | ||||||||||||||||||||
Off-balance sheet items |
||||||||||||||||||||||||||||||||||||||||
Financial guarantees |
$ | 1,228 | $ | 2,477 | $ | 3,432 | $ | 4,472 | $ | 3,409 | $ | 880 | $ | 7,594 | $ | 639 | $ | 25 | $ | 24,156 | ||||||||||||||||||||
Commitments to extend credit |
3,984 | 10,766 | 12,593 | 13,918 | 20,943 | 57,965 | 198,205 | 25,485 | 4,204 | 348,063 | ||||||||||||||||||||||||||||||
Other credit-related commitments |
15,281 | 1,143 | 1,814 | 1,666 | 1,528 | 149 | 386 | 66 | 80,653 | 102,686 | ||||||||||||||||||||||||||||||
Other commitments |
5 | 10 | 16 | 15 | 17 | 61 | 151 | 196 | 909 | 1,380 | ||||||||||||||||||||||||||||||
Total off-balance sheet items |
$ | 20,498 | $ | 14,396 | $ | 17,855 | $ | 20,071 | $ | 25,897 | $ | 59,055 | $ | 206,336 | $ | 26,386 | $ | 85,791 | $ | 476,285 |
(1) | With the exception of debt securities within the Insurance segment, trading debt securities classified as FVTPL have been included in the less than 1 month category as there is no expectation to hold these assets to their contractual maturity. |
(2) | Open reverse repo and repo contracts, which have no set maturity date and are typically short-term, have been included in the with no specific maturity category. |
(3) | A major portion of relationship-based deposits are repayable on demand or at short notice on a contractual basis while, in practice, these customer balances form a core base for our operations and liquidity needs, as explained in the preceding Deposit and funding profile section. |
Capital management |
Basel III capital, leverage and TLAC ratios |
OSFI regulatory target requirements for large banks under Basel III |
Domestic Stability Buffer (3) |
Minimum including Capital Buffers, D-SIB/G-SIB surcharge and Domestic Stability Buffer as at April 30, 2024 (4) |
RBC capital, leverage and TLAC ratios as at April 30, 2024 |
||||||||||||||||||||||||||||
Minimum |
Capital Buffers |
Minimum including Capital Buffers |
D-SIB/G-SIB surcharge (1) |
Minimum including Capital Buffers and D-SIB/G-SIB surcharge (1), (2) |
||||||||||||||||||||||||||||
Common Equity Tier 1 | 4.5% | 2.6% | 7.1% | 1.0% | 8.1% | 3.5% | 11.6% | 12.8% | ||||||||||||||||||||||||
Tier 1 capital | 6.0% | 2.6% | 8.6% | 1.0% | 9.6% | 3.5% | 13.1% | 14.1% | ||||||||||||||||||||||||
Total capital | 8.0% | 2.6% | 10.6% | 1.0% | 11.6% | 3.5% | 15.1% | 16.1% | ||||||||||||||||||||||||
Leverage ratio | 3.5% | n.a. | 3.5% | n.a. | 3.5% | n.a. | 3.5% | 4.2% | ||||||||||||||||||||||||
TLAC ratio | 21.6% | n.a. | 21.6% | n.a. | 21.6% | 3.5% | 25.1% | 27.5% | ||||||||||||||||||||||||
TLAC leverage ratio | 7.25% | n.a. | 7.25% | n.a. | 7.25% | n.a. | 7.25% | 8.1% |
(1) | A capital surcharge, equal to the higher of our D-SIB surcharge and the BCBS’s G-SIB surcharge, is applicable to risk-weighted capital. |
(2) | The capital buffers include the capital conservation buffer of 2.5% and the countercyclical capital buffer (CCyB) as prescribed by OSFI. The CCyB, calculated in accordance with OSFI’s CAR guidelines, was 0.05% as at April 30, 2024 (January 31, 2024 – 0.06%; October 31, 2023 – 0.06%). |
(3) | The DSB can range from 0% to 4% of total RWA and is currently set at 3.5%. |
(4) | Minimum target requirements reflect CCyB requirements as at April 30, 2024 which are subject to change based on exposures held at the reporting date. |
n.a. | not applicable |
As at | ||||||||||||
(Millions of Canadian dollars, except percentage amounts and as otherwise noted) |
April 30 2024 |
January 31 2024 |
October 31 2023 |
|||||||||
Capital (1), (2) |
||||||||||||
CET1 capital |
$ |
83,497 |
$ | 88,106 | $ | 86,611 | ||||||
Tier 1 capital |
92,444 |
96,140 | 93,904 | |||||||||
Total capital |
105,353 |
106,865 | 104,952 | |||||||||
RWA used in calculation of capital ratios (1), (2) |
||||||||||||
Credit risk |
$ |
531,381 |
$ | 474,677 | $ | 475,842 | ||||||
Market risk |
35,156 |
30,980 | 40,498 | |||||||||
Operational risk |
87,165 |
84,600 | 79,883 | |||||||||
Total RWA |
$ |
653,702 |
$ | 590,257 | $ | 596,223 | ||||||
Capital ratios and Leverage ratio (1), (2) |
||||||||||||
CET1 ratio |
12.8% |
14.9% | 14.5% | |||||||||
Tier 1 capital ratio |
14.1% |
16.3% | 15.7% | |||||||||
Total capital ratio |
16.1% |
18.1% | 17.6% | |||||||||
Leverage ratio |
4.2% |
4.4% | 4.3% | |||||||||
Leverage ratio exposure |
$ |
2,219,019 |
$ | 2,173,419 | $ | 2,179,590 | ||||||
TLAC available and ratios (1), (3) |
||||||||||||
TLAC available |
$ |
179,902 |
$ | 185,556 | $ | 184,916 | ||||||
TLAC ratio |
27.5% |
31.4% | 31.0% | |||||||||
TLAC leverage ratio |
8.1% |
8.5% | 8.5% |
(1) | As prior period restatements are not required by OSFI, there was no impact from the adoption of IFRS 17 on regulatory capital, RWA, capital ratios, leverage ratio, TLAC available and TLAC ratios for periods prior to November 1, 2023. |
(2) | Capital, RWA, and capital ratios are calculated using OSFI’s CAR guideline and the Leverage ratio is calculated using OSFI’s LR guideline. Both the CAR guideline and LR guideline are based on the Basel III framework. The period ended October 31, 2023 reflects our adoption of the revised CAR and LR guidelines that came into effect in Q2 2023, as further updated on October 20, 2023 as part of OSFI’s implementation of the Basel III reforms. The periods ended January 31, 2024 and April 30, 2024 also reflect our adoption of the revised market risk and CVA frameworks that came into effect on November 1, 2023. |
(3) | TLAC available and TLAC ratios are calculated using OSFI’s TLAC guideline. The TLAC standard is applied at the resolution entity level which for us is deemed to be Royal Bank of Canada and its subsidiaries. A resolution entity and its subsidiaries are collectively called a resolution group. The TLAC ratio and TLAC leverage ratio are calculated using the TLAC available as a percentage of total RWA and leverage exposure, respectively. |
(1) | Represents rounded figures. |
(2) | Includes capital deductions for goodwill and intangible assets of (139) bps, initial PCL on the purchased performing loans of (2) bps and RWA resulting from the HSBC Canada transaction of (99) bps. |
(3) | Represents net internal capital generation of $2.2 billion or 38 bps consisting of Net income available to shareholders excluding the impact of specified items, less common and preferred share dividends and distributions on other equity instruments. |
(4) | Excludes specified items for transaction and integration costs relating to the HSBC Canada transaction and the management of closing capital volatility related to the HSBC Canada transaction. |
(5) | Excludes the impact of the HSBC Canada transaction. |
(6) | For further details about the Dividend reinvestment plan (DRIP), refer to Note 11 of our Condensed Financial Statements. |
(7) | Includes the impact of specified items noted above. |
For the three months ended April 30, 2024 |
For the six months ended April 30, 2024 |
|||||||||||||||||||||||
(Millions of Canadian dollars, except number of shares) | Issuance or redemption date |
Number of shares |
Amount |
Number of shares |
Amount |
|||||||||||||||||||
Tier 1 capital |
||||||||||||||||||||||||
Common shares activity |
||||||||||||||||||||||||
Issued in connection with share-based compensation plans (1) |
228 |
$ |
22 |
628 |
$ |
60 |
||||||||||||||||||
Issued under the DRIP (2) |
5,715 |
740 |
11,850 |
1,460 |
||||||||||||||||||||
Redemption of preferred shares, Series C-2 (3) |
November 7, 2023 |
– |
– |
(15 |
) |
(23 |
) | |||||||||||||||||
Issuance of preferred shares, Series BU (3), (4) |
January 25, 2024 |
– |
– |
750 |
750 |
|||||||||||||||||||
Issuance of LRCN Series 4 (3), (4), (5) |
April 24, 2024 |
1,000 |
1,370 |
1,000 |
1,370 |
|||||||||||||||||||
Tier 2 capital |
||||||||||||||||||||||||
Issuance of April 3, 2034 subordinated debentures (3), (4) |
April 2, 2024 |
$ |
2,000 |
$ |
2,000 |
(1) | Amounts include cash received for stock options exercised during the period and fair value adjustments to stock options. |
(2) | During the three and six months ended April 30, 2024, the requirements of the DRIP were satisfied through shares issued from treasury. On February 28, 2024, we announced our intention to satisfy requirements of the DRIP through open market share purchases with no discount from the Average Market Price (as defined in the DRIP) for our May 24, 2024 dividend and for future dividends declared until further notice. |
(3) | For further details, refer to Note 11 of our Condensed Financial Statements. |
(4) | Non-Viability Contingent Capital (NVCC) instruments. |
(5) | For the LRCNs, the number of shares represents the number of notes issued. |
As at April 30, 2024 |
||||||||||||
(Millions of Canadian dollars, except number of shares and as otherwise noted) |
Number of shares |
Amount |
Dividends declared per share |
|||||||||
Common shares issued |
1,414,850 |
$ |
20,918 |
$ |
1.38 |
|||||||
Treasury shares – common shares (2) |
(546 |
) |
(71 |
) |
||||||||
Common shares outstanding |
1,414,304 |
$ |
20,847 |
|||||||||
Stock options and awards |
||||||||||||
Outstanding |
8,731 |
|||||||||||
Exercisable |
4,309 |
|||||||||||
First preferred shares issued |
||||||||||||
Non-cumulative Series AZ (3), (4) |
20,000 |
$ |
500 |
$ |
0.23 |
|||||||
Non-cumulative Series BB (3), (4) |
20,000 |
500 |
0.23 |
|||||||||
Non-cumulative Series BD (3), (4) |
24,000 |
600 |
0.20 |
|||||||||
Non-cumulative Series BF (3), (4) |
12,000 |
300 |
0.19 |
|||||||||
Non-cumulative Series BH (4) |
6,000 |
150 |
0.31 |
|||||||||
Non-cumulative Series BI (4) |
6,000 |
150 |
0.31 |
|||||||||
Non-cumulative Series BO (3), (4) |
14,000 |
350 |
0.37 |
|||||||||
Non-cumulative Series BT (3), (4), (5) |
750 |
750 |
4.20% |
|||||||||
Non-cumulative Series BU (3), (4), (5) |
750 |
750 |
7.41% |
|||||||||
Other equity instruments issued |
||||||||||||
Limited recourse capital notes Series 1 (3), (4), (6), (7) |
1,750 |
1,750 |
4.50% |
|||||||||
Limited recourse capital notes Series 2 (3), (4), (6), (7) |
1,250 |
1,250 |
4.00% |
|||||||||
Limited recourse capital notes Series 3 (3), (4), (6), (7) |
1,000 |
1,000 |
3.65% |
|||||||||
Limited recourse capital notes Series 4 (3), (4), (6), (7) |
1,000 |
1,370 |
7.50% |
|||||||||
Preferred shares and other equity instruments issued |
108,500 |
9,420 |
||||||||||
Treasury instruments – preferred shares and other equity instruments (2) |
15 |
19 |
||||||||||
Preferred shares and other equity instruments outstanding |
108,515 |
$ |
9,439 |
|||||||||
Dividends on common shares |
$ |
1,953 |
||||||||||
Dividends on preferred shares and distributions on other equity instruments (8) |
67 |
(1) | For further details about our capital management activity, refer to Note 11 of our Condensed Financial Statements. |
(2) | Positive amounts represent a short position and negative amounts represent a long position. |
(3) | Dividend rate will reset every five years. |
(4) | NVCC instruments. |
(5) | The dividends declared per share represent the per annum dividend rate applicable to the shares issued as at the reporting date. |
(6) | For LRCN Series, the number of shares represent the number of notes issued and the dividends declared per share represent the annual interest rate percentage applicable to the notes issued as at the reporting date. |
(7) | In connection with the issuance of LRCN Series 1, on July 28, 2020, we issued $1,750 million of First Preferred Shares Series BQ (Series BQ); in connection with the issuance of LRCN Series 2, on November 2, 2020, we issued $1,250 million of First Preferred Shares Series BR (Series BR); in connection with the issuance of LRCN Series 3, on June 8, 2021, we issued $1,000 million of First Preferred Shares Series BS (Series BS); and in connection with the issuance of LRCN Series 4 on April 24, 2024, we issued US$1,000 million of First Preferred Shares Series BV (Series BV). The Series BQ, BR and BS preferred shares were issued at a price of $1,000 per share and the Series BV preferred shares were issued at a price of US$1,000 per share. The Series BQ, BR, BS and BV preferred shares were issued to a consolidated trust to be held as trust assets in connection with the LRCN structure. For further details, refer to Note 20 of our 2023 Annual Consolidated Financial Statements. |
(8) | Excludes distributions to non-controlling interests. |
Accounting and control matters |
Summary of accounting policies and estimates |
Changes in accounting policies and disclosures |
Controls and procedures |
Related party transactions |
Glossary |
• | Adjusted effective income tax rate |
• | Adjusted income before income taxes |
• | Adjusted income taxes |
• | Adjusted net income |
• | Adjusted net income available to common shareholders |
• | Adjusted non-interest expensenon-interest expense excluding the impact of specified items and amortization of acquisition-related intangibles. |
• | Adjusted total revenue |
Enhanced Disclosure Task Force recommendations index |
Location of disclosure | ||||||||||
Type of Risk |
Recommendation |
Disclosure |
RTS page |
Annual Report page |
SFI page | |||||
General |
1 | Table of contents for EDTF risk disclosure |
50 | 132 | 1 | |||||
2 | Define risk terminology and measures |
65-70, 130-131 |
– | |||||||
3 | Top and emerging risks |
63-65 |
– | |||||||
4 | New regulatory ratios |
40-43 | 109-114 |
– | ||||||
Risk governance, risk management and business model |
5 | Risk management organization |
65-70 |
– | ||||||
6 | Risk culture |
65-70 |
– | |||||||
7 | Risk in the context of our business activities |
117 | – | |||||||
8 | Stress testing |
68-69, 81 |
– | |||||||
Capital adequacy and risk-weighted assets (RWA) |
9 | Minimum Basel III capital ratios and Domestic systemically important bank surcharge |
41 | 109-114 |
– | |||||
10 | Composition of capital and reconciliation of the accounting balance sheet to the regulatory balance sheet |
– | * | |||||||
11 | Flow statement of the movements in regulatory capital |
– | 19 | |||||||
12 | Capital strategic planning |
109-114 |
– | |||||||
13 | RWA by business segments |
– | 20 | |||||||
14 | Analysis of capital requirement, and related measurement model information |
71-74 |
* | |||||||
15 | RWA credit risk and related risk measurements |
– | * | |||||||
16 | Movement of RWA by risk type |
– | 20 | |||||||
17 | Basel back-testing |
68, 71-73 |
31 | |||||||
Liquidity |
18 | Quantitative and qualitative analysis of our liquidity reserve |
32 | 88-89, 94-95 |
– | |||||
Funding |
19 | Encumbered and unencumbered assets by balance sheet category, and contractual obligations for rating downgrades |
33, 35 | 90, 93 | – | |||||
20 | Maturity analysis of consolidated total assets, liabilities and off-balance sheet commitments analyzed by remaining contractual maturity at the balance sheet date |
39-40 | 97-98 |
– | ||||||
21 | Sources of funding and funding strategy |
33-35 | 90-92 |
– | ||||||
Market risk |
22 | Relationship between the market risk measures for trading and non-trading portfolios and the balance sheet |
30-31 | 85-86 |
– | |||||
23 | Decomposition of market risk factors |
28-29 | 81-86 |
– | ||||||
24 | Market risk validation and back-testing |
81 | – | |||||||
25 | Primary risk management techniques beyond reported risk measures and parameters |
81-84 |
– | |||||||
Credit risk |
26 | Bank’s credit risk profile |
24-27 | 71-81, 178-185 |
21-31,* | |||||
Quantitative summary of aggregate credit risk exposures that reconciles to the balance sheet |
69-74 | 124-129 |
* | |||||||
27 | Policies for identifying impaired loans |
73-75, 119, 149-151 |
– | |||||||
28 | Reconciliation of the opening and closing balances of impaired loans and impairment allowances during the year |
– | 23, 28 | |||||||
29 | Quantification of gross notional exposure for over-the-counter |
76 | 32 | |||||||
30 | Credit risk mitigation, including collateral held for all sources of credit risk |
74-75 |
* | |||||||
Other |
31 | Other risk types |
100-109 |
– | ||||||
32 | Publicly known risk events |
104-105, 223-224 |
– |
* | These disclosure requirements are satisfied or partially satisfied by disclosures provided in our Pillar 3 Report for the quarter ended April 30, 2024 and for the year ended October 31, 2023. |
Interim Condensed Consolidated Financial Statements |
Interim Condensed Consolidated Balance Sheets |
As at | ||||||||
(Millions of Canadian dollars) |
April 30 2024 |
October 31 2023 (Restated – Note 2) |
||||||
Assets |
||||||||
Cash and due from banks |
$ |
$ | ||||||
Interest-bearing deposits with banks |
|
| ||||||
Securities |
||||||||
Trading |
||||||||
Investment, net of applicable allowance (Note 4) |
||||||||
Assets purchased under reverse repurchase agreements and securities borrowed |
|
| ||||||
Loans (Note 5) |
||||||||
Retail |
||||||||
Wholesale |
||||||||
Allowance for loan losses (Note 5) |
( |
) |
( |
) | ||||
Other |
||||||||
Customers’ liability under acceptances |
||||||||
Derivatives |
||||||||
Premises and equipment |
||||||||
Goodwill |
||||||||
Other intangibles |
||||||||
Other assets |
||||||||
Total assets |
$ |
$ | |
|||||
Liabilities and equity |
||||||||
Deposits (Note 7) |
||||||||
Personal |
$ |
$ | ||||||
Business and government |
||||||||
Bank |
||||||||
Other |
||||||||
Acceptances |
||||||||
Obligations related to securities sold short |
||||||||
Obligations related to assets sold under repurchase agreements and securities loaned |
||||||||
Derivatives |
||||||||
Insurance contract liabilities (Note 8) |
||||||||
Other liabilities |
||||||||
Subordinated debentures (Note 11) |
|
| ||||||
Total liabilities |
||||||||
Equity attributable to shareholders |
||||||||
Preferred shares and other equity instruments |
||||||||
Common shares (Note 11) |
||||||||
Retained earnings |
||||||||
Other components of equity |
||||||||
Non-controlling interests |
||||||||
Total equity |
||||||||
Total liabilities and equity |
$ |
$ |
Interim Condensed Consolidated Statements of Income |
(Millions of Canadian dollars, except per share amounts) | For the three months ended | For the six months ended | ||||||||||||||||||
April 30 2024 |
April 30 2023 (Restated – Note 2) |
April 30 2024 |
April 30 2023 (Restated – Note 2) |
|||||||||||||||||
Interest and dividend income (Note 3) |
||||||||||||||||||||
Loans |
$ |
$ | $ |
$ | ||||||||||||||||
Securities |
||||||||||||||||||||
Assets purchased under reverse repurchase agreements and securities borrowed |
||||||||||||||||||||
Deposits and other |
||||||||||||||||||||
Interest expense (Note 3) |
||||||||||||||||||||
Deposits and other |
||||||||||||||||||||
Other liabilities |
||||||||||||||||||||
Subordinated debentures |
||||||||||||||||||||
Net interest income |
||||||||||||||||||||
Non-interest income |
||||||||||||||||||||
Insurance service result (Note 8) |
||||||||||||||||||||
Insurance investment result (Note 8) |
( |
) | ||||||||||||||||||
Trading revenue |
||||||||||||||||||||
Investment management and custodial fees |
||||||||||||||||||||
Mutual fund revenue |
||||||||||||||||||||
Securities brokerage commissions |
||||||||||||||||||||
Service charges |
||||||||||||||||||||
Underwriting and other advisory fees |
||||||||||||||||||||
Foreign exchange revenue, other than trading |
||||||||||||||||||||
Card service revenue |
||||||||||||||||||||
Credit fees |
||||||||||||||||||||
Net gains on investment securities |
||||||||||||||||||||
Share of profit in joint ventures and associates |
||||||||||||||||||||
Other |
||||||||||||||||||||
Total revenue |
|
|
||||||||||||||||||
Provision for credit losses (Notes 4 and 5) |
||||||||||||||||||||
Non-interest expense |
||||||||||||||||||||
Human resources (Note 9) |
||||||||||||||||||||
Equipment |
||||||||||||||||||||
Occupancy |
||||||||||||||||||||
Communications |
||||||||||||||||||||
Professional fees |
||||||||||||||||||||
Amortization of other intangibles |
||||||||||||||||||||
Other |
||||||||||||||||||||
Income before income taxes |
||||||||||||||||||||
Income taxes |
||||||||||||||||||||
Net income |
$ |
$ | $ |
$ | ||||||||||||||||
Net income attributable to: |
||||||||||||||||||||
Shareholders |
$ |
$ | $ |
$ | ||||||||||||||||
Non-controlling interests |
||||||||||||||||||||
$ |
$ | $ |
$ | |||||||||||||||||
Basic earnings per share (in dollars) (Note 12) |
$ |
$ | $ |
$ | ||||||||||||||||
Diluted earnings per share (in dollars) (Note 12) |
||||||||||||||||||||
Dividends per common share (in dollars) |
Interim Condensed Consolidated Statements of Comprehensive Income |
(Millions of Canadian dollars) | For the three months ended | For the six months ended | ||||||||||||||||
April 30 2024 |
April 30 2023 (Restated – Note 2) |
April 30 2024 |
April 30 2023 (Restated – Note 2) |
|||||||||||||||
Net income |
$ |
$ | $ |
$ | ||||||||||||||
Other comprehensive income (loss), net of taxes |
||||||||||||||||||
Items that will be reclassified subsequently to income: |
||||||||||||||||||
Net change in unrealized gains (losses) on debt securities and loans at fair value through other comprehensive income |
||||||||||||||||||
Net unrealized gains (losses) on debt securities and loans at fair value through other comprehensive income |
( |
) | ||||||||||||||||
Reclassification of net losses (gains) on debt securities and loans at fair value through other comprehensive income to income |
( |
) |
( |
) | ( |
) |
( |
) | ||||||||||
( |
) | |||||||||||||||||
Foreign currency translation adjustments |
||||||||||||||||||
Unrealized foreign currency translation gains (losses) |
( |
) |
||||||||||||||||
Net foreign currency translation gains (losses) from hedging activities |
( |
) |
( |
) | ( |
) | ||||||||||||
Reclassification of losses (gains) on net investment hedging activities to income |
– |
– | – | |||||||||||||||
( |
) |
|||||||||||||||||
Net change in cash flow hedges |
||||||||||||||||||
Net gains (losses) on derivatives designated as cash flow hedges |
( |
) | ( |
) |
( |
) | ||||||||||||
Reclassification of losses (gains) on derivatives designated as cash flow hedges to income |
( |
) |
( |
) |
||||||||||||||
( |
) | ( |
) |
( |
) | |||||||||||||
Items that will not be reclassified subsequently to income: |
||||||||||||||||||
Remeasurement gains (losses) on employee benefit plans (Note 9) |
( |
) | ( |
) | ||||||||||||||
Net gains (losses) from fair value changes due to credit risk on financial liabilities designated at fair value through profit or loss |
( |
) |
( |
) |
( |
) | ||||||||||||
Net gains (losses) on equity securities designated at fair value through other comprehensive income |
||||||||||||||||||
( |
) |
( |
) |
( |
) | |||||||||||||
Total other comprehensive income (loss), net of taxes |
( |
) |
( |
) | ||||||||||||||
Total comprehensive income (loss) |
$ |
$ | $ |
$ | ||||||||||||||
Total comprehensive income attributable to: |
||||||||||||||||||
Shareholders |
$ |
$ | $ |
$ | ||||||||||||||
Non-controlling interests |
||||||||||||||||||
$ |
$ | |
$ |
$ | |
For the three months ended | For the six months ended | |||||||||||||||||
(Millions of Canadian dollars) |
April 30 2024 |
April 30 2023 |
April 30 2024 |
April 30 2023 |
||||||||||||||
Income taxes on other comprehensive income |
||||||||||||||||||
Net unrealized gains (losses) on debt securities and loans at fair value through other comprehensive income |
$ |
( |
) |
$ | |
$ |
$ | |
||||||||||
Provision for credit losses recognized in income |
– |
– |
||||||||||||||||
Reclassification of net losses (gains) on debt securities and loans at fair value through other comprehensive income to income |
( |
) |
( |
) | ( |
) |
( |
) | ||||||||||
Unrealized foreign currency translation gains (losses) |
( |
) |
||||||||||||||||
Net foreign currency translation gains (losses) from hedging activities |
( |
) |
( |
) | ( |
) | ||||||||||||
Net gains (losses) on derivatives designated as cash flow hedges |
( |
) | ( |
) |
( |
) | ||||||||||||
Reclassification of losses (gains) on derivatives designated as cash flow hedges to income |
( |
) |
( |
) |
||||||||||||||
Remeasurement gains (losses) on employee benefit plans |
( |
) | ( |
) | ||||||||||||||
Net gains (losses) from fair value changes due to credit risk on financial liabilities designated at fair value through profit or loss |
( |
) |
( |
) |
( |
) | ||||||||||||
Net gains (losses) on equity securities designated at fair value through other comprehensive income |
||||||||||||||||||
Total income tax expenses (recoveries) |
$ |
( |
) |
$ | ( |
) | $ |
( |
) |
$ | ( |
) |
Interim Condensed Consolidated Statements of Changes in Equity |
For the three months ended April 30, 2024 |
||||||||||||||||||||||||||||||||||||||||||||||||
Other components of equity |
||||||||||||||||||||||||||||||||||||||||||||||||
(Millions of Canadian dollars) |
Preferred shares and other equity instruments |
Common shares |
Treasury – preferred shares and other equity instruments |
Treasury – common shares |
Retained earnings |
FVOCI securities and loans |
Foreign currency translation |
Cash flow hedges |
Total other components of equity |
Equity attributable to shareholders |
Non-controlling interests |
Total equity |
||||||||||||||||||||||||||||||||||||
Balance at beginning of period |
$ |
$ |
$ |
( |
) |
$ |
( |
) |
$ |
$ |
( |
) |
$ |
$ |
$ |
$ |
$ |
$ |
||||||||||||||||||||||||||||||
Changes in equity |
||||||||||||||||||||||||||||||||||||||||||||||||
Issues of share capital and other equity instruments |
– |
– |
( |
) |
– |
– |
– |
– |
– |
|||||||||||||||||||||||||||||||||||||||
Sales of treasury shares and other equity instruments |
– |
– |
– |
– |
– |
– |
– |
– |
||||||||||||||||||||||||||||||||||||||||
Purchases of treasury shares and other equity instruments |
– |
– |
( |
) |
( |
) |
– |
– |
– |
– |
– |
( |
) |
– |
( |
) | ||||||||||||||||||||||||||||||||
Share-based compensation awards |
– |
– |
– |
– |
– |
– |
– |
– |
– |
– |
– |
– |
||||||||||||||||||||||||||||||||||||
Dividends on common shares |
– |
– |
– |
– |
( |
) |
– |
– |
– |
– |
( |
) |
– |
( |
) | |||||||||||||||||||||||||||||||||
Dividends on preferred shares and distributions on other equity instruments |
– |
– |
– |
– |
( |
) |
– |
– |
– |
– |
( |
) |
( |
) |
( |
) | ||||||||||||||||||||||||||||||||
Other |
– |
– |
– |
– |
( |
) |
– |
– |
– |
– |
( |
) |
– |
( |
) | |||||||||||||||||||||||||||||||||
Net income |
– |
– |
– |
– |
– |
– |
– |
– |
||||||||||||||||||||||||||||||||||||||||
Total other comprehensive income (loss), net of taxes |
– |
– |
– |
– |
( |
) |
||||||||||||||||||||||||||||||||||||||||||
Balance at end of period |
$ |
$ |
$ |
$ |
( |
) |
$ |
$ |
( |
) |
$ |
$ |
$ |
$ |
$ |
$ |
||||||||||||||||||||||||||||||||
For the three months ended April 30, 2023 (Restated – Note 2) | ||||||||||||||||||||||||||||||||||||||||||||||||
Other components of equity | ||||||||||||||||||||||||||||||||||||||||||||||||
(Millions of Canadian dollars) |
Preferred shares and other equity instruments |
Common shares |
Treasury – preferred shares and other equity instruments |
Treasury – common shares |
Retained earnings |
FVOCI securities and loans |
Foreign currency translation |
Cash flow hedges |
Total other components of equity |
Equity attributable to shareholders |
Non-controlling interests |
Total equity |
||||||||||||||||||||||||||||||||||||
Balance at beginning of period |
$ | $ | $ | $ | ( |
) | $ | $ | ( |
) | $ | $ | $ | $ | $ | $ | ||||||||||||||||||||||||||||||||
Changes in equity |
||||||||||||||||||||||||||||||||||||||||||||||||
Issues of share capital and other equity instruments |
– | – | – | – | – | – | – | – | – | |||||||||||||||||||||||||||||||||||||||
Sales of treasury shares and other equity instruments |
– | – | – | – | – | – | – | – | ||||||||||||||||||||||||||||||||||||||||
Purchases of treasury shares and other equity instruments |
– | – | ( |
) | ( |
) | – | – | – | – | – | ( |
) | – | ( |
) | ||||||||||||||||||||||||||||||||
Share-based compensation awards |
– | – | – | – | ( |
) | – | – | – | – | ( |
) | – | ( |
) | |||||||||||||||||||||||||||||||||
Dividends on common shares |
– | – | – | – | ( |
) | – | – | – | – | ( |
) | – | ( |
) | |||||||||||||||||||||||||||||||||
Dividends on preferred shares and distributions on other equity instruments |
– | – | – | – | ( |
) | – | – | – | – | ( |
) | ( |
) | ( |
) | ||||||||||||||||||||||||||||||||
Other |
– | – | – | – | – | – | – | – | – | |||||||||||||||||||||||||||||||||||||||
Net income |
– | – | – | – | – | – | – | – | ||||||||||||||||||||||||||||||||||||||||
Total other comprehensive income (loss), net of taxes |
– | – | – | – | ( |
) | ( |
) | ||||||||||||||||||||||||||||||||||||||||
Restated balance at end of period |
$ | $ | $ | ( |
) | $ | ( |
) | $ | $ | ( |
) | $ | $ | $ | $ | $ | $ |
For the six months ended April 30, 2024 |
||||||||||||||||||||||||||||||||||||||||||||||||
Other components of equity |
||||||||||||||||||||||||||||||||||||||||||||||||
(Millions of Canadian dollars) |
Preferred shares and other equity instruments |
Common shares |
Treasury – preferred shares and other equity instruments |
Treasury – common shares |
Retained earnings |
FVOCI securities and loans |
Foreign currency translation |
Cash flow hedges |
Total other components of equity |
Equity attributable to shareholders |
Non-controlling interests |
Total equity |
||||||||||||||||||||||||||||||||||||
Balance at beginning of period |
$ |
$ |
$ |
( |
) |
$ |
( |
) |
$ |
$ |
( |
) |
$ |
$ |
$ |
$ |
$ |
$ |
||||||||||||||||||||||||||||||
Transition adjustment (Note 2) |
– |
– |
– |
– |
( |
) |
– |
– |
– |
– |
– |
|||||||||||||||||||||||||||||||||||||
Restated balance at beginning of period |
$ |
$ |
$ |
( |
) |
$ |
( |
) |
$ |
$ |
( |
) |
$ |
$ |
$ |
$ |
$ |
$ |
||||||||||||||||||||||||||||||
Changes in equity |
||||||||||||||||||||||||||||||||||||||||||||||||
Issues of share capital and other equity instruments |
– |
– |
( |
) |
– |
– |
– |
– |
– |
|||||||||||||||||||||||||||||||||||||||
Redemption of preferred shares and other equity instruments |
( |
) |
– |
– |
– |
– |
– |
– |
– |
( |
) |
– |
( |
) | ||||||||||||||||||||||||||||||||||
Sales of treasury shares and other equity instruments |
– |
– |
– |
– |
– |
– |
– |
– |
||||||||||||||||||||||||||||||||||||||||
Purchases of treasury shares and other equity instruments |
– |
– |
( |
) |
( |
) |
– |
– |
– |
– |
– |
( |
) |
– |
( |
) | ||||||||||||||||||||||||||||||||
Share-based compensation awards |
– |
– |
– |
– |
– |
– |
– |
– |
– |
|||||||||||||||||||||||||||||||||||||||
Dividends on common shares |
– |
– |
– |
– |
( |
) |
– |
– |
– |
– |
( |
) |
– |
( |
) | |||||||||||||||||||||||||||||||||
Dividends on preferred shares and distributions on other equity instruments |
– |
– |
– |
– |
( |
) |
– |
– |
– |
– |
( |
) |
( |
) |
( |
) | ||||||||||||||||||||||||||||||||
Other |
– |
– |
– |
– |
– |
– |
– |
– |
– |
|||||||||||||||||||||||||||||||||||||||
Net income |
– |
– |
– |
– |
– |
– |
– |
– |
||||||||||||||||||||||||||||||||||||||||
Total other comprehensive income (loss), net of taxes |
– |
– |
– |
– |
( |
) |
( |
) |
( |
) |
( |
) |
( |
) |
– |
( |
) | |||||||||||||||||||||||||||||||
Balance at end of period |
$ |
$ |
$ |
$ |
( |
) |
$ |
$ |
( |
) |
$ |
$ |
$ |
$ |
$ |
$ |
||||||||||||||||||||||||||||||||
For the six months ended April 30, 2023 (Restated – Note 2) | ||||||||||||||||||||||||||||||||||||||||||||||||
Other components of equity | ||||||||||||||||||||||||||||||||||||||||||||||||
(Millions of Canadian dollars) |
Preferred shares and other equity instruments |
Common shares |
Treasury – preferred shares and other equity instruments |
Treasury – common shares |
Retained earnings |
FVOCI securities and loans |
Foreign currency translation |
Cash flow hedges |
Total other components of equity |
Equity attributable to shareholders |
Non-controlling interests |
Total equity |
||||||||||||||||||||||||||||||||||||
Balance at beginning of period |
$ | $ | $ | ( |
) | $ | ( |
) | $ | $ | ( |
) | $ | $ | $ | $ | $ | $ | ||||||||||||||||||||||||||||||
Transition adjustment (Note 2) |
– | – | – | – | ( |
) | – | – | – | – | ( |
) | – | ( |
) | |||||||||||||||||||||||||||||||||
Restated balance at beginning of period |
$ | $ | $ | ( |
) | $ | ( |
) | $ | $ | ( |
) | $ | $ | $ | $ | $ | $ | ||||||||||||||||||||||||||||||
Changes in equity |
||||||||||||||||||||||||||||||||||||||||||||||||
Issues of share capital and other equity instruments |
– | – | – | – | – | – | – | – | ||||||||||||||||||||||||||||||||||||||||
Redemption of preferred shares and other equity instruments |
– | – | – | – | – | – | – | – | – | – | – | – | ||||||||||||||||||||||||||||||||||||
Sales of treasury shares and other equity instruments |
– | – | – | – | – | – | – | – | ||||||||||||||||||||||||||||||||||||||||
Purchases of treasury shares and other equity instruments |
– | – | ( |
) | ( |
) | – | – | – | – | – | ( |
) | – | ( |
) | ||||||||||||||||||||||||||||||||
Share-based compensation awards |
– | – | – | – | – | – | – | – | – | |||||||||||||||||||||||||||||||||||||||
Dividends on common shares |
– | – | – | – | ( |
) | – | – | – | – | ( |
) | – | ( |
) | |||||||||||||||||||||||||||||||||
Dividends on preferred shares and distributions on other equity instruments |
– | – | – | – | ( |
) | – | – | – | – | ( |
) | ( |
) | ( |
) | ||||||||||||||||||||||||||||||||
Other |
– | – | – | – | – | – | – | – | – | |||||||||||||||||||||||||||||||||||||||
Net income |
– | – | – | – | – | – | – | – | ||||||||||||||||||||||||||||||||||||||||
Total other comprehensive income (loss), net of taxes |
– | – | – | – | ( |
) | ( |
) | ( |
) | – | ( |
) | |||||||||||||||||||||||||||||||||||
Restated balance at end of period |
$ | $ | $ | ( |
) | $ | ( |
) | $ | $ | ( |
) | $ | $ | $ | $ | $ | $ |
Interim Condensed Consolidated Statements of Cash Flows |
For the three months ended | For the six months ended | |||||||||||||||||
(Millions of Canadian dollars) |
April 30 2024 |
April 30 2023 (Restated – Note 2) |
April 30 2024 |
April 30 2023 (Restated – Note 2) |
||||||||||||||
Cash flows from operating activities |
||||||||||||||||||
Net income |
$ |
$ | |
$ |
$ | |
||||||||||||
Adjustments for non-cash items and others |
||||||||||||||||||
Provision for credit losses |
||||||||||||||||||
Depreciation |
||||||||||||||||||
Deferred income taxes |
( |
) |
( |
) | ( |
) |
( |
) | ||||||||||
Amortization and impairment of other intangibles |
||||||||||||||||||
Net changes in investments in joint ventures and associates |
( |
) |
( |
) | ( |
) |
( |
) | ||||||||||
Losses (Gains) on investment securities |
( |
) |
( |
) | ( |
) |
( |
) | ||||||||||
Losses (Gains) on disposition of businesses |
( |
) |
– | ( |
) |
– | ||||||||||||
Adjustments for net changes in operating assets and liabilities |
||||||||||||||||||
Insurance contract liabilities |
( |
) |
||||||||||||||||
Net change in accrued interest receivable and payable |
||||||||||||||||||
Current income taxes |
( |
) |
( |
) | ( |
) |
||||||||||||
Derivative assets |
( |
) |
||||||||||||||||
Derivative liabilities |
( |
) | ( |
) |
( |
) | ||||||||||||
Trading securities |
||||||||||||||||||
Loans, net of securitizations |
( |
) |
( |
) | ( |
) |
( |
) | ||||||||||
Assets purchased under reverse repurchase agreements and securities borrowed |
( |
) | ( |
) | ||||||||||||||
Obligations related to assets sold under repurchase agreements and securities loaned |
( |
) |
( |
) |
||||||||||||||
Obligations related to securities sold short |
( |
) |
( |
) |
||||||||||||||
Deposits, net of securitizations |
||||||||||||||||||
Brokers and dealers receivable and payable |
( |
) | ( |
) | ||||||||||||||
Other |
( |
) |
( |
) |
( |
) | ||||||||||||
Net cash from (used in) operating activities |
( |
) |
( |
) |
||||||||||||||
Cash flows from investing activities |
||||||||||||||||||
Change in interest-bearing deposits with banks |
||||||||||||||||||
Proceeds from sales and maturities of investment securities |
||||||||||||||||||
Purchases of investment securities |
( |
) |
( |
) | ( |
) |
( |
) | ||||||||||
Net acquisitions of premises and equipment and other intangibles |
( |
) |
( |
) | ( |
) |
( |
) | ||||||||||
Net proceeds from (cash transferred for) dispositions |
– |
– |
||||||||||||||||
Cash used in acquisitions, net of cash acquired |
( |
) |
– | ( |
) |
– | ||||||||||||
Net cash from (used in) investing activities |
( |
) | ||||||||||||||||
Cash flows from financing activities |
||||||||||||||||||
Issuance of subordinated debentures |
– | |||||||||||||||||
Repayment of subordinated debentures |
– |
– | – |
( |
) | |||||||||||||
Issue of common shares, net of issuance costs |
||||||||||||||||||
Issue of preferred shares and other equity instruments, net of issuance costs |
– | – | ||||||||||||||||
Redemption of preferred shares and other equity instruments |
– |
– | ( |
) |
– | |||||||||||||
Sales of treasury shares and other equity instruments |
||||||||||||||||||
Purchases of treasury shares and other equity instruments |
( |
) |
( |
) | ( |
) |
( |
) | ||||||||||
Dividends paid on shares and distributions paid on other equity instruments |
( |
) |
( |
) | ( |
) |
( |
) | ||||||||||
Dividends/distributions paid to non-controlling interests |
( |
) |
( |
) | ( |
) |
( |
) | ||||||||||
Change in short-term borrowings of subsidiaries |
( |
) |
( |
) | ( |
) |
||||||||||||
Repayment of lease liabilities |
( |
) |
( |
) | ( |
) |
( |
) | ||||||||||
Net cash from (used in) financing activities |
( |
) |
( |
) | ( |
) |
||||||||||||
Effect of exchange rate changes on cash and due from banks |
( |
) |
( |
) |
||||||||||||||
Net change in cash and due from banks |
( |
) |
( |
) |
||||||||||||||
Cash and due from banks at beginning of period (1) |
||||||||||||||||||
Cash and due from banks at end of period (1) |
$ |
$ | $ |
$ | ||||||||||||||
Cash flows from operating activi tie s include: |
||||||||||||||||||
Amount of interest paid |
$ |
$ | $ |
$ | ||||||||||||||
Amount of interest received |
||||||||||||||||||
Amount of dividends received |
||||||||||||||||||
Amount of income taxes paid |
(1) | We are required to maintain balances due to regulatory requirements or contractual restrictions from central banks, other regulatory authorities, and other counterparties. The total balances were $ |
Note 1 General information |
Note 2 Summary of significant accounting policies, estimates and judgments |
• | For insurance contracts with direct participating features (applicable primarily to our segregated fund insurance contracts), the variable fee approach (VFA) is applied. |
• | For insurance contracts and reinsurance contracts held with a short duration of one year or less (applicable primarily to our creditor reinsurance contracts issued, group life and health insurance contracts and travel insurance contracts), the premium allocation approach (PAA) is applied. |
• | The general measurement method (GMM) is applied to all remaining contracts. |
Note 2 Summary of significant accounting policies, estimates and judgments (continued) |
• | Insurance revenue is recognized as we provide insurance contract services under the groups of insurance contracts. For contracts measured using the PAA, the insurance revenue is generally recognized based on allocating expected premium receipts over the passage of time. For contracts measured using the GMM and VFA, insurance revenue represents the amount of consideration we expect to be entitled to in exchange for services in the period, which includes expected claims and expenses directly attributable to fulfilling insurance contracts (excluding any investment components), release of the risk adjustment for the period, CSM amortization to reflect services provided in the period, an allocation of premiums that relates to recovering insurance acquisition expenses and experience adjustments for premium receipts relating to current or past services. |
• | Insurance service expense arising from insurance contracts include incurred claims and other directly attributable expenses in the current period (excluding investment components), amortization and impairment losses relating to insurance acquisition cash flows where applicable, changes relating to past or current services and changes in loss components of onerous groups of contracts. |
• | Net income (expense) from reinsurance contracts held represents the amounts recovered from the reinsurers less the allocation of premiums paid on reinsurance contracts held. |
• | Net investment income primarily comprises interest and dividend income and net gains (losses) on financial assets, including segregated fund assets, and derivatives relating to the Insurance segment. Financial assets supporting the Insurance segment are primarily measured at FVTPL and FVOCI. |
• | Insurance and reinsurance finance income (expense) represents the net effect of and changes in the time value of money (including the time value of money relating to risk adjustment on non-financial risks) and financial risks on insurance contracts and reinsurance contracts held respectively . |
(Millions of Canadian dollars) | As at November 1, 2022 before transition |
Transition adjustments |
As at November 1, 2022 after transition |
|||||||||
Assets |
||||||||||||
Segregated fund net assets (1) |
$ | $ | ( |
) | $ | – | ||||||
Other |
||||||||||||
Other assets (2) |
||||||||||||
Total assets |
$ | $ | $ | |||||||||
Liabilities |
||||||||||||
Segregated fund net liabilities (3) |
$ | $ | ( |
) | $ | – | ||||||
Other |
||||||||||||
Insurance claims and policy benefit liabilities (4) |
( |
) | – | |||||||||
Insurance contract liabilities (4) |
– | |||||||||||
Other liabilities (5) |
( |
) | ||||||||||
Total liabilities |
$ | $ | $ | |||||||||
Total equity |
( |
) | ||||||||||
Total liabilities and equity |
$ | |
$ | |
$ | |
(1) | Segregated fund net assets are now presented within Other assets. |
(2) | The increase is primarily attributable to the inclusion of segregated fund net assets, the increase in insurance contract assets, reinsurance contract held assets and the tax effects of the IFRS 17 transition adjustment. |
(3) | Segregated fund insurance contracts are now presented within Insurance contract liabilities. |
(4) | Insurance claims and policy benefit liabilities measured under IFRS 4 is replaced with Insurance contract liabilities measured under IFRS 17. The increase in these balances is attributable to presentation changes and remeasurement impacts including the establishment of the CSM for in-force contracts at transition. |
(5) | Certain liabilities that were previously presented in Other liabilities are now included in the measurement of insurance contracts or reinsurance contracts held. |
• | $ |
• | $ |
• | $ |
• | $ |
Note 3 Fair value of financial instruments |
As at April 30, 2024 |
||||||||||||||||||||||||||||||||||||
Carrying value and fair value |
Carrying value |
Fair value |
||||||||||||||||||||||||||||||||||
(Millions of Canadian dollars) | Financial instruments classified as FVTPL |
Financial instruments designated as FVTPL |
Financial instruments classified as FVOCI |
Financial instruments designated as FVOCI |
Financial instruments measured at amortized cost |
Total carrying amount |
Total fair value |
||||||||||||||||||||||||||||
Financial assets |
||||||||||||||||||||||||||||||||||||
Interest-bearing deposits |
$ |
– |
$ |
$ |
– |
$ |
– |
$ |
$ |
$ |
$ |
|||||||||||||||||||||||||
Securities |
||||||||||||||||||||||||||||||||||||
Trading |
– |
– |
– |
– |
||||||||||||||||||||||||||||||||
Investment, net of applicable allowance |
– |
– |
||||||||||||||||||||||||||||||||||
Assets purchased under reverse repurchase agreements and securities borrowed |
– |
– |
– |
|||||||||||||||||||||||||||||||||
Loans, net of applicable allowance |
||||||||||||||||||||||||||||||||||||
Retail |
– |
– |
||||||||||||||||||||||||||||||||||
Wholesale |
– |
|||||||||||||||||||||||||||||||||||
– |
||||||||||||||||||||||||||||||||||||
Other |
||||||||||||||||||||||||||||||||||||
Derivatives |
– |
– |
– |
– |
– |
|||||||||||||||||||||||||||||||
Other assets (1) |
– |
– |
||||||||||||||||||||||||||||||||||
Financial liabilities |
||||||||||||||||||||||||||||||||||||
Deposits |
||||||||||||||||||||||||||||||||||||
Personal |
$ |
$ |
$ |
$ |
$ |
$ |
||||||||||||||||||||||||||||||
Business and government (2) |
||||||||||||||||||||||||||||||||||||
Bank (3) |
– |
|||||||||||||||||||||||||||||||||||
Other |
||||||||||||||||||||||||||||||||||||
Obligations related to securities sold short |
– |
– |
– |
|||||||||||||||||||||||||||||||||
Obligations related to assets sold under repurchase agreements and securities loaned |
– |
|||||||||||||||||||||||||||||||||||
Derivatives |
– |
– |
– |
|||||||||||||||||||||||||||||||||
Other liabilities (4) |
( |
) |
||||||||||||||||||||||||||||||||||
Subordinated debentures |
– |
– |
As at October 31, 2023 (Restated – Note 2) | ||||||||||||||||||||||||||||||||||||
Carrying value and fair value | Carrying value | Fair value | ||||||||||||||||||||||||||||||||||
(Millions of Canadian dollars) | Financial instruments classified as FVTPL |
Financial instruments designated as FVTPL |
Financial instruments classified as FVOCI |
Financial instruments designated as FVOCI |
Financial instruments measured at amortized cost |
Total carrying amount |
Total fair value | ||||||||||||||||||||||||||||
Financial assets |
||||||||||||||||||||||||||||||||||||
Interest-bearing deposits with banks |
$ | – | $ | $ | – | $ | – | $ | $ | $ | $ | |||||||||||||||||||||||||
Securities |
||||||||||||||||||||||||||||||||||||
Trading |
– | – | – | – | ||||||||||||||||||||||||||||||||
Investment, net of applicable allowance |
– | – | |
|||||||||||||||||||||||||||||||||
|
||||||||||||||||||||||||||||||||||||
Assets purchased under reverse repurchase agreements and securities borrowed |
|
– | – | – | ||||||||||||||||||||||||||||||||
Loans, net of applicable allowance |
||||||||||||||||||||||||||||||||||||
Retail |
– | |||||||||||||||||||||||||||||||||||
Wholesale |
– | |||||||||||||||||||||||||||||||||||
– | ||||||||||||||||||||||||||||||||||||
Other |
||||||||||||||||||||||||||||||||||||
Derivatives |
– | – | – | – | – | |||||||||||||||||||||||||||||||
Other assets (1) |
– | – | ||||||||||||||||||||||||||||||||||
Financial liabilities |
||||||||||||||||||||||||||||||||||||
Deposits |
||||||||||||||||||||||||||||||||||||
Personal |
$ | $ | $ | $ | $ | $ | ||||||||||||||||||||||||||||||
Business and government (2) |
||||||||||||||||||||||||||||||||||||
Bank (3) |
– | |||||||||||||||||||||||||||||||||||
|
|
|
|
|||||||||||||||||||||||||||||||||
Other |
||||||||||||||||||||||||||||||||||||
Obligations related to securities sold short |
– | – | – | |||||||||||||||||||||||||||||||||
Obligations related to assets sold under repurchase agreements and securities loaned |
– | |
||||||||||||||||||||||||||||||||||
Derivatives |
– | – | – | |||||||||||||||||||||||||||||||||
Other liabilities (4) |
( |
) | ||||||||||||||||||||||||||||||||||
Subordinated debentures |
– | – |
(1) | Includes Customers’ liability under acceptances and financial instruments recognized in Other assets. |
(2) | Business and government deposits include deposits from regulated deposit-taking institutions other than banks. |
(3) | Bank deposits refer to deposits from regulated banks and central banks. |
(4) | Includes Acceptances and financial instruments recognized in Other liabilities. |
Note 3 Fair value of financial instruments (continued) |
As at | ||||||||||||||||||||||||||||||||||||||||||
April 30, 2024 |
October 31, 2023 (Restated – Note 2) | |||||||||||||||||||||||||||||||||||||||||
Fair value measurements using |
Netting adjustments |
|
Fair value measurements using | Netting adjustments |
|
|||||||||||||||||||||||||||||||||||||
(Millions of Canadian dollars) | Level 1 |
Level 2 |
Level 3 |
Fair value |
Level 1 | Level 2 | Level 3 | Fair value | ||||||||||||||||||||||||||||||||||
Financial assets |
||||||||||||||||||||||||||||||||||||||||||
Interest-bearing deposits with banks |
$ |
– |
$ |
$ |
– |
$ |
$ |
$ | – | $ | $ | – | $ | $ | ||||||||||||||||||||||||||||
Securities |
||||||||||||||||||||||||||||||||||||||||||
Trading |
||||||||||||||||||||||||||||||||||||||||||
Debt issued or guaranteed by: |
||||||||||||||||||||||||||||||||||||||||||
Canadian government (1) |
||||||||||||||||||||||||||||||||||||||||||
Federal |
– |
– | ||||||||||||||||||||||||||||||||||||||||
Provincial and municipal |
– |
– |
– | – | ||||||||||||||||||||||||||||||||||||||
U.S. federal, state, municipal and agencies (1), (2) |
– |
– | ||||||||||||||||||||||||||||||||||||||||
Other OECD government (3) |
– |
– | ||||||||||||||||||||||||||||||||||||||||
Mortgage-backed securities (1) |
– |
– |
– | – | ||||||||||||||||||||||||||||||||||||||
Asset-backed securities |
||||||||||||||||||||||||||||||||||||||||||
Non-CDO securities (4) |
– |
– |
– | – | ||||||||||||||||||||||||||||||||||||||
Corporate debt and other debt |
– |
– |
– | – | ||||||||||||||||||||||||||||||||||||||
Equities |
||||||||||||||||||||||||||||||||||||||||||
Investment |
||||||||||||||||||||||||||||||||||||||||||
Debt issued or guaranteed by: |
||||||||||||||||||||||||||||||||||||||||||
Canadian government (1) |
||||||||||||||||||||||||||||||||||||||||||
Federal |
– |
– | ||||||||||||||||||||||||||||||||||||||||
Provincial and municipal |
– |
– |
– | – | ||||||||||||||||||||||||||||||||||||||
U.S. federal, state, municipal and agencies (1) |
– |
– | ||||||||||||||||||||||||||||||||||||||||
Other OECD government |
– |
– | – | |||||||||||||||||||||||||||||||||||||||
Mortgage-backed securities (1) |
– |
– | ||||||||||||||||||||||||||||||||||||||||
Asset-backed securities |
||||||||||||||||||||||||||||||||||||||||||
CDO |
– |
– |
– | – | ||||||||||||||||||||||||||||||||||||||
Non-CDO securities |
– |
– |
– | – | ||||||||||||||||||||||||||||||||||||||
Corporate debt and other debt |
– |
– | ||||||||||||||||||||||||||||||||||||||||
Equities |
||||||||||||||||||||||||||||||||||||||||||
Assets purchased under reverse repurchase agreements and securities borrowed |
– |
– |
– | – | ||||||||||||||||||||||||||||||||||||||
Loans |
– |
– | ||||||||||||||||||||||||||||||||||||||||
Other |
||||||||||||||||||||||||||||||||||||||||||
Derivatives |
||||||||||||||||||||||||||||||||||||||||||
Interest rate contracts |
– |
– | ||||||||||||||||||||||||||||||||||||||||
Foreign exchange contracts |
– |
– | ||||||||||||||||||||||||||||||||||||||||
Credit derivatives |
– |
– |
– | – | ||||||||||||||||||||||||||||||||||||||
Other contracts |
||||||||||||||||||||||||||||||||||||||||||
Valuation adjustments |
– |
( |
) |
( |
) |
– | ( |
) | ( |
) | ||||||||||||||||||||||||||||||||
Total gross derivatives |
||||||||||||||||||||||||||||||||||||||||||
Netting adjustments |
( |
) |
( |
) |
( |
) | ( |
) | ||||||||||||||||||||||||||||||||||
Total derivatives |
||||||||||||||||||||||||||||||||||||||||||
Other assets |
||||||||||||||||||||||||||||||||||||||||||
$ |
$ |
$ |
$ |
( |
) |
$ |
$ | |
$ | |
$ | |
$ | ( |
) | $ | |
|||||||||||||||||||||||||
Financial liabilities |
||||||||||||||||||||||||||||||||||||||||||
Deposits |
||||||||||||||||||||||||||||||||||||||||||
Personal |
$ |
– |
$ |
$ |
$ |
$ |
$ | – | $ | $ | $ | $ | ||||||||||||||||||||||||||||||
Business and government |
– |
– |
– | – | ||||||||||||||||||||||||||||||||||||||
Bank |
– |
– |
– | – | ||||||||||||||||||||||||||||||||||||||
Other |
||||||||||||||||||||||||||||||||||||||||||
Obligations related to securities sold short |
– |
– | ||||||||||||||||||||||||||||||||||||||||
Obligations related to assets sold under repurchase agreements and securities loaned |
– |
– |
– | – | ||||||||||||||||||||||||||||||||||||||
Derivatives |
||||||||||||||||||||||||||||||||||||||||||
Interest rate contracts |
– |
– | ||||||||||||||||||||||||||||||||||||||||
Foreign exchange contracts |
– |
– | ||||||||||||||||||||||||||||||||||||||||
Credit derivatives |
– |
– |
– | – | ||||||||||||||||||||||||||||||||||||||
Other contracts |
||||||||||||||||||||||||||||||||||||||||||
Valuation adjustments |
– |
( |
) |
( |
) |
– | ( |
) | ( |
) | ||||||||||||||||||||||||||||||||
Total gross derivatives |
||||||||||||||||||||||||||||||||||||||||||
Netting adjustments |
( |
) |
( |
) |
( |
) | ( |
) | ||||||||||||||||||||||||||||||||||
Total derivatives |
||||||||||||||||||||||||||||||||||||||||||
Other liabilities |
( |
) |
– |
( |
) |
( |
) | – | ( |
) | ||||||||||||||||||||||||||||||||
$ |
$ |
$ |
$ |
( |
) |
$ |
$ | $ | $ | $ | ( |
) | $ |
(1) | As at April 30, 2024, residential and commercial mortgage-backed securities (MBS) included in all fair value levels of trading securities were $ |
(2) | United States (U.S.). |
(3) | Organisation for Economic Co-operation and Development (OECD). |
(4) | Collateralized debt obligations (CDO). |
For the three months ended April 30, 2024 |
||||||||||||||||||||||||||||||||||||
(Millions of Canadian dollars) | Fair value at beginning of period |
Gains (losses) included in earnings |
Gains (losses) included in OCI |
Purchases (issuances) |
Settlement (sales) and other |
Transfers into Level 3 |
Transfers out of Level 3 |
Fair value at end of period |
Gains (losses) included in earnings for positions still held |
|||||||||||||||||||||||||||
Assets |
||||||||||||||||||||||||||||||||||||
Securities |
||||||||||||||||||||||||||||||||||||
Trading |
||||||||||||||||||||||||||||||||||||
Debt issued or guaranteed by: |
||||||||||||||||||||||||||||||||||||
U.S. state, municipal and agencies |
$ |
– |
$ |
– |
$ |
– |
$ |
– |
$ |
– |
$ |
– |
$ |
– |
$ |
– |
$ |
– |
||||||||||||||||||
Asset-backed securities |
||||||||||||||||||||||||||||||||||||
Non-CDO securities |
– |
– |
– |
– |
– |
– |
– |
– |
– |
|||||||||||||||||||||||||||
Corporate debt and other debt |
– |
– |
– |
– |
– |
– |
– |
– |
– |
|||||||||||||||||||||||||||
Equities |
( |
) |
( |
) |
– |
( |
) |
( |
) | |||||||||||||||||||||||||||
( |
) |
( |
) |
– |
( |
) |
( |
) | ||||||||||||||||||||||||||||
Investment |
||||||||||||||||||||||||||||||||||||
Mortgage-backed securities |
– |
– |
– |
– |
– |
– |
n.a. |
|||||||||||||||||||||||||||||
Corporate debt and other debt |
– |
– |
( |
) |
– |
– |
n.a. |
|||||||||||||||||||||||||||||
Equities |
– |
– |
– |
n.a. |
||||||||||||||||||||||||||||||||
– |
( |
) |
– |
n.a. |
||||||||||||||||||||||||||||||||
Loans |
( |
) |
( |
) |
( |
) |
( |
) | ||||||||||||||||||||||||||||
Other |
||||||||||||||||||||||||||||||||||||
Net derivative balances (3) |
||||||||||||||||||||||||||||||||||||
Interest rate contracts |
( |
) |
( |
) |
– |
( |
) |
( |
) |
( |
) |
( |
) |
( |
) |
( |
) | |||||||||||||||||||
Foreign exchange contracts |
( |
) |
( |
) |
( |
) |
( |
) |
||||||||||||||||||||||||||||
Other contracts |
( |
) |
( |
) |
( |
) |
( |
) |
( |
) |
– |
|||||||||||||||||||||||||
Valuation adjustments |
– |
– |
( |
) |
( |
) |
– |
– |
( |
) |
– |
|||||||||||||||||||||||||
Other assets |
– |
– |
– |
( |
) |
– |
– |
– |
||||||||||||||||||||||||||||
$ |
$ |
( |
) |
$ |
$ |
$ |
( |
) |
$ |
( |
) |
$ |
$ |
$ |
( |
) | ||||||||||||||||||||
Liabilities |
||||||||||||||||||||||||||||||||||||
Deposits |
$ |
( |
) |
$ |
( |
) |
$ |
( |
) |
$ |
( |
) |
$ |
$ |
( |
) |
$ |
$ |
( |
) |
$ |
|||||||||||||||
$ |
( |
) |
$ |
( |
) |
$ |
( |
) |
$ |
( |
) |
$ |
$ |
( |
) |
$ |
$ |
( |
) |
$ |
Note 3 Fair value of financial instruments (continued) |
For the three months ended April 30, 2023 | ||||||||||||||||||||||||||||||||||||
(Millions of Canadian dollars) | Fair value at beginning of period |
Gains (losses) included in earnings |
Gains (losses) included in OCI (1) |
Purchases (issuances) |
Settlement (sales) and other (2) |
Transfers into Level 3 |
Transfers out of Level 3 |
Fair value at end of period |
Gains (losses) included in earnings for positions still held |
|||||||||||||||||||||||||||
Assets |
||||||||||||||||||||||||||||||||||||
Securities |
||||||||||||||||||||||||||||||||||||
Trading |
||||||||||||||||||||||||||||||||||||
Debt issued or guaranteed by: |
||||||||||||||||||||||||||||||||||||
U.S. state, municipal and agencies |
$ | – | $ | – | $ | – | $ | – | $ | – | $ | – | $ | – | $ | – | $ | – | ||||||||||||||||||
Asset-backed securities |
||||||||||||||||||||||||||||||||||||
Non-CDO securities |
– | – | – | – | – | – | – | – | – | |||||||||||||||||||||||||||
Corporate debt and other debt |
– | – | – | – | – | – | ||||||||||||||||||||||||||||||
Equities |
( |
) | ( |
) | – | ( |
) | |||||||||||||||||||||||||||||
( |
) | ( |
) | – | ( |
) | ||||||||||||||||||||||||||||||
Investment |
||||||||||||||||||||||||||||||||||||
Mortgage-backed securities |
– | ( |
) | – | – | – | n.a. | |||||||||||||||||||||||||||||
Corporate debt and other debt |
– | – | ( |
) | – | – | n.a. | |||||||||||||||||||||||||||||
Equities |
– | – | – | – | – | n.a. | ||||||||||||||||||||||||||||||
– | ( |
) | – | – | n.a. | |||||||||||||||||||||||||||||||
Loans |
( |
) | – | ( |
) | |||||||||||||||||||||||||||||||
Other |
||||||||||||||||||||||||||||||||||||
Net derivative balances (3) |
||||||||||||||||||||||||||||||||||||
Interest rate contracts |
( |
) | ( |
) | – | ( |
) | ( |
) | ( |
) | |||||||||||||||||||||||||
Foreign exchange contracts |
( |
) | ( |
) | ( |
) | – | – | ( |
) | ( |
) | ||||||||||||||||||||||||
Other contracts |
( |
) | ( |
) | ( |
) | ( |
) | ( |
) | ||||||||||||||||||||||||||
Valuation adjustments |
– | – | – | ( |
) | – | – | – | ||||||||||||||||||||||||||||
Other assets |
– | – | – | – | – | – | – | |||||||||||||||||||||||||||||
$ | $ | $ | $ | $ | ( |
) | $ | ( |
) | $ | $ | $ | ( |
) | ||||||||||||||||||||||
Liabilities |
||||||||||||||||||||||||||||||||||||
Deposits |
$ | ( |
) | $ | ( |
) | $ | ( |
) | $ | ( |
) | $ | $ | ( |
) | $ | $ | ( |
) | $ | ( |
) | |||||||||||||
$ | ( |
) | $ | ( |
) | $ | ( |
) | $ | ( |
) | $ | $ | ( |
) | $ | $ | ( |
) | $ | ( |
) |
For the six months ended April 30, 2024 |
||||||||||||||||||||||||||||||||||||
(Millions of Canadian dollars) | Fair value at beginning of period |
Gains (losses) included in earnings |
Gains (losses) included in OCI |
Purchases (issuances) |
Settlement (sales) and other |
Transfers into Level 3 |
Transfers out of Level 3 |
Fair value at end of period |
Gains (losses) included in earnings for positions still held |
|||||||||||||||||||||||||||
Assets |
||||||||||||||||||||||||||||||||||||
Securities |
||||||||||||||||||||||||||||||||||||
Trading |
||||||||||||||||||||||||||||||||||||
Debt issued or guaranteed by: |
||||||||||||||||||||||||||||||||||||
U.S. state, municipal and agencies |
$ |
– |
$ |
– |
$ |
– |
$ |
– |
$ |
– |
$ |
– |
$ |
– |
$ |
– |
$ |
– |
||||||||||||||||||
Asset-backed securities |
||||||||||||||||||||||||||||||||||||
Non-CDO securities |
– |
– |
– |
– |
– |
– |
– |
– |
– |
|||||||||||||||||||||||||||
Corporate debt and other debt |
– |
– |
– |
– |
– |
– |
– |
– |
– |
|||||||||||||||||||||||||||
Equities |
( |
) |
( |
) |
( |
) |
– |
( |
) |
( |
) | |||||||||||||||||||||||||
( |
) |
( |
) |
( |
) |
– |
( |
) |
( |
) | ||||||||||||||||||||||||||
Investment |
||||||||||||||||||||||||||||||||||||
Mortgage-backed securities |
– |
– |
– |
– |
– |
n.a. |
||||||||||||||||||||||||||||||
Corporate debt and other debt |
– |
– |
( |
) |
– |
– |
n.a. |
|||||||||||||||||||||||||||||
Equities |
– |
– |
– |
n.a. |
||||||||||||||||||||||||||||||||
– |
( |
) |
– |
n.a. |
||||||||||||||||||||||||||||||||
Loans |
( |
) |
( |
) |
( |
) |
( |
) | ||||||||||||||||||||||||||||
Other |
||||||||||||||||||||||||||||||||||||
Net derivative balances (3) |
||||||||||||||||||||||||||||||||||||
Interest rate contracts |
( |
) |
– |
( |
) |
( |
) |
|||||||||||||||||||||||||||||
Foreign exchange contracts |
( |
) |
( |
) |
( |
) |
( |
) |
||||||||||||||||||||||||||||
Other contracts |
( |
) |
( |
) |
( |
) |
( |
) |
( |
) |
( |
) | ||||||||||||||||||||||||
Valuation adjustments |
– |
– |
( |
) |
( |
) |
– |
– |
( |
) |
– |
|||||||||||||||||||||||||
Other assets |
– |
– |
– |
( |
) |
– |
– |
– |
||||||||||||||||||||||||||||
$ |
$ |
( |
) |
$ |
$ |
$ |
( |
) |
$ |
( |
) |
$ |
$ |
$ |
( |
) | ||||||||||||||||||||
Liabilities |
||||||||||||||||||||||||||||||||||||
Deposits |
$ |
( |
) |
$ |
( |
) |
$ |
$ |
( |
) |
$ |
$ |
( |
) |
$ |
$ |
( |
) |
$ |
( |
) | |||||||||||||||
$ |
( |
) |
$ |
( |
) |
$ |
$ |
( |
) |
$ |
$ |
( |
) |
$ |
$ |
( |
) |
$ |
( |
) |
For the six months ended April 30, 2023 | ||||||||||||||||||||||||||||||||||||
(Millions of Canadian dollars) | Fair value at beginning of period |
Gains (losses) included in earnings |
Gains (losses) included in OCI (1) |
Purchases (issuances) |
Settlement (sales) and other (2) |
Transfers into Level 3 |
Transfers out of Level 3 |
Fair value at end of period |
Gains (losses) included in earnings for positions still held |
|||||||||||||||||||||||||||
Assets |
||||||||||||||||||||||||||||||||||||
Securities |
||||||||||||||||||||||||||||||||||||
Trading |
||||||||||||||||||||||||||||||||||||
Debt issued or guaranteed by: |
||||||||||||||||||||||||||||||||||||
U.S. state, municipal and agencies |
$ | $ | – | $ | – | $ | – | $ | ( |
) | $ | – | $ | – | $ | – | $ | – | ||||||||||||||||||
Asset-backed securities |
||||||||||||||||||||||||||||||||||||
Non-CDO securities |
– | – | – | ( |
) | – | – | – | – | |||||||||||||||||||||||||||
Corporate debt and other debt |
– | – | – | ( |
) | – | ||||||||||||||||||||||||||||||
Equities |
( |
) | ( |
) | ( |
) | – | ( |
) | |||||||||||||||||||||||||||
( |
) | ( |
) | ( |
) | ( |
) | ( |
) | |||||||||||||||||||||||||||
Investment |
||||||||||||||||||||||||||||||||||||
Mortgage-backed securities |
– | ( |
) | – | – | – | n.a. | |||||||||||||||||||||||||||||
Corporate debt and other debt |
– | – | ( |
) | – | – | n.a. | |||||||||||||||||||||||||||||
Equities |
– | – | ( |
) | – | – | n.a. | |||||||||||||||||||||||||||||
– | ( |
) | – | – | n.a. | |||||||||||||||||||||||||||||||
Loans |
( |
) | ( |
) | ( |
) | ||||||||||||||||||||||||||||||
Other |
||||||||||||||||||||||||||||||||||||
Net derivative balances (3) |
||||||||||||||||||||||||||||||||||||
Interest rate contracts |
( |
) | ( |
) | ( |
) | ||||||||||||||||||||||||||||||
Foreign exchange contracts |
( |
) | – | ( |
) | ( |
) | |||||||||||||||||||||||||||||
Other contracts |
( |
) | ( |
) | ( |
) | ( |
) | ||||||||||||||||||||||||||||
Valuation adjustments |
– | – | – | ( |
) | – | – | – | ||||||||||||||||||||||||||||
Other assets |
– | – | – | ( |
) | – | – | – | ||||||||||||||||||||||||||||
$ | $ | ( |
) | $ | $ | $ | ( |
) | $ | $ | $ | $ | ( |
) | ||||||||||||||||||||||
Liabilities |
||||||||||||||||||||||||||||||||||||
Deposits |
$ | ( |
) | $ | ( |
) | $ | – | $ | ( |
) | $ | $ | ( |
) | $ | $ | ( |
) | $ | ( |
) | ||||||||||||||
$ | ( |
) | $ | ( |
) | $ | – | $ | ( |
) | $ | $ | ( |
) | $ | $ | ( |
) | $ | ( |
) |
(1) | These amounts include the foreign currency translation gains or losses arising on consolidation of foreign subsidiaries relating to the Level 3 instruments, where applicable. The unrealized gains or losses on Investment securities recognized in other comprehensive income (OCI) were $ |
(2) | Other includes amortization of premiums or discounts recognized in net income. |
(3) | Net derivatives as at April 30, 2024 included derivative assets of $ |
n.a. | not applicable |
Note 3 Fair value of financial instruments (continued) |
For the three months ended | For the six months ended | |||||||||||||||||
(Millions of Canadian dollars) |
April 30 2024 |
April 30 2023 |
April 30 2024 |
April 30 2023 |
||||||||||||||
Interest and dividend income (1), (2) |
||||||||||||||||||
Financial instruments measured at fair value through profit or loss |
$ |
$ | $ |
$ | ||||||||||||||
Financial instruments measured at fair value through other comprehensive income |
||||||||||||||||||
Financial instruments measured at amortized cost |
||||||||||||||||||
Interest expense (1) |
||||||||||||||||||
Financial instruments measured at fair value through profit or loss |
||||||||||||||||||
Financial instruments measured at amortized cost |
||||||||||||||||||
|
|
|||||||||||||||||
Net interest income |
$ |
$ | $ |
$ |
(1) | Excludes interest and dividend income for the three months ended April 30, 2024 of $ |
(2) | Includes dividend income for the three months ended April 30, 2024 of $ |
Note 4 Securities |
As at | ||||||||||||||||||||||||||||||||||
April 30, 2024 |
October 31, 2023 | |||||||||||||||||||||||||||||||||
(Millions of Canadian dollars) | Cost/ Amortized cost |
Gross unrealized gains |
Gross unrealized losses |
Fair value |
Cost/ Amortized cost |
Gross unrealized gains |
Gross unrealized losses |
Fair value | ||||||||||||||||||||||||||
Debt issued or guaranteed by: |
||||||||||||||||||||||||||||||||||
Canadian government |
||||||||||||||||||||||||||||||||||
Federal |
$ |
$ |
$ |
( |
) |
$ |
$ | $ | $ | ( |
) | $ | ||||||||||||||||||||||
Provincial and municipal |
( |
) |
( |
) | ||||||||||||||||||||||||||||||
U.S. federal, state, municipal and agencies |
( |
) |
( |
) | ||||||||||||||||||||||||||||||
Other OECD government |
( |
) |
( |
) | ||||||||||||||||||||||||||||||
Mortgage-backed securities |
( |
) |
– | ( |
) | |||||||||||||||||||||||||||||
Asset-backed securities |
||||||||||||||||||||||||||||||||||
CDO |
( |
) |
( |
) | ||||||||||||||||||||||||||||||
Non-CDO securities |
( |
) |
( |
) | ||||||||||||||||||||||||||||||
Corporate debt and other debt |
( |
) |
( |
) | ||||||||||||||||||||||||||||||
Equities |
( |
) |
( |
) | ||||||||||||||||||||||||||||||
$ |
$ |
$ |
( |
) |
$ |
$ | |
$ | $ | ( |
) | $ | |
(1) | Excludes $ held-to-collect |
(2) | Gross unrealized gains and losses includes $( |
(3) | These amounts reflect certain reclassifications made upon the adoption of IFRS 17 as at November 1, 2023 with no restatement of comparative information. Refer to Note 2 for further details. |
• | Transfers between stages, which are presumed to occur before any corresponding remeasurement of the allowance. |
• | Purchases, which reflect the allowance related to assets newly recognized during the period, including those assets that were derecognized following a modification of terms. |
• | Sales and maturities, which reflect the allowance related to assets derecognized during the period without a credit loss being incurred, including those assets that were derecognized following a modification of terms. |
• | Changes in risk, parameters and exposures, which comprise the impact of changes in model inputs or assumptions, including changes in forward-looking macroeconomic conditions; partial repayments; changes in the measurement following a transfer between stages; and unwinding of the time value discount due to the passage of time. |
For the three months ended | ||||||||||||||||||||||||||||||||||||||||||||
April 30, 2024 |
April 30, 2023 | |||||||||||||||||||||||||||||||||||||||||||
Performing |
Impaired |
Performing | Impaired | |||||||||||||||||||||||||||||||||||||||||
(Millions of Canadian dollars) | Stage 1 |
Stage 2 |
Stage 3 |
Total |
Stage 1 | Stage 2 | Stage 3 (2) | Total | ||||||||||||||||||||||||||||||||||||
Balance at beginning of period |
$ |
$ |
– |
$ |
( |
) |
$ |
( |
) |
$ | $ | $ | ( |
) | $ | ( |
) | |||||||||||||||||||||||||||
Provision for credit losses |
||||||||||||||||||||||||||||||||||||||||||||
Transfers to stage 1 |
– |
– |
– |
– |
– | – | – | – | ||||||||||||||||||||||||||||||||||||
Transfers to stage 2 |
– |
– |
– |
– |
– | – | – | – | ||||||||||||||||||||||||||||||||||||
Transfers to stage 3 |
– |
– |
– |
– |
– | – | – | – | ||||||||||||||||||||||||||||||||||||
Purchases |
– |
– |
– | – | |
|||||||||||||||||||||||||||||||||||||||
Sales and maturities |
( |
) |
– |
– |
( |
) |
( |
) | – | – | ( |
) | ||||||||||||||||||||||||||||||||
Changes in risk, parameters and exposures |
( |
) |
– |
( |
) |
( |
) |
– | ( |
) | ( |
) | ||||||||||||||||||||||||||||||||
Exchange rate and other |
– |
– |
( |
) | ( |
) | – | |||||||||||||||||||||||||||||||||||||
Balance at end of period |
$ |
$ |
– |
$ |
( |
) |
$ |
( |
) |
$ | |
$ | |
$ | ( |
) | $ | ( |
) |
For the six months ended | ||||||||||||||||||||||||||||||||||||||||||||
April 30, 2024 |
April 30, 2023 | |||||||||||||||||||||||||||||||||||||||||||
Performing |
Impaired |
Performing | Impaired | |||||||||||||||||||||||||||||||||||||||||
(Millions of Canadian dollars) | Stage 1 |
Stage 2 |
Stage 3 |
Total |
Stage 1 | Stage 2 | Stage 3 (2) | Total | ||||||||||||||||||||||||||||||||||||
Balance at beginning of period |
$ |
$ |
– |
$ |
( |
) |
$ |
( |
) |
$ | $ | $ | ( |
) | $ | ( |
) | |||||||||||||||||||||||||||
Provision for credit losses |
||||||||||||||||||||||||||||||||||||||||||||
Transfers to stage 1 |
– |
– |
– |
– |
– | – | – | – | ||||||||||||||||||||||||||||||||||||
Transfers to stage 2 |
– |
– |
– |
– |
– | – | – | – | ||||||||||||||||||||||||||||||||||||
Transfers to stage 3 |
– |
– |
– |
– |
– | – | – | – | ||||||||||||||||||||||||||||||||||||
Purchases |
– |
– |
– | – | ||||||||||||||||||||||||||||||||||||||||
Sales and maturities |
( |
) |
– |
– |
( |
) |
( |
) | – | – | ( |
) | ||||||||||||||||||||||||||||||||
Changes in risk, parameters and exposures |
( |
) |
– |
( |
) |
( |
) |
( |
) | ( |
) | ( |
) | |||||||||||||||||||||||||||||||
Exchange rate and other |
– |
( |
) | ( |
) | |||||||||||||||||||||||||||||||||||||||
Balance at end of period |
$ |
$ |
– |
$ |
( |
) |
$ |
( |
) |
$ | |
$ | |
$ | ( |
) | $ | ( |
) |
(1) | Expected credit losses on debt securities at FVOCI are not separately recognized on the balance sheet as the related securities are recorded at fair value. The cumulative amount of credit losses recognized in income is presented in Other components of equity. |
(2) | Reflects changes in the allowance for purchased credit impaired securities. |
Note 4 Securities (continued) |
For the three months ended | ||||||||||||||||||||||||||||||||||||||||||||
April 30, 2024 |
April 30, 2023 | |||||||||||||||||||||||||||||||||||||||||||
Performing |
Impaired |
Performing | Impaired | |||||||||||||||||||||||||||||||||||||||||
(Millions of Canadian dollars) | Stage 1 |
Stage 2 |
Stage 3 |
Total |
Stage 1 | Stage 2 | Stage 3 | Total | ||||||||||||||||||||||||||||||||||||
Balance at beginning of period |
$ |
$ |
$ |
– |
$ |
$ | $ | $ | – | $ | ||||||||||||||||||||||||||||||||||
Provision for credit losses |
||||||||||||||||||||||||||||||||||||||||||||
Transfers to stage 1 |
– |
– |
– |
– |
– | – | – | – | ||||||||||||||||||||||||||||||||||||
Transfers to stage 2 |
– |
– |
– |
– |
– | – | – | – | ||||||||||||||||||||||||||||||||||||
Transfers to stage 3 |
– |
– |
– |
– |
– | – | – | – | ||||||||||||||||||||||||||||||||||||
Purchases |
– |
– |
– | – | ||||||||||||||||||||||||||||||||||||||||
Sales and maturities |
– |
– |
– |
– |
– | – | – | – | ||||||||||||||||||||||||||||||||||||
Changes in risk, parameters and exposures |
( |
) |
( |
) |
– |
( |
) |
( |
) | – | – | ( |
) | |||||||||||||||||||||||||||||||
Exchange rate and other |
– |
– |
– |
– |
– | – | ||||||||||||||||||||||||||||||||||||||
Balance at end of period |
$ |
$ |
$ |
– |
$ |
$ | |
$ | |
$ | – | $ | |
For the six months ended | ||||||||||||||||||||||||||||||||||||||||||||
April 30, 2024 |
April 30, 2023 | |||||||||||||||||||||||||||||||||||||||||||
Performing |
Impaired |
Performing | Impaired | |||||||||||||||||||||||||||||||||||||||||
(Millions of Canadian dollars) | Stage 1 |
Stage 2 |
Stage 3 |
Total |
Stage 1 | Stage 2 | Stage 3 | Total | ||||||||||||||||||||||||||||||||||||
Balance at beginning of period |
$ |
$ |
$ |
– |
$ |
$ | $ | $ | – | $ | ||||||||||||||||||||||||||||||||||
Provision for credit losses |
||||||||||||||||||||||||||||||||||||||||||||
Transfers to stage 1 |
– |
– |
– |
– |
– | – | – | – | ||||||||||||||||||||||||||||||||||||
Transfers to stage 2 |
– |
– |
– |
– |
– | – | – | – | ||||||||||||||||||||||||||||||||||||
Transfers to stage 3 |
– |
– |
– |
– |
– | – | – | – | ||||||||||||||||||||||||||||||||||||
Purchases |
– |
– |
– | – | ||||||||||||||||||||||||||||||||||||||||
Sales and maturities |
– |
– |
– |
– |
– | – | – | – | ||||||||||||||||||||||||||||||||||||
Changes in risk, parameters and exposures |
( |
) |
( |
) |
– |
( |
) |
( |
) | ( |
) | – | ( |
) | ||||||||||||||||||||||||||||||
Exchange rate and other |
– |
( |
) |
– |
( |
) |
– | – | ||||||||||||||||||||||||||||||||||||
Balance at end of period |
$ |
$ |
$ |
– |
$ |
$ | |
$ | |
$ | – | $ | |
As at |
||||||||||||||||||||||||||||||||||||||||||||
April 30, 2024 |
October 31, 2023 |
|||||||||||||||||||||||||||||||||||||||||||
Performing |
Impaired |
Performing |
Impaired |
|||||||||||||||||||||||||||||||||||||||||
(Millions of Canadian dollars) |
Stage 1 |
Stage 2 |
Stage 3 |
Total |
Stage 1 |
Stage 2 |
Stage 3 (1) |
Total |
||||||||||||||||||||||||||||||||||||
Investment securities |
||||||||||||||||||||||||||||||||||||||||||||
Securities at FVOCI |
||||||||||||||||||||||||||||||||||||||||||||
Investment grade |
$ |
$ |
$ |
– |
$ |
$ | |
$ | $ | – | $ | |||||||||||||||||||||||||||||||||
Non-investment grade |
– |
– |
– | – | ||||||||||||||||||||||||||||||||||||||||
Impaired |
– |
– |
– | – | ||||||||||||||||||||||||||||||||||||||||
|
|
|||||||||||||||||||||||||||||||||||||||||||
Items not subject to impairment (2) |
||||||||||||||||||||||||||||||||||||||||||||
$ |
$ | |
||||||||||||||||||||||||||||||||||||||||||
Securities at amortized cost |
||||||||||||||||||||||||||||||||||||||||||||
Investment grade |
$ |
$ |
– |
$ |
– |
$ |
$ | $ | – | $ | – | $ | ||||||||||||||||||||||||||||||||
Non-investment grade |
– |
– | ||||||||||||||||||||||||||||||||||||||||||
Impaired |
– |
– |
– |
– |
– | – | – | – | ||||||||||||||||||||||||||||||||||||
– |
– | |||||||||||||||||||||||||||||||||||||||||||
Allowance for credit losses |
– |
– | ||||||||||||||||||||||||||||||||||||||||||
$ |
$ |
$ |
– |
$ |
$ | $ | $ | – | $ |
(1) | Reflects $ |
(2) | Investment securities at FVOCI not subject to impairment represent equity securities designated as FVOCI. |
Note 5 Loans and allowance for credit losses |
For the three months ended | ||||||||||||||||||||||||||||||||||||||||||
April 30, 2024 |
April 30, 2023 | |||||||||||||||||||||||||||||||||||||||||
(Millions of Canadian dollars) | Balance at beginning of period |
Provision for credit losses |
Net write-offs |
Exchange rate and other |
Balance at end of period |
Balance at beginning of period |
Provision for credit losses |
Net write-offs |
Exchange rate and other |
Balance at end of period |
||||||||||||||||||||||||||||||||
Retail |
||||||||||||||||||||||||||||||||||||||||||
Residential mortgages |
$ |
$ |
$ |
( |
) |
$ |
$ |
$ | $ | $ | ( |
) | $ | $ | ||||||||||||||||||||||||||||
Personal |
( |
) |
( |
) | ( |
) | ||||||||||||||||||||||||||||||||||||
Credit cards |
( |
) |
– |
( |
) | – | ||||||||||||||||||||||||||||||||||||
Small business |
( |
) |
( |
) |
( |
) | ( |
) | ||||||||||||||||||||||||||||||||||
Wholesale |
( |
) |
( |
) |
( |
) | ( |
) | ||||||||||||||||||||||||||||||||||
Customers’ liability under acceptances |
– |
– |
( |
) | – | |||||||||||||||||||||||||||||||||||||
$ |
$ |
$ |
( |
) |
$ |
$ |
$ | |
$ | $ | ( |
) | $ | ( |
) | $ | |
|||||||||||||||||||||||||
Presented as: |
||||||||||||||||||||||||||||||||||||||||||
Allowance for loan losses |
$ |
$ |
$ | $ | ||||||||||||||||||||||||||||||||||||||
Other liabilities – Provisions |
||||||||||||||||||||||||||||||||||||||||||
Customers’ liability under acceptances |
||||||||||||||||||||||||||||||||||||||||||
Other components of equity |
||||||||||||||||||||||||||||||||||||||||||
For the six months ended | ||||||||||||||||||||||||||||||||||||||||||
April 30, 2024 |
April 30, 2023 | |||||||||||||||||||||||||||||||||||||||||
(Millions of Canadian dollars) | Balance at beginning of period |
Provision for credit losses |
Net write-offs |
Exchange rate and other |
Balance at end of period |
Balance at beginning of period |
Provision for credit losses |
Net write-offs |
Exchange rate and other |
Balance at end of period |
||||||||||||||||||||||||||||||||
Retail |
||||||||||||||||||||||||||||||||||||||||||
Residential mortgages |
$ |
$ |
$ |
( |
) |
$ |
( |
) |
$ |
$ | $ | $ | ( |
) | $ | ( |
) | $ | ||||||||||||||||||||||||
Personal |
( |
) |
( |
) | ( |
) | ||||||||||||||||||||||||||||||||||||
Credit cards |
( |
) |
( |
) |
( |
) | ( |
) | ||||||||||||||||||||||||||||||||||
Small business |
( |
) |
( |
) |
( |
) | – | |||||||||||||||||||||||||||||||||||
Wholesale |
( |
) |
( |
) |
( |
) | ( |
) | ||||||||||||||||||||||||||||||||||
Customers’ liability under acceptances |
– |
– |
( |
) | – | |||||||||||||||||||||||||||||||||||||
$ |
$ |
$ |
( |
) |
$ |
( |
) |
$ |
$ | |
$ | $ | ( |
) | $ | ( |
) | $ | |
|||||||||||||||||||||||
Presented as: |
||||||||||||||||||||||||||||||||||||||||||
Allowance for loan losses |
$ |
$ |
$ | $ | ||||||||||||||||||||||||||||||||||||||
Other liabilities – Provisions |
||||||||||||||||||||||||||||||||||||||||||
Customers’ liability under acceptances |
||||||||||||||||||||||||||||||||||||||||||
Other components of equity |
• | Transfers between stages, which are presumed to occur before any corresponding remeasurements of the allowance. |
• | Originations, which reflect the allowance related to assets newly recognized during the period, including those assets that were derecognized following a modification of terms. |
• | Maturities, which reflect the allowance related to assets derecognized during the period without a credit loss being incurred, including those assets that were derecognized following a modification of terms. |
• | Changes in risk, parameters and exposures, which comprise the impact of changes in model inputs or assumptions, including changes in forward-looking macroeconomic conditions; partial repayments and additional draws on existing facilities; changes in the measurement following a transfer between stages; and unwinding of the time value discount due to the passage of time in stage 1 and stage 2. |
Note 5 Loans and allowance for credit losses (continued) |
For the three months ended | ||||||||||||||||||||||||||||||||||||||
April 30, 2024 |
April 30, 2023 | |||||||||||||||||||||||||||||||||||||
Performing |
Impaired |
Performing | Impaired | |||||||||||||||||||||||||||||||||||
(Millions of Canadian dollars) | Stage 1 |
Stage 2 |
Stage 3 |
Total |
Stage 1 | Stage 2 | Stage 3 | Total | ||||||||||||||||||||||||||||||
Residential mortgages |
||||||||||||||||||||||||||||||||||||||
Balance at beginning of period |
$ |
$ |
$ |
$ |
$ | $ | $ | $ | ||||||||||||||||||||||||||||||
Provision for credit losses |
||||||||||||||||||||||||||||||||||||||
Transfers to stage 1 |
( |
) |
– |
– |
( |
) | – | – | ||||||||||||||||||||||||||||||
Transfers to stage 2 |
( |
) |
( |
) |
– |
( |
) | ( |
) | – | ||||||||||||||||||||||||||||
Transfers to stage 3 |
( |
) |
( |
) |
– |
( |
) | ( |
) | – | ||||||||||||||||||||||||||||
Originations (1) |
– |
– |
– | – | ||||||||||||||||||||||||||||||||||
Maturities |
( |
) |
( |
) |
– |
( |
) |
( |
) | – | – | ( |
) | |||||||||||||||||||||||||
Changes in risk, parameters and exposures |
( |
) |
( |
) | ||||||||||||||||||||||||||||||||||
Write-offs |
– |
– |
( |
) |
( |
) |
– | – | ( |
) | ( |
) | ||||||||||||||||||||||||||
Recoveries |
– |
– |
– | – | ||||||||||||||||||||||||||||||||||
Exchange rate and other |
– |
– |
||||||||||||||||||||||||||||||||||||
Balance at end of period |
$ |
$ |
$ |
$ |
$ | $ | $ | $ | ||||||||||||||||||||||||||||||
Personal |
||||||||||||||||||||||||||||||||||||||
Balance at beginning of period |
$ |
$ |
$ |
$ |
$ | $ | $ | $ | ||||||||||||||||||||||||||||||
Provision for credit losses |
||||||||||||||||||||||||||||||||||||||
Transfers to stage 1 |
( |
) |
– |
– |
( |
) | ( |
) | – | |||||||||||||||||||||||||||||
Transfers to stage 2 |
( |
) |
( |
) |
– |
( |
) | ( |
) | – | ||||||||||||||||||||||||||||
Transfers to stage 3 |
– |
( |
) |
– |
( |
) | ( |
) | – | |||||||||||||||||||||||||||||
Originations (1) |
– |
– |
– | – | ||||||||||||||||||||||||||||||||||
Maturities |
( |
) |
( |
) |
– |
( |
) |
( |
) | ( |
) | – | ( |
) | ||||||||||||||||||||||||
Changes in risk, parameters and exposures |
( |
) |
( |
) | ||||||||||||||||||||||||||||||||||
Write-offs |
– |
– |
( |
) |
( |
) |
– | – | ( |
) | ( |
) | ||||||||||||||||||||||||||
Recoveries |
– |
– |
– | – | ||||||||||||||||||||||||||||||||||
Exchange rate and other |
( |
) |
– | ( |
) | ( |
) | |||||||||||||||||||||||||||||||
Balance at end of period |
$ |
$ |
$ |
$ |
$ | $ | $ | $ | ||||||||||||||||||||||||||||||
Credit cards |
||||||||||||||||||||||||||||||||||||||
Balance at beginning of period |
$ |
$ |
$ |
– |
$ |
$ | $ | $ | – | $ | ||||||||||||||||||||||||||||
Provision for credit losses |
||||||||||||||||||||||||||||||||||||||
Transfers to stage 1 |
( |
) |
– |
– |
( |
) | – | – | ||||||||||||||||||||||||||||||
Transfers to stage 2 |
( |
) |
– |
– |
( |
) | – | – | ||||||||||||||||||||||||||||||
Transfers to stage 3 |
– |
( |
) |
– |
( |
) | ( |
) | – | |||||||||||||||||||||||||||||
Originations (1) |
– |
– |
– | – | ||||||||||||||||||||||||||||||||||
Maturities |
( |
) |
( |
) |
– |
( |
) |
( |
) | ( |
) | – | ( |
) | ||||||||||||||||||||||||
Changes in risk, parameters and exposures |
( |
) |
( |
) | ||||||||||||||||||||||||||||||||||
Write-offs |
– |
– |
( |
) |
( |
) |
– | – | ( |
) | ( |
) | ||||||||||||||||||||||||||
Recoveries |
– |
– |
– | – | ||||||||||||||||||||||||||||||||||
Exchange rate and other |
– |
( |
) |
– |
– | – | – | – | ||||||||||||||||||||||||||||||
Balance at end of period |
$ |
$ |
$ |
– |
$ |
$ | $ | $ | – | $ | ||||||||||||||||||||||||||||
Small business |
||||||||||||||||||||||||||||||||||||||
Balance at beginning of period |
$ |
$ |
$ |
$ |
$ | $ | $ | $ | ||||||||||||||||||||||||||||||
Provision for credit losses |
||||||||||||||||||||||||||||||||||||||
Transfers to stage 1 |
( |
) |
– |
– |
( |
) | – | – | ||||||||||||||||||||||||||||||
Transfers to stage 2 |
( |
) |
– |
– |
( |
) | – | – | ||||||||||||||||||||||||||||||
Transfers to stage 3 |
– |
( |
) |
– |
( |
) | ( |
) | – | |||||||||||||||||||||||||||||
Originations (1) |
– |
– |
– | – | ||||||||||||||||||||||||||||||||||
Maturities |
( |
) |
( |
) |
– |
( |
) |
( |
) | ( |
) | – | ( |
) | ||||||||||||||||||||||||
Changes in risk, parameters and exposures |
( |
) |
( |
) | ||||||||||||||||||||||||||||||||||
Write-offs |
– |
– |
( |
) |
( |
) |
– | – | ( |
) | ( |
) | ||||||||||||||||||||||||||
Recoveries |
– |
– |
– | – | ||||||||||||||||||||||||||||||||||
Exchange rate and other |
– |
– |
( |
) |
( |
) |
( |
) | ( |
) | ||||||||||||||||||||||||||||
Balance at end of period |
$ |
$ |
$ |
$ |
$ | $ | $ | $ | ||||||||||||||||||||||||||||||
Wholesale |
||||||||||||||||||||||||||||||||||||||
Balance at beginning of period |
$ |
$ |
$ |
$ |
$ | $ | $ | $ | ||||||||||||||||||||||||||||||
Provision for credit losses |
||||||||||||||||||||||||||||||||||||||
Transfers to stage 1 |
( |
) |
( |
) |
– |
( |
) | – | – | |||||||||||||||||||||||||||||
Transfers to stage 2 |
( |
) |
( |
) |
– |
( |
) | – | – | |||||||||||||||||||||||||||||
Transfers to stage 3 |
( |
) |
( |
) |
– |
( |
) | ( |
) | – | ||||||||||||||||||||||||||||
Originations (1) |
– |
– |
– | – | ||||||||||||||||||||||||||||||||||
Maturities |
( |
) |
( |
) |
– |
( |
) |
( |
) | ( |
) | – | ( |
) | ||||||||||||||||||||||||
Changes in risk, parameters and exposures |
( |
) |
( |
) | ||||||||||||||||||||||||||||||||||
Write-offs |
– |
– |
( |
) |
( |
) |
– | – | ( |
) | ( |
) | ||||||||||||||||||||||||||
Recoveries |
– |
– |
– | – | ||||||||||||||||||||||||||||||||||
Exchange rate and other |
( |
) |
( |
) |
( |
) | ( |
) | ||||||||||||||||||||||||||||||
Balance at end of period |
$ |
$ |
$ |
$ |
$ | |
$ | |
$ | |
$ | |
(1) | Includes the impact of the HSBC Canada transaction. Refer to Note 6 for further details. |
For the six months ended | ||||||||||||||||||||||||||||||||||||||
April 30, 2024 |
April 30, 2023 | |||||||||||||||||||||||||||||||||||||
Performing |
Impaired |
Performing | Impaired | |||||||||||||||||||||||||||||||||||
(Millions of Canadian dollars) | Stage 1 |
Stage 2 |
Stage 3 |
Total |
Stage 1 | Stage 2 | Stage 3 | Total | ||||||||||||||||||||||||||||||
Residential mortgages |
||||||||||||||||||||||||||||||||||||||
Balance at beginning of period |
$ |
$ |
$ |
$ |
$ | $ | $ | $ | ||||||||||||||||||||||||||||||
Provision for credit losses |
||||||||||||||||||||||||||||||||||||||
Transfers to stage 1 |
( |
) |
– |
– |
( |
) | – | – | ||||||||||||||||||||||||||||||
Transfers to stage 2 |
( |
) |
( |
) |
– |
( |
) | ( |
) | – | ||||||||||||||||||||||||||||
Transfers to stage 3 |
( |
) |
( |
) |
– |
( |
) | ( |
) | – | ||||||||||||||||||||||||||||
Originations (1) |
– |
– |
– | – | ||||||||||||||||||||||||||||||||||
Maturities |
( |
) |
( |
) |
– |
( |
) |
( |
) | ( |
) | – | ( |
) | ||||||||||||||||||||||||
Changes in risk, parameters and exposures |
( |
) |
( |
) | ||||||||||||||||||||||||||||||||||
Write-offs |
– |
– |
( |
) |
( |
) |
– | – | ( |
) | ( |
) | ||||||||||||||||||||||||||
Recoveries |
– |
– |
– | – | ||||||||||||||||||||||||||||||||||
Exchange rate and other |
( |
) |
( |
) |
( |
) |
– | ( |
) | ( |
) | |||||||||||||||||||||||||||
Balance at end of period |
$ |
$ |
$ |
$ |
$ | $ | $ | $ | ||||||||||||||||||||||||||||||
Personal |
||||||||||||||||||||||||||||||||||||||
Balance at beginning of period |
$ |
$ |
$ |
$ |
$ | $ | $ | $ | ||||||||||||||||||||||||||||||
Provision for credit losses |
||||||||||||||||||||||||||||||||||||||
Transfers to stage 1 |
( |
) |
– |
– |
( |
) | ( |
) | – | |||||||||||||||||||||||||||||
Transfers to stage 2 |
( |
) |
( |
) |
– |
( |
) | ( |
) | – | ||||||||||||||||||||||||||||
Transfers to stage 3 |
( |
) |
( |
) |
– |
( |
) | ( |
) | – | ||||||||||||||||||||||||||||
Originations (1) |
– |
– |
– | – | ||||||||||||||||||||||||||||||||||
Maturities |
( |
) |
( |
) |
– |
( |
) |
( |
) | ( |
) | – | ( |
) | ||||||||||||||||||||||||
Changes in risk, parameters and exposures |
( |
) |
( |
) | ||||||||||||||||||||||||||||||||||
Write-offs |
– |
– |
( |
) |
( |
) |
– | – | ( |
) | ( |
) | ||||||||||||||||||||||||||
Recoveries |
– |
– |
– | – | ||||||||||||||||||||||||||||||||||
Exchange rate and other |
( |
) |
– |
( |
) | ( |
) | ( |
) | |||||||||||||||||||||||||||||
Balance at end of period |
$ |
$ |
$ |
$ |
$ | $ | $ | $ | ||||||||||||||||||||||||||||||
Credit cards |
||||||||||||||||||||||||||||||||||||||
Balance at beginning of period |
$ |
$ |
$ |
– |
$ |
$ | $ | $ | – | $ | ||||||||||||||||||||||||||||
Provision for credit losses |
||||||||||||||||||||||||||||||||||||||
Transfers to stage 1 |
( |
) |
– |
– |
( |
) | – | – | ||||||||||||||||||||||||||||||
Transfers to stage 2 |
( |
) |
– |
– |
( |
) | – | – | ||||||||||||||||||||||||||||||
Transfers to stage 3 |
( |
) |
( |
) |
– |
( |
) | ( |
) | – | ||||||||||||||||||||||||||||
Originations (1) |
– |
– |
– | – | ||||||||||||||||||||||||||||||||||
Maturities |
( |
) |
( |
) |
– |
( |
) |
( |
) | ( |
) | – | ( |
) | ||||||||||||||||||||||||
Changes in risk, parameters and exposures |
( |
) |
( |
) | ||||||||||||||||||||||||||||||||||
Write-offs |
– |
– |
( |
) |
( |
) |
– | – | ( |
) | ( |
) | ||||||||||||||||||||||||||
Recoveries |
– |
– |
– | – | ||||||||||||||||||||||||||||||||||
Exchange rate and other |
– |
( |
) |
– |
( |
) |
( |
) | – | – | ( |
) | ||||||||||||||||||||||||||
Balance at end of period |
$ |
$ |
$ |
– |
$ |
$ | $ | $ | – | $ | ||||||||||||||||||||||||||||
Small business |
||||||||||||||||||||||||||||||||||||||
Balance at beginning of period |
$ |
$ |
$ |
$ |
$ | $ | $ | $ | ||||||||||||||||||||||||||||||
Provision for credit losses |
||||||||||||||||||||||||||||||||||||||
Transfers to stage 1 |
( |
) |
– |
– |
( |
) | – | – | ||||||||||||||||||||||||||||||
Transfers to stage 2 |
( |
) |
– |
– |
( |
) | – | – | ||||||||||||||||||||||||||||||
Transfers to stage 3 |
– |
( |
) |
– |
( |
) | ( |
) | – | |||||||||||||||||||||||||||||
Originations (1) |
– |
– |
– | – | ||||||||||||||||||||||||||||||||||
Maturities |
( |
) |
( |
) |
– |
( |
) |
( |
) | ( |
) | – | ( |
) | ||||||||||||||||||||||||
Changes in risk, parameters and exposures |
( |
) |
( |
) | ||||||||||||||||||||||||||||||||||
Write-offs |
– |
– |
( |
) |
( |
) |
– | – | ( |
) | ( |
) | ||||||||||||||||||||||||||
Recoveries |
– |
– |
– | – | ||||||||||||||||||||||||||||||||||
Exchange rate and other |
– |
( |
) |
( |
) |
( |
) | – | ||||||||||||||||||||||||||||||
Balance at end of period |
$ |
$ |
$ |
$ |
$ | $ | $ | $ | ||||||||||||||||||||||||||||||
Wholesale |
||||||||||||||||||||||||||||||||||||||
Balance at beginning of period |
$ |
$ |
$ |
$ |
$ | $ | $ | $ | ||||||||||||||||||||||||||||||
Provision for credit losses |
||||||||||||||||||||||||||||||||||||||
Transfers to stage 1 |
( |
) |
( |
) |
– |
( |
) | – | – | |||||||||||||||||||||||||||||
Transfers to stage 2 |
( |
) |
( |
) |
– |
( |
) | ( |
) | – | ||||||||||||||||||||||||||||
Transfers to stage 3 |
( |
) |
( |
) |
– |
( |
) | ( |
) | – | ||||||||||||||||||||||||||||
Originations (1) |
– |
– |
– | – | ||||||||||||||||||||||||||||||||||
Maturities |
( |
) |
( |
) |
– |
( |
) |
( |
) | ( |
) | – | ( |
) | ||||||||||||||||||||||||
Changes in risk, parameters and exposures |
( |
) |
( |
) | ||||||||||||||||||||||||||||||||||
Write-offs |
– |
– |
( |
) |
( |
) |
– | – | ( |
) | ( |
) | ||||||||||||||||||||||||||
Recoveries |
– |
– |
– | – | ||||||||||||||||||||||||||||||||||
Exchange rate and other |
( |
) |
( |
) |
( |
) |
( |
) |
– | ( |
) | ( |
) | ( |
) | |||||||||||||||||||||||
Balance at end of period |
$ |
$ |
$ |
$ |
$ | |
$ | |
$ | |
$ | |
(1) | Includes the impact of the HSBC Canada transaction. Refer to Note 6 for further details. |
Note 5 Loans and allowance for credit losses (continued) |
• | Unemployment rates |
|
• | Gross Domestic Product (GDP ) |
|
|
• | Oil price (West Texas Intermediate in US$) |
• | Canadian housing price index |
Note 5 Loans and allowance for credit losses (continued) |
As at |
||||||||||||||||||||||||||||||||||
April 30, 2024 |
October 31, 2023 |
|||||||||||||||||||||||||||||||||
(Millions of Canadian dollars) |
Stage 1 |
Stage 2 |
Stage 3 |
Total |
Stage 1 |
Stage 2 |
Stage 3 (1) |
Total |
||||||||||||||||||||||||||
Retail |
||||||||||||||||||||||||||||||||||
Loans outstanding – Residential mortgages |
||||||||||||||||||||||||||||||||||
Low risk |
$ |
$ |
$ |
– |
$ |
$ | $ | $ | – | $ | ||||||||||||||||||||||||
Medium risk |
– |
– | ||||||||||||||||||||||||||||||||
High risk |
– |
– | ||||||||||||||||||||||||||||||||
Not rated (2) |
– |
– | ||||||||||||||||||||||||||||||||
Impaired |
– |
– |
– | – | ||||||||||||||||||||||||||||||
Items not subject to impairment (3) |
||||||||||||||||||||||||||||||||||
Total |
$ |
$ | ||||||||||||||||||||||||||||||||
Loans outstanding – Personal |
||||||||||||||||||||||||||||||||||
Low risk |
$ |
$ |
$ |
– |
$ |
$ | $ | $ | – | $ | ||||||||||||||||||||||||
Medium risk |
– |
– | ||||||||||||||||||||||||||||||||
High risk |
– |
– | ||||||||||||||||||||||||||||||||
Not rated (2) |
– |
– | ||||||||||||||||||||||||||||||||
Impaired |
– |
– |
– | – | ||||||||||||||||||||||||||||||
Total |
$ |
$ |
$ |
$ |
$ | $ | $ | $ | ||||||||||||||||||||||||||
Loans outstanding – Credit cards |
||||||||||||||||||||||||||||||||||
Low risk |
$ |
$ |
$ |
– |
$ |
$ | $ | $ | – | $ | ||||||||||||||||||||||||
Medium risk |
– |
– | ||||||||||||||||||||||||||||||||
High risk |
– |
– | ||||||||||||||||||||||||||||||||
Not rated (2) |
– |
– | ||||||||||||||||||||||||||||||||
Total |
$ |
$ |
$ |
– |
$ |
$ | $ | $ | – | $ | ||||||||||||||||||||||||
Loans outstanding – Small business |
||||||||||||||||||||||||||||||||||
Low risk |
$ |
$ |
$ |
– |
$ |
$ | $ | $ | – | $ | ||||||||||||||||||||||||
Medium risk |
– |
– | ||||||||||||||||||||||||||||||||
High risk |
– |
– | ||||||||||||||||||||||||||||||||
Not rated (2) |
– |
– |
– | – | ||||||||||||||||||||||||||||||
Impaired |
– |
– |
– | – | ||||||||||||||||||||||||||||||
Total |
$ |
$ |
$ |
$ |
$ | $ | $ | $ | ||||||||||||||||||||||||||
Undrawn loan commitments – Retail |
||||||||||||||||||||||||||||||||||
Low risk |
$ |
$ |
$ |
– |
$ |
$ | $ | $ | – | $ | ||||||||||||||||||||||||
Medium risk |
– |
– | ||||||||||||||||||||||||||||||||
High risk |
– |
– | ||||||||||||||||||||||||||||||||
Not rated (2) |
– |
– | ||||||||||||||||||||||||||||||||
Total |
$ |
$ |
$ |
– |
$ |
$ | $ | $ | – | $ | ||||||||||||||||||||||||
Wholesale – Loans outstanding |
||||||||||||||||||||||||||||||||||
Investment grade |
$ |
$ |
$ |
– |
$ |
$ | $ | $ | – | $ | ||||||||||||||||||||||||
Non-investment grade |
– |
– | ||||||||||||||||||||||||||||||||
Not rated (2) |
– |
– | ||||||||||||||||||||||||||||||||
Impaired |
– |
– |
– | – | ||||||||||||||||||||||||||||||
|
||||||||||||||||||||||||||||||||||
Items not subject to impairment (3) |
||||||||||||||||||||||||||||||||||
Total |
$ |
$ | ||||||||||||||||||||||||||||||||
Undrawn loan commitments – Wholesale |
||||||||||||||||||||||||||||||||||
Investment grade |
$ |
$ |
$ |
– |
$ |
$ | $ | $ | – | $ | ||||||||||||||||||||||||
Non-investment grade |
– |
– | ||||||||||||||||||||||||||||||||
Not rated (2) |
– |
– | – | |||||||||||||||||||||||||||||||
Total |
$ |
$ |
$ |
– |
$ |
$ | |
$ | |
$ | – | $ | |
(1) | Includes $ |
(2) | In certain cases where an internal risk rating is not assigned, we use other approved credit risk assessment or rating methodologies, policies and tools to manage our credit risk . |
(3) | Items not subject to impairment are loans held at FVTPL. |
As at |
||||||||||||||||||||||||||
April 30, 2024 |
October 31, 2023 |
|||||||||||||||||||||||||
(Millions of Canadian dollars) |
30 to 89 days |
90 days and greater |
Total |
30 to 89 days |
90 days and greater |
Total |
||||||||||||||||||||
Retail |
$ |
$ |
$ |
$ | $ | $ | ||||||||||||||||||||
Wholesale |
||||||||||||||||||||||||||
$ |
$ |
$ |
$ | $ | $ | |
(1) | Excludes loans less than 30 days past due as they are not generally representative of the borrowers’ ability to meet their payment obligations. |
(2) | Amounts presented may include loans past due as a result of administrative processes, such as mortgage loans on which payments are restrained pending payout due to sale or refinancing, which can fluctuate based on business volumes. Past due loans arising from administrative processes are not representative of the borrowers’ ability to meet their payment obligations. |
Note 6 Significant acquisition and disposition |
(Millions of Canadian dollars, except percentage amounts) |
||||
Percentage of shares acquired |
% |
|||
Purchase consideration |
$ |
|||
Fair value of identifiable assets acquired |
||||
Cash and due from banks |
$ |
|||
Securities |
||||
Trading |
||||
Investment |
||||
Loans (1) |
||||
Retail (2) |
||||
Wholesale |
||||
Derivatives |
||||
Intangible assets (3) |
||||
Other (4) |
||||
Total fair value of identifiable assets acquired |
$ |
|||
Fair value of identifiable liabilities assumed |
||||
Deposits |
||||
Personal |
||||
Business and government (2) |
||||
Bank |
||||
Obligations related to assets sold under repurchase agreements and securities loaned |
||||
Derivatives |
||||
Other (5) |
||||
Total fair value of identifiable liabilities assumed |
$ |
|||
Fair value of identifiable net assets acquired |
$ |
|||
Goodwill |
||||
Total purchase consideration |
$ |
(1) | The fair value of loans reflects estimates of incurred and expected future credit losses as at the acquisition date and interest rate premiums or discounts relative to prevailing market rates. As at March 28, 2024, the gross contractual value of the loans is $ |
(2) | Loans – Retail includes $ |
(3) | Intangible assets include $ |
(4) | Includes Assets purchased under reverse repurchase agreements and securities borrowed, Customers’ liability under acceptances, and Other assets. |
(5) | Includes Acceptances, Obligations related to securities sold short, and Other liabilities. |
Note 6 Significant acquisition and disposition (continued) |
Note 7 Deposits |
As at | ||||||||||||||||||||||||||||||||||
April 30, 2024 |
October 31, 2023 | |||||||||||||||||||||||||||||||||
(Millions of Canadian dollars) | Demand |
Notice |
Term |
Total |
Demand (1) | Notice (2) | Term (3) | Total | ||||||||||||||||||||||||||
Personal |
$ |
$ |
$ |
$ |
$ | $ | $ | $ | ||||||||||||||||||||||||||
Business and government |
||||||||||||||||||||||||||||||||||
Bank |
||||||||||||||||||||||||||||||||||
$ |
$ |
$ |
$ |
$ | $ | $ | $ | |||||||||||||||||||||||||||
Non-interest-bearing (4) |
||||||||||||||||||||||||||||||||||
Canada |
$ |
$ |
$ |
$ |
$ | $ | $ | $ | ||||||||||||||||||||||||||
United States |
– |
– |
– | – | ||||||||||||||||||||||||||||||
Europe (5) |
– |
– |
– | – | ||||||||||||||||||||||||||||||
Other International |
– |
– |
– | – | ||||||||||||||||||||||||||||||
Interest-bearing (4) |
||||||||||||||||||||||||||||||||||
Canada |
||||||||||||||||||||||||||||||||||
United States |
||||||||||||||||||||||||||||||||||
Europe (5) |
||||||||||||||||||||||||||||||||||
Other International |
||||||||||||||||||||||||||||||||||
$ |
$ |
$ |
$ |
$ | |
$ | |
$ | |
$ | |
(1) | Demand deposits are deposits for which we do not have the right to require notice of withdrawal, which include both savings and chequing accounts. |
(2) | Notice deposits are deposits for which we can legally require notice of withdrawal. These deposits are primarily savings accounts. |
(3) | Term deposits are deposits payable on a fixed date, and include term deposits, guaranteed investment certificates and similar instruments. |
(4) | The geographical splits of the deposits are based on the point of origin of the deposits and where the revenue is recognized. As at April 30, 2024, deposits denominated in U.S. dollars, British pounds, Euro and other foreign currencies were $ |
(5) | Europe includes the United Kingdom and the Channel Islands. |
As at | ||||||||
(Millions of Canadian dollars) |
April 30 2024 |
October 31 2023 |
||||||
Within 1 year: |
||||||||
less than 3 months |
$ |
$ | ||||||
3 to 6 months |
||||||||
6 to 12 months |
||||||||
1 to 2 years |
||||||||
2 to 3 years |
||||||||
3 to 4 years |
||||||||
4 to 5 years |
||||||||
Over 5 years |
||||||||
$ |
$ | |||||||
Aggregate amount of term deposits in denominations of one hundred thousand dollars or more |
$ |
$ | |
Note 8 Insurance and reinsurance |
As at | ||||||||||||||||||||||||||||||||||
April 30, 2024 |
October 31, 2023 | |||||||||||||||||||||||||||||||||
(Millions of Canadian dollars) | Estimates of present value of future cash flows |
Risk adjustment for non-financial risk |
CSM |
Total |
Estimates of present value of future cash flows |
Risk adjustment for non-financial risk |
CSM | Total | ||||||||||||||||||||||||||
Insurance contract assets (2) |
$ |
$ |
( |
) |
$ |
( |
) |
$ |
$ | $ | ( |
) | $ | ( |
) | $ | ||||||||||||||||||
Insurance contract liabilities (3) |
||||||||||||||||||||||||||||||||||
Insurance contract liabilities for segregated funds |
$ |
( |
) |
$ |
( |
) |
$ |
( |
) |
$ |
( |
) |
$ | ( |
) | $ | ( |
) | $ | ( |
) | $ | ( |
) | ||||||||||
Insurance contract liabilities excluding segregated funds |
( |
) |
( |
) |
( |
) |
( |
) |
( |
) | ( |
) | ( |
) | ( |
) | ||||||||||||||||||
$ |
( |
) |
$ |
( |
) |
$ |
( |
) |
$ |
( |
) |
$ | ( |
) | $ | ( |
) | $ | ( |
) | $ | ( |
) | |||||||||||
Reinsurance contract held assets (2), (3) |
$ |
$ |
$ |
$ |
$ | $ | $ | |
$ | |
||||||||||||||||||||||||
Reinsurance contract held liabilities (4) |
$ |
( |
) |
$ |
$ |
$ |
( |
) |
$ | ( |
) | $ | $ | $ | ( |
) | ||||||||||||||||||
CSM for insurance contracts, net of reinsurance contracts held |
$ |
( |
) |
$ | ( |
) |
(1) | Includes contracts measured using the GMM and VFA that have CSM and contracts measured using the PAA in which CSM is not applicable. |
(2) | Presented in Other assets. |
(3) | Insurance contract liabilities and reinsurance contract held assets primarily relate to balances for remaining coverage for future services on contracts measured using the GMM or VFA. |
(4) | Presented in Other liabilities. |
For the three months ended | For the six months ended | |||||||||||||||
(Millions of Canadian dollars) |
April 30 2024 |
April 30 2023 (1) |
April 30 2024 |
April 30 2023 (1) |
||||||||||||
Insurance service result |
||||||||||||||||
Insurance revenue |
$ |
$ | $ |
$ | ||||||||||||
Insurance service expense |
( |
) |
( |
) | ( |
) |
( |
) | ||||||||
Net income (expense) from reinsurance contracts held |
( |
) |
( |
) | ( |
) |
( |
) | ||||||||
$ |
$ | $ |
$ | |||||||||||||
Insurance investment result |
||||||||||||||||
Net investment income |
$ |
$ | $ |
$ | ||||||||||||
Insurance finance income (expense) |
( |
) |
( |
) | ( |
) |
( |
) | ||||||||
Reinsurance finance income (expense) |
( |
) |
||||||||||||||
$ |
$ | $ |
$ | ( |
) | |||||||||||
Insurance service and insurance investment results |
$ |
$ | $ |
$ |
(1) | The 2023 amounts may not be fully comparable to the current period as we were not managing our asset and liability portfolios under IFRS 17 and Net investment income was not restated for the reclassifications of certain eligible financial assets. Refer to Note 2 for further details. |
Note 9 Employee benefits – Pension and other post-employment benefits |
For the three months ended | ||||||||||||||||||
Pension plans | Other post-employment benefit plans |
|||||||||||||||||
(Millions of Canadian dollars) |
April 30 2024 |
April 30 2023 |
April 30 2024 |
April 30 2023 |
||||||||||||||
Current service costs |
$ |
$ | $ |
$ | ||||||||||||||
Net interest expense (income) |
( |
) |
( |
) | ||||||||||||||
Remeasurements of other long-term benefits |
– |
– | ( |
) |
||||||||||||||
Administrative expense |
– |
– | ||||||||||||||||
Defined benefit pension expense |
||||||||||||||||||
Defined contribution pension expense |
– |
– | ||||||||||||||||
$ |
$ | $ |
$ |
For the six months ended | ||||||||||||||||||
Pension plans | Other post-employment benefit plans |
|||||||||||||||||
(Millions of Canadian dollars) |
April 30 2024 |
April 30 2023 |
April 30 2024 |
April 30 2023 |
||||||||||||||
Current service costs |
$ |
$ | $ |
$ | ||||||||||||||
Net interest expense (income) |
( |
) |
( |
) | ||||||||||||||
Remeasurements of other long-term benefits |
– |
– | ||||||||||||||||
Administrative expense |
– |
– | ||||||||||||||||
Defined benefit pension expense |
||||||||||||||||||
Defined contribution pension expense |
– |
– | ||||||||||||||||
$ |
$ | $ |
$ |
For the three months ended | ||||||||||||||||||
Defined benefit pension plans | Other post-employment benefit plans |
|||||||||||||||||
(Millions of Canadian dollars) |
April 30 2024 |
April 30 2023 |
April 30 2024 |
April 30 2023 |
||||||||||||||
Actuarial (gains) losses: |
||||||||||||||||||
Changes in financial assumptions (2) |
$ |
( |
) |
$ | $ |
( |
) |
$ | ||||||||||
Experience adjustments |
– |
– | ( |
) |
( |
) | ||||||||||||
Return on plan assets (excluding interest based on discount rate) |
– |
– | ||||||||||||||||
$ |
( |
) |
$ | $ |
( |
) |
$ |
For the six months ended | ||||||||||||||||||
Defined benefit pension plans | Other post-employment benefit plans |
|||||||||||||||||
(Millions of Canadian dollars) |
April 30 2024 |
April 30 2023 |
April 30 2024 |
April 30 2023 |
||||||||||||||
Actuarial (gains) losses: |
||||||||||||||||||
Changes in financial assumptions (2) |
$ |
$ | $ |
$ | ||||||||||||||
Experience adjustments |
– |
– | – |
( |
) | |||||||||||||
Return on plan assets (excluding interest based on discount rate) |
( |
) |
( |
) | – |
– | ||||||||||||
$ |
( |
) |
$ | $ |
$ |
(1) | Market based assumptions, including Changes in financial assumptions and Return on plan assets, are reviewed on a quarterly basis. All other assumptions are updated during our annual review of plan assumptions. |
(2) | Changes in financial assumptions in our defined benefit pension plans primarily relate to changes in discount rates. |
Note 10 Income taxes |
Note 11 Significant capital and funding transactions |
Note 11 Significant capital and funding transactions (continued) |
For the three months ended | ||||||||||||||||||
April 30, 2024 |
April 30, 2023 | |||||||||||||||||
(Millions of Canadian dollars, except number of shares) | Number of shares (thousands) |
Amount |
Number of shares (thousands) |
Amount | ||||||||||||||
Issued in connection with share-based compensation plans (1) |
$ |
$ | ||||||||||||||||
Issued in connection with dividend reinvestment plan (2) |
||||||||||||||||||
$ |
$ | |
For the six months ended | ||||||||||||||||||
April 30, 2024 |
April 30, 2023 | |||||||||||||||||
(Millions of Canadian dollars, except number of shares) | Number of shares (thousands) |
Amount |
Number of shares (thousands) |
Amount | ||||||||||||||
Issued in connection with share-based compensation plans (1) |
$ |
$ | ||||||||||||||||
Issued in connection with dividend reinvestment plan (2) |
||||||||||||||||||
$ |
$ | |
(1) | Amounts include cash received for stock options exercised during the period and the fair value adjustment to stock options. |
(2) | The requirements of our dividend reinvestment plan (DRIP) are satisfied through either open market share purchases or shares issued from treasury. During the three and six months ended April 30, 2024 our DRIP requirements were satisfied through shares issued from treasury. During the three months ended April 30, 2023 our DRIP requirements were satisfied through shares issued from treasury. During the three months ended January 31, 2023 our DRIP requirements were satisfied through open market share purchases. |
Note 12 Earnings per share |
For the three months ended | For the six months ended | |||||||||||||||||
(Millions of Canadian dollars, except share and per share amounts) | April 30 2024 |
April 30 2023 (Restated – Note 2) |
April 30 2024 |
April 30 2023 (Restated – Note 2) |
||||||||||||||
Basic earnings per share |
||||||||||||||||||
Net income |
$ |
$ | $ |
$ | ||||||||||||||
Dividends on preferred shares and distributions on other equity instruments |
( |
) |
( |
) | ( |
) |
( |
) | ||||||||||
Net income attributable to non-controlling interests |
( |
) |
( |
) | ( |
) |
( |
) | ||||||||||
Net income available to common shareholders |
$ |
$ | $ |
$ | ||||||||||||||
Weighted average number of common shares (in thousands) |
|
|
||||||||||||||||
Basic earnings per share (in dollars) |
$ |
$ | $ |
$ | ||||||||||||||
Diluted earnings per share |
||||||||||||||||||
Net income available to common shareholders |
$ |
$ | $ |
$ | ||||||||||||||
Weighted average number of common shares (in thousands) |
||||||||||||||||||
Stock options (1) |
||||||||||||||||||
Issuable under other share-based compensation plans |
||||||||||||||||||
Average number of diluted common shares (in thousands) |
||||||||||||||||||
Diluted earnings per share (in dollars) |
$ |
$ | $ |
$ |
(1) | The dilutive effect of stock options was calculated using the treasury stock method. When the exercise price of options outstanding is greater than the average market price of our common shares, the options are excluded from the calculation of diluted earnings per share. For the three months ended April 30, 2024, |
Note 13 Legal and regulatory matters |
Note 14 Results by business segment |
For the three months ended April 30, 2024 |
||||||||||||||||||||||||
(Millions of Canadian dollars) | Personal & Commercial Banking |
Wealth Management |
Insurance |
Capital Markets |
Corporate Support |
Total |
||||||||||||||||||
Net interest income (3) |
$ |
$ |
$ |
– |
$ |
$ |
$ |
|||||||||||||||||
Non-interest income |
( |
) |
||||||||||||||||||||||
Total revenue |
||||||||||||||||||||||||
Provision for credit losses |
– |
|||||||||||||||||||||||
Non-interest expense |
||||||||||||||||||||||||
Income (loss) before income taxes |
( |
) |
||||||||||||||||||||||
Income taxes (recoveries) |
( |
) |
||||||||||||||||||||||
Net income |
$ |
$ |
$ |
$ |
$ |
( |
) |
$ |
||||||||||||||||
Non-interest expense includes: |
||||||||||||||||||||||||
Depreciation and amortization |
$ |
$ |
$ |
( |
) |
$ |
$ |
( |
) |
$ |
||||||||||||||
For the three months ended April 30, 2023 (Restated – Note 2) | ||||||||||||||||||||||||
(Millions of Canadian dollars) | Personal & Commercial Banking |
Wealth Management (4), (5) |
Insurance | Capital Markets (2), (5) |
Corporate Support (2), (4) |
Total | ||||||||||||||||||
Net interest income (3) |
$ | $ | $ | – | $ | $ | $ | |||||||||||||||||
Non-interest income |
( |
) | ||||||||||||||||||||||
Total revenue |
( |
) | ||||||||||||||||||||||
Provision for credit losses |
– | – | ||||||||||||||||||||||
Non-interest expense |
||||||||||||||||||||||||
Income (loss) before income taxes |
( |
) | ||||||||||||||||||||||
Income taxes (recoveries) |
( |
) | ||||||||||||||||||||||
Net income |
$ | $ | $ | $ | $ | ( |
) | $ | ||||||||||||||||
Non-interest expense includes: |
||||||||||||||||||||||||
Depreciation and amortization |
$ | $ | $ | $ | $ | – | $ |
For the six months ended April 30, 2024 |
||||||||||||||||||||||||
(Millions of Canadian dollars) | Personal & Commercial Banking |
Wealth Management |
Insurance |
Capital Markets |
Corporate Support |
Total |
||||||||||||||||||
Net interest income (3) |
$ |
$ |
$ |
– |
$ |
$ |
$ |
|||||||||||||||||
Non-interest income |
( |
) |
||||||||||||||||||||||
Total revenue |
( |
) |
||||||||||||||||||||||
Provision for credit losses |
||||||||||||||||||||||||
Non-interest expense |
||||||||||||||||||||||||
Income (loss) before income taxes |
( |
) |
||||||||||||||||||||||
Income taxes (recoveries) |
( |
) |
||||||||||||||||||||||
Net income |
$ |
$ |
$ |
$ |
$ |
( |
) |
$ |
||||||||||||||||
Non-interest expense includes: |
||||||||||||||||||||||||
Depreciation and amortization |
$ |
$ |
$ |
$ |
$ |
( |
) |
$ |
||||||||||||||||
For the six months ended April 30, 2023 (Restated – Note 2) | ||||||||||||||||||||||||
(Millions of Canadian dollars) | Personal & Commercial Banking |
Wealth Management (4), (5) |
Insurance | Capital Markets (2), (5) |
Corporate Support (2), (4) |
Total | ||||||||||||||||||
Net interest income (3) |
$ | $ | $ | – | $ | $ | $ | |||||||||||||||||
Non-interest income |
( |
) | ||||||||||||||||||||||
Total revenue |
( |
) | ||||||||||||||||||||||
Provision for credit losses |
– | – | ||||||||||||||||||||||
Non-interest expense |
||||||||||||||||||||||||
Income (loss) before income taxes |
( |
) | ||||||||||||||||||||||
Income taxes (recoveries) |
||||||||||||||||||||||||
Net income |
$ | $ | $ | $ | $ | ( |
) | $ | ||||||||||||||||
Non-interest expense includes: |
||||||||||||||||||||||||
Depreciation and amortization |
$ | $ | $ | $ | $ | – | $ |
(1) | On March 28, 2024, we completed the HSBC Canada transaction. HSBC Canada results have been consolidated from the closing date, and are included in our Personal & Commercial Banking, Wealth Management and Capital Markets segments. For further details, refer to Note 6. |
(2) | Taxable equivalent basis. |
(3) | Interest revenue is reported net of interest expense as we rely primarily on net interest income as a performance measure. |
(4) | Amounts for the three months and six months ended April 30, 2023 have been revised from those previously presented. |
(5) | Effective the fourth quarter of 2023, we moved the Investor Services lending business from our Wealth Management segment to our Capital Markets segment. Therefore, comparative results for the three months and six months ended April 30, 2023 have been revised from those previously presented. |
As at April 30, 2024 |
||||||||||||||||||||||||
(Millions of Canadian dollars) |
Personal & Commercial Banking |
Wealth Management |
Insurance |
Capital Markets |
Corporate Support |
Total |
||||||||||||||||||
Total assets |
$ |
$ |
$ |
$ |
$ |
$ |
||||||||||||||||||
Total liabilities |
( |
) |
||||||||||||||||||||||
As at October 31, 2023 (Restated – Note 2) | ||||||||||||||||||||||||
(Millions of Canadian dollars) | Personal & Commercial Banking |
Wealth Management |
Insurance | Capital Markets |
Corporate Support | Total | ||||||||||||||||||
Total assets |
$ | $ | $ | $ | $ | $ | ||||||||||||||||||
Total liabilities |
( |
) |
(1) | Includes the impact of the HSBC Canada transaction. Refer to Note 6 for further details. |
Note 15 Capital management |
As at | ||||||||
(Millions of Canadian dollars, except percentage amounts and as otherwise noted) |
April 30 2024 |
October 31 2023 |
||||||
Capital (1), (2) |
||||||||
CET1 capital |
$ |
$ | ||||||
Tier 1 capital |
||||||||
Total capital |
||||||||
Risk-weighted assets (RWA) used in calculation of capital ratios (1), (2) |
||||||||
Credit risk |
$ |
$ | ||||||
Market risk |
||||||||
Operational risk |
||||||||
Total RWA |
$ |
$ | ||||||
Capital ratios and Leverage ratio (1), (2) |
||||||||
CET1 ratio |
||||||||
Tier 1 capital ratio |
||||||||
Total capital ratio |
||||||||
Leverage ratio |
||||||||
Leverage ratio exposure |
$ |
$ | |
|||||
TLAC available and ratios (1), (3) |
||||||||
TLAC available |
$ |
$ | ||||||
TLAC ratio |
||||||||
TLAC leverage ratio |
(1) | As prior period restatements are not required by OSFI, there was no impact from the adoption of IFRS 17 on regulatory capital, RWA, capital ratios, leverage ratio, TLAC available and TLAC ratios for periods prior to November 1, 2023. |
(2) | Capital, RWA, and capital ratios are calculated using OSFI’s Capital Adequacy Requirements (CAR) guideline and the Leverage ratio is calculated using OSFI’s Leverage Requirements (LR) guideline. Both the CAR guideline and LR guideline are based on the Basel III framework. The period ended October 31, 2023 reflects our adoption of the revised CAR and LR guidelines that came into effect in Q2 2023, as further updated on October 20, 2023 as part of OSFI’s implementation of the Basel III reforms. The period ended April 30, 2024 also reflects our adoption of the revised market risk and CVA frameworks that came into effect on November 1, 2023. |
(3) | TLAC available and TLAC ratios are calculated using OSFI’s TLAC guideline. The TLAC standard is applied at the resolution entity level which for us is deemed to be Royal Bank of Canada and its subsidiaries. A resolution entity and its subsidiaries are collectively called a resolution group. The TLAC ratio and TLAC leverage ratio are calculated using the TLAC available as percentage of total RWA and leverage exposure, respectively. |