|
Exhibit 99.1 |
SECOND QUARTER 2021
EARNINGS RELEASE
|
ROYAL BANK OF CANADA REPORTS SECOND QUARTER 2021 RESULTS
|
All amounts are in Canadian dollars and are based on financial statements presented in compliance with International Accounting Standard 34 Interim Financial Reporting, unless otherwise noted. Our Q2 2021 Report to Shareholders and Supplementary Financial Information are available at: http://www.rbc.com/investorrelations.
| Net Income
$4.0 Billion
Up $2.5 Billion YoY
|
Diluted EPS1
$2.76
Up from $1.00 in Q2 2020 |
PCL2
$(96) Million
PCL on loans ratio down 12 bps3 QoQ
|
ROE4
19.4%
Up from 7.3% last year
|
CET1 Ratio
12.8%
Well above regulatory requirements
|
TORONTO, May 27, 2021 – Royal Bank of Canada (RY on TSX and NYSE) today reported net income of $4.0 billion for the quarter ended April 30, 2021, up $2.5 billion from the prior year. Diluted EPS was $2.76, up significantly over the same period. Our results this quarter included releases of provisions on performing loans of $260 million compared to elevated provisions on performing loans of $2.1 billion in the prior year.
Pre-provision, pre-tax earnings5 of $5.1 billion were up 11% from a year ago, mainly reflecting constructive markets and strong volume growth, partially offset by the impact of low interest rates, and higher expenses largely due to higher variable compensation on improved results and higher stock-based compensation. Personal & Commercial Banking and Capital Markets generated solid earnings growth, with Capital Markets reporting record earnings this quarter. Higher results in Wealth Management and Insurance also contributed to the increase. These factors were partially offset by lower results in Investor & Treasury Services.
Compared to last quarter, net income was up $168 million with higher results in Personal & Commercial Banking, Wealth Management and Capital Markets. These results were partially offset by lower earnings in Insurance and Investor & Treasury Services.
The PCL on loans ratio of (5) bps was down 12 bps from last quarter primarily due to lower provisions in Personal & Commercial Banking and Capital Markets, partially offset by higher recoveries in Wealth Management in the prior quarter. The PCL on impaired loans ratio of 11 bps decreased 2 bps from last quarter.
Our capital position remained robust, with a Common Equity Tier 1 (CET1) ratio of 12.8% supporting strong client-driven volume growth and $1.5 billion in common share dividends paid. We also had a strong average Liquidity Coverage Ratio (LCR) of 133%.
|
“I’m tremendously proud of how our employees continue to demonstrate resilience, and bring our Purpose to life to deliver for our clients, communities and shareholders. The strong momentum we’ve achieved in the first half of 2021 reflects our focused strategy to deliver exceptional experiences and create more value for clients. RBC brings this to life through the combination of our powerful scale, strong market share growth, prudent risk management, and significant multi-year investments in talent and technology. While there is reason for optimism as recovery continues to take hold, we know the pandemic’s path forward still poses challenges. We remain firmly committed to helping our clients thrive and communities prosper, and to being an enabler of a more inclusive and sustainable future.” – Dave McKay, RBC President and Chief Executive Officer |
|
| ||||||||
|
Q2 2021 Compared to Q2 2020 |
• Net income of $4,015 million • Diluted EPS of $2.76 • ROE of 19.4% • CET1 ratio of 12.8% |
h 171% h 176% h 1,210 bps h 110 bps |
||||||
|
| ||||||||
|
Q2 2021 Compared to Q1 2021 |
• Net income of $4,015 million • Diluted EPS of $2.76 • ROE of 19.4% • CET1 ratio of 12.8% |
h 4% h 4% h 80 bps h 30 bps |
||||||
|
| ||||||||
|
YTD 2021 Compared to YTD 2020 |
• Net income of $7,862 million • Diluted EPS of $5.42 • ROE of 19.0% |
h 58% h 59% h 650 bps |
||||||
|
| ||||||||
| 1 | Earnings per share (EPS). |
| 2 | Provision for credit losses (PCL). |
| 3 | Basis points (bps). |
| 4 | Return on equity (ROE). This measure does not have a standardized meaning under GAAP. For further information, refer to the Key Performance and non-GAAP measures section on page 3 of this Earnings Release. |
| 5 | Pre-provision, pre-tax earnings is calculated as income before income taxes (Q2 2021: $5,186 million; Q2 2020: $1,738 million) plus PCL (Q2 2021: -$96 million; Q2 2020: $2,830 million). This is a non-GAAP measure. For further information, refer to the Key Performance and non-GAAP measures section on page 3 of this Earnings Release. |
1
|
Personal & Commercial Banking
|
Net income of $1,908 million increased $1,376 million from a year ago, primarily attributable to lower PCL. Pre-provision, pre-tax earnings6 of $2,612 million were up 6% from a year ago, mainly reflecting strong average volume growth of 11% (+16% in deposits and +6% in loans), higher card service revenue, and higher mutual fund distribution fees in Canadian Banking, partially offset by lower spreads.
Compared to last quarter, net income increased $115 million or 6%, primarily due to lower PCL resulting from higher releases of provisions on performing loans in the current quarter. Average volume growth of 1% in Canadian Banking and lower staff-related costs also contributed to the increase. These factors were partially offset by the impact of three less days in the current quarter.
|
Wealth Management
|
Net income of $691 million increased $267 million or 63% from a year ago, primarily due to average loan growth as well as higher average fee-based client assets, reflecting market appreciation and net sales, net of the associated variable compensation. Lower PCL and higher transactional revenue also contributed to the increase. These factors were partially offset by the impact of lower interest rates.
Compared to last quarter, net income increased $42 million or 6%, largely attributable to higher average fee-based client assets, net of the associated variable compensation, lower staff-related costs and higher transactional revenue. These factors were partially offset by unfavourable changes in the fair value of seed capital investments.
|
Insurance
|
Net income of $187 million increased $7 million or 4% from a year ago, mainly due to lower claims costs and the favourable impact of actuarial adjustments. These factors were partially offset by the impact of realized investment gains in the prior year and lower new longevity reinsurance contracts.
Compared to last quarter, net income decreased $14 million or 7%, largely due to lower new longevity reinsurance contracts.
|
Investor & Treasury Services
|
Net income of $120 million decreased $106 million or 47% from a year ago, primarily due to lower funding and liquidity revenue as the prior year benefitted from the impact of interest rate movements and higher gains from the disposition of investment securities. Lower client deposit revenue, largely driven by lower interest rates, also contributed to the decrease.
Compared to last quarter, net income decreased $3 million or 2%, mainly driven by lower funding and liquidity revenue as the prior quarter benefitted from money market opportunities, partially offset by the impact of annual regulatory costs in the prior quarter.
|
Capital Markets
|
Net income of $1,071 million increased $966 million from a year ago, primarily driven by lower PCL, as well as record revenue in Investment Banking. These factors were partially offset by higher taxes reflecting an increase in the proportion of earnings from higher tax rate jurisdictions, and higher compensation on improved results.
Compared to last quarter, net income remained relatively flat as lower PCL and higher debt and equity origination across all regions were offset by lower fixed income trading revenue across all regions driven by reduced client activity, and higher taxes as the prior quarter reflected favourable tax adjustments.
|
Capital, Liquidity and Credit Quality
|
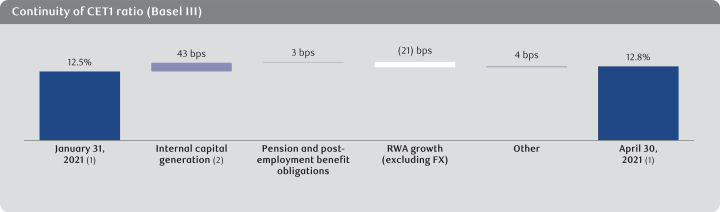
Capital – As at April 30, 2021, our CET1 ratio was 12.8%, up 30 bps from last quarter, mainly reflecting internal capital generation and the impact of higher discount rates in determining our pension and other post-employment benefit obligations, partially offset by risk-weighted assets growth (excluding FX).
In Q3 2021, we expect to reflect model parameter updates to increase the threshold for determining small business clients subject to retail capital treatment, as permitted under regulatory capital requirements, and to recalibrate probability of default parameters for the remaining borrowers in our wholesale portfolio. We expect the implementation of these parameter updates to increase our CET1 ratio
| 6 | Pre-provision, pre-tax earnings is calculated as income before income taxes (Q2 2021: $2,577 million; Q2 2020: $747 million) plus PCL (Q2 2021: $35 million; Q2 2020: $1,706 million). This is a non-GAAP measure. For further information, refer to the Key Performance and non-GAAP measures section on page 3 of this Earnings Release. |
2
by approximately 70-80 bps in Q3 2021. This impact will be partially offset by the increase in stressed Value-at-Risk (SVaR) multipliers effective May 1, 2021, which is expected to decrease our CET1 ratio by approximately 10-15 bps. Both of these estimates are subject to change based on portfolio size or portfolio mix held.
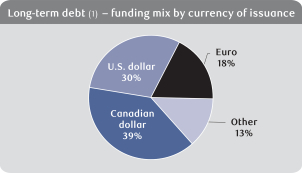
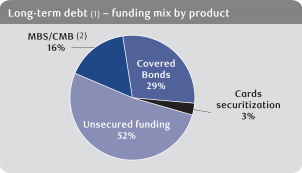
Liquidity – For the quarter ended April 30, 2021, the average LCR was 133%, which translates into a surplus of approximately $89.6 billion, compared to 141% and a surplus of approximately $104.3 billion in the prior quarter. Average LCR decreased from the prior quarter primarily due to lower funding levels as the bank continues to optimize its liquidity position.
Net Stable Funding Ratio (NSFR) as at April 30, 2021 was 118%, which translates into a surplus of approximately $119.0 billion, compared to 118% and a surplus of approximately $122.2 billion in the prior quarter. NSFR has remained stable over the quarter as lower wholesale funding was largely offset by continued growth in client deposits.
Credit Quality
Q2 2021 vs. Q2 2020
Total PCL was $(96) million. PCL on loans of $(83) million decreased $2,817 million from a year ago, primarily due to lower provisions in Personal & Commercial Banking, Capital Markets and Wealth Management. The PCL on loans ratio was (5) bps. The PCL on impaired loans ratio was 11 bps.
PCL on performing loans was $(260) million compared to $2,121 million in the prior year, as the prior year reflected elevated provisions due to the impact of the onset of the COVID-19 pandemic as compared to releases in the current quarter. While uncertainty over the impact of the COVID-19 pandemic remains, the releases were driven by improvements in our macroeconomic and credit quality outlook.
PCL on impaired loans of $177 million decreased $436 million, mainly due to recoveries in Capital Markets in the current quarter as compared to provisions taken in the prior year. Lower provisions in Personal & Commercial Banking and Wealth Management also contributed to the decrease.
Q2 2021 vs. Q1 2021
PCL on loans of $(83) million decreased $204 million from last quarter, primarily due to lower provisions in Personal & Commercial Banking and Capital Markets, partially offset by higher recoveries in Wealth Management in the prior quarter. The PCL on loans ratio of (5) bps decreased 12 bps.
PCL on performing loans of $(260) million decreased $163 million, primarily reflecting higher releases of provisions in Personal & Commercial Banking and Capital Markets. While uncertainty over the impact of the COVID-19 pandemic remains, the releases were driven by improvements in our macroeconomic and credit quality outlook.
PCL on impaired loans of $177 million decreased $41 million, primarily due to recoveries in Capital Markets as compared to provisions in the last quarter and lower provisions in Personal & Commercial Banking, partially offset by recoveries in Wealth Management in the prior quarter.
ACL
The ratio of ACL on loans and acceptances to total loans and acceptances was 79 bps, down 6 bps from last quarter and 5 bps from last year.
|
Digitally Enabled Relationship Bank
|
Digital usage continued to grow with 90-day Active Mobile users increasing 9% from a year ago to 5.3 million, and mobile sessions up 22% from a year ago to 111.6 million. Digital adoption increased to 56.8%, and self-serve transactions increased 150 bps from last year to 93.5%.
Key Performance and Non-GAAP Measures
We measure and evaluate the performance of our consolidated operations and each business segment using a number of financial metrics, such as net income, ROE and non-GAAP measures, including pre-provision, pre-tax earnings. ROE and pre-provision, pre-tax earnings do not have any standardized meanings under GAAP. We use ROE as a measure of return on total capital invested in our business. We believe that certain non-GAAP measures are more reflective of our ongoing operating results and provide readers with a better understanding of management’s perspective on our performance.
Additional information about ROE and other key performance and non-GAAP measures can be found under the Key performance and non-GAAP measures section of our Q2 2021 Report to Shareholders.
3
|
CAUTION REGARDING FORWARD-LOOKING STATEMENTS
|
From time to time, we make written or oral forward-looking statements within the meaning of certain securities laws, including the “safe harbour” provisions of the United States Private Securities Litigation Reform Act of 1995 and any applicable Canadian securities legislation. We may make forward-looking statements in this Earnings Release, in other filings with Canadian regulators or the SEC, in other reports to shareholders, and in other communications, including statements by our President and Chief Executive Officer. Forward-looking statements in this document include, but are not limited to, statements relating to our financial performance objectives, vision and strategic goals, expectations regarding our CET1 ratio, and the potential continued impacts of the coronavirus (COVID-19) pandemic on our business operations, and financial results, condition and objectives and on the global economy and financial market conditions. The forward-looking information contained in this Earnings Release is presented for the purpose of assisting the holders of our securities and financial analysts in understanding our financial position and results of operations as at and for the periods ended on the dates presented, as well as our financial performance objectives, vision and strategic goals, and may not be appropriate for other purposes. Forward-looking statements are typically identified by words such as “believe”, “expect”, “foresee”, “forecast”, “anticipate”, “intend”, “estimate”, “goal”, “plan” and “project” and similar expressions of future or conditional verbs such as “will”, “may”, “should”, “could” or “would”.
By their very nature, forward-looking statements require us to make assumptions and are subject to inherent risks and uncertainties, which give rise to the possibility that our predictions, forecasts, projections, expectations or conclusions will not prove to be accurate, that our assumptions may not be correct and that our financial performance objectives, vision and strategic goals will not be achieved. We caution readers not to place undue reliance on these statements as a number of risk factors could cause our actual results to differ materially from the expectations expressed in such forward-looking statements. These factors – many of which are beyond our control and the effects of which can be difficult to predict – include: credit, market, liquidity and funding, insurance, operational, regulatory compliance (which could lead to us being subject to various legal and regulatory proceedings, the potential outcome of which could include regulatory restrictions, penalties and fines), strategic, reputation, legal and regulatory environment, competitive and systemic risks and other risks discussed in the risk sections and Significant developments: COVID-19 section of our annual report for the fiscal year ended October 31, 2020 (the 2020 Annual Report) and the Risk management and Impact of COVID-19 pandemic sections of our Q2 2021 Report to Shareholders; including business and economic conditions, information technology and cyber risks, Canadian housing and household indebtedness, geopolitical uncertainty, privacy, data and third party related risks, regulatory changes, environmental and social risk (including climate change), and digital disruption and innovation, culture and conduct, the business and economic conditions in the geographic regions in which we operate, the effects of changes in government fiscal, monetary and other policies, tax risk and transparency, and the emergence of widespread health emergencies or public health crises such as pandemics and epidemics, including the COVID-19 pandemic and its impact on the global economy and financial market conditions and our business operations, and financial results, condition and objectives.
We caution that the foregoing list of risk factors is not exhaustive and other factors could also adversely affect our results. When relying on our forward-looking statements to make decisions with respect to us, investors and others should carefully consider the foregoing factors and other uncertainties and potential events. Material economic assumptions underlying the forward-looking statements contained in this Earnings Release are set out in the Economic, market and regulatory review and outlook section and for each business segment under the Strategic priorities and Outlook headings in our 2020 Annual Report, as updated by the Economic, market and regulatory review and outlook and Impact of COVID-19 pandemic sections of our Q2 2021 Report to Shareholders. Except as required by law, we do not undertake to update any forward-looking statement, whether written or oral, that may be made from time to time by us or on our behalf.
Additional information about these and other factors can be found in the risk sections and Significant developments: COVID-19 section of our 2020 Annual Report and the Risk management and Impact of COVID-19 pandemic sections of our Q2 2021 Report to Shareholders.
Information contained in or otherwise accessible through the websites mentioned does not form part of this Earnings Release. All references in this Earnings Release to websites are inactive textual references and are for your information only.
ACCESS TO QUARTERLY RESULTS MATERIALS
Interested investors, the media and others may review this quarterly Earnings Release, quarterly results slides, supplementary financial information and our Q2 2021 Report to Shareholders at rbc.com/investorrelations.
Quarterly conference call and webcast presentation
Our quarterly conference call is scheduled for May 27, 2021 at 8:30 a.m. (EST) and will feature a presentation about our second quarter results by RBC executives. It will be followed by a question and answer period with analysts. Interested parties can access the call live on a listen-only basis at rbc.com/investorrelations/quarterly-financial-statements.html or by telephone (416-340-2217, 866-696-5910, passcode 4691510#). Please call between 8:20 a.m. and 8:25 a.m. (EST).
Management’s comments on results will be posted on our website shortly following the call. A recording will be available by 5:00 p.m. (EST) from May 27, 2021 until August 24, 2021 at rbc.com/investorrelations/quarterly-financial-statements.html or by telephone (905-694-9451 or 800-408-3053, passcode 8026879#).
Media Relations Contact
Gillian McArdle, Senior Director, Communications, Group Risk Management and Finance, gillian.mcardle@rbccm.com, 416-842-4231
Investor Relations Contacts
Nadine Ahn, SVP Wholesale Finance and Investor Relations, nadine.ahn@rbccm.com, 416-974-3355
Asim Imran, Vice President, Investor Relations, asim.imran@rbc.com, 416-955-7804
Marco Giurleo, Senior Director, Investor Relations, marco.giurleo@rbc.com, 416-955-2546
ABOUT RBC
Royal Bank of Canada is a global financial institution with a purpose-driven, principles-led approach to delivering leading performance. Our success comes from the 86,000+ employees who leverage their imaginations and insights to bring our vision, values and strategy to life so we can help our clients thrive and communities prosper. As Canada’s biggest bank, and one of the largest in the world based on market capitalization, we have a diversified business model with a focus on innovation and providing exceptional experiences to our 17 million clients in Canada, the U.S. and 27 other countries. Learn more at rbc.com.
We are proud to support a broad range of community initiatives through donations, community investments and employee volunteer activities. See how at rbc.com/community-social-impact.
Trademarks used in this earnings release include the LION & GLOBE Symbol, ROYAL BANK OF CANADA and RBC which are trademarks of Royal Bank of Canada used by Royal Bank of Canada and/or by its subsidiaries under license. All other trademarks mentioned in this earnings release, which are not the property of Royal Bank of Canada, are owned by their respective holders.
4