Table of Contents
As filed with the Securities and Exchange Commission on September 20, 2013
Registration No. 333-178644
UNITED STATES
SECURITIES AND EXCHANGE COMMISSION
WASHINGTON, D.C. 20549
FORM N-2
(Check Appropriate Box or Boxes)
| x | REGISTRATION STATEMENT UNDER THE SECURITIES ACT OF 1933 |
| ¨ | PRE-EFFECTIVE AMENDMENT NO. |
| x | POST-EFFECTIVE AMENDMENT NO. 2 |
MEDALLION FINANCIAL CORP.
(Exact Name of Registrant as Specified in Charter)
437 Madison Avenue
38th Floor
New York, New York 10022
(Address of Principal Executive Offices)
Registrant’s Telephone Number, including Area Code: (212) 328-2100
Andrew M. Murstein
President
c/o Medallion Financial Corp.
437 Madison Avenue, 38th Floor
New York, New York 10022
(212) 328-2100
(Name and Address of Agent for Service)
Copies of information to:
| Jeffrey Yin, Esq. Chief Compliance Officer and General Counsel Medallion Financial Corp. 437 Madison Avenue, 38th Floor New York, New York 10022 (212) 328-2100 |
Mario M. Cuomo, Esq. Willkie Farr & Gallagher LLP 787 Seventh Avenue New York, NY 10019-6099 (212) 728-8000 |
Approximate Date of Proposed Public Offering: From time to time after the effective date of this Registration Statement.
If any securities being registered on this form will be offered on a delayed or continuous basis in reliance on Rule 415 under the Securities Act of 1933, other than securities offered in connection with a dividend reinvestment plan, check the following box. x
It is proposed that this filing will become effective (check appropriate box):
| x | when declared effective pursuant to section 8(c). |
Table of Contents
The information in this prospectus is not complete and may be changed. We may not sell these securities until the registration statement filed with the Securities and Exchange Commission is effective. This prospectus is not an offer to sell these securities and it is not soliciting an offer to buy these securities in any state where the offer and sale is not permitted.
Subject to Completion September 20, 2013
PRELIMINARY PROSPECTUS
$100,000,000

Common Stock
Preferred Stock
Debt Securities
Subscription Rights
Warrants
We, Medallion Financial Corp. or the Company, are a specialty finance company that has a leading position in originating, acquiring and servicing loans that finance taxicab medallions and various types of commercial businesses. A wholly-owned portfolio company of ours, Medallion Bank, also originates consumer loans for the purchase of recreational vehicles, boats, motorcycles and trailers, and to finance small-scale home improvements. Our core philosophy has been “In niches there are riches.” We try to identify markets that are profitable and where we can be an industry leader. Our investment objectives are to provide a high level of distributable income, consistent with preservation of capital, as well as long-term growth of net asset value and our stock price. These investment objectives may be changed without shareholder approval. We are a closed-end, non-diversified management investment company that has elected to be treated as a business development company under the Investment Company Act of 1940. In addition, we have elected to be treated for tax purposes as a regulated investment company, or RIC, under the Internal Revenue Code of 1986, as amended. As a RIC, provided certain conditions are met, we are not subject to corporate taxes on the amounts we pay as dividends to our shareholders.
We may offer, from time to time, in one or more offerings or series, together or separately, up to $100,000,000 of our common stock, preferred stock, debt securities, subscription rights to purchase shares of our common stock, or warrants representing rights to purchase shares of our common stock, preferred stock or debt securities, which we refer to, collectively, as the “securities.” The preferred stock, debt securities, subscription rights and warrants offered hereby may be convertible or exchangeable into shares of our common stock. The securities may be offered at prices and on terms to be described in one or more supplements to this prospectus. In the event we offer common stock, the offering price per share of our common stock less any underwriting commissions or discounts will generally not be less than the net asset value per share of our common stock at the time we make the offering. However, we may issue shares of our common stock pursuant to this prospectus at a price per share that is less than our net asset value per share (a) in connection with a rights offering to our existing shareholders, (b) with the prior approval of the majority of our common shareholders or (c) under such circumstances as the Securities and Exchange Commission may permit.
Our common stock is traded on the NASDAQ Global Select Market under the symbol “TAXI”. As of September 19, 2013, the last reported sales price on the NASDAQ Global Select Market for our common stock was $14.80 per share.
This prospectus, and the accompanying prospectus supplement, if any, contains important information you should know before investing in our securities. Please read it before you invest and keep it for future reference. We file annual, quarterly and current reports, proxy statements and other information with the Securities and Exchange Commission. This information is available free of charge by contacting us at 437 Madison Avenue, 38th Floor, New York, NY, 10022 or by telephone at 877-MEDALLION or on our website at www.medallion.com. The Securities and Exchange Commission also maintains a website at www.sec.gov that contains such information.
Investing in our securities involves a high degree of risk and is highly speculative. The securities in which we invest will not be rated by any rating agency. If they were, all of them could be rated as below investment grade or “junk.” Indebtedness of below investment grade quality has predominantly speculative characteristics with respect to the issuer’s capacity to pay interest and repay principal. Before buying any securities, you should read the discussion of the material risks of investing in our securities in “Risk Factors” beginning on page 14 of this prospectus.
Neither the Securities and Exchange Commission nor any state securities commission has approved or disapproved of these securities or determined if this prospectus is truthful or complete. Any representation to the contrary is a criminal offense.
This prospectus may not be used to consummate sales of securities unless accompanied by a prospectus supplement.
The date of this prospectus is , 2013.
Table of Contents
You should rely only on the information contained in this prospectus and the accompanying prospectus supplement, if any. We have not authorized anyone to provide you with additional information, or information different from that contained in this prospectus and the accompanying prospectus supplement, if any. If anyone provides you with different or additional information, you should not rely on it. We are offering to sell, and seeking offers to buy, securities only in jurisdictions where offers and sales are permitted. The information contained in this prospectus and the accompanying prospectus supplement, if any, is accurate only as of the date of this prospectus or such prospectus supplement. We will update this prospectus and any supplements to reflect any material changes. Our business, financial condition, results of operations and prospects may have changed since then.
| 1 | ||||
| 5 | ||||
| 6 | ||||
| 8 | ||||
| 11 | ||||
| 12 | ||||
| 14 | ||||
| 30 | ||||
| MANAGEMENT’S DISCUSSION AND ANALYSIS OF FINANCIAL CONDITION AND RESULTS OF OPERATIONS |
31 | |||
| 58 | ||||
| 59 | ||||
| 70 | ||||
| 74 | ||||
| 75 | ||||
| 97 | ||||
| 100 | ||||
| 101 | ||||
| 103 | ||||
| 110 | ||||
| 116 | ||||
| 120 | ||||
| 121 | ||||
| 123 | ||||
| 125 | ||||
| 127 | ||||
| 128 | ||||
| 128 | ||||
| CUSTODIAN, TRANSFER AGENT, DIVIDEND DISBURSING AGENT, AND REGISTRAR |
128 | |||
| 128 | ||||
| F-1 | ||||
| F-2 | ||||
| F-8 | ||||
| F-53 | ||||
| F-54 | ||||
| F-59 | ||||
| F-74 | ||||
| F-80 |
Table of Contents
ABOUT THIS PROSPECTUS
This prospectus is part of a registration statement that we have filed with the Securities and Exchange Commission, or the SEC, using the “shelf” registration process. Under the shelf registration process, we may offer, from time to time, in one or more offerings or series, up to $100,000,000 of our common stock, preferred stock, debt securities, subscription rights to purchase shares of our common stock or warrants representing rights to purchase shares of our common stock, preferred stock or debt securities on terms to be determined at the time of the offering. The securities may be offered at prices and on terms described in one or more supplements to this prospectus. This prospectus provides you with a general description of the securities that we may offer. Each time we use this prospectus to offer securities, we will provide a prospectus supplement that will contain specific information about the terms of that offering. The prospectus supplement may also add, update or change information contained in this prospectus. Please carefully read this prospectus and any prospectus supplement together with any exhibits and the additional information described under the heading “Available Information” and the section under the heading “Risk Factors” before you make an investment decision.
Table of Contents
This summary highlights some of the information in this prospectus. It is not complete and may not contain all of the information that you may want to consider. You should read carefully the more detailed information set forth under “Risk Factors” and the other information included in this prospectus. In this prospectus and any accompanying prospectus supplement, except where the context suggests otherwise, the terms “we”, “us” and “our” refer to Medallion Financial Corp.
Overview
We are a specialty finance company that has a leading position in originating, acquiring and servicing loans that finance taxicab medallions and various types of commercial businesses. A wholly-owned portfolio company of ours, Medallion Bank, also originates consumer loans for the purchase of recreational vehicles, boats, motorcycles and trailers, and to finance small-scale home improvements. Our investment objectives are to provide a high level of distributable income, consistent with preservation of capital, as well as long-term growth of net asset value and our stock price. These investment objectives may be changed without shareholder approval. Since 1996, the year in which we became a public company, through June 30, 2013, we have increased our taxicab medallion loan portfolio at a compound annual growth rate of 5%, and our commercial loan portfolio at a compound annual growth rate of 2% (10% and 7% on a managed basis when combined with Medallion Bank). Since Medallion Bank acquired a consumer loan portfolio and began originating consumer loans in 2004, it has increased its consumer loan portfolio at a compound annual growth rate of 15%. Total assets under our management and the management of our unconsolidated wholly-owned subsidiaries, which includes assets serviced for third party investors, were approximately $1.26 billion as of June 30, 2013 and $1.22 billion as of December 31, 2012, and have grown at a compound rate of 11% from approximately $215.0 million at the end of 1996.
Our managed net investment portfolio was comprised of managed medallion loans of approximately $637,054,000, or 58%, as of June 30, 2013 and approximately $630,603,000, or 60%, as of December 31, 2012 and other managed commercial loans of approximately $120,979,000, or 11%, as of June 30, 2013 and approximately $126,056,000, or 12%, as of December 31, 2012. Consumer loans originated by Medallion Bank of $307,346,000 and $258,933,000 comprised 28% and 25% of the managed net investment portfolio as of June 30, 2013 and December 31, 2012, respectively. For more information, see “Business—Overview.”
Management
We have assembled a management team which has extensive experience in our lines of business. Alvin Murstein, our Chairman and Chief Executive Officer, has over 50 years of experience in the ownership, management and financing of taxicab medallions. Andrew M. Murstein, our President, is the third generation in his family to be active in the business and has over 25 years of experience in the ownership, management and financing of taxicab medallions. In addition to our medallion loan experience, our Chief Operating and Credit Officer has over 35 years of commercial banking experience, our Chief Financial Officer has over 30 years of finance company experience, and the head of our commercial lending area has over 35 years of commercial banking experience. For more information, see “Management.”
Strategy
Our core philosophy has been “In niches there are riches.” We try to identify markets that are profitable and where we can be an industry leader. Key elements of our strategy include capitalizing on our relationships with customers and brokers and dealers, employing disciplined underwriting policies and maintaining rigorous portfolio monitoring, leveraging the skills of our experienced management team and performing strategic acquisitions. Investments in our portfolio companies are not rated by any of the public ratings agencies, but if
1
Table of Contents
they were, all of them could be rated below “investment grade.” Our portfolio companies may have limited access to capital, higher funding costs, abrupt business cycles, and intense competition. These factors could impair their cash flow or result in other events, such as bankruptcy, that could limit their ability to repay their obligations to us and may materially adversely affect the return on, or the recovery of, our investments in their businesses. For more information, see “Business—Our Strategy.”
Structure
We are a closed-end, non-diversified management investment company that has elected to be treated as a business development company under the Investment Company Act of 1940, or the 1940 Act. For more information on our organizational structure, see “Our Structure” and “Business—Overview.”
In addition, we have elected to be treated for tax purposes as a regulated investment company, or RIC, under the Internal Revenue Code of 1986, as amended, or the Code. As a RIC, we will not be subject to U.S. federal income tax on any investment company taxable income (which includes, among other things, dividends and interest reduced by deductible expenses) that we distribute to our shareholders if at least 90% of our investment company taxable income for that taxable year is distributed. We intend to pay quarterly cash dividends to comply with this requirement. Shareholders can elect to reinvest distributions. For more information, see “Material U.S. Federal Income Tax Considerations.”
Medallion Loans
Medallion loans of approximately $637,054,000 and $630,603,000 comprised 58% and 60% of our managed net investment portfolio, as of June 30, 2013 and December 31, 2012. Since 1979 through June 30, 2013, we and Medallion Bank have originated, on a combined basis, over approximately $3,159,368,000 medallion loans in New York City, Chicago, Boston, Newark, Cambridge and other cities within the United States.
Based on taxi medallion values published by the New York City Taxi and Limousine Commission, or TLC, we estimate that the total value of all the New York City taxicab medallions and related assets such as the vehicle, taximeter and roof lights exceeds $15.1 billion as of June 30, 2013 and $13.5 billion as of December 31, 2012. We estimate that the total value of all taxicab medallions and related assets in the U.S. exceeds $19.0 billion and $17.5 billion as of June 30, 2013 and December 31, 2012. We believe that we will continue to develop growth opportunities by further penetrating the highly fragmented medallion financing markets. In the future, we may enhance our portfolio growth rate with selective acquisitions of medallion financing businesses and their related portfolios. Since our initial public offering in May 1996, we have acquired several additional medallion loan portfolios.
Our medallion loan portfolio is comprised mostly of fixed-rate loans, collateralized by first security interests in taxicab medallions and related assets. Approximately 70% and 71% of the principal amount of our medallion loans were in New York City as of June 30, 2013 and December 31, 2012. Although some of our medallion loans have from time to time been in arrears or in default, our loss experience on medallion loans has been immaterial. We estimate that the average loan-to-value ratio of all of our medallion loans was approximately 40% as of June 30, 2013 and December 31, 2012. In addition, we have recourse against a vast majority of the owners of the taxicab medallions and related assets through personal guarantees. For more information, see “Business—Medallion Loans.”
2
Table of Contents
Commercial Loans
Commercial loans of approximately $120,979,000 and $126,056,000 comprised 11% and 12% of our managed net investment portfolio, as of June 30, 2013 and December 31, 2012. From the inception of our commercial loan business in 1987 through June 30, 2013, we and Medallion Bank have originated more than 10,347 commercial loans in an aggregate principal amount of approximately $834,578,000. Our commercial loan portfolio consists of floating-rate, adjustable, and fixed-rate loans. We have increased our commercial loan activity in recent years primarily because of the attractive higher-yielding, floating-rate nature of this type of lending. We focus our marketing efforts on the manufacturing, wholesale trade, administrative and support services and accommodation and food services industries with the portfolio concentrated in the manufacturing industry. The majority of our commercial borrowers are located in the New York metropolitan area, the Midwest region and Florida. For more information regarding the geographic and industry concentrations of the portfolio, see “Portfolio Companies.” We plan to continue to expand our commercial loan activities to develop a more diverse borrower base and a wider geographic area of coverage, as well as to expand our targeted industries.
Our commercial loans generally are secured by equipment, accounts receivable, real estate and other assets, and have interest rates averaging 495 basis points over the prevailing prime rate. As with our medallion loans, we require the vast majority of the principals of borrowers to personally guarantee commercial loans. Our aggregate realized loss of principal on commercial loans has averaged 1.07% per annum for the last five years. The commercial loans originated by our SBIC subsidiaries are made to qualifying small businesses as defined by applicable SBA regulations and all of our commercial loans are made to eligible portfolio companies.
We originate the following types of commercial loans:
Asset-Based Loans. We originate, manage and service asset-based loans to small businesses for working capital through our Medallion Business Credit division. These commercial loans are generally secured principally by the borrower’s accounts receivable, but may also be secured by inventory, machinery, equipment, and/or real estate, and are personally guaranteed by the principals. Currently, our clients are mostly located in the New York metropolitan area, and include wholesale and retail trade, transportation and warehousing, and other industrial and services businesses. The loans generally range in size from $500,000 to $5,000,000. These loans comprised 52% and 54%, or approximately $69,041,000 and $73,542,000, of our managed commercial loan portfolio as of June 30, 2013 and December 31, 2012, respectively.
Secured Mezzanine Loans. Through our subsidiary, Medallion Capital, Inc., or Medallion Capital, we originate primarily secured mezzanine loans to businesses in a variety of industries, including radio and television stations, airport food service operations and various manufacturing concerns, about a third of which are located in the upper Midwest and Great Lakes region, with the rest scattered across the country. These mezzanine loans are primarily secured by a second position on all assets of the businesses and generally range in amounts from $1,000,000 to $5,000,000. Frequently, we receive warrants to purchase an equity interest in the companies to which we provide secured mezzanine loans. These loans comprised 36% and 37%, or approximately $48,200,000 and $49,456,000 of our managed commercial loan portfolio as of June 30, 2013 and December 31, 2012, respectively.
Other Secured Commercial Loans. We originate, primarily through our subsidiary, Freshstart Venture Capital Corp., or Freshstart, other commercial loans that are focused on food service, real estate, dry cleaner and laundromat businesses, which are typically located within 200 miles of New York City. These commercial loans are generally secured by all of the assets of the businesses and are generally personally guaranteed by the principals. Frequently, we receive assignments of lease from our borrowers. The loans generally range in size from under $100,000 to approximately $3,000,000. These loans, which are generally fixed-rate loans, comprised 12% and 9%, or approximately $15,082,000 and $11,946,000 of our managed commercial loan portfolio as of June 30, 2013 and December 31, 2012, respectively. For more information, see “Business—Commercial Loans.”
3
Table of Contents
Consumer Loans
Consumer loans are originated by Medallion Bank, a wholly-owned, unconsolidated portfolio company. Consumer loans of approximately $307,346,000 and $258,933,000 represented 28% and 25% of our managed net investment portfolio as of June 30, 2013 and December 31, 2012, respectively. Recreational vehicles, boats, motorcycles, trailers and home improvements located in all 50 states collateralize the loans. The portfolio is serviced by a third party consumer loan servicer. For more information, see “Business—Consumer Loans.”
Interest Rate Sensitivity
We, like other financial institutions, are subject to interest rate risk to the extent that our interest-earning assets (consisting of medallion, commercial, and consumer loans; and investment securities) reprice on a different basis over time in comparison to our interest-bearing liabilities (consisting primarily of credit facilities with banks and other lenders, bank certificates of deposit, and SBA debentures). The effect of changes in interest rates is mitigated by regular turnover of the portfolio. We seek to manage interest rate risk by originating adjustable-rate loans, by incurring fixed-rate indebtedness, by evaluating appropriate derivatives, pursuing securitization opportunities, and by other options consistent with managing interest rate risk. For more information on our interest rate risk, see “Management’s Discussion and Analysis of Financial Condition and Results of Operations—Asset/Liability Management—Interest Rate Sensitivity.”
Sources of Funds
We have historically funded our lending operations primarily through credit facilities with bank syndicates and, to a lesser degree, through fixed-rate, senior secured notes and long-term subordinated debentures issued to or guaranteed by the Small Business Administration, or the SBA. Since the inception of Medallion Bank, a Federal Deposit Insurance Corporation, or FDIC, insured Utah industrial bank, substantially all of Medallion Bank’s funding has been provided by FDIC-insured brokered certificates of deposit. The determination of funding sources is established by our management, based upon an analysis of the respective financial and other costs and burdens associated with funding sources. Our funding strategy and interest rate risk management strategy seeks to have the proper structuring of debt to minimize both rate and maturity risk, while maximizing returns with the lowest cost of funding over an intermediate period of time. Our objective is to have a good mix of both fixed and floating rate debt and to maximize our interest rate spreads. For more information, see “Business—Source of Funds.”
Determination of Net Asset Value
The net asset value per share of our common stock is determined by dividing the total shareholders’ equity by the total number of our shares of common stock outstanding at that date.
In calculating the value of our total assets, we value investments for which market quotations are readily available at such market quotations. A significant portion of our debt and equity securities are not publicly traded or their market price is not readily available. These securities are valued at fair value as determined in good faith by our Board of Directors under a valuation policy and a consistently applied valuation process, and involves subjective judgment. Because such valuations, and particularly valuations of private securities and private companies, are inherently uncertain, the valuations may fluctuate over short periods of time and may be based on estimates. As a result, our determinations of fair value may differ materially from the values that would have been used if a ready market for these investments existed. Our net asset value could be adversely affected if our determinations regarding the fair value of our investments were materially higher than the values that we ultimately realize upon the disposal of such securities. For more information, see “Determination of Net Asset Value” and “Risk Factors—Risks Relating to Our Business and Structure—Our investment portfolio is, and will
4
Table of Contents
continue to be, recorded at fair value as determined in good faith by our Board of Directors and, as a result, there is, and will continue to be, uncertainty as to the value of our portfolio investments which could adversely affect our net asset value.”
Dividend Reinvestment Plan
We have adopted a dividend reinvestment plan that provides for reinvestment of our dividend distributions on behalf of our shareholders who elect to participate in the plan. As a result, if our Board of Directors authorizes, and we declare, a cash dividend, then our shareholders who have opted into our dividend reinvestment plan will have their cash dividends automatically reinvested in additional shares of our common stock, rather than receiving the cash dividends. A registered shareholder must notify our transfer agent in writing if they wish to participate in the dividend reinvestment plan. For more information, see “Dividend Reinvestment Plan.”
Corporate Information
Our administrative and executive offices are located at 437 Madison Avenue, 38th Floor, New York, New York 10022, telephone number (212) 328-2100. Our common stock is quoted on the NASDAQ Global Select Market, or NASDAQ, under the symbol “TAXI” and our website is www.medallion.com.
We have filed with the SEC a registration statement on Form N-2 (file number 333-178644), together with all amendments and related exhibits, under the Securities Act of 1933, as amended, with respect to our securities offered by this prospectus. The registration statement contains additional information about us and the securities being offered by this prospectus.
We file with or submit to the SEC annual, quarterly and current periodic reports, proxy statements and other information meeting the informational requirements of the Securities Exchange Act of 1934 as amended. You may read and copy these reports, proxy statements and other information, as well as the registration statement and related exhibits and schedules, at the Public Reference Room of the SEC at 100 F Street, NE, Washington, D.C. 20549. You may obtain information on the operation of the Public Reference Room by calling the SEC at 1-800-SEC-0330. The SEC maintains an Internet site that contains reports, proxy and information statements and other information filed electronically by us with the SEC which are available on the SEC’s Internet site at http://www.sec.gov.
5
Table of Contents
The following table is intended to assist you in understanding the costs and expenses that an investor in shares of our common stock will bear directly or indirectly. We caution you that some of the percentages indicated in the table below are estimates and may vary. Except where the context suggests otherwise, whenever this prospectus contains a reference to fees or expenses paid by “you” or “us”, or that “we” will pay fees or expenses, shareholders will indirectly bear such fees or expenses as our investors.
| Shareholder Transaction Expenses |
||||
| Sales Load (as a percentage of offering price)(1) |
— | % | ||
| Dividend Reinvestment Plan Fees(2) |
None | |||
| Annual Expenses (as a percentage of average net assets attributable to common stock)(3) |
||||
| Operating Expenses(4)(5) |
7.01 | % | ||
| Interest Payments on Borrowed Funds(6) |
5.50 | % | ||
|
|
|
|||
| Total Annual Expenses(7) |
12.51 | % | ||
|
|
|
| (1) | In the event that shares of our common stock to which this prospectus relates are sold to or through underwriters, a corresponding prospectus supplement will disclose the applicable sales load. |
| (2) | The expenses associated with the administration of our dividend reinvestment plan are included in “Operating Expenses.” The participants in our dividend reinvestment plan will pay a pro rata share of brokerage commissions incurred with respect to open market purchases, if any, made by the administrator under the plan. For more details about the plan, see “Dividend Reinvestment Plan.” |
| (3) | “Average net assets attributable to common stock” are estimated for the current fiscal year, taking into account the anticipated net proceeds from offerings of common stock, which are based on the average total shareholder’s equity of $197,504,000 for the fiscal year ended December 31, 2012. |
| (4) | “Operating Expenses” are estimated for the current fiscal year, which are based on the annualized operating expenses for the fiscal year ended December 31, 2012. |
| (5) | We do not have an investment adviser and are internally managed by our executive officers under the supervision of our Board of Directors. As a result, we do not pay investment advisory fees, but instead we pay the operating costs associated with employing investment management professionals. |
| (6) | “Interest Payments on Borrowed Funds” are estimated for the current fiscal year, which are based on the annualized interest expense for the fiscal year ended December 31, 2012. |
| (7) | “Total Annual Expenses” is the sum of the Operating Expenses and Interest Expense. This figure is higher than the same amount would be for a company that is not leveraged. We borrow money to leverage our shareholders’ equity and increase our total assets. The SEC requires us to calculate the Total Annual Expenses percentage as a percentage of consolidated average net assets, rather than the consolidated average total assets, including assets that have been funded with borrowed monies. |
Example
The following example demonstrates the projected dollar amount of total cumulative expenses that would be incurred over various periods with respect to a hypothetical investment in our common stock. In calculating the following expense amounts, we have assumed that the annual expenses, including leverage, would remain the same each year at the levels set forth in the table above. In the event that shares to which this prospectus relates are sold to or through agents, underwriters or dealers, a corresponding prospectus supplement will restate this example to reflect the applicable sales load.
| 1 year | 3 years | 5 years | 10 years | |||||||||||||
| You would pay the following expenses on a $1,000 investment, assuming a 5% annual return |
$ | 120 | $ | 335 | $ | 518 | $ | 869 | ||||||||
6
Table of Contents
While the example assumes, as required by the SEC, a 5% annual return, our performance will vary and may result in a return greater or less than 5%. While the example assumes reinvestment of all dividends and distributions at net asset value, participants in our dividend reinvestment plan will receive a number of shares of our common stock, determined by dividing the total dollar amount of the dividend payable to a participant by the market price per share of our common stock at the close of trading on the valuation date for the dividend.
This example and the expenses in the table above should not be considered a representation of our future expenses, and actual expenses (including the cost of debt, if any, and other expenses) may be greater or less than those shown.
7
Table of Contents
SELECTED CONDENSED CONSOLIDATED FINANCIAL DATA
You should read the condensed consolidated financial information below with the Consolidated Financial Statements and Notes thereto included elsewhere in this prospectus. See “Management’s Discussion and Analysis of Financial Condition and Results of Operations” and our Consolidated Financial Statements for more information.
You should read the consolidated financial information below with the Consolidated Financial Statements and Notes thereto for the six months ended June 30, 2013 and 2012 the years ended December 31, 2012, 2011, 2010, 2009 and 2008.
| Six months ended June 30, (unaudited) |
Year ended December 31, | |||||||||||||||||||||||||||
|
(Dollars in thousands, except per share data) |
2013 | 2012 | 2012 | 2011 | 2010 | 2009 | 2008 | |||||||||||||||||||||
| Statement of operations |
||||||||||||||||||||||||||||
| Investment income |
$ | 15,789 | $ | 15,927 | $ | 32,344 | $ | 37,227 | $ | 37,253 | $ | 41,403 | $ | 52,284 | ||||||||||||||
| Interest expense |
4,187 | 6,155 | 10,858 | 13,538 | 14,585 | 16,876 | 23,711 | |||||||||||||||||||||
|
|
|
|
|
|
|
|
|
|
|
|
|
|
|
|||||||||||||||
| Net interest income |
11,602 | 9,772 | 21,486 | 23,689 | 22,668 | 24,527 | 28,573 | |||||||||||||||||||||
| Noninterest income |
623 | 677 | 1,135 | 1,185 | 3,533 | 3,383 | 3,837 | |||||||||||||||||||||
| Operating expenses(1) |
8,020 | 7,046 | 13,856 | 14,111 | 16,328 | 19,730 | 17,320 | |||||||||||||||||||||
|
|
|
|
|
|
|
|
|
|
|
|
|
|
|
|||||||||||||||
| Net investment income before income taxes |
4,205 | 3,403 | 8,765 | 10,763 | 9,873 | 8,180 | 15,090 | |||||||||||||||||||||
| Income tax (provision) benefit |
— | — | — | — | — | — | — | |||||||||||||||||||||
|
|
|
|
|
|
|
|
|
|
|
|
|
|
|
|||||||||||||||
| Net investment income after income taxes |
4,205 | 3,403 | 8,765 | 10,763 | 9,873 | 8,180 | 15,090 | |||||||||||||||||||||
| Net realized gains (losses) on investments |
81 | 265 | (6,731 | ) | (546 | ) | (7,638 | ) | (4,135 | ) | (3,746 | ) | ||||||||||||||||
| Net change in unrealized appreciation (depreciation) on Medallion Bank and other controlled subsidiaries(2) |
1,906 | 3,867 | 7,896 | 7,668 | 12,535 | (5,671 | ) | (2,419 | ) | |||||||||||||||||||
| Net change in unrealized appreciation (depreciation) on investments(2) |
6,529 | 3,847 | 14,587 | 1,278 | (3,491 | ) | 2,648 | 6,323 | ||||||||||||||||||||
|
|
|
|
|
|
|
|
|
|
|
|
|
|
|
|||||||||||||||
| Net increase in net assets resulting from operations |
$ | 12,721 | $ | 11,382 | $ | 24,517 | $ | 19,163 | $ | 11,279 | $ | 1,022 | $ | 15,248 | ||||||||||||||
|
|
|
|
|
|
|
|
|
|
|
|
|
|
|
|||||||||||||||
| Per share data |
||||||||||||||||||||||||||||
| Net investment income |
$ | 0.19 | $ | 0.18 | $ | 0.43 | $ | 0.61 | $ | 0.56 | $ | 0.46 | $ | 0.85 | ||||||||||||||
| Income tax (provision) benefit |
— | — | — | — | — | — | — | |||||||||||||||||||||
| Net realized gains (losses) on investments |
— | 0.02 | (0.33 | ) | (0.03 | ) | (0.43 | ) | (0.23 | ) | (0.21 | ) | ||||||||||||||||
| Net change in unrealized appreciation (depreciation) on investments(2) |
0.39 | 0.41 | 1.11 | 0.51 | 0.51 | (0.17 | ) | 0.22 | ||||||||||||||||||||
|
|
|
|
|
|
|
|
|
|
|
|
|
|
|
|||||||||||||||
| Net increase in net assets resulting from operations |
$ | 0.58 | $ | 0.61 | $ | 1.21 | $ | 1.09 | $ | 0.64 | $ | 0.06 | $ | 0.86 | ||||||||||||||
|
|
|
|
|
|
|
|
|
|
|
|
|
|
|
|||||||||||||||
| Dividends declared per share |
$ | 0.44 | $ | 0.42 | $ | 0.85 | $ | 0.74 | $ | 0.61 | $ | 0.72 | $ | 0.76 | ||||||||||||||
|
|
|
|
|
|
|
|
|
|
|
|
|
|
|
|||||||||||||||
| Weighted average common shares outstanding |
||||||||||||||||||||||||||||
| Basic |
21,527,912 | 18,505,127 | 19,912,883 | 17,426,097 | 17,501,414 | 17,569,688 | 17,520,966 | |||||||||||||||||||||
| Diluted |
21,890,556 | 18,753,671 | 20,180,694 | 17,659,831 | 17,631,928 | 17,691,437 | 17,722,575 | |||||||||||||||||||||
|
|
|
|
|
|
|
|
|
|
|
|
|
|
|
|||||||||||||||
| Balance sheet data |
||||||||||||||||||||||||||||
| Net investments |
$ | 460,340 | $ | 426,471 | $ | 455,010 | $ | 451,835 | $ | 483,516 | $ | 475,133 | $ | 570,597 | ||||||||||||||
| Total assets |
571,746 | 512,213 | 543,465 | 537,031 | 550,312 | 555,174 | 646,685 | |||||||||||||||||||||
| Total funds borrowed |
342,698 | 294,578 | 322,770 | 357,779 | 380,532 | 382,522 | 462,650 | |||||||||||||||||||||
| Total liabilities |
348,404 | 300,538 | 327,147 | 365,527 | 387,547 | 392,197 | 471,739 | |||||||||||||||||||||
| Total shareholders’ equity |
223,342 | 211,675 | 216,318 | 171,504 | 162,765 | 162,977 | 174,946 | |||||||||||||||||||||
|
|
|
|
|
|
|
|
|
|
|
|
|
|
|
|||||||||||||||
8
Table of Contents
| Six months ended June 30, (unaudited) |
Year ended December 31, | |||||||||||||||||||||||||||
|
(Dollars in thousands, except per share data) |
2013 | 2012 | 2012 | 2011 | 2010 | 2009 | 2008 | |||||||||||||||||||||
| Managed balance sheet data(3) |
||||||||||||||||||||||||||||
| Net investments |
$ | 1,100,518 | $ | 976,360 | $ | 1,048,635 | $ | 956,626 | $ | 946,343 | $ | 846,542 | $ | 922,007 | ||||||||||||||
| Total assets |
1,242,599 | 1,090,513 | 1,174,124 | 1,080,239 | 1,041,729 | 950,909 | 1,018,114 | |||||||||||||||||||||
| Total funds borrowed |
985,169 | 844,060 | 924,921 | 872,108 | 849,489 | 754,241 | 829,058 | |||||||||||||||||||||
| Total liabilities |
1,019,257 | 878,838 | 957,806 | 908,735 | 878,964 | 787,932 | 843,168 | |||||||||||||||||||||
|
|
|
|
|
|
|
|
|
|
|
|
|
|
|
|||||||||||||||
| Selected financial ratios and other data |
||||||||||||||||||||||||||||
| Return on average assets (ROA)(4)(13) |
||||||||||||||||||||||||||||
| Net investment income after taxes |
1.55 | % | 1.30 | % | 1.68 | % | 2.01 | % | 1.82 | % | 1.36 | % | 2.27 | % | ||||||||||||||
| Net increase in net assets resulting from operations |
4.69 | 4.36 | 4.69 | 3.57 | 2.08 | 0.17 | 2.29 | |||||||||||||||||||||
| Return on average equity (ROE)(5)(13) |
||||||||||||||||||||||||||||
| Net investment income after taxes |
3.87 | 3.72 | 4.44 | 6.46 | 6.11 | 4.74 | 8.67 | |||||||||||||||||||||
| Net increase in net assets resulting from operations |
11.72 | 12.45 | 12.41 | 11.49 | 6.98 | 0.59 | 8.76 | |||||||||||||||||||||
|
|
|
|
|
|
|
|
|
|
|
|
|
|
|
|||||||||||||||
| Weighted average yield |
6.98 | % | 7.29 | % | 7.37 | % | 8.01 | % | 7.91 | % | 7.77 | % | 8.58 | % | ||||||||||||||
| Weighted average cost of funds |
1.85 | 2.82 | 2.48 | 2.91 | 3.10 | 3.17 | 3.89 | |||||||||||||||||||||
|
|
|
|
|
|
|
|
|
|
|
|
|
|
|
|||||||||||||||
| Net interest margin(6) |
5.13 | 4.47 | 4.89 | 5.10 | 4.81 | 4.60 | 4.69 | |||||||||||||||||||||
|
|
|
|
|
|
|
|
|
|
|
|
|
|
|
|||||||||||||||
| Noninterest income ratio(7)(13) |
0.28 | % | 0.31 | % | 0.26 | 0.26 | 0.75 | 0.63 | 0.63 | |||||||||||||||||||
| Total expense ratio(1)(8)(9)(13) |
5.39 | 6.04 | 5.63 | 5.95 | 6.56 | 6.87 | 6.74 | |||||||||||||||||||||
| Operating expense ratio(1)(9)(13) |
3.54 | 3.22 | 3.16 | 3.04 | 3.47 | 3.70 | 2.84 | |||||||||||||||||||||
|
|
|
|
|
|
|
|
|
|
|
|
|
|
|
|||||||||||||||
| As of June 30, (unaudited) |
As of December 31, | |||||||||||||||||||||||||||
| 2013 | 2012 | 2012 | 2011 | 2010 | 2009 | 2008 | ||||||||||||||||||||||
| As a percentage of net investment portfolio |
||||||||||||||||||||||||||||
| Medallion loans |
64 | % | 65 | % | 65 | % | 68 | % | 67 | % | 68 | % | 70 | % | ||||||||||||||
| Commercial loans |
13 | 12 | 12 | 12 | 16 | 16 | 16 | |||||||||||||||||||||
| Investment in subsidiaries |
22 | 21 | 22 | 19 | 16 | 15 | 13 | |||||||||||||||||||||
| Equity investments |
1 | 1 | 1 | 1 | 1 | 1 | 1 | |||||||||||||||||||||
| Investment securities |
— | — | — | — | — | — | — | |||||||||||||||||||||
|
|
|
|
|
|
|
|
|
|
|
|
|
|
|
|||||||||||||||
| Investments to assets(10) |
81 | % | 83 | % | 84 | % | 84 | % | 88 | % | 86 | % | 88 | % | ||||||||||||||
| Equity to assets(11) |
39 | 41 | 40 | 32 | 30 | 29 | 27 | |||||||||||||||||||||
| Debt to equity(12) |
153 | 139 | 149 | 209 | 234 | 235 | 264 | |||||||||||||||||||||
|
|
|
|
|
|
|
|
|
|
|
|
|
|
|
|||||||||||||||
| (1) | Includes $1,312 of expense reversals related to the costs of winding up the operations of Sports Properties Acquisition Corp., or SPAC, and National Security Solutions Inc., or SPAC 2, in 2010 that were reclassified to realized losses on investments, and $310 that was reversed as a result of favorable negotiations with the creditors of SPAC. Also includes $1,622 of charges in 2009 related to winding up the operations of the SPAC’s. Excluding these amounts, the total expense ratios were 6.91% and 6.56%, and the operating expense ratios were 3.81% and 3.40% for 2010 and 2009. |
| (2) | Unrealized appreciation (depreciation) on investments represents the increase (decrease) for the year in the fair value of our investments, including the results of operations for Medallion Bank and other controlled subsidiaries, where applicable. |
| (3) | Includes the balances of wholly-owned, unconsolidated portfolio companies, primarily Medallion Bank. |
| (4) | ROA represents the net investment income after taxes or net increase in net assets resulting from operations, divided by average total assets. |
| (5) | ROE represents the net investment income after taxes or net increase in net assets resulting from operations, divided by average shareholders’ equity. |
9
Table of Contents
| (6) | Net interest margin represents net interest income for the year divided by average interest earning assets, and included interest recoveries and bonuses of $35 and $294 in the six months ended June 30, 2013 and 2012 and $444 in 2012, $4,070 in 2011, $2,678 in 2010, $1,684 in 2009, and $4,471 in 2008, and also included dividends from Medallion Bank of $10,500 in 2012, $5,500 in 2011, $4,000 in 2010, $4,000 in 2009, and $6,000 in 2008. On a managed basis, combined with Medallion Bank, the net interest margin was 6.32% and 6.18% for the six months ended June 30, 2013 and 2012 and was 6.31%, 6.68%, 6.59%, 6.10%, and 5.21% for 2012, 2011, 2010, 2009, and 2008. |
| (7) | Noninterest income ratio represents noninterest income divided by average interest earning assets. |
| (8) | Total expense ratio represents total expenses (interest expense, operating expenses, and income taxes) divided by average interest earning assets. |
| (9) | Operating expense ratio represents operating expenses divided by average interest earning assets. |
| (10) | Represents net investments divided by total assets as of the period indicated. |
| (11) | Represents total shareholders’ equity divided by total assets as of the period indicated. |
| (12) | Represents total funds borrowed divided by total shareholders’ equity as of the period indicated. |
| (13) | In December 2010, Medallion Servicing Corp., or MSC, assumed our servicing obligations, and as a result, servicing fee income of $6,066 and $5,492 and operating expenses of $6,359 and $5,659, which formally were ours were now MSC’s for the years ended December 31, 2012 and 2011. Excluding the impact of the MSC amounts, the 2012 ROA and ROE on net investment income after taxes were 1.62% and 4.29%, and the noninterest income, total expense, and operating expense ratios were 1.64%, 7.08%, and 4.60%; and the comparable amounts for 2011 were 1.98%, 6.36%, 1.44%, 7.17%, and 4.26%. |
| 2013 | 2012 | 2011 | ||||||||||||||||||||||||||||||||||||||
| (In thousands except per share |
Qtr 2 | Qtr 1 | Qtr 4 | Qtr 3 | Qtr 2 | Qtr 1 | Qtr 4 | Qtr 3 | Qtr 2 | Qtr 1 | ||||||||||||||||||||||||||||||
| Quarterly Data (unaudited) |
||||||||||||||||||||||||||||||||||||||||
| Total investment income |
$ | 7,543 | $ | 8,245 | $ | 9,270 | $ | 7,147 | $ | 8,064 | $ | 7,863 | $ | 11,188 | $ | 8,029 | $ | 8,413 | $ | 9,597 | ||||||||||||||||||||
| Net investment income before income taxes |
1,742 | 2,463 | 4,024 | 1,337 | 1,793 | 1,611 | 5,067 | 1,376 | 1,479 | 2,841 | ||||||||||||||||||||||||||||||
| Net increase in net assets resulting from operations |
6,249 | 6,472 | 6,523 | 6,611 | 5,917 | 5,466 | 5,632 | 4,835 | 4,416 | 4,280 | ||||||||||||||||||||||||||||||
| Diluted earnings per common share |
0.28 | 0.30 | 0.30 | 0.31 | 0.30 | 0.30 | 0.32 | 0.27 | 0.25 | 0.24 | ||||||||||||||||||||||||||||||
| Dividends declared per common share |
0.22 | 0.22 | 0.22 | 0.21 | 0.21 | 0.21 | 0.20 | 0.19 | 0.18 | 0.17 | ||||||||||||||||||||||||||||||
| Net asset value per common share |
10.17 | 10.08 | 9.99 | 9.96 | 9.87 | 9.71 | 9.68 | 9.59 | 9.49 | 9.41 | ||||||||||||||||||||||||||||||
10
Table of Contents
Our Structure
Below is our organizational structure reflecting our consolidated and unconsolidated subsidiaries.
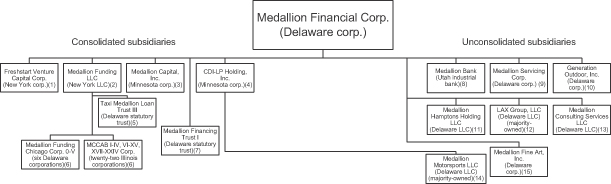
| (1) | An SBIC and a RIC which originates and services taxicab medallion and commercial loans. |
| (2) | An SBIC which is our primary taxicab medallion lending company. |
| (3) | An SBIC and a RIC which conducts a mezzanine financing business. |
| (4) | Formed for the purpose of holding and managing equity investments in a racing team, an equipment manufacturing business and an airport and food retail business. |
| (5) | Formed for the purpose of owning taxicab medallion loans originated by Medallion Funding. |
| (6) | Formed for purpose of owning and leasing repossessed Chicago taxicab medallions. |
| (7) | Formed for the purpose of issuing unsecured preferred securities to investors. |
| (8) | A Utah industrial bank regulated by the FDIC and the Utah Department of Financial Institutions which originates taxicab medallion, commercial, and consumer loans, raises deposits, and conducts other banking activities. |
| (9) | Formed for the purpose of conducting loan servicing activities. |
| (10) | Formed for the purpose of engaging in out-of-home media planning and buying. |
| (11) | Formed for the purpose of holding and managing a hotel investment. |
| (12) | Formed for the purpose of holding an equity investment in a professional lacrosse team. |
| (13) | Formed for the purpose of engaging in general consulting services. |
| (14) | Formed for the purpose of holding an equity investment in a racing team. |
| (15) | Formed for the purpose of engaging in art dealing. |
We intend to use the net proceeds from this offering for general corporate purposes, which may include reducing our debt under our revolving facilities, originating additional loans, funding acquisitions and repurchasing loan participations. Pending such application, we intend to invest such proceeds in cash equivalents, U.S. government securities and other high-quality debt investments that mature in one year or less from the date of investment and other general corporate purposes. The supplement to this prospectus relating to an offering will more fully identify the use of the proceeds from such offering. We anticipate that substantially all of the net proceeds from this offering will be used for the above purposes within two years of receipt of the applicable funds or as otherwise required pursuant to applicable law, depending on the availability of appropriate investment opportunities consistent with our investment objective and market conditions.
11
Table of Contents
PRICE RANGE OF COMMON STOCK AND DISTRIBUTIONS
Our common stock is quoted on NASDAQ under the symbol “TAXI.” Our common stock commenced trading on May 23, 1996. As of September 19, 2013, there were approximately 253 holders of record of our common stock.
On September 19, 2013, the last reported sale price of our common stock was $14.80 per share, which represented a premium of approximately 46% to the net asset value per share reported by us as of June 30, 2013.
The following table sets forth, for the periods indicated, the range of high and low closing prices for our common stock on NASDAQ, the net asset value and the discount and premium to net asset value. Since our initial public offering, our common stock has traded at a premium to net asset value per share more frequently than at a discount to net asset value.
| Premium | (Discount) | |||||||||||||||||||
| 2013 |
High | Low | Net Asset Value | High Price to Net Asset Value |
Low Price to Net Asset Value |
|||||||||||||||
| Third Quarter through September 19 |
$ | 15.11 | $ | 14.06 | * | * | * | |||||||||||||
| Second Quarter |
15.78 | 13.13 | $ | 10.17 | 55 | % | 29 | % | ||||||||||||
| First Quarter |
13.60 | 12.01 | 10.08 | 35 | 19 | |||||||||||||||
| 2012 |
||||||||||||||||||||
| Fourth Quarter |
$ | 12.56 | $ | 11.07 | $ | 9.99 | 26 | % | 11 | % | ||||||||||
| Third Quarter |
12.05 | 10.73 | 9.96 | 21 | 8 | |||||||||||||||
| Second Quarter |
11.89 | 10.00 | 9.87 | 20 | 1 | |||||||||||||||
| First Quarter |
11.45 | 10.65 | 9.71 | 18 | 10 | |||||||||||||||
| 2011 |
||||||||||||||||||||
| Fourth Quarter |
$ | 12.03 | $ | 8.91 | $ | 9.68 | 24 | % | (8 | )% | ||||||||||
| Third Quarter |
10.13 | 9.01 | 9.59 | 6 | (6 | ) | ||||||||||||||
| Second Quarter |
9.89 | 8.70 | 9.49 | 4 | (8 | ) | ||||||||||||||
| First Quarter |
8.79 | 7.82 | 9.41 | (7 | ) | (17 | ) | |||||||||||||
| * | Not determinable at the time of filing. |
Dividends
We intend to distribute quarterly dividends to our shareholders. Our quarterly dividends, if any, will be determined by our Board of Directors.
We have elected to be taxed as a RIC under Subchapter M of the Code. To maintain our RIC status, we must distribute at least 90% of our ordinary income and realized net short-term capital gains in excess of realized net long-term capital losses, if any, out of the assets legally available for distribution. In order to avoid certain excise taxes imposed on RICs, we must distribute during each calendar year an amount at least equal to the sum of (1) 98% of our ordinary income for the calendar year, (2) 98.2% of our capital gains in excess of capital losses for the one-year period ending on October 31st and (3) any ordinary income and net capital gains for preceding years that were not distributed during such years. In addition, although we currently intend to distribute realized net capital gains ( i.e., net long-term capital gains in excess of short-term capital losses), if any, at least annually, out of the assets legally available for such distributions, we may in the future decide to retain such capital gains for investment. In such event, the consequences of our retention of net capital gains are as described under
12
Table of Contents
“Material U.S. Federal Income Tax Considerations.” In the event that we do not make the distributions described above, we are subject to a 4% excise tax on any shortfall.
We maintain a dividend reinvestment plan for our common shareholders. As a result, if a shareholder has elected to participate in the plan and we declare a dividend, then such shareholders’ cash dividends will be reinvested in additional shares of our common stock.
We may not be able to achieve operating results that will allow us to make dividends and distributions at a specific level or to increase the amount of these dividends and distributions from time to time. In addition, we may be limited in our ability to make dividends and distributions due to the asset coverage test for borrowings when applicable to us as a business development company under the 1940 Act and due to provisions in future credit facilities. If we do not distribute a certain percentage of our income annually, we will suffer adverse tax consequences, including possible loss of our status as a regulated investment company. We cannot assure shareholders that they will receive any dividends and distributions or dividends and distributions at a particular level.
The following table lists the quarterly dividends we have paid per share since January 1, 2008.
| Cash Dividends Declared Per Share | ||||||||||||||||||||||||
| 2013 | 2012 | 2011 | 2010 | 2009 | 2008 | |||||||||||||||||||
| Fourth Quarter |
* | $ | 0.22 | $ | 0.20 | $ | 0.16 | $ | 0.15 | $ | 0.19 | |||||||||||||
| Third Quarter |
* | 0.21 | 0.19 | 0.15 | 0.19 | 0.19 | ||||||||||||||||||
| Second Quarter |
$ | 0.22 | 0.21 | 0.18 | 0.15 | 0.19 | 0.19 | |||||||||||||||||
| First Quarter |
0.22 | 0.21 | 0.17 | 0.15 | 0.19 | 0.19 | ||||||||||||||||||
|
|
|
|
|
|
|
|
|
|
|
|
|
|||||||||||||
| Total |
0.44 | 0.85 | 0.74 | 0.61 | 0.72 | 0.76 | ||||||||||||||||||
|
|
|
|
|
|
|
|
|
|
|
|
|
|||||||||||||
| * | Not determinable on the date hereof. |
13
Table of Contents
Investing in our securities involves a number of significant risks. We cannot assure you that we will achieve our investment objective. In addition to the other information contained in this report, you should consider carefully the following information before making an investment in our securities. The risks set out below are not the only risks we face. Additional risks and uncertainties not presently known to us or not presently deemed material by us may also impair our operations and performance. If any of the following events occur, our business, financial condition and results of operations could be materially adversely affected. In such case, our net asset value of our common stock and the trading price of our securities could decline, and you may lose all or part of your investment.
Risks Relating to Our Business and Structure
We have recently experienced a period of capital markets disruption and severe recession and these conditions could worsen in the future.
The recent market conditions have materially and adversely affected the debt and equity capital markets in the U.S., which could have a negative impact on our business and operations. The U.S. capital markets have experienced extreme volatility and disruption for an extended period of time as evidenced by a lack of liquidity in the debt capital markets, significant write-offs in the financial services sector, the repricing of credit risk in the broadly syndicated credit market, and the failure of major financial institutions. These events have contributed to worsening general economic conditions that materially and adversely impacted the broader financial and credit markets and reduced the availability of credit and equity capital for the markets as a whole, and financial services firms in particular. While recent market conditions have improved there have been continuing periods of volatility and there can be no assurance that adverse market conditions will not repeat themselves or worsen in the future. As a result, we believe these conditions may continue for a prolonged period of time and possibly worsen in the future. A prolonged period of market illiquidity could have an adverse effect on our business, financial condition, and results of operations. Unfavorable economic conditions also could increase our funding costs, limit our access to the capital markets or result in a decision by lenders not to extend credit to us. Equity capital may be difficult to raise because, subject to some limited exceptions, we generally are not able to issue and sell our common stock at a price below net asset value per share. In addition, the debt capital that will be available, if at all, may be at a higher cost and on less favorable terms and conditions.
We borrow money, which magnifies the potential for gain or loss on amounts invested, and may increase the risk of investing in us.
Borrowings, also known as leverage, magnify the potential for gain or loss on amounts invested, and therefore increase the risk associated with investing in us. We borrow from and issue senior debt securities to banks and other lenders, and through long-term subordinated SBA debentures. These creditors have fixed dollar claims on our assets that are superior to the claims of our shareholders. If the value of our assets increases, then leveraging would cause the net asset value to increase more sharply than it would have had we not leveraged. Conversely, if the value of our assets decreases, leveraging would cause net asset value to decline more sharply than it otherwise would have had we not leveraged. Similarly, any increase in our income in excess of interest payable on the borrowed funds would cause our net income to increase more than it would without the leverage, while any decrease in our income would cause net income to decline more sharply than it would have had we not borrowed. Such a decline could reduce the amount available for dividend payments.
As of June 30, 2013, we had $342,698,000 of outstanding indebtedness, which had a weighted average borrowing cost of 2.28% at June 30, 2013, and our wholly-owned unconsolidated portfolio companies, primarily Medallion Bank, had $642,471,000 of outstanding indebtedness at a weighted average borrowing cost of 0.60%.
14
Table of Contents
Illustration. The following table illustrates the effect of leverage on returns from an investment in our common stock assuming various annual returns, net of expenses. The calculations in the table below are hypothetical and actual returns may be higher or lower than those appearing in the table below.
| Assumed return on our portfolio (net of expenses) | ||||||||||||||||||||
| -10% | -5% | 0% | 5% | 10% | ||||||||||||||||
| Corresponding return to shareholder(1) |
(29 | )% | (16 | )% | (3 | )% | 9 | % | 22 | % | ||||||||||
| (1) | Assumes $571,746,000 in total assets, $342,698,000 in debt outstanding, $223,342,000 in shareholders’ equity and an average cost of funds of 2.28%, which was our weighted average borrowing cost as of June 30, 2013. |
Consumer lending by Medallion Bank carries a higher risk of loss and could be adversely affected by an economic downturn.
By its nature, lending to consumers that have blemishes on their credit reports carries with it a higher risk of loss. Although the net interest margins should be higher to compensate Medallion Bank for this increased risk, an economic downturn could result in higher loss rates and lower returns than expected, and could affect the profitability of Medallion Bank’s consumer loan portfolio.
We are dependent upon our key investment personnel for our future success.
We depend on the diligence, skill, and network of business contacts of the investment professionals we employ for sourcing, evaluating, negotiating, structuring, and monitoring our investments. Our future success will also depend, to a significant extent, on the continued service and coordination of our senior management team, particularly, Alvin Murstein, our Chairman and Chief Executive Officer, Andrew M. Murstein, our President, and Larry D. Hall, our Chief Financial Officer. The departure of Messrs. Murstein or Mr. Hall, or any member of our senior management team, could have a material adverse effect on our ability to achieve our investment objective.
We operate in a highly regulated environment, and if we are found to be in violation of any of the federal, state, or local laws or regulations applicable to us, our business could suffer.
The 1940 Act imposes numerous constraints on the operations of business development companies. For example, business development companies are required to invest at least 70% of their total assets in qualifying assets, primarily securities of “eligible portfolio companies” (as defined under the 1940 Act), cash, cash equivalents, U.S. government securities, and other high quality debt investments that mature in one year or less. Our regulatory requirements may hinder our ability to take advantage of attractive investment opportunities and, as a result, achieve our investment objective. In addition, we rely upon several exemptive orders from the SEC permitting us to consolidate our financial reporting and operate our business as presently conducted. Our failure to satisfy the conditions set forth in those exemptive orders could result in our inability to rely upon such orders or to cause the SEC to revoke the orders which could result in material changes in our financial reporting or the way in which we conduct our business. Furthermore, any failure to comply with the requirements imposed on business development companies by the 1940 Act could have material adverse consequences to us or our investors, including possible enforcement action by the SEC and the possible loss of our ability to qualify as a RIC that is exempt from corporate-level income tax under the Code. If we do not remain a business development company, we might be regulated as a closed-end investment company under the 1940 Act, which would further significantly decrease our operating flexibility.
The Dodd-Frank Wall Street Reform and Consumer Protection Act, or the Dodd-Frank Act, was signed into law on July 21, 2010. The Dodd-Frank Act significantly changes federal financial services regulation and affects, among other things, the lending, deposit, investment, trading, and operating activities of financial institutions and
15
Table of Contents
their holding companies. The Dodd-Frank Act requires various federal agencies to adopt a broad range of new implementing rules and regulations. The federal agencies have significant discretion in issuing these rules and regulations, and consequently, many of the details and much of the effect of the Dodd-Frank Act may not be known for many months or years. As such, we cannot predict and may not be able to anticipate all the effects of the Dodd-Frank Act on our financial condition or operations.
We are also subject to a wide range of federal, state, and local laws and regulations, such as local licensing requirements, and retail financing, debt collection, consumer protection, environmental, health and safety, creditor, wage-hour, anti-discrimination, whistleblower and other employment practices laws and regulations and we expect these costs to increase going forward. The violation of these or future requirements or laws and regulations could result in administrative, civil, or criminal sanctions against us, which may include a cease and desist order against the subject operations or even revocation or suspension of our license to operate the subject business. As a result, we have incurred and will continue to incur capital and operating expenditures and other costs to comply with these requirements and laws and regulations.
Changes in laws, regulations, or policies may adversely affect our business.
The post-financial crisis era has been marked by an increase in regulation, regulatory intensity, and enforcement. We are unable to predict all of the ways in which this change in the regulatory environment could impact our business models or objectives. The laws and regulations governing our lending, servicing, and debt collection activities or the regulatory or enforcement environment at the federal level or in any of the states in which we operate may change at any time which may have an adverse effect on our business.
We expect, however, to see an increase over time in regulatory scrutiny and enforcement in the area of consumer financial products regulation, as a result of the establishment of the Consumer Financial Protection Bureau, or the CFPB. The CFPB became operational in certain respects in July 2011, and on January 4, 2012, President Obama appointed a Director of the CFPB in a recess appointment bypassing Senate confirmation. Although there remain doubts about the legality of this appointment and the appointment may be subject to legal challenge, the CFPB has announced that it will now exercise full regulatory, supervisory, and enforcement powers. While Medallion Bank’s size currently falls below the threshold that would give the CFPB direct authority over it, Medallion Bank’s existing bank supervisors may pursue similar policies and make similar information requests to those of the CFPB with respect to consumer financial products and other matters within the scope of the CFPB’s authority. We believe that the CFPB’s regulatory reforms, together with other provisions of the Dodd-Frank Act, and increased regulatory supervision, may increase our cost of doing business, impose new restrictions on the way in which we conduct our business, or add significant operational constraints that might impair our profitability.
We are unable to predict how these or any other future legislative proposals or programs will be administered or implemented or in what form, or whether any additional or similar changes to statutes or regulations, including the interpretation or implementation thereof, will occur in the future. Any such action could affect us in substantial and unpredictable ways and could have an adverse effect on our results of operations and financial condition.
Our inability to remain in compliance with regulatory requirements in a particular jurisdiction could have a material adverse effect on our operations in that market and on our reputation generally. No assurance can be given that applicable laws or regulations will not be amended or construed differently or that new laws and regulations will not be adopted, either of which could materially adversely affect our business, financial condition, or results of operations.
16
Table of Contents
Federal and state law may discourage certain acquisitions of our common stock which could have a material adverse effect on our shareholders.
Because Medallion Bank is an “insured depository institution” within the meaning of the Federal Deposit Insurance Act and the Change in Bank Control Act and we are a “financial institution holding company” within the meaning of the Utah Financial Institutions Act, federal and Utah law and regulations prohibit any person or company from acquiring control of us and, indirectly, Medallion Bank, without, in most cases, prior written approval of the FDIC or the Commissioner of Financial Institutions, as applicable. Under the Change in Bank Control Act, control is conclusively presumed if, among other things, a person or company acquires 25% or more of any class of our voting stock. A rebuttable presumption of control arises if a person or company acquires 10% or more of any class of voting stock and is subject to a number of specified “control factors” as set forth in the applicable regulations. Although Medallion Bank is an “insured depository institution” within the meaning of the Federal Deposit Insurance Act and the Change in Bank Control Act, your investment in Medallion Financial Corp. is not guaranteed by the FDIC and is subject to loss. Under the Utah Financial Institutions Act, control is defined as the power to vote 20% or more of any class of our voting securities by an individual or to vote more than 10% of any class of our voting securities by a person other than an individual. Investors are responsible for ensuring that they do not, directly or indirectly, acquire shares of our common stock in excess of the amount which can be acquired without regulatory approval. These provisions could delay or prevent a third party from acquiring us, despite the possible benefit to our shareholders, or otherwise adversely affect the market price of our common stock.
Regulations governing our operation as a business development company may affect our ability to, and the way in which we, raise additional capital.
Our business may periodically require capital. We may acquire additional capital from the following sources:
Senior Securities and Other Indebtedness. We may issue debt securities or preferred stock, and/or borrow money from banks or other financial institutions, which we refer to collectively as senior securities, up to the maximum amount permitted by the 1940 Act. If we issue senior securities, including debt or preferred stock, we will be exposed to additional risks, including the following:
| • | Under the provisions of the 1940 Act, we are permitted, as a business development company, to issue senior securities only in amounts such that our asset coverage, as defined in the 1940 Act, equals at least 200% after each issuance of senior securities. If the value of our assets declines, we may be unable to satisfy this test. If that happens, we may be restricted from issuing additional debt, may be limited in making distributions on our stock, and may be required to sell a portion of our investments and, depending on the nature of our leverage, to repay a portion of our debt at a time when such sales and/or repayments may be disadvantageous. In addition to the 1940 Act, we are subject to two exemptive orders which govern how we calculate our senior securities and under which we have agreed that we will meet the applicable asset coverage ratios both individually and on a consolidated basis. |
| • | Any amounts that we use to service our debt or make payments on preferred stock will not be available for dividends to our common shareholders. |
| • | It is likely that any senior securities or other indebtedness we issue will be governed by an indenture or other instrument containing covenants restricting our operating flexibility. Additionally, some of these securities or other indebtedness may be rated by rating agencies, and in obtaining a rating for such securities and other indebtedness, we may be required to abide by operating and investment guidelines that further restrict operating and financial flexibility. |
| • | We and, indirectly, our shareholders will bear the cost of issuing and servicing such securities and other indebtedness. |
17
Table of Contents
| • | Preferred stock or any convertible or exchangeable securities that we issue in the future may have rights, preferences, and privileges more favorable than those of our common stock, including separate voting rights, and could delay or prevent a transaction or a change in control to the detriment of the holders of our common stock. |
Additional Common Stock. We are not generally able to issue and sell our common stock at a price below net asset value (less any distributing commission or discount) per share. We may, however, sell our common stock, warrants, options, or rights to acquire our common stock, at a price below the current net asset value of the common stock if our Board of Directors determines that such sale is in our best interests and that of our shareholders, and our shareholders approve such sale. In any such case, the price at which our securities are to be issued and sold may not be less than a price which, in the determination of our Board of Directors, closely approximates the market value of such securities (less any distributing commission or discount). We may also make rights offerings to our shareholders at prices per share less than the net asset value per share, subject to applicable requirements of the 1940 Act. If we raise additional funds by issuing more common stock or senior securities convertible into, or exchangeable for, our common stock, the percentage ownership of our shareholders at that time would decrease and they may experience dilution. Moreover, we can offer no assurance that we will be able to issue and sell additional equity securities in the future, on favorable terms or at all.
If our investments in assets that are not “qualifying assets” are determined to exceed 30% of our total assets, we could be deemed to be in violation of the 1940 Act or could be precluded from investing in what we believe are attractive investments, which could have a material adverse effect on our business.
As a business development company, we are not permitted to acquire any assets other than “qualifying assets” unless, at the time of such acquisition, at least 70% of our total assets are qualifying assets. Our investment in Medallion Bank may constitute a non-qualifying asset. As of June 30, 2013, up to approximately 27% of our total assets were invested in non-qualifying assets.
At the end of each fiscal quarter, we may take proactive steps to prospectively preserve investment flexibility in the next quarter which is assessed against our total assets at our most recent quarter end. We can accomplish this in many ways including purchasing U.S. Treasury bills or other investment-grade debt securities, and closing out our position on a net cash basis subsequent to quarter end. However, if such proactive measures are ineffective or our primary investments are deemed not to be qualifying assets, or if the fair value of our non-qualifying assets increases or is determined to be higher than previously determined, or if the fair value of our qualifying assets decreases or is determined to be lower than previously determined, we could be deemed in violation of the 1940 Act, or could be precluded from investing in what we believe are attractive investments or from making follow-on investments in existing portfolio companies that are non-qualifying assets, or could be required to dispose of non-qualifying assets at times or on terms that may be disadvantageous to us. Medallion Bank may also not be able to grow as quickly if we are precluded from providing additional funding to Medallion Bank. Any of the foregoing consequences could have a material adverse effect on us. In addition, if we are found to be in violation of the requirements applicable to business development companies under the 1940 Act, we could be unable to qualify as a RIC under the Code.
We will be subject to corporate-level income tax if we are unable to qualify as a RIC under Subchapter M of the Code.
To obtain and maintain RIC tax treatment under the Code, we must meet the following annual distribution, income source, and asset diversification requirements.
| • | The annual distribution requirement for a RIC will be satisfied if we distribute to our shareholders on an annual basis at least 90% of our net ordinary income and realized net short-term capital gains in excess of realized net long-term capital losses, if any, and at least 90% of our net tax-exempt income. Because we use debt financing, we are subject to certain asset coverage ratio requirements under the |
18
Table of Contents
| 1940 Act and financial covenants under loan and credit agreements that could, under certain circumstances, restrict us from making distributions necessary to satisfy the distribution requirement. If we are unable to obtain cash from other sources, we could fail to qualify for RIC tax treatment and thus become subject to corporate-level income tax. |
| • | The income source requirement will be satisfied if we obtain at least 90% of our income for each year from dividends, interest, gains from the sale of stock or securities, or similar sources. |
| • | The asset diversification requirement will be satisfied if we meet certain asset diversification requirements at the end of each quarter of our taxable year. Failure to meet those requirements may result in our having to dispose of certain investments quickly in order to prevent the loss of RIC status. Because most of our investments will be in private companies, and therefore will be relatively illiquid, any such dispositions could be made at disadvantageous prices and could result in substantial losses. |
If we do not qualify as a RIC for more than two consecutive years, and then seek to requalify and elect RIC status, we would be required to recognize gain to the extent of any unrealized appreciation on our assets unless we make a special election to pay corporate-level tax on any such unrealized appreciation recognized during the succeeding 10-year period.
If we fail to qualify for RIC tax treatment for any reason and are subject to corporate income tax, the resulting corporate taxes could substantially reduce our net assets, the amount of income available for distribution and the amount of our distributions. In addition, the asset coverage and distribution requirements impose significant cash flow management restrictions on us and limit our ability to retain earnings to cover periods of loss, provide for future growth, and pay for extraordinary items. Additionally, we could fail to satisfy the requirement that a RIC derive at least 90% of its gross income from qualifying sources, with the result that we would not qualify as a RIC. Qualification as a RIC is made on an annual basis and, although we and some of our subsidiaries have qualified in the past, we cannot assure you that we will qualify for such treatment in the future.
The Code’s diversification requirements may limit our ability to expand our business.
RIC qualification rules require that at the end of each quarter of our taxable year, (i) at least 50% of the market value of our assets must be represented by cash, securities of other RICs, U.S. government securities and other securities, with such other securities limited, in respect of any one issuer, to an amount not greater than 5% of our assets and not greater than 10% of the outstanding voting securities of such issuer and (ii) not more than 25% of the value of our assets may be invested in the securities (other than U.S. government securities or securities of other RICs) of any one issuer, any two or more issuers of which 20% or more of the voting stock is held by us and that are determined to be engaged in the same or similar trades or businesses or related trades or businesses or in the securities of one or more qualified publicly traded partnerships. As of June 30, 2013, our largest investment subject to this test was our investment in Medallion Bank, representing 19% of our RIC assets. No other investments were more than 5% of our RIC assets. We will continue to monitor the levels of this and any other investment concentrations in conjunction with the diversification tests.
We may have difficulty paying our required distributions if we recognize income before or without receiving cash representing such income.
For U.S. federal income tax purposes, we will include in taxable income certain amounts that we have not yet received in cash, such as original issue discount, which may arise if we receive warrants in connection with the origination of a loan or possibly in other circumstances, or contractual payment-in-kind interest, which represents contractual interest added to the loan balance and due at the end of the loan term. Such original issue discount or increases in loan balances as a result of payment-in-kind interest will be included in income before we receive any corresponding cash payments. We also may be required to include in income certain other amounts that we will not receive in cash.
19
Table of Contents
Since, in certain cases, we may recognize income before or without receiving cash representing such income, we may have difficulty meeting the annual distribution requirement necessary to achieve and maintain RIC tax treatment under the Code. Accordingly, we may have to sell some of our investments at times and/or at prices we would not consider advantageous, raise additional debt or equity capital, or reduce new investment originations for this purpose. If we are not able to obtain cash from other sources, we may fail to qualify for RIC tax treatment and thus become subject to corporate-level income tax.
As Medallion Bank grows, a greater portion of our business will be subject to corporate-level tax.
Medallion Bank must pay corporate-level U.S. federal and state income taxes. As Medallion Bank grows its business, more of its income will be taxed, which will reduce the amount of cash available for distribution to us and, in turn, to our shareholders.
Our SBIC subsidiaries may be unable to meet the investment company requirements, which could result in the imposition of an entity-level tax.
Some of our subsidiaries are subject to the Small Business Investment Act, or the SBIA. Our Small Business Investment Company, or SBIC, subsidiaries that are also RICs may be prohibited by the SBIA from making the distributions necessary to qualify as a RIC. Each year, in order to comply with the SBA regulations and the RIC distribution requirements, we must request and receive a waiver of the SBA’s restrictions. While the current policy of the SBA’s Office of SBIC Operations is to grant such waivers if the SBIC makes certain offsetting adjustments to its paid-in capital and surplus accounts, we cannot assure you that this will continue to be the SBA’s policy or that our subsidiaries will have adequate capital to make the required adjustments. If our subsidiaries are unable to obtain a waiver, compliance with the SBA regulations may result in loss of RIC status and a consequent imposition of an entity-level tax at the subsidiary level.
Our SBIC subsidiaries are licensed by the SBA, and are therefore subject to SBA regulations.
Our SBIC subsidiaries are licensed to act as SBICs and are regulated by the SBA. The SBA also places certain limitations on the financing terms of investments by SBICs in portfolio companies and prohibits SBICs from providing funds for certain purposes or to businesses in a few prohibited industries. Compliance with SBA requirements may cause the SBIC subsidiaries to forego attractive investment opportunities that are not permitted under SBA regulations.
Further, SBA regulations require that a licensed SBIC be periodically examined and audited by the SBA to determine its compliance with the relevant SBA regulations. The SBA prohibits, without prior SBA approval, a “change of control” of an SBIC or transfers that would result in any person (or a group of persons acting in concert) owning 10% or more of a class of capital stock of a licensed SBIC. If the SBIC subsidiaries fail to comply with applicable SBIC regulations, the SBA could, depending on the severity of the violation, limit or prohibit their use of debentures, declare outstanding debentures immediately due and payable, and/or limit them from making new investments. In addition, the SBA can revoke or suspend a license for willful or repeated violation of, or willful or repeated failure to observe, any provision of the SBIA or any rule or regulation promulgated thereunder. Such actions by the SBA would, in turn, negatively affect us.
We may materially change our corporate structure and the nature of our business.
We are very much affected by the legal, regulatory, tax and accounting regimes under which we operate. We are evaluating whether those regimes and our existing corporate structure are the optimum means for the operation and capitalization of our business. As a result of these evaluations, we may decide to proceed with structural and organizational changes (certain of which may require the approval of our shareholders), which could result in material dispositions of various assets, changes in our corporate form, termination of our election to be regulated as a business development company, our conversion from an investment company to an operating company or other fundamental changes. If we were no longer an investment company, our accounting practices would change and, for example, lead to the consolidation of certain majority owned companies with which we do
20
Table of Contents
not now consolidate as an investment company. Additionally, if we were no longer an investment company, our shareholders would not benefit from the investor protections provided by the 1940 Act. We may incur certain costs in completing these evaluations and may receive no benefit from these expenditures, particularly if we do not proceed with any changes. No decisions have been made with respect to any such changes and there is no timetable for making any decisions, including any decision not to proceed with any such changes.
We operate in a highly competitive market for investment opportunities.
We compete for investments with other business development companies and other investment funds as well as traditional financial services companies such as commercial banks and credit unions. Many of our competitors are substantially larger and have considerably greater financial, technical, and marketing resources than we do. For example, some competitors may have a lower cost of funds and access to funding sources that are not available to us. In addition, some of our competitors may have higher risk tolerances or different risk assessments. These characteristics could allow our competitors to consider a wider variety of investments, establish more relationships, and offer better pricing and more flexible structuring than us. We may lose investment opportunities if we do not match our competitors’ pricing, terms, and structure. If we are forced to match our competitors’ pricing, terms, and structure, we may not be able to achieve acceptable returns on our investments or may bear substantial risk of capital loss. Furthermore, many of our competitors are not subject to the regulatory restrictions that the 1940 Act imposes on us as a business development company.
We cannot assure you that the competitive pressures we face will not have a material adverse effect on our business, financial condition, and results of operations. Also, as a result of this competition, we may not be able to take advantage of attractive investment opportunities from time to time.
Changes in interest rates may affect our cost of capital and net investment income.
Because we borrow to fund our investments, a portion of our income is dependent upon the difference between the interest rate at which we borrow funds and the interest rate at which we invest these funds. A portion of our investments, such as taxi medallion loans, will have fixed interest rates, while a portion of our borrowings will likely have floating interest rates. As a result, a significant change in market interest rates could have a material adverse effect on our net investment income. In periods of rising interest rates, our cost of funds could increase, which would reduce our net investment income. We may hedge against interest rate fluctuations by using standard hedging instruments, subject to applicable legal requirements. These activities may limit our ability to participate in the benefits of lower interest rates with respect to the hedged portfolio. Adverse developments resulting from changes in interest rates or hedging transactions could have a material adverse effect on our business, financial condition, and results of operations. Also, we will have to rely on our counterparties to perform their obligations under such hedges.
We depend on cash flow from our subsidiaries to make dividend payments and other distributions to our shareholders.
We are primarily a holding company, and we derive most of our operating income and cash flow from our subsidiaries. As a result, we rely heavily upon distributions from our subsidiaries to generate the funds necessary to make dividend payments and other distributions to our shareholders. Funds are provided to us by our subsidiaries through dividends and payments on intercompany indebtedness, but we cannot assure you that our subsidiaries will be in a position to continue to make these dividend or debt payments. Furthermore, as a condition to receipt of FDIC insurance, Medallion Bank entered into a capital maintenance agreement with the FDIC requiring it to maintain a 15% leverage ratio (Tier 1 capital to total assets). Medallion Bank may be restricted from declaring and paying dividends if doing so were to cause it to fall below a 15% leverage ratio.
21
Table of Contents
Medallion Bank’s use of brokered deposit sources for its deposit-gathering activities may not be available when needed.
Medallion Bank relies on the established brokered deposit market to originate deposits to fund its operations. Medallion Bank’s brokered deposits consist of deposits raised through the brokered deposit market rather than through retail branches. While Medallion Bank has developed contractual relationships with a diversified group of investment brokers, and the brokered deposit market is well developed and utilized by many banking institutions, conditions could change that might affect the availability of deposits. If the capital levels at Medallion Bank fall below the “well-capitalized” level as defined by the FDIC or the capital level currently required by the FDIC pursuant to its capital maintenance agreement or if Medallion Bank experiences a period of sustained operating losses, the cost of attracting deposits from the brokered deposit market could increase significantly, and the ability of Medallion Bank to raise deposits from this source could be impaired. Medallion Bank’s ability to manage its growth to stay within the “well-capitalized” level, and the capital level currently required by the FDIC pursuant to its capital maintenance agreement, which is also considerably higher than the level required to be classified as “well-capitalized”, is critical to Medallion Bank’s retaining open access to this funding source.
A decrease in prevailing interest rates may lead to more loan prepayments, which could adversely affect our business.
Our borrowers generally have the right to prepay their loans upon payment of a fee ranging from 30 to 120 days interest for standard commodity loans, and for higher amounts, as negotiated, for larger more custom loan arrangements. A borrower is likely to exercise prepayment rights at a time when the interest rate payable on the borrower’s loan is high relative to prevailing interest rates. In a lower interest rate environment, we will have difficulty re-lending prepaid funds at comparable rates, which may reduce the net interest income that we receive. When this occurs, we will generally reinvest these proceeds in temporary investments, pending their future investment in new portfolio companies. These temporary investments will typically have substantially lower yields than the debt being prepaid, and we could experience significant delays in reinvesting these amounts. Any future investment in a new portfolio company may also be at lower yields than the debt that was repaid. As a result, our results of operations could be materially adversely affected if a substantial number of our portfolio companies elect to prepay amounts owed to us and we are not able to reinvest the proceeds for comparable yields in a timely fashion. Additionally, prepayments could negatively impact our return on equity, which could result in a decline in the market price of our common stock.
Our investment portfolio is, and will continue to be, recorded at fair value as determined in good faith by our Board of Directors and, as a result, there is, and will continue to be, uncertainty as to the value of our portfolio investments which could adversely affect our net asset value.
Under the 1940 Act, we are required to carry our portfolio investments at market value or, if there is no readily available market value, at fair value as determined by our Board of Directors. Unlike other lending institutions, we are not permitted to maintain a general reserve for anticipated losses. Instead, we are required by the 1940 Act to specifically value each individual investment and record an unrealized gain or loss for any asset we believe has increased or decreased in value. Typically, there is not a public market for most of the investments in which we have invested and will generally continue to invest. As a result, our Board of Directors values our investments on a quarterly basis based on a determination of their fair value made in good faith and in accordance with the written guidelines approved by our Board of Directors. Our Board of Directors regularly reviews the appropriateness and accuracy of the method used in valuing our investments, and makes any necessary adjustments. The types of factors that may be considered in determining the fair value pricing of our investments include the nature and realizable value of any collateral, the portfolio company’s earnings and its ability to make payments on its indebtedness, the markets in which the portfolio company does business, comparison to publicly traded companies, discounted cash flow, comparable sales and valuations of companies similar to the portfolio company, regulatory factors that may limit the value of the portfolio company, and other relevant factors. Because such valuations, and particularly valuations of private securities and private companies,
22
Table of Contents
are inherently uncertain, the valuations may fluctuate over short periods of time and may be based on estimates. As a result, our determinations of fair value may differ materially from the values that would have been used if a ready market for these investments existed and may cause our net asset value on a given date to materially understate or overstate the value that we may ultimately realize upon the sale or disposition of one or more of our investments. Investors purchasing our securities in connection with an offering based on an overstated net asset value would pay a higher price than the value of our investments might warrant, and investors purchasing our securities in connection with an offering based on an understated net asset value would pay a lower price than the value of our investments might warrant. Our net asset value could be adversely affected if our determinations regarding the fair value of our investments were materially higher than the values that we ultimately realize upon the disposal of such securities. Considering these factors, we have determined that the fair value of our portfolio is below its cost basis. As of June 30, 2013, our net unrealized depreciation on investments other than in controlled subsidiaries, foreclosed properties, and other assets was $7,135,000 or 1.53% of our investment portfolio.
The lack of liquidity in our investments may adversely affect our business.
We generally make investments in private companies. Substantially all of these securities are subject to legal and other restrictions on resale or are otherwise less liquid than publicly traded securities. The illiquidity of our investments may make it difficult for us to sell such investments if the need arises. In addition, if we are required to liquidate all or a portion of our portfolio quickly, we may realize significantly less than the value at which we had previously recorded our investments. We may also face other restrictions on our ability to liquidate an investment in a portfolio company to the extent that we have material non-public information regarding such portfolio company.
In addition, the illiquidity of our loan portfolio and investments may adversely affect our ability to dispose of loans at times when it may be advantageous for us to liquidate such portfolio or investments. In addition, if we were required to liquidate some or all of the investments in the portfolio, the proceeds of such liquidation may be significantly less than the current value of such investments. Because we borrow money to make loans and investments, our net operating income is dependent upon the difference between the rate at which we borrow funds and the rate at which we invest these funds. As a result, there can be no assurance that a significant change in market interest rates will not have a material adverse effect on our interest income. In periods of sharply rising interest rates, our cost of funds would increase, which would reduce our net operating income before net realized and unrealized gains. We use a combination of long-term and short-term borrowings and equity capital to finance our investing activities. Our long-term fixed-rate investments are financed primarily with short-term floating-rate debt, and to a lesser extent by term fixed-rate debt. We may use interest rate risk management techniques in an effort to limit our exposure to interest rate fluctuations. Such techniques may include various interest rate hedging activities to the extent permitted by the 1940 Act. We have analyzed the potential impact of changes in interest rates on net interest income. Assuming that the balance sheet were to remain constant and no actions were taken to alter the existing interest rate sensitivity, and including the impact on Medallion Bank, a hypothetical immediate 1% increase in interest rates would have positively impacted net increase in net assets resulting from operations as of June 30, 2013 by approximately $1,379,000 on an annualized basis, compared to a positive impact of approximately $1,282,000 at December 31, 2012, and the impact of such an immediate increase of 1% over a one year period would have been approximately ($2,459,000) at June 30, 2013, compared to approximately ($2,880,000) for December 31, 2012. Although management believes that this measure is indicative of our sensitivity to interest rate changes, it does not adjust for potential changes in credit quality, size, and composition of the assets on the balance sheet, and other business developments that could affect net increase in net assets resulting from operations in a particular quarter or for the year taken as a whole. Accordingly, no assurances can be given that actual results would not differ materially from the potential outcome simulated by these estimates.
23
Table of Contents
We may experience fluctuations in our quarterly results.
We could experience fluctuations in our quarterly operating results due to a number of factors, including our ability to make investments in companies that meet our investment criteria, the interest rate payable on the debt securities we acquire, the level of our expenses, variations in and the timing of the recognition of realized and unrealized gains or losses, the degree to which we encounter competition in our markets, and general economic conditions. As a result of these factors, results for any period should not be relied upon as being indicative of performance in future periods.
Terrorist attacks, other acts of violence or war, and natural disasters may affect any market for our securities, impact the businesses in which we invest, and harm our operations and profitability.
Terrorist attacks and natural disasters may harm our results of operations and your investment. We cannot assure you that there will not be further terrorist attacks against the U.S. or U.S. businesses or major natural disasters hitting the United States. Such attacks or natural disasters in the U.S. or elsewhere may impact the businesses in which we invest directly, or indirectly by undermining economic conditions in the United States. In addition, a substantial portion of our business is focused in the New York City metropolitan area, which suffered a terrorist attack in 2001. Another terrorist attack in New York City or elsewhere could severely impact our results of operations. Losses resulting from terrorist attacks are generally uninsurable.
Our financial condition and results of operations will depend on our ability to manage growth effectively.
Our ability to achieve our investment objective will depend on our ability to grow, which will depend, in turn, on our management team’s ability to identify, evaluate, and monitor, and our ability to finance and invest in, companies that meet our investment criteria.
Accomplishing this result on a cost-effective basis will be largely a function of our management team’s handling of the investment process, its ability to provide competent, attentive, and efficient services, and our access to financing on acceptable terms. In addition to monitoring the performance of our existing investments, members of our management team and our investment professionals may also be called upon to provide managerial assistance to our portfolio companies. These demands on their time may distract them or slow the rate of investment. In order to grow, we will need to hire, train, supervise, and manage new employees. However, we cannot assure you that any such employees will contribute to the success of our business. Any failure to manage our future growth effectively could have a material adverse effect on our business, financial condition, and results of operations.
Acquisitions may lead to difficulties that could adversely affect our operations.
By their nature, corporate acquisitions entail certain risks, including those relating to undisclosed liabilities, the entry into new markets, operational, and personnel matters. We may have difficulty integrating acquired operations or managing problems due to sudden increases in the size of our loan portfolio. In such instances, we might be required to modify our operating systems and procedures, hire additional staff, obtain and integrate new equipment, and complete other tasks appropriate for the assimilation of new business activities. We cannot assure you that we would be successful, if and when necessary, in minimizing these inherent risks or in establishing systems and procedures which will enable us to effectively achieve our desired results in respect of any future acquisitions.
Our ability to enter into transactions with our affiliates is restricted.
The 1940 Act restricts our ability to knowingly participate in certain transactions with our affiliates. These restrictions limit our ability to buy or sell any security from or to our affiliates, or engage in “joint” transactions with our affiliates, which could include investments in the same portfolio company (whether at the same or different times). With respect to controlling or certain closely affiliated persons, we will generally be prohibited
24
Table of Contents
from engaging in such transactions absent the prior approval of the SEC. With respect to other affiliated persons, we may engage in such transactions only with the prior approval of our independent directors.
The SBA restricts the ability of SBICs to lend money to their officers, directors, and employees, or invest in affiliates thereof.
Medallion Bank is subject to certain federal laws that restrict and control its ability to provide or receive services between affiliates. Sections 23A and 23B of the Federal Reserve Act and applicable regulations also impose restrictions on Medallion Bank. These restrictions limit the transfer of funds by a depository institution to certain of its affiliates, including us, in the form of loans, extensions of credit, investments, or purchases of assets. Sections 23A and 23B also require generally that the depository institution’s transactions with its affiliates be on terms no less favorable to Medallion Bank than comparable transactions with unrelated third parties.
Our Board of Directors may change our operating policies and strategies without prior notice or shareholder approval, the effects of which may be adverse.
Our Board of Directors has the authority to modify or waive our current operating policies and strategies without prior notice and without shareholder approval. We cannot predict the effect any changes to our current operating policies and strategies would have on our business, operating results, and value of our stock. However, the effects might be adverse, which could negatively impact our ability to pay you dividends and cause you to lose all or part of your investment.
Risks Relating to Our Investments
Changes in taxicab industry regulations that result in the issuance of additional medallions or increases in the expenses involved in operating a medallion could lead to a decrease in the value of our medallion loan collateral.
Every city in which we originate medallion loans, and most other major cities in the United States, limits the supply of taxicab medallions. This regulation results in supply restrictions that support the value of medallions. Actions that loosen these restrictions and result in the issuance of additional medallions into a market could decrease the value of medallions in that market. If this were to occur, the value of the collateral securing our then outstanding medallion loans in that market could be adversely affected. For example, the New York State legislature enacted a law on December 21, 2011 which was amended on February 17, 2012 to permit cars for hire to pickup street hails in boroughs outside of Manhattan. The law is currently in the early stages of implementation. Upon the law’s full implementation, income from operating medallions and the value of medallions serving as collateral for our loans could decrease by a material amount. This could increase our loan to value ratios, loan delinquencies, or loan defaults. We are unable to forecast with any degree of certainty whether any other potential increases in the supply of medallions will occur.
In New York City, Chicago, Boston, and in other markets where we originate medallion loans, taxicab fares are generally set by government agencies. Expenses associated with operating taxicabs are largely unregulated. As a result, the ability of taxicab operators to recoup increases in expenses is limited in the short term. Escalating expenses, such as rising gas prices, can render taxicab operations less profitable, could cause borrowers to default on loans from us, and could potentially adversely affect the value of our collateral.
A significant portion of our loan revenue is derived from loans collateralized by New York City taxicab medallions. According to New York City TLC data, over the past 20 years New York City taxicab medallions have appreciated in value from under $160,000 to $1,164,000 for corporate medallions and $1,051,000 for individual medallions. However, for sustained periods during that time, taxicab medallions have declined in value. Since December 31, 2011, the value of New York City taxicab medallions increased by approximately 50% for individual medallions and 16% for corporate medallions.
25
Table of Contents
Lending to small businesses involves a high degree of risk and is highly speculative.
Lending to small businesses involves a high degree of business and financial risk, which can result in substantial losses and should be considered speculative. Our borrower base consists primarily of small business owners that may have limited resources and that are generally unable to obtain financing from traditional sources. There is generally no publicly available information about these small business owners, and we must rely on the diligence of our employees and agents to obtain information in connection with our credit decisions. In addition, these small businesses often do not have audited financial statements. Some smaller businesses have narrower product lines and market shares than their competition. Therefore, they may be more vulnerable to customer preferences, market conditions, or economic downturns, which may adversely affect the return on, or the recovery of, our investment in these businesses.
Our portfolio is and may continue to be concentrated in a limited number of portfolio companies and industries, which will subject us to a risk of significant loss if any of these companies defaults on its obligations to us or by a downturn in the particular industry.
Our portfolio is and may continue to be concentrated in a limited number of portfolio companies and industries. In addition, taxicab companies that constitute separate issuers may have related management or guarantors and constitute larger business relationships to us. As of June 30, 2013, investments in New York City taxi medallion loans represented approximately 76% of our managed taxi medallion loans. Beyond the asset diversification requirements associated with our qualification as a RIC, we do not have fixed guidelines for diversification, and while we are not targeting any specific industries, our investments are, and could continue to be, concentrated in relatively few industries. As a result, the aggregate returns we realize may be adversely affected if a small number of investments perform poorly or if we need to write down the value of any one investment. If our larger borrowers were to significantly reduce their relationships with us and seek financing elsewhere, the size of our loan portfolio and operating results could decrease. In addition, larger business relationships may also impede our ability to immediately foreclose on a particular defaulted portfolio company as we may not want to impair an overall business relationship with either the portfolio company management or any related funding source. Additionally, a downturn in any particular industry in which we are invested could also negatively impact the aggregate returns we realize.
If we are unable to continue to diversify geographically, our business may be adversely affected if the New York City taxicab industry experiences a sustained economic downturn.
A significant portion of our loan revenue is derived from New York City medallion loans collateralized by New York City taxicab medallions. An economic downturn in the New York City taxicab industry could lead to an increase in defaults on our medallion loans. We cannot assure you that we will be able to sufficiently diversify our operations geographically.
An economic downturn could result in certain of our commercial and consumer loan customers experiencing declines in business activities and/or personal resources, which could lead to difficulties in their servicing of their loans with us, and increasing the level of delinquencies, defaults, and loan losses in our commercial and consumer loan portfolios.
Laws and regulations implemented in response to climate change could result in increased operating costs for our portfolio companies.
Congress and other governmental authorities have either considered or implemented various laws and regulations in response to climate change and the reduction of greenhouse gases. Existing environmental regulations could be revised or reinterpreted, new laws and regulations could be adopted, and future changes in environmental laws and regulations could occur, which could impose additional costs on the operation of our portfolio companies. For example, regulations to cut gasoline use and control greenhouse gas emissions from new cars could adversely affect our medallion portfolio companies. Our portfolio companies may have to make significant capital and other expenditures to comply with these laws and regulations. Changes in, or new,
26
Table of Contents
environmental restrictions may force our portfolio companies to incur significant expenses or expenses that may exceed their estimates. There can be no assurance that such companies would be able to recover all or any increased environmental costs from their customers or that their business, financial condition or results of operations would not be materially and adversely affected by such expenditures or any changes in environmental laws and regulations, in which case the value of these companies could be adversely affected.
Our portfolio companies may incur debt that ranks equally with, or senior to, our investments in such companies.
We invest in our portfolio companies primarily through senior secured loans, junior secured loans, and subordinated debt issued by small- to mid-sized companies. Our portfolio companies may have, or may be permitted to incur, other debt that ranks equally with, or senior to, the debt in which we invest. By their terms, such debt instruments may entitle the holders to receive payment of interest or principal on or before the dates on which we are entitled to receive payments with respect to the debt instruments in which we invest. Also, in the event of insolvency, liquidation, dissolution, reorganization, or bankruptcy of a portfolio company, holders of debt instruments ranking senior to our investment in that portfolio company would typically be entitled to receive payment in full before we receive any distribution. After repaying such senior creditors, such portfolio company may not have any remaining assets to use for repaying its obligation to us. In the case of debt ranking equally with debt instruments in which we invest, we would have to share on an equal basis any distributions with other creditors holding such debt in the event of an insolvency, liquidation, dissolution, reorganization, or bankruptcy of the relevant portfolio company.
A third party finance company sold various participations in asset based loans to Medallion Business Credit and Medallion Bank. At June 30, 2013, the aggregate balance of the participations was approximately $13.8 million, $12.9 million of which were held by Medallion Bank. That amount is divided between seven separate borrowers operating in a variety of industries. In April 2013, the finance company became the subject of an involuntary bankruptcy petition filed by its bank lenders. Among other things, the bank lenders alleged that the finance company fraudulently misrepresented its borrowing availability under its credit facility with the bank lenders and are seeking the finance company’s liquidation. In May 2013, the bankruptcy court presiding over the finance company’s case entered an order converting the involuntary chapter 7 case to a chapter 11 case. Although the bankruptcy proceeding is in its earliest stages, we have performed certain field examinations and due diligence procedures and believes our loan participations are not subject to the misconduct alleged by the bank lenders. We also believe the loan participations are fully secured by the underlying collateral, including personal guarantees from one or more of the principals of each of the underlying seven borrowers. On May 31, 2013, we commenced an adverse proceeding against the finance company and the bank lenders seeking declaratory judgment that our loan participations are true participations and not subject to the bankruptcy estate or to the bank lender’s security interest in the finance company’s assets. The finance company and bank lenders are contesting our position. Although we believe the claims raised by the finance company and the senior lenders are without merit and will vigorously defend against them, we cannot at this time predict the outcome of this litigation or determine our potential exposure. If we are incorrect in our assessments our results of operations could be materially adversely affected.
There may be circumstances where our debt investments could be subordinated to claims of other creditors or we could be subject to lender liability claims.
Even though we may have structured most of our investments as senior loans, if one of our portfolio companies were to go bankrupt, depending on the facts and circumstances, including the extent to which we actually provided managerial assistance to that portfolio company, a bankruptcy court might recharacterize our debt investment and subordinate all or a portion of our claim to that of other creditors. We may also be subject to lender liability claims for actions taken by us with respect to a borrower’s business or instances where we exercise control over the borrower. It is possible that we could become subject to a lender’s liability claim, including as a result of actions taken in rendering significant managerial assistance.
27
Table of Contents
We may not control many of our portfolio companies.
We may not control many of our portfolio companies, even though we may have board representation or board observation rights, and our debt agreements may contain certain restrictive covenants. As a result, we are subject to the risk that a portfolio company in which we invest may make business decisions with which we disagree, and the management of such company may take risks or otherwise act in ways that do not serve our interests as debt investors.
We may not realize gains from our equity investments.
Certain investments that we have made in the past and may make in the future include warrants or other equity securities. In addition, we may from time to time make non-control, equity co-investments in companies in conjunction with private equity sponsors. Our goal is ultimately to realize gains upon our disposition of such equity interests. However, the equity interests we receive may not appreciate in value and, in fact, may decline in value. Accordingly, we may not be able to realize gains from our equity interests, and any gains that we do realize on the disposition of any equity interests may not be sufficient to offset any other losses we experience. We also may be unable to realize any value if a portfolio company does not have a liquidity event, such as a sale of the business, recapitalization, or public offering, which would allow us to sell the underlying equity interests.
Risks Relating to this Offering
Investing in our securities may involve an above average degree of risk.
The investments we make in accordance with our investment objective may result in a higher amount of risk than alternative investment options and volatility or loss of principal. Our investment in portfolio companies may be highly speculative and aggressive, and therefore, an investment in our securities may not be suitable for someone with a low risk tolerance.
There is a risk that investors in our equity securities may not receive dividends or that our dividends may not grow over time.
We intend to make distributions on a quarterly basis to our shareholders out of assets legally available for distribution. We cannot assure you that we will achieve investment results that will allow us to make a specified level of cash distributions or year-to-year increases in cash distributions. In addition, due to the asset coverage test applicable to us as a business development company, we may be limited in our ability to make distributions.
Our principal shareholders will continue to have substantial ownership in us and this could limit your ability to influence the outcome of key transactions, including a change of control.
As of September 19, 2013, Alvin Murstein and Andrew M. Murstein together beneficially own approximately 14.38% of the outstanding shares of our common stock. As a result, the Mursteins may be able to exert influence over our management and policies. The Mursteins may acquire additional shares of our equity securities in the future. This concentration of ownership may also have the effect of delaying, preventing, or deterring a change of control of our company, could deprive our shareholders of an opportunity to receive a premium for their common stock as part of a sale of our company and might ultimately affect the market price of our common stock.
The market price of our common stock may fluctuate significantly.
The market price and liquidity of the market for shares of our common stock may be significantly affected by numerous factors, some of which are beyond our control and may not be directly related to our operating performance. These factors include:
| • | significant volatility in the market price and trading volume of securities of business development companies or other companies in our sector, which are not necessarily related to the operating performance of these companies; |
28
Table of Contents
| • | changes in regulatory policies or tax guidelines, particularly with respect to RICs, business development companies or industrial banks; |
| • | loss of RIC status; |
| • | changes in earnings or variations in operating results; |
| • | changes in the value of our portfolio of investments; |
| • | any shortfall in revenue or net income or any increase in losses from levels expected by investors or securities analysts; |
| • | departure of our key personnel; |
| • | operating performance of companies comparable to us; |
| • | general economic trends and other external factors; and |
| • | loss of a major funding source. |
Shares of closed-end investment companies, including business development companies, may trade at a discount from net asset value.
Shares of closed-end investment companies, including business development companies, may trade at a discount from net asset value. This characteristic of closed-end investment companies and business development companies is separate and distinct from the risk that our net asset value per share may decline. We cannot predict whether our common stock will trade at, above, or below net asset value.
We may allocate the net proceeds from this offering in ways with which you may not agree.
We have significant flexibility in investing the net proceeds of this offering and may use the net proceeds from this offering in ways with which you may not agree.
Sales of substantial amounts of our common stock, or securities convertible into our common stock, may have an adverse effect on the market price of our common stock.
Sales of substantial amounts of our common stock, or securities convertible into our common stock, or the availability of such securities for sale, could adversely affect the prevailing market prices for our common stock. If this occurs and continues, it could impair our ability to raise additional capital through the sale of common stock should we desire to do so.
Certain provisions of our restated certificate of incorporation and restated bylaws as well as the Delaware General Corporation Law could deter takeover attempts and have an adverse impact on the price of our common stock.
Our restated certificate of incorporation and our restated bylaws as well as the Delaware General Corporation Law, or DGCL, contain provisions that may have the effect of discouraging a third party from making an acquisition proposal for us. These anti-takeover provisions may inhibit a change in control in circumstances that could give the holders of our common stock the opportunity to realize a premium over the market price for our common stock.
We are not rated by a credit rating agency to show the risks of an investment in our debt securities.
We are not rated by a credit rating agency to assess our ability to pay our obligations. A credit rating is not available to help show the risks of an investment in our debt securities.
29
Table of Contents
Investors in offerings of our common stock will likely incur immediate dilution upon the closing of such offering.
We generally expect the public offering price of any offering of shares of our common stock to be higher than the book value per share of our outstanding common stock (unless we offer shares pursuant to a rights offering or after obtaining prior approval for such issuance from our stockholders and our independent directors). Accordingly, investors purchasing shares of common stock in offerings pursuant to this prospectus may pay a price per share that exceeds the tangible book value per share after such offering and will experience immediate and substantial dilution in net asset value.
Some of the statements in this prospectus constitute forward-looking statements, which relate to future events or our future performance or financial condition. The forward-looking statements contained in this prospectus involve risks and uncertainties, including statements as to:
| • | our future operating results; |
| • | our business prospects and the prospects of our portfolio companies; |
| • | the impact of investments that we expect to make; |
| • | our contractual arrangements and relationships with third parties; |
| • | the dependence of our future success on the general economy and its impact on the industries in which we invest; |
| • | the ability of our portfolio companies to achieve their objectives; |
| • | our expected financings and investments; |
| • | the adequacy of our cash resources and working capital; |
| • | the timing of cash flows, if any, from the operations of our portfolio companies; |
| • | the adequacy of our internal controls; and |
| • | the presentation of our financial statements. |
We generally use words such as “anticipates,” “believes,” “expects,” “intends,” “plans” and similar expressions to identify forward-looking statements. Our actual results could differ materially from those projected in the forward-looking statements for any reason, including the factors set forth in “Risk Factors” and elsewhere in this prospectus.
We have based the forward-looking statements included in this prospectus on information available to us on the date of this prospectus, and we assume no obligation to update any such forward-looking statements. Although we undertake no obligation to revise or update any forward-looking statements, whether as a result of new information, future events or otherwise, you are advised to consult any additional disclosures that we may make directly to you or through reports that we in the future may file with the SEC, including annual reports on Form 10-K, quarterly reports on Form 10-Q, and current reports on Form 8-K.
30
Table of Contents
MANAGEMENT’S DISCUSSION AND ANALYSIS
OF FINANCIAL CONDITION AND RESULTS OF OPERATIONS
The information contained in this section should be read in conjunction with the Consolidated Financial Statements and Notes thereto for the six months ended June 30, 2013 and 2012 and years ended December 31, 2012, 2011, and 2010. In addition, this section contains forward-looking statements. These forward-looking statements are subject to the inherent uncertainties in predicting future results and conditions. Certain factors that could cause actual results and conditions to differ materially from those projected in these forward-looking statements are described in the “Risk Factors.” Additionally, more information about our business activities can be found in “Business.”
Critical Accounting Policies
The SEC has issued cautionary advice regarding disclosure about critical accounting policies. The SEC defines critical accounting policies as those that are both most important to the portrayal of a company’s financial condition and results, and that require management’s most difficult, subjective, or complex judgments, often as a result of the need to make estimates about matters that are inherently uncertain and may change materially in subsequent periods. The preparation of our consolidated financial statements requires estimates and assumptions that affect amounts reported and disclosed in the financial statements and related notes. Significant estimates made by us include valuation of loans, equity investments, and investments in subsidiaries, evaluation of the recoverability of accounts receivable and income tax assets, and the assessment of litigation and other contingencies. The matters that give rise to such provisions are inherently uncertain and may require complex and subjective judgments. Although we believe that estimates and assumptions used in determining the recorded amounts of net assets and liabilities at June 30, 2013 are reasonable, actual results could differ materially from the estimated amounts recorded in our financial statements.
General
We are a specialty finance company that has a leading position in originating, acquiring, and servicing loans that finance taxicab medallions and various types of commercial businesses. A wholly-owned portfolio company of ours, Medallion Bank, also originates consumer loans for the purchase of recreational vehicles, boats, motorcycles, and trailers, and to finance small-scale home improvements. Since 1996, the year in which we became a public company, through June 30, 2013, we have increased our taxicab medallion loan portfolio at a compound annual growth rate of 5%, and our commercial loan portfolio at a compound annual growth rate of 2% (10% and 7% on a managed basis when combined with Medallion Bank). Since Medallion Bank acquired a consumer loan portfolio and began originating consumer loans in 2004, it has increased its consumer loan portfolio at a compound annual growth rate of 15%. Total assets under our management and the management of our unconsolidated wholly-owned subsidiaries, which includes assets serviced for third party investors, were $1,255,849,000 as of June 30, 2013, and $1,219,224,000 and $1,159,971,000 as of December 31, 2012 and June 30, 2012, and have grown at a compound annual growth rate of 11% from $215,000,000 at the end of 1996.
Our loan-related earnings depend primarily on our level of net interest income. Net interest income is the difference between the total yield on our loan portfolio and the average cost of borrowed funds. We fund our operations through a wide variety of interest-bearing sources, such as revolving bank facilities, bank certificates of deposit issued to customers, debentures issued to and guaranteed by the SBA, and bank term debt. Net interest income fluctuates with changes in the yield on our loan portfolio and changes in the cost of borrowed funds, as well as changes in the amount of interest-bearing assets and interest-bearing liabilities held by us. Net interest income is also affected by economic, regulatory, and competitive factors that influence interest rates, loan demand, and the availability of funding to finance our lending activities. We, like other financial institutions, are subject to interest rate risk to the degree that our interest-earning assets reprice on a different basis than our interest-bearing liabilities.
31
Table of Contents
We also provide debt, mezzanine, and equity investment capital to companies in a variety of industries, consistent with our investment objectives. These investments may be venture capital style investments which may not be fully collateralized. Medallion Capital’s investments are typically in the form of secured debt instruments with fixed interest rates accompanied by warrants to purchase an equity interest for a nominal exercise price (such warrants are included in equity investments on the consolidated balance sheets). Interest income is earned on the debt instruments.
We are a closed-end, management investment company under the 1940 Act. We have elected to be treated as a business development company under the 1940 Act. We have also elected to be treated for federal income tax purposes as a RIC under Subchapter M of the Code. As a RIC, we generally do not have to pay corporate-level federal income taxes on any net ordinary income or capital gains that we distribute to our shareholders as dividends if we meet certain source-of-income and asset diversification requirements. Medallion Bank is not a RIC and must pay corporate-level U.S. federal and state income taxes.
Our wholly-owned portfolio company, Medallion Bank, is a Utah industrial bank regulated by the FDIC and the Utah Department of Financial Institutions which originates taxicab medallion, commercial, and consumer loans, raises deposits, and conducts other banking activities. Medallion Bank generally provides us with our lowest cost of funds which it raises through bank certificates of deposit issued to its customers. To take advantage of this low cost of funds, we refer a portion of our taxicab medallion and commercial loans to Medallion Bank, which then originates these loans. However, the FDIC restricts the amount of taxicab medallion loans that Medallion Bank may finance to three times Tier 1 capital, or $357,363,000 as of June 30, 2013. We earn referral fees for these activities. All of these servicing activities have been assigned to MSC. As a non-investment company, Medallion Bank is not consolidated with the Company.
Realized gains or losses on investments are recognized when the investments are sold or written off. The realized gains or losses represent the difference between the proceeds received from the disposition of portfolio assets, if any, and the cost of such portfolio assets. In addition, changes in unrealized appreciation or depreciation on investments are recorded and represent the net change in the estimated fair values of the portfolio assets at the end of the period as compared with their estimated fair values at the beginning of the period. Generally, realized gains (losses) on investments and changes in unrealized appreciation (depreciation) on investments are inversely related. When an appreciated asset is sold to realize a gain, a decrease in the previously recorded unrealized appreciation occurs. Conversely, when a loss previously recorded as unrealized depreciation is realized by the sale or other disposition of a depreciated portfolio asset, the reclassification of the loss from unrealized to realized causes a decrease in net unrealized depreciation and an increase in realized loss.
Our investment in Medallion Bank, as a wholly-owned portfolio investment, is also subject to quarterly assessments of fair value. We conduct a thorough valuation analysis and also receive an opinion regarding the valuation from an independent third party to assist the Board of Directors in its determination of the fair value of Medallion Bank. We determine whether any factors give rise to a valuation different than recorded book value, including various regulatory restrictions that were established at Medallion Bank’s inception, by the FDIC and State of Utah, and also by additional regulatory restrictions, such as the prior moratorium imposed by the Dodd-Frank Act on the acquisition of control of an industrial bank by a “commercial firm” (a company whose gross revenues are primarily derived from non-financial activities) which expired in July 2013. As a result of this valuation process, we used Medallion Bank’s actual results of operations as the best estimate of changes in fair value, and recorded the results as a component of unrealized appreciation (depreciation) on investments, although changes in these restrictions and other applicable factors could change these conclusions in the future. For more information, see “Risk Factors—Risks Relating to Our Business and Structure—Our investment portfolio is, and will continue to be, recorded at fair value as determined in good faith by our Board of Directors and, as a result, there is, and will continue to be, uncertainty as to the value of our portfolio investments which could adversely affect our net asset value.”
32
Table of Contents
Trends in Investment Portfolio
Our investment income is driven by the principal amount of and yields on our investment portfolio. To identify trends in the balances and yields, the following table illustrates our investments at fair value, grouped by medallion loans, commercial loans, equity investments, and investment securities, and also presents the portfolio information for Medallion Bank, at the dates indicated.
| June 30, 2013 | June 30, 2012 | December 31, 2012 | December 31, 2011 | December 31, 2010 | ||||||||||||||||||||||||||||||||||||
| (Dollars in thousands) |
Interest Rate(1) |
Investment Balances |
Interest Rate(1) |
Investment Balances |
Interest Rate(1) |
Investment Balances |
Interest Rate(1) |
Investment Balances |
Interest Rate(1) |
Investment Balances |
||||||||||||||||||||||||||||||
| Medallion loans |
||||||||||||||||||||||||||||||||||||||||
| New York |
3.58 | % | $ | 204,578 | 4.43 | % | $ | 201,452 | 3.96 | % | $ | 208,564 | 4.66 | % | $ | 227,426 | 5.52 | % | $ | 239,435 | ||||||||||||||||||||
| Chicago |
5.00 | 39,260 | 5.45 | 35,355 | 5.28 | 40,405 | 5.79 | 34,200 | 6.69 | 34,832 | ||||||||||||||||||||||||||||||
| Newark |
5.26 | 21,975 | 7.11 | 16,625 | 6.70 | 17,342 | 7.38 | 17,693 | 7.81 | 19,777 | ||||||||||||||||||||||||||||||
| Boston |
5.98 | 19,109 | 6.14 | 14,895 | 5.47 | 19,713 | 6.56 | 16,955 | 6.74 | 18,237 | ||||||||||||||||||||||||||||||
| Cambridge |
5.40 | 5,745 | 6.51 | 6,048 | 5.74 | 5,260 | 6.62 | 6,179 | 6.72 | 5,501 | ||||||||||||||||||||||||||||||
| Other |
6.40 | 3,279 | 6.74 | 3,021 | 6.70 | 2,899 | 6.54 | 4,318 | 7.05 | 5,047 | ||||||||||||||||||||||||||||||
|
|
|
|
|
|
|
|
|
|
|
|||||||||||||||||||||||||||||||
| Total medallion loans |
4.12 | 293,946 | 4.89 | 277,396 | 4.46 | 294,183 | 5.11 | 306,771 | 5.90 | 322,830 | ||||||||||||||||||||||||||||||
|
|
|
|
|
|
|
|
|
|
|
|||||||||||||||||||||||||||||||
| Deferred loan acquisition costs |
83 | 360 | 205 | 396 | 296 | |||||||||||||||||||||||||||||||||||
| Unrealized depreciation on loans |
— | — | — | — | — | |||||||||||||||||||||||||||||||||||
|
|
|
|
|
|
|
|
|
|
|
|||||||||||||||||||||||||||||||
| Net medallion loans |
$ | 294,029 | $ | 277,756 | $ | 294,388 | $ | 307,167 | $ | 323,126 | ||||||||||||||||||||||||||||||
|
|
|
|
|
|
|
|
|
|
|
|||||||||||||||||||||||||||||||
| Commercial loans |
||||||||||||||||||||||||||||||||||||||||
| Secured mezzanine |
12.68 | % | $ | 48,200 | 13.54 | % | $ | 53,649 | 13.04 | % | $ | 49,456 | 14.04 | % | $ | 51,622 | 14.41 | % | $ | 68,299 | ||||||||||||||||||||
| Asset based |
5.69 | 7,207 | 5.71 | 7,123 | 5.79 | 7,631 | 5.77 | 9,388 | 5.73 | 10,234 | ||||||||||||||||||||||||||||||
| Other secured commercial |
9.32 | 11,822 | 8.32 | 8,120 | 8.01 | 7,754 | 8.06 | 7,539 | 7.50 | 9,873 | ||||||||||||||||||||||||||||||
|
|
|
|
|
|
|
|
|
|
|
|
|
|
|
|||||||||||||||||||||||||||
| Total commercial loans |
11.34 | 67,229 | 12.11 | 68,892 | 11.59 | 64,841 | 12.25 | 68,549 | 12.63 | 88,406 | ||||||||||||||||||||||||||||||
|
|
|
|
|
|
|
|
|
|
|
|||||||||||||||||||||||||||||||
| Deferred loan acquisition income |
(40 | ) | (52 | ) | (78 | ) | (92 | ) | (323 | ) | ||||||||||||||||||||||||||||||
| Unrealized depreciation on loans |
(7,960 | ) | (14,560 | ) | (7,844 | ) | (14,298 | ) | (11,217 | ) | ||||||||||||||||||||||||||||||
|
|
|
|
|
|
|
|
|
|
|
|||||||||||||||||||||||||||||||
| Net commercial loans |
$ | 59,229 | $ | 54,280 | $ | 56,919 | $ | 54,159 | $ | 76,866 | ||||||||||||||||||||||||||||||
|
|
|
|
|
|
|
|
|
|
|
|||||||||||||||||||||||||||||||
| Investment in Medallion Bank and other controlled subsidiaries, net |
11.46 | % | $ | 100,343 | 8.99 | % | $ | 89,035 | 10.60 | % | $ | 99,083 | 6.40 | % | $ | 85,932 | 5.08 | % | $ | 78,735 | (3) | |||||||||||||||||||
|
|
|
|
|
|
|
|
|
|
|
|
|
|
|
|
|
|
|
|
|
|||||||||||||||||||||
| Equity investments |
0.98 | % | $ | 5,914 | 1.64 | % | $ | 4,575 | 1.66 | % | $ | 4,576 | 2.26 | % | $ | 3,472 | 1.48 | % | $ | 4,588 | ||||||||||||||||||||
|
|
|
|
|
|
|
|
|
|
|
|||||||||||||||||||||||||||||||
| Unrealized appreciation on equities |
825 | 825 | 44 | 1,105 | 201 | |||||||||||||||||||||||||||||||||||
|
|
|
|
|
|
|
|
|
|
|
|||||||||||||||||||||||||||||||
| Net equity investments |
$ | 6,739 | $ | 5,400 | $ | 4,620 | $ | 4,577 | $ | 4,789 | ||||||||||||||||||||||||||||||
|
|
|
|
|
|
|
|
|
|
|
|||||||||||||||||||||||||||||||
| Investment securities |
— | % | $ | — | — | % | $ | — | — | % | $ | — | — | % | $ | — | — | % | $ | — | ||||||||||||||||||||
|
|
|
|
|
|
|
|
|
|
|
|
|
|
|
|
|
|
|
|
|
|||||||||||||||||||||
| Investments at cost |
6.69 | % | $ | 467,432 | 6.81 | % | $ | 439,898 | 6.75 | % | $ | 462,683 | 6.38 | % | $ | 464,724 | 6.93 | % | $ | 494,559 | (3) | |||||||||||||||||||
|
|
|
|
|
|
|
|
|
|
|
|
|
|
|
|
|
|
|
|
|
|||||||||||||||||||||
| Deferred loan acquisition (income) costs |
43 | 308 | 127 | 304 | (27 | ) | ||||||||||||||||||||||||||||||||||
| Unrealized appreciation on equities |
825 | 825 | 44 | 1,105 | 201 | |||||||||||||||||||||||||||||||||||
| Unrealized depreciation on loans |
(7,960 | ) | (14,560 | ) | (7,844 | ) | (14,298 | ) | (11,217 | ) | ||||||||||||||||||||||||||||||
|
|
|
|
|
|
|
|
|
|
|
|||||||||||||||||||||||||||||||
| Net investments |
$ | 460,340 | $ | 426,471 | $ | 455,010 | $ | 451,835 | $ | 483,516 | ||||||||||||||||||||||||||||||
|
|
|
|
|
|
|
|
|
|
|
|||||||||||||||||||||||||||||||
| Medallion Bank investments |
||||||||||||||||||||||||||||||||||||||||
| Medallion loans |
3.86 | % | $ | 343,825 | 4.53 | % | $ | 313,164 | 4.17 | % | $ | 337,108 | 4.79 | % | $ | 294,214 | 5.57 | % | $ | 260,808 | ||||||||||||||||||||
| Consumer loans |
16.22 | 311,968 | 17.39 | 232,884 | 16.81 | 264,691 | 17.73 | 199,843 | 17.94 | 189,752 | ||||||||||||||||||||||||||||||
| Commercial loans |
4.95 | 65,095 | 5.05 | 75,451 | 4.94 | 70,103 | 4.97 | 76,606 | 5.06 | 73,574 | ||||||||||||||||||||||||||||||
| Investment securities |
2.45 | 22,498 | 2.72 | 20,680 | 2.37 | 20,951 | 2.51 | 25,419 | 3.32 | 20,479 | ||||||||||||||||||||||||||||||
|
|
|
|
|
|
|
|
|
|
|
|
|
|
|
|
|
|
|
|
|
|||||||||||||||||||||
| Medallion Bank investments at cost(2) |
9.10 | 743,386 | 9.20 | 642,179 | 9.02 | 692,853 | 9.06 | 596,082 | 9.73 | 544,613 | ||||||||||||||||||||||||||||||
|
|
|
|
|
|
|
|
|
|
|
|||||||||||||||||||||||||||||||
| Deferred loan acquisition costs |
8,524 | 6,417 | 7,019 | 5,597 | 5,559 | |||||||||||||||||||||||||||||||||||
| Unrealized appreciation (depreciation) on investment securities |
(137 | ) | 896 | 835 | 714 | 144 | ||||||||||||||||||||||||||||||||||
| Premiums paid on purchased securities |
315 | 315 | 336 | 403 | 164 | |||||||||||||||||||||||||||||||||||
| Unrealized depreciation on loans |
(17,290 | ) | (14,766 | ) | (14,636 | ) | (14,576 | ) | (13,645 | ) | ||||||||||||||||||||||||||||||
|
|
|
|
|
|
|
|
|
|
|
|||||||||||||||||||||||||||||||
| Medallion Bank net investments |
$ | 734,798 | $ | 635,041 | $ | 686,407 | $ | 588,220 | $ | 536,835 | ||||||||||||||||||||||||||||||
|
|
|
|
|
|
|
|
|
|
|
|||||||||||||||||||||||||||||||
| (1) | Represents the weighted average interest or dividend rate of the respective portfolio as of the date indicated. |
| (2) | The weighted average interest rate for the entire managed loan portfolio (medallion, commercial, and consumer loans) was 8.03% and 8.31% at June 30, 2013 and 2012 and 8.02%, 8.18%, and 8.82% at December 31, 2012, 2011, and 2010. |
| (3) | Includes $1,389 for unrealized appreciation on Medallion Hamptons Holding as of December 31, 2010. |
33
Table of Contents
Investment Activity
The following table sets forth the components of investment activity in the investment portfolio for the periods indicated:
| Six Months Ended June 30,(4) |
Year ended December 31(4) | |||||||||||||||||||
| (Dollars in thousands) |
2013 | 2012 | 2012 | 2011 | 2010 | |||||||||||||||
| Net investments at beginning of period |
$ | 455,010 | $ | 451,835 | $ | 956,626 | $ | 946,343 | $ | 846,542 | ||||||||||
| Investments originated(1) |
134,100 | 67,314 | 492,077 | 471,194 | 525,872 | |||||||||||||||
| Repayments of investments(1) |
(131,287 | ) | (96,194 | ) | (383,298 | ) | (438,646 | ) | (392,417 | ) | ||||||||||
| Net realized gains (losses) on investments(2) |
81 | 265 | (11,081 | ) | (6,810 | ) | (18,333 | ) | ||||||||||||
| Net increase in unrealized appreciation (depreciation)(3) |
2,570 | 3,325 | 4,525 | (4,038 | ) | 66 | ||||||||||||||
| Transfers to other assets/liabilities, net |
— | — | (7,748 | ) | (9,171 | ) | (13,478 | ) | ||||||||||||
| Amortization of origination costs |
(134 | ) | (74 | ) | (2,466 | ) | (2,246 | ) | (1,909 | ) | ||||||||||
|
|
|
|
|
|
|
|
|
|
|
|||||||||||
| Net increase (decrease) in investments |
5,330 | (25,364 | ) | 92,009 | 10,283 | 99,801 | ||||||||||||||
|
|
|
|
|
|
|
|
|
|
|
|||||||||||
| Net investments at end of period |
$ | 460,340 | $ | 426,471 | $ | 1,048,635 | $ | 956,626 | $ | 946,343 | ||||||||||
|
|
|
|
|
|
|
|
|
|
|
|||||||||||
| (1) | Includes refinancings. |
| (2) | Excludes net realized losses of $74 for the year ended December 31, 2012, related to foreclosed properties, and net realized losses of $779 for the year ended December 31, 2010, related to the investment in SPAC 2, which were carried in other assets on the consolidated balance sheet. |
| (3) | Excludes net unrealized appreciation (depreciation) of $5,865 and $4,389 for the six months ended June 30, 2013 and 2012, and $9,193, $3,455, and $2,153 for the years ended December 31, 2012, 2011, and 2010, related to foreclosed properties, which were carried in other assets on the consolidated balance sheet, and the reversal of unrealized depreciation of $759 for the year ended December 31, 2010, related to the realized loss on the SPAC 2 investment. |
| (4) | Consistent with the presentation in our quarterly and annual SEC filings, the six month data reflects the investment activity of Medallion Financial only, while the full year data is presented on a managed basis, including the activity of Medallion Bank. |
Portfolio Summary
Total Portfolio Yield
The weighted average yield of the total portfolio at June 30, 2013 was 6.69% (5.46% for the loan portfolio), a decrease of 6 basis points from 6.75% at December 31, 2012, and a decrease of 12 basis points from 6.81% at June 30, 2012. The weighted average yield of the total managed portfolio at June 30, 2013 was 7.84% (8.03% for the loan portfolio), an increase of 1 basis point from 7.83% at December 31, 2012, and a decrease of 29 basis points from 8.13% at June 30, 2012. The slight changes in 2013 reflected changes in the portfolio mix.
Medallion Loan Portfolio
Our medallion loans comprised 64% of the net portfolio of $460,340,000 at June 30, 2013, compared to 65% of the net portfolio of $455,010,000 at December 31, 2012, and 65% of $426,471,000 at June 30, 2012. Our managed medallion loans of $637,054,000 comprised 58% of the net managed portfolio of $1,100,518,000 at June 30, 2013, compared to 60% of the net managed portfolio of $1,048,635,000 at December 31, 2012, and 60% of $976,360,000 at June 30, 2012. The medallion loan portfolio decreased by $359,000 or less than 1% in 2013 (an increase of $6,451,000 or 1% on a managed basis), primarily reflecting loan participations sold and the movement of loans to Medallion Bank. Total medallion loans serviced for third parties were $25,340,000, $57,676,000, and $83,441,000 at June 30, 2013, December 31, 2012, and June 30, 2012.
34
Table of Contents
The weighted average yield of the medallion loan portfolio at June 30, 2013 was 4.12%, a decrease of 34 basis points from 4.46% at December 31, 2012, and a decrease of 77 basis points from 4.89% at June 30, 2012. The weighted average yield of the managed medallion loan portfolio at June 30, 2013 was 3.98%, a decrease of 33 basis points from 4.31% at December 31, 2012, and a decrease of 72 basis points from 4.70% at June 30, 2012. The decrease in yield primarily reflected the impact of falling interest rates in the economy and the effects of borrower refinancings. At June 30, 2013, 30% of the medallion loan portfolio represented loans outside New York, compared to 29% and 27% at December 31, 2012 and June 30, 2012. At June 30, 2013, 24% of the managed medallion loan portfolio represented loans outside New York, compared to 22% at December 31, 2012 and 21% at June 30, 2012. We continue to focus our efforts on originating higher yielding medallion loans outside the New York market.
Commercial Loan Portfolio
Our commercial loans represented 13%, 12%, and 13% of the net investment portfolio as of June 30, 2013, December 31, 2012, and June 30, 2012, and were 11%, 12%, and 13% on a managed basis. Commercial loans increased by $2,310,000 or 4% during 2013 (decreased $5,076,000 or 4% on a managed basis), primarily reflecting increases in the secured mezzanine portfolio. Net commercial loans serviced by third parties were $12,090,000 at June 30, 2013, $12,575,000 at December 31, 2012, and $13,984,000 at June 30, 2012.
The weighted average yield of the commercial loan portfolio at June 30, 2013 was 11.34%, a decrease of 25 basis points from 11.59% at December 31, 2012, and a decrease of 77 basis points from 12.11% at June 30, 2012. The weighted average yield of the managed commercial loan portfolio at June 30, 2013 was 8.20%, an increase of 7 basis points from 8.13% at December 31, 2012, and a decrease of 22 basis points from 8.42% at June 30, 2012. The fluctuations primarily reflect changes in the portfolio mix and changes in the rates earned. We continue to originate adjustable-rate and floating-rate loans tied to the prime rate to help mitigate our interest rate risk in a rising interest rate environment. At June 30, 2013, variable-rate loans represented approximately 12% of the commercial portfolio, compared to 13% and 11% at December 31, 2012 and June 30, 2012, and were 53%, 56%, and 55% on a managed basis. Although this strategy initially produces a lower yield, we believe that this strategy mitigates interest rate risk by better matching our earning assets to their adjustable-rate funding sources.
Consumer Loan Portfolio
Our managed consumer loans, all of which are held in the portfolio managed by Medallion Bank, represented 28%, 25%, and 23% of the managed net investment portfolio as of June 30, 2013, December 31, 2012, and June 30, 2012. Medallion Bank originates adjustable rate consumer loans secured by recreational vehicles, boats, motorcycles, and trailers, and also finances small-scale home improvements in all 50 states. The portfolio is serviced by a third party subsidiary of a major commercial bank.
The weighted average gross yield of the managed consumer loan portfolio was 16.22% at June 30, 2013, compared to 16.81% and 17.39% at December 31, 2012 and June 30, 2012. Adjustable rate loans represented 72%, 76%, and 80% of the managed consumer portfolio at June 30, 2013, December 31, 2012, and June 30, 2012.
Delinquency and Loan Loss Experience
We generally follow a practice of discontinuing the accrual of interest income on our loans that are in arrears as to payments for a period of 90 days or more. We deliver a default notice and begin foreclosure and liquidation proceedings when management determines that pursuit of these remedies is the most appropriate course of action under the circumstances. A loan is considered to be delinquent if the borrower fails to make a payment on time; however, during the course of discussion on delinquent status, we may agree to modify the payment terms of the loan with a borrower that cannot make payments in accordance with the original loan agreement. For loan modifications, the loan will only be returned to accrual status if all past due interest payments are brought fully current. For credit that is collateral based, we evaluate the anticipated net residual value we would receive upon foreclosure of such loans, if necessary. There can be no assurance, however, that the collateral securing these loans will be adequate in the event of foreclosure. For credit that is cash flow-based, we assess our collateral position, and evaluate most of these relationships as ongoing businesses, expecting to locate and install a new operator to run the business and reduce the debt.
35
Table of Contents
For the consumer loan portfolio, the process to repossess the collateral is started at 60 days past due. If the collateral is not located and the account reaches 120 days delinquent, the account is charged off to realized losses. If the collateral is repossessed, a realized loss is recorded to write the collateral down to 75% of its net realizable value, and the collateral is sent to auction. When the collateral is sold, the net auction proceeds are applied to the account, and any remaining balance is written off as a realized loss, and any excess proceeds are recorded as a realized gain. Proceeds collected on charged off accounts are recorded as realized gains. All collection, repossession, and recovery efforts are handled on behalf of Medallion Bank by the third party servicer.
The following table shows the trend in loans 90 days or more past due as of the dates shown.
| June 30, 2013 | June 30, 2012 | December 31, 2012 | December 31, 2011 | December 31, 2010 | ||||||||||||||||||||||||||||||||||||
| (Dollars in thousands) |
Amount | %(1) | Amount | %(1) | Amount | %(1) | Amount | %(1) | Amount | %(1) | ||||||||||||||||||||||||||||||
| Medallion loans |
$ | — | 0.0 | % | $ | 580 | 0.2 | % | $ | — | 0.0 | % | $ | 35 | 0.0 | % | $ | 361 | 0.1 | % | ||||||||||||||||||||
|
|
|
|
|
|
|
|
|
|
|
|
|
|
|
|
|
|
|
|
|
|||||||||||||||||||||
| Commercial loans |
||||||||||||||||||||||||||||||||||||||||
| Secured mezzanine |
2,182 | 0.6 | 8,845 | 2.5 | 2,380 | 0.7 | 14,930 | 4.0 | 9,391 | 2.3 | ||||||||||||||||||||||||||||||
| Asset-based receivable |
205 | 0.1 | — | 0.0 | — | 0.0 | — | 0.0 | — | 0.0 | ||||||||||||||||||||||||||||||
| Other secured commercial |
492 | 0.1 | — | 0.0 | — | 0.0 | 390 | 0.1 | 1,364 | 0.3 | ||||||||||||||||||||||||||||||
|
|
|
|
|
|
|
|
|
|
|
|
|
|
|
|
|
|
|
|
|
|||||||||||||||||||||
| Total commercial loans |
2,879 | 0.8 | 8,845 | 2.5 | 2,380 | 0.7 | 15,320 | 4.1 | 10,755 | 2.6 | ||||||||||||||||||||||||||||||
|
|
|
|
|
|
|
|
|
|
|
|
|
|
|
|
|
|
|
|
|
|||||||||||||||||||||
| Total loans 90 days or more past due |
$ | 2,879 | 0.8 | % | $ | 9,425 | 2.7 | % | $ | 2,380 | 0.7 | % | $ | 15,355 | 4.1 | % | $ | 11,116 | 2.7 | % | ||||||||||||||||||||
|
|
|
|
|
|
|
|
|
|
|
|
|
|
|
|
|
|
|
|
|
|||||||||||||||||||||
| Total Medallion Bank loans |
$ | 1,198 | 0.2 | % | $ | 887 | 0.1 | % | $ | 1,252 | 0.2 | % | $ | 1,265 | 0.2 | % | $ | 2,246 | 0.4 | % | ||||||||||||||||||||
|
|
|
|
|
|
|
|
|
|
|
|
|
|
|
|
|
|
|
|
|
|||||||||||||||||||||
| Total managed loans 90 days or more past due |
$ | 4,077 | 0.4 | % | $ | 10,312 | 1.1 | % | $ | 3,632 | 0.4 | % | $ | 16,620 | 1.8 | % | $ | 13,362 | 1.4 | % | ||||||||||||||||||||
|
|
|
|
|
|
|
|
|
|
|
|
|
|
|
|
|
|
|
|
|
|||||||||||||||||||||
| (1) | Percentages are calculated against the total or managed loan portfolio, as appropriate. |
A third party finance company sold various participations in asset based loans to Medallion Business Credit and Medallion Bank. At June 30, 2013, the aggregate balance of the participations was approximately $13.8 million, $12.9 million of which were held by Medallion Bank. That amount is divided between seven separate borrowers operating in a variety of industries. In April 2013, the finance company became the subject of an involuntary bankruptcy petition filed by its bank lenders. Among other things, the bank lenders alleged that the finance company fraudulently misrepresented its borrowing availability under its credit facility with the bank lenders and are seeking the finance company’s liquidation. In May 2013, the bankruptcy court presiding over the finance company’s case entered an order converting the involuntary chapter 7 case to a chapter 11 case. Although the bankruptcy proceeding is in its earliest stages, we have performed certain field examinations and due diligence procedures and believe our loan participations are not subject to the misconduct alleged by the bank lenders. We also believe the loan participations are fully secured by the underlying collateral, including personal guarantees from one or more of the principals of each of the underlying seven borrowers. We and Medallion Bank have received no payments on these accounts since March 31, 2013. Because of this and the inherent uncertainty associated with bankruptcy proceedings, we and Medallion Bank have placed these loans on nonaccrual, and have reversed interest income of $52,000 and $170,000 in that regard, and in addition, have established valuation allowances against the outstanding balances of 20% or $169,000 and $2,587,000. On May 31, 2013, we commenced an adverse proceeding against the finance company and the bank lenders seeking declaratory judgment that its loan participations are true participations and not subject to the bankruptcy estate or to the bank lender’s security interest in the finance company’s assets. The finance company and bank lenders are contesting our position. Although we believe the claims raised by the finance company and the bank lenders are without merit and will vigorously defend against them, we cannot at this time predict the outcome of this litigation or determine our potential exposure.
In general, collection efforts since the establishment of our collection department have contributed to the reduction in overall delinquencies of medallion and other secured commercial loans. Medallion loan delinquencies remained low. Secured mezzanine delinquencies improved reflecting collection and restructuring efforts. Medallion Bank continued with low levels of delinquency in its consumer loan portfolio. In addition to the delinquencies in the loan portfolio as described above, a receivable from bonuses related to certain
36
Table of Contents
investments of $6,468,000 was more than 90 days delinquent at June 30, 2013. We are actively working with each delinquent borrower/obligor to bring them current, and believe that any potential loss exposure is reflected in our mark-to-market estimates on each investment. Although there can be no assurances as to changes in the trend rate and further negative changes in the economy, management believes that any loss exposures are properly reflected in reported asset values.
We monitor delinquent loans for possible exposure to loss by analyzing various factors, including the value of the collateral securing the loan and the borrower’s prior payment history. Under the 1940 Act, our loan portfolio must be recorded at fair value or “marked-to-market.” Unlike other lending institutions, we are not permitted to establish reserves for loan losses. Instead, the valuation of our portfolio is adjusted quarterly to reflect our estimate of the current realizable value of our loan portfolio. Since no ready market exists for this portfolio, fair value is subject to the good faith determination of our Board of Directors. Because of the subjectivity of these estimates, there can be no assurance that in the event of a foreclosure or the sale of portfolio loans we would be able to recover the amounts reflected on our balance sheet. For more information, see “Risk Factors—Risks Relating to Our Business and Structure—Our investment portfolio is, and will continue to be, recorded at fair value as determined in good faith by our Board of Directors and, as a result, there is, and will continue to be, uncertainty as to the value of our portfolio investments which could adversely affect our net asset value.”
In determining the value of our portfolio, the Board of Directors may take into consideration various factors such as the financial condition of the borrower and the adequacy of the collateral. For example, in a period of sustained increases in market interest rates the Board of Directors could decrease its valuation of the portfolio if the portfolio consists primarily of long-term, fixed-rate loans. Our valuation procedures are designed to generate values that approximate that which would have been established by market forces, and are therefore subject to uncertainties and variations from reported results. Based upon these factors, net unrealized appreciation or depreciation on investments is determined based on the fluctuations of our estimate of the current realizable value of our portfolio from our cost basis.
The following table sets forth the changes in our unrealized appreciation (depreciation) on investments, other than investments in controlled subsidiaries, for the periods shown below.
| (Dollars in thousands) |
Medallion Loans |
Commercial Loans |
Equity Investments |
Foreclosed Properties |
Total | |||||||||||||||
| Balance December 31, 2009 |
$ | — | ($ | 4,236 | ) | ($ | 8,101 | ) | $ | 18,956 | $ | 6,619 | ||||||||
| Net change in unrealized |
||||||||||||||||||||
| Appreciation on investments |
— | — | 545 | 2,153 | 2,698 | |||||||||||||||
| Depreciation on investments |
— | (7,172 | ) | (475 | ) | — | (7,647 | ) | ||||||||||||
| Reversal of unrealized appreciation |
||||||||||||||||||||
| Gains on investments |
— | — | — | — | — | |||||||||||||||
| Losses on investments(1) |
— | 191 | 8,232 | — | 8,423 | |||||||||||||||
|
|
|
|
|
|
|
|
|
|
|
|||||||||||
| Balance December 31, 2010 |
— | (11,217 | ) | 201 | 21,109 | 10,093 | ||||||||||||||
| Net change in unrealized |
||||||||||||||||||||
| Appreciation on investments |
— | — | 825 | 3,518 | 4,343 | |||||||||||||||
| Depreciation on investments |
— | (5,708 | ) | 79 | (63 | ) | (5,692 | ) | ||||||||||||
| Reversal of unrealized appreciation |
||||||||||||||||||||
| Gains on investments |
— | — | — | — | — | |||||||||||||||
| Losses on investments |
— | 2,627 | — | — | 2,627 | |||||||||||||||
|
|
|
|
|
|
|
|
|
|
|
|||||||||||
| Balance December 31, 2011 |
— | (14,298 | ) | 1,105 | 24,564 | 11,371 | ||||||||||||||
| Net change in unrealized |
||||||||||||||||||||
| Appreciation on investments |
— | — | (1,266 | ) | 9,129 | 7,863 | ||||||||||||||
| Depreciation on investments |
— | (759 | ) | 3 | (3 | ) | (759 | ) | ||||||||||||
| Reversal of unrealized appreciation |
||||||||||||||||||||
| Gains on investments |
— | — | — | — | — | |||||||||||||||
| Losses on investments |
— | 7,213 | 202 | 67 | 7,482 | |||||||||||||||
|
|
|
|
|
|
|
|
|
|
|
|||||||||||
| Balance December 31, 2012 |
$ | — | ($ | 7,844 | ) | $ | 44 | $ | 33,757 | $ | 25,957 | |||||||||
|
|
|
|
|
|
|
|
|
|
|
|||||||||||
37
Table of Contents
| (Dollars in thousands) |
Medallion Loans |
Commercial Loans |
Equity Investments |
Foreclosed Properties(1) |
Total | |||||||||||||||
| Balance December 31, 2012 |
$ | — | ($ | 7,844 | ) | $ | 44 | $ | 33,757 | $ | 25,957 | |||||||||
| Net change in unrealized |
||||||||||||||||||||
| Appreciation on investments |
— | — | (11 | ) | 3,012 | 3,001 | ||||||||||||||
| Depreciation on investments |
— | (50 | ) | 14 | — | (36 | ) | |||||||||||||
| Reversal of unrealized appreciation |
||||||||||||||||||||
| Gains on investments |
— | — | — | — | — | |||||||||||||||
| Losses on investments |
— | — | — | — | — | |||||||||||||||
|
|
|
|
|
|
|
|
|
|
|
|||||||||||
| Balance March 31, 2013 |
— | (7,894 | ) | 47 | 36,769 | 28,922 | ||||||||||||||
| Net change in unrealized |
||||||||||||||||||||
| Appreciation on investments |
— | — | 505 | 2,853 | 3,358 | |||||||||||||||
| Depreciation on investments |
— | (66 | ) | 273 | — | 207 | ||||||||||||||
| Reversal of unrealized appreciation |
||||||||||||||||||||
| Gains on investments |
— | — | — | — | — | |||||||||||||||
| Losses on investments |
— | — | — | — | — | |||||||||||||||
|
|
|
|
|
|
|
|
|
|
|
|||||||||||
| Balance June 30, 2013 |
$ | — | ($ | 7,960 | ) | $ | 825 | $ | 39,622 | $ | 32,487 | |||||||||
|
|
|
|
|
|
|
|
|
|
|
|||||||||||
| (Dollars in thousands) |
Medallion Loans |
Commercial Loans |
Equity Investments |
Foreclosed Properties(1) |
Total | |||||||||||||||
| Balance December 31, 2011 |
$ | — | ($ | 14,298 | ) | $ | 1,105 | $ | 24,564 | $ | 11,371 | |||||||||
| Net change in unrealized |
||||||||||||||||||||
| Appreciation on investments |
— | — | (213 | ) | 2,377 | 2,164 | ||||||||||||||
| Depreciation on investments |
— | (659 | ) | 51 | 33 | (575 | ) | |||||||||||||
| Reversal of unrealized appreciation |
||||||||||||||||||||
| Gains on investments |
— | — | — | — | — | |||||||||||||||
| Losses on investments |
— | 424 | — | — | 424 | |||||||||||||||
|
|
|
|
|
|
|
|
|
|
|
|||||||||||
| Balance March 31, 2012 |
— | (14,533 | ) | 943 | 26,974 | 13,384 | ||||||||||||||
| Net change in unrealized |
||||||||||||||||||||
| Appreciation on investments |
— | — | (92 | ) | 1,997 | 1,905 | ||||||||||||||
| Depreciation on investments |
— | (27 | ) | (28 | ) | (18 | ) | (73 | ) | |||||||||||
| Reversal of unrealized appreciation |
||||||||||||||||||||
| Gains on investments |
— | — | — | — | — | |||||||||||||||
| Losses on investments |
— | — | 2 | — | 2 | |||||||||||||||
|
|
|
|
|
|
|
|
|
|
|
|||||||||||
| Balance June 30, 2012 |
$ | — | ($ | 14,560 | ) | $ | 825 | $ | 28,953 | $ | 15,218 | |||||||||
|
|
|
|
|
|
|
|
|
|
|
|||||||||||
| (1) | Includes the reversal of unrealized depreciation of $7,720 related to the investments in SPAC and SPAC 2 which were written off in 2010. See Note 10 to the consolidated financial statements for additional information on these investments. |
| (2) | Foreclosed properties are held in other assets on the consolidated balance sheet. |
38
Table of Contents
The following table presents credit-related information for the investment portfolios as of as of the dates shown.
| (Dollars in thousands) |
June 30, 2013 |
June 30, 2012 |
December 31, 2012 |
December 31, 2011 |
December 31, 2010 |
|||||||||||||||
| Total loans |
||||||||||||||||||||
| Medallion loans |
$ | 294,029 | $ | 277,756 | $ | 294,388 | $ | 307,167 | $ | 323,126 | ||||||||||
| Commercial loans |
59,229 | 54,280 | 56,919 | 54,159 | 76,866 | |||||||||||||||
|
|
|
|
|
|
|
|
|
|
|
|||||||||||
| Total loans |
353,258 | 332,036 | 351,307 | 361,326 | 399,992 | |||||||||||||||
| Investment in Medallion Bank and other controlled subsidiaries |
100,343 | 89,035 | 99,083 | 85,932 | 78,735 | |||||||||||||||
| Equity investments(1) |
6,739 | 5,400 | 4,620 | 4,577 | 4,789 | |||||||||||||||
| Investment securities |
— | — | — | — | — | |||||||||||||||
|
|
|
|
|
|
|
|
|
|
|
|||||||||||
| Net investments |
$ | 460,340 | $ | 426,471 | $ | 455,010 | $ | 451,835 | $ | 483,516 | ||||||||||
|
|
|
|
|
|
|
|
|
|
|
|||||||||||
| Net investments at Medallion Bank and other controlled subsidiaries |
$ | 734,398 | $ | 635,041 | $ | 686,407 | $ | 588,220 | $ | 536,835 | ||||||||||
| Managed net investments |
$ | 1,100,518 | $ | 976,360 | $ | 1,048,635 | $ | 956,626 | $ | 946,343 | ||||||||||
|
|
|
|
|
|
|
|
|
|
|
|||||||||||
| Unrealized appreciation (depreciation) on investments |
||||||||||||||||||||
| Medallion loans |
$ | — | $ | — | $ | — | $ | — | $ | — | ||||||||||
| Commercial loans |
(7,960 | ) | (14,560 | ) | (7,844 | ) | (14,298 | ) | (11,217 | ) | ||||||||||
|
|
|
|
|
|
|
|
|
|
|
|||||||||||
| Total loans |
(7,960 | ) | (14,560 | ) | (7,844 | ) | (14,298 | ) | (11,217 | ) | ||||||||||
| Investment in Medallion Bank and other controlled subsidiaries(2) |
— | — | — | — | — | |||||||||||||||
| Equity investments |
825 | 825 | 44 | 1,105 | 201 | |||||||||||||||
| Investment securities |
— | — | — | — | — | |||||||||||||||
|
|
|
|
|
|
|
|
|
|
|
|||||||||||
| Total unrealized depreciation on investments(2) |
($ | 7,135 | ) | ($ | 13,735 | ) | ($ | 7,800 | ) | ($ | 13,193 | ) | ($ | 11,016 | ) | |||||
|
|
|
|
|
|
|
|
|
|
|
|||||||||||
| Net unrealized depreciation on investments at Medallion Bank and other controlled subsidiaries |
($ | 17,427 | ) | ($ | 13,869 | ) | ($ | 13,801 | ) | ($ | 13,862 | ) | ($ | 13,501 | ) | |||||
| Managed total unrealized depreciation on investments(2) |
($ | 24,562 | ) | ($ | 27,604 | ) | ($ | 21,601 | ) | ($ | 27,055 | ) | ($ | 24,517 | ) | |||||
|
|
|
|
|
|
|
|
|
|
|
|||||||||||
| Unrealized appreciation (depreciation) as a % of balances outstanding(3) |
||||||||||||||||||||
| Medallion loans |
— | % | — | % | — | % | — | % | — | % | ||||||||||
| Commercial loans |
(11.84 | ) | (21.14 | ) | (12.10 | ) | (20.86 | ) | (12.69 | ) | ||||||||||
| Total loans |
(2.20 | ) | (4.20 | ) | (2.18 | ) | (3.81 | ) | (2.73 | ) | ||||||||||
| Investment in Medallion Bank and other controlled subsidiaries |
— | — | — | — | — | |||||||||||||||
| Equity investments |
13.96 | 18.03 | 0.97 | 31.82 | 4.37 | |||||||||||||||
| Investment securities |
— | — | — | — | — | |||||||||||||||
| Net investments |
(1.53 | ) | (3.12 | ) | (1.69 | ) | (2.84 | ) | (2.23 | ) | ||||||||||
|
|
|
|
|
|
|
|
|
|
|
|||||||||||
| Net investments at Medallion Bank and other controlled subsidiaries |
(2.34% | ) | (2.16% | ) | (1.99% | ) | (2.33% | ) | (2.48% | ) | ||||||||||
| Managed net investments |
(2.20% | ) | (2.77% | ) | (2.03% | ) | (2.77% | ) | (2.54% | ) | ||||||||||
|
|
|
|
|
|
|
|
|
|
|
|||||||||||
| (1) | Represents common stock and warrants held as investments. |
| (2) | Excludes $869, $0, $0, $0 and $1,389 for unrealized appreciation on Medallion Hamptons Holding, a wholly owned subsidiary at June 30, 2013 and 2012 and December 31, 2012, 2011 and 2010. |
| (3) | Unlike other lending institutions, we are not permitted to establish reserves for loan losses. Instead, the valuation of our portfolio is adjusted quarterly to reflect estimates of the current realizable value of the investment portfolio. These percentages represent the discount or premium that investments are carried on the books at, relative to their par or gross value. |
39
Table of Contents
The following table presents the gain/loss experience on the investment portfolios as of the dates shown.
| (Dollars in thousands) |
June 30, 2013 |
June 30, 2012 |
December 31, 2012 |
December 31, 2011 |
December 31, 2010 |
|||||||||||||||
| Realized gains (losses) on loans and equity investments(1) |
||||||||||||||||||||
| Medallion loans |
$ | 40 | $ | — | $ | 4 | $ | — | $ | — | ||||||||||
| Commercial loans |
41 | (412 | ) | (7,295 | ) | (2,672 | ) | (40 | ) | |||||||||||
|
|
|
|
|
|
|
|
|
|
|
|||||||||||
| Total loans |
81 | (412 | ) | (7,291 | ) | (2,672 | ) | (40 | ) | |||||||||||
| Investment in Medallion Bank and other controlled subsidiaries(2) |
— | — | — | — | (8,258 | ) | ||||||||||||||
| Equity investments |
— | 677 | 634 | 2,126 | 1,439 | |||||||||||||||
| Investment securities |
— | — | — | — | — | |||||||||||||||
|
|
|
|
|
|
|
|
|
|
|
|||||||||||
| Total realized gains (losses) on loans and equity investments(2) |
81 | 265 | ($ | 6,657 | ) | ($ | 546 | ) | ($ | 6,859 | ) | |||||||||
|
|
|
|
|
|
|
|
|
|
|
|||||||||||
| Net realized gains (losses) on investments at Medallion Bank and other controlled subsidiaries |
(2,444 | ) | (2,349 | ) | (4,424 | ) | (6,264 | ) | (11,474 | ) | ||||||||||
|
|
|
|
|
|
|
|
|
|
|
|||||||||||
| Total managed realized gains (losses) on loans and equity investments(2) |
($ | 2,363 | ) | ($ | 2,084 | ) | ($ | 11,081 | ) | ($ | 6,810 | ) | ($ | 18,333 | ) | |||||
|
|
|
|
|
|
|
|
|
|
|
|||||||||||
| Realized gains (losses) as a % of average balances outstanding |
||||||||||||||||||||
| Medallion loans |
0.03 | % | — | % | 0.00 | % | — | % | — | % | ||||||||||
| Commercial loans |
0.12 | (1.19 | ) | (10.60 | ) | (3.34 | ) | (0.05 | ) | |||||||||||
| Total loans |
0.05 | (0.23 | ) | (2.05 | ) | (0.68 | ) | (0.01 | ) | |||||||||||
| Investment in Medallion Bank and other controlled subsidiaries |
— | — | — | — | (11.04 | ) | ||||||||||||||
| Equity investments |
— | 33.19 | 14.79 | 55.30 | 41.04 | |||||||||||||||
| Investment securities |
— | — | — | — | — | |||||||||||||||
| Net investments |
0.04 | 0.12 | (1.47 | ) | (0.11 | ) | (1.43 | ) | ||||||||||||
|
|
|
|
|
|
|
|
|
|
|
|||||||||||
| Net investments at Medallion Bank and other controlled subsidiaries |
(0.69 | ) | (0.77 | ) | (0.69% | ) | (1.10% | ) | (2.33% | ) | ||||||||||
| Managed net investments |
(0.44% | ) | (0.43% | ) | (1.10% | ) | (0.70% | ) | (2.03% | ) | ||||||||||
|
|
|
|
|
|
|
|
|
|
|
|||||||||||
| (1) | Excludes realized gains (losses) of ($74), $0 and $0 for the years ended December 31, 2012, 2011, and 2010, related to foreclosed properties which are carried in other assets on the consolidated balance sheet. |
| (2) | Excludes $779 of net realized losses in 2010, related to the investment in SPAC 2, which was carried in other assets on the consolidated balance sheet. |
40
Table of Contents
The table below summarizes components of unrealized and realized gains and losses in the investment portfolios as of the dates shown.
| (Dollars in thousands) |
June 30, 2013 |
June 30, 2012 |
December 31, 2012 |
December 31, 2011 |
December 31, 2010 |
|||||||||||||||
| Net change in unrealized appreciation (depreciation) on investments |
||||||||||||||||||||
| Unrealized appreciation |
$ | 494 | ($ | 306 | ) | ($ | 1,266 | ) | $ | 825 | $ | 545 | ||||||||
| Unrealized depreciation |
170 | (662 | ) | (755 | ) | (5,629 | ) | (7,139 | ) | |||||||||||
| Net unrealized appreciation on investment in Medallion Bank and other controlled subsidiaries(1) |
1,906 | 3,867 | 7,896 | 7,668 | 12,535 | |||||||||||||||
| Realized gains |
— | — | — | — | — | |||||||||||||||
| Realized losses(2) |
— | 426 | 7,415 | 2,627 | 950 | |||||||||||||||
| Unrealized gains on foreclosed properties and other assets |
5,865 | 4,389 | 9,193 | 3,455 | 2,153 | |||||||||||||||
|
|
|
|
|
|
|
|
|
|
|
|||||||||||
| Total |
$ | 8,435 | $ | 7,714 | $ | 22,483 | $ | 8,946 | $ | 9,044 | ||||||||||
|
|
|
|
|
|
|
|
|
|
|
|||||||||||
| Net realized gains (losses) on investments |
||||||||||||||||||||
| Realized gains |
$ | — | $ | — | $ | — | $ | — | $ | — | ||||||||||
| Realized losses(3) |
— | (426 | ) | (7,415 | ) | (2,627 | ) | (8,423 | ) | |||||||||||
| Other gains |
— | 359 | 516 | 2,171 | 1,581 | |||||||||||||||
| Direct recoveries (charge-offs)(4) |
81 | 332 | 242 | (90 | ) | (796 | ) | |||||||||||||
| Realized gains (losses) on foreclosed properties and other assets |
— | — | (74 | ) | — | — | ||||||||||||||
|
|
|
|
|
|
|
|
|
|
|
|||||||||||
| Total |
$ | 81 | $ | 265 | ($ | 6,731 | ) | ($ | 546 | ) | ($ | 7,638 | ) | |||||||
|
|
|
|
|
|
|
|
|
|
|
|||||||||||
| (1) | Includes the reversal of $6,966 of net unrealized depreciation related to the investment in SPAC, including $508 that was recorded in 2010, and which was written off in 2010. |
| (2) | Includes the reversal of unrealized depreciation of $759 related to the investment in SPAC 2 which was written off in 2010, and which was carried in other assets on the consolidated balance sheet. |
| (3) | Represents the writeoffs related to the investments in SPAC and SPAC 2 in 2010. See Note 10 for additional information on these investments. |
| (4) | Includes $817 of direct charge-offs related to the settlement of the liabilities associated with the writeoff of SPAC and SPAC 2 in 2010, all of which represented a reversal of accrued expenses. |
Investment in Medallion Bank and Other Controlled Subsidiaries
Investment in Medallion Bank and other controlled subsidiaries represented 22%, 22%, and 21% of our total portfolio at June 30, 2013, December 31, 2012, and June 30, 2012. The portfolio company investments primarily represent the wholly-owned unconsolidated subsidiaries of ours, substantially all of which is represented by our investment in Medallion Bank, a non-pass-through, taxpaying entity. In addition, to facilitate maintenance of Medallion Bank’s capital ratio requirement and to provide the necessary capital for continued growth, we periodically make capital contributions to Medallion Bank. Separately, Medallion Bank declared dividends to us of $2,500,000 and $5,500,000 in the 2013 second quarter and six months, and $2,500,000 and $4,500,000 in the comparable 2012 periods. See Note 3 of the consolidated financial statements for additional information about these investments.
Equity Investments
Equity investments were 1% of our total portfolio at June 30, 2013, December 31, 2012, and June 30, 2012. Equity investments were 1% of our total managed portfolio at June 30, 2013, December 31, 2012, and June 30, 2012. Equity investments are comprised of common stock, partnership interests, and warrants.
41
Table of Contents
Investment Securities
Investment securities were 0% of our total portfolio at June 30, 2013, December 31, 2012, and June 30, 2012. Investment securities were 2% of our total managed portfolio at June 30, 2013, December 31, 2012, and June 30, 2012. The investment securities are primarily adjustable-rate mortgage-backed securities purchased by Medallion Bank to better utilize required cash liquidity.
Trend in Interest Expense
Our interest expense is driven by the interest rates payable on our short-term credit facilities with banks, bank certificates of deposit, fixed-rate, long-term debentures issued to the SBA, and other short-term notes payable. We established a medallion lending relationship with DZ Bank in December 2008, that provides for growth in the portfolio at generally lower rates than under prior facilities, all of which have been fully paid off. In addition, Medallion Bank began raising brokered bank certificates of deposit during 2004, which were at our lowest borrowing costs. As a result of Medallion Bank raising funds through certificates of deposit as previously noted, we were able to realign the ownership of some of our medallion loans and related assets to Medallion Bank allowing us and our subsidiaries to use cash generated through these transactions to retire debt with higher interest rates. In addition, Medallion Bank is able to bid on these deposits at a wide variety of maturity levels which allows for improved interest rate management strategies.
Our cost of funds is primarily driven by the rates paid on our various debt instruments and their relative mix, and changes in the levels of average borrowings outstanding. See Note 4 to the consolidated financial statements for details on the terms of all outstanding debt. Our debentures issued to the SBA typically have terms of ten years.
We measure our borrowing costs as our aggregate interest expense for all of our interest-bearing liabilities divided by the average amount of such liabilities outstanding during the period. The following table shows the average borrowings and related borrowing costs for the six months ended June 30, 2013 and 2012 and years ended December 31, 2012, 2011 and 2010. Our average balances declined and Medallion Bank’s average balances increased, reflecting the sourcing of more business to Medallion Bank, and an increase in loan participations sold. The decrease in borrowing costs reflected the trend of decreasing interest rates in the economy, and the repricing of term borrowings.
| (Dollars in thousands) |
Interest Expense |
Average Balance |
Average Borrowing Costs |
|||||||||
| June 30, 2013 |
||||||||||||
| Revolving lines of credit |
$ | 1,309 | $ | 159,284 | 1.66 | % | ||||||
| SBA debentures |
1,414 | 59,059 | 4.83 | |||||||||
| Notes payable to banks |
1,062 | 63,288 | 3.38 | |||||||||
| Preferred securities |
402 | 33,000 | 2.46 | |||||||||
|
|
|
|
|
|||||||||
| Total |
$ | 4,187 | $ | 314,631 | 2.68 | |||||||
|
|
|
|
|
|||||||||
| Medallion Bank borrowings |
$ | 2,606 | $ | 606,241 | 0.87 | |||||||
|
|
|
|
|
|||||||||
| Total managed borrowings |
$ | 6,793 | $ | 920,872 | 1.49 | |||||||
|
|
|
|
|
|
|
|||||||
| June 30, 2012 |
||||||||||||
| Revolving lines of credit |
$ | 1,556 | $ | 168,010 | 1.86 | % | ||||||
| SBA debentures |
1,871 | 62,144 | 6.06 | |||||||||
| Notes payable to banks |
1,459 | 70,798 | 4.14 | |||||||||
| Preferred securities |
1,269 | 33,000 | 7.73 | |||||||||
|
|
|
|
|
|||||||||
| Total |
$ | 6,155 | $ | 333,952 | 3.71 | |||||||
|
|
|
|
|
|||||||||
| Medallion Bank borrowings |
$ | 2,414 | $ | 516,020 | 0.94 | |||||||
|
|
|
|
|
|||||||||
| Total managed borrowings |
$ | 8,569 | $ | 849,972 | 2.03 | |||||||
|
|
|
|
|
|
|
|||||||
42
Table of Contents
| (Dollars in thousands) |
Interest Expense |
Average Balance |
Average Borrowing Costs |
|||||||||
| December 31, 2012 |
||||||||||||
| Revolving lines of credit |
$ | 2,890 | $ | 158,892 | 1.82 | % | ||||||
| SBA debentures |
3,464 | 59,550 | 5.82 | |||||||||
| Notes payable to banks |
2,502 | 62,939 | 3.97 | |||||||||
| Preferred securities |
2,002 | 33,000 | 6.07 | |||||||||
|
|
|
|
|
|||||||||
| Total |
$ | 10,858 | $ | 314,381 | 3.45 | |||||||
|
|
|
|
|
|||||||||
| Medallion Bank borrowings |
5,094 | 548,268 | 0.93 | |||||||||
|
|
|
|
|
|||||||||
| Total managed borrowings |
$ | 15,952 | $ | 862,649 | 1.85 | |||||||
|
|
|
|
|
|
|
|||||||
| December 31, 2011 |
||||||||||||
| Revolving lines of credit |
$ | 3,034 | $ | 174,081 | 1.74 | % | ||||||
| SBA debentures |
4,508 | 76,719 | 5.88 | |||||||||
| Notes payable to banks |
3,458 | 75,859 | 4.56 | |||||||||
| Preferred securities |
2,538 | 33,000 | 7.69 | |||||||||
|
|
|
|
|
|||||||||
| Total |
$ | 13,538 | $ | 359,659 | 3.76 | |||||||
|
|
|
|
|
|||||||||
| Medallion Bank borrowings |
6,058 | 486,414 | 1.25 | |||||||||
|
|
|
|
|
|||||||||
| Total managed borrowings |
$ | 19,596 | $ | 846,073 | 2.32 | |||||||
|
|
|
|
|
|
|
|||||||
| December 31, 2010 |
||||||||||||
| Revolving lines of credit |
$ | 3,205 | $ | 181,489 | 1.77 | % | ||||||
| SBA debentures |
5,449 | 85,113 | 6.40 | |||||||||
| Notes payable to banks |
3,393 | 67,041 | 5.06 | |||||||||
| Preferred securities |
2,538 | 33,000 | 7.69 | |||||||||
|
|
|
|
|
|||||||||
| Total |
$ | 14,585 | $ | 366,643 | 3.98 | |||||||
|
|
|
|
|
|||||||||
| Medallion Bank borrowings |
7,478 | 416,062 | 1.80 | |||||||||
|
|
|
|
|
|||||||||
| Total managed borrowings |
$ | 22,063 | $ | 782,705 | 2.82 | |||||||
|
|
|
|
|
|
|
|||||||
We will continue to seek SBA funding to the extent it offers attractive rates. SBA financing subjects its recipients to limits on the amount of secured bank debt they may incur. We use SBA funding to fund loans that qualify under Small Business Investment Act (SBIA) and SBA regulations. We believe that financing operations primarily with short-term floating rate secured bank debt has generally decreased our interest expense, but has also increased our exposure to the risk of increases in market interest rates, which we mitigate with certain interest rate strategies. At June 30, 2013 and 2012, short-term adjustable rate debt constituted 72% and 65% of total debt, and was 25% and 23% on a fully managed basis including the borrowings of Medallion Bank.
Factors Affecting Net Assets
Factors that affect our net assets include net realized gain or loss on investments and change in net unrealized appreciation or depreciation on investments. Net realized gain or loss on investments is the difference between the proceeds derived upon sale or foreclosure of a loan or an equity investment and the cost basis of such loan or equity investment. Change in net unrealized appreciation or depreciation on investments is the amount, if any, by which our estimate of the fair value of our investment portfolio is above or below the previously established fair value or the cost basis of the portfolio. Under the 1940 Act and the SBIA, our loan portfolio and other investments must be recorded at fair value.
Unlike certain lending institutions, we are not permitted to establish reserves for loan losses, but adjust quarterly the valuation of the investment portfolio to reflect our estimate of the current value of the total
43
Table of Contents
investment portfolio. Since no ready market exists for our investments, fair value is subject to our Board of Directors’ good faith determination. In determining such fair value, our Board of Directors considers factors such as the financial condition of our borrowers and the adequacy of their collateral. Any change in the fair value of portfolio investments or other investments as determined by our Board of Directors is reflected in net unrealized depreciation or appreciation on investments and affects net increase in net assets resulting from operations but has no impact on net investment income or distributable income.
Our investment in Medallion Bank, as a wholly-owned portfolio investment, is also subject to quarterly assessments of fair value. We conduct a thorough valuation analysis as described previously and also receive an opinion regarding the valuation from an independent third party to assist the Board of Directors in its determination of the fair value of Medallion Bank. We determine whether any factors give rise to valuation different than recorded book value, including various regulatory restrictions that were established at Medallion Bank’s inception, by the FDIC and State of Utah, and also by additional regulatory restrictions, such as the prior moratorium imposed by the Dodd-Frank Act on the acquisition of control of an industrial bank by a “commercial firm” (a company whose gross revenues are primarily derived from non-financial activities) which expired in July 2013. Because of these restrictions and other factors, our Board of Directors has determined that Medallion Bank has little value beyond its recorded book value. As a result of this valuation process, we used Medallion Bank’s actual results of operations as the best estimate of changes in fair value, and recorded the results as a component of unrealized appreciation (depreciation) on investments, although changes in these restrictions and other applicable factors could change these conclusions in the future.
Consolidated Results of Operations
2013 Second Quarter and Six Months compared to the 2012 periods
Net increase in net assets resulting from operations was $6,249,000 or $0.28 per diluted common share and $12,721,000 or $0.58 in the 2013 second quarter and six months, up $332,000 or 6% and $1,339,000 or 12% from $5,917,000 or $0.30 per share and $11,382,000 or $0.61 in the 2012 second quarter and six months, primarily reflecting higher net realized/unrealized gains and net interest income, partially offset by higher operating expenses and lower noninterest income in both periods. Net investment income after income taxes was $1,742,000 or $0.08 per share and $4,205,000 or $0.19 in the 2013 quarter and six months, down $51,000 or 3%, and up $802,000 or 24% from $1,793,000 or $0.09 per share and $3,403,000 or $0.18 in the 2012 quarter and six months.
Investment income was $7,543,000 and $15,789,000 in the 2013 second quarter and six months, down $521,000 or 6% and $138,000 or 1% from $8,064,000 and $15,927,000 in the year ago periods, and included $18,000 and $35,000 from interest recoveries and bonuses on certain investments in the 2013 quarter and six months, compared to $88,000 and $294,000 in the 2012 periods. Also included in the 2013 quarter and six months was $2,500,000 and $5,500,000 in dividends from Medallion Bank, compared to $2,500,000 and $4,500,000 in the comparable 2012 periods. Excluding those items, investment income decreased $451,000 or 8% in the quarter and $879,000 or 8% in the six months, primarily reflecting the repricing of the portfolios to lower current market interest rates, and the sourcing of a greater proportion of our business to Medallion Bank. The yield on the investment portfolio was 6.63% in the 2013 quarter, down 11% from 7.46% in 2012, and was 6.98% in the 2013 six months, down 4% from 7.29% in the 2012 six months. Excluding the extra interest and dividends, the 2013 second quarter and six month yields were down 13% and 11% to 4.41% and 4.53%, from 5.07% and 5.09%, in the 2012 quarter and six months, reflecting the general decrease in market interest rates and changes in the portfolio mix. Average investments outstanding were up 5% to $456,624,000 in the 2013 quarter and up 4% to $456,391,000 in the six months, from $434,728,000 and $439,545,000 in the year ago periods, primarily reflecting portfolio growth, partially offset by loan participations sold and loan payments received.
Medallion loans were $294,029,000 at quarter end, up $16,273,000 or 6% from $277,756,000 a year ago, representing 64% of the investment portfolio compared to 65% a year ago, and were yielding 4.12% compared to
44
Table of Contents
4.89% a year ago, a decrease of 16%, reflecting the repricing of the portfolio to lower current market interest rates. The increase in outstandings primarily reflected portfolio growth in all markets and a reduction in sold participations, partially offset by an increase in loans sourced to Medallion Bank and loan repayments. The managed medallion portfolio, which includes loans at Medallion Bank and those serviced for third parties, was $662,394,000 at quarter end, down $11,061,000 or 2% from $673,455,000 a year ago, reflecting the above. The commercial loan portfolio was $59,229,000 at quarter end, compared to $54,280,000 a year ago, an increase of $4,949,000 or 9%, and represented 13% of the investment portfolio in both periods. The increase primarily reflected growth in the other commercial secured and high-yield mezzanine loan portfolios. Commercial loans yielded 11.34% at quarter end, down 6% from 12.11% a year ago, primarily reflecting lower yields on the mezzanine portfolio. The net managed commercial loan portfolio, which includes loans at Medallion Bank and those serviced for or by third parties, was $108,889,000 at quarter end, down $5,780,000 or 5% from $114,669,000 a year ago, primarily reflecting the changes described above, and decreases and reserve increases in the asset-based loan portfolio at Medallion Bank. Investments in Medallion Bank and other controlled subsidiaries were $100,343,000 at quarter end, up $11,308,000 or 13% from $89,035,000 a year ago, primarily reflecting our equity in the earnings of Medallion Bank and other portfolio company investments and appreciation, and which represented 22% of the investment portfolio, compared to 21% a year ago, and which yielded 11.46% at quarter end, compared to 8.99% a year ago, reflecting the increased level of dividends from Medallion Bank. See Notes 3 and 10 of the consolidated financial statements for additional information about Medallion Bank and the other controlled subsidiaries. Equity investments were $6,739,000 at quarter end, up $1,339,000 or 25% from $5,400,000 a year ago, primarily reflecting increased equity investments, and represented 1% of the investment portfolio at both quarter ends, and had a dividend yield of 0.98%, compared to 1.64% a year ago. Investment securities were zero at both quarter ends. See page 33 for a table that shows balances and yields by type of investment.
Interest expense was $2,121,000 and $4,187,000 in the 2013 quarter and six months, down $787,000 or 27% and $1,968,000 or 32% from $2,908,000 and $6,155,000 in the 2012 periods. The decrease in interest expense was primarily due to reduced funding costs, and also by decreased borrowing levels. The cost of borrowed funds was 2.69% and 2.68% in the 2013 quarter and six months, compared to 3.64% and 3.71% in the year ago periods, decreases of 26% and 28%, reflecting the repricing of certain debt to lower interest rates, as well as the adjustable rate nature of much of our borrowings, and changes in our funding mix. Average debt outstanding was down 1% to $316,389,000 for the 2013 quarter, and was down 6% to $314,631,000 in the six months, compared to $320,973,000 and $333,952,000 in the year ago periods, primarily reflecting decreased borrowings as much of our portfolio growth has been in Medallion Bank. See page 42-43 for a table which shows average balances and cost of funds for our funding sources.
Net interest income was $5,422,000 and $11,602,000 and the net interest margin was 4.76% and 5.13% for the 2013 second quarter and six months, up $266,000 or 5% and $1,830,000 or 19% from $5,156,000 and $9,772,000 a year ago, which represented net interest margins of 4.77% and 4.47%, all reflecting the items discussed above.
Noninterest income, which is comprised of prepayment fees, servicing fee income, late charges, and other miscellaneous income was $327,000 and $623,000 in the 2013 second quarter and six months, down $15,000 or 4% and $54,000 or 8% from $342,000 and $677,000 a year ago, primarily reflecting lower late charges.
Operating expenses were $4,007,000 and $8,020,000 in the 2013 second quarter and six months, up $302,000 or 8% and $974,000 or 14% from $3,705,000 and $7,046,000 in the 2012 periods. Salaries and benefits expense was $2,345,000 and $4,896,000 in the second quarter and six months, up $58,000 or 3% and $559,000 or 13% from $2,287,000 and $4,337,000 in 2012, primarily reflecting higher bonus accruals and stock-based compensation expense, partially offset by higher salary deferrals related to loan originations. Professional fees were $897,000 and $1,397,000 in the quarter and six months, up $460,000 and $648,000 or 87% from $437,000 and $749,000 a year ago, primarily reflecting higher legal fees associated with the realization of certain portfolio investments and other legal matters, and from higher consultant and accounting costs related to investment
45
Table of Contents
activities, portfolio valuations, and assistance with enhancements to the operating environment. Occupancy expense was $191,000 and $391,000 in the quarter and six months, down $18,000 or 9% and $30,000 or 7% from $209,000 and $421,000 in the 2012 periods, primarily reflecting higher rent allocated to unconsolidated portfolio companies. Other operating expenses of $574,000 and $1,336,000 in 2013 were down $198,000 or 26% and $203,000 or 13% from $772,000 and $1,539,000 a year ago, primarily reflecting lower other operating expenses and franchise tax accruals, partially offset by higher travel and entertainment expenses and advertising expenses; and in the six months, also by higher directors fees and lower travel and entertainment expenses.
Income tax expense was $0 in the 2013 and 2012 second quarters and six months.
Net change in unrealized appreciation on investments was $4,503,000 and $8,435,000 in the 2013 second quarter and six months, compared to $3,801,000 and $7,714,000 in the 2012 second quarter and six months, an increase in appreciation of $702,000 or 18% in the quarter and $721,000 or 9% in the six months. Net change in unrealized appreciation other than the portion related to Medallion Bank and the other controlled subsidiaries, was appreciation of $3,565,000 and $6,529,000 in the 2013 quarter and six months, compared to $1,834,000 and $3,847,000 in the 2012 periods, resulting in increased appreciation of $1,731,000 or 94% and $2,682,000 or 70% in the 2012 quarter and six months. Unrealized appreciation (depreciation) arises when we make valuation adjustments to the investment portfolio. When investments are sold or written off, any resulting realized gain (loss) is grossed up to reflect previously recorded unrealized components. As a result, movement between periods can appear distorted. The 2013 activity resulted from net appreciation on foreclosed property of $2,853,000 ($5,864,000 in the six months), net appreciation on Medallion Bank and other controlled subsidiaries of $938,000 ($1,906,000 in the six months), and net unrealized appreciation on equity investments of $778,000 ($781,000 in the six months), partially offset by net unrealized depreciation on loans of $66,000 ($116,000 in the six months). The 2012 activity resulted from net appreciation on foreclosed property of $1,979,000 ($4,389,000 in the six months), net appreciation on Medallion Bank and other controlled subsidiaries of $1,967,000 ($3,867,000 in the six months), reversals of unrealized depreciation associated with fully depreciated loans which were charged off of $0 ($424,000 in the six months), and reversals of unrealized depreciation associated with equity investments which were sold of $2,000 ($2,000 in the six months) partially offset by net unrealized depreciation on equity investments of $120,000 ($282,000 in the six months) and net unrealized depreciation on loans of $27,000 ($686,000 in the six months). The net appreciation on Medallion Bank and other controlled subsidiaries described above is net of the dividends declared by them to us of $2,500,000 and $5,500,000 in the 2013 second quarter and six months, and were $2,500,000 and $4,500,000 in the comparable 2012 periods.
Our net realized gains on investments were $4,000 and $81,000 in the 2013 quarter and six months, compared to $323,000 and $265,000 in the 2012 quarter and six months, a decrease in realized gains of $319,000 or 99% in the quarter and $184,000 or 69% in the six months. The 2013 activity reflected net direct recoveries of $4,000 ($81,000 in the six months). The 2012 activity reflected net direct recoveries of $325,000 ($332,000 in the six months) and gains on the sale of equity investments of $0 ($359,000 in the six months), partially offset by the reversals described in the unrealized paragraph above.
Our net realized/unrealized gains on investments were $4,507,000 and $8,516,000 in the 2013 quarter and six months, compared to $4,124,000 and $7,979,000 in the 2012 periods, an increase of $383,000 or 9% and $537,000 or 7% in net gains in the 2013 periods, reflecting the above.
For the Years Ended December 31, 2012 and 2011
Net increase in net assets resulting from operations was $24,517,000 or $1.21 per diluted common share in 2012, up $5,354,000 or 28% from $19,163,000 or $1.09 per share in 2011, primarily reflecting higher net realized/unrealized gains and lower operating expenses, partially offset by lower net interest and noninterest income. Net investment income after taxes was $8,765,000 or $0.43 per share in 2012, down $1,998,000 or 19% from $10,763,000 or $0.61 in 2011.
46
Table of Contents
Investment income was $32,344,000 in 2012, down $4,883,000 or 13% from $37,227,000 a year ago, and included $444,000 from interest recoveries and bonuses on certain investments in 2012, compared to $4,070,000 in 2011. Also included in 2012 and 2011 were $10,500,000 and $5,500,000 in dividends from Medallion Bank. Excluding those items, investment income decreased $6,257,000 or 23%, primarily reflecting the repricing of the portfolios to lower current market interest rates, and the sourcing of a greater proportion of our business to Medallion Bank. The yield on the investment portfolio was 7.37% in 2012, down 8% from 8.01% in 2011. Excluding the extra interest and dividends, the 2012 yield was down 18% to 4.87% from 5.95% in 2011, reflecting the general decrease in market interest rates and changes in the portfolio mix. Average investments outstanding were $439,100,000 in 2012, down 5% from $464,541,000 a year ago, primarily reflecting portfolio growth, more than offset by loan participations sold and loan payments received.
Medallion loans were $294,388,000 at year end, down $12,779,000 or 4% from $307,167,000 a year ago, representing 65% of the investment portfolio, compared to 68% a year ago, and were yielding 4.46% compared to 5.11% a year ago, a decrease of 13%, reflecting the repricing of the portfolio to lower current market interest rates. The decrease in outstandings primarily reflected the sourcing of more business to Medallion Bank and repayments, primarily in the New York market, partially offset by portfolio growth, particularly in Chicago. The managed medallion portfolio, which includes loans at Medallion Bank and those serviced for third parties, was $688,279,000 at year end, up $11,746,000 or 2% from $676,533,000 a year ago, reflecting the above and the strong overall portfolio growth at Medallion Bank, particularly in the New York and Chicago markets, partially offset by a reduction in third party participations sold. The commercial loan portfolio was $56,919,000 at year end, compared to $54,159,000 a year ago, an increase of $2,760,000 or 5%, and represented 12% of the investment portfolio in both periods. The increase primarily reflected growth in the high-yield mezzanine loan portfolio, partly offset by repayments in the asset-based loan portfolio. Commercial loans yielded 11.59% at year end, down 5% from 12.25% a year ago, reflecting the change in portfolio mix and lower yields on the mezzanine portfolio. The net managed commercial loan portfolio, which includes loans at Medallion Bank and those serviced for or by third parties, was $113,481,000 at year end, down $1,890,000 or 2% from $115,371,000 a year ago, primarily reflecting the changes described above and decreases in Medallion Bank’s asset-based portfolio. Investments in Medallion Bank and other controlled subsidiaries were $99,083,000 at year end, up $13,151,000 or 15% from $85,932,000 a year ago, primarily reflecting our equity in the earnings of Medallion Bank, and which represented 22% of the investment portfolio, compared to 19% a year ago, and which yielded 10.60% at year end, compared to 6.40% a year ago, reflecting the increased level of dividends from Medallion Bank. See Notes 3 and 10 of the consolidated financial statements for additional information about Medallion Bank and the other controlled subsidiaries. Equity investments were $4,620,000 at year end, up $43,000 or 1% from $4,577,000 a year ago, primarily reflecting increased equity purchases and portfolio depreciation, and represented 1% of the investment portfolio at both year ends, and had a dividend yield of 1.66%, compared to 2.26% a year ago. Investment securities were zero at both year ends. See page 33 for a table that shows balances and yields by type of investment.
Interest expense was $10,858,000 in 2012, down $2,680,000 or 20% from $13,538,000 in 2011. The decrease in interest expense was primarily due to decreased levels of borrowing, but also reflected reduced funding costs. The cost of borrowed funds was 3.45% in 2012, compared to 3.76% a year ago, a decrease of 8%, reflecting the adjustable rate nature of much of our borrowings, and changes in our funding mix. Average debt outstanding was $314,380,000 in 2012, compared to $359,659,000 a year ago, a decrease of 13%, primarily reflecting decreased borrowings as much of our portfolio growth has been in Medallion Bank. See page 42-43 for a table which shows average balances and cost of funds for our funding sources.
Net interest income was $21,486,000 and the net interest margin was 4.89% in 2012, down $2,203,000 or 9% from $23,689,000 a year ago, which represented a net interest margin of 5.10%, all reflecting the items discussed above.
Noninterest income, which is comprised of prepayment fees, servicing fee income, late charges, and other miscellaneous income was $1,135,000 in 2012, down $50,000 or 4% from $1,185,000 a year ago, primarily reflecting lower servicing and other fees generated from the portfolio base at Medallion Bank.
47
Table of Contents
Operating expenses were $13,856,000 in 2012, down $255,000 or 2% from $14,111,000 in 2011. Salaries and benefits expense was $8,862,000 in the year, up $382,000 or 5% from $8,480,000 in 2011, primarily reflecting higher stock-based compensation expense and salaries, partially offset by lower bonus accruals and higher salary deferrals related to loan originations. Professional fees were $1,381,000 in 2012, down $134,000 or 9% from $1,515,000 a year ago, primarily reflecting lower accounting and other professional expenses, partially offset by higher legal expenses. Occupancy expense was $828,000 in 2012, down $83,000 or 9% from $911,000 in 2011, primarily reflecting higher rent allocated to unconsolidated portfolio companies. Other operating expenses of $2,785,000 in 2012 were down $420,000 or 13% from $3,205,000 a year ago, primarily reflecting higher expense reimbursements from Medallion Bank, and lower director’s fees, other operating expenses, franchise taxes, investment-related expenses, and telephone costs, partially offset by higher travel and entertainment expenses.
Income tax expense was $0 in 2012 and 2011.
Net change in unrealized appreciation on investments was $22,483,000 in 2012, compared to $8,946,000 in 2011, an increase in appreciation of $13,537,000. Net change in unrealized appreciation (depreciation), net of the net change in unrealized appreciation or depreciation on Medallion Bank and the other controlled subsidiaries, was appreciation of $14,587,000 in 2012, compared $1,278,000 in 2011, resulting in increased appreciation of $13,309,000 in 2012. Unrealized appreciation (depreciation) arises when we make valuation adjustments to the investment portfolio. When investments are sold or written off, any resulting realized gain (loss) is grossed up to reflect previously recorded unrealized components. As a result, movement between periods can appear distorted. The 2012 activity resulted from net appreciation on foreclosed property of $9,193,000, net appreciation on Medallion Bank and other controlled subsidiaries of $7,896,000, reversals of unrealized depreciation associated with fully depreciated loans which were charged off of $7,213,000, and reversals of unrealized depreciation associated with equity investments which were sold of $202,000, partially offset by net unrealized depreciation on equity investments of $1,263,000 and net unrealized depreciation on loans of $758,000. The 2011 activity resulted from net appreciation on Medallion Bank and other controlled subsidiaries of $7,668,000, net appreciation on foreclosed property of $3,455,000, reversals of unrealized depreciation associated with fully depreciated loans which were charged off of $2,627,000, and net unrealized appreciation on equity investments of $904,000, partially offset by net unrealized depreciation on loans of $5,708,000. The net appreciation or depreciation on Medallion Bank and other controlled subsidiaries described above is net of the dividends declared by them to us of $10,500,000 in 2012 and $5,500,000 in 2011.
Our net realized losses on investments were $6,731,000 in 2012, compared to $546,000 in 2011, an increase in realized losses of $6,185,000 in 2012. The 2012 activity reflected the reversals described in the unrealized paragraph above and net realized losses on sales of foreclosed property of $74,000, partially offset by gains on the sale of equity investments of $516,000 and net direct recoveries of $242,000. The 2011 activity reflected the reversals described above and net direct chargeoffs of $90,000, partially offset by gains on the sale of equity investments of $2,171,000.
Our net realized/unrealized gains on investments were $15,752,000 in 2012, compared to $8,400,000 in 2011, an increase of $7,352,000 of net gains in the year, reflecting the above.
For the Years Ended December 31, 2011 and 2010
Net increase in net assets resulting from operations was $19,163,000 or $1.09 per diluted common share in 2011, up $7,884,000 or 70% from $11,279,000 or $0.64 per share in 2010, primarily reflecting higher net realized/unrealized gains, lower operating expenses, and higher net interest income, partially offset by lower noninterest income. Net investment income after taxes was $10,763,000 or $0.61 per share in 2011, up $890,000 or 9% from $9,873,000 or $0.56 in 2010.
48
Table of Contents
Investment income was $37,227,000 in 2011, down $26,000 from $37,253,000 a year ago, and included $4,070,000 from interest recoveries and bonuses on certain investments in 2011, compared to $2,678,000 in 2010. Also included in 2011 and 2010 were $5,500,000 and $4,000,000 in dividends from Medallion Bank, respectively. Excluding those items, investment income decreased $2,918,000 or 10%, primarily reflecting changes in the yields earned and the sourcing of a greater proportion of our business to Medallion Bank. The yield on the investment portfolio was 8.01% in 2011, up 1% from 7.91% in 2010. Excluding the extra interest and dividends, the 2011 yield was down 8% to 5.95% from 6.49% in 2010, reflecting the general decrease in market interest rates and changes in the portfolio mix. Average investments outstanding were $464,541,000 in 2011, down 1% from $471,105,000 a year ago, primarily reflecting portfolio growth, partially offset by loan participations sold and loan payments received.
Medallion loans were $307,167,000 at year end, down $15,959,000 or 5% from $323,126,000 a year ago, representing 68% of the investment portfolio compared to 67% a year ago, and were yielding 5.11% compared to 5.90% a year ago, a decrease of 13%, reflecting the repricing of the portfolio to lower current market interest rates. The decrease in outstandings primarily reflected sold participations and repayments, primarily in the New York market, partially offset by portfolio growth. The managed medallion portfolio, which includes loans at Medallion Bank and those serviced for third parties, was $676,533,000 at year end, up $29,006,000 or 4% from $647,527,000 a year ago, reflecting the above and the strong overall portfolio growth at Medallion Bank, particularly in the New York market. The commercial loan portfolio was $54,159,000 at year end, compared to $76,866,000 a year ago, a decrease of $22,707,000 or 30%, and represented 12% of the investment portfolio compared to 16% a year ago. The decrease primarily reflected repayments and reserve increases in the high-yield mezzanine loan portfolio. Commercial loans yielded 12.06% at year end, down 3% from 12.44% a year ago, reflecting the general reduction in market interest rates and changes in the portfolio mix. The net managed commercial loan portfolio, which includes loans at Medallion Bank and those serviced for or by third parties, was $115,371,000 at year end, down $21,914,000 or 16% from $137,285,000 a year ago, primarily reflecting the changes described above and increases in Medallion Bank’s asset-based portfolio, mostly offset by decreases in other secured commercial loans. Investments in Medallion Bank and other controlled subsidiaries were $85,932,000 at year end, up $7,197,000 or 9% from $78,735,000 a year ago, primarily reflecting our equity in the earnings of Medallion Bank, and which represented 19% of the investment portfolio, compared to 16% a year ago, and which yielded 6.40% at year end, compared to 5.08% a year ago, reflecting the increased 2011 fourth quarter dividend from Medallion Bank. See Notes 3 and 10 of the consolidated financial statements for additional information about Medallion Bank and the other controlled subsidiaries. Equity investments were $4,577,000 at year end, down $212,000 or 4% from $4,789,000 a year ago, primarily reflecting portfolio dispositions, partially offset by portfolio appreciation, and represented 1% of the investment portfolio at both year ends, and had a dividend yield of 2.26%, compared to 1.48% a year ago. Investment securities were zero at both year ends. See page 33 for a table that shows balances and yields by type of investment.
Interest expense was $13,538,000 in 2011, down $1,047,000 or 7% from $14,585,000 in 2010. The decrease in interest expense was primarily due to the decreased cost of borrowed funds. The cost of borrowed funds was 3.76% in 2011, compared to 3.98% a year ago, a decrease of 6%, reflecting the adjustable rate nature of much of our borrowings, and changes in our funding mix. Average debt outstanding was $359,659,000 in 2011, compared to $366,643,000 a year ago, a decrease of 2%, primarily reflecting the stabilization of our borrowing needs as much of our portfolio growth was in Medallion Bank. See pages 42-43 for a table which shows average balances and cost of funds for our funding sources.
Net interest income was $23,689,000 and the net interest margin was 5.10% in 2011, up $1,021,000 or 5% from $22,668,000 a year ago, which represented a net interest margin of 4.81%, all reflecting the items discussed above.
Noninterest income, which is comprised of prepayment fees, servicing fee income, late charges, and other miscellaneous income was $1,185,000 in 2011, down $2,348,000 or 66% from $3,533,000 a year ago, primarily reflecting lower servicing and other fees generated from the portfolio base at Medallion Bank, and lower
49
Table of Contents
prepayment fees. Excluded from noninterest income in 2011 was $5,492,000, compared to $412,000 in 2010, of servicing fee income, which beginning in the 2010 fourth quarter was assigned to Medallion Servicing Corp. (MSC), a wholly-owned unconsolidated portfolio company, established for the purpose of conducting most of the servicing activities for Medallion Bank.
Operating expenses were $14,111,000 in 2011, down $2,217,000 or 14% from $16,328,000 in 2010, which included $1,622,000 of 2010 expense reversals associated with potential liabilities of the SPAC’s. Also, excluded from operating expenses in 2011 and 2010 was $5,659,000 and $349,000, respectively, of servicing-related expenses, which beginning in the 2010 fourth quarter were charged to MSC. Excluding the SPAC and MSC amounts, operating expenses increased $1,471,000 or 8% in 2011. Salaries and benefits expense was $8,480,000 in the year, down $2,059,000 or 20% from $10,539,000 in 2010, and which reflected $3,908,000 and $225,000 of MSC allocations in 2011 and 2010. Excluding the MSC allocations, salaries and benefits expense increased $1,624,000 or 15%, primarily reflecting higher salary levels and bonus accruals. Professional fees were $1,515,000 in 2011, down $824,000 or 35% from $2,339,000 a year ago, and which reflected $250,000 and $25,000 of MSC allocations in 2011 and 2010. Excluding the MSC allocations, professional fees expense decreased $599,000 or 25%, primarily reflecting higher 2010 legal and other professional expenses related to costs associated with a cancelled equity initiative, various investment opportunities, and the MFC reorganization, and lower accounting costs in 2011. Occupancy expense was $911,000 in 2011, down $419,000 or 32% from $1,330,000 in 2010, and which reflected $550,000 and $43,000 of MSC allocations in 2011 and 2010. Excluding the MSC allocations, occupancy expense increased $88,000 or 6%, primarily reflecting scheduled rent increases. Other operating expenses of $3,205,000 in 2011 were up $1,085,000 or 51% from $2,120,000 a year ago, primarily reflecting $1,622,000 of 2010 expense reversals associated with potential liabilities of the SPAC’s, and also which reflected $951,000 and $56,000 of MSC allocations in 2011 and 2010. Excluding the SPAC and MSC amounts, other operating expenses increased $358,000 or 9%, primarily reflecting lower expense reimbursements from Medallion Bank and higher travel and entertainment expenses.
Income tax expense was $0 in 2011 and 2010.
Net change in unrealized appreciation on investments was $8,946,000 in 2011, compared to $9,044,000 in 2010, a decrease in appreciation of $98,000 or 1%. Net change in unrealized appreciation (depreciation), net of the net change in unrealized appreciation or depreciation on Medallion Bank and the other controlled subsidiaries, was appreciation of $1,278,000 in 2011, compared to depreciation of $3,491,000 in 2010, resulting in increased appreciation of $4,769,000 in 2011. Unrealized appreciation (depreciation) arises when we make valuation adjustments to the investment portfolio. When investments are sold or written off, any resulting realized gain (loss) is grossed up to reflect previously recorded unrealized components. As a result, movement between periods can appear distorted. The 2011 activity resulted from net appreciation on Medallion Bank and other controlled subsidiaries of $7,668,000, net appreciation on foreclosed property of $3,455,000, reversals of unrealized depreciation associated with fully depreciated loans which were charged off of $2,627,000, and net unrealized appreciation on equity investments of $904,000, partially offset by net unrealized depreciation on loans of $5,708,000. The 2010 activity resulted from net appreciation on Medallion Bank and other controlled subsidiaries of $12,535,000, net appreciation on foreclosed property of $2,153,000, reversals of unrealized depreciation associated with equity investments (SPAC 2) which were charged off of $759,000, net unrealized appreciation on equity investments of $556,000, and reversals of unrealized depreciation associated with fully depreciated loans which were charged off of $191,000, partially offset by net unrealized depreciation on loans of $7,150,000. The net appreciation or depreciation on Medallion Bank and other controlled subsidiaries described above is net of the dividends declared by them to us of $5,500,000 in 2011 and $4,000,000 in 2010, and also in 2010 included the reversal of unrealized depreciation of $7,473,000 related to the writeoffs of the SPAC investments realized in the 2010 first quarter.
Our net realized losses on investments were $546,000 in 2011, compared to $7,638,000 in 2010, a decrease in realized losses of $7,092,000 in 2011. The 2011 activity reflected gains on the sale of equity investments of
50
Table of Contents
$2,171,000 and net direct chargeoffs of $90,000. The 2010 activity reflected the reversals described in the unrealized paragraph above and net direct chargeoffs of $796,000, partially offset by net direct gains on the sale of investments of $1,581,000.
Our net realized/unrealized gains on investments were $8,400,000 in 2011, compared to $1,406,000 in 2010, an increase of $6,994,000 of net gains in the year, reflecting the above.
Asset/Liability Management
Interest Rate Sensitivity
We, like other financial institutions, are subject to interest rate risk to the extent that our interest-earning assets (consisting of medallion, commercial, and consumer loans; and investment securities) reprice on a different basis over time in comparison to our interest-bearing liabilities (consisting primarily of credit facilities with banks and other lenders, bank certificates of deposit, and SBA debentures).
Having interest-bearing liabilities that mature or reprice more frequently on average than assets may be beneficial in times of declining interest rates, although such an asset/liability structure may result in declining net earnings during periods of rising interest rates. Abrupt increases in market rates of interest may have an adverse impact on our earnings until we are able to originate new loans at the higher prevailing interest rates. Conversely, having interest-earning assets that mature or reprice more frequently on average than liabilities may be beneficial in times of rising interest rates, although this asset/liability structure may result in declining net earnings during periods of falling interest rates. This mismatch between maturities and interest rate sensitivities of our interest-earning assets and interest-bearing liabilities results in interest rate risk.
The effect of changes in interest rates is mitigated by regular turnover of the portfolio. Based on past experience, we anticipate that approximately 40% of the taxicab medallion portfolio will mature or be prepaid each year. We believe that the average life of our loan portfolio varies to some extent as a function of changes in interest rates. Borrowers are more likely to exercise prepayment rights in a decreasing interest rate environment because the interest rate payable on the borrower’s loan is high relative to prevailing interest rates. Conversely, borrowers are less likely to prepay in a rising interest rate environment. However, borrowers may prepay for a variety of other reasons, such as to monetize increases in the underlying collateral values, particularly in the medallion loan portfolio.
In addition, we manage our exposure to increases in market rates of interest by incurring fixed-rate indebtedness, such as ten year subordinated SBA debentures, and by setting repricing intervals or the maturities of tranches drawn under the revolving lines of credit or issued as certificates of deposit, for terms of up to five years. We had outstanding SBA debentures of $58,635,000 with a weighted average interest rate of 4.44%, constituting 17% of our total indebtedness as of June 30, 2013. Also, as of June 30, 2013, portions of the adjustable rate debt with banks repriced at intervals of as long as 26 months, and certain of the certificates of deposit were for terms of up to 59 months, further mitigating the immediate impact of changes in market interest rates.
A relative measure of interest rate risk can be derived from our interest rate sensitivity gap. The interest rate sensitivity gap represents the difference between interest-earning assets and interest-bearing liabilities, which mature and/or reprice within specified intervals of time. The gap is considered to be positive when repriceable assets exceed repriceable liabilities, and negative when repriceable liabilities exceed repriceable assets. A relative measure of interest rate sensitivity is provided by the cumulative difference between interest sensitive assets and interest sensitive liabilities for a given time interval expressed as a percentage of total assets.
The following table presents our interest rate sensitivity gap at June 30, 2013, compared to the respective positions at the end of 2012 and 2010. The principal amounts of interest earning assets are assigned to the time
51
Table of Contents
frames in which such principal amounts are contractually obligated to be repriced. We have not reflected an assumed annual prepayment rate for such assets in this table.
| June 30, 2013 Cumulative Rate Gap(1) |
||||||||||||||||||||||||||||||||
| (Dollars in thousands) |
Less Than 1 Year |
More Than 1 and Less Than 2 Years |
More Than 2 and Less Than 3 Years |
More Than 3 and Less Than 4 Years |
More Than 4 and Less Than 5 Years |
More Than 5 and Less Than 6 Years |
Thereafter | Total | ||||||||||||||||||||||||
| Earning assets |
||||||||||||||||||||||||||||||||
| Floating-rate |
$ | 7,207 | $ | — | $ | — | $ | — | $ | — | $ | — | $ | — | $ | 7,207 | ||||||||||||||||
| Adjustable rate |
120 | 3,355 | 539 | 575 | — | — | — | 4,589 | ||||||||||||||||||||||||
| Fixed-rate |
26,795 | 46,538 | 185,500 | 47,413 | 39,490 | 500 | 3,144 | 349,380 | ||||||||||||||||||||||||
| Cash |
41,458 | — | — | — | — | — | — | 41,458 | ||||||||||||||||||||||||
|
|
|
|
|
|
|
|
|
|
|
|
|
|
|
|
|
|||||||||||||||||
| Total earning assets |
$ | 75,580 | $ | 49,893 | $ | 186,039 | $ | 47,988 | $ | 39,490 | $ | 500 | $ | 3,144 | $ | 402,634 | ||||||||||||||||
|
|
|
|
|
|
|
|
|
|
|
|
|
|
|
|
|
|||||||||||||||||
| Interest bearing liabilities |
||||||||||||||||||||||||||||||||
| Revolving lines of credit |
$ | 166,255 | $ | — | $ | — | $ | — | $ | — | $ | — | $ | — | $ | 166,255 | ||||||||||||||||
| Notes payable to banks |
47,033 | 25,182 | 229 | 12,364 | — | — | — | 84,808 | ||||||||||||||||||||||||
| SBA debentures |
9,150 | 6,500 | 4,000 | — | — | 3,000 | 35,985 | 58,635 | ||||||||||||||||||||||||
| Preferred securities |
33,000 | — | — | — | — | — | — | 33,000 | ||||||||||||||||||||||||
|
|
|
|
|
|
|
|
|
|
|
|
|
|
|
|
|
|||||||||||||||||
| Total liabilities |
$ | 255,438 | $ | 31,682 | $ | 4,229 | $ | 12,364 | $ | — | $ | 3,000 | $ | 35,985 | $ | 342,698 | ||||||||||||||||
|
|
|
|
|
|
|
|
|
|
|
|
|
|
|
|
|
|||||||||||||||||
| Interest rate gap |
($ | 179,858 | ) | $ | 18,211 | $ | 181,810 | $ | 35,624 | $ | 39,490 | ($ | 2,500 | ) | ($ | 32,841 | ) | $ | 59,936 | |||||||||||||
|
|
|
|
|
|
|
|
|
|
|
|
|
|
|
|
|
|||||||||||||||||
| Cumulative interest rate gap (2) |
($ | 179,858 | ) | ($ | 161,647 | ) | $ | 20,163 | $ | 55,787 | $ | 95,277 | $ | 92,777 | $ | 59,936 | — | |||||||||||||||
|
|
|
|
|
|
|
|
|
|
|
|
|
|
|
|
|
|||||||||||||||||
| December 31, 2012 (2) |
($ | 181,961 | ) | ($ | 163,542 | ) | $ | 8,504 | $ | 45,211 | $ | 78,313 | $ | 81,009 | $ | 63,129 | — | |||||||||||||||
| December 31, 2011 (2) |
($ | 163,313 | ) | ($ | 124,585 | ) | ($ | 29,456 | ) | $ | 30,710 | $ | 63,680 | $ | 70,283 | $ | 46,894 | — | ||||||||||||||
|
|
|
|
|
|
|
|
|
|
|
|
|
|
|
|
|
|||||||||||||||||
| (1) | The ratio of the cumulative one year gap to total interest rate sensitive assets was (45%), (47%), and (40%), as of June 30, 2013, and December 31, 2012 and 2011, and was (33%), (40%), and (26%) on a combined basis with Medallion Bank. |
| (2) | Adjusted for the medallion loan 40% prepayment assumption results in a cumulative one year negative interest rate gap and related ratio of ($69,815) or (17%) for June 30, 2013, compared to ($75,090) or (19%) and ($57,386) or (14%) for December 31, 2012 and 2011, and was ($145,630) or (12%), ($213,406) or (19%), and ($60,584) or (6%) on a combined basis with Medallion Bank. |
Our interest rate sensitive assets were $402,633,000 and interest rate sensitive liabilities were $342,698,000 at June 30, 2013. The one-year cumulative interest rate gap was a negative $179,858,000 or 45% of interest rate sensitive assets, compared to a negative $181,961,000 or 47% at December 31, 2012 and $163,313,000 or 40% at December 31, 2011. However, using our estimated 40% prepayment/refinancing rate for medallion loans to adjust the interest rate gap resulted in a negative gap of $69,815,000 or 17% at June 30, 2013. We seek to manage interest rate risk by originating adjustable-rate loans, by incurring fixed-rate indebtedness, by evaluating appropriate derivatives, pursuing securitization opportunities, and by other options consistent with managing interest rate risk.
On a combined basis with Medallion Bank, our interest rate sensitive assets were $1,166,904,000 and interest rate sensitive liabilities were $985,169,000 at June 30, 2013. The one year cumulative interest rate gap was a negative $382,437,000 or 33% of interest rate sensitive assets, compared to a negative $442,219,000 or 40% and $272,395,000 or 26% at December 31, 2012 and 2011. Using our estimated 40% prepayment/refinancing rate for medallion loans to adjust the interest rate gap resulted in a negative gap of $145,630,000 or 12% at June 30, 2013.
Interest Rate Cap Agreements
We manage our exposure to increases in market rates of interest by periodically purchasing interest rate caps to lock in the cost of funds of our variable-rate debt in the event of a rapid run up in interest rates. We entered into contracts to purchase interest rate caps on $160,000,000 of notional value of principal from various multinational banks, with termination dates ranging to July 2015. The caps provide for payments to us if various
52
Table of Contents
LIBOR thresholds are exceeded during the cap terms. Total cap purchases were generally fully expensed when paid, including $17,000 and $39,000 for the three and six months ended June 30, 2013, and $42,000 for both comparable 2012 periods, and all are carried at $0 on the balance sheet at June 30, 2013.
Liquidity and Capital Resources
Our sources of liquidity are the revolving lines of credit with DZ Bank and with a variety of local and regional banking institutions, unfunded commitments to sell debentures to the SBA, loan amortization and prepayments, private issuances of debt securities, and participations or sales of loans to third parties. As a RIC, we are required to distribute at least 90% of our investment company taxable income; consequently, we have primarily relied upon external sources of funds to finance growth. Trust III’s $200,000,000 revolving line of credit with DZ Bank had $33,745,000 of availability. Lastly, $41,200,000 was available under revolving credit agreements with commercial banks, and unfunded commitments from the SBA were $5,000,000.
Additionally, Medallion Bank, our wholly-owned, unconsolidated portfolio company has access to independent sources of funds for our business originated there, primarily through brokered certificates of deposit. At the current required capital levels, it is expected, although there can be no guarantee, that deposits of approximately $26,000,000 could be raised by Medallion Bank to fund future loan origination activities, and Medallion Bank also has $15,000,000 available under Fed Funds lines with several commercial banks. In addition, Medallion Bank, as a non-RIC subsidiary of ours, is allowed to retain all earnings in the business to fund future growth.
The components of our debt were as follows at June 30, 2013. See Note 4 to the consolidated financial statements for details of the contractual terms of our borrowings.
| (Dollars in thousands) |
Balance | Percentage | Rate(1) | |||||||||
| Revolving lines of credit |
$ | 166,255 | 49 | % | 1.21 | % | ||||||
| Notes payable to banks |
84,808 | 25 | 2.82 | |||||||||
| SBA debentures |
58,635 | 17 | 4.44 | |||||||||
| Preferred securities |
33,000 | 9 | 2.40 | |||||||||
|
|
|
|
|
|||||||||
| Total outstanding debt |
$ | 342,698 | 100 | % | 2.28 | |||||||
|
|
|
|
|
|
|
|||||||
| Deposits and other borrowings at Medallion Bank |
642,471 | — | 0.60 | % | ||||||||
|
|
|
|||||||||||
| Total outstanding debt, including Medallion Bank |
$ | 985,169 | — | 1.19 | ||||||||
|
|
|
|
|
|
|
|||||||
| (1) | Weighted average contractual rate as of June 30, 2013. |
Our contractual obligations expire on or mature at various dates through September 2037. The following table shows all contractual obligations at June 30, 2013.
| Payments due by period | ||||||||||||||||||||||||||||
| (Dollars in thousands) |
Less than 1 year |
1 – 2 years | 2 – 3 years | 3 – 4 years | 4 – 5 years | More than 5 years |
Total | |||||||||||||||||||||
| Revolving lines of credit |
$ | 166,255 | $ | — | $ | — | $ | — | $ | — | $ | — | $ | 166,255 | ||||||||||||||
| Notes payable to banks |
47,747 | 24,468 | 229 | 12,364 | — | — | 84,808 | |||||||||||||||||||||
| SBA debentures |
9,150 | 6,500 | 4,000 | — | — | 38,985 | 58,635 | |||||||||||||||||||||
| Preferred securities |
— | — | — | — | — | 33,000 | 33,000 | |||||||||||||||||||||
|
|
|
|
|
|
|
|
|
|
|
|
|
|
|
|||||||||||||||
| Total |
$ | 223,152 | $ | 30,968 | $ | 4,229 | $ | 12,364 | $ | — | $ | 71,985 | $ | 342,698 | ||||||||||||||
|
|
|
|
|
|
|
|
|
|
|
|
|
|
|
|||||||||||||||
| Deposits and other borrowings at Medallion Bank |
349,736 | 146,011 | 129,016 | 7,692 | 10,016 | — | 642,471 | |||||||||||||||||||||
|
|
|
|
|
|
|
|
|
|
|
|
|
|
|
|||||||||||||||
| Total, including Medallion Bank |
$ | 572,888 | $ | 176,979 | $ | 133,245 | $ | 20,056 | $ | 10,016 | $ | 71,985 | $ | 985,169 | ||||||||||||||
|
|
|
|
|
|
|
|
|
|
|
|
|
|
|
|||||||||||||||
53
Table of Contents
We value our portfolio at fair value as determined in good faith by the Board of Directors in accordance with our valuation policy. Unlike certain lending institutions, we are not permitted to establish reserves for loan losses. Instead, we must value each individual investment and portfolio loan on a quarterly basis. We record unrealized depreciation on investments and loans when we believe that an asset has been impaired and full collection is unlikely. We record unrealized appreciation on equities if we have a clear indication that the underlying portfolio company has appreciated in value and, therefore, our equity investment has also appreciated in value. Without a readily ascertainable market value, the estimated value of our portfolio of investments and loans may differ significantly from the values that would be placed on the portfolio if there existed a ready market for the investments. We adjust the valuation of the portfolio quarterly to reflect our Board of Directors’ estimate of the current fair value of each investment in the portfolio. Any changes in estimated fair value are recorded in our statement of operations as net unrealized appreciation (depreciation) on investments. Our investment in Medallion Bank, as a wholly-owned portfolio investment, is also subject to quarterly assessments of its fair value. We conduct a thorough valuation analysis and also receive an opinion regarding the valuation from an independent third party to assist the Board of Directors in its determination of the fair value of Medallion Bank. We determine whether any factors give rise to valuation different than recorded book value. As a result of this valuation process, we used Medallion Bank’s actual results of operations as the best estimate of changes in fair value, and recorded the result as a component of unrealized appreciation (depreciation) on investments, although changes in the restrictions described previously, including the expiration in July 2013 of the prior moratorium on the acquisition of control of an industrial bank such as Medallion Bank by a “commercial firm,” and other applicable factors could change these conclusions in the future. For more information, see “Risk Factors—Risks Relating to Our Business and Structure—Our investment portfolio is, and will continue to be, recorded at fair value as determined in good faith by our Board of Directors and, as a result, there is, and will continue to be, uncertainty as to the value of our portfolio investments which could adversely affect our net asset value.”
In addition, the illiquidity of our loan portfolio and investments may adversely affect our ability to dispose of loans at times when it may be advantageous for us to liquidate such portfolio or investments. In addition, if we were required to liquidate some or all of the investments in the portfolio, the proceeds of such liquidation may be significantly less than the current value of such investments. Because we borrow money to make loans and investments, our net operating income is dependent upon the difference between the rate at which we borrow funds and the rate at which we invest these funds. As a result, there can be no assurance that a significant change in market interest rates will not have a material adverse effect on our interest income. In periods of sharply rising interest rates, our cost of funds would increase, which would reduce our net operating income before net realized and unrealized gains. We use a combination of long-term and short-term borrowings and equity capital to finance our investing activities. Our long-term fixed-rate investments are financed primarily with short-term floating-rate debt, and to a lesser extent by term fixed-rate debt. We may use interest rate risk management techniques in an effort to limit our exposure to interest rate fluctuations. Such techniques may include various interest rate hedging activities to the extent permitted by the 1940 Act. We have analyzed the potential impact of changes in interest rates on net interest income. Assuming that the balance sheet were to remain constant and no actions were taken to alter the existing interest rate sensitivity, and including the impact on Medallion Bank, a hypothetical immediate 1% increase in interest rates would have positively impacted net increase in net assets resulting from operations as of June 30, 2013 by approximately $1,379,000 on an annualized basis, compared to a positive impact of $1,282,000 at December 31, 2012, and the impact of such an immediate increase of 1% over a one year period would have been ($2,459,000) at June 30, 2013, compared to ($2,880,000) at December 31, 2012. Although management believes that this measure is indicative of our sensitivity to interest rate changes, it does not adjust for potential changes in credit quality, size, and composition of the assets on the balance sheet, and other business developments that could affect net increase in net assets resulting from operations in a particular quarter or for the year taken as a whole. Accordingly, no assurances can be given that actual results would not differ materially from the potential outcome simulated by these estimates.
We continue to work with investment banking firms and other financial intermediaries to investigate the viability of a number of other financing options which include, among others, the sale or spin off certain assets or divisions, the development of a securitization conduit program, and other independent financing for certain
54
Table of Contents
subsidiaries or asset classes. These financing options would also provide additional sources of funds for both external expansion and continuation of internal growth.
The following table illustrates sources of available funds for us and each of our subsidiaries, and amounts outstanding under credit facilities and their respective end of period weighted average interest rates at June 30, 2013. See Note 4 to the consolidated financial statements for additional information about each credit facility.
| (Dollars in thousands) |
The Company |
MFC | MCI | MBC | FSVC | MB | Total | 12/31/2012 | ||||||||||||||||||||||||
| Cash |
$ | 24,405 | $ | 3,725 | $ | 6,016 | $ | 1,913 | $ | 5,399 | $ | — | $ | 41,458 | $ | 26,875 | ||||||||||||||||
| Bank loans |
67,327 | 58,606 | — | — | 75 | — | 126,008 | $ | 126,207 | |||||||||||||||||||||||
| Amounts undisbursed |
13,000 | 28,200 | — | — | — | — | 41,200 | 60,000 | ||||||||||||||||||||||||
| Amounts outstanding |
54,327 | 30,406 | — | — | 75 | — | 84,808 | 66,207 | ||||||||||||||||||||||||
| Average interest rate |
2.69 | % | 3.02 | % | — | — | 10.32 | % | — | 2.82 | % | 3.09 | % | |||||||||||||||||||
| Maturity |
5/14-11/16 | 8/13-11/16 | — | — | 2/15-3/16 | — | 8/13-11/16 | 4/13-1/16 | ||||||||||||||||||||||||
| Preferred securities |
33,000 | — | — | — | — | — | 33,000 | $ | 33,000 | |||||||||||||||||||||||
| Average interest rate |
2.40 | % | — | — | — | — | — | 2.40 | % | 2.44 | % | |||||||||||||||||||||
| Maturity |
9/37 | — | — | — | — | — | 9/37 | 9/37 | ||||||||||||||||||||||||
| Lines of credit |
— | 200,000 | — | — | — | — | 200,000 | $ | 200,000 | |||||||||||||||||||||||
| Amounts undisbursed |
— | 33,745 | — | — | — | — | 33,745 | 36,372 | ||||||||||||||||||||||||
| Amounts outstanding |
— | 166,255 | — | — | — | — | 166,255 | 163,628 | ||||||||||||||||||||||||
| Average interest rate |
— | 1.21 | % | — | — | — | — | 1.21 | % | 1.24 | % | |||||||||||||||||||||
| Maturity |
— | 12/13 | — | — | — | — | 12/13 | 12/13 | ||||||||||||||||||||||||
| SBA debentures |
— | — | 30,500 | — | 33,135 | — | 63,635 | $ | 59,935 | |||||||||||||||||||||||
| Amounts undisbursed |
— | — | 5,000 | — | — | — | 5,000 | — | ||||||||||||||||||||||||
| Amounts outstanding |
— | — | 25,500 | — | 33,135 | — | 58,635 | 59,935 | ||||||||||||||||||||||||
| Average interest rate |
— | — | 4.70 | % | — | 4.24 | % | — | 4.44 | % | 4.91 | % | ||||||||||||||||||||
| Maturity |
— | — | 3/14-3/23 | — | 9/13-3/23 | — | 9/13-3/23 | 3/13-3/23 | ||||||||||||||||||||||||
|
|
|
|
|
|
|
|
|
|
|
|
|
|
|
|
|
|||||||||||||||||
| Total cash and amounts remaining undisbursed under credit facilities |
$ | 37,405 | $ | 65,670 | $ | 11,016 | $ | 1,913 | $ | 5,399 | $ | — | $ | 121,403 | $ | 123,247 | ||||||||||||||||
|
|
|
|
|
|
|
|
|
|
|
|
|
|
|
|
|
|||||||||||||||||
| Total debt outstanding |
$ | 87,327 | $ | 196,661 | $ | 25,500 | $ | — | $ | 33,210 | $ | — | $ | 342,698 | $ | 322,770 | ||||||||||||||||
|
|
|
|
|
|
|
|
|
|
|
|
|
|
|
|
|
|||||||||||||||||
| Including Medallion Bank |
||||||||||||||||||||||||||||||||
| Cash |
— | — | — | — | — | $ | 20,885 | $ | 20,885 | $ | 24,770 | |||||||||||||||||||||
| Deposits and other borrowings |
— | — | — | — | — | 642,471 | 642,471 | 602,151 | ||||||||||||||||||||||||
| Average interest rate |
— | — | — | — | — | 0.60 | % | 0.60 | % | 0.69 | % | |||||||||||||||||||||
| Maturity |
— | — | — | — | — | 7/13-6/18 | 7/13-6/18 | 1/13-10/17 | ||||||||||||||||||||||||
|
|
|
|
|
|
|
|
|
|
|
|
|
|
|
|
|
|||||||||||||||||
| Total cash and amounts remaining undisbursed under credit facilities |
$ | 37,405 | $ | 65,670 | $ | 11,016 | $ | 1,913 | $ | 5,399 | $ | 20,885 | $ | 142,288 | $ | 148,017 | ||||||||||||||||
|
|
|
|
|
|
|
|
|
|
|
|
|
|
|
|
|
|||||||||||||||||
| Total debt outstanding |
$ | 87,327 | $ | 196,661 | $ | 25,500 | $ | — | $ | 33,210 | $ | 642,471 | $ | 985,169 | $ | 924,921 | ||||||||||||||||
|
|
|
|
|
|
|
|
|
|
|
|
|
|
|
|
|
|||||||||||||||||
Loan amortization, prepayments, and sales also provide a source of funding for us. Prepayments on loans are influenced significantly by general interest rates, medallion loan market values, economic conditions, and competition.
We have available liquidity of $33,745,000 under our revolving credit agreement with DZ Bank as of June 30, 2013. We also generate liquidity through deposits generated at Medallion Bank, borrowing arrangements with other banks, and through the issuance of SBA debentures, as well as from cash flow from operations. In addition, we may choose to participate a greater portion of our loan portfolio to third parties. We are actively seeking additional sources of liquidity, however, given current market conditions, we cannot assure you that we will be able to secure additional liquidity on terms favorable to us or at all. If that occurs, we may decline to underwrite lower yielding loans in order to conserve capital until credit conditions in the market become more favorable; or we may be required to dispose of assets when we would not otherwise do so, and at
55
Table of Contents
prices which may be below the net book value of such assets in order for us to repay indebtedness on a timely basis. Also, Medallion Bank is not a RIC, and therefore is able to retain earnings to finance growth.
Recently Issued Accounting Standards
In July 2013, the FASB issued Accounting Standards Update (ASU) 2013-11, “Income Tax (Topic 740) Presentation of an Unrecognized Tax Benefit When a Net Operating Loss Carryforward, a Similar Tax Loss, or a Tax Credit Carryforward Exists – a consensus of the FASB Emerging Issues Task Force”. ASU 2013-11 requires, with limited exception, that an unrecognized tax benefit be presented in the financial statements as a reduction to a deferred tax asset. The update applies to all entities that have unrecognized tax benefits with a net operating loss carryforward, a similar tax loss, or a tax credit carryforward which exists as of the reporting date. The update is effective for periods beginning after December 15, 2013, with early adoption permitted. As a BDC which has elected to be treated as a RIC for federal income tax purposes, we do not have any unrecognized tax benefits and as such we do not believe that adoption of this standard will have a material impact on our financial condition or results of operations.
In July 2013, the FASB issued Accounting Standards Update (ASU) 2013-10, “Derivatives and Hedging (Topic 815) Inclusion of the Fed Funds Effective Swap Rate (or Overnight Index Swap Rate) as a Benchmark Interest Rate for Hedge Accounting Purposes – a consensus of the FASB Emerging Issues Task Force.” ASU 2013-10 permits the Fed Funds Effective Swap Rate to be used as a U.S. benchmark interest rate for hedge accounting purposes under Topic 815. The update also removes the restriction on using different benchmark rates for similar hedges. The update applied to all entities that elect to apply hedge accounting of the benchmark interest rate under Topic 815. The update is prospectively for qualifying new or redesignated hedging relationships entered into on or after July 17, 2013. We do not believe that adoption of this standard will have a material impact on our financial condition or results of operations.
In June 2013, the FASB issued Accounting Standards Update (ASU) 2013-08, “Financial Services – Investment Companies (Topic 946) Amendments to the Scope, Measurement, and Disclosure Requirements.” ASU 2013-08 clarifies the characteristics of an investment company, provides a comprehensive guide for assessing whether an entity is an investment company, requires an investment company to measure noncontrolling ownership interests in other investment companies at fair value, requires disclosure that an entity is an investment company applying the guidance in Topic 946, as well as requiring the disclosure of any changes in the entity’s status as an investment company. The update specifies that an entity regulated under the 1940 Act is an investment company with respect to Topic 946. The update is effective for periods beginning after December 15, 2013. As a BDC, regulated under the 1940 Act, we have presented ourselves as an investment company, as such we do not believe that adoption of this standard will have a material impact on our financial condition or results of operations.
Quantitative and Qualitative Disclosures About Market Risk
Our business activities contain elements of risk. We consider the principal types of risk to be fluctuations in interest rates and portfolio valuations. We consider the management of risk essential to conducting our businesses. Accordingly, our risk management systems and procedures are designed to identify and analyze our risks, to set appropriate policies and limits, and to continually monitor these risks and limits by means of reliable administrative and information systems and other policies and programs.
We value our portfolio at fair value as determined in good faith by the Board of Directors in accordance with our valuation policy. Unlike certain lending institutions, we are not permitted to establish reserves for loan losses. Instead, we must value each individual investment and portfolio loan on a quarterly basis. We record unrealized depreciation on investments and loans when we believe that an asset has been impaired and full collection is unlikely. We record unrealized appreciation on equities if there is a clear indication that the underlying portfolio company has appreciated in value and, therefore, our equity investment has also appreciated
56
Table of Contents
in value. Without a readily ascertainable market value, the estimated value of our portfolio of investments and loans may differ significantly from the values that would be placed on the portfolio if there existed a ready market for the investments. We adjust the valuation of the portfolio quarterly to reflect our Board of Directors’ estimate of the current fair value of each investment in the portfolio. Any changes in estimated fair value are recorded in our statement of operations as net unrealized appreciation (depreciation) on investments. Our investment in Medallion Bank, as a wholly owned portfolio investment, is also subject to quarterly assessments of fair value. We conduct a thorough valuation analysis and also receive an opinion regarding the valuation from an independent third party to assist the Board of Directors in its determination of the fair value of Medallion Bank. We determine whether any factors give rise to valuation different than recorded book value, including various regulatory restrictions that were established at Medallion Bank’s inception, by the FDIC and State of Utah, and also by additional regulatory restrictions, such as the prior moratorium imposed by the Dodd-Frank Act on the acquisition of control of an industrial bank by a “commercial firm” (a company whose gross revenues are primarily derived from non-financial activities) that expired in July 2013. As a result of this valuation process, we used Medallion Bank’s actual results of operations as the best estimate of changes in fair value, and recorded the results as a component of unrealized appreciation (depreciation) on investments, although changes in these restrictions and other applicable factors could change these conclusions in the future. For more information, see “Risk Factors—Risks Relating to Our Business and Structure—Our investment portfolio is, and will continue to be, recorded at fair value as determined in good faith by our Board of Directors and, as a result, there is, and will continue to be, uncertainty as to the value of our portfolio investments which could adversely affect our net asset value.”
In addition, the illiquidity of our loan portfolio and investments may adversely affect our ability to dispose of loans at times when it may be advantageous for us to liquidate such portfolio or investments. In addition, if we were required to liquidate some or all of the investments in the portfolio, the proceeds of such liquidation may be significantly less than the current value of such investments. Because we borrow money to make loans and investments, our net operating income is dependent upon the difference between the rate at which we borrow funds and the rate at which we invest these funds. As a result, there can be no assurance that a significant change in market interest rates will not have a material adverse effect on our interest income. In periods of sharply rising interest rates, our cost of funds would increase, which would reduce our net operating income before net realized and unrealized gains. We use a combination of long-term and short-term borrowings and equity capital to finance our investing activities. Our long-term fixed-rate investments are financed primarily with short-term floating-rate debt, and to a lesser extent by term fixed-rate debt. We may use interest rate risk management techniques in an effort to limit our exposure to interest rate fluctuations. Such techniques may include various interest rate hedging activities to the extent permitted by the 1940 Act. We have analyzed the potential impact of changes in interest rates on net interest income. Assuming that the balance sheet were to remain constant and no actions were taken to alter the existing interest rate sensitivity, and including the impact on Medallion Bank, a hypothetical immediate 1% increase in interest rates would have positively impacted net increase in net assets resulting from operations as of June 30, 2013 by approximately $1,379,000 on an annualized basis, compared to a positive impact of $1,282,000 at December 31, 2012, and the impact of such an immediate increase of 1% over a one year period would have been ($2,459,000) at June 30, 2012, compared to ($2,880,000) at December 31, 2012. Although management believes that this measure is indicative of our sensitivity to interest rate changes, it does not adjust for potential changes in credit quality, size, and composition of the assets on the balance sheet, and other business developments that could affect net increase in net assets resulting from operations in a particular quarter or for the year taken as a whole. Accordingly, no assurances can be given that actual results would not differ materially from the potential outcome simulated by these estimates.
57
Table of Contents
Information about our senior securities is shown in the following table as of December 31 for the years indicated in the table, unless otherwise noted. The information contained in the table for the years 2003 through 2012 has been derived from our audited financial statements. WeiserMazars LLP’s report on the senior securities table as of December 31, 2012, 2011, 2010, 2009 and 2008 is attached as an exhibit to the registration statement of which this prospectus is a part.
| Year |
Total Amount Outstanding Exclusive of Treasury Securities(1) |
Asset Coverage Per Unit(2) |
Involuntary Liquidating Preference Per Unit(3) |
Average Market Value Per Unit (Exclude Bank Loans)(4) |
||||||||||||
| 2003 |
4,000,000 | 41.53 | — | N/A | ||||||||||||
| 2004 |
11,700,000 | 15.57 | — | N/A | ||||||||||||
| 2005 |
5,500,000 | 31.25 | — | N/A | ||||||||||||
| 2006 |
8,462,000 | 21.05 | — | N/A | ||||||||||||
| 2007 |
50,848,000 | 4.39 | — | N/A | ||||||||||||
| 2008 |
55,224,000 | 4.17 | — | N/A | ||||||||||||
| 2009 |
80,306,000 | 3.03 | — | N/A | ||||||||||||
| 2010 |
82,815,000 | 2.96 | — | N/A | ||||||||||||
| 2011 |
92,557,000 | 2.85 | — | N/A | ||||||||||||
| 2012 |
87,922,000 | 3.46 | — | N/A | ||||||||||||
| (1) | Total amount of each class of senior securities outstanding at the end of the period presented. |
| (2) | Asset coverage per unit is the ratio of the carrying value of our total consolidated assets, less all liabilities and indebtedness not represented by senior securities, to the aggregate amount of senior securities representing indebtedness. The amount of senior securities is calculated based on applicable 1940 Act provisions and the terms of our exemptive orders and does not include certain indebtedness of the Company. See “Management’s Discussion and Analysis of Financial Condition and Results of Operations—Liquidity and Capital Resources” for further information on our total outstanding indebtedness. Asset coverage per unit is expressed in terms of dollar amounts per $1,000 of indebtedness. |
| (3) | The amount to which such class of senior security would be entitled upon the voluntary liquidation of the issuer in preference to any security junior to it. The “—” in this column indicates that the SEC expressly does not require this information to be disclosed for certain types of senior securities. |
| (4) | Not applicable because senior securities are not registered for public trading. |
58
Table of Contents
Overview
We, Medallion Financial Corp. or the Company, are a specialty finance company that has a leading position in originating, acquiring, and servicing loans that finance taxicab medallions and various types of commercial businesses. A wholly-owned portfolio company of ours, Medallion Bank, also originates consumer loans for the purchase of recreational vehicles, boats, motorcycles, and trailers, and to finance small-scale home improvements. Our core philosophy has been “In niches there are riches.” We try to identify markets that are profitable and where we can become an industry leader. Our investment objectives are to provide high level of distributable income, consistent with the preservation of capital, as well as long-term growth of net asset value and our stock price. These investment objectives may be changed without shareholder approval. We also provide other debt, mezzanine, and equity investment capital to companies in a variety of industries, consistent with our investment objectives. For additional information about our business and operations, see “Management’s Discussion and Analysis of Financial Condition and Results of Operations.”
Since 1996, the year in which we became a public company, we have increased our taxicab medallion loan portfolio at a compound annual growth rate of 5%, and our commercial loan portfolio at a compound annual growth rate of 2% (10% and 7% on a managed basis when combined with Medallion Bank). Since Medallion Bank acquired a consumer loan portfolio and began originating consumer loans in 2004, it has increased its consumer loan portfolio at a compound annual growth rate of 15%. Total assets under our management and the management of our unconsolidated wholly-owned subsidiaries, which includes assets serviced for third party investors, were $1,255,849,000 as of June 30, 2013, and $1,219,224,000 and $1,159,971,000 as of December 31, 2012 and June 30, 2012, and have grown at a compound annual growth rate of 11% from $215,000,000 at the end of 1996. Since our initial public offering in 1996, we have paid/declared dividends in excess of $195,200,000 or $11.89 per share.
We conduct our business through various wholly-owned investment company subsidiaries including:
| • | Medallion Funding LLC, or Medallion Funding, an SBIC, our primary taxicab medallion lending company; |
| • | Medallion Capital, Inc., or Medallion Capital, an SBIC and a RIC, which conducts a mezzanine financing business; and |
| • | Freshstart Venture Capital Corp., or Freshstart, an SBIC and a RIC, which originates and services taxicab medallion and commercial loans. |
In December 2010, we formed a wholly-owned portfolio company, Medallion Servicing Corporation, or MSC, to provide loan services to Medallion Bank, also a portfolio company wholly-owned by us. We have assigned all of our loan servicing rights for Medallion Bank, which consists of servicing taxi medallion and commercial loans originated by Medallion Bank, to MSC, which bills and collects the related service fee income from Medallion Bank, and is allocated and charged by us for MSC’s share of these servicing costs.
On March 26, 2009, we formed a new wholly-owned New York limited liability company subsidiary, Medallion Funding LLC. On February 26, 2010, Medallion Funding Corp. merged into Medallion Funding LLC and following the merger, Medallion Funding LLC was the surviving entity and the successor-in-interest to Medallion Funding Corp.’s business. There was no business or operational change resulting from this corporate restructuring. For federal and most state tax purposes, Medallion Funding LLC is treated as a disregarded entity, and is subsumed in the tax return of Medallion Financial Corp. Medallion Funding LLC maintains its status as an SBIC.
We also conduct business through our asset-based lending division, Medallion Business Credit, an originator of loans to small businesses for the purpose of financing inventory and receivables, which prior to
59
Table of Contents
December 31, 2007, was a wholly-owned investment company subsidiary. On December 31, 2007, Medallion Business Credit was merged into us and ceased to exist as a separate legal entity.
In addition, we conduct business through a wholly-owned portfolio company, Medallion Bank, a bank regulated by the FDIC and the Utah Department of Financial Institutions which originates taxicab medallion, commercial, and consumer loans, raises deposits, and conducts other banking activities. Medallion Bank generally provides us with our lowest cost of funds which it raises through bank certificates of deposit issued to its customers. To take advantage of this low cost of funds, we refer a portion of our taxicab medallion and commercial loans to Medallion Bank, which then originates these loans, which are then serviced by MSC. However, the FDIC restricts the amount of taxicab medallion loans that Medallion Bank may finance to three times Tier 1 capital, or $357,363,000 as of June 30, 2013. MSC earns referral and servicing fees for these activities. As a non-investment company, Medallion Bank is not consolidated with the Company, which is an investment company under the 1940 Act.
We are a closed-end, non-diversified management investment company under the 1940 Act. We have elected to be treated as a business development company under the 1940 Act. We have also elected to be treated for federal income tax purposes as a RIC under Subchapter M of the Code. As a RIC, we generally do not have to pay corporate-level federal income taxes on any net ordinary income or capital gains that we distribute to our shareholders as dividends, if we meet certain source-of-income and asset diversification requirements. Medallion Bank is not a RIC and must pay corporate-level U.S. federal and state income taxes.
We are managed by our executive officers under the supervision of our Board of Directors. As a result, we do not pay investment advisory fees, but instead we incur the operating costs associated with employing investment and portfolio management professionals. Alvin Murstein, our chairman and chief executive officer, has over 50 years of experience in the ownership, management, and financing of taxicab medallions and other commercial businesses. Andrew M. Murstein, our president, has over 25 years of experience and is the third generation in his family to participate in the business.
Below is our organizational structure reflecting our consolidated and unconsolidated subsidiaries.
| (1) | An SBIC and a RIC which originates and services taxicab medallion and commercial loans. |
| (2) | An SBIC which is our primary taxicab medallion lending company. |
| (3) | An SBIC and a RIC which conducts a mezzanine financing business. |
| (4) | Formed for the purpose of holding and managing equity investments in a racing team, an equipment manufacturing business and an airport and food retail business. |
| (5) | Formed for the purpose of owning taxicab medallion loans originated by Medallion Funding. |
| (6) | Formed for purpose of owning and leasing repossessed Chicago taxicab medallions. |
| (7) | Formed for the purpose of issuing unsecured preferred securities to investors. |
60
Table of Contents
| (8) | A Utah industrial bank regulated by the FDIC and the Utah Department of Financial Institutions which originates taxicab medallion, commercial, and consumer loans, raises deposits, and conducts other banking activities. |
| (9) | Formed for the purpose of conducting loan servicing activities. |
| (10) | Formed for the purpose of engaging in out-of-home media planning and buying. |
| (11) | Formed for the purpose of holding and managing a hotel investment. |
| (12) | Formed for the purpose of holding an equity investment in a professional lacrosse team. |
| (13) | Formed for the purpose of engaging in general consulting services. |
| (14) | Formed for the purpose of holding an equity investment in a racing team. |
| (15) | Formed for the purpose of engaging in art dealing. |
Our Market
We provide loans to individuals and small to mid-size businesses, both directly through our investment company subsidiaries and also through Medallion Bank, in three primary markets:
| • | loans that finance taxicab medallions; |
| • | loans that finance commercial businesses; and |
| • | loans that finance consumer purchases of recreational vehicles, boats, motorcycles, and trailers, and to finance small-scale home improvements. |
The following chart shows the components of our $1,100,518,000 managed net investment portfolio as of June 30, 2013.
| (Dollars in thousands) |
On-Balance Sheet | Off-Balance Sheet(1) | Total Managed Investments | |||||||||
| Medallion loans |
$ | 294,029 | $ | 343,025 | $ | 637,054 | ||||||
| Commercial loans |
59,229 | 61,750 | 120,979 | |||||||||
| Consumer loans |
— | 307,346 | 307,346 | |||||||||
| Investments in Medallion Bank and other controlled subsidiaries |
100,343 | (94,619 | ) | 5,724 | ||||||||
| Investment securities |
— | 22,676 | 22,676 | |||||||||
| Equity investments |
6,739 | — | 6,739 | |||||||||
|
|
|
|
|
|
|
|||||||
| Net investment portfolio |
$ | 460,340 | $ | 640,178 | $ | 1,100,518 | ||||||
|
|
|
|
|
|
|
|||||||
| (1) | Off-balance sheet investments are those owned by our wholly-owned unconsolidated portfolio companies, primarily Medallion Bank. |
Medallion Loans
Taxi medallion loans of $294,029,000 comprised 64% of our $460,340,000 net investment portfolio as of June 30, 2013, compared to $294,388,000 or 65% of our $455,010,000 net investment portfolio as of December 31, 2012. Managed taxi medallion loans of $637,054,000 comprised 58% of our $1,100,518,000 managed net investment portfolio as of June 30, 2013, compared to $630,603,000 or 60% of our $1,048,635,000 managed net investment portfolio as of December 31, 2012. Including loans to unaffiliated investors, the total amount of medallion loans under our management was $662,394,000 as of June 30, 2013, compared to $688,279,000 as of December 31, 2012. Since 1979, we and Medallion Bank have originated, on a combined basis, approximately $3,159,368,000 in medallion loans in New York City, Chicago, Boston, Newark,
61
Table of Contents
Cambridge, and other cities within the United States. In addition, our management has a long history of owning, managing, and financing taxicab fleets, taxicab medallions, and corporate car services, dating back to 1956.
Medallion loans collateralized by New York City taxicab medallions and related assets comprised 70% and 71% of the value of the medallion loan portfolio as of June 30, 2013 and December 31, 2012, and were 76% and 78% on a managed basis. Based on taxi medallion values published by the TLC, we estimate that the total value of all of New York City taxicab medallions and related assets such as the vehicle, taximeter and roof lights exceeded $15.1 billion and $13.5 billion as of June 30, 2013 and December 31, 2012. We estimate that the total value of all taxicab medallions and related assets in our major U.S. markets exceeded $19.0 billion and $17.5 billion as of June 30, 2013 and December 31, 2012.
Although some of the medallion loans have from time to time been in arrears or in default, our loss experience on medallion loans has been negligible. We believe that our medallion loan portfolio is of high credit quality because medallions have generally increased in value and are relatively simple to repossess and resell in an active market. In the past, when a borrower has defaulted on a loan, we have repossessed the medallion collateralizing that loan. If the loan was not brought current, the medallion was sold in the active market at prices at or in excess of the amounts due.
The following table displays information on managed medallion loans outstanding (other than those managed for third party investors) in each of our major markets at June 30, 2013. For a presentation of only the consolidated on-balance sheet medallion loans, see the Consolidated Summary Schedule of Investments in the consolidated financial statements.
| (Dollars in thousands) |
# of Loans | % of Medallion Loan Portfolio(1) |
Average Interest Rate(2) |
Principal Balance |
||||||||||||
| Managed medallion loans |
||||||||||||||||
| New York |
805 | 76 | % | 3.54 | % | $ | 482,223 | |||||||||
| Chicago |
239 | 14 | 5.01 | 88,274 | ||||||||||||
| Newark |
126 | 4 | 6.02 | 24,395 | ||||||||||||
| Boston |
58 | 3 | 5.22 | 22,986 | ||||||||||||
| Cambridge |
25 | 2 | 5.60 | 12,017 | ||||||||||||
| Other |
59 | 1 | 7.32 | 7,675 | ||||||||||||
|
|
|
|
|
|
|
|||||||||||
| Total managed medallion loans |
1,312 | 100 | % | 3.98 | 637,770 | |||||||||||
|
|
|
|
|
|
|
|||||||||||
| Deferred loan acquisition costs |
1,007 | |||||||||||||||
| Unrealized depreciation on loans |
(1,723 | ) | ||||||||||||||
|
|
|
|||||||||||||||
| Net managed medallion loans |
$ | 637,054 | ||||||||||||||
|
|
|
|||||||||||||||
| (1) | Based on principal balance outstanding at June 30, 2013. |
| (2) | Based on the contractual rates of the portfolios at June 30, 2013. |
The New York City Market. A New York City taxicab medallion is the only permitted license to operate a taxicab and accept street hails in New York City, except as discussed below. As reported by the TLC, individual (owner-driver) medallions sold for approximately $1,051,000 and corporate medallions sold for approximately $1,164,000 as of June 30, 2013. The number of taxicab medallions is limited by law, and as a result of the limited supply of medallions, an active market for medallions has developed. The law limiting the number of medallions also stipulates that the ownership for the 13,237 medallions outstanding as of June 30, 2013 shall remain divided into 5,573 individual medallions and 7,664 fleet or corporate medallions. Corporate medallions are more valuable because they can be aggregated by businesses, leased to drivers, and operated for more than one shift. New York City auctioned 600 additional medallions during 2004, 308 during 2006, and 89 during 2008. The medallions auctioned in 2006 were restricted to hybrid fuel vehicles and wheelchair accessible vehicles. In
62
Table of Contents
addition, New York City auctioned an additional 63 medallions for wheelchair accessible vehicles in 2007. New York City announced a 25% fare hike to support the increased level of medallions, which took effect in the 2004 second quarter. The New York State legislature enacted a law on December 21, 2011 which was amended on February 17, 2012 to permit cars for hire to pick up street hails in the boroughs outside Manhattan. This law is currently in the early stages of implementation.
A prospective medallion owner must qualify under the medallion ownership standards set and enforced by the TLC. These standards prohibit individuals with criminal records from owning medallions, require that the funds used to purchase medallions be derived from legitimate sources, and mandate that taxicab vehicles and meters meet TLC specifications. In addition, before the TLC will approve a medallion transfer, the TLC requires a letter from the seller’s insurer stating that there are no outstanding claims for personal injuries in excess of insurance coverage. After the transfer is approved, the owner’s taxicab is subject to quarterly TLC inspections.
Most New York City medallion transfers are handled through approximately 23 medallion brokers licensed by the TLC. In addition to brokering medallions, these brokers also arrange for TLC documentation insurance, vehicles, meters, and financing. We have excellent relations with many of the most active brokers, and regularly receive referrals from them. Brokers generated 35% of the loans originated during the six months ended June 30, 2013, and 38% for the year ended December 31, 2012. However, we receive most of our referrals from a small number of brokers.
The Chicago Market. We estimate that Chicago medallions sold for approximately $332,000 as of June 30, 2013. Pursuant to a municipal ordinance, the number of outstanding medallions is capped at 6,951 as of June 30, 2013. We estimate that the total value of all Chicago medallions and related assets is over $2,377,242,000 as of June 30, 2013.
The Boston Market. We estimate that Boston medallions sold for approximately $643,000 as of June 30, 2013. The number of Boston medallions is capped at 1,825 as of June 30, 2013. We estimate that the total value of all Boston medallions and related assets is over $1,196,187,000 as of June 30, 2013.
The Newark Market. We estimate that Newark medallions sold for approximately $425,000 as of June 30, 2013. The number of Newark medallions has been limited to 600 since 1950 by local law. We estimate that the total value of all Newark medallions and related assets is over $258,600,000 as of June 30, 2013.
The Cambridge Market. We estimate that Cambridge medallions sold for approximately $501,000 as of June 30, 2013. The number of Cambridge medallions is 257 as of June 30, 2013. We estimate that the total value of all Cambridge medallions and related assets is over $131,571,000 as of June 30, 2013.
Commercial Loans
Commercial loans finance either the purchase of the equipment and related assets necessary to open a new business or the purchase or improvement of an existing business. From the inception of the commercial loan business in 1987 through June 30, 2013, we and Medallion Bank have originated more than 10,347 commercial loans for an aggregate principal amount of approximately $834,578,000. Commercial loans of $59,229,000 comprised 13% of our $460,340,000 net investment portfolio as of June 30, 2013, compared to $56,919,000 or 12% of our $455,010,000 net investment portfolio as of December 31, 2012. Managed commercial loans of $120,979,000 comprised 11% of our $1,100,518,000 managed net investment portfolio as of June 30, 2013, compared to $126,056,000 or 12% of our $1,048,635,000 managed net investment portfolio as of December 31, 2012. We have worked to increase our commercial loan activity in recent years, primarily because of the attractive higher yielding, floating rate nature of most of this business. The outstanding balances of managed commercial loans have grown at a compound annual rate of 7% since 1996. The increase since 1996 has been primarily driven by internal growth through the origination of additional commercial loans. We focus our marketing efforts on the manufacturing, wholesale trade, administrative and support services and accommodation
63
Table of Contents
and food services industries with the portfolio concentrated in the manufacturing industry. The majority of our commercial borrowers are located in the New York metropolitan area, the Midwest region and Florida. For more information regarding the geographic and industry concentrations of the portfolio, see “Portfolio Companies.” We plan to continue expanding our commercial loan activities by developing a more diverse borrower base, a wider geographic area of coverage, and by expanding targeted industries.
Commercial loans are generally secured by equipment, accounts receivable, real estate, or other assets, and have interest rates averaging 495 basis points over the prevailing prime rate at June 30, 2013, up from 488 basis points over prime at the end of 2012. As with medallion loans, the vast majority of the principals of borrowers personally guarantee commercial loans. The aggregate realized loss of principal on managed commercial loans has averaged 1.07% per annum for the last five years.
The following table displays information on managed commercial loans outstanding (other than those managed for third party investors) in each of our major markets at June 30, 2013. For a presentation of only the consolidated on-balance sheet commercial loans, see the Consolidated Summary Schedule of Investments in the consolidated financial statements.
| (Dollars in thousands) |
# of Loans | % of Commercial Loan Portfolio(1) |
Average Interest Rate(2) |
Principal Balance |
||||||||||||
| Managed commercial loans |
||||||||||||||||
| Asset-based |
37 | 52 | % | 4.99 | % | $ | 69,041 | |||||||||
| Secured mezzanine |
28 | 36 | 12.68 | 48,201 | ||||||||||||
| Other secured commercial |
50 | 12 | 8.53 | 15,082 | ||||||||||||
|
|
|
|
|
|
|
|||||||||||
| Total managed commercial loans |
115 | 100 | % | 8.20 | 132,324 | |||||||||||
|
|
|
|
|
|
|
|||||||||||
| Deferred loan acquisition income |
(30 | ) | ||||||||||||||
| Unrealized depreciation on loans |
(11,315 | ) | ||||||||||||||
|
|
|
|||||||||||||||
| Net managed commercial loans |
$ | 120,979 | ||||||||||||||
|
|
|
|||||||||||||||
| (1) | Based on principal balance outstanding at June 30, 2013. |
| (2) | Based on the contractual rates of the portfolios at June 30, 2013. |
Asset Based Loans. Through our Medallion Business Credit division, we originate, manage, and service asset-based loans to small businesses which require working capital credit facilities generally ranging from $500,000 to $5,000,000. Medallion Business Credit refers most of its potential commercial loans to Medallion Bank to originate, so that we can benefit from Medallion Bank’s lower cost of funds. Additionally, from time to time, Medallion Business Credit also sells and purchases loan participations to and from independent third party lenders. Together, these loans represent approximately 52% of the managed commercial loan portfolio as of June 30, 2013 and were 54% as of December 31, 2012. These commercial loans are generally secured principally by the borrower’s accounts receivable, but may also be secured by inventory, machinery, equipment, and/or real estate, and are personally guaranteed by the principals. Currently, our clients are mostly located in the New York metropolitan area, and include wholesale and retail trade, transportation and warehousing, and other industrial and services businesses. We had successfully established 37 commercial loans as of June 30, 2013.
Secured Mezzanine Loans. Through our subsidiary Medallion Capital, we originate both senior and subordinated loans nationwide to businesses in a variety of industries, including manufacturing and various service providers, more than a third of which are located in the upper Midwest and Great Lakes region, with the rest scattered across the country. These mezzanine loans are primarily secured by a second position on all assets of the businesses and generally range in amount from $1,000,000 to $5,000,000, and represent approximately 36% of our managed commercial loan portfolio as of June 30, 2013, and 37% as of December 31, 2012. Frequently, we also receive warrants to purchase an equity interest in the borrowers of secured mezzanine loans.
64
Table of Contents
Other Secured Commercial Loans. We originate, primarily through our subsidiary Freshstart, other commercial loans that are focused on food services, real estate, dry cleaner and laundromat businesses, which are typically located within 200 miles of New York City. These commercial loans are generally secured by all of the assets of the businesses and are generally personally guaranteed by the principals. Frequently, we receive assignments of lease from our borrowers. The loans generally range in size from under $100,000 to approximately $3,000,000. These loans represented approximately 12% of the managed commercial loan portfolio as of June 30, 2013, and were 9% as of December 31, 2012. Historically, most of the portfolio has consisted of fixed-rate loans.
Consumer Loans
Consumer loans are originated by Medallion Bank, a wholly-owned, unconsolidated portfolio company. Consumer loans of $307,346,000 comprised 29% of our $1,100,518,000 managed net investment portfolio as of June 30, 2013 and consumer loans of $258,933,000 comprised 25% of our $1,048,635,000 managed net investment portfolio as of December 31, 2012. The loans are collateralized by recreational vehicles, boats, motorcycles, trailers and home improvements located in all 50 states. The portfolio is serviced by a large third party servicer. We believe that Medallion Bank’s consumer loan portfolio is of acceptable credit quality given the high interest rates earned on the loans, which compensate for the higher degree of credit risk in the portfolio.
Other
As a business development company, we also provide debt, mezzanine, and equity investment capital to companies in a variety of industries. These investments may be venture capital style investments which may not be fully collateralized. This is a small, but growing portion of our business.
Our Strategy
Our core philosophy has been “In niches there are riches.” We try to identify markets that are profitable and where we can be an industry leader. Key elements of our strategy include:
Capitalize on our relationships with brokers and dealers. We are committed to establishing, building, and maintaining our relationships with our brokers and dealers. Our marketing efforts are focused on building relationships with brokers in the medallion market and dealers in the consumer market. We believe that our relationships with brokers and dealers provide us with, in addition to potential investment opportunities, other significant benefits, including an additional layer of due diligence and additional monitoring capabilities. We have assembled a management team that has developed an extensive network of broker and dealer relationships in our target market over the last 50 years. We believe that our management team’s relationships with these brokers and dealers have and will continue to provide us with significant investment opportunities. At June 30, 2013, approximately 34% of our originated investment transactions were generated by brokers and dealers.
Employ disciplined underwriting policies and maintain rigorous portfolio monitoring. We have an extensive investment underwriting and monitoring process. We conduct a thorough analysis of each potential investment and its prospects, competitive position, financial performance, and industry dynamics. We stress the importance of credit and risk analysis in our underwriting process. We believe that our continued adherence to this disciplined process will permit us to continue to generate a stable, diversified and increasing revenue stream of current income from our debt investments to enable us to make distributions to our shareholders.
Leverage the skills of our experienced management team. Our management team is led by our Chief Executive Officer, Mr. Alvin Murstein, and our President, Mr. Andrew M. Murstein. Alvin Murstein has over 50 years of experience in the ownership, management, and financing of taxicab medallions and other commercial businesses, and Andrew M. Murstein is the third generation in his family to participate in the business and has over 25 years of experience in the ownership, management and financing of taxicab medallions and other
65
Table of Contents
commercial businesses. The other members of our management team have broad investment backgrounds, with prior experience at specialty finance companies, middle market commercial banks, and other financial services companies. We believe that the experience and contacts of our management team will continue to allow us to effectively implement the key aspects of our business strategy.
Perform Strategic Acquisitions. In addition to increasing market share in existing lending markets and identifying new niches, we seek to acquire medallion financing businesses and related portfolios and specialty finance companies that make secured loans to small businesses which have experienced historically low loan losses similar to our own. Since our initial public offering in May 1996, eight specialty finance companies, five loan portfolios, and three taxicab rooftop advertising companies have been acquired.
Investment Activity
The following table sets forth the components of investment activity in the managed investment portfolio for the periods indicated.
| Six Months Ended June 30,(4) |
Year ended December 31(4) | |||||||||||||||||||
| (Dollars in thousands) |
2013 | 2012 | 2012 | 2011 | 2010 | |||||||||||||||
| Net investments at beginning of period |
$ | 455,010 | $ | 451,835 | $ | 956,626 | $ | 946,343 | $ | 846,542 | ||||||||||
| Investments originated(1) |
134,100 | 67,314 | 492,077 | 471,194 | 525,872 | |||||||||||||||
| Repayments of investments(1) |
(131,287 | ) | (96,194 | ) | (383,298 | ) | (438,646 | ) | (392,417 | ) | ||||||||||
| Net realized gains (losses) on investments(2) |
81 | 265 | (11,081 | ) | (6,810 | ) | (18,333 | ) | ||||||||||||
| Net increase in unrealized appreciation (depreciation)(3) |
2,570 | 3,325 | 4,525 | (4,038 | ) | 66 | ||||||||||||||
| Transfers to other assets/liabilities, net |
— | — | (7,748 | ) | (9,171 | ) | (13,478 | ) | ||||||||||||
| Amortization of origination costs |
(134 | ) | (74 | ) | (2,466 | ) | (2,246 | ) | (1,909 | ) | ||||||||||
|
|
|
|
|
|
|
|
|
|
|
|||||||||||
| Net increase (decrease) in investments |
5,330 | (25,364 | ) | 92,009 | 10,283 | 99,801 | ||||||||||||||
|
|
|
|
|
|
|
|
|
|
|
|||||||||||
| Net investments at end of period |
$ | 460,340 | $ | 426,471 | $ | 1,048,635 | $ | 956,626 | $ | 946,343 | ||||||||||
|
|
|
|
|
|
|
|
|
|
|
|||||||||||
| (1) | Includes refinancings. |
| (2) | Excludes net realized losses of $74 for the year ended December 31, 2012, related to foreclosed properties, and net realized losses of $779 for the year ended December 31, 2010, related to the investment in SPAC 2, which were carried in other assets on the consolidated balance sheet. |
| (3) | Excludes net unrealized appreciation (depreciation) of $5,865 and $4,389 for the six months ended June 30, 2013 and 2012, and $9,193, $3,455, and $2,153 for the years ended December 31, 2012, 2011, and 2010, related to foreclosed properties, which were carried in other assets on the consolidated balance sheet, and the reversal of unrealized depreciation of $759 for the year ended December 31, 2010, related to the realized loss on the SPAC 2 investment. |
| (4) | Consistent with the presentation in our quarterly and annual SEC filings, the six month data reflects the investment activity of Medallion Financial only, while the full year data is presented on a managed basis, including the activity of Medallion Bank. |
Investment Characteristics
Medallion Loans. Our medallion loan portfolio consists of mostly fixed-rate loans, collateralized by first security interests in taxicab medallions and related assets (vehicles, meters, and the like). The portfolio was originated at an approximate loan-to-value ratio range of 50 to 75%. We estimate that the average loan-to-value ratio of all of the medallion loans was approximately 40% as of June 30, 2013. In addition, we have recourse against a vast majority of the owners of the taxicab medallions and related assets through personal guarantees.
66
Table of Contents
Medallion loans generally require equal monthly payments covering accrued interest and amortization of principal over a five to twenty-five year schedule, subject to a balloon payment of all outstanding principal after three or five years. More recently, we have begun to originate loans with one-to-three year maturities where interest rates are adjusted and a new maturity period set. Borrowers may prepay medallion loans upon payment of a fee of approximately 90 days’ interest.
We generally retain the medallion loans we originate; however, from time to time, we participate or sell shares of some loans or portfolios to interested third party financial institutions. In these cases, we retain the borrower relationships and service the sold loans.
Commercial Loans. We have typically originated commercial loans in principal amounts generally ranging from $100,000 to $6,500,000, and occasionally, have originated loans in excess of that amount. These loans are generally retained and typically have maturities ranging from three to ten years and require monthly payments ranging from full amortization over the loan term to fully deferred interest and principal at maturity, with multiple payment options in between. Substantially all loans may be prepaid with a fee ranging from 30 to 120 days’ interest. The term of, and interest rate charged on, certain of our outstanding loans are subject to SBA regulations. Under SBA regulations, the maximum rate of interest permitted on loans originated by us is 19%. Unlike medallion loans, for which competition precludes us from charging the maximum rate of interest permitted under SBA regulations, we are able to charge the maximum rate on certain commercial loans. We believe that the increased yield on commercial loans compensates for their higher risk relative to medallion loans and further illustrates the benefits of diversification.
Commercial loans are generally originated at an average loan-to-value ratio of 60 to 75%. Substantially all of the commercial loans are collateralized by security interests in the assets being financed by the borrower. In addition, we have recourse against the vast majority of the principals of borrowers who personally guarantee the loans. Although personal guarantees increase the commitment of borrowers to repay their loans, we cannot assure you that the assets available under personal guarantees would, if required, be sufficient to satisfy the obligations secured by such guarantees. In certain cases, equipment vendors may provide full and partial recourse guarantees on loans.
Consumer Loans. Consumer loans generally require equal monthly payments covering accrued interest and amortization of principal over a negotiated term, generally around ten years. Interest rates offered are both floating and fixed, and certain of the floating rate notes have built in floors. Borrowers may prepay consumer loans without any prepayment penalty. In general, Medallion Bank has established relationships with dealers in the industry, who are the sources for most of the customers of Medallion Bank.
Marketing, Origination, and Loan Approval Process
We employ 34 loan originators to originate medallion, commercial, and consumer loans. Each loan application is individually reviewed through analysis of a number of factors, including loan-to-value ratios, a review of the borrower’s credit history, public records, personal interviews, trade references, personal inspection of the premises, and approval from the TLC, SBA, or other regulatory body, if applicable. Each medallion and commercial loan applicant is required to provide personal or corporate tax returns, premises leases, and/or property deeds. Senior management establishes loan origination criteria. Loans that conform to such criteria may be processed by a loan officer with the proper credit authority, and non-conforming loans must be approved by the chief executive officer and/or the chief credit officer. Both medallion and commercial loans are sourced from brokers with extensive networks of applicants, and commercial loans are also referred by contacts with banks, attorneys, and accounting firms. Consumer loans are primarily sourced through relationships which have been established with recreational vehicle, boat dealers and home improvement contractors throughout our market area.
67
Table of Contents
Sources of Funds
We have historically funded our lending operations primarily through credit facilities with bank syndicates and, to a lesser degree, through equity or debt offerings or private placements, and fixed-rate, senior secured notes and long-term subordinated debentures issued to or guaranteed by the SBA. Since the inception of Medallion Bank, substantially all of Medallion Bank’s funding has been provided by FDIC insured brokered certificates of deposit. The determination of funding sources is established by our management, based upon an analysis of the respective financial and other costs and burdens associated with funding sources. Our funding strategy and interest rate risk management strategy is to have the proper structuring of debt to minimize both rate and maturity risk, while maximizing returns with the lowest cost of funding over an intermediate period of time.
The table below summarizes our sources of available funds and amounts outstanding under credit facilities and their respective end of period weighted average interest rates at June 30, 2013. See Note 4 to the consolidated financial statements for additional information about each credit facility.
| Consolidated sources of funds (Dollars in thousands) |
Total | |||
| Cash |
$ | 41,458 | ||
| Bank loans |
$ | 126,008 | ||
| Amounts undisbursed |
41,200 | |||
| Amounts outstanding |
84,808 | |||
| Average interest rate |
2.82 | % | ||
| Maturity |
8/13-11/16 | |||
| Preferred securities |
$ | 33,000 | ||
| Average interest rate |
2.40 | % | ||
| Maturity |
9/37 | |||
| Lines of credit |
$ | 200,000 | ||
| Amounts undisbursed |
33,745 | |||
| Amounts outstanding |
166,255 | |||
| Average interest rate |
1.21 | % | ||
| Maturity |
12/13 | |||
| SBA debentures |
$ | 63,635 | ||
| Amounts undisbursed |
5,000 | |||
| Amounts outstanding |
58,635 | |||
| Average interest rate |
4.44 | % | ||
| Maturity |
9/13-3/23 | |||
|
|
|
|||
| Total cash and amounts remaining undisbursed under credit facilities |
$ | 121,403 | ||
|
|
|
|||
| Total debt outstanding |
$ | 342,698 | ||
|
|
|
|||
| Medallion bank sources of funds |
||||
| Cash |
$ | 20,885 | ||
| Deposits |
642,471 | |||
| Average interest rate |
0.60 | % | ||
| Maturity |
7/13-6/18 | |||
|
|
|
|||
| Total cash and amounts remaining undisbursed under credit facilities, including Medallion Bank |
$ | 142,288 | ||
|
|
|
|||
| Total debt outstanding, including Medallion Bank |
$ | 985,169 | ||
|
|
|
|||
68
Table of Contents
We fund our fixed-rate loans with variable-rate credit lines and bank debt, and with fixed-rate SBA debentures. The mismatch between maturities and interest-rate sensitivities of these balance sheet items results in interest rate risk. We seek to manage our exposure to increases in market rates of interest to an acceptable level by:
| • | Originating adjustable rate loans; |
| • | Incurring fixed-rate debt; and |
| • | Purchasing interest rate caps to hedge a portion of variable-rate debt against increases in interest rates. |
Nevertheless, we accept varying degrees of interest rate risk depending on market conditions. For additional discussion of our funding sources and asset liability management strategy, see Asset/Liability Management on page 51.
Competition
Banks, credit unions, and finance companies, some of which are SBICs, compete with us in originating medallion, commercial, and consumer loans. In addition, finance subsidiaries of equipment manufacturers also compete with us in originating commercial loans. Many of these competitors have greater resources than we do and certain competitors are subject to less restrictive regulations than us. As a result, we cannot assure you that we will be able to identify and complete the financing transactions that will permit us to compete successfully.
Employees
As of June 30, 2013 we employed 153 persons, including 51 at our Medallion Bank subsidiary. We believe that relations with all of our employees are good.
Properties
We lease approximately 17,000 square feet of office space in New York City for our corporate headquarters under a lease expiring in June 2016, and lease a facility in Long Island City, New York, of approximately 6,000 square feet for certain corporate back-office operations. We also lease office space for loan origination offices and subsidiaries operations in Boston, MA, Chicago, IL, Minneapolis, MN, and Flemington, NJ. Medallion Bank leases space in Salt Lake City, UT, and Seattle, WA. We do not own any real property, other than foreclosed property obtained as a result of lending relationships. We believe that our leased properties, taken as a whole, are in good operating condition and are suitable for our current business operations.
Legal Proceedings
We and our subsidiaries are currently involved in various legal proceedings incident to the ordinary course of our business, including collection matters with respect to certain loans. We intend to vigorously defend any outstanding claims and pursue our legal rights. In the opinion of our management and based upon the advice of legal counsel, there is no proceeding pending, or to the knowledge of management threatened, which in the event of an adverse decision would result in a material adverse effect on our results of operations or financial condition.
69
Table of Contents
The following table sets forth certain information as of June 30, 2013, regarding portfolio companies in which we had a material debt or equity investment. Because we are primarily a lender to small businesses, we have made debt investments through the form of medallion loans, other commercial loans which are generally standardized in nature and Medallion Bank has made consumer loans to more than 10,000 borrowers as described elsewhere in this prospectus.
| (Dollars in thousands) |
Industry |
State |
Security Type |
% Held | # of Invest. |
% of Total | Interest Rate(1) |
Investment Balances |
||||||||||||||||
| Medallion loans |
||||||||||||||||||||||||
| New York |
374 | 44 | % | 3.58 | % | $ | 204,578 | |||||||||||||||||
| Chicago |
98 | 8 | 5.00 | 39,260 | ||||||||||||||||||||
| Newark |
98 | 4 | 5.98 | 19,109 | ||||||||||||||||||||
| Boston |
54 | 5 | 5.26 | 21,975 | ||||||||||||||||||||
| Cambridge |
17 | 1 | 5.40 | 5,745 | ||||||||||||||||||||
| Other |
14 | 1 | 6.40 | 3,279 | ||||||||||||||||||||
|
|
|
|
|
|
|
|||||||||||||||||||
| Total |
655 | 63 | % | 4.12 | % | 293,946 | ||||||||||||||||||
| Deferred loan acquisition costs |
83 | |||||||||||||||||||||||
| Unrealized depreciation on loans |
— | |||||||||||||||||||||||
|
|
|
|||||||||||||||||||||||
| Medallion loans, net |
$ | 294,029 | ||||||||||||||||||||||
|
|
|
|||||||||||||||||||||||
| Commercial loans |
||||||||||||||||||||||||
| Secured mezzanine (37% Minnesota, 10% North Carolina, 8% New York, 8% Texas, 7% California, 7% Wisconsin, 6% Oklahoma, 5% Arizona, 5% Florida and 7% all other states)(2) |
||||||||||||||||||||||||
| Manufacturing |
13 | 6 | % | 13.83 | % | $ | 25,890 | |||||||||||||||||
| Administrative and support services |
4 | 2 | 11.23 | 7,213 | ||||||||||||||||||||
| Professional, scientific, and technical services |
3 | 1 | 13.49 | 5,202 | ||||||||||||||||||||
| Arts, entertainment, and recreation |
1 | 1 | 10.00 | 3,931 | ||||||||||||||||||||
| Accommodation and food services |
3 | * | 9.85 | 2,777 | ||||||||||||||||||||
| Information |
1 | * | 14.50 | 1,500 | ||||||||||||||||||||
| Health care and social assistance |
1 | * | 7.00 | 1,148 | ||||||||||||||||||||
| Retail trade |
1 | * | 10.00 | 539 | ||||||||||||||||||||
|
|
|
|
|
|
|
|||||||||||||||||||
| Total |
27 | 10 | % | 12.68 | $ | 48,200 | ||||||||||||||||||
| Asset-based (70% New York, 21% New Jersey, and 9% all other states) |
||||||||||||||||||||||||
| Wholesale trade |
10 | 1 | % | 5.30 | % | $ | 3,573 | |||||||||||||||||
| Transportation and warehousing |
5 | * | 6.25 | 1,283 | ||||||||||||||||||||
| Retail trade |
5 | * | 5.44 | 683 | ||||||||||||||||||||
| Finance and insurance |
6 | * | 6.25 | 659 | ||||||||||||||||||||
| Manufacturing |
5 | * | 6.25 | 526 | ||||||||||||||||||||
| Construction |
2 | * | 6.38 | 284 | ||||||||||||||||||||
| Administrative and support services |
2 | * | 5.64 | 205 | ||||||||||||||||||||
| Health care and social assistance |
2 | * | 5.42 | (6 | ) | |||||||||||||||||||
|
|
|
|
|
|
|
|||||||||||||||||||
| Total |
37 | 1 | % | 5.69 | $ | 7,207 | ||||||||||||||||||
70
Table of Contents
| (Dollars in thousands) |
Industry |
State |
Security Type |
% Held | # of Invest. |
% of Total | Interest Rate(1) |
Investment Balances |
||||||||||||||||||||
| Other secured commercial (76% New York, 23% New Jersey, and 1% Illinois) |
|
|||||||||||||||||||||||||||
| Retail trade |
|
15 | 2 | % | 10.43 | % | $ | 7,641 | ||||||||||||||||||||
| Accommodation and food services |
|
4 | 1 | 7.47 | 3,662 | |||||||||||||||||||||||
| Other services (except public administration) |
|
2 | * | 5.81 | 186 | |||||||||||||||||||||||
| Real estate and rental and leasing |
|
2 | * | 5.29 | 184 | |||||||||||||||||||||||
| Health care and social assistance |
|
1 | * | 7.50 | 148 | |||||||||||||||||||||||
| Transportation and warehousing |
|
1 | * | 6.50 | 1 | |||||||||||||||||||||||
|
|
|
|
|
|
|
|||||||||||||||||||||||
| Total |
|
25 | 3 | % | 9.32 | $ | 11,822 | |||||||||||||||||||||
| Total |
|
89 | 14 | % | 11.34 | % | $ | 67,229 | ||||||||||||||||||||
| Deferred loan acquisition income |
|
(40 | ) | |||||||||||||||||||||||||
| Unrealized depreciation on loans |
|
(7,960 | ) | |||||||||||||||||||||||||
|
|
|
|||||||||||||||||||||||||||
| Commercial loans, net |
|
$ | 59,229 | |||||||||||||||||||||||||
|
|
|
|||||||||||||||||||||||||||
| Investment in Medallion Bank and other controlled subsidiaries |
|
|||||||||||||||||||||||||||
| Medallion Fine Art, Inc. 437 Madison Avenue New York, NY 10022 |
Art dealing | NY | Common stock | 100 | % | 1 | * | 0.00 | % | $ | 1,240 | |||||||||||||||||
| LAX Group, LLC 437 Madison Avenue New York, NY 10022 |
Professional Sports Team | NY | Membership Interests | 42 | % | 1 | * | 0.00 | 585 | |||||||||||||||||||
| Medallion Bank** 1100 East 6600 South, Suite 510 Salt Lake City, UT 84121 |
Commercial banking | UT | Common stock | 100 | % | 1 | 20 | % | 12.23 | 94,049 | ||||||||||||||||||
| Medallion Hamptons Holding LLC 437 Madison Avenue New York, NY 10022 |
Real Estate | NY | Membership Interests | 100 | % | 1 | 1 | 0.00 | 3,750 | |||||||||||||||||||
| Medallion Servicing Corp. 437 Madison Avenue New York, NY 10022 |
Loan Service | NY | Common Stock | 100 | % | 1 | * | 0.00 | 571 | |||||||||||||||||||
| Generation Outdoor, Inc. 437 Madison Avenue New York, NY 10022 |
Advertising | NY | Common stock | 100 | % | 1 | * | 0.00 | 148 | |||||||||||||||||||
|
|
|
|
|
|||||||||||||||||||||||||
| Total |
|
6 | 22 | % | 11.46 | % | $ | 100,343 | ||||||||||||||||||||
| Unrealized appreciation on investments in Medallion Bank and other controlled subsidiaries |
|
— | ||||||||||||||||||||||||||
|
|
|
|||||||||||||||||||||||||||
| Investment in Medallion Bank and other controlled subsidiaries, net |
|
$ | 100,343 | |||||||||||||||||||||||||
|
|
|
|||||||||||||||||||||||||||
71
Table of Contents
| (Dollars in thousands) |
Industry |
State |
Security Type |
% Held | # of Invest. |
% of Total | Interest Rate(1) |
Investment Balances |
||||||||||||||||||||
| Equity investments |
|
|||||||||||||||||||||||||||
| Convergent Capital, Ltd 505 N. Highway 169 Minneapolis MN 35441 |
Commercial Finance | MN | Limited Partnership Interest | 7 | % | 1 | * | 0.00 | % | 1,133 | ||||||||||||||||||
| PMC Commercial Trust ** 17950 Preston Road, Suite 600 Dallas, TX 75252 |
Real Estate Investment | TX | Common Stock | * | 1 | * | 6.45 | 901 | ||||||||||||||||||||
| Medallion Motorsports, LLC 3000 West Country Road Burnsville, MN 55337 |
NASCAR Race Team | MN | Limited Liability Interest | 75 | % | 1 | * | 0.00 | 1,954 | |||||||||||||||||||
| Aeration Industries International, LLC 4100 Peavey Road Chaska, MN 55318 |
Equipment Manufacturing | MN | Limited Liability Interest | 5.25 | % | 1 | * | 0.00 | 364 | |||||||||||||||||||
| Reel Power International, Inc. 913 North Wheeling Ave Tulsa, OK 74110 |
Machinery Manufacturer | OK | Common Stock | 2.65 | % | 1 | * | 0.00 | 318 | |||||||||||||||||||
| Summit Medical, Inc. 815 Northwest Parkway, Suite 100 St. Paul, MN 55121 |
Surgical Instruments | MN | Common Stock | 9.25 | % | 1 | * | 0.00 | 135 | |||||||||||||||||||
| Quaker Bakery Brands, Inc. 1207 North Mason Street P.O. Box 1016 Appleton, WI 59414 |
Bakery | WI | Senior Preferred Stock | * | 1 | * | 0.00 | 359 | ||||||||||||||||||||
| First National Bank of New York** 152 West 57th Street, 52nd Floor New York, NY 10019 |
Banking | NY | Common Stock | * | 1 | * | 0.00 | 750 | ||||||||||||||||||||
| Appliance Recycling Centers of America, Inc.** 7400 Excelsior Boulevard Minneapolis, MN 55426-4516 |
Appliance Recycler | MN | Common Stock | 8.86 | % | 1 | * | 0.00 | — | |||||||||||||||||||
|
|
|
|
|
|
|
|||||||||||||||||||||||
| Total |
|
9 | 1 | % | 0.98 | % | $ | 5,914 | ||||||||||||||||||||
| Unrealized appreciation on equities |
|
825 | ||||||||||||||||||||||||||
|
|
|
|||||||||||||||||||||||||||
| Equity investments, net |
|
$ | 6,739 | |||||||||||||||||||||||||
|
|
|
|||||||||||||||||||||||||||
72
Table of Contents
| (Dollars in thousands) |
Industry |
State |
Security Type |
% Held | # of Invest. |
% of Total | Interest Rate(1) |
Investment Balances |
||||||||||||||||
| Investment securities |
||||||||||||||||||||||||
|
|
|
|
|
|
|
|||||||||||||||||||
| Total |
— | — | % | — | % | $ | — | |||||||||||||||||
| Unrealized appreciation on investment securities |
— | |||||||||||||||||||||||
| Investment securities, net |
$ | — | ||||||||||||||||||||||
|
|
|
|
|
|
|
|
|
|||||||||||||||||
| Total investments at cost |
759 | 100 | % | 6.69 | % | $ | 467,432 | |||||||||||||||||
|
|
|
|
|
|
|
|||||||||||||||||||
| Deferred loan acquisition income |
43 | |||||||||||||||||||||||
| Unrealized appreciation on investments in Medallion Bank and other controlled subsidiaries |
— | |||||||||||||||||||||||
| Unrealized appreciation on equities |
825 | |||||||||||||||||||||||
| Unrealized depreciation on loans |
(7,960 | ) | ||||||||||||||||||||||
|
|
|
|||||||||||||||||||||||
| Net Investments ($238,638 pledged as collateral under borrowing arrangements) |
$ | 460,340 | ||||||||||||||||||||||
|
|
|
|||||||||||||||||||||||
| * | Less than 1.0% |
| ** | Not an eligible portfolio company as such term is defined in Section 2(a)(46) of the 1940 Act. |
| (1) | Represents the weighted average interest or dividend rate of the respective portfolio as of the date indicated. |
| (2) | Included in secured mezzanine commercial loans was $1,855,000 of interest income capitalized into the outstanding investment balances, in accordance with the terms of the investment contract. |
73
Table of Contents
DETERMINATION OF NET ASSET VALUE
The net asset value per share of our common stock is determined by dividing total shareholders’ equity by the total number of shares of common stock outstanding at that date.
A substantial portion of our assets consist of the loans held in the portfolios of our subsidiaries Medallion Funding, Medallion Capital, and Freshstart which are RICs. The respective boards of directors of these subsidiaries approve the valuation of their respective loans in connection with their respective determinations of net asset value.
We value our portfolio at fair value as determined in good faith by our Board of Directors in accordance with our valuation policy. Unlike certain lending institutions, we are not permitted to establish reserves for loan losses. Instead, we must value each individual investment and portfolio loan on a quarterly basis. We record unrealized depreciation on investments and loans when we believe that an asset has been impaired and full collection is unlikely. We record unrealized appreciation on equities if it has a clear indication that the underlying portfolio company has appreciated in value and, therefore, our security has also appreciated in value. Without a readily ascertainable market value, the estimated value of our portfolio of investments and loans may differ significantly from the values that would be placed on the portfolio if there existed a ready market for the investments. We adjust the valuation of the portfolio quarterly to reflect our Board of Directors’ estimate of the current fair value of each investment in the portfolio. Any changes in estimated fair value are recorded in our statement of operations as net unrealized appreciation (depreciation) on investments.
Our investment in Medallion Bank, as a wholly owned portfolio investment, is also subject to quarterly assessments of fair value. We conduct a thorough valuation analysis as described previously and also receive an opinion regarding the valuation from an independent third party to assist the Board of Directors in its determination of the fair value of Medallion Bank. We determine whether any factors give rise to a valuation different than recorded book value, including various regulatory restrictions that were established at Medallion Bank’s inception, by the FDIC and State of Utah, and also by additional regulatory restrictions, such as the prior moratorium imposed by the Dodd-Frank Act on the acquisition of control of an industrial bank by a “commercial firm” (a company whose gross revenues are primarily derived from non-financial activities) which expired in July 2013. Because of these restrictions and other factors, our Board of Directors has determined that Medallion Bank has little value beyond its recorded book value. As a result of this valuation process, we used Medallion Bank’s actual results of operations as the best estimate of changes in fair value, and recorded the results as a component of unrealized appreciation (depreciation) on investments, although changes in these restrictions and other applicable factors could change these conclusions in the future. For more information, see “Risk Factors—Risks Relating to Our Business and Structure—Our investment portfolio is, and will continue to be, recorded at fair value as determined in good faith by our Board of Directors and, as a result, there is, and will continue to be, uncertainty as to the value of our portfolio investments which could adversely affect our net asset value.”
74
Table of Contents
Our business and affairs are managed under the direction of our Board of Directors. The Board of Directors currently consists of nine members, six of whom are not “interested persons” as defined in Section 2(a)(19) of the 1940 Act. We refer to these individuals as our independent directors. Our Board of Directors elects our officers who serve at the discretion of the Board of Directors.
Structure of Board of Directors
Under our charter, our directors are divided into three classes. Each class of directors holds office for a three year term. At each annual meeting of our shareholders, the successors to the class of directors whose terms expire at such meeting will be elected to hold office for a term expiring at the annual meeting of shareholders held in the third year following the year of their election. Each director holds office for the term to which he or she is elected and until his or her successor is duly elected and qualified.
Directors
| Name, Address, and Age |
Position |
Term of Office and Length
of |
Principal Occupation(s) During Past 5 Years |
Number of |
Other | |||||
| Independent Directors |
||||||||||
| Henry L. Aaron c/o Medallion Financial Corp. 437 Madison Avenue, 38th Floor New York, New York 10022 Age: 79 |
Director | 3 Years—Current term expires in 2014
Director since 2004 |
Senior Vice President of Atlanta National League Baseball Club, Inc. | N/A | Current DSW Inc. Previous Retail Ventures, Inc. Sports Properties Acquisition Corp. | |||||
| Henry D. Jackson(1) c/o Medallion Financial Corp. 437 Madison Avenue, 38th Floor New York, New York 10022 Age: 48 |
Director | 3 Years—Current term expires in 2014
Director since 2002 |
Managing Partner and Chief Executive of OpCapita LLP, a private investment fund
Managing Partner and Chief Executive of Merchant Equity Partners LLP, the predecessor to OpCapita |
N/A | None | |||||
| Stanley Kreitman c/o Medallion Financial Corp. 437 Madison Avenue, 38th Floor New York, New York 10022 Age: 81 |
Director | 3 Years—Current term expires in 2015
Director since 1996 |
Chairman of Manhattan Associates, an investment banking company
Senior Advisor of the Advisory Board to Signature Bank |
N/A | Current CCA Industries, Inc. KSW Corp. Previous Capital Lease Funding Geneva Financial Corp. Sports Properties Acquisition Corp. Renaissance Acquisition Corp. | |||||
| Frederick A. Menowitz c/o Medallion Financial Corp. 437 Madison Avenue, 38th Floor New York, New York 10022 Age: 76 |
Director | 3 Years—Current term expires in 2015
Director since 2003 |
Independent real estate investor | N/A | None | |||||
75
Table of Contents
| Name, Address, and Age |
Position |
Term of Office and Length
of |
Principal Occupation(s) During Past 5 Years |
Number of |
Other | |||||
| Lowell P. Weicker, Jr. c/o Medallion Financial Corp. 437 Madison Avenue, 38th Floor New York, New York 10022 Age: 82 |
Director | 3 Years—Current term expires in 2016
Director since 2003 |
Retired | N/A | Previous World Wrestling Entertainment, Inc. Compuware Corporation | |||||
| Interested Directors |
||||||||||
| Mario M. Cuomo c/o Medallion Financial Corp. 437 Madison Avenue, 38th Floor New York, New York 10022 Age: 81 |
Director | 3 Years—Current term expires in 2016
Director since 1996 |
Of counsel in the law firm of Willkie Farr & Gallagher LLP(3) | N/A | Previous Sports Properties Acquisition Corp. | |||||
| Alvin Murstein(4) c/o Medallion Financial Corp. 437 Madison Avenue, 38th Floor New York, New York 10022 Age: 79 |
Chairman and Chief Executive Officer | 3 Years—Current term expires in 2014
Director since 1995 |
Chairman and Chief Executive Officer of Medallion Financial Corp. | N/A | None | |||||
| Andrew M. Murstein(5) c/o Medallion Financial Corp. 437 Madison Avenue, 38th Floor New York, New York 10022 Age: 49 |
President and Director | 3 Years—Current term expires in 2016
Director since 1997 |
President of Medallion Financial Corp. | N/A | Previous Sports Properties Acquisition Corp. | |||||
| David L. Rudnick(2) c/o Medallion Financial Corp. 437 Madison Avenue, 38th Floor New York, New York 10022 Age: 73 |
Director | 3 Years—Current term expires in 2015
Director since 1996 |
President of Rudco Properties, Inc., a real estate management concern
Chief Executive Officer of the Century Associates Group, a national commercial real estate concern |
N/A | None | |||||
| (1) | Mr. Jackson resides outside the United States and a substantial portion of his assets are located outside the United States. He has not authorized an agent in the United States to receive service of process. As a result, it may not be possible for investors to effect service of process within the United States or to enforce against him in United States courts judgments predicated upon civil liability provisions of United States securities laws. It also may not be possible to enforce against him in foreign courts judgments of United States courts or liabilities in original actions predicated upon civil liability provisions of the United States. |
| (2) | Mr. Rudnick is Andrew M. Murstein’s father-in-law. |
| (3) | Willkie Farr & Gallagher LLP serves as our counsel in connection with various legal matters. |
| (4) | Alvin Murstein is the father of Andrew M. Murstein. |
| (5) | Andrew Murstein is the son of Alvin Murstein and the son-in law of David Rudnick. |
76
Table of Contents
Executive Officers Who Are Not Directors
| Name, Address, and Age |
Position
Held |
Term of Office and |
Principal Occupation(s) During Past 5 | |||
| Larry D. Hall c/o Medallion Financial Corp. 437 Madison Avenue, 38th Floor New York, New York 10022 Age: 59 |
Senior Vice President and Chief Financial Officer | Indefinite
Officer since 2000 |
Senior Vice President and Chief Financial Officer of Medallion Financial Corp. | |||
| Michael J. Kowalsky c/o Medallion Financial Corp. 437 Madison Avenue, 38th Floor New York, New York 10022 Age: 67 |
Executive Vice President | Indefinite
Officer since 1996 |
Executive Vice President of Medallion Financial Corp. | |||
| Brian S. O’Leary c/o Medallion Financial Corp. 437 Madison Avenue, 38th Floor New York, New York 10022 Age: 67 |
Executive Vice President and Chief Operating Officer | Indefinite
Officer since 1999 |
Executive Vice President and Chief Operating Officer of Medallion Financial Corp. | |||
| Marie Russo c/o Medallion Financial Corp. 437 Madison Avenue, 38th Floor New York, New York 10022 Age: 89 |
Senior Vice President and Secretary | Indefinite
Officer since 1996 |
Senior Vice President and Secretary of Medallion Financial Corp. | |||
| Jeffrey Yin c/o Medallion Financial Corp. 437 Madison Avenue, 38th Floor New York, New York 10022 Age: 39 |
Chief Compliance Officer and General Counsel | Indefinite
Officer since 2005 |
Chief Compliance Officer and General Counsel of Medallion Financial Corp. | |||
Biographical Information
Our directors have been divided into two groups—interested directors and independent directors. Interested directors are interested persons as defined in the 1940 Act.
Independent Directors
Henry L. Aaron has served as our director since November 2004. Mr. Aaron served as a director of Turner Broadcasting System, Inc. from 1980 until its acquisition by Time Warner, Inc. in 1996. Mr. Aaron is currently Senior Vice President of Atlanta National League Baseball Club, Inc. Mr. Aaron sits on the board of directors DSW Inc. and the Atlanta Braves. He also sits on the board of advisors of the Atlanta Falcons. Mr. Aaron previously served as a director of Retail Ventures, Inc. and Sports Properties Acquisition Corp. He is a member of the Board of Governors for Boys and Girls Clubs of America. Mr. Aaron is a recipient of the Presidential Medal of Freedom, the nation’s highest civilian award, awarded by President George W. Bush. Mr. Aaron brings strong executive management skills to our Board of Directors. He also provides the Board of Directors with experience on other public company boards of directors which provides our Board of Directors with insight on developing best practices for public companies in areas such as risk oversight and corporate governance matters.
Henry D. Jackson has served as our director since November 2002. Mr. Jackson is Managing Partner and Chief Executive of OpCapita LLP, a private investment fund headquartered in London, England and focused on special situations in the European retail industry. Prior to establishing Merchant Equity Partners, the predecessor to OpCapita, in 2006, he spent 20 years as an investment banker to the retail sector in Europe and the United States and was a Managing Director of Deutsche Bank and Credit Suisse First Boston. Mr. Jackson received a
77
Table of Contents
B.Sc., with honors, from the Wharton School, a B.A., with honors, from the University of Pennsylvania, and was elected to Phi Beta Kappa. Mr. Jackson’s leadership experience in the investment banking industry allows him to provide continued financial business skills to our Board of Directors.
Stanley Kreitman has served as our director since February 1996. Since 1993, Mr. Kreitman has served as Chairman of Manhattan Associates, an investment banking company. In addition, since 2001, Mr. Kreitman has served as Senior Advisor of the Advisory Board to Signature Bank. Mr. Kreitman served as a director of Tri-Magna from 1991 until May 1996. Mr. Kreitman served as President of the United States Banknote Corporation, a securities printing company, from 1976 until his retirement in 1996. Mr. Kreitman serves as a member of the board of directors of CCA Industries, Inc. and KSW Corp., both publicly-traded companies. Mr. Kreitman previously served as a director of Capital Lease Funding, Geneva Financial Corp., Sports Properties Acquisition Corp. and Renaissance Acquisition Corp. He also serves as Chairman of the New York City Board of Corrections. Mr. Kreitman received a B.S. from New York University. Mr. Kreitman’s financial accounting skills have qualified him to chair our Audit Committee and to serve as the audit committee financial expert. He also provides the Board of Directors with experience on other public company boards of directors which provides our Board of Directors with insight on developing best practices for public companies in areas such as risk oversight and corporate governance matters. Mr. Kreitman has deep knowledge of our company and its business, having served on our Board of Directors since 1996.
Frederick A. Menowitz has served as our director since May 2003. Mr. Menowitz is currently an independent real estate investor with over 50 years of experience and a philanthropist. Mr. Menowitz received a B.A. from the University of Virginia and a J.D. from the University of Virginia School of Law. He is a Founder of Mount Sinai Medical Center, Miami Beach, Florida and a member of the Board of Directors of the Cystic Fibrosis Foundation. Mr. Menowitz brings legal and business expertise and finance and investment skills to our Board of Directors.
Lowell P. Weicker, Jr. has served as our director since February 2003. Mr. Weicker served as Governor of the State of Connecticut from 1991 to 1995. He served as a United States Senator representing the State of Connecticut from 1970 to 1988. Mr. Weicker serves as President of Trust for America’s Health, a Washington, DC-based advocate for better public health. Mr. Weicker previously served as a director of World Wrestling Entertainment, Inc. and Compuware Corporation. He received a B.A. from Yale University and a L.L.B. from the University of Virginia School of Law. Mr. Weicker brings valuable skills to the Board of Directors that he acquired through his extensive career in the public sector, such as his expertise in the areas of government relations and external affairs. He also provides the Board of Directors with experience on other public company boards of directors which provides our Board of Directors with insight on developing best practices for public companies in areas such as risk oversight and corporate governance matters.
Interested Directors
Mario M. Cuomo has served as our director since February 1996. Mr. Cuomo served as Governor of the State of New York from January 1983 through 1994. Mr. Cuomo has been of counsel in the law firm of Willkie Farr & Gallagher LLP since July 2002 and was a partner in Willkie Farr & Gallagher LLP from February 1995 through June 2002. Willkie Farr & Gallagher LLP serves as our counsel in connection with various legal matters. Mr. Cuomo previously served as a director of Sports Properties Acquisition Corp. Mr. Cuomo received a B.A., summa cum laude, from St. John’s University and a J.D., magna cum laude, from St. John’s University School of Law. Mr. Cuomo brings valuable skills to the Board of Directors that he acquired through his extensive career in the public sector, such as his expertise in the areas of government relations and external affairs. Mr. Cuomo’s experience at an international law firm provides the Board of Directors with strong legal skills that are useful in the discussion and evaluation of financial and general corporate affairs. Mr. Cuomo has deep knowledge of our company and its business, having served on our Board of Directors since 1996.
78
Table of Contents
Alvin Murstein has served as Chairman of our Board of Directors since our founding in 1995 and has been our Chief Executive Officer since February 1996. Mr. Murstein has also been Chairman of the board of directors and Chief Executive Officer of Medallion Funding LLC, formerly known as Medallion Funding Corp., since its founding in 1979. He also currently serves and has previously served as officer and director of some of our other wholly owned subsidiaries. Mr. Murstein received a B.A. and an M.B.A. from New York University and has been an executive in the taxicab industry for over 40 years. Mr. Murstein served on the board of directors of the Strober Organization, Inc., a building supply company, from 1988 to 1997. Alvin Murstein is the father of Andrew M. Murstein. Mr. Murstein brings to our Board of Directors over 50 years of experience in the ownership, management, and financing of taxicab medallions and other commercial businesses. He has deep knowledge of our company and its business, having served as Chairman of our Board of Directors since our founding in 1995 and our Chief Executive Officer since 1996.
Andrew M. Murstein has served as our President since our inception in 1995. Mr. Murstein has served as our director since October 1997. He also currently serves and has previously served as officer and director of some of our wholly owned subsidiaries. Mr. Murstein previously served as the Vice Chairman and Secretary of Sports Properties Acquisition Corp. Mr. Murstein received a B.A. in economics, cum laude, from Tufts University and an M.B.A. in finance from New York University. Andrew Murstein is the son of Alvin Murstein and the son-in law of David Rudnick. Mr. Murstein brings to our Board of Directors over 25 years of experience in the ownership, management, and financing of taxicab medallions and other commercial businesses. He has deep knowledge of our company and its business, having served as our President since our inception in 1995 and on our Board of Directors since 1997.
David L. Rudnick has served as our director since February 1996. Mr. Rudnick serves as President of Rudco Properties, Inc., a real estate management concern and CEO of the Century Associates Group, a national commercial real estate concern which he founded in 1969. Mr. Rudnick served as President of Rudco Industries, Inc., an international manufacturer of machine readable documents, from 1963 to 1986. Mr. Rudnick previously served as President of the Financial Stationers Association and a director of West Side Federal Savings & Loan Association. Mr. Rudnick received an A.B. with honors in economics from Harvard University and an M.B.A. from Columbia University Graduate School of Business. Mr. Rudnick is Andrew M. Murstein’s father-in-law. Mr. Rudnick brings investment and executive management skills to our Board of Directors. He also has deep knowledge of our company and its business, having served on our Board of Directors since 1996.
Executive Officers Who Are Not Directors
Larry D. Hall has served as our Chief Financial Officer since March 2004. Prior to that he served as our Acting Chief Financial Officer since July 2003. Prior to that he served as our Chief Accounting Officer since May 2001 and our Assistant Treasurer since October 2000. Mr. Hall previously served as Chief Financial Officer of Sports Properties Acquisition Corp. Mr. Hall was employed by Citibank as Vice President—Corporate Financial Control/Corporate Reporting & Analysis from October 1995 to October 2000. Mr. Hall was Vice President—Finance/Controller, Treasurer and Secretary of Consolidated Waste Services of America from April 1993 to March 1995. Prior to that, he was Vice President—Manager of Line Accounting for Wells Fargo and Co. from November 1987 to March 1993 and Senior Audit Manager in the Financial Services Industry Group for Arthur Andersen & Company from September 1976 to October 1987. Mr. Hall received his B.S. in business administration from the University of Southern California.
Michael J. Kowalsky has served as our Executive Vice President since May 1996. Mr. Kowalsky has been President of Medallion Funding LLC, formerly known as Medallion Funding Corp., since June 1996. He also served as Chief Operating Officer of Edwards Capital from 1992 until June 1996. Prior to joining Edwards Capital in 1990, Mr. Kowalsky was a Senior Vice President at General Cigar Co. Inc., a cigar manufacturing company. Mr. Kowalsky received a B.A. and M.A. in economics from the University of Kentucky and an M.B.A. from the New York University Graduate School of Business.
79
Table of Contents
Brian S. O’Leary has served as our Chief Operating Officer since April 2001. Mr. O’Leary joined us in December 1999 as Executive Vice President and Chief Credit Officer. From April 1996 to December 1999, Mr. O’Leary was Executive Vice President of Atlantic Bank of New York, serving initially as Chief Credit Officer and Chief Administrative Officer and later as head of middle market banking which included the bank’s Leasing and Premium Finance subsidiaries. Mr. O’Leary was also a member of the management credit committee. From May 1990 to April 1996 Mr. O’Leary was with Bank Leumi Trust Co. of New York, first as a Deputy Division Head of the Lending Division and a Deputy Chief Lending Officer and then as EVP and Division Executive of domestic banking. He was also a member of the Senior Credit Committee. From July 1977 to May 1990, he was with Marine Midland Bank, most recently as a Regional Executive Vice President. He began his banking career in 1970 with Bankers Trust Co. in the metropolitan banking division. Mr. O’Leary received a B.A. in economics from Fordham University and an M.B.A. in finance from Pace University.
Marie Russo has served as our Senior Vice President and Secretary since February 1996. Ms. Russo has also been Senior Vice President and Secretary of Medallion Funding LLC, formerly known as Medallion Funding Corp., since June 1996. Ms. Russo served as Vice President of Operations of Tri-Magna from 1989 until its acquisition by us in May 1996. From 1989 to 1996, she was Vice President of Medallion Funding LLC, formerly known as Medallion Funding Corp., and from 1983 to 1986, she was Controller of Medallion Funding LLC, formerly known as Medallion Funding Corp. Ms. Russo received a B.S. in accounting from Hunter College.
Jeffrey Yin has served as our General Counsel and Chief Compliance Officer since June 2005. Prior to joining us, Mr. Yin served as Corporate Counsel of Marsh & McLennan Companies, Inc. Prior to joining Marsh & McLennan Companies, Mr. Yin was an attorney in the New York office of Orrick, Herrington & Sutcliffe LLP. Mr. Yin received a B.A. in Economics and Rhetoric from the University of California at Berkeley and a J.D. from the New York University School of Law.
Committees of the Board of Directors
We have four standing committees: the Audit Committee, the Compensation Committee, the Nominating and Governance Committee and the Executive Committee. Each of these committees, except the Executive Committee, has a written charter approved by the Board of Directors. A copy of each charter can be found in the “For Investors” section of our website at www.medallion.com.
Audit Committee
The Audit Committee reviews the results and scope of the audit and other services provided by our independent public accountants. The Audit Committee met four times during the year ended December 31, 2012 to review (i) the effectiveness of the public accountants during the audit for the year ended December 31, 2012, (ii) the adequacy of the 2012 financial statement disclosures for the year ended December 31, 2012, (iii) our internal control policies and procedures, and (iv) the selection of our independent public accountants. The members of the Audit Committee are Messrs. Kreitman, Jackson, and Menowitz. Mr. Kreitman is the Chairman and audit committee financial expert. Each Audit Committee member meets the independence requirements of NASDAQ and the SEC.
Compensation Committee
The Compensation Committee makes recommendations concerning compensation of our directors and executive officers including (i) all incentive, restricted stock or stock option plans or arrangements established by us for officers and employees, including the grant of stock options and restricted stock to employees, (ii) adoption and amendment of all employee restricted stock, stock option and other employee benefit, plans and arrangements and (iii) the engagement of, terms of any employment agreements and arrangements with, and termination of, all of our officers. The Compensation Committee reviews management’s recommendations and
80
Table of Contents
advises management and the Board of Directors on broad compensation policies such as salary ranges, annual incentive bonuses, long-term incentive plans, including equity-based compensation programs, and other benefit and perquisite programs. The Compensation Committee may, in its discretion, delegate all or a portion of its duties and responsibilities to a subcommittee of the Compensation Committee. The Compensation Committee has the resources and authority to discharge its duties and responsibilities, including the authority to retain counsel and other experts or consultants. The Compensation Committee has sole authority to select and retain a compensation consultant, to terminate any consultant retained by the Compensation Committee, and to approve the fees and other retention terms of any consultant. These consultants report directly to the Compensation Committee.
The Compensation Committee meets with the frequency necessary to perform its duties and responsibilities. The Compensation Committee usually makes many of its performance-based decisions at a meeting held in February of each fiscal year, including evaluating the performance of our named executive officers, or NEOs, during the immediately preceding year, determining the amount of their annual cash bonuses for the preceding year and determining base salaries for the upcoming fiscal year. Grants of equity compensation are generally made in the first quarter of each year.
In 2009 and 2010, the Compensation Committee retained the services of a third party, independent executive consultant, Meridian Compensation Partners, LLC, or Meridian, to assist the Compensation Committee in its review of our executive compensation practices, including the competitiveness of our executive pay levels. At no time during 2009 or 2010 or at any other time did the Compensation Committee direct Meridian to perform services in any particular manner or under any particular method. The Compensation Committee has the final authority to hire and terminate the consultant, and the Compensation Committee evaluates the consultant annually. The Compensation Committee did not engage an executive compensation consultant for 2012 but performed its own assessment of executive compensation.
The members of the Compensation Committee are Messrs. Aaron, Menowitz, and Weicker, who is the Chairman. Each member of the Compensation Committee is an “independent director,” as defined under Rule 4200(a)(15) of the NASDAQ Marketplace Rules. Each member is also a “non-employee director,” as defined in Rule 16b-3 promulgated under the Exchange Act, and each qualifies as an “outside director” within the meaning of Section 162(m) of the Internal Revenue Code of 1986, as amended. The Board of Directors did not reject any recommendations of the Compensation Committee during the year ended December 31, 2012. The Compensation Committee met three times during the year ended December 31, 2012 and made recommendations concerning compensation, restricted stock, stock options and other employment matters. See “Compensation Committee Report.”
Nominating and Governance Committee
The Nominating and Governance Committee identifies individuals qualified to become members of the Board of Directors and recommends individuals to the Board of Directors for nomination as members of the Board of Directors and its committees. The Nominating and Governance Committee is also charged with overseeing the evaluation of the Board of Directors and reviewing our board governance principles and advising the Board of Directors on such board governance. The members of the Nominating and Governance Committee are Messrs. Jackson, Kreitman, and Weicker. Mr. Kreitman is the Chairman. Each Nominating and Governance Committee member meets the independence requirements of the NASDAQ and the SEC. The Nominating and Governance Committee met one times during the year ended December 31, 2012.
Nominees for the Board of Directors should be committed to enhancing long-term shareholder value and must possess a high level of personal and professional ethics, sound business judgment and integrity. The Board of Directors’ policy is to encourage the selection of directors who will contribute to our overall corporate goals: responsibility to shareholders, finance leadership, effective execution, high customer satisfaction and superior employee working environment. In nominating a candidate for election to the Board of Directors, the Nominating
81
Table of Contents
and Governance Committee may take into consideration such factors as it deems appropriate. These factors may include judgment, skill, diversity, experience with businesses and other organizations comparable to us, the interplay of the candidate’s experience with the experiences of other board members, and the extent to which the candidate would be a desirable addition to the Board of Directors and any committees. While the Nominating and Governance Committee carefully considers diversity when considering directors, it has not established a formal policy regarding diversity. In evaluating potential candidates for the Board of Directors, the Nominating and Governance Committee considers the above factors in the light of the specific needs of the Board of Directors at that time.
In recommending candidates for election to the Board of Directors, the Nominating and Governance Committee considers nominees recommended by directors, officers, employees, shareholders and others, using the same criteria to evaluate all candidates. The Nominating and Governance Committee reviews each candidate’s qualifications, including whether a candidate possesses any of the specific qualities and skills desirable in certain members of the Board of Directors. Evaluation of candidates generally involve a review of background materials, internal discussions and interviews with selected candidates as appropriate. Upon selection of a qualified candidate, the Nominating and Governance Committee would recommend the candidate for consideration by the full Board of Directors. The Nominating and Governance Committee may engage third-party consultants or search firms to assist in identifying and evaluating potential nominees. To recommend a prospective nominee for the Nominating and Governance Committee’s consideration, submit the candidate’s name and qualifications to our Secretary in writing to the following address: Medallion Financial Corp., Attn: Secretary, 437 Madison Avenue, 38th Floor, New York, New York 10022, with a copy to Medallion Financial Corp, Attn: General Counsel at the same address. When submitting candidates for nomination to be elected at the annual meeting of shareholders, shareholders must also follow the notice procedures and provide the information required by our bylaws.
In particular, for the Nominating and Governance Committee to consider a candidate or candidates recommended by a shareholder for nomination at our next annual meeting of shareholders, written notice of such shareholder’s intent to make such nomination or nominations must be given, either by personal delivery or by United States mail, postage prepaid, to our Secretary not later than 120 days in advance of the date of our notice of annual meeting released to shareholders in connection with the previous year’s annual meeting of shareholders, except that if no annual meeting was held in the previous year or the date of the annual meeting has been changed by more than 30 days from the date contemplated at the time of the previous year’s notice of annual meeting of shareholders, then, in that event only, a shareholder’s notice must be delivered to and received at our principal executive offices at least 30 days before the notice of the date of the annual meeting is mailed to shareholders in the current year. The notice must include the information specified in our bylaws, including the following:
| • | the name and address of the shareholder who intends to make the nomination and of the person or persons to be nominated; |
| • | a representation that the shareholder is a holder of record of our stock entitled to vote at such meeting and intends to appear in person or by proxy at the meeting the person or persons specified above; |
| • | a description of all arrangements or understandings between the shareholder and each nominee and any other person or persons (naming such person or persons) pursuant to which the nomination or nominations are to be made by the shareholder; |
| • | such other information regarding each nominee proposed by such shareholders as would be required to be included in our proxy statement filed pursuant to the proxy rules of the SEC had the nominee been nominated, or intended to be nominated, by the Board of Directors; and |
| • | the consent of each nominee to serve as our director if so elected. |
82
Table of Contents
Executive Committee
The Executive Committee meets on an ad hoc basis to provide strategic and managerial advice to management. The members of the Executive Committee are Messrs. Alvin Murstein, Andrew M. Murstein, Stanley Kreitman, and David L. Rudnick. The Executive Committee met one time during the year ended December 31, 2012.
Board Leadership Structure
Alvin Murstein serves as both the Chief Executive Officer and Chairman of the Board of Directors. Mr. Murstein is an “interested person” under the 1940 Act. The Board of Directors believes that this leadership structure is appropriate because Mr. Murstein’s service as both the Chief Executive Officer and Chairman of the Board of Directors is in the best interest of our company and our shareholders. Mr. Murstein possesses detailed and in-depth specialized knowledge of the taxicab medallion loan business, opportunities and challenges facing our company and is thus best positioned to develop agendas that ensure that the Board of Director’s time and attention are focused on the most critical matters. His combined role enables greater efficiency regarding management of the company, provides for decisive leadership, ensures clear accountability, and enhances our ability to communicate our message and strategy clearly and consistently to our shareholders, employees and customers. Because of the ease of communication arising from the relatively small size of the Board of Directors and the small number of independent directors, the Board of Directors has determined not to designate a lead independent director.
The Board of Directors believes that our independent directors provide effective oversight of management. Moreover, in addition to feedback provided during the course of Board of Director meetings, the independent directors hold regular executive sessions. We believe that this approach effectively encourages full engagement of all directors in executive sessions, while avoiding unnecessary hierarchy. Following an executive session of independent directors, the presiding director acts as a liaison between the independent directors and the Chairman regarding any specific feedback or issues, provides the Chairman with input regarding agenda items for Board and Committee meetings, and coordinates with the Chairman regarding information to be provided to the independent directors in performing their duties. The Board believes that this approach appropriately and effectively complements the combined Chairman/Chief Executive Officer structure.
Board’s Role in Risk Oversight
While risk management is primarily the responsibility of our management team, the Board of Directors is responsible for the overall supervision of our risk management activities. The Board’s oversight of the material risks faced by our company occurs at both the full board level and at the committee level.
Management provides regular updates throughout the year to the respective committees regarding the management of the risks they oversee, and each of these committees report on risk to the full board at regular meetings of the Board. In addition to the reports from the committees, the Board receives presentations throughout the year from various department and business unit leaders that include discussion of significant risks as necessary. At each Board meeting, the Board addresses matters of particular importance or concern, including any significant areas of risk that require Board attention.
We believe that our approach to risk oversight, as described above, optimizes our ability to assess inter-relationships among the various risks, make informed cost-benefit decisions, and approach emerging risks in a proactive manner for our company. We also believe that our risk structure complements our current board leadership structure, as it allows our independent directors, through our fully independent board committees and otherwise, to exercise effective oversight of the actions of management in identifying risks and implementing effective risk management policies and controls.
83
Table of Contents
Code of Ethics
As part of our compliance with the 1940 Act, we have in place a code of ethics policy for our directors, officers and employees. These persons must act ethically at all times and in accordance with the guidelines comprising our Code of Ethical Conduct and Insider Trading Policy (codified as a written policy and adopted by the Board of Directors on October 4, 2004 and amended on August 1, 2006 and April 30, 2008) to establish standards and procedures for the prevention and detection of activities which signal a conflict of interest or an abuse of fiduciary duty. Our Code of Ethical Conduct and Insider Trading Policy establishes procedures for personal investment and restricts certain transactions by our personnel. Our Code of Ethical Conduct and Insider Trading Policy generally does not permit investment by our employees in securities that have been or are contemplated to be purchased or held by us. To further promote ethical and responsible decision-making, the Board of Directors also adopted a Code of Ethical Conduct for Senior Financial Officers. Our Code of Ethical Conduct and Insider Trading Policy and Code of Ethical Conduct for Senior Financial Officers can be found in the “For Investors” section of our website at www.medallion.com. If we make any substantive amendments to the Code of Ethics or grant any waiver from a provision of the Code to any executive officer or director, we will promptly disclose the nature of the amendment or waiver on our website. You may also read and copy our Code of Ethical Conduct and Insider Trading Policy at the SEC’s Public Reference Room in Washington, D.C. You may obtain information on operations of the Public Reference Room by calling the SEC at 1-202-551-8090. In addition, our Code of Ethical Conduct and Insider Trading Policy is available on the EDGAR database on the SEC Internet site at http://www.sec.gov. You may obtain copies of the our Code of Ethical Conduct and Insider Trading Policy, after paying a duplicating fee, by electronic request at the following E-mail address: publicinfo@sec.gov, or by writing to the SEC’s Public Reference Section, Washington, D.C. 20549-0102. The Board of Directors expects our directors, as well as our officers and employees, to act ethically at all times and to acknowledge their adherence to the policies comprising our Code of Ethical Conduct and Insider Trading Policy, which include, among other things, rules prohibiting loans or other extensions of credit, securities transactions during “blackout” periods, acceptance of gifts, and certain interested transactions. In addition, our Board of Directors has established a policy for reporting employee concerns to the Audit Committee of the Board of Directors. Anyone with a concern about our accounting, internal accounting controls, or auditing matters may confidentially report such concern by telephone to a special dedicated toll-free phone number. This policy was previously announced to all of our employees and the telephone number is published in our common-area workplaces. All such communications are confidential and shall be promptly reviewed by the Audit Committee.
Proxy Voting Policies and Procedures
We hold an immaterial amount of voting securities. Executive management, pursuant to no special policy or procedure, votes these proxies, when applicable, as part of their routine executive functions.
84
Table of Contents
EXECUTIVE COMPENSATION
Summary Compensation Table
The following table sets forth certain compensation information for (i) our Chief Executive Officer, (ii) our Chief Financial Officer, and (iii) each of our next three most highly compensated executive officers, collectively the NEOs, for the fiscal years ended December 31, 2012, December 31, 2011, and December 31, 2010. We do not have a pension plan, a stock award plan or a non-equity incentive compensation plan, but we have established a 401(k) Investment Plan that provides matching contributions.
| Name and Principal Position |
Year | Salary ($) |
Bonus ($) |
Restricted Stock Awards ($)(1) |
All Other Compensation ($) |
Total ($) |
||||||||||||||||||
| Alvin Murstein |
2012 | 818,850 | 495,000 | 695,000 | 106,541 | (2) | 2,115,391 | |||||||||||||||||
| Chairman, Chief Executive Officer and Director |
2011 | 795,000 | 450,000 | 149,996 | 74,469 | 1,469,465 | ||||||||||||||||||
| 2010 | 499,500 | — | — | 133,470 | 632,970 | |||||||||||||||||||
| Andrew M. Murstein |
2012 | 982,311 | 1,289,438 | 790,000 | 119,179 | (3) | 3,180,928 | |||||||||||||||||
| President and Director |
2011 | 953,700 | 1,121,250 | 149,996 | 127,494 | 2,352,440 | ||||||||||||||||||
| 2010 | 935,000 | 975,000 | — | 117,099 | 2,027,099 | |||||||||||||||||||
| Larry D. Hall |
2012 | 283,250 | 105,800 | 90,000 | 10,820 | (4) | 489,870 | |||||||||||||||||
| Senior Vice President, and Chief Financial Officer |
2011 | 275,000 | 92,000 | 14,997 | 10,034 | 392,031 | ||||||||||||||||||
| 2010 | 249,150 | 80,000 | — | — | 329,150 | |||||||||||||||||||
| Michael J. Kowalsky |
2012 | 301,688 | 155,043 | 60,000 | 16,559 | (5) | 533,290 | |||||||||||||||||
| Executive Vice President |
2011 | 292,901 | 144,900 | 12,001 | 16,032 | 465,834 | ||||||||||||||||||
| 2010 | 284,370 | 126,000 | — | 16,413 | 426,783 | |||||||||||||||||||
| John M. Taggart |
2012 | 221,330 | 230,000 | 254,998 | — | (6) | 706,328 | |||||||||||||||||
| Chief Executive Officer and President of Medallion Bank |
||||||||||||||||||||||||
| (1) | This amount is the aggregate grant date fair value of restricted stock awards with respect to the fiscal years ended December 31, 2012, December 31, 2011, and December 31, 2010 computed in accordance with FASB ASC Topic 718. See note 5 to the consolidated financial statements included in our Annual Report on Form 10-K for the fiscal year ended December 31, 2012 for all assumptions made in the valuation. |
| (2) | All other compensation for Alvin Murstein for the fiscal year ended December 31, 2012 includes $46,532 for a country club membership, our aggregate incremental costs attributable to a car lease, garage, car insurance, three social club memberships and term life insurance premiums paid by us for the benefit of Alvin Murstein and his spouse and amounts received pursuant to the matching program under our 401(k) Investment Plan. |
| (3) | All other annual compensation for Andrew M. Murstein for the fiscal year ended December 31, 2012 includes $64,516 for his pro-rated use of our driver, and our aggregate incremental costs attributable to a car lease, garage, car maintenance, car insurance, a country club membership, a social club membership and amounts received pursuant to the matching program under our 401(k) Investment Plan. |
| (4) | All other annual compensation for Larry D. Hall for the fiscal year ended December 31, 2012 includes amounts received as a monthly car allowance and amounts received pursuant to the matching program under our 401(k) Investment Plan. |
| (5) | All other annual compensation for Michael J. Kowalsky for the fiscal year ended December 31, 2012 includes our aggregate incremental cost attributable to a car lease and amounts received pursuant to the matching program under our 401(k) Investment Plan. |
| (6) | For the other NEOs, our aggregate incremental cost of all perquisites and other personal benefits provided to each such NEOs is less than $10,000. |
85
Table of Contents
2012 Grants of Plan-Based Awards
There were no stock options granted during the last fiscal year by us to the NEOs.
| Name |
Grant Date |
Restricted Stock Awards: Number of Shares (#)(1) |
Grant Date Fair Value of Restricted Stock Awards($)(2) |
|||||||||
| Alvin Murstein |
02/16/2012 | 27,076 | 300,000 | |||||||||
| 12/18/2012 | 33,221 | 395,000 | ||||||||||
| Andrew M. Murstein |
02/16/2012 | 27,076 | 300,000 | |||||||||
| 12/18/2012 | 41,211 | 490,000 | ||||||||||
| Larry D. Hall |
02/16/2012 | 3,610 | 40,000 | |||||||||
| 12/18/2012 | 4,205 | 50,000 | ||||||||||
| Michael J. Kowalsky |
02/16/2012 | 2,256 | 25,000 | |||||||||
| 12/18/2012 | 2,944 | 35,000 | ||||||||||
| John M. Taggart |
02/16/2012 | 9,476 | 104,999 | |||||||||
| 12/18/2012 | 12,616 | 149,999 | ||||||||||
| (1) | These shares of restricted Common Stock will vest in equal one-third increments on the first, second and third anniversaries of the date of grant. |
| (2) | This amount is the grant date fair value of the restricted stock awards computed in accordance with FASB ASC Topic 718. See note 5 to the consolidated financial statements included in our Annual Report on Form 10-K for the fiscal year ended December 31, 2012 for all assumptions made in the valuation. |
Outstanding Equity Awards at 2012 Fiscal Year-End
| Option Awards | Restricted Stock Awards | |||||||||||||||||||||||
| Name |
Number of Securities Underlying Unexercised Options (#) Exercisable |
Number of Securities Underlying Unexercised Options (#) Unexercisable |
Option Exercise Price ($) |
Option Expiration Date |
Number of Shares of Restricted Stock That Have Not Vested (#) |
Market Value of Shares of Restricted Stock That Have Not Vested ($) |
||||||||||||||||||
| Alvin Murstein |
25,000 | — | 9.07 | 09/17/2014 | 18,773 | (1) | 220,395 | |||||||||||||||||
| 75,000 | — | 9.22 | 04/03/2018 | 27,076 | (2) | 317,872 | ||||||||||||||||||
| 33,221 | (3) | 390,015 | ||||||||||||||||||||||
| Andrew M. Murstein |
25,000 | — | 9.07 | 09/17/2014 | 18,773 | (1) | 220,395 | |||||||||||||||||
| 95,000 | — | 9.22 | 04/03/2018 | 27,076 | (2) | 317,872 | ||||||||||||||||||
| 41,211 | (3) | 483,817 | ||||||||||||||||||||||
| Larry D. Hall |
17,000 | — | 3.50 | 03/04/2013 | 1,877 | (1) | 22,036 | |||||||||||||||||
| 30,000 | — | 9.22 | 04/03/2018 | 3,610 | (2) | 42,381 | ||||||||||||||||||
| 4,205 | (3) | 49,367 | ||||||||||||||||||||||
| Michael J. Kowalsky |
30,000 | — | 9.22 | 04/03/2018 | 1,502 | (1) | 17,633 | |||||||||||||||||
| 2,256 | (2) | 26,485 | ||||||||||||||||||||||
| 2,944 | (3) | 34,563 | ||||||||||||||||||||||
| John M. Taggart |
24,000 | — | 11.21 | 02/15/2017 | 6,258 | (1) | 73,469 | |||||||||||||||||
| 8,334 | 8,333 | (4) | 8.21 | 04/14/2020 | 9,476 | (2) | 111,248 | |||||||||||||||||
| 12,616 | (3) | 148,112 | ||||||||||||||||||||||
| (1) | These shares of restricted Common Stock will vest on February 18, 2014. |
| (2) | These shares of restricted Common Stock will vest in equal one-third increments on February 16, 2013, February 16, 2014 and February 16, 2015. |
86
Table of Contents
| (3) | These shares of restricted Common Stock will vest in equal one-third increments on December 18, 2013, December 18, 2014 and December 18, 2015. |
| (4) | These options were granted on April 4, 2010 and vested on April 14, 2013. |
2012 Option Exercises and Restricted Stock Vested
No shares of restricted stock vested for the NEOs during the last fiscal year. The following table sets forth certain information concerning stock options exercised by the NEOs during the last fiscal year:
| Option Awards | ||||||||
| Name |
Number of Shares Acquired on Exercise (#) |
Value Realized on Exercise ($) |
||||||
| Alvin Murstein |
— | — | ||||||
| Andrew M. Murstein |
172,000 | 1,117,170 | ||||||
| Larry D. Hall |
5,000 | 38,550 | ||||||
| Michael J. Kowalsky |
13,494 | 105,122 | ||||||
| John M. Taggart |
8,333 | 25,249 | ||||||
Potential Payments Upon Termination or Change-in-Control
The following table sets forth information regarding potential payments to be made to the NEOs following an employment termination or change of control. Amounts in the table assume an employment termination or change in control on December 31, 2012. The following table sets forth potential payments to be made to the NEOs following an employment termination or change of control if these restrictions were not in place.
| Name |
Termination Without Cause ($) |
Termination by Officer for Good Reason (Not Involving Change of Control) ($) |
Disability ($) |
Change of Control— Termination or Change in Employment ($) |
Change of Control— Employment Agreement Assumed By New Owner ($) |
Non-Renewal of Employment Agreement ($) |
||||||||||||||||||
| Alvin Murstein |
||||||||||||||||||||||||
| Severance |
6,340,838 | (1) | — | — | 6,340,838 | (1) | — | — | ||||||||||||||||
| Other Benefits |
— | — | — | — | — | — | ||||||||||||||||||
| Andrew M. Murstein |
||||||||||||||||||||||||
| Severance |
10,657,825 | (2) | — | — | 10,657,825 | (2) | — | — | ||||||||||||||||
| Other Benefits |
— | — | — | — | — | — | ||||||||||||||||||
| Larry D. Hall |
||||||||||||||||||||||||
| Severance |
112,500 | — | — | 112,500 | — | — | ||||||||||||||||||
| Other Benefits |
— | — | — | — | — | — | ||||||||||||||||||
| Michael J. Kowalsky |
||||||||||||||||||||||||
| Severance |
228,366 | (3) | 228,366 | (3) | 228,366 | (4) | 228,366 | (3) | 301,688 | (5) | 150,844 | (6) | ||||||||||||
| Other Benefits |
9,968 | (7) | 9,968 | (7) | 9,968 | (8) | 9,968 | (7) | — | 9,968 | (8) | |||||||||||||
| John M. Taggart |
||||||||||||||||||||||||
| Severance |
— | — | — | — | — | — | ||||||||||||||||||
| Other Benefits |
— | — | — | — | — | — | ||||||||||||||||||
| (1) | Alvin Murstein would be entitled to an amount equal to the remainder of the salary, bonus and value of the fringe benefits which he would be entitled to receive for the balance of his current employment period, |
87
Table of Contents
| which expires on May 29, 2017. The severance payment was calculated based on his salary and bonus for the fiscal year ended December 31, 2012, and the value of his fringe benefits as of December 31, 2012. The value of Alvin Murstein’s fringe benefits includes $79,966 for a car lease, $205,478 for a country club membership, $67,439 for health insurance, our aggregate incremental costs attributable to a garage, car insurance, three social club memberships, life insurance premiums paid by us for the benefit of Alvin Murstein and his spouse and amounts received pursuant to the matching program under our 401(k) Investment Plan. |
| (2) | Andrew M. Murstein would be entitled to an amount equal to the remainder of the salary, bonus and value of the fringe benefits which he would be entitled to receive for the balance of his current employment period, which expires on May 29, 2017. The severance payment was calculated based on his salary and bonus for the fiscal year ended December 31, 2012, and the value of his fringe benefits as of December 31, 2012. The value of Andrew M. Murstein’s fringe benefits includes $284,948 for his pro-rated use of our driver, $97,883 for health insurance, our aggregate incremental costs attributable to a car lease, a garage, car maintenance, car insurance, a country club membership, a social club membership and amounts received pursuant to the matching program under our 401(k) Investment Plan. |
| (3) | Michael J. Kowalsky would be entitled to an amount equal to his salary and bonus for the balance of his current employment period, which expires on June 30, 2013. The severance payment was calculated based on his salary and bonus for the fiscal year ended December 31, 2012, with annual 3% increases to his salary as set forth in his employment agreement. |
| (4) | Michael J. Kowalsky would be entitled to an amount equal to his salary and bonus for the six months following termination. The severance payment was calculated based on his salary and bonus for the fiscal year ended December 31, 2012. |
| (5) | Michael J. Kowalsky would be entitled to an amount equal to his salary for the twelve months following termination. The severance payment was calculated based on his salary for the fiscal year ended December 31, 2012. |
| (6) | Michael J. Kowalsky would be entitled to an amount equal to his salary for the six months following termination. The severance payment was calculated based on his salary and bonus for the fiscal year ended December 31, 2012. |
| (7) | Michael J. Kowalsky would be entitled to receive his health benefits and car lease for the balance of his current employment period. |
| (8) | Michael J. Kowalsky would be entitled to receive his health benefits and car lease for the six months following termination. |
DIRECTOR COMPENSATION
Non-employee directors are paid $39,655 for each year they serve, payable in quarterly installments, and receive $3,965 for each Board of Directors meeting per quarter attended, $3,965 for attendance at any additional Board of Directors meetings that quarter, $1,130 for each telephonic Board of Directors meeting, $1,700 for each Compensation Committee and Nominating and Governance Committee meeting attended, an additional $1,700 for the Chairperson of the Compensation Committee and Nominating and Governance Committee for each Compensation Committee and Nominating and Governance Committee meeting attended by such Chairperson, $3,400 for each Audit Committee meeting attended, an additional $2,265 for the Chairperson of the Audit Committee for each Audit Committee meeting attended by such Chairperson, $3,965 for each Executive Committee meeting attended, and are reimbursed for expenses relating thereto. Employee directors do not receive any additional compensation for their service on the Board of Directors. We do not provide any pension or retirement plan with respect to our non-employee directors.
Non-employee directors were eligible to participate in our First Amended and Restated 2006 Non-Employee Director Stock Option Plan. Our First Amended and Restated 2006 Non-Employee Director Stock Option Plan was approved by the Board of Directors on April 16, 2009, approved by our shareholders on June 5, 2009, and approved by the Commission on July 17, 2012. Under the First Amended and Restated 2006 Non-Employee
88
Table of Contents
Director Stock Option Plan, we grant an option to purchase 9,000 shares to each non-employee director elected at each annual shareholder meeting. If a non-employee director is elected by means other that an annual shareholder meeting, we automatically grant an option to purchase 9,000 shares multiplied by a fraction representing the remaining portion of such non-employee director’s three-year term. The exercise price of options granted is not less than the fair market value of our Common Stock on the date of grant, or if the stock is not quoted on the date of grant, the current net asset value of the Common Stock as determined in good faith by the members of the Board of Directors not eligible to participate in the 2006 Non-Employee Director Stock Option Plan. Options become exercisable in equal one-third increments on the first, second and third anniversaries of the date of grant. To exercise options, the optionee must remain a non-employee director. No option may be exercised more than ten years after the date on which it is granted.
Our employee directors are eligible to participate in our 401(k) Investment Plan and our 2006 Employee Stock Option Plan.
The following table sets forth certain compensation information for our non-employee directors for the fiscal year ended December 31, 2012.
| Name |
Fees Earned or Paid in Cash ($) |
Option Awards ($)(1) |
Total ($) | |||||||||
| Independent Directors |
||||||||||||
| Henry L. Aaron |
65,788 | — | 65,788 | |||||||||
| Henry D. Jackson |
74,138 | — | 74,138 | |||||||||
| Stanley Kreitman |
100,743 | — | 100,743 | |||||||||
| Frederick A. Menowitz |
79,188 | — | 79,188 | |||||||||
| Lowell P. Weicker, Jr. |
78,538 | — | 78,538 | |||||||||
| Interested Directors |
||||||||||||
| Mario M. Cuomo |
55,243 | — | 55,243 | |||||||||
| David L. Rudnick |
80,063 | — | 80,063 | |||||||||
| (1) | The following table sets forth each non-employee director’s outstanding option awards at fiscal year-end. |
| Name |
Outstanding Option Awards (#) |
|||
| Independent Directors |
||||
| Henry L. Aaron |
9,000 | |||
| Henry D. Jackson |
9,000 | |||
| Stanley Kreitman |
18,000 | |||
| Frederick A. Menowitz |
18,000 | |||
| David L. Rudnick |
12,000 | |||
| Lowell P. Weicker, Jr. |
14,000 | |||
| Interested Directors |
||||
| Mario M. Cuomo |
14,000 | |||
89
Table of Contents
Dollar Range of Equity Securities Beneficially Owned By the Directors
The following table sets forth the dollar range of our equity securities beneficially owned by each of our directors as of December 31, 2012. We are not part of a “family of investment companies,” as that term is defined in the 1940 Act.
| Name of Director |
Dollar Range of Equity in Our Securities(1) | |
| Independent Directors |
||
| Henry L. Aaron |
$10,001-$50,000 | |
| Henry D. Jackson |
$10,001-$50,000 | |
| Stanley Kreitman |
over $100,000 | |
| Frederick A. Menowitz |
over $100,000 | |
| David L. Rudnick |
over $100,000 | |
| Lowell P. Weicker, Jr. |
over $100,000 | |
| Interested Directors |
||
| Mario M. Cuomo |
$10,001-$50,000 | |
| Alvin Murstein |
over $100,000 | |
| Andrew M. Murstein |
over $100,000 | |
| (1) | Dollar ranges are as follows: none, $1-$10,000, $10,001-$50,000, $50,001-$100,000, or over $100,000. |
COMPENSATION DISCUSSION AND ANALYSIS
Overview of Compensation Program
The primary objective of our compensation program is to establish compensation levels which will enable us to attract, retain and reward executive officers who contribute to our long-term success, to tie annual and long-term cash and stock incentives to the achievement of measurable corporate, business unit and individual performance objectives, and to align executives’ incentives with shareholder value creation.
Our executive compensation philosophy is based on the belief that competitive compensation is essential to attract, motivate and retain highly qualified and industrious employees. Our policy is to provide total compensation packages that are competitive within our industry. The compensation program includes components designed both to motivate executives and to provide incentives to executives, as well as retain them. The primary components of our compensation program are base salary, cash bonus, restricted stock and stock options. Bonuses are paid to encourage effective performance relative to current plans and objectives. Restricted stock and stock options are granted to help retain productive executives and to more closely align their interests with those of shareholders. As a business development company, we are constrained by the 1940 Act in the number of outstanding securities we may issue pursuant to all of our compensation plans. Accordingly, our Compensation Committee takes into account the number of restricted stock and options already outstanding when determining whether to make additional grants. In addition, the Compensation Committee takes into account the number of restricted stock and options available for future grants under the plan to ensure sufficient availability for future needs.
In implementing our compensation policy, we seek to tie compensation to our financial performance and business objectives, reward high levels of individual performance and base a significant portion of total executive compensation on both our annual and long-term performance. While compensation survey data are useful guides for comparative purposes, we believe that a successful compensation program also requires the application of judgment and subjective determinations of individual performance, and to that extent our Compensation Committee applies such judgment and subjective determinations in reconciling the program’s objectives with the realities of retaining valued employees.
90
Table of Contents
Executive Compensation Program
The Compensation Committee is responsible for determining the compensation of our NEOs and our directors. The full Board of Directors typically ratifies the Compensation Committee’s annual determination of NEO compensation.
Our President and Chief Financial Officer, with the assistance of our human resources department, compile and provide information, make recommendations for the Compensation Committee’s consideration and assist in the management and administration of our executive and other benefit plans. Their responsibilities may include, but are not limited to, the following:
| • | Recommending pay levels and equity grants and incentive awards for our officers; |
| • | Recommending changes to ensure that our compensation programs remain competitive and aligned with our objectives; and |
| • | Providing information to the Compensation Committee, including but not limited to, information concerning (1) company and individual performance, (2) the attainment of our strategic objectives, (3) the common stock ownership of each executive and his option and restricted stock holdings, (4) equity compensation plan dilution, and (5) peer group compensation and performance data. |
Our executive officers may attend the meetings of the Compensation Committee, at its request. A portion of each of the Compensation Committee meetings held during 2012 was an executive session during which none of our executive officers was present.
We do not have a specific formula that dictates the overall weighting of each compensation element as a part of the total. Instead, the Compensation Committee makes individual compensation decisions which it believes reflects each individual’s contribution to the company.
Peer Group
At the Compensation Committee’s request, Meridian completed its most recent peer group-based compensation assessment in late 2008. This assessment compared the compensation arrangements and levels for our Chief Executive Officer, President, and Chief Financial Officer and compared them to the compensation arrangements and levels for similar positions at a group of peer companies.
The peer group consisted of the following 12 companies, which are similar in size, industry, and location to us and have similar talent needs:
| American River Bankshares | Center Bancorp Inc. | Newstar Financial Inc. | ||
| Canandaigua National Corp. | First of Long Island Corp. | PS Business Parks | ||
| Capital City Bank Group, Inc. | Marlin Business Services Inc. | Sterling Bancorp | ||
| Caplease Inc. | MCG Capital Corp. | Willis Lease Finance Corp. |
The peer group was approved by the Compensation Committee and represents companies (a) in the specialized finance, real estate investment and commercial banking industries; (b) with median assets of $1.05 billion; and (c) with corporate functions in higher cost areas (e.g., the New York City metropolitan area and California). Meridian relied on market data from the 2008 proxy statements, updated with any compensation adjustments from Form 4 and 8-K disclosures. The pay levels of our Chief Executive Officer, President, and Chief Financial Officer were compared to the peer group market median and 75th percentile levels. Meridian assessed the following compensation elements: base salary, actual annual incentives, actual total cash compensation (base salary plus actual bonus), annualized value of long-term incentives, actual all other compensation and actual total compensation (sum of base salary, actual bonus, annualized long-term incentive value, and all other compensation).
91
Table of Contents
While the Compensation Committee compared executive pay levels with the peer group market median and 75th percentile levels, it did not benchmark pay for our executives to any specific market pay level. The Compensation Committee considered such data in addition to individual and company performance and internal equity when making decisions regarding annual incentive awards.
Since Meridian’s most recent peer group-based compensation assessment in late 2008, we and the Compensation Committee have continued to compare our executive pay levels with those of the peer group on a periodic basis.
Impact of Prior Say on Pay Vote on Compensation Decisions
We were required by Section 14A of the Exchange Act to permit our shareholders to vote on a non-binding advisory resolution regarding the compensation of the NEOs for the 2012 Annual Meeting of Shareholders. A majority of the votes cast approved that resolution. We, the Board of Directors and the Compensation Committee pay careful attention to communication received from shareholders regarding executive compensation, including the non-binding advisory vote. We believe the 2012 shareholder vote supports the work of the Compensation Committee and that our executive compensation programs are aligned with shareholders’ interests.
Base Salary
We provide our NEOs with base salary as a base level of compensation to compensate them for general services rendered during the fiscal year. Base salary ranges for NEOs are determined for each executive based on each NEO’s position and duties.
Increases in annual base salary are based on a review and evaluation of an NEO’s job performance, the impact of such performance on us and the skills and experience required for the job, coupled with a comparison of these elements against those for similarly positioned executives both inside and outside our organization conducted by our President and reviewed by the Compensation Committee. Salary levels are typically determined annually as part of our performance review process as well as upon a promotion or other significant change in job responsibility. In 2012 each of our NEOs received an increase in base salary as reported in the Summary Compensation Table. These decisions were made by the Compensation Committee at its February 2012 meeting and communicated to each NEO shortly thereafter.
Bonus
The Compensation Committee has the authority to award discretionary annual or periodic bonuses to our NEOs. The annual bonuses are intended to compensate NEOs for achieving financial and operational goals and for achieving individual annual performance objectives. These objectives vary depending on the individual executive, but relate generally to strategic factors such as borrowers financed or retained, new investment opportunities identified and completed and to financial factors such as raising capital, improving our results of operations and increasing the price per share of our common stock. We do not maintain formal targets or goals. Rather, the Compensation Committee typically reviews a variety of different factors applicable to us which may change in accordance with the changing nature of our business. Alvin Murstein’s 2012 bonus was $495,000, which was attributed in part to the overall performance of our taxi medallion loan portfolio in 2012. Andrew Murstein’s 2012 bonus was $1,289,438, which was attributed in part to the overall performance of our taxi medallion loan portfolio in 2012. Larry D. Hall’s 2012 bonus was $105,800, which was attributed in part to the overall performance of our taxi medallion loan portfolio in 2012 and his overall management of the public company in 2012. Michael J. Kowalsky’s 2012 bonus was $155,043, which was attributed in part to the overall performance of our taxi medallion loan portfolio in 2012. John M. Taggart’s 2012 bonus was $230,000, which was attributed in part to the overall performance of Medallion Bank’s consumer loan portfolio in 2012 and his overall management of Medallion Bank in 2012.
92
Table of Contents
Our discretionary annual bonus is paid in cash in an amount reviewed and approved by the Compensation Committee and ordinarily is paid in a single installment in either the fourth quarter of a given fiscal year or the first quarter following the completion of a given fiscal year. The Compensation Committee, however, has the discretion to declare a bonus more frequently than on an annual basis and may do so in recognition of exceptional contributions to us at other times.
Long-Term Incentive Compensation
Under the 1940 Act, the number of restricted stock, warrants, options or rights to subscribe or convert to our voting securities we may issue is limited. We are also limited under the 1940 Act to the types of securities we may issue. Accordingly, our long-term incentive compensation program is limited to the issuance of restricted stock and stock options and is generally constrained in scope and nature by the parameters set forth in the 1940 Act.
Nonetheless, we believe that long-term performance is achieved through granting restricted stock and stock options, which creates an ownership culture that encourages long-term performance by our NEOs. Our restricted stock and stock option plans (discussed below) have been established to provide certain of our employees, including our NEOs, with incentives (i) to highlight and reinforce the mutuality of long-term interests between employees and shareholders and (ii) to assist in the attraction and retention of critically important key executives, managers and individual contributors who are essential to our growth and development. The Compensation Committee believes that the use of restricted stock and stock options is important achieving our compensation goals, however, the 1940 Act limits the number of restricted stock and stock options the Company is permitted to issue which impairs our ability to use restricted stock and stock options to achieve such goals. We have not adopted formal stock ownership guidelines, and our restricted stock and stock option plans have provided the principal method for our NEOs to acquire equity in our company.
We have two stock option plans: the Amended and Restated 1996 Employee Stock Option Plan and the 2006 Employee Stock Option Plan (together, the Plans). The Amended and Restated 1996 Employee Stock Option Plan expired on May 21, 2006, but stock options remain outstanding under it. The Plans include vesting periods to optimize the retention value of options and to provide an incentive to our NEOs to achieve success over the long term. Generally, stock options vest in equal annual installments over three to five years commencing on the first anniversary of the date of grant, and if employees leave us before these vesting periods, they forfeit the unvested portions of these awards. The vesting schedules chosen are dependent on the NEO, the rationale behind such option grant, the number of options granted and the exercise price of such options.
The number of shares of Common Stock subject to option grants is generally intended to reflect the significance of an NEO’s current and anticipated contributions to us. Pursuant to the 1940 Act, the per-share exercise price of options granted by us cannot be less than 100% of the fair market value per share on the date of grant. Grants of stock options, if made, are generally granted on the date of the Compensation Committee or Board of Directors meeting held during the first quarter of each year. Grants, however, may be made by the Compensation Committee at other times. The options have value only to the extent that the current stock price is greater than the price at the time of the option grant, which directly links the interest of the NEOs with those of our shareholders. The decision to exercise an option in any particular year is primarily determined by each individual within the limits of the vesting schedule and not by our Board of Directors. As a business development company, we are constrained by the 1940 Act in the number of outstanding securities we may issue pursuant to all of our compensation plans. Accordingly, our Compensation Committee takes into account the number of options already outstanding when determining whether to make additional grants. In addition, the Compensation Committee takes into account the number of options available for future grant under the plan to ensure sufficient availability for future needs. No option grants were made to the NEOs in 2012 in light of these considerations.
The 2009 Employee Restricted Stock Plan, or the 2009 Employee Plan, was adopted by our Board of Directors on April 16, 2009, approved by the Commission on April 26, 2010, and approved by our shareholders on
93
Table of Contents
June 11, 2010. The terms of the 2009 Employee Plan provide for grants of restricted stock awards to our employees and any person who has been offered employment by us; provided, that such prospective employee may not receive any payment relating to a restricted stock award until such person has commenced employment with us. The Compensation Committee is authorized to grant restricted stock awards. A grant of restricted stock is a grant of shares of our common stock that, at the time of issuance, are subject to certain forfeiture provisions, and thus are restricted as to transferability until such forfeiture restrictions have lapsed. The restrictions on the restricted stock issued pursuant to the 2009 Employee Plan may relate to continued service to us, the achievement of specified performance objectives, or other restrictions deemed by the Compensation Committee from time to time to be appropriate and in our best interests and in the interests of our shareholders. Restricted stock awards made to the NEOs in 2012 are set forth in the column titled “Restricted Stock Awards” in 2012 Grants of Plan-Based Awards.
401(k) Plan
Since 1996, we have maintained our 401(k) Investment Plan which covers all our full- and part-time employees who have attained the age of 21 and have a minimum of one year of service. Under the 401(k) Investment Plan, an employee may elect to defer not less than 1.0% of his or her total annual compensation, up to the applicable limits set forth in the Internal Revenue Code. Employee contributions are invested in various mutual funds, according to the direction of the employee. We match employee annual contributions to the 401(k) Investment Plan in an amount equal to one-third of the first 6% of an employee’s annual contributions.
Employment Agreements and Offer Letters
We will enter into a new employment agreement with an executive officer or a candidate only when necessary to attract or retain exceptional personnel. Any employment agreement with an executive officer (a) must be approved by the Compensation Committee; (b) should have as short a term as possible and provide as few terms and conditions as are necessary to accomplish its purpose; and (c) if required by law to be available for public review, must be filed promptly with the appropriate regulatory authority.
In May 1996, Alvin Murstein, our Chairman and Chief Executive Officer, and Andrew M. Murstein, our President, entered into employment agreements with us, which were subsequently amended and restated in May 1998. The agreements provide for a five-year term and automatically renew each year for a new five-year term unless either party terminates the agreement. The agreements provide that Alvin Murstein and Andrew M. Murstein shall receive a minimum annual base salary of $300,000 and $225,000 respectively, which may be increased by the Compensation Committee. The agreements also subject Messrs. Murstein to non-competition obligations. The agreements provide for a severance payment in the event that we terminate their employment without Cause (as defined in the agreements) or if they terminate their employment for Good Reason (as defined in the agreements). The severance payment is equal to their base salary multiplied by the number of full and partial years remaining in the term of employment at the time of termination plus legal fees and/or acceleration of vesting of any unvested options. Consistent with competitive practice, the agreements provide that if payments made to Messrs. Murstein are subject to an excise tax as excess parachute payments by the Internal Revenue Code, we will gross up the compensation to fully offset the excise taxes. However, if the payment does not exceed the excise tax threshold by more than 10%, we will reduce the payment so that no portion of the payment is subject to excise tax and no gross-up would be made. We believe that this is a best practice relating to gross-up provisions in change-in-control arrangements.
Michael J. Kowalsky, our Executive Vice President, is a party to an employment agreement with us which provides for a one-year term and automatically renews each year for a new one-year term unless terminated by either party. Under the agreement, Mr. Kowalsky is entitled to an annual base salary of $245,300, annual increases at a rate no less than 3% of his then-existing base salary and a minimum bonus of $37,000. The agreement provides for a severance payment if the agreement is not renewed under certain conditions, and also a non-competition covenant.
94
Table of Contents
John M. Taggart, the Chief Executive Officer and President of Medallion Bank, is a party to an employment agreement with us, which became effective in April 2002 and has no termination date. Under the agreement, Mr. Taggart is entitled to an annual base salary of $150,000. The agreement also subjects Mr. Taggart to non-competition obligations.
Larry D. Hall, our Chief Financial Officer, entered into an agreement with us, which became effective in March 2003 and has no termination date. Mr. Hall is entitled to an annual base salary of $182,000. Mr. Hall is entitled to a severance payment of $112,500 if we terminate his employment without Cause (as defined in the agreement) or upon a change of control if his employment is discontinued in connection therewith.
Our Board of Directors determined that providing the modest change of control arrangements described above appropriately reflects the risk imposed on executives that a company such as ours might be acquired. These arrangements are intended to attract and retain qualified executives with employment alternatives that may appear to them to be less risky absent these arrangements, and to mitigate a potential disincentive to authorize such an acquisition, particularly where the services of these executive officers may not be required by the acquirer. For quantification of these severance and change of control benefits, please see the discussion under “Executive Compensation—Potential Payments Upon Termination or Change-in-Control” below.
Our Compensation Committee authorized the various change in control and severance provisions in recognition of the importance to us and our shareholders of assuring that we have the continued dedication and full attention of certain key employees prior to and after the consummation of a change in control event. In addition to the foregoing, the provisions are intended to ensure that, if a possible change in control should arise and a NEO should be involved in deliberations or negotiations in connection with the possible change in control, such officer would be in a position to consider as objectively as possible whether the possible change in control transaction is in our best interests and those of our shareholders, without concern for his position or financial well-being. Absent termination without cause or for good reason, or a change of control event, no NEO is entitled to either equity vesting acceleration or cash severance payments upon termination of employment.
Pursuant to either an employment agreement or an offer letter, each officer is generally eligible for a discretionary bonus in excess of a minimum amount. However, the Compensation Committee may increase the discretionary annual bonus paid to our executive officers, and the discretionary bonus paid to each officer in 2012 for performance in 2012 generally exceeded minimum specified amounts. The actual amount of any discretionary bonus will be determined following a review of each executive’s individual performance and contribution to our strategic goals. The Compensation Committee has not fixed a maximum payout for any officers’ annual discretionary bonus.
Perquisites
We provide NEOs with perquisites and other personal benefits that we and the Compensation Committee believe are reasonable and consistent with our overall compensation program to better enable us to attract and retain superior employees for key positions. The Compensation Committee periodically reviews the levels of perquisites and other personal benefits provided to NEOs.
All of our NEOs except for Mr. Taggart are provided with a monthly car allowance, which allows such NEOs to visit clients. In addition, we provide Mr. Alvin Murstein with a country club membership, three social club memberships, term life insurance and incidental costs related to his automobile such as parking and car insurance. We provide Mr. Andrew Murstein with a country club membership, a social club membership, incidental costs related to his automobile such as parking and car insurance and pay for his pro-rated use of our driver. The additional perquisites provided for Messrs. Murstein reflect their additional seniority and contributions to our overall organization. Attributed costs of the personal benefits for the NEOs for the fiscal year ended December 31, 2012 are included in the column titled “All Other Compensation” of the Summary Compensation Table.
95
Table of Contents
Other Benefits
NEOs are eligible to participate in all of our employee benefit plans, such as medical, dental, vision, group life, disability, and accidental death and dismemberment insurance, as well as our 401(k) Investment Plan, in each case on the same basis as other employees.
Impact of Tax and Accounting Treatment
Section 162(m) of the Internal Revenue Code generally disallows a tax deduction to public companies for compensation over $1 million paid to its chief executive officer or any of its four other most highly compensated executive officers. However, qualifying performance-based compensation will not be subject to the deduction limit if certain requirements are met. Our policy is to maximize the deductibility of compensation but does not preclude awards or payments that are not fully deductible if, in our judgment, such awards and payments are necessary to achieve our compensation objectives and to protect shareholder interests.
With our adoption of FASB Accounting Standard Codification Topic 718, “Compensation—Stock Compensation”, or ASC 718, which requires the recognition of compensation expense for stock options and restricted stock, we do not expect the accounting treatment of differing forms of equity awards to vary significantly. Accordingly, our adoption of ASC 718 is not expected to have a material effect on our selection of forms of equity compensation to be granted to our NEOs in the foreseeable future.
COMPENSATION COMMITTEE REPORT
The Compensation Committee has reviewed and discussed the Compensation Discussion and Analysis required by Item 402(b) of Regulation S-K with management and, based on such review and discussions, the Compensation Committee recommended to the Board of Directors that the Compensation Discussion and Analysis be included in its 2013 proxy statement.
THE COMPENSATION COMMITTEE
Lowell P. Weicker, Jr., Chairman
Henry L. Aaron
Federick A. Menowitz
Shareholder Communications with the Board of Directors
Shareholders may communicate with our Board of Directors through our Secretary by writing to the following address: Board of Directors, c/o Secretary, Medallion Financial Corp., 437 Madison Avenue, 38th Floor, New York, New York, 10022. Our Secretary will forward all correspondence to the Board of Directors, except for junk mail, mass mailings, loan complaints or inquiries, job inquiries, surveys, business solicitations or advertisements, or patently offensive or otherwise inappropriate material. Our Secretary may forward certain correspondence, such as loan-related inquiries, elsewhere within Medallion Financial Corp. for review and possible response.
96
Table of Contents
CONTROL PERSONS AND PRINCIPAL SHAREHOLDERS
As of September 19, 2013, there were no persons that owned 25% or more of our outstanding voting securities, and no person would be deemed to control us, as such term is defined in the 1940 Act.
The following table sets forth information, as of September 19, 2013, regarding the ownership of our common stock by (i) the persons known by us to own more than five percent of the outstanding shares, (ii) all of our directors and nominees, (iii) each of our executive officers named in the Summary Compensation Table, and (iv) all of our directors and executive officers as a group. The number of shares beneficially owned by each director or executive officer is determined under rules of the SEC and the information is not necessarily indicative of beneficial ownership for any other purpose. Under such rules, beneficial ownership includes any shares as to which the individual has the sole or shared voting power or investment power and also any shares which the individual has the right to acquire within 60 days of September 19, 2013 through the exercise of any stock option or other right. Unless otherwise indicated, each person has sole investment and voting power (or shares such power with his or her spouse) with respect to the shares set forth in the following table. The inclusion herein of any shares deemed beneficially owned does not constitute an admission of beneficial ownership of such shares.
| Name and Address |
Shares of Common Stock Beneficially Owned |
Percentage of Common Stock Beneficially Owned(1) |
||||||
| Alvin Murstein(2) |
1,540,030 | 6.96 | % | |||||
| Chairman, Chief Executive Officer, and Director c/o Medallion Financial Corp. 437 Madison Avenue, 38th Floor New York, NY 10022 |
||||||||
| Andrew M. Murstein(3) |
1,661,123 | 7.50 | % | |||||
| President and Director c/o Medallion Financial Corp. 437 Madison Avenue, 38th Floor New York, NY 10022 |
||||||||
| Larry D. Hall(4) |
56,692 | * | ||||||
| Senior Vice President and Chief Financial Officer c/o Medallion Financial Corp. 437 Madison Avenue, 38th Floor New York, NY 10022 |
||||||||
| Michael J. Kowalsky(5) |
58,693 | * | ||||||
| Executive Vice President c/o Medallion Financial Corp. 437 Madison Avenue, 38th Floor New York, NY 10022 |
||||||||
| John M. Taggart(6) |
97,260 | * | ||||||
| Chief Executive Officer and President of Medallion Bank c/o Medallion Financial Corp. 437 Madison Avenue, 38th Floor New York, NY 10022 |
||||||||
97
Table of Contents
| Name and Address |
Shares of Common Stock Beneficially Owned |
Percentage of Common Stock Beneficially Owned(1) |
||||||
| Henry L. Aaron(7) |
9,000 | * | ||||||
| Director c/o Medallion Financial Corp. 437 Madison Avenue, 38th Floor New York, NY 10022 |
||||||||
| Mario M. Cuomo(8) |
14,000 | * | ||||||
| Director c/o Medallion Financial Corp. 437 Madison Avenue, 38th Floor New York, NY 10022 |
||||||||
| Henry D. Jackson |
0 | 0 | % | |||||
| Director c/o Medallion Financial Corp. 437 Madison Avenue, 38th Floor New York, NY 10022 |
||||||||
| Stanley Kreitman(9) |
28,000 | * | ||||||
| Director c/o Medallion Financial Corp. 437 Madison Avenue, 38th Floor New York, NY 10022 |
||||||||
| Frederick A. Menowitz(10) |
26,500 | * | ||||||
| Director c/o Medallion Financial Corp. 437 Madison Avenue, 38th Floor New York, NY 10022 |
||||||||
| David L. Rudnick(11) |
22,424 | * | ||||||
| Director c/o Medallion Financial Corp. 437 Madison Avenue, 38th Floor New York, NY 10022 |
||||||||
| Lowell P. Weicker, Jr.(12) |
32,450 | * | ||||||
| Director c/o Medallion Financial Corp. 437 Madison Avenue, 38th Floor New York, NY 10022 |
||||||||
| All executive officers and directors as a group (15 persons)(13) |
3,617,521 | 16.12 | % | |||||
| BlackRock, Inc.(14) |
1,289,485 | 5.85 | % | |||||
| 40 East 52nd Street New York, NY 10022 |
||||||||
| Dimensional Fund Advisors LP(15) |
1,259,582 | 5.72 | % | |||||
| Palisades West, Building One 6300 Bee Cave Road Austin, TX 78746 |
||||||||
| * | Less than 1.0% |
98
Table of Contents
| (1) | Applicable percentage of ownership is based on 22,036,423 shares of Common Stock outstanding as of September 19, 2013 together with the exercisable options for such shareholder or group of shareholders, as applicable. In computing the number of shares of Common Stock beneficially owned by a person and the percentage ownership of that person, shares subject to options are not deemed outstanding for purposes of computing the percentage ownership of any other person. |
| (2) | Includes 1,238,300 shares of Common Stock owned by the Alvin Murstein Second Family Trust of which Alvin Murstein is a trustee and beneficiary, 9,025 shares of Common Stock owned by Alvin Murstein directly, 117,660 shares of Common Stock owned by the Aileen J. Murstein Family 2012 Trust of which Mr. Murstein is the grantor and Mr. Murstein’s spouse is a co-trustee and the beneficiary, 5,000 shares of Common Stock owned by Alvin Murstein’s spouse, 70,045 shares of restricted Common Stock owned by Alvin Murstein directly and 100,000 shares of Common Stock issuable upon the exercise of options. |
| (3) | Includes 1,446,063 shares owned by the Andrew Murstein Family Trust, of which Andrew M. Murstein is a trustee and beneficiary, 17,025 shares held by Andrew M. Murstein directly, 78,035 shares of restricted Common Stock owned by Andrew M. Murstein directly and 167,000 shares of Common Stock issuable upon the exercise of options. |
| (4) | Includes 18,203 shares of Common Stock owned by Larry D. Hall directly, 8,489 shares of restricted Common Stock owned by Larry D. Hall directly and 30,000 shares of Common Stock issuable upon the exercise of options. |
| (5) | Includes 27,074 shares of Common Stock owned by Michael J. Kowalsky directly, 3,670 shares of Common Stock held by Fidelity Investments in an Individual Retirement Account for the benefit of Michael J. Kowalsky, 5,949 shares of restricted Common Stock owned by Michael J. Kowalsky directly and 22,000 shares of Common Stock issuable upon the exercise of options. |
| (6) | Includes 51,735 shares of Common Stock owned by John M. Taggart directly, 25,191 shares of restricted Common Stock owned by John M. Taggart directly and 20,334 shares issuable upon the exercise of options. |
| (7) | Consists of 9,000 shares of Common Stock issuable upon the exercise of options. |
| (8) | Consists of 14,000 shares of Common Stock issuable upon the exercise of options. Does not include 9,000 shares of Common Stock issuable upon the exercise of options not exercisable within 60 days of September 19, 2013. |
| (9) | Includes 10,000 shares of Common Stock owned by Stanley Kreitman directly and 18,000 shares of Common Stock issuable upon the exercise of options. |
| (10) | Includes 15,500 shares of Common Stock owned by Frederick A. Menowitz directly and 11,000 shares of Common Stock issuable upon the exercise of options. |
| (11) | Includes 10,424 shares of Common Stock owned by David L. Rudnick directly and 12,000 shares of Common Stock issuable upon the exercise of options. |
| (12) | Includes 7,600 shares of Common Stock owned by Lowell P. Weicker, Jr. directly, 8,250 shares of Common Stock owned by the Lowell P. Weicker Estate for Lowell P. Weicker, Jr. of which Mr. Weicker is the income beneficiary, 2,300 shares of Common Stock held by Bank of New York Mellon Wealth Management in an Individual Retirement Account for the benefit of Lowell P. Weicker, Jr.’s spouse, 300 shares of Common Stock owned by Lowell P. Weicker, Jr.’s spouse and 14,000 shares of Common Stock issuable upon the exercise of options. Does not include 9,000 shares of Common Stock issuable upon the exercise of options not exercisable within 60 days of September 19, 2013. |
| (13) | Consists of 405,334 shares of Common Stock issuable upon the exercise of options. Does not include 18,000 shares of Common Stock issuable upon the exercise of options not exercisable within 60 days of September 19, 2013. |
| (14) | Based upon a Schedule 13G filed with the Commission on February 5, 2013 by BlackRock, Inc., or BlackRock. In the Schedule 13G, BlackRock reported that it has sole voting power with respect to 1,289,485 shares of Common Stock and sole dispositive power with respect to 1,289,485 shares of Common Stock. |
| (15) | Based upon a Schedule 13G filed with the Commission on February 11, 2013 by Dimensional Fund Advisors LP, or Dimensional. In the Schedule 13G, Dimensional reported that it has sole voting power with respect to 1,231,967 shares and sole dispositive power with respect to 1,259,582 shares. Dimensional reports that all securities reported in the Schedule 13G are owned by advisory clients of Dimensional. Dimensional disclaims beneficial ownership of such securities. |
99
Table of Contents
CERTAIN RELATIONSHIPS AND RELATED PARTY TRANSACTIONS
Mario M. Cuomo is our director and is of counsel in the law firm of Willkie Farr & Gallagher LLP, which serves as our legal counsel in connection with various matters. We have paid Willkie Farr & Gallagher LLP approximately $386,000 in legal fees for the fiscal year ended December 31, 2012. Mr. Cuomo does not have a direct interest in the payment of such legal fees, but has an indirect interest in such fees as an employee of the law firm.
Jeffrey Rudnick, the son of our director, David Rudnick, is an officer of LAX Group, LLC, or LAX, one of our portfolio companies. Mr. Rudnick receives a salary from LAX of $160,000 per year, and certain equity from LAX consisting of 10% ownership in LAX Class B stock, vesting at 3.34% per year; 5% of any new equity raised from outside investors at a valuation of $1.5 million or higher; and 10% of LAX’s profits as a year end bonus. In addition, Mr. Rudnick provides consulting services to us directly for a monthly retainer of $4,200.
Certain of our directors, officers and shareholders are also directors or director nominees of our wholly owned subsidiaries and controlled portfolio companies, including Medallion Funding LLC, Medallion Capital, Inc., Freshstart Venture Capital Corp. and Medallion Bank. Officer salaries are set by our Board of Directors.
Section 57 of the 1940 Act prohibits some transactions with affiliates described therein without exemptive relief from the SEC and other transactions with affiliates described therein without a required majority of directors. A required majority means both majority approval of directors who have no financial interest in the transaction, plan or arrangement and a majority of directors who are not interested persons. In addition, Section 404 of Regulation S-K requires us to disclose certain other related party transactions. Sections 23A and 23B and Regulation W place certain restrictions on the transactions that Medallion Bank may conduct with its affiliates. SBA Regulation Section 107.730 requires that our SBIC subsidiaries cannot enter into certain transactions without the SBA’s prior written approval. SBA Regulation Section 107.885 requires that Freshstart and Medallion Capital cannot dispose of assets to an affiliate without the SBA’s prior written approval. The SBA has also required that Medallion Capital obtain the SBA’s prior written approval for purchases of portfolio securities from an affiliated entity. In addition, as a condition to exemptive relief that we received from the SEC in May 1996, we and our SBIC subsidiaries are required to obtain the SBA’s prior written approval for purchases and sales of portfolio securities between each other and for us to acquire the securities of our SBIC subsidiaries. Our Board of Directors also recognizes that transactions with affiliates and other related party transactions present a heightened risk of conflicts of interest and/or improper valuation (or the perception thereof). Therefore, we maintain a Related and Affiliated Party Transactions Policy (codified as a written policy and adopted by the Board of Directors on February 13, 2008 and amended on February 9, 2010) that requires management to ensure no transactions with affiliates or related party transactions occur unless the Board of Directors has been briefed on the transaction and has approved the proposed transaction by the required majority. The Board of Directors may, in its sole discretion, approve or deny any transactions with affiliates or related party transactions and approval may be conditioned upon any other actions the Board of Directors deems appropriate. Failure to follow the approval process can lead to disciplinary action including termination.
100
Table of Contents
Pursuant to our Dividend Reinvestment Plan, a shareholder whose shares are registered in his or her own name can have all distributions reinvested in additional shares of common stock by American Stock Transfer, or the Plan Agent, if the shareholder enrolls in the Dividend Reinvestment Plan by delivering an Authorization Form to the Plan Agent prior to the corresponding dividend declaration date. The Plan Agent will effect purchases of common stock under the Dividend Reinvestment Plan in the open market. Holders of common stock who do not elect to participate in the Dividend Reinvestment Plan will receive all distributions in cash paid by check mailed directly to the shareholder of record (or if the common stock is held in street or other nominee name, then to the nominee) as of the relevant record date, by the Plan Agent, as dividend disbursing agent. Shareholders whose shares are held in the name of a broker or nominee, or shareholders transferring such an account to a new broker or nominee, should contact the broker or nominee to determine whether and how they may participate in the Dividend Reinvestment Plan.
The Plan Agent serves as agent for the holders of common stock in administering the Dividend Reinvestment Plan. After we declare a dividend, the Plan Agent will, as agent for the participants, receive the cash payment and use it to buy common stock on NASDAQ or elsewhere for the participants’ accounts. The price of the shares will be the average market price at which such shares were purchased by the Plan Agent.
Participants in the Dividend Reinvestment Plan may withdraw from the Dividend Reinvestment Plan upon written notice to the Plan Agent. Such withdrawal will be effective immediately if received not less than ten days prior to a dividend record date; otherwise, it will be effective the day after the related dividend distribution date. When a participant withdraws from the Dividend Reinvestment Plan or upon termination of the Dividend Reinvestment Plan as provided below, certificates for whole shares of common stock credited to his or her account under the Dividend Reinvestment Plan will be issued and a cash payment will be made for any fractional share of common stock credited to such account.
The Plan Agent will maintain each participant’s account in the Dividend Reinvestment Plan and will furnish monthly written confirmations of all transactions in such account, including information needed by the shareholder for personal and tax records. Common stock in the account of each Dividend Reinvestment Plan participant will be held by the Plan Agent in non-certificate form in the name of such participant. Proxy materials relating to our stockholders’ meetings will include those shares purchased as well as shares held pursuant to the Dividend Reinvestment Plan.
In the case of participants whose beneficially owned shares are held in the name of banks, brokers, or other nominees, the Plan Agent will administer the Dividend Reinvestment Plan on the basis of the number of shares of common stock certified from time to time by the record holders as the amount held for the account of such beneficial owners. Shares of common stock may be purchased by the Plan Agent through any of the Underwriters, acting as broker or, after the completion of this offering, from a dealer.
The Plan Agent’s fees for the handling or reinvestment of dividends and other distributions will be paid by us. Each participant will pay a pro rata share of brokerage commissions incurred with respect to the Plan Agent’s open market purchases in connection with the reinvestment of distributions. There are no other charges to participants for reinvesting distributions.
Distributions are taxable whether paid in cash or reinvested in additional shares, and the reinvestment of distributions pursuant to the Dividend Reinvestment Plan will not relieve participants of any U.S. federal income tax or state income tax that may be payable or required to be withheld on such distributions. See “Material U.S. Federal Income Tax Considerations.”
101
Table of Contents
Experience under the Dividend Reinvestment Plan may indicate that changes are desirable. Accordingly, we reserve the right to amend or terminate the Reinvestment Plan as applied to any distribution paid subsequent to written notice of the change sent to all of our shareholders at least 90 days before the record date for such distribution.
The Dividend Reinvestment Plan also may be amended or terminated by the Plan Agent by at least 90 days’ written notice to all our shareholders. All correspondence concerning the Dividend Reinvestment Plan should be directed to, and additional information can be obtained from, the Plan Agent at 6201 15th Avenue, Brooklyn, New York 11219.
102
Table of Contents
MATERIAL U.S. FEDERAL INCOME TAX CONSIDERATIONS
The following discussion is a general summary of the material U.S. federal income tax considerations applicable to us and to an investment in shares of our common stock. This summary does not purport to be a complete description of the income tax considerations applicable to such an investment. For example, we have not described tax consequences that we assume to be generally known by investors or certain considerations that may be relevant to certain types of holders subject to special treatment under U.S. federal income tax laws, including shareholders subject to the alternative minimum tax, tax-exempt organizations, insurance companies, dealers in securities, pension plans and trusts, and financial institutions. This summary assumes that investors hold our common stock as capital assets (within the meaning of the Code). The discussion is based upon the Code, Treasury regulations, and administrative and judicial interpretations, each as of the date of this prospectus and all of which are subject to change, possibly retroactively, which could affect the continuing validity of this discussion. We have not sought and will not seek any ruling from the Internal Revenue Service, or the IRS, regarding this offering. This summary does not discuss any aspects of U.S. estate or gift tax, or foreign, state, or local tax. It does not discuss the special treatment under U.S. federal income tax laws that could result if we invested in tax-exempt securities or certain other investment assets.
This summary does not discuss the consequences of an investment in shares of our preferred stock or debt securities. The tax consequences of such an investment will be discussed in a relevant prospectus supplement.
As used herein, a “U.S. person” is a person that is for U.S. federal income tax purposes:
| • | a citizen or individual resident of the United States; |
| • | a corporation, or other entity treated as a corporation for U.S. federal income tax purposes, created or organized in or under the laws of the U.S. or any state thereof or the District of Columbia; or |
| • | a trust or an estate, the income of which is subject to U.S. federal income taxation regardless of its source. |
A “U.S. shareholder” is a beneficial owner of shares of our common stock that is a U.S. person.
A “non-U.S. shareholder” is a beneficial owner of shares of our common stock that is not a U.S. shareholder.
If a partnership (including an entity treated as a partnership for U.S. federal income tax purposes) holds shares of our common stock, the tax treatment of a partner in the partnership will generally depend upon the status of the partner and the activities of the partnership. A prospective shareholder that is a partner of a partnership holding shares of our common stock should consult its tax advisors with respect to the purchase, ownership, and disposition of shares of our common stock.
Tax matters are very complicated and the tax consequences to an investor of an investment in our shares will depend on the facts of his, her, or its particular situation. We encourage investors to consult their own tax advisors regarding the specific consequences of such an investment, including tax reporting requirements, the applicability of federal, state, local, and foreign tax laws, eligibility for the benefits of any applicable tax treaty and the effect of any possible changes in the tax laws.
Election to Be Taxed as a RIC
As a business development company, we have elected to be treated as a RIC under Subchapter M of the Code. As a RIC, we generally will not have to pay corporate-level U.S. federal income taxes on any ordinary income or capital gains that we distribute to our shareholders as dividends. To qualify as a RIC, we must, among other things, meet certain source-of-income and asset diversification requirements (as described below). In
103
Table of Contents
addition, to obtain RIC tax treatment we must distribute to our shareholders, for each taxable year, at least 90% of our “investment company taxable income,” which is generally our ordinary income plus the excess of realized net short-term capital gains over realized net long-term capital losses, or the Annual Distribution Requirement.
Taxation as a RIC
If we:
| • | qualify as a RIC; and |
| • | satisfy the Annual Distribution Requirement; |
then we will not be subject to U.S. federal income tax on the portion of our investment company taxable income and net capital gain ( i.e., net long-term capital gains in excess of net short-term capital losses) we distribute to shareholders. We will be subject to U.S. federal income tax at the regular corporate rates on any income or capital gain not distributed (or deemed distributed) to our shareholders.
We will be subject to a 4% nondeductible U.S. federal excise tax on certain undistributed income of RICs unless we distribute in a timely manner an amount at least equal to the sum of (1) 98% of our ordinary income for each calendar year, (2) 98.2% of our capital gain net income for the one-year period ending October 31 in that calendar year, and (3) any income realized, but not distributed, in preceding years, or the Excise Tax Avoidance Requirement. We currently intend to make sufficient distributions each taxable year to satisfy the Excise Tax Avoidance Requirement.
In order to qualify as a RIC for U.S. federal income tax purposes, we must, among other things:
| • | qualify to be treated as a business development company under the 1940 Act at all times during each taxable year; |
| • | derive in each taxable year at least 90% of our gross income from dividends, interest, payments with respect to certain securities loans, gains from the sale of stock or other securities, or other income derived with respect to our business of investing in such stock or securities, and net income derived from interests in “qualified publicly traded partnerships” (i.e., partnerships that are traded on an established securities market or tradable on a secondary market, other than partnerships that derive 90% of their income from interest, dividends, capital gains, and other traditionally permitted mutual fund income described in this paragraph) or the 90% Income Test; and |
| • | diversify our holdings so that at the end of each quarter of the taxable year: |
| • | at least 50% of the value of our assets consists of cash, cash equivalents, U.S. Government securities, securities of other RICs, and other securities if such other securities of any one issuer do not represent more than 5% of the value of our assets or more than 10% of the outstanding voting securities of the issuer; and |
| • | no more than 25% of the value of our assets is invested in the securities, other than U.S. Government securities or securities of other RICs, of one issuer or of two or more issuers that are controlled, as determined under applicable tax rules, by us and that are engaged in the same or similar or related trades or businesses or in the securities of one or more qualified publicly traded partnerships, or the Diversification Tests. |
We may be required to recognize taxable income in circumstances in which we do not receive cash. For example, if we hold debt obligations that are treated under applicable tax rules as having original issue discount (such as debt instruments with payment-in-kind interest or, in certain cases, increasing interest rates or issued with warrants), we must include in income each year a portion of the original issue discount that accrues over the life of the obligation, regardless of whether cash representing such income is received by us in the same taxable
104
Table of Contents
year. Because any original issue discount accrued will be included in our investment company taxable income for the year of accrual, we may be required to make a distribution to our shareholders in order to satisfy the Annual Distribution Requirement, even though we will not have received any corresponding cash amount.
Gain or loss realized by us from warrants acquired by us as well as any loss attributable to the lapse of such warrants generally will be treated as capital gain or loss. Such gain or loss generally will be long-term or short-term, depending on how long we held a particular warrant.
We are authorized to borrow funds and to sell assets in order to satisfy distribution requirements. However, under the 1940 Act, we are not permitted to make distributions to our shareholders while our debt obligations and other senior securities are outstanding unless certain “asset coverage” tests are met. See “Regulation—Senior Securities.” Moreover, our ability to dispose of assets to meet our distribution requirements may be limited by (1) the illiquid nature of our portfolio and/or (2) other requirements relating to our status as a RIC, including the Diversification Tests. If we dispose of assets in order to meet the Annual Distribution Requirement or the Excise Tax Avoidance Requirement, we may make such dispositions at times that, from an investment standpoint, are not advantageous.
If we fail to satisfy the Annual Distribution Requirement or otherwise fail to qualify as a RIC in any taxable year, we will be subject to tax in that year on all of our taxable income, regardless of whether we make any distributions to our shareholders. In that case, all of our income will be subject to corporate-level U.S. federal income tax, reducing the amount available to be distributed to our shareholders. In contrast, assuming we qualify as a RIC, our corporate-level federal U.S. income tax should be substantially reduced or eliminated. See “Election to be Taxed as a RIC” above.
The remainder of this discussion assumes that we qualify as a RIC and have satisfied the Annual Distribution Requirement.
Taxation of U.S. Shareholders
Distributions by us generally are taxable to U.S. shareholders as ordinary income or capital gains. Distributions of our “investment company taxable income” (which is, generally, our ordinary income plus realized net short-term capital gains in excess of realized net long-term capital losses) will be taxable as ordinary income to U.S. shareholders to the extent of our current or accumulated earnings and profits, whether paid in cash or reinvested in additional common stock. To the extent such distributions paid by us to non-corporate shareholders (including individuals) are attributable to dividends from U.S. corporations and certain qualified foreign corporations, such distributions generally will be eligible for a maximum tax rate of 20%. In this regard, it is anticipated that distributions paid by us will generally not be attributable to dividends and, therefore, generally will not qualify for the 20% maximum rate. Distributions of our net capital gains (which is generally our realized net long-term capital gains in excess of realized net short-term capital losses) properly reported by us as “capital gain dividends” will be taxable to a U.S. shareholder as long-term capital gains (currently at a maximum rate of 20% in the case of individuals, trusts, or estates), regardless of the U.S. shareholder’s holding period for his, her, or its common stock, and regardless of whether paid in cash or reinvested in additional common stock. Distributions in excess of our earnings and profits first will reduce a U.S. shareholder’s adjusted tax basis in such shareholder’s common stock and, after the adjusted basis is reduced to zero, will constitute capital gains to such U.S. shareholder.
Although we currently intend to distribute any long-term capital gains at least annually, we may in the future decide to retain some or all of our long-term capital gains but designate the retained amount as a “deemed distribution.” In that case, among other consequences, we will pay tax on the retained amount, each U.S. shareholder will be required to include his, her, or its share of the deemed distribution in income as if it had been actually distributed to the U.S. shareholder, and the U.S. shareholder will be entitled to claim a credit equal to his, her, or its allocable share of the tax paid thereon by us. The amount of the deemed distribution net of such
105
Table of Contents
tax will be added to the U.S. shareholder’s tax basis for his, her, or its common stock. Since we expect to pay tax on any retained capital gains at our regular corporate tax rate, and since that rate is in excess of the maximum rate currently payable by individuals on long-term capital gains, the amount of tax that individual shareholders will be treated as having paid and for which they will receive a credit will exceed the tax they owe on the retained net capital gain. Such excess generally may be claimed as a credit against the U.S. shareholder’s other U.S. federal income tax obligations or may be refunded to the extent it exceeds a shareholder’s liability for U.S. federal income tax. A shareholder that is not subject to federal income tax or otherwise required to file a U.S. federal income tax return would be required to file a U.S. federal income tax return on the appropriate form in order to claim a refund for the taxes we paid. In order to utilize the deemed distribution approach, we must provide written notice to our shareholders prior to the expiration of 60 days after the close of the relevant taxable year. We cannot treat any of our investment company taxable income as a “deemed distribution.”
For purposes of determining (1) whether the Annual Distribution Requirement is satisfied for any year and (2) the amount of capital gain dividends paid for that year, we may, under certain circumstances, elect to treat a dividend that is paid during the following taxable year as if it had been paid during the taxable year in question. If we make such an election, the U.S. shareholder will still be treated as receiving the dividend in the taxable year in which the distribution is made. However, any dividend declared by us in October, November, or December of any calendar year, payable to shareholders of record on a specified date in such a month and actually paid during January of the following year, will be treated as if it had been received by our U.S. shareholders on December 31 of the year in which the dividend was declared.
If an investor purchases shares of our common stock shortly before the record date of a distribution, the price of the shares will include the value of the distribution and the investor will be subject to tax on the distribution even though it represents a return of his, her, or its investment.
A shareholder generally will recognize taxable gain or loss if the shareholder sells or otherwise disposes of his, her, or its shares of our common stock. Any gain arising from such sale or disposition generally will be treated as capital gain or loss if the shareholder has held his, her or its shares for more than one year. Otherwise, it would be classified as short-term capital gain or loss. However, any capital loss arising from the sale or disposition of shares of our common stock held for six months or less will be treated as long-term capital loss to the extent of the amount of capital gain dividends received, or undistributed capital gain deemed received, with respect to such shares. In addition, all or a portion of any loss recognized upon a disposition of shares of our common stock may be disallowed if other shares of our common stock are purchased (whether through reinvestment of distributions or otherwise) within 30 days before or after the disposition.
In general, individual and other non-corporate U.S. shareholders currently are subject to a maximum U.S. federal income tax rate of 20% on their net capital gain, i.e., the excess of realized net long-term capital gain over realized net short-term capital loss for a taxable year, including a long-term capital gain derived from an investment in our shares. Such rate is lower than the maximum rate on ordinary income currently payable by individuals. Corporate U.S. shareholders currently are subject to U.S. federal income tax on net capital gain at the maximum 35% rate also applied to ordinary income. Non-corporate shareholders with net capital losses for a year (i.e., capital losses in excess of capital gains) generally may deduct up to $3,000 of such losses against their ordinary income each year; any net capital losses of a non-corporate shareholder in excess of $3,000 generally may be carried forward and used in subsequent years as provided in the Code. Corporate shareholders generally may not deduct any net capital losses against ordinary income for a year, but may carryback such losses for three years or carry forward such losses for five years.
We will send to each of our U.S. shareholders, as promptly as possible after the end of each calendar year, a notice detailing, on a per share basis, the amounts includible in such U.S. shareholder’s taxable income for such year as ordinary income and as long-term capital gain. In addition, the U.S. federal tax status of each year’s distributions generally will be reported to the IRS (including the amount of dividends, if any, eligible for the 15% maximum rate applicable to qualifying dividends in 2012 and the 20% rate thereafter). Distributions may also be
106
Table of Contents
subject to additional state, local, and foreign taxes depending on a U.S. shareholder’s particular situation. Dividends distributed by us generally will not be eligible for the dividends-received deduction or the 15% maximum rate applicable to qualifying dividends in 2012 and the 20% rate thereafter.
We may be required to withhold U.S. federal income tax (“backup withholding”) currently at a rate of 28% from all taxable distributions to any non-corporate U.S. shareholder (1) who fails to furnish us with a correct taxpayer identification number or a certificate that such shareholder is exempt from backup withholding, or (2) with respect to whom the IRS notifies us that such shareholder has failed to properly report certain interest and dividend income to the IRS and to respond to notices to that effect. An individual’s taxpayer identification number is his or her social security number. Any amount withheld under backup withholding is allowed as a credit against the U.S. shareholder’s federal income tax liability and may entitle such shareholder to a refund, provided that proper information is timely provided to the IRS.
The exercise of a warrant to purchase common stock generally will not constitute a taxable event. Accordingly, a holder of a warrant that is a U.S. person generally will not recognize gain or loss upon the exercise of a warrant. Rather, a holder of a warrant that is a U.S. person will recognize taxable gain or loss if and when such holder disposes of the common stock received pursuant to the exercise of the warrant in a taxable transaction. The aggregate tax basis of a U.S. person that is a holder of a warrant in the common stock received pursuant to the exercise of the warrant equals the amount paid upon the exercise of the warrant plus the holder’s basis in the warrant. The holding period of the common stock received pursuant to the exercise of the warrant would begin on the day that the warrant is exercised.
Generally, for United States federal income tax purposes, a holder of a warrant that is a U.S. person will recognize taxable gain or loss upon the sale or other disposition of the warrants in an amount equal to the difference between the amount realized for the warrants and the holder’s tax basis in the warrants. Such gain or loss will generally be treated as capital gain or loss.
If a warrant is allowed to lapse unexercised, a holder of a warrant that is a U.S. person will recognize a capital loss equal to such holder’s basis in the warrant. Such loss will be long-term if the warrant has been held for more than one year.
The exercise price of the warrants will be adjusted in certain circumstances. Under Section 305(c) of the Code, adjustments (or failures to make adjustments) that have the effect of increasing a holder’s proportionate interest in our assets or earnings may in some circumstances result in a deemed distribution to such holder. Adjustments to the exercise price made pursuant to a bona fide reasonable adjustment formula that has the effect of preventing the dilution of the interest of the holders of the warrants, however, will generally not be considered to result in a deemed distribution to holders. Certain of the possible exercise price adjustments provided in the warrants (including, without limitation, adjustments in respect of taxable dividends to holders of our common stock) may not qualify as being pursuant to a bona fide reasonable adjustment formula. If such adjustments are made, a warrant holder will be deemed to have received a distribution even though such holder has not received any cash or property as a result of such adjustments. Any deemed distributions will be taxable as a dividend, return of capital, or capital gain in accordance with the earnings and profits rules under the Code. U.S. shareholders should consult their own tax advisors regarding the possible application of Section 305(c) of the Code.
Taxation of Non-U.S. Shareholders
Whether an investment in our common stock is appropriate for a non-U.S. shareholder will depend upon that person’s particular circumstances. An investment in our common stock by a non-US shareholder may have adverse tax consequences. Non-U.S. shareholders should consult their tax advisers before investing in our common stock.
107
Table of Contents
Dividends paid by us to non-U.S. shareholders are generally subject to withholding at a 30% rate or a reduced rate specified by an applicable income tax treaty to the extent derived from net investment company income. In order to obtain a reduced rate of withholding, a non-U.S. shareholder will be required to provide an IRS Form W-8BEN certifying its entitlement to benefits under a treaty. The withholding tax does not apply to regular dividends paid to a non-U.S. shareholder who provides a Form W-8ECI, certifying that the dividends are effectively connected with the non-U.S. shareholder’s conduct of a trade or business within the United States. Instead, the effectively connected dividends will be subject to regular U.S. income tax as if the non-U.S. shareholder were a U.S. shareholder. A non-U.S. corporation receiving effectively connected dividends may also be subject to additional “branch profits tax” imposed at a rate of 30% (or lower treaty rate). A non-U.S. shareholder who fails to provide an IRS Form W-8BEN or other applicable form may be subject to backup withholding at the appropriate rate.
In general, U.S. federal withholding tax will not apply to any gain or income realized by a non-U.S. shareholder in respect of any distributions of net long-term capital gains over net short-term capital losses, exempt-interest dividends, or upon the sale or other disposition of shares of our common stock.
For taxable years beginning before January 1, 2014, properly reported dividends are generally exempt from U.S. federal withholding tax where they (i) are paid in respect of out “qualified net interest income” (generally, our U.S. source interest income, other than certain contingent interest and interest from obligations of a corporation or partnership in which we are at least a 10% shareholder, reduced by expenses that are allocable to such income) or (ii) are paid in respect of our “qualified short-term capital gains” (generally, the excess of our net short-term capital gain over our long-term capital loss for such taxable year). However, depending on its circumstances, we may report all, some or none of its potentially eligible dividends as such qualified net interest income or as qualified short-term capital gains and/or treat such dividends, in whole or in part, as ineligible for this exemption from withholding. In order to qualify for this exemption from withholding, a non-U.S. shareholder would need to comply with applicable certification requirements relating to its non-U.S. status (including, in general, furnishing an IRS Form W-8BEN or substitute Form). In the case of shares held through an intermediary, the intermediary could withhold even if we designate the payment as qualified net interest income or qualified short-term capital gain. Non-U.S. shareholders should contact their intermediaries with respect to the application of these rules to their accounts.
A 30% withholding tax will be imposed on dividends paid after June 30, 2014, and redemption proceeds paid after December 31, 2016, to foreign financial institutions including non-U.S. investment funds and certain other non-financial foreign entities unless they comply with certain information reporting requirements. To avoid withholding, foreign financial institutions will need to (i) enter into agreements with the IRS that state that they will provide the IRS information, including the names, addresses and taxpayer identification numbers of direct and indirect U.S. account holders, comply with due diligence procedures with respect to the identification of U.S. accounts, report to the IRS certain information with respect to U.S. accounts maintained, agree to withhold tax on certain payments made to non-compliant foreign financial institutions or to account holders who fail to provide the required information, and determine certain other information as to their account holders, or (ii) in the event that an applicable intergovernmental agreement and implementing legislation are adopted, comply with modified requirements including in some cases providing local revenue authorities with similar account holder information. Other foreign entities will need to either provide the name, address, and taxpayer identification number of each substantial U.S. owner or certifications of no substantial U.S. ownership unless certain exceptions apply or agree to provide certain information to other revenue authorities for transmittal to the IRS.
Non-U.S. persons should consult their own tax advisors with respect to the U.S. federal income tax and withholding tax, and state, local, and foreign tax consequences of an investment in the shares.
108
Table of Contents
Failure to Qualify as a RIC
If we were unable to qualify for treatment as a RIC, we would be subject to tax on all of our taxable income at regular corporate rates. We would not be able to deduct distributions to shareholders, nor would they be required to be made. Distributions would generally be taxable to our shareholders as ordinary dividend income eligible for the 15% maximum rate for taxable years beginning before January 1, 2013 and 20% thereafter to the extent of our current and accumulated earnings and profits for U.S. federal tax purposes. Subject to certain limitations under the Code, corporate distributees would be eligible for the dividends received deduction. Distributions in excess of our current and accumulated earnings and profits would be treated first as a return of capital to the extent of the shareholder’s tax basis, and any remaining distributions would be treated as a capital gain.
109
Table of Contents
Regulation by the SEC and under the 1940 Act
We are a closed-end, management investment company that has elected to be treated as a business development company under the 1940 Act. We conduct our business through various wholly-owned investment company subsidiaries including Medallion Funding LLC, a closed end investment company, Medallion Capital, Inc., a business development company, and Freshstart Venture Capital Corp., a business development company. Pursuant to various exemptive orders, we operate and are regulated as a single business development company. The 1940 Act contains prohibitions and restrictions relating to transactions between business development companies and their affiliates (including any investment advisers or sub-advisers), principal underwriters and affiliates of those affiliates or underwriters, and requires that a majority of the directors be persons other than “interested persons,” as that term is defined in the 1940 Act. In addition, the 1940 Act provides that we may not change the nature of our business so as to cease to be, or to withdraw our election as, a business development company unless approved by a majority of our outstanding voting securities voting as a class.
We may invest up to 100% of our assets in securities acquired directly from issuers in privately negotiated transactions. With respect to such securities, we may, for the purpose of public resale, be deemed an “underwriter” as that term is defined in the Securities Act of 1933. Similarly, in connection with an acquisition, we may acquire rights to require the issuers of acquired securities or their affiliates to repurchase them under certain circumstances. We also do not intend to acquire securities issued by any investment company that exceed the limits imposed by the 1940 Act. Under these limits, we generally cannot acquire more than 3% of the voting stock of any registered investment company, invest more than 5% of the value of our total assets in the securities of one investment company or invest more than 10% of the value of our total assets in the securities of more than one investment company. Certain of these limits are not applicable to our investments in our wholly-owned SBIC subsidiaries. With regard to that portion of our portfolio invested in securities issued by investment companies, it should be noted that such investments might subject our stockholders to additional expenses. None of our policies is fundamental, and each may be changed without stockholder approval.
Qualifying Assets
Under the 1940 Act, a business development company may not acquire any asset other than assets of the type listed in Section 55(a) of the 1940 Act, which are referred to as qualifying assets, unless, at the time the acquisition is made, qualifying assets represent at least 70% of the company’s total assets. The principal categories of qualifying assets relevant to our business are the following:
| (1) | Securities purchased in transactions not involving any public offering from the issuer of such securities, which issuer (subject to certain limited exceptions) is an eligible portfolio company, or from any person who is, or has been during the preceding 13 months, an affiliated person of an eligible portfolio company, or from any other person, subject to such rules as may be prescribed by the SEC. An eligible portfolio company is generally defined in the 1940 Act as any issuer which: |
| (a) | is organized under the laws of, and has its principal place of business in, any state in the U.S.; |
| (b) | is not an investment company (other than a small business investment company wholly owned by the business development company) or a company that would be an investment company but for certain exclusions under the 1940 Act; and |
| (c) | satisfies any of the following: |
| • | does not have any class of securities listed on a national securities exchange, or has a class of securities listed on a national securities exchange, but has an aggregate market value of outstanding voting and non-voting common equity of less than $250 million; |
110
Table of Contents
| • | is controlled by a business development company or a group of companies including a business development company, and the business development company in fact exercises a controlling influence on the management or policies of such eligible portfolio company and, as a result of such control, has an affiliated person who is a director of the eligible portfolio company; or |
| • | is a small and solvent company having total assets of not more than $4 million and capital and surplus of not less than $2 million. |
| (2) | Securities of any eligible portfolio company which we control. |
| (3) | Securities purchased in transactions not involving any public offering from a U.S. issuer that is not an investment company or from an affiliated person of the issuer, or in transactions incident thereto, if the issuer is in bankruptcy and subject to reorganization or if the issuer, immediately prior to the purchase of its securities was unable to meet its obligations as they came due without material assistance other than conventional lending or financing arrangements. |
| (4) | Securities of an eligible portfolio company purchased from any person in a private transaction if there is no ready market for such securities and we already own at least 60% of the outstanding equity of the eligible portfolio company. |
| (5) | Securities received in exchange for or distributed on or with respect to securities described in (1) through (4) above, or pursuant to the exercise of warrants or rights relating to such securities. |
| (6) | Cash, cash equivalents, U.S. Government securities or high-quality debt securities maturing in one year or less from the time of investment. |
| (7) | Subject to certain conditions, securities issued by a company that met the definition of eligible portfolio company at the time of our initial investment but subsequently does not meet the definition because the company no longer meets the definition set forth above. |
Managerial Assistance to Portfolio Companies
In addition, a business development company must have been organized and have its principal place of business in the U.S. and must be operated for the purpose of making investments in the types of securities described in (1), (2), or (3) above. However, in order to count portfolio securities as qualifying assets for the purpose of the 70% test, the business development company must either control the issuer of the securities or must offer to make available to the issuer of the securities (other than small and solvent companies described above) significant managerial assistance; except that, where the business development company purchases such securities in conjunction with one or more other persons acting together, one of the other persons in the group may make available such managerial assistance. Making available managerial assistance means, among other things, any arrangement whereby the business development company, through its directors, officers, or employees, offers to provide, and, if accepted, does so provide, significant guidance and counsel concerning the management, operations, or business objectives and policies of a portfolio company.
Temporary Investments
Pending investment in other types of “qualifying assets,” as described above, our investments may consist of cash equivalents, U.S. government securities, or high-quality debt securities maturing in one year or less from the time of investment, which we refer to, collectively, as temporary investments, so that 70% of our assets are qualifying assets. Typically, we will invest in U.S. Treasury bills or in repurchase agreements, provided that such agreements are fully collateralized by cash or securities issued by the U.S. government or its agencies. A repurchase agreement involves the purchase by an investor, such as us, of a specified security and the simultaneous agreement by the seller to repurchase it at an agreed-upon future date and at a price which is greater than the purchase price by an amount that reflects an agreed-upon interest rate. There is no percentage restriction on the proportion of our assets that may be invested in such repurchase agreements.
111
Table of Contents
Senior Securities
We are permitted, under specified conditions, to issue multiple classes of indebtedness and one class of stock senior to our common stock if our asset coverage, as defined in the 1940 Act, is at least equal to 200% immediately after each such issuance. In addition, while any senior securities remain outstanding, we must make provisions to prohibit any distribution to our shareholders or the repurchase of such securities or shares unless we meet the applicable asset coverage ratios at the time of the distribution or repurchase. We may also borrow amounts up to 5% of the value of our total assets for temporary or emergency purposes without regard to full asset coverage requirements. In addition to the 1940 Act, we are subject to two exemptive orders which govern how we calculate our senior securities and under which we have agreed that we will meet the applicable asset coverage ratios both individually and on a consolidated basis. For a discussion of the risks associated with leverage, see “Risk Factors—Risks Relating to Our Business and Structure—Regulations governing our operation as a business development company will affect our ability to, and the way in which we raise additional capital.”
Regulation by the SBA
Medallion Funding, Medallion Capital, and Freshstart each operate as Small Business Investment Companies, or SBIC’s. The SBIA authorizes the organization of SBIC’s as vehicles for providing equity capital, long term financing, and management assistance to small business concerns. The SBIA and the SBA regulations define a “small business concern” as a business that is independently owned and operated, which does not dominate its field of operation, and which (i) has a net worth, together with any affiliates, of $18.0 million or less and average annual net income after U.S. federal income taxes for the preceding two years of $6.0 million or less (average annual net income is computed without the benefit of any carryover loss), or (ii) satisfies alternative criteria under SBA regulations that focus on the industry in which the business is engaged and the number of persons employed by the business or its gross revenues. In addition, at the end of each year, at least 25% of the total amount of loans made after April 25, 1994 must be made in “smaller businesses” which have a net worth of $6.0 million or less, and average net income after federal income taxes for the preceding two years of $2.0 million or less. SBA regulations also prohibit an SBIC from providing funds to a small business concern for certain purposes, such as relending and reinvestment.
Medallion Funding is authorized to make loans to borrowers other than disadvantaged businesses (that is, businesses that are at least 50% owned, and controlled, and managed, on a day to day basis, by a person or persons whose participation in the free enterprise system is hampered because of social or economic disadvantage) if, at the time of the loan, Medallion Funding has in its portfolio outstanding loans to disadvantaged businesses with an aggregate cost basis equal to or exceeding the value of the unamortized repurchase discount under the preferred stock repurchase agreement between Medallion Funding and the SBA, which is currently zero.
Under current SBA Regulations, the maximum rate of interest that Medallion Funding may charge may not exceed the higher of (i) 19% or (ii) the sum of (a) the higher of (i) that company’s weighted average cost of qualified borrowings, as determined under SBA Regulations, or (ii) the current SBA debenture rate, plus (b) 11%, rounded to the next lower eighth of one percent. As of December 31, 2011, the maximum rate of interest permitted on loans originated by Medallion Funding, Medallion Capital, and Freshstart was 19%. As of December 31, 2011, our outstanding medallion loans had a weighted average rate of interest 5.11% and our outstanding commercial loans had a weighted average rate of interest of 12.06%. Current SBA regulations also require that each loan originated by an SBIC has a term between one and 20 years; loans to disadvantaged businesses also may be for a minimum term of one year.
The SBA restricts the ability of SBICs to repurchase their capital stock, to retire their SBA debentures, and to lend money to their officers, directors, and employees, or invest in affiliates thereof. The SBA also prohibits, without prior SBA approval, a “change of control” or transfers which would result in any person (or group of
112
Table of Contents
persons acting in concert) owning 10% or more of any class of capital stock of an SBIC. A “change of control” is any event which would result in the transfer of the power, direct or indirect, to direct the management and policies of an SBIC, whether through ownership, contractual arrangements, or otherwise.
Under SBA Regulations, without prior SBA approval, loans by licensees with outstanding SBA leverage to any single small business concern may not exceed 30% of an SBIC’s regulatory capital, as defined. Under the terms of the respective conversion agreements with the SBA, however, Medallion Funding is authorized to make loans to disadvantaged borrowers in amounts not exceeding 30% of its respective regulatory capital.
SBICs must invest idle funds that are not being used to make loans in investments permitted under SBA regulations. These permitted investments include direct obligations of, or obligations guaranteed as to principal and interest by, the government of the U.S. with a term of 15 months or less and deposits maturing in one year or less issued by an institution insured by the FDIC. These permitted investments must be maintained in (i) direct obligations of, or obligations guaranteed as to principal and interest by, the U.S., which mature within 15 months from the date of the investment; (ii) repurchase agreements with federally insured institutions with a maturity of seven days or less if the securities underlying the repurchase agreements are direct obligations of, or obligations guaranteed as to principal and interest by the U.S., and such securities must be maintained in a custodial account in a federally insured institution; (iii) certificates of deposit with a maturity of one year or less, issued by a federally insured institution; (iv) a deposit account in a federally insured institution, subject to withdrawal restriction of one year or less; (v) a checking account in a federally insured institution; or (vi) a reasonable petty cash fund.
SBICs may purchase voting securities of small business concerns in accordance with SBA regulations. Although prior regulations prohibited an SBIC from controlling a small business concern except in limited circumstances, regulations adopted by the SBA on October 22, 2002 (pursuant to Public Law 106-554) now allow an SBIC to exercise control over a small business for a period of seven years from the date on which the SBIC initially acquires its control position. This control period may be extended for an additional period of time with the SBA’s prior written approval.
Regulation of Medallion Bank as an Industrial Bank
In May 2002, we formed Medallion Bank, which received approval from the FDIC for federal deposit insurance in October 2003. Medallion Bank, a Utah-chartered industrial bank, is a depository institution subject to regulatory oversight and examination for safely and soundness by both the FDIC and the Utah Department of Financial Institutions. Under its banking charter, Medallion Bank is empowered to make consumer and commercial loans, and may accept all FDIC-insured deposits other than demand deposits (checking accounts). The creation of Medallion Bank allows us to apply stable and low-cost bank deposit funding for key lending business activities throughout our business.
In addition, the FDIC has regulatory authority to prohibit Medallion Bank from engaging in any unsafe or unsound practice in conducting its business.
Medallion Bank is further subject to capital adequacy guidelines issued by the Federal Financial Institutions Examination Council, or the FFIEC. These guidelines make regulatory capital requirements more sensitive to differences in risk profiles among banking organizations and consider off-balance sheet exposures in determining capital adequacy. Under the rules and regulations of the FFIEC, at least half of a bank’s total capital is required to be Tier 1 capital, comprised of common equity, retained earnings and a limited amount of non-cumulative perpetual preferred stock. The remaining capital, Tier 2 capital, may consist of other preferred stock, certain hybrid debt/equity instruments, a limited amount of term-subordinated debt, or a limited amount of the reserve for possible credit losses. The FFIEC has also adopted minimum leverage ratios for banks, which are calculated by dividing Tier 1 capital by total average assets. Recognizing that the risk-based capital standards address only
113
Table of Contents
credit risk, and not interest rate, liquidity, operational, or other risks, many banks are expected to maintain capital in excess of the minimum standards.
In addition, pursuant to provisions of the FDIC Improvement Act of 1991, or FDICIA, and related regulations with respect to prompt corrective action, FDIC-insured institutions such as Medallion Bank may only accept brokered deposits without FDIC permission if they meet specified capital standards, and are subject to restrictions with respect to the interest they may pay on deposits unless they are well-capitalized. To be well-capitalized under the prompt corrective action provisions, a bank must have a ratio of combined Tier 1 and Tier 2 capital to risk-weighted assets of not less than 10%, Tier 1 capital to risk-weighted assets of not less than 6%, and a Tier 1 to average assets of not less than 5%.
We, the FDIC, and Medallion Bank have agreed that the capital levels of Medallion Bank will at all times meet or exceed the levels required for Medallion Bank to be considered well-capitalized under the FDIC rules and regulations, that Medallion Bank’s Tier 1 capital to total assets leverage ratio will be maintained at not less than 15%, and that Medallion Bank will maintain an adequate allowance for loan and lease losses.
Medallion Bank is subject to certain federal laws that restrict and control its ability to extend credit and provide or receive services between affiliates. Sections 23A and 23B of the Federal Reserve Act and applicable regulations also impose restrictions on Medallion Bank. These restrictions limit the transfer of funds by a depository institution to certain of its affiliates, including us, in the form of loans, extensions of credit, investments, or purchases of assets. Sections 23A and 23B also require generally that the depository institution’s transactions with its affiliates be on terms no less favorable to Medallion Bank than comparable transactions with unrelated third parties.
The USA Patriot Act and the International Money Laundering Abatement and Anti-Terrorist Financing Act of 2001, or the Patriot Act, was enacted on October 26, 2001, and is intended to detect and prosecute terrorism and international money laundering. The Patriot Act establishes new standards for verifying customer identification incidental to the opening of new accounts. Medallion Bank has undertaken appropriate measures to comply with the Patriot Act and associated regulations. Other provisions of the Patriot Act provide for special information sharing procedures governing communications with the government and other financial institutions with respect to suspected terrorists and money laundering activity, and enhancements to suspicious activity reporting, including electronic filing of suspicious activity reports over a secure filing network. Bank regulators routinely examine institutions for compliance with these obligations and are required to consider compliance in connection with the regulatory review of applications.
Federal and state banking agencies require Medallion Bank to prepare annual reports on financial condition and to conduct an annual audit of financial affairs in compliance with minimum standards and procedures. Medallion Bank must undergo regular on-site examinations by the appropriate banking agency, which will examine for adherence to a range of legal and regulatory compliance responsibilities. A bank regulator conducting an examination has complete access to the books and records of the examined institution. The results of the examination are confidential. The cost of examinations may be assessed against the examined institution as the agency deems necessary or appropriate.
Other
Because Medallion Bank is an “insured depository institution” within the meaning of the Federal Deposit Insurance Act and the Change in Bank Control Act and we are a “financial institution holding company” within the meaning of the Utah Financial Institutions Act, federal and Utah law and regulations prohibit any person or company from acquiring control of us and, indirectly, Medallion Bank, without, in most cases, prior written approval of the FDIC or the Commissioner of Financial Institutions, as applicable. Under the Change in Bank Control Act, control is conclusively presumed if, among other things, a person or company acquires 25% or more of any class of our voting stock. A rebuttable presumption of control arises if a person or company acquires 10%
114
Table of Contents
or more of any class of voting stock and is subject to a number of specified “control factors” as set forth in the applicable regulations. Although Medallion Bank is an “insured depository institution” within the meaning of the Federal Deposit Insurance Act and the Change in Bank Control Act, your investment in Medallion Financial Corp. is not guaranteed by the FDIC and is subject to loss. Under the Utah Financial Institutions Act, control is defined as the power to vote 20% or more of any class of our voting securities by an individual or to vote more than 10% of any class of our voting securities by a person other than an individual. Investors are responsible for ensuring that they do not, directly or indirectly, acquire shares of our common stock in excess of the amount which can be acquired without regulatory approval.
We may also be prohibited under the 1940 Act from knowingly participating in certain transactions with our affiliates without the prior approval of our Board of Directors who are not interested persons and, in some cases, prior approval by the SEC.
We are periodically examined by the SEC for compliance with the 1940 Act. We are examined by the SBA annually for compliance with applicable SBA regulations. We are also periodically examined by the FDIC and the Department of Financial Institutions of the State of Utah (DFI). Medallion Bank is examined annually by the FDIC and the DFI.
We are required to provide and maintain a bond issued by a reputable fidelity insurance company to protect us against larceny and embezzlement. Furthermore, as a business development company, we are prohibited from protecting any director or officer against any liability to us or our shareholders arising from willful misfeasance, bad faith, gross negligence, or reckless disregard of the duties involved in the conduct of such person’s office.
We have adopted and implemented written policies and procedures reasonably designed to prevent violation of the federal securities laws, and intend to review these policies and procedures annually for their adequacy and the effectiveness of their implementation. We have designated a chief compliance officer to be responsible for administering our policies and procedures.
Compliance with the Sarbanes-Oxley Act of 2002 and NASDAQ Corporate Governance Regulations
The Sarbanes-Oxley Act of 2002, or the Sarbanes-Oxley Act, imposes a wide variety of regulatory requirements on publicly-held companies and their insiders. Many of these requirements affect us. The Sarbanes-Oxley Act has required us to review our policies and procedures to determine whether we comply with the Sarbanes-Oxley Act and the regulations promulgated thereunder. We will continue to monitor our compliance with all future regulations that are adopted under the Sarbanes-Oxley Act and will take actions necessary to ensure that we are in compliance therewith.
In addition, NASDAQ has adopted or is in the process of adopting corporate governance changes to its listing standards. We believe we are in compliance with such corporate governance listing standards. We will continue to monitor our compliance with all future listing standards and will take actions necessary to ensure that we are in compliance therewith.
115
Table of Contents
DESCRIPTION OF OUR CAPITAL STOCK
The following description is based on relevant portions of the DGCL and on our charter and by-laws. This summary is not necessarily complete, and we refer you to the DGCL and our charter and bylaws for a more detailed description of the provisions summarized below.
General
We were organized as a corporation under the laws of the State of Delaware on October 20, 1995. Our authorized capital stock consists of 1,000,000 shares of preferred stock, and 50,000,000 shares of common stock. As of September 19, 2013, there were no shares of preferred stock outstanding and 22,036,423 shares of common stock outstanding and 253 record holders.
Common Stock
The holders of our common stock are entitled to one vote for each share on all matters voted upon by shareholders, including the election of directors.
Subject to the rights of any outstanding shares of preferred stock, the holders of the common stock are entitled to such dividends as may be declared in the discretion of the Board of Directors out of funds legally available therefor. Holders of common stock are entitled to share ratably in our net assets upon liquidation after payment or provision for all liabilities and any preferential liquidation rights of any outstanding shares of preferred stock.
The holders of common stock have no preemptive rights to purchase shares of our stock. Shares of common stock are not subject to any redemption provisions and are not convertible into any of our other securities. All outstanding shares of common stock are, and the shares of common stock to be issued pursuant to this offering will be upon payment therefor, fully paid and non-assessable.
Preferred Stock
Subject to the requirements of the 1940 Act, preferred stock may be issued from time to time by the Board of Directors as shares of one or more classes or series. Subject to the provisions of our certificate of incorporation and limitations prescribed by law, the Board of Directors is expressly authorized to adopt resolutions to issue the shares, to fix the number of shares, to change the number of shares constituting any series, and to provide for or change the voting powers, designations, preferences and relative, participating, optional or other special rights, qualifications, limitations or restrictions thereof, including dividend rights (including whether dividends are cumulative), dividend rates, terms of redemption (including sinking fund provisions), redemption prices, conversion rights and liquidation preferences of the shares constituting any class or series of the preferred stock, in each case without any further action or vote by the shareholders. We have no current plans to issue any shares of preferred stock of any class or series.
One of the effects of undesignated preferred stock may be to enable the Board of Directors to render more difficult, or to discourage an attempt, to obtain control of us by means of a tender offer, proxy contest, merger or otherwise, and thereby to protect the continuity of our management. The issuance of shares of the preferred stock pursuant to the Board of Directors’ authority described above may adversely affect the rights of the holders of common stock. For example, preferred stock issued by us may rank prior to the common stock as to dividend rights, liquidation preference or both and may have full or limited voting rights and be convertible into shares of common stock. Accordingly, the issuance of shares of preferred stock may discourage bids for the common stock or may otherwise adversely affect the market price of the common stock.
116
Table of Contents
Limitation on Directors’ Liabilities
Pursuant to our certificate of incorporation and under Delaware law, our directors are not liable to us or its shareholders for monetary damages for breach of fiduciary duty, except for liability in connection with a breach of duty of loyalty, for acts or omissions not in good faith or which involve intentional misconduct or a knowing violation of law, for dividend payments or stock repurchases illegal under Delaware law or any transaction in which a director has derived an improper personal benefit.
Authorized and Outstanding Securities
The following table illustrates our authorized and outstanding securities on September 19, 2013:
| Title of Class |
Amount Authorized | Amount Held By Us For Our Own Account |
Amount Outstanding(1) | |||||||||
| Common Stock |
50,000,000 | 1,600,733 | 22,036,423 | |||||||||
| Preferred Stock |
1,000,000 | 0 | 0 | |||||||||
| (1) | Exclusive of amount held by us or for our own accounts. |
Stock Repurchase Program
We maintain a stock repurchase program in which we are authorized to repurchase up to $20,000,000 of our common stock. Our Board of Directors authorized us to repurchase up to $10,000,000 of our common stock on November 3, 2003 and authorized us to repurchase an additional $10,000,000 of our common stock on November 3, 2004. The stock repurchase program expires after a certain number of days, except in certain cases where it is extended through completion of the authorized amounts. The stock repurchase program was extended in November 2005 and was further extended in July 2006, April 2007, November 2007, April 2008, November 2008, April 2009, November 2009, April 2010, October 2010, April 2011, October 2011, April 2012, October 2012 and April 2013. Under the most recent extension, purchases could commence no earlier than November 2011 and were to conclude 180 days after the commencement of the purchases. If we have not repurchased all of the common stock by the end of the period set forth above, we are permitted to extend the term of the stock repurchase program for an additional period or periods, until we have repurchased up to the total amount authorized under the stock repurchase program.
Delaware Law and Certain Provisions of the Certificate of Incorporation and the By-Laws
Our certificate of incorporation and by-laws include provisions that could make it more difficult to acquire us by means of a merger, a tender offer, a proxy contest or otherwise. These provisions, as described below, are expected to discourage certain types of coercive takeover practices and inadequate takeover bids and to encourage persons seeking to acquire control of us first to negotiate. These provisions may also, however, inhibit a change in control of in circumstances that could give our shareholders the opportunity to realize a premium over the then prevailing market price of our common stock. In addition, these provisions could adversely affect the market price for our common stock. We believe that the benefits of increased protection of our potential ability to negotiate with the proponent of an unfriendly or unsolicited proposal to acquire or restructure us outweigh the disadvantages of discouraging such proposals because, among other things, negotiations with respect to such proposals could result in an improvement of their terms.
Our certificate of incorporation and the by-laws provide that our Board of Directors be divided into three classes of directors, with the term of each class expiring in a different year. See “Management.” Our by-laws provide that the number of directors will be fixed from time to time exclusively by the Board of Directors, but shall consist of not more than 15 nor less than three directors. A majority of the Board of Directors then in office has the sole authority to fill any vacancies on the Board of Directors. Our certificate of incorporation provides that directors may be removed only by the affirmative vote of holders of at least 75% of the voting power of all
117
Table of Contents
of the then outstanding shares of stock entitled to vote generally in the election of directors voting together as a single class.
Our certificate of incorporation provides that shareholder action can be taken only at an annual or special meeting of shareholders and prohibits shareholder action by written consent in lieu of a meeting. Our certificate of incorporation and by-laws provide that special meetings of shareholders can be called by the chairman of the Board of Directors, pursuant to a resolution approved by a majority of the total number of directors which we would have if there were no vacancies on the Board of Directors, or by the shareholders owning at least 20% of the stock entitled to vote at the meeting. The business permitted to be conducted at any special meeting of shareholders is limited to the business brought before the meeting by the chairman of the Board of Directors, or at the request of a majority of the members of the Board of Directors, or as specified in the shareholders’ notice of a meeting.
Our by-laws set forth an advance notice procedure with regard to the nomination, other than by or at the direction of the Board of Directors, of candidates for election as directors and with regard to business brought before an annual meeting of our shareholders.
Our certificate of incorporation and by-laws contain provisions requiring the affirmative vote of the holders of at least 75% of our voting stock, voting together as a single class, to amend certain provisions of the certificate of incorporation relating primarily to anti-takeover provisions and to the limitations on director liability and to amend the by-laws.
Our certificate of incorporation empowers the Board of Directors, when considering a tender offer or merger or acquisition proposal, to take into account factors in addition to potential economic benefits to shareholders.
These factors may include (i) comparison of the proposed consideration to be received by our shareholders in relation to the then current market price of our capital stock, our estimated current value in a freely negotiated transaction, and our estimated future value as an independent entity; (ii) the impact of such a transaction on our customers and employees, and its effect on the communities in which we operate; and (iii) our ability to fulfill our objectives under applicable statutes and regulations.
Our certificate of incorporation prohibits us from purchasing any shares of our stock from any person, entity or group that beneficially owns 5% or more of our voting stock at a price exceeding the average closing price for the 20 trading days prior to the purchase date, unless a majority of our disinterested shareholders approve the transaction. This restriction on our purchases does not apply to any offer to purchase shares of a class of our stock which is made on the same terms and conditions to all holders of that class of stock, to any purchase of stock owned by such a 5% shareholder occurring more than two years after such shareholder’s last acquisition of our stock, to any purchase of our stock in accordance with the terms of any stock option or employee benefit plan, or to any purchase at prevailing market prices pursuant to a stock purchase program.
Section 203 of the DGCL, is applicable to corporations organized under the laws of the State of Delaware. Subject to certain exceptions set forth therein, Section 203 of the DGCL provides that a corporation shall not engage in any business combination with any “interested shareholder” for a three-year period following the date that such shareholder becomes an interested shareholder unless (a) prior to such date, the Board of Directors of the corporation approved either the business combination or the transaction which resulted in the shareholder becoming an interested shareholder, (b) upon consummation of the transaction which resulted in the shareholder becoming an interested shareholder, the interested shareholder owned at least 85% of the voting stock of the corporation outstanding at the time the transaction commenced (excluding certain shares) or (c) on or subsequent to such date, the business combination is approved by the Board of Directors of the corporation and by the affirmative vote of at least 66 2/3% of the outstanding voting stock which is not owned by the interested shareholder. Except as specified therein, an interested shareholder is defined to mean any person that (i) is the owner of 15% or more of the outstanding voting stock of the corporation; or (ii) is an affiliate or associate of the
118
Table of Contents
corporation and was the owner of 15% or more of the outstanding voting stock of the corporation at any time within three years immediately prior to the relevant date, and the affiliates and associates of such person referred to in clause (i) or (ii) of this sentence. Under certain circumstances, Section 203 of the DGCL makes it more difficult for an interested shareholder to effect various business combinations with a corporation for a three-year period, although the shareholders may, by adopting an amendment to the corporation’s certificate of incorporation or by-laws, elect not to be governed by this section, effective twelve months after adoption. Our certificate of incorporation and by-laws do not exclude us from the restrictions imposed under Section 203 of the DGCL. It is anticipated that the provisions of Section 203 of the DGCL may encourage companies interested in acquiring us to negotiate in advance with the Board of Directors.
119
Table of Contents
DESCRIPTION OF OUR PREFERRED STOCK
In addition to shares of common stock, our charter authorizes the issuance of preferred stock. If we offer preferred stock under this prospectus, we will issue an appropriate prospectus supplement. We may issue preferred stock from time to time in one or more classes or series, without shareholder approval. Prior to issuance of shares of each class or series, our board of directors is required by Delaware law and by our charter to set the terms, preferences, conversion or other rights, voting powers, restrictions, limitations as to dividends or other distributions, qualifications and terms or conditions of redemption for each class or series. Any such an issuance must adhere to the requirements of the 1940 Act, Delaware law and any other limitations imposed by law.
The 1940 Act currently requires, among other things, that (a) immediately after issuance and before any distribution is made with respect to common stock, the liquidation preference of the preferred stock, together with all other senior securities, must not exceed an amount equal to 50% of our total assets (taking into account such distribution), (b) the holders of shares of preferred stock, if any are issued, must be entitled as a class to elect two directors at all times and to elect a majority of the directors if dividends on the preferred stock are in arrears by two years or more and (c) such class of stock have complete priority over any other class of stock as to distribution of assets and payment of dividends, which dividends shall be cumulative.
For any series of preferred stock that we may issue, our board of directors will determine and the articles supplementary and the prospectus supplement relating to such series will describe:
| • | the designation and number of shares of such series; |
| • | the rate and time at which, and the preferences and conditions under which, any dividends will be paid on shares of such series, as well as whether such dividends are participating or non-participating; |
| • | any provisions relating to convertibility or exchangeability of the shares of such series, including adjustments to the conversion price of such series; |
| • | the rights and preferences, if any, of holders of shares of such series upon our liquidation, dissolution or winding up of our affairs; |
| • | the voting powers, if any, of the holders of shares of such series; |
| • | any provisions relating to the redemption of the shares of such series; |
| • | any limitations on our ability to pay dividends or make distributions on, or acquire or redeem, other securities while shares of such series are outstanding; |
| • | any conditions or restrictions on our ability to issue additional shares of such series or other securities; |
| • | if applicable, a discussion of material U.S. federal income tax considerations; and |
| • | any other relative powers, preferences and participating, optional or special rights of shares of such series, and the qualifications, limitations or restrictions thereof. |
All shares of preferred stock that we may issue will be identical and of equal rank except as to the particular terms thereof that may be fixed by our board of directors, and all shares of each series of preferred stock will be identical and of equal rank except as to the dates from which dividends, if any, thereon will be cumulative.
120
Table of Contents
DESCRIPTION OF OUR DEBT SECURITIES
We may issue debt securities in one or more series. The specific terms of each series of debt securities will be described in the particular prospectus supplement relating to that series. The prospectus supplement may or may not modify the general terms found in this prospectus and will be filed with the SEC. For a complete description of the terms of a particular series of debt securities, you should read both this prospectus and the prospectus supplement relating to that particular series.
As required by federal law for all bonds and notes of companies that are publicly offered, our debt securities will be governed by a document called an “indenture.” An indenture is a contract that will be between us and a financial institution acting as trustee on your behalf, and will be subject to and governed by the Trust Indenture Act of 1939, as amended. The trustee will have two main roles. First, the trustee will be able to enforce your rights against us if we default. There are some limitations on the extent to which the trustee acts on your behalf. Second, the trustee will perform certain administrative duties for us. We will file the form of the indenture with the SEC.
The prospectus supplement, which will accompany this prospectus, will describe the particular series of debt securities being offered, including, among other things:
| • | the designation or title of the series of debt securities; |
| • | the total principal amount of the series of debt securities; |
| • | the percentage of the principal amount at which the series of debt securities will be offered; |
| • | the date or dates on which principal will be payable; |
| • | the rate or rates (which may be either fixed or variable) and/or the method of determining such rate or rates of interest, if any; |
| • | the date or dates from which any interest will accrue, or the method of determining such date or dates, and the date or dates on which any interest will be payable; |
| • | the terms for redemption, extension or early repayment, if any; |
| • | the currencies in which the series of debt securities are issued and payable; |
| • | whether the amount of payments of principal, premium or interest, if any, on a series of debt securities will be determined with reference to an index, formula or other method (which could be based on one or more currencies, commodities, equity indices or other indices) and how these amounts will be determined; |
| • | the place or places, if any, of payment, transfer, conversion and/or exchange of the debt securities; |
| • | the denominations in which the offered debt securities will be issued; |
| • | the provision for any sinking fund; |
| • | any restrictive covenants; |
| • | any events of default; |
| • | whether the series of debt securities are issuable in certificated form; |
| • | any provisions for defeasance or covenant defeasance; |
| • | if applicable, U.S. federal income tax considerations relating to original issue discount; |
| • | whether and under what circumstances we will pay additional amounts in respect of any tax, assessment or governmental charge and, if so, whether we will have the option to redeem the debt securities rather than pay the additional amounts (and the terms of this option); |
121
Table of Contents
| • | any provisions for convertibility or exchangeability of the debt securities into or for any other securities; |
| • | whether the debt securities are subject to subordination and the terms of such subordination; |
| • | the listing, if any, on a securities exchange; and |
| • | any other terms. |
The debt securities may be secured or unsecured obligations. Unless the prospectus supplement states otherwise, principal (and premium, if any) and interest, if any, will be paid by us in immediately available funds.
We are permitted, under specified conditions, to issue multiple classes of indebtedness if our asset coverage, as defined in the 1940 Act, is at least equal to 200% immediately after each such issuance. In addition, while any indebtedness and senior securities remain outstanding, we must make provisions to prohibit the distribution to our shareholders or the repurchase of such securities or shares unless we meet the applicable asset coverage ratios at the time of the distribution or repurchase. Specifically, we may be precluded from declaring dividends or repurchasing shares of our common stock unless our asset coverage is at least 200%. We may also borrow amounts up to 5% of the value of our total assets for temporary or emergency purposes without regard to asset coverage.
122
Table of Contents
DESCRIPTION OF OUR SUBSCRIPTION RIGHTS
General
We may issue subscription rights to our shareholders to purchase common stock. Subscription rights may be issued independently or together with any other offered security and may or may not be transferable by the person purchasing or receiving the subscription rights. In connection with a subscription rights offering to our shareholders, we would distribute certificates evidencing the subscription rights and a prospectus supplement to our shareholders on the record date that we set for receiving subscription rights in such subscription rights offering.
The applicable prospectus supplement would describe the following terms of subscription rights in respect of which this prospectus is being delivered:
| • | the period of time the offering would remain open (which shall be open a minimum number of days such that all record holders would be eligible to participate in the offering and shall not be open longer than 120 days); |
| • | the title of such subscription rights; |
| • | the exercise price for such subscription rights (or method of calculation thereof); |
| • | the ratio of the offering (which, in the case of transferable rights, will require a minimum of three shares to be held of record before a person is entitled to purchase an additional share); |
| • | the number of such subscription rights issued to each shareholder; |
| • | the extent to which such subscription rights are transferable and the market on which they may be traded if they are transferable; |
| • | if applicable, a discussion of material U.S. federal income tax considerations applicable to the issuance or exercise of such subscription rights; |
| • | the date on which the right to exercise such subscription rights shall commence, and the date on which such right shall expire (subject to any extension); |
| • | the extent to which such subscription rights include an over-subscription privilege with respect to unsubscribed securities and the terms of such over-subscription privilege; |
| • | any termination right we may have in connection with such subscription rights offering; and |
| • | any other terms of such subscription rights, including exercise, settlement and other procedures and limitations relating to the transfer and exercise of such subscription rights. |
Exercise of Subscription Rights
Each subscription right would entitle the holder of the subscription right to purchase for cash such amount of shares of common stock at such exercise price as shall in each case be set forth in, or be determinable as set forth in, the prospectus supplement relating to the subscription rights offered thereby. Subscription rights may be exercised at any time up to the close of business on the expiration date for such subscription rights set forth in the prospectus supplement. After the close of business on the expiration date, all unexercised subscription rights would become void.
Subscription rights may be exercised as set forth in the prospectus supplement relating to the subscription rights offered thereby. Upon receipt of payment and the subscription rights certificate properly completed and duly executed at the corporate trust office of the subscription rights agent or any other office indicated in the prospectus supplement we will forward, as soon as practicable, the shares of common stock purchasable upon such exercise. To the extent permissible under applicable law, we may determine to offer any unsubscribed
123
Table of Contents
offered securities directly to persons other than shareholders, to or through agents, underwriters or dealers or through a combination of such methods, as set forth in the applicable prospectus supplement.
Under the 1940 Act, we may generally only offer subscription rights (other than rights to subscribe expiring not later than 120 days after their issuance and issued exclusively and ratably to a class or classes of our security holders) on the condition that (1) the subscription rights expire by their terms within ten years; (2) the exercise price is not less than the current market value at the date of issuance; (3) our stockholders authorize the proposal to issue such subscription rights, and a “required” majority of our board of directors approves of such issuance on the basis that the issuance is in the best interests of Medallion Financial Corp. and our stockholders; and (4) if the subscription rights are accompanied by other securities, the subscription rights are not separately transferable unless no class of such subscription rights and the securities accompanying them has been publicly distributed. A “required” majority of our board of directors is a vote of both a majority of our directors who have no financial interest in the transaction and a majority of the directors who are not interested persons of the company. The 1940 Act also provides that the amount of our voting securities that would result from the exercise of all outstanding warrants, options and subscription rights at the time of issuance may not exceed 25% of our outstanding voting securities.
124
Table of Contents
The following is a general description of the terms of the warrants we may issue from time to time. Particular terms of any warrants we offer will be described in the prospectus supplement relating to such warrants.
We may issue warrants to purchase shares of our common stock, preferred stock or debt securities. Such warrants may be issued independently or together with shares of common stock, preferred stock or debt securities and may be attached or separate from such securities. We will issue each series of warrants under a separate warrant agreement to be entered into between us and a warrant agent. The warrant agent will act solely as our agent and will not assume any obligation or relationship of agency for or with holders or beneficial owners of warrants.
A prospectus supplement will describe the particular terms of any series of warrants we may issue, including the following:
| • | the title of such warrants; |
| • | the aggregate number of such warrants; |
| • | the price or prices at which such warrants will be issued; |
| • | the currency or currencies, including composite currencies, in which the price of such warrants may be payable; |
| • | if applicable, the designation and terms of the securities with which the warrants are issued and the number of warrants issued with each such security or each principal amount of such security; |
| • | in the case of warrants to purchase debt securities, the principal amount of debt securities purchasable upon exercise of one warrant and the price at which and the currency or currencies, including composite currencies, in which this principal amount of debt securities may be purchased upon such exercise; |
| • | in the case of warrants to purchase common stock or preferred stock, the number of shares of common stock or preferred stock, as the case may be, purchasable upon exercise of one warrant and the price at which and the currency or currencies, including composite currencies, in which these shares may be purchased upon such exercise; |
| • | the date on which the right to exercise such warrants shall commence and the date on which such right will expire; |
| • | whether such warrants will be issued in registered form or bearer form; |
| • | if applicable, the minimum or maximum amount of such warrants which may be exercised at any one time; |
| • | if applicable, the date on and after which such warrants and the related securities will be separately transferable; |
| • | information with respect to book-entry procedures, if any; |
| • | the terms of the securities issuable upon exercise of the warrants; |
| • | if applicable, a discussion of material U.S. federal income tax considerations; and |
| • | any other terms of such warrants, including terms, procedures and limitations relating to the exchange and exercise of such warrants. |
125
Table of Contents
We and the warrant agent may amend or supplement the warrant agreement for a series of warrants without the consent of the holders of the warrants issued thereunder to effect changes that are not inconsistent with the provisions of the warrants and that do not materially and adversely affect the interests of the holders of the warrants.
Prior to exercising their warrants, holders of warrants will not have any of the rights of holders of the securities purchasable upon such exercise, including, in the case of warrants to purchase debt securities, the right to receive principal, premium, if any, or interest payments, on the debt securities purchasable upon exercise or to enforce covenants in the applicable indenture or, in the case of warrants to purchase common stock or preferred stock, the right to receive dividends, if any, or payments upon our liquidation, dissolution or winding up or to exercise any voting rights.
Under the 1940 Act, we may generally only offer warrants provided that (a) the warrants expire by their terms within ten years, (b) the exercise or conversion price is not less than the current market value at the date of issuance, (c) our shareholders authorize the proposal to issue such warrants, and our board of directors approves such issuance on the basis that the issuance is in the best interests of Medallion Financial Corp. and its shareholders and (d) if the warrants are accompanied by other securities, the warrants are not separately transferable unless no class of such warrants and the securities accompanying them has been publicly distributed. The 1940 Act also provides that the amount of our voting securities that would result from the exercise of all outstanding warrants, as well as options and rights, at the time of issuance may not exceed 25% of our outstanding voting securities.
126
Table of Contents
We may sell the securities in any of three ways (or in any combination): (a) through underwriters or dealers; (b) directly to a limited number of purchasers or to a single purchaser; or (c) through agents. The securities may be sold “at-the-market” to or through a market maker or into an existing trading market for the securities, on an exchange or otherwise. The prospectus supplement will set forth the terms of the offering of such securities, including:
| • | the name or names of any underwriters, dealers or agents and the amounts of securities underwritten or purchased by each of them; |
| • | the offering price of the securities and the proceeds to us and any discounts, commissions or concessions allowed or reallowed or paid to dealers; and |
| • | any securities exchanges on which the securities may be listed. |
Any offering price and any discounts or concessions allowed or reallowed or paid to dealers may be changed from time to time.
If underwriters are used in the sale of any securities, the securities will be acquired by the underwriters for their own account and may be resold from time to time in one or more transactions, including negotiated transactions, at a fixed public offering price or at varying prices determined at the time of sale. The securities may be either offered to the public through underwriting syndicates represented by managing underwriters, or directly by underwriters. Generally, the underwriters’ obligations to purchase the securities will be subject to certain conditions precedent. The underwriters will be obligated to purchase all of the securities if they purchase any of the securities.
The total amount of all items of compensation from whatever source, including compensation paid from offering proceeds and in the form of “trail commissions,” payable to underwriters, broker-dealers, or affiliates thereof who are members of the Financial Industry Regulatory Authority will not exceed an amount that equals 10% of the gross proceeds of the sale of any securities being offered (excluding securities purchased through the reinvestment of dividends).
We may sell the securities through agents from time to time. The prospectus supplement will name any agent involved in the offer or sale of the securities and any commissions we pay to them. Generally, any agent will be acting on a best efforts basis for the period of its appointment.
We may authorize underwriters, dealers or agents to solicit offers by certain purchasers to purchase the securities from us at the public offering price set forth in the prospectus supplement pursuant to delayed delivery contracts providing for payment and delivery on a specified date in the future. The contracts will be subject only to those conditions set forth in the prospectus supplement, and the prospectus supplement will set forth any commissions we pay for soliciting these contracts.
Agents and underwriters may be entitled to indemnification by us against certain civil liabilities, including liabilities under the Securities Act of 1933 or to contribution with respect to payments which the agents or underwriters may be required to make in respect thereof. Agents and underwriters may be customers of, engage in transactions with, or perform services for us in the ordinary course of business.
We may enter into derivative transactions with third parties, or sell securities not covered by this prospectus to third parties in privately negotiated transactions. If the applicable prospectus supplement indicates, in connection with those derivatives, the third parties may sell securities covered by this prospectus and the applicable prospectus supplement, including in short sale transactions. If so, the third party may use securities pledged by us or borrowed from us or others to settle those sales or to close out any related open borrowings of
127
Table of Contents
stock, and may use securities received from us in settlement of those derivatives to close out any related open borrowings of stock. The third party in such sale transactions will be an underwriter and, if not identified in this prospectus, will be identified in the applicable prospectus supplement (or a post-effective amendment). We or one of our affiliates may loan or pledge securities to a financial institution or other third party that in turn may sell the securities using this prospectus. Such financial institution or third party may transfer its short position to investors in our securities or in connection with a simultaneous offering of other securities offered by this prospectus or otherwise.
Certain legal matters regarding the securities offered by this prospectus will be passed upon for us by Willkie Farr & Gallagher LLP, New York, New York. Mario M. Cuomo, of counsel in the firm of Willkie Farr & Gallagher LLP, is one of our directors.
The financial statements for the years ended December 31, 2012, 2011 and 2010 included in this prospectus and elsewhere in this registration statement have been audited by WeiserMazars LLP, 135 West 50th Street, New York, NY 10020, an independent registered public accounting firm, as indicated in their reports with respect thereto, and are included herein in reliance upon the authority of said firm as experts in accounting and auditing in giving said reports.
CUSTODIAN, TRANSFER AGENT, DIVIDEND DISBURSING AGENT, AND REGISTRAR
American Stock Transfer & Trust Company, LLC, 6201 15th Avenue, Brooklyn, New York 11219, serves as the custodian, transfer agent, dividend disbursing agent, and registrar for our common stock.
BROKERAGE ALLOCATION AND OTHER PRACTICES
Since we generally acquire and dispose of our investments in privately negotiated transactions, we infrequently use brokers in the normal course of our business. From January 1, 2010 through June 30, 2013, we have paid less than $50,000 in brokerage commissions. Subject to policies established by our Board of Directors, management is primarily responsible for the execution of the publicly traded securities portion of our portfolio transactions and the allocation of brokerage commissions. We do not execute transactions through any particular broker or dealer, but seek to obtain the best net results, taking into account such factors as price (including the applicable brokerage commission or dealer spread), size of order, difficulty of execution, and operational facilities of the firm and the firm’s risk and skill in positioning blocks of securities. While we generally seek reasonably competitive trade execution costs, we will not necessarily pay the lowest spread or commission available. Subject to applicable legal requirements, we may select a broker based partly upon brokerage or research services provided to management. In return for such services, we may pay a higher commission than other brokers would charge if our management determines in good faith that such commission is reasonable in relation to the services provided.
128
Table of Contents
F-1
Table of Contents
REPORT OF INDEPENDENT REGISTERED PUBLIC ACCOUNTING FIRM
To the Board of Directors and Shareholders of Medallion Financial Corp.
We have audited the accompanying consolidated balance sheets of Medallion Financial Corp. and subsidiaries (the “Company”), including the consolidated summary schedule of investments, as of December 31, 2012 and 2011, and the related consolidated statements of operations, changes in net assets, and cash flows for each of the three years in the three-year period ended December 31, 2012 and the selected financial ratios and other data (see note 13) for each of the five years in the five-year period ended December 31, 2012. We have also audited the consolidated schedules of investments in and advances to affiliates as of and for the years ended December 31, 2012 and 2011. These consolidated financial statements, selected financial ratios and other data, and schedules are the responsibility of the Company’s management. Our responsibility is to express an opinion on these consolidated financial statements, selected financial ratios and other data, and schedules based on our audits.
We conducted our audits in accordance with the standards of the Public Company Accounting Oversight Board (United States). Those standards require that we plan and perform the audit to obtain reasonable assurance about whether the consolidated financial statements, selected financial ratios and other data, and schedules are free of material misstatement. An audit includes examining, on a test basis, evidence supporting the amounts and disclosures in the consolidated financial statements. Our procedures included confirmation of securities owned as of December 31, 2012 and 2011, and the performance of other auditing procedures when applicable. An audit also includes assessing the accounting principles used and significant estimates made by management, as well as evaluating the overall consolidated financial statement presentation. We believe that our audits provide a reasonable basis for our opinion.
In our opinion, the consolidated financial statements and the selected financial ratios and other data referred to above present fairly, in all material respects, the consolidated financial position of the Company as of December 31, 2012 and 2011, and the consolidated results of their operations, changes in net assets, and cash flows for each of the three years in the three-year period ended December 31, 2012 and the selected financial ratios and other data for each of the five years in the five-year period ended December 31, 2012, in conformity with US generally accepted accounting principles. Also, in our opinion, the consolidated schedules of investments in and advances to affiliates, when considered in relation to the basic consolidated financial statements taken as a whole, present fairly, in all material respects, the information set forth therein.
We have also audited, in accordance with the standards of the Public Company Accounting Oversight Board (United States), the Company’s internal control over financial reporting as of December 31, 2012, based on the criteria established in Internal Control- Integrated Framework Issued by the Committee of Sponsoring Organizations of the Treadway Commission (“COSO”), and our report dated March 12, 2013 expressed an unqualified opinion on the effectiveness of the Company’s internal control over financial reporting.
/s/ WeiserMazars LLP
New York, New York
March 12, 2013
F-2
Table of Contents
REPORT OF INDEPENDENT REGISTERED PUBLIC ACCOUNTING FIRM
To the Board of Directors and Shareholders of Medallion Financial Corp.
We have audited Medallion Financial Corp. and subsidiaries’ (the “Company”) internal control over financial reporting as of December 31, 2012, based on criteria established in Internal Control—Integrated Framework issued by the Committee of Sponsoring Organizations of the Treadway Commission (“COSO”). The Company’s management is responsible for maintaining effective internal control over financial reporting and for its assessment of the effectiveness of internal control over financial reporting, included in the accompanying Management’s Annual Report on Internal Control over Financial Reporting. Our responsibility is to express an opinion on the Company’s internal control over financial reporting based on our audit.
We conducted our audit in accordance with the standards of the Public Company Accounting Oversight Board (United States). Those standards require that we plan and perform the audit to obtain reasonable assurance about whether effective internal control over financial reporting was maintained in all material respects. Our audit included obtaining an understanding of internal control over financial reporting, assessing the risk that a material weakness exists, and testing and evaluating the design and operating effectiveness of internal control, based on the assessed risk, and performing such other procedures as we considered necessary in the circumstances. We believe that our audit provides a reasonable basis for our opinion.
A Company’s internal control over financial reporting is a process designed to provide reasonable assurance regarding the reliability of financial reporting and the preparation of financial statements for external purposes in accordance with generally accepted accounting principles. A Company’s internal control over financial reporting includes those policies and procedures that (1) pertain to the maintenance of records that, in reasonable detail, accurately and fairly reflect the transactions and dispositions of the assets of the Company (2) provide reasonable assurance that transactions are recorded as necessary to permit preparation of financial statements in accordance with generally accepted accounting principles, and that receipts and expenditures of the Company are being made only in accordance with authorizations of management and directors of the Company; and (3) provide reasonable assurance regarding prevention or timely detection of unauthorized acquisition, use, or disposition of the Company’s assets that could have a material effect on the financial statements.
Because of its inherent limitations, internal control over financial reporting may not prevent or detect misstatements. Also, projections of any evaluation of effectiveness to future periods are subject to the risk that controls may become inadequate because of changes in conditions, or that the degree of compliance with the policies and procedures may deteriorate.
In our opinion, the Company maintained, in all material respects, effective internal control over financial reporting as of December 31, 2012, based on criteria established in Internal Control-Integrated Framework issued by the Committee of Sponsoring Organizations of the Treadway Commission (“COSO”).
We also have audited, in accordance with the standards of the Public Company Accounting Oversight Board (United States), the consolidated balance sheets of the Company including the consolidated summary schedule of investments, as of December 31, 2012 and 2011, and the related consolidated statements of operations, changes in net assets, and cash flows for each of the three years in the three-year period ended December 31, 2012, and the selected financial ratios and other data for each of the five years in the five-year period ended December 31, 2012, and our report dated March 12, 2013 expressed an unqualified opinion on those consolidated financial statements.
/s/ WeiserMazars LLP
New York, New York
March 12, 2013
F-3
Table of Contents
MEDALLION FINANCIAL CORP.
CONSOLIDATED STATEMENTS OF OPERATIONS
| Year Ended December 31, | ||||||||||||
| (Dollars in thousands, except per share data) |
2012 | 2011 | 2010 | |||||||||
| Interest income on investments |
$ | 20,301 | $ | 30,225 | $ | 31,918 | ||||||
| Dividends and interest income on short-term investments(1) |
10,570 | 5,606 | 4,111 | |||||||||
| Medallion lease income |
1,473 | 1,396 | 1,224 | |||||||||
|
|
|
|
|
|
|
|||||||
| Total investment income |
32,344 | 37,227 | 37,253 | |||||||||
|
|
|
|
|
|
|
|||||||
| Total interest expense(2) |
10,858 | 13,538 | 14,585 | |||||||||
|
|
|
|
|
|
|
|||||||
| Net interest income |
21,486 | 23,689 | 22,668 | |||||||||
|
|
|
|
|
|
|
|||||||
| Total noninterest income |
1,135 | 1,185 | 3,533 | |||||||||
|
|
|
|
|
|
|
|||||||
| Salaries and benefits |
8,862 | 8,480 | 10,539 | |||||||||
| Professional fees |
1,381 | 1,515 | 2,339 | |||||||||
| Occupancy expense |
828 | 911 | 1,330 | |||||||||
| Other operating expenses(3) |
2,785 | 3,205 | 2,120 | |||||||||
|
|
|
|
|
|
|
|||||||
| Total operating expenses |
13,856 | 14,111 | 16,328 | |||||||||
|
|
|
|
|
|
|
|||||||
| Net investment income before income taxes(1) (4) |
8,765 | 10,763 | 9,873 | |||||||||
| Income tax (provision) benefit |
— | — | — | |||||||||
|
|
|
|
|
|
|
|||||||
| Net investment income after income taxes |
8,765 | 10,763 | 9,873 | |||||||||
|
|
|
|
|
|
|
|||||||
| Net realized losses on investments |
(6,731 | ) | (546 | ) | (7,638 | ) | ||||||
|
|
|
|
|
|
|
|||||||
| Net change in unrealized appreciation (depreciation) on investments |
14,587 | 1,278 | (3,491 | ) | ||||||||
| Net change in unrealized appreciation on Medallion Bank and other controlled subsidiaries |
7,896 | 7,668 | 12,535 | |||||||||
|
|
|
|
|
|
|
|||||||
| Net unrealized appreciation on investments |
22,483 | 8,946 | 9,044 | |||||||||
|
|
|
|
|
|
|
|||||||
| Net realized/unrealized gains on investments |
15,752 | 8,400 | 1,406 | |||||||||
|
|
|
|
|
|
|
|||||||
| Net increase in net assets resulting from operations |
$ | 24,517 | $ | 19,163 | $ | 11,279 | ||||||
|
|
|
|
|
|
|
|||||||
| Net increase in net assets resulting from operations per common share |
||||||||||||
| Basic |
$ | 1.23 | $ | 1.10 | $ | 0.64 | ||||||
| Diluted |
$ | 1.21 | $ | 1.09 | $ | 0.64 | ||||||
|
|
|
|
|
|
|
|||||||
| Dividends declared per share |
$ | 0.85 | $ | 0.74 | $ | 0.61 | ||||||
|
|
|
|
|
|
|
|||||||
| Weighted average common shares outstanding |
||||||||||||
| Basic |
19,912,883 | 17,426,097 | 17,501,414 | |||||||||
| Diluted |
20,180,694 | 17,659,831 | 17,631,928 | |||||||||
|
|
|
|
|
|
|
|||||||
| (1) | Includes $10,500, $5,500, and $4,000 of dividend income in 2012, 2011, and 2010 from Medallion Bank. |
| (2) | Average borrowings outstanding were $314,380, $359,659, and $366,643, and the related average borrowing costs were 3.45%, 3.76%, and 3.98% for the years ended December 31, 2012, 2011, and 2010. |
| (3) | Includes $1,312 of expense reversals related to the costs of winding up the operations of the SPAC’s that were reclassified to realized losses on investments and $310 that was reversed as a result of favorable negotiations with the creditors of SPAC in 2010. See notes 10 and 12 for additional information. |
| (4) | Includes $717, $889, and $3,422 of net revenues received from Medallion Bank for the years ended December 31, 2012, 2011, and 2010 primarily for servicing fees, loan origination fees, and expense reimbursements. See notes 3 and 10 for additional information. |
The accompanying notes should be read in conjunction with these consolidated financial statements.
F-4
Table of Contents
MEDALLION FINANCIAL CORP.
| (Dollars in thousands, except per share data) |
December 31, 2012 | December 31, 2011 | ||||||
| Assets |
||||||||
| Medallion loans, at fair value |
$ | 294,388 | $ | 307,167 | ||||
| Commercial loans, at fair value(1) |
56,919 | 54,159 | ||||||
| Investment in Medallion Bank and other controlled subsidiaries, at fair value |
99,083 | 85,932 | ||||||
| Equity investments, at fair value |
4,620 | 4,577 | ||||||
| Investment securities, at fair value |
— | — | ||||||
|
|
|
|
|
|||||
| Net investments ($236,357 at December 31, 2012 and $252,660 at December 31, 2011 pledged as collateral under borrowing arrangements) |
455,010 | 451,835 | ||||||
| Cash and cash equivalents ($0 at December 31, 2012 and 2011 restricted as to use by lender) |
26,875 | 29,352 | ||||||
| Accrued interest receivable |
957 | 1,120 | ||||||
| Fixed assets, net |
601 | 466 | ||||||
| Goodwill, net |
5,069 | 5,069 | ||||||
| Other assets, net |
54,953 | 49,189 | ||||||
|
|
|
|
|
|||||
| Total assets |
$ | 543,465 | $ | 537,031 | ||||
|
|
|
|
|
|||||
| Liabilities |
||||||||
| Accounts payable and accrued expenses |
$ | 3,144 | $ | 6,040 | ||||
| Accrued interest payable |
1,233 | 1,708 | ||||||
| Funds borrowed |
322,770 | 357,779 | ||||||
|
|
|
|
|
|||||
| Total liabilities |
327,147 | 365,527 | ||||||
|
|
|
|
|
|||||
| Commitments and contingencies |
— | — | ||||||
| Shareholders’ equity (net assets) |
||||||||
| Preferred stock (1,000,000 shares of $0.01 par value stock authorized—none outstanding) |
— | — | ||||||
| Common stock (50,000,000 shares of $0.01 par value stock authorized—23,251,937 shares at December 31, 2012 and 19,320,303 shares at December 31, 2011 issued) |
233 | 193 | ||||||
| Treasury stock at cost (1,600,733 shares at December 31, 2012 and 2011) |
(14,304 | ) | (14,304 | ) | ||||
| Capital in excess of par value |
217,621 | 180,981 | ||||||
| Accumulated undistributed net investment loss |
(13,189 | ) | (6,737 | ) | ||||
| Accumulated undistributed net realized gains on investments |
— | — | ||||||
| Net unrealized appreciation on investments |
25,957 | 11,371 | ||||||
|
|
|
|
|
|||||
| Total shareholders’ equity (net assets) |
216,318 | 171,504 | ||||||
|
|
|
|
|
|||||
| Total liabilities and shareholders’ equity |
$ | 543,465 | $ | 537,031 | ||||
|
|
|
|
|
|||||
| Number of common shares outstanding |
21,651,204 | 17,719,570 | ||||||
| Net asset value per share |
$ | 9.99 | $ | 9.68 | ||||
|
|
|
|
|
|||||
| (1) | Includes a $3,081 loan to an entity which is majority owned by one of our controlled subsidiaries. |
The accompanying notes should be read in conjunction with these consolidated financial statements.
F-5
Table of Contents
MEDALLION FINANCIAL CORP.
CONSOLIDATED STATEMENTS OF CHANGES IN NET ASSETS
| Year Ended December 31, | ||||||||||||
| (Dollars in thousands, except per share data) |
2012 | 2011 | 2010 | |||||||||
| Net investment income after income taxes |
$ | 8,765 | $ | 10,763 | $ | 9,873 | ||||||
| Net realized losses on investments |
(6,731 | ) | (546 | ) | (7,638 | ) | ||||||
| Net unrealized appreciation on investments |
22,483 | 8,946 | 9,044 | |||||||||
|
|
|
|
|
|
|
|||||||
| Net increase in net assets resulting from operations |
24,517 | 19,163 | 11,279 | |||||||||
|
|
|
|
|
|
|
|||||||
| Investment income, net |
(7,695 | ) | (12,251 | ) | (10,511 | ) | ||||||
| Return of capital |
(8,688 | ) | — | — | ||||||||
| Realized gains from investment transactions, net |
— | — | — | |||||||||
|
|
|
|
|
|
|
|||||||
| Dividends and distributions to shareholders(1) |
(16,383 | ) | (12,251 | ) | (10,511 | ) | ||||||
|
|
|
|
|
|
|
|||||||
| Issuance of common stock(2) |
34,655 | — | — | |||||||||
| Stock—based compensation expense |
910 | 228 | 223 | |||||||||
| Exercise of stock options |
1,115 | 1,677 | 10 | |||||||||
| Treasury stock acquired |
— | (78 | ) | (1,213 | ) | |||||||
|
|
|
|
|
|
|
|||||||
| Capital share transactions |
36,680 | 1,827 | (980 | ) | ||||||||
|
|
|
|
|
|
|
|||||||
| Total increase (decrease) in net assets |
44,814 | 8,739 | (212 | ) | ||||||||
| Net assets at the beginning of the year |
171,504 | 162,765 | 162,977 | |||||||||
|
|
|
|
|
|
|
|||||||
| Net assets at the end of the year(3) |
$ | 216,318 | $ | 171,504 | $ | 162,765 | ||||||
|
|
|
|
|
|
|
|||||||
| Capital share activity |
||||||||||||
| Common stock issued, beginning of year |
19,320,303 | 18,992,319 | 18,990,119 | |||||||||
| Issuance of common stock(2) |
3,500,000 | — | — | |||||||||
| Exercise of stock options |
210,610 | 248,316 | 2,200 | |||||||||
| Issuance of restricted stock, net |
221,024 | 79,668 | — | |||||||||
|
|
|
|
|
|
|
|||||||
| Common stock issued, end of year |
23,251,937 | 19,320,303 | 18,992,319 | |||||||||
|
|
|
|
|
|
|
|||||||
| Treasury stock, beginning of year |
(1,600,733 | ) | (1,592,086 | ) | (1,414,242 | ) | ||||||
| Treasury stock acquired |
— | (8,647 | ) | (177,844 | ) | |||||||
|
|
|
|
|
|
|
|||||||
| Treasury stock, end of year |
(1,600,733 | ) | (1,600,733 | ) | (1,592,086 | ) | ||||||
|
|
|
|
|
|
|
|||||||
| Common stock outstanding |
21,651,204 | 17,719,570 | 17,400,233 | |||||||||
|
|
|
|
|
|
|
|||||||
| (1) | Dividends declared were $0.85, $0.74, and $0.61 per share for the years ended December 31, 2012, 2011, and 2010. |
| (2) | On May 21, 2012, the Company sold 3,500,000 shares at an offering price of $10.72 per share, resulting in net proceeds after closing costs, underwriting commissions, etc. of $34,655 as of December 31, 2012. |
| (3) | Includes $0, $1,134, and $2,941 of undistributed net investment income and $0, $0, and $0 of undistributed net realized gains on investments at December 31, 2012, 2011, and 2010. |
The accompanying notes should be read in conjunction with these consolidated financial statements.
F-6
Table of Contents
MEDALLION FINANCIAL CORP.
CONSOLIDATED STATEMENTS OF CASH FLOWS
| Year ended December 31, | ||||||||||||
| (Dollars in thousands) |
2012 | 2011 | 2010 | |||||||||
| CASH FLOWS FROM OPERATING ACTIVITIES |
||||||||||||
| Net increase in net assets resulting from operations |
$ | 24,517 | $ | 19,163 | $ | 11,279 | ||||||
| Adjustments to reconcile net increase in net assets resulting from operations to net cash provided by operating activities: |
||||||||||||
| Depreciation and amortization |
1,218 | 1,316 | 1,421 | |||||||||
| (Accretion) amortization of origination costs, net |
132 | 58 | (333 | ) | ||||||||
| Increase in net unrealized (appreciation) depreciation on investments |
(14,587 | ) | (1,278 | ) | 3,491 | |||||||
| Increase in unrealized appreciation on Medallion Bank and other controlled subsidiaries |
(7,896 | ) | (7,668 | ) | (12,535 | ) | ||||||
| Net realized losses on investments |
6,731 | 546 | 7,638 | |||||||||
| Stock-based compensation expense |
910 | 228 | 223 | |||||||||
| Decrease in accrued interest receivable |
164 | 321 | 220 | |||||||||
| (Increase) decrease in other assets, net |
2,303 | (4,012 | ) | (2,025 | ) | |||||||
| Increase (decrease) in accounts payable and accrued expenses |
(2,897 | ) | 939 | (2,366 | ) | |||||||
| Decrease in accrued interest payable |
(475 | ) | (206 | ) | (294 | ) | ||||||
|
|
|
|
|
|
|
|||||||
| Net cash provided by operating activities |
10,120 | 9,407 | 6,719 | |||||||||
|
|
|
|
|
|
|
|||||||
| CASH FLOWS FROM INVESTING ACTIVITIES |
||||||||||||
| Investments originated |
(169,051 | ) | (198,084 | ) | (219,737 | ) | ||||||
| Proceeds from principal receipts, sales, and maturities of investments |
177,632 | 233,875 | 213,139 | |||||||||
| (Investments in) capital returned by Medallion Bank and other controlled subsidiaries, net |
(5,255 | ) | 474 | (2,179 | ) | |||||||
| Capital expenditures |
(301 | ) | (216 | ) | (336 | ) | ||||||
|
|
|
|
|
|
|
|||||||
| Net cash provided by (used for) investing activities |
3,025 | 36,049 | (9,113 | ) | ||||||||
|
|
|
|
|
|
|
|||||||
| CASH FLOWS FROM FINANCING ACTIVITIES |
||||||||||||
| Proceeds from funds borrowed |
100,325 | 201,689 | 173,790 | |||||||||
| Repayments of funds borrowed |
(125,584 | ) | (213,879 | ) | (167,780 | ) | ||||||
| Issuance of SBA debentures |
5,000 | 7,485 | 8,500 | |||||||||
| Repayments of SBA debentures |
(14,750 | ) | (18,050 | ) | (16,500 | ) | ||||||
| Proceeds from issuance of common stock, net |
34,655 | — | — | |||||||||
| Proceeds from exercise of stock options |
1,115 | 1,677 | 10 | |||||||||
| Purchase of treasury stock at cost |
— | (78 | ) | (1,213 | ) | |||||||
| Payments of declared dividends |
(16,383 | ) | (12,251 | ) | (10,511 | ) | ||||||
|
|
|
|
|
|
|
|||||||
| Net cash used for financing activities |
(15,622 | ) | (33,407 | ) | (13,704 | ) | ||||||
|
|
|
|
|
|
|
|||||||
| NET INCREASE (DECREASE) IN CASH AND CASH EQUIVALENTS |
(2,477 | ) | 12,049 | (16,098 | ) | |||||||
| CASH and cash equivalents, beginning of year |
29,352 | 17,303 | 33,401 | |||||||||
|
|
|
|
|
|
|
|||||||
| CASH and cash equivalents, end of year |
$ | 26,875 | $ | 29,352 | $ | 17,303 | ||||||
|
|
|
|
|
|
|
|||||||
| SUPPLEMENTAL INFORMATION |
||||||||||||
| Cash paid during the year for interest |
$ | 10,280 | $ | 12,598 | $ | 13,676 | ||||||
| Cash paid during the year for income taxes |
— | — | — | |||||||||
| Non-cash investing activities-net transfers to (from) other assets |
— | 303 | — | |||||||||
|
|
|
|
|
|
|
|||||||
The accompanying notes should be read in conjunction with these consolidated financial statements.
F-7
Table of Contents
MEDALLION FINANCIAL CORP.
NOTES TO CONSOLIDATED FINANCIAL STATEMENTS
DECEMBER 31, 2012
(1) ORGANIZATION OF MEDALLION FINANCIAL CORP. AND ITS SUBSIDIARIES
We, Medallion Financial Corp. (the Company), are a closed-end management investment company organized as a Delaware corporation. The Company has elected to be regulated as a business development company (BDC) under the Investment Company Act of 1940, as amended (the 1940 Act). The Company conducts its business through various wholly-owned subsidiaries including its primary operating company, Medallion Funding LLC (MFC), a Small Business Investment Company (SBIC) which originates and services taxicab medallion and commercial loans.
In December 2010, we formed a wholly-owned portfolio company, Medallion Servicing Corporation (MSC), to provide loan services to Medallion Bank, also a portfolio company wholly-owned by us. We have assigned all of our loan servicing rights for Medallion Bank, which consists of servicing taxi medallion and commercial loans originated by Medallion Bank, to MSC, who bills and collects the related service fee income from Medallion Bank, and is allocated and charged by the Company for MSC’s share of these servicing costs.
On March 26, 2009, the Company formed a new wholly-owned New York limited liability company subsidiary, Medallion Funding LLC. On February 26, 2010, Medallion Funding Corp. merged into Medallion Funding LLC and following the merger, Medallion Funding LLC was the surviving entity and the successor-in-interest to Medallion Funding Corp.’s business. There was no business or operational change resulting from this corporate restructuring. For federal and most state tax purposes, Medallion Funding LLC is treated as a disregarded entity, and is subsumed in the tax return of the Company. Medallion Funding LLC maintains its status as an SBIC.
The Company also conducts business through Medallion Capital, Inc. (MCI), an SBIC which conducts a mezzanine financing business, and Freshstart Venture Capital Corp. (FSVC), an SBIC which originates and services taxicab medallion and commercial loans. MFC, MCI, and FSVC, as SBICs, are regulated by the Small Business Administration (SBA). MCI and FSVC are financed in part by the SBA. The Company also conducts business through our asset-based lending division, Medallion Business Credit (MBC), an originator of loans to small businesses for the purpose of financing inventory and receivables.
In December 2008, MFC established a wholly-owned subsidiary, Taxi Medallion Loan Trust III (Trust III), for the purpose of owning medallion loans originated by MFC or others. Trust III is a separate legal and corporate entity with its own creditors who, in any liquidation of Trust III, will be entitled to be satisfied out of Trust III’s assets prior to any value in Trust III becoming available to Trust III’s equity holders. The assets of Trust III, aggregating $204,807,000 at December 31, 2012, are not available to pay obligations of its affiliates or any other party, and the assets of affiliates or any other party are not available to pay obligations of Trust III. Trust III’s loans are serviced by MFC.
In June 2007, the Company established a wholly-owned subsidiary, Medallion Financing Trust I (Fin Trust) for the purpose of issuing unsecured preferred securities to investors. Fin Trust is a separate legal and corporate entity with its own creditors who, in any liquidation of Fin Trust, will be entitled to be satisfied out of Fin Trust’s assets prior to any value in Fin Trust becoming available to Fin Trust’s equity holders. The assets of Fin Trust, aggregating $36,160,000 at December 31, 2012, are not available to pay obligations of its affiliates or any other party, and the assets of affiliates or any other party are not available to pay obligations of Fin Trust.
In December 2006, MFC established a wholly-owned subsidiary, Taxi Medallion Loan Trust II (Trust II), for the purpose of owning medallion loans originated by MFC or others. Trust II was a separate legal and corporate entity with its own creditors who, in any liquidation of Trust II, would have been entitled to be satisfied out of Trust II’s assets prior to any value in Trust II becoming available to Trust II’s equity holders. In 2010, Trust II ceased operations and its assets were reduced to $0.
F-8
Table of Contents
In December 2006, September 2006, and previously in June 2003, MFC through several wholly-owned and newly formed subsidiaries which, along with an existing subsidiary (together, Medallion Chicago), purchased certain City of Chicago taxicab medallions out of foreclosure which are leased to fleet operators while being held for sale. The 159 medallions are carried at a fair value of $43,588,000 in other assets on the consolidated balance sheet at December 31, 2012, compared to $34,078,000 a year ago.
A wholly-owned portfolio investment, Medallion Bank, a Federal Deposit Insurance Corporation (FDIC) insured industrial bank, originates medallion loans, commercial loans, and consumer loans, raises deposits, and conducts other banking activities (see Note 3). Medallion Bank is subject to competition from other financial institutions and to the regulations of certain federal and state agencies, and undergoes examinations by those agencies.
Medallion Bank is not an investment company, and therefore, is not consolidated with the Company, but instead is treated as a portfolio investment. It was initially formed for the primary purpose of originating commercial loans in three categories: 1) loans to finance the purchase of taxicab medallions (licenses), 2) asset-based commercial loans, and 3) SBA 7(a) loans. The loans are marketed and serviced by Medallion Bank’s affiliates who have extensive prior experience in these asset groups. Additionally, Medallion Bank began issuing brokered certificates of deposit in January 2004, and purchased over $84,150,000 of taxicab medallion and asset-based loans from affiliates of the Company. On April 1, 2004, Medallion Bank purchased a consumer loan portfolio from an unrelated financial institution for consideration of $86,309,000. In the 2004 third quarter, Medallion Bank began originating consumer loans similar to the acquired portfolio, which are serviced by a third party.
(2) SUMMARY OF SIGNIFICANT ACCOUNTING POLICIES
Use of Estimates
The preparation of the consolidated financial statements in conformity with accounting principles generally accepted in the US requires management to make estimates that affect the amounts reported in the consolidated financial statements and the accompanying notes. Accounting estimates and assumptions are those that management considers to be the most critical to an understanding of the consolidated financial statements because they inherently involve significant judgments and uncertainties. All of these estimates reflect management’s best judgment about current economic and market conditions and their effects based on information available as of the date of these consolidated financial statements. If such conditions persist longer or deteriorate further than expected, it is reasonably possible that the judgments and estimates could change, which may result in future impairments of loans receivable, loans held for sale, and investments, among other effects.
Principles of Consolidation
The consolidated financial statements include the accounts of the Company and its wholly-owned subsidiaries, except for Medallion Bank and other portfolio investments. All significant intercompany transactions, balances, and profits have been eliminated in consolidation. As a non-investment company, Medallion Bank is not consolidated with the Company, which is an investment company under the 1940 Act. See Note 3 for the presentation of financial information for Medallion Bank and other controlled subsidiaries.
Cash and Cash Equivalents
The Company considers all highly liquid instruments with an original purchased maturity of three months or less to be cash equivalents. Cash balances are generally held in accounts at large national or regional banking organizations in amounts that frequently exceed the federally insured limits, and includes $1,000,000 related to a compensating balance requirement of a regional banking organization.
F-9
Table of Contents
Fair Value of Assets and Liabilities
The Company follows FASB Accounting Standards Codification Topic 820, Fair Value Measurements and Disclosures, (FASB ASC 820), which defines fair value, establishes a framework for measuring fair value, and expands disclosures about fair value measurements. FASB ASC 820 defines fair value as an exit price (i.e. a price that would be received to sell, as opposed to acquire, an asset or transfer a liability), and emphasizes that fair value is a market-based measurement. It establishes a fair value hierarchy that distinguishes between assumptions developed based on market data obtained from independent external sources and the reporting entities own assumptions. Further, it specifies that fair value measurement should consider adjustment for risk, such as the risk inherent in the valuation technique or its inputs. See also Notes 2, 15, and 16 to the consolidated financial statements.
Investment Valuation
The Company’s loans, net of participations and any unearned discount, are considered investment securities under the 1940 Act and are recorded at fair value. As part of the fair value methodology, loans are valued at cost adjusted for any unrealized appreciation (depreciation). Since no ready market exists for these loans, the fair value is determined in good faith by the Board of Directors. In determining the fair value, the Board of Directors considers factors such as the financial condition of the borrower, the adequacy of the collateral, individual credit risks, historical loss experience, and the relationships between current and projected market rates and portfolio rates of interest and maturities. Foreclosed properties, which represent collateral received from defaulted borrowers, and which are carried in other assets on the consolidated balance sheet, are valued similarly.
Equity investments (common stock and stock warrants, including certain controlled subsidiary portfolio investments) and investment securities (US Treasuries and mortgage backed bonds), in total representing 23% and 20% of the investment portfolio at December 31, 2012 and 2011, are recorded at fair value, represented as cost, plus or minus unrealized appreciation or depreciation. The fair value of investments that have no ready market are determined in good faith by the Board of Directors, based upon the financial condition and operating performance of the underlying investee companies as well as general market trends for businesses in the same industry. Included in equity investments were marketable securities of $811,000 and $2,456,000 at December 31, 2012 and 2011, and non-marketable securities of $3,809,000 and $2,121,000 in the comparable periods. The $99,083,000 and $85,932,000 related to portfolio investments in controlled subsidiaries at December 31, 2012 and 2011 were all non-marketable in each period. Because of the inherent uncertainty of valuations, the Board of Directors’ estimates of the values of the investments may differ significantly from the values that would have been used had a ready market for the investments existed, and the differences could be material.
Our investment in Medallion Bank, as a wholly owned portfolio investment, is also subject to quarterly assessments of fair value. We conduct a thorough valuation analysis as described previously, and determine whether any factors give rise to a valuation different than recorded book value, including various regulatory restrictions that were established at Medallion Bank’s inception, by the FDIC and State of Utah, and also by additional regulatory restrictions, such as on the current moratorium imposed by the Dodd-Frank Act on the acquisition of control of an industrial bank by a “commercial firm” (a company whose gross revenues are primarily derived from non-financial activities) before July 2013. Because of these restrictions and other factors, our Board of Directors has determined that Medallion Bank has little value beyond its recorded book value. As a result of this valuation process, we used Medallion Bank’s actual results of operations as the best estimate of changes in- fair value, and recorded the results as a component of unrealized appreciation (depreciation) on investments, although changes in these restrictions and other applicable factors could change these conclusions in the future. See Note 3 for additional information about Medallion Bank.
A majority of the Company’s investments consist of long-term loans to persons defined by SBA regulations as socially or economically disadvantaged, or to entities that are at least 50% owned by such persons. Approximately 65% and 68% of the Company’s investment portfolio at December 31, 2012 and 2011 had arisen in connection with the financing of taxicab medallions, taxicabs, and related assets, of which 71% and 74% were
F-10
Table of Contents
in New York City at December 31, 2012 and 2011. These loans are secured by the medallions, taxicabs, and related assets, and are personally guaranteed by the borrowers, or in the case of corporations, are generally guaranteed personally by the owners. A portion of the Company’s portfolio (12% at December 31, 2012 and 2011) represents loans to various commercial enterprises in a wide variety of industries, including manufacturing, administrative and support services, accommodation and food services, retail trade and various other industries. Approximately 31% of these loans are made primarily in the metropolitan New York City area, with the balance widely scattered across the United States. Investments in controlled unconsolidated subsidiaries, equity investments, and investment securities were 22%, 1%, and 0% at December 31, 2012, and 19%, 1%, and 0% at December 31, 2011.
On a managed basis, which includes the investments of Medallion Bank after eliminating the Company’s investment in Medallion Bank, medallion loans were 60% and 63% at December 31, 2012 and 2011 (78% in New York City), commercial loans were 12% and 13%, and 25% and 20% were consumer loans in all 50 states collateralized by recreational vehicles, boats, motorcycles, trailers, and home improvements. Investment securities were 2% and 3% at December 31, 2012 and 2011, and equity investments (including investments in controlled subsidiaries) were 1% at both year ends.
Investment Transactions and Income Recognition
Loan origination fees and certain direct origination costs are deferred and recognized as an adjustment to the yield of the related loans. At December 31, 2012 and 2011, net loan origination costs were $127,000 and $304,000. Net amortization income (expense) for the years ended December 31, 2012, 2011, and 2010 was $132,000, $58,000, and $333,000.
Investment securities are purchased from time-to-time in the open market at prices that are greater or lesser than the par value of the investment. The resulting premium or discount is deferred and recognized as an adjustment to the yield of the related investment. At December 31, 2012 and 2011, there were no premiums or discounts on investment securities, and their related income accretion or amortization was immaterial for 2012, 2011, and 2010.
Interest income is recorded on the accrual basis. Taxicab medallion and commercial loans are placed on nonaccrual status, and all uncollected accrued interest is reversed, when there is doubt as to the collectability of interest or principal, or if loans are 90 days or more past due, unless management has determined that they are both well-secured and in the process of collection. Interest income on nonaccrual loans is generally recognized when cash is received, unless a determination has been made to apply all cash receipts to principal. At December 31, 2012, 2011, and 2010, total non-accrual loans were $20,607,000, $25,795,000, and $22,477,000, and represented 6%, 7%, and 5% of the gross medallion and commercial loan portfolio at each year end, and were primarily concentrated in the secured mezzanine portfolio. The amount of interest income on nonaccrual loans that would have been recognized if the loans had been paying in accordance with their original terms was $8,496,000, $12,311,000, and $10,612,000 as of December 31, 2012, 2011, and 2010, of which $3,196,000, $4,349,000, and $3,503,000 would have been recognized in the years ended December 31, 2012, 2011, and 2010. The reduction in nonaccrual interest foregone and principal balances reflects the recognition of certain loans as realized losses, and hence removal from the nonaccrual disclosures.
Loan Sales and Servicing Fee Receivable
The Company accounts for its sales of loans in accordance with FASB Accounting Standards Codification Topic 860, Transfers and Servicing (FASB ASC 860). FASB ASC 860 provides accounting and reporting standards for transfers and servicing of financial assets and extinguishments of liabilities. In accordance with FASB ASC 860, we have elected the fair value measurement method for our servicing assets and liabilities. The principal portion of loans serviced for others by the Company and its affiliates was $452,057,000 and $432,385,000 at December 31, 2012 and 2011, and included $406,956,000 and $370,068,000 of loans serviced for Medallion Bank. The Company has evaluated the servicing aspect of its business in accordance with FASB ASC 860, most of which relates to servicing assets held by Medallion Bank, and determined that no material
F-11
Table of Contents
servicing asset or liability exists as of December 31, 2012 and 2011. In December 2010, the Company assigned its servicing rights to the Medallion Bank portfolio to MSC, a wholly-owned unconsolidated portfolio investment. The costs of servicing are allocated to MSC by the Company, and the servicing fee income is billed to and collected from Medallion Bank by MSC.
Unrealized Appreciation (Depreciation) and Realized Gains (Losses) on Investments
Unrealized appreciation (depreciation) on investments is the amount by which the fair value estimated by the Company is greater (less) than the cost basis of the investment portfolio. Realized gains or losses on investments are generated through sales of investments, foreclosure on specific collateral, and writeoffs of loans or assets acquired in satisfaction of loans, net of recoveries. Unrealized appreciation on net investments was $25,957,000, $11,371,000, and $10,093,000 as of December 31, 2012, 2011, and 2010. Our investment in Medallion Bank, a wholly owned portfolio investment, is a also subject to quarterly assessments of fair value. We conduct a thorough valuation analysis as described previously, and determine whether any factors give rise to valuation different than recorded book value, including various regulatory restrictions that were established at Medallion Bank’s inception, by the FDIC and State of Utah, and also by additional marketplace restrictions, such as on the ability to transfer industrial bank charters. As a result of this valuation process, we used Medallion Bank’s actual results of operations as the best estimate of changes in fair value, and recorded the results as a component of unrealized appreciation (depreciation) on investments, although changes in these restrictions and other applicable factors could change these conclusions in the future. See Note 3 for the presentation of financial information for Medallion Bank.
The following table sets forth the changes in our unrealized appreciation (depreciation) on investments, other than investments in controlled subsidiaries, for the years ended December 31, 2012, 2011, and 2010.
| (Dollars in thousands) |
Medallion Loans |
Commercial Loans |
Equity Investments |
Foreclosed Properties(1) |
Total | |||||||||||||||
| Balance December 31, 2009 |
$ | — | ($ | 4,236 | ) | ($ | 8,101 | ) | $ | 18,956 | $ | 6,619 | ||||||||
| Net change in unrealized |
||||||||||||||||||||
| Appreciation on investments |
— | — | 545 | 2,153 | 2,698 | |||||||||||||||
| Depreciation on investments |
— | (7,172 | ) | (475 | ) | — | (7,647 | ) | ||||||||||||
| Reversal of unrealized appreciation (depreciation) related to realized |
||||||||||||||||||||
| Gains on investments |
— | — | — | — | — | |||||||||||||||
| Losses on investments(2) |
— | 191 | 8,232 | — | 8,423 | |||||||||||||||
|
|
|
|
|
|
|
|
|
|
|
|||||||||||
| Balance December 31, 2010 |
— | (11,217 | ) | 201 | 21,109 | 10,093 | ||||||||||||||
| Net change in unrealized |
||||||||||||||||||||
| Appreciation on investments |
— | — | 825 | 3,518 | 4,343 | |||||||||||||||
| Depreciation on investments |
— | (5,708 | ) | 79 | (63 | ) | (5,692 | ) | ||||||||||||
| Reversal of unrealized appreciation (depreciation) related to realized |
||||||||||||||||||||
| Gains on investments |
— | — | — | — | — | |||||||||||||||
| Losses on investments |
— | 2,627 | — | — | 2,627 | |||||||||||||||
|
|
|
|
|
|
|
|
|
|
|
|||||||||||
| Balance December 31, 2011 |
— | (14,298 | ) | 1,105 | 24,564 | 11,371 | ||||||||||||||
| Net change in unrealized |
||||||||||||||||||||
| Appreciation on investments |
— | — | (1,266 | ) | 9,129 | 7,863 | ||||||||||||||
| Depreciation on investments |
— | (759 | ) | 3 | (3 | ) | (759 | ) | ||||||||||||
| Reversal of unrealized appreciation (depreciation) related to realized |
||||||||||||||||||||
| Gains on investments |
— | — | — | — | — | |||||||||||||||
| Losses on investments |
— | 7,213 | 202 | 67 | 7,482 | |||||||||||||||
|
|
|
|
|
|
|
|
|
|
|
|||||||||||
| Balance December 31, 2012 |
$ | — | ($ | 7,844 | ) | $ | 44 | $ | 33,757 | $ | 25,957 | |||||||||
|
|
|
|
|
|
|
|
|
|
|
|||||||||||
F-12
Table of Contents
| (1) | Foreclosed properties all held in other assets on the consolidated balance sheet. |
| (2) | Includes the reversal of unrealized depreciation of $7,720 related to the investments in SPAC and SPAC 2 which were written off in 2010. See Note 10 for additional information on these investments. |
The table below summarizes components of unrealized and realized gains and losses in the investment portfolios for the years ended December 31, 2012, 2011, and 2010.
| (Dollars in thousands) |
2012 | 2011 | 2010 | |||||||||
| Net change in unrealized appreciation (depreciation) on investments |
||||||||||||
| Unrealized appreciation |
($ | 1,266 | ) | $ | 825 | $ | 545 | |||||
| Unrealized depreciation |
(755 | ) | (5,629 | ) | (7,139 | ) | ||||||
| Net unrealized appreciation on investment in Medallion Bank and other controlled subsidiaries(1) |
7,896 | 7,668 | 12,535 | |||||||||
| Realized gains |
— | — | — | |||||||||
| Realized losses(2) |
7,415 | 2,627 | 950 | |||||||||
| Unrealized gains on foreclosed properties and other assets |
9,193 | 3,455 | 2,153 | |||||||||
|
|
|
|
|
|
|
|||||||
| Total |
$ | 22,483 | $ | 8,946 | $ | 9,044 | ||||||
|
|
|
|
|
|
|
|||||||
| Net realized gains (losses) on investments |
||||||||||||
| Realized gains |
$ | — | $ | — | $ | — | ||||||
| Realized losses(3) |
(7,415 | ) | (2,627 | ) | (8,423 | ) | ||||||
| Other gains |
516 | 2,171 | 1,581 | |||||||||
| Direct recoveries (charge-offs)(4) |
242 | (90 | ) | (796 | ) | |||||||
| Realized losses on foreclosed properties and other assets |
(74 | ) | — | — | ||||||||
|
|
|
|
|
|
|
|||||||
| Total |
($ | 6,731 | ) | ($ | 546 | ) | ($ | 7,638 | ) | |||
|
|
|
|
|
|
|
|||||||
| (1) | Includes the reversal of $6,966 of net unrealized depreciation related to the investment in SPAC, including $508 that was recorded in 2010, and which was written off in 2010. |
| (2) | Includes the reversal unrealized depreciation of $759 related the investment in SPAC which was written off in 2010, and which was carried in other assets on the consolidated balance sheet. |
| (3) | Represents the writeoffs related to the investments in SPAC and SPAC 2 in 2010. See Note 10 for additional information on these investments. |
| (4) | Includes $817 of direct chargeoffs related to the settlement of the liabilities associated with the writeoff of SPAC and SPAC 2 in 2010, all of which represented a reversal of accrued expenses. |
The following tables provide additional information on attributes of the nonperforming loan portfolio as of December 31, 2012 and 2011.
| (Dollars in thousands) |
Recorded Investment |
Unpaid Principal Balance |
Average Recorded Investment |
|||||||||
| With no related allowance recorded, December 31, 2012 |
||||||||||||
| Medallion |
$ | — | $ | — | $ | — | ||||||
| Commercial(1) (2) (3) |
$ | 20,607 | $ | 28,391 | $ | 25,367 | ||||||
|
|
|
|
|
|
|
|||||||
| (1) | As of December 31, 2012, $7,729 of unrealized depreciation has been recorded as a valuation allowance with regards to the impaired commercial loans. |
| (2) | Interest income of $109 attributed to commercial loans was recognized during the year. |
F-13
Table of Contents
| (3) | Included in the unpaid principal balance is unearned paid-in-kind interest on nonaccrual loans of $7,784, which is included in the non accrual disclosures in the section titled “Investment Transactions and Income Recognition” on page F-11. |
| (Dollars in thousands) |
Recorded Investment |
Unpaid Principal Balance |
Average Recorded Investment |
|||||||||
| With no related allowance recorded, December 31, 2011 |
||||||||||||
| Medallion |
$ | — | $ | — | $ | — | ||||||
| Commercial(1) (2) (3) |
$ | 25,795 | $ | 31,735 | $ | 25,565 | ||||||
|
|
|
|
|
|
|
|||||||
| (1) | As of December 31, 2011, $14,157 of unrealized depreciation has been recorded as a valuation allowance with regards to the impaired commercial loans. |
| (2) | Interest income of $1,081 attributed to commercial loans was recognized during the year. |
| (3) | Included in the unpaid principal balance is unearned paid-in-kind interest on nonaccrual loans of $5,940, which is included in the non accrual disclosures in the section titled “Investment Transactions and Income Recognition” on page F-11. |
The following tables show the aging of medallion and commercial loans as of December 31, 2012 and 2011.
| December 31, 2012 | Days Past Due | Total | Current | Total | Recorded Investment > 90 Days and Accruing |
|||||||||||||||||||||||
| (Dollars in thousands) |
31-60 | 61-90 | 91 + | |||||||||||||||||||||||||
| Medallion loans |
$ | 3,105 | $ | 1,047 | $ | — | $ | 4,152 | $ | 290,031 | $ | 294,183 | $ | — | ||||||||||||||
|
|
|
|
|
|
|
|
|
|
|
|
|
|
|
|||||||||||||||
| Commercial loans |
||||||||||||||||||||||||||||
| Secured mezzanine |
— | — | 2,380 | 2,380 | 47,076 | 49,456 | — | |||||||||||||||||||||
| Asset-based receivable |
— | — | — | — | 7,631 | 7,631 | — | |||||||||||||||||||||
| Other secured commercial |
437 | 56 | — | 493 | 7,261 | 7,754 | — | |||||||||||||||||||||
|
|
|
|
|
|
|
|
|
|
|
|
|
|
|
|||||||||||||||
| Total commercial loans |
437 | 56 | 2,380 | 2,873 | 61,968 | 64,841 | — | |||||||||||||||||||||
|
|
|
|
|
|
|
|
|
|
|
|
|
|
|
|||||||||||||||
| Total |
$ | 3,542 | $ | 1,103 | $ | 2,380 | $ | 7,025 | $ | 351,999 | $ | 359,024 | $ | — | ||||||||||||||
|
|
|
|
|
|
|
|
|
|
|
|
|
|
|
|||||||||||||||
| December 31, 2011 | Days Past Due | Total | Current | Total | Recorded Investment > 90 Days and Accruing |
|||||||||||||||||||||||
| (Dollars in thousands) |
31-60 | 61-90 | 91 + | |||||||||||||||||||||||||
| Medallion loans |
$ | 4,316 | $ | 556 | $ | 35 | $ | 4,907 | $ | 301,864 | $ | 306,771 | $ | 35 | ||||||||||||||
|
|
|
|
|
|
|
|
|
|
|
|
|
|
|
|||||||||||||||
| Commercial loans |
||||||||||||||||||||||||||||
| Secured mezzanine |
— | 2,415 | 14,930 | 17,345 | 34,277 | 51,622 | — | |||||||||||||||||||||
| Asset-based receivable |
— | — | — | — | 9,388 | 9,388 | — | |||||||||||||||||||||
| Other secured commercial |
104 | — | 390 | 494 | 7,045 | 7,539 | — | |||||||||||||||||||||
|
|
|
|
|
|
|
|
|
|
|
|
|
|
|
|||||||||||||||
| Total commercial loans |
104 | 2,415 | 15,320 | 17,839 | 50,710 | 68,549 | — | |||||||||||||||||||||
|
|
|
|
|
|
|
|
|
|
|
|
|
|
|
|||||||||||||||
| Total |
$ | 4,420 | $ | 2,971 | $ | 15,355 | $ | 22,746 | $ | 352,574 | $ | 375,320 | $ | 35 | ||||||||||||||
|
|
|
|
|
|
|
|
|
|
|
|
|
|
|
|||||||||||||||
In addition to the loan portfolio delinquencies as described above, the receivable from bonuses related to certain investments of $6,468,000 was delinquent for more than 91 days at December 31, 2012 and which is carried in other assets on the consolidated balance sheet.
F-14
Table of Contents
The following table shows troubled debt restructurings which the Company entered into during the year ended December 31, 2012.
| Number of Loans |
Pre-Modification Investment |
Post-Modification Investment |
Troubled Debt Restructuring that Subsequently Defaulted |
|||||||||||||||||
| (Dollars in thousands) |
Number of Loans |
Recorded Investment |
||||||||||||||||||
| Medallion loans |
— | $ | — | $ | — | — | $ | — | ||||||||||||
|
|
|
|
|
|
|
|
|
|
|
|||||||||||
| Commercial loans |
||||||||||||||||||||
| Secured mezzanine |
3 | 7,646 | 7,096 | — | — | |||||||||||||||
| Asset-based receivable |
— | — | — | — | — | |||||||||||||||
| Other secured commercial |
— | — | — | — | — | |||||||||||||||
|
|
|
|
|
|
|
|
|
|
|
|||||||||||
| Total commercial loans |
3 | 7,646 | 7,096 | — | — | |||||||||||||||
|
|
|
|
|
|
|
|
|
|
|
|||||||||||
| Total |
3 | $ | 7,646 | $ | 7,096 | — | $ | — | ||||||||||||
|
|
|
|
|
|
|
|
|
|
|
|||||||||||
Goodwill
In accordance with ASC Topic 350, “Intangibles – Goodwill and Other,” the Company has determined that it is more likely than not that the relevant reporting unit’s fair value is greater than its carrying amount as of December 31, 2012 and 2011, and that the impairment testing of goodwill is not required. For 2010 and prior periods, the Company tested its goodwill for impairment, and engaged a consultant to help management evaluate its carrying value. The results of this evaluation demonstrated no impairment in goodwill for any period evaluated, and management believes, and the Board of Directors concurs, that there is no impairment as of December 31, 2012. The Company conducts annual, and if necessary, more frequent, appraisals of its goodwill, and will recognize any impairment in the period any impairment is identified as a charge to operating expenses.
Fixed Assets
Fixed assets are carried at cost less accumulated depreciation and amortization, and are depreciated on a straight-line basis over their estimated useful lives of 3 to 10 years. Leasehold improvements are amortized on a straight-line basis over the shorter of the lease term or the estimated economic useful life of the improvement. Depreciation and amortization expense was $166,000, $170,000, and $218,000 for the years ended December 31, 2012, 2011, and 2010.
Deferred Costs
Deferred financing costs, included in other assets, represents costs associated with obtaining the Company’s borrowing facilities, and is amortized on a straight line basis over the lives of the related financing agreements. Amortization expense was $1,016,000, $1,052,000, and $1,060,000 for the years ended December 31, 2012, 2011, and 2010. In addition, the Company capitalizes certain costs for transactions in the process of completion (other than business combinations), including those for potential investments, and the sourcing of other financing alternatives. Upon completion or termination of the transaction, any accumulated amounts will be amortized against income over an appropriate period, or written off, including $759,000 related to the investment in SPAC 2, which was fully reserved for in 2009 and written off in 2010, and $485,000 related to costs associated with a canceled equity offering in 2010. The amounts on the balance sheet for all of these purposes were $1,337,000 and $2,206,000 at December 31, 2012 and 2011.
F-15
Table of Contents
Federal Income Taxes
The Company and each of its major subsidiaries other than Medallion Bank and Medallion Funding LLC (the RIC subsidiaries) have qualified to be treated for federal income tax purposes as regulated investment companies (RICs) under the Internal Revenue Code of 1986, as amended (the Code). As RICs, the Company and each of the RIC subsidiaries are not subject to US federal income tax on any gains or investment company taxable income (which includes, among other things, dividends and interest income reduced by deductible expenses) that it distributes to its shareholders, if at least 90% of its investment company taxable income for that taxable year is distributed. It is the Company’s and the RIC subsidiaries’ policy to comply with the provisions of the Code. The Company’s RIC qualification is determined on an annual basis, and it qualified and filed its federal tax returns as a RIC for 2011 and 2010, and anticipates qualifying and filing as a RIC for 2012. As a result, no provisions for income taxes have been recorded for the years ended December 31, 2012, 2011, and 2010. State and local tax treatment follows the federal model.
The Company has filed tax returns in many states. Federal, New York State, and New York City tax filings of the Company for the tax years 2009 through the present are the more significant filings that are open for examination.
Medallion Bank is not a RIC and is taxed as a regular corporation. Fin Trust, Medallion Funding LLC, and Trust III are not subject to federal income taxation, instead their taxable income is treated as having been earned by the Company.
Net Increase in Net Assets Resulting from Operations per Share (EPS)
Basic earnings per share are computed by dividing net increase in net assets resulting from operations available to common shareholders by the weighted average number of common shares outstanding for the period. Diluted earnings per share reflect the potential dilution that could occur if option contracts to issue common stock were exercised, or if restricted stock vests, and has been computed after giving consideration to the weighted average dilutive effect of the Company’s stock options and restricted stock. The Company uses the treasury stock method to calculate diluted EPS, which is a method of recognizing the use of proceeds that could be obtained upon exercise of options and warrants, including unvested compensation expense related to the shares, in computing diluted EPS. It assumes that any proceeds would be used to purchase common stock at the average market price during the period.
The table below shows the calculation of basic and diluted EPS.
| Years Ended December 31, | ||||||||||||
| (Dollars in thousands) |
2012 | 2011 | 2010 | |||||||||
| Net increase in net assets resulting from operations available to common shareholders |
$ | 24,517 | $ | 19,163 | $ | 11,279 | ||||||
|
|
|
|
|
|
|
|||||||
| Weighted average common shares outstanding applicable to basic EPS |
19,912,883 | 17,426,097 | 17,501,414 | |||||||||
| Effect of dilutive stock options |
199,670 | 218,448 | 130,514 | |||||||||
| Effect of restricted stock grants |
68,141 | 15,286 | — | |||||||||
|
|
|
|
|
|
|
|||||||
| Adjusted weighted average common shares outstanding applicable to diluted EPS |
20,180,694 | 17,659,831 | 17,631,928 | |||||||||
|
|
|
|
|
|
|
|||||||
| Basic earnings per share |
$ | 1.23 | $ | 1.10 | $ | 0.64 | ||||||
| Diluted earnings per share |
1.21 | 1.09 | 0.64 | |||||||||
|
|
|
|
|
|
|
|||||||
Potentially dilutive common shares excluded from the above calculations aggregated 159,720, 290,396, and 1,005,171 shares as of December 31, 2012, 2011, and 2010.
F-16
Table of Contents
Stock Compensation
The Company follows FASB Accounting Standard Codification Topic 718 (ASC 718), “Compensation—Stock Compensation”, for its stock option and restricted stock plans, and accordingly, the Company recognizes the expense of these grants as required. Stock-based employee compensation costs pertaining to stock options is reflected in net increase in net assets resulting from operations for any new grants using the fair values established by usage of the Black-Scholes option pricing model, expensed over the vesting period of the underlying option. Stock-based employee compensation costs pertaining to restricted stock are reflected in net increase in net assets resulting from operations for any new grants using the grant date fair value of the shares granted, expensed over the vesting period of the underlying stock.
The Company elected the modified prospective transition method in applying ASC 718. Under this method, the provisions of ASC 718 apply to all awards granted or modified after the date of adoption. During 2012 and 2011, the Company issued 221,693 and 79,800 restricted shares of stock-based compensation awards, and during 2012 and 2010, the Company issued 8,000 and 68,500 shares of other stock-based compensation awards, and recognized $910,000, $228,000, and $223,000, or $0.05, $0.01, and $0.01 per diluted common share for each respective year, of non-cash stock-based compensation expense related to the grants. As of December 31, 2012, the total remaining unrecognized compensation cost related to unvested stock options and restricted stock was $2,212,000, which is expected to be recognized over the next 12 quarters (see Note 5).
Dividends to Shareholders
The table below shows the tax character of distributions for tax reporting purposes.
| Years Ended December 31, | ||||||||||||
| (Dollars in thousands) |
2012 | 2011 | 2010 | |||||||||
| Dividends paid from |
||||||||||||
| Investment income, net |
$ | 7,695 | $ | 12,251 | $ | 10,511 | ||||||
| Return of capital |
8,688 | — | — | |||||||||
| Realized gains from investment transactions, net |
— | — | — | |||||||||
|
|
|
|
|
|
|
|||||||
| Total dividends |
$ | 16,383 | $ | 12,251 | $ | 10,511 | ||||||
|
|
|
|
|
|
|
|||||||
Our ability to make dividend payments is restricted by SBA regulations and under the terms of the SBA debentures. As of December 31, 2012, the Company has no undistributed net investment income or realized gains.
Derivatives
The Company manages its exposure to increases in market rates of interest by periodically purchasing interest rate caps to lock in the cost of funds of its variable-rate debt in the event of a rapid run up in interest rates. Beginning in 2009, the Company entered into contracts to purchase interest rate caps on $622,000,000 of notional value of principal from various multinational banks, of which $150,000,000 are active with termination dates ranging to July 2015. The caps provide for payments to the Company if various LIBOR thresholds are exceeded during the cap terms. Total cap purchases of $477,000 were generally fully expensed when paid, including $70,000, $93,000, and $142,000 in 2012, 2011, and 2010, and all are carried at $0 on the balance sheet at December 31, 2012.
Reclassifications
Certain reclassifications have been made to prior year balances to conform with the current year presentation. These reclassifications have no effect on the previously reported results of operations.
F-17
Table of Contents
(3) INVESTMENT IN MEDALLION BANK AND OTHER CONTROLLED SUBSIDIARIES
The following table presents information derived from Medallion Bank’s statement of comprehensive income and other valuation adjustments on other controlled subsidiaries for the years ended December 31, 2012, 2011, and 2010.
| (Dollars in thousands) |
2012 | 2011 | 2010 | |||||||||
| Statement of comprehensive income |
||||||||||||
| Investment income |
$ | 56,467 | $ | 51,291 | $ | 47,273 | ||||||
| Interest expense |
5,094 | 6,058 | 7,478 | |||||||||
|
|
|
|
|
|
|
|||||||
| Net interest income |
51,373 | 45,233 | 39,795 | |||||||||
| Noninterest income |
437 | 635 | 520 | |||||||||
| Operating expenses |
15,741 | 13,756 | 10,827 | |||||||||
|
|
|
|
|
|
|
|||||||
| Net investment income before income taxes |
36,069 | 32,112 | 29,488 | |||||||||
| Income tax provision |
12,097 | 9,487 | 6,718 | |||||||||
|
|
|
|
|
|
|
|||||||
| Net investment income after income taxes |
23,972 | 22,625 | 22,770 | |||||||||
| Net realized/unrealized losses of Medallion Bank |
(4,426 | ) | (6,850 | ) | (11,502 | ) | ||||||
|
|
|
|
|
|
|
|||||||
| Net increase in net assets resulting from operations of Medallion Bank |
19,546 | 15,775 | 11,268 | |||||||||
| Unrealized depreciation on Medallion Bank(1) |
(10,763 | ) | (6,635 | ) | (5,230 | ) | ||||||
| Net realized/unrealized gains (losses) on controlled subsidiaries other than Medallion Bank |
(887 | ) | (1,472 | ) | 6,497 | |||||||
|
|
|
|
|
|
|
|||||||
| Net increase in net assets resulting from operations of Medallion Bank and other controlled subsidiaries |
$ | 7,896 | $ | 7,668 | $ | 12,535 | ||||||
|
|
|
|
|
|
|
|||||||
| (1) | Unrealized depreciation on Medallion Bank reflects the adjustment to the investment carrying amount to reflect the dividends declared to the Company and the US Treasury. |
The following table presents Medallion Bank’s balance sheets and the net investment in other controlled subsidiaries as of December 31, 2012 and 2011.
| (Dollars in thousands) |
2012 | 2011 | ||||||
| Loans |
$ | 664,381 | $ | 561,865 | ||||
| Investment securities, at fair value |
22,122 | 26,537 | ||||||
|
|
|
|
|
|||||
| Net investments ($0 pledged as collateral under borrowing arrangements at December 31, 2012 and 2011)(1) |
686,503 | 588,402 | ||||||
| Cash ($0 at December 31, 2012 and 2011 restricted as to use by lender) |
24,770 | 28,626 | ||||||
| Other assets, net |
12,100 | 11,881 | ||||||
|
|
|
|
|
|||||
| Total assets |
$ | 723,373 | $ | 628,909 | ||||
|
|
|
|
|
|||||
| Other liabilities |
$ | 1,643 | $ | 4,316 | ||||
| Due to affiliates |
1,462 | 964 | ||||||
| Deposits and federal funds purchased, including accrued interest payable |
602,635 | 514,779 | ||||||
|
|
|
|
|
|||||
| Total liabilities |
605,740 | 520,059 | ||||||
| Medallion Bank equity(2) |
117,633 | 108,850 | ||||||
|
|
|
|
|
|||||
| Total liabilities and equity |
$ | 723,373 | $ | 628,909 | ||||
|
|
|
|
|
|||||
| Investment in other controlled subsidiaries |
$ | 6,914 | $ | 3,080 | ||||
| Total investment in Medallion Bank and other controlled subsidiaries |
99,083 | 85,932 | ||||||
|
|
|
|
|
|||||
F-18
Table of Contents
| (1) | Included in Medallion Bank’s net investments is $96 and $183 for purchased loan premium at December 31, 2012 and 2011. |
| (2) | Includes $26,303 of preferred stock issued to the US Treasury under the Small Business Lending Fund Program (SBLF). |
The following paragraphs summarize the accounting and reporting policies of Medallion Bank, and provide additional information relating to the tables presented above.
Investment securities are purchased from time-to-time in the open market at prices that are greater or lesser than the par value of the investment. The resulting premium or discount is deferred and recognized on a level yield basis as an adjustment to the yield of the related investment. At December 31, 2012 and 2011, the net premium on investment securities totaled $336,000 and $403,000, and $177,000, $76,000, and $67,000 was amortized to interest income for the years ended December 31, 2012, 2011, and 2010.
Loan origination fees and certain direct origination costs are deferred and recognized as an adjustment to the yield of the related loans. At December 31, 2012 and 2011, net loan origination costs were $7,019,000 and $5,597,000. Net amortization expense for the years ended December 31, 2012, 2011, and 2010 was $2,334,000, $2,188,000, and $2,242,000.
Medallion Bank’s policies regarding nonaccrual of medallion and commercial loans are similar to those of the Company. The consumer portfolio has different characteristics compared to commercial loans, typified by a larger number of lower dollar loans that have similar characteristics. These loans are placed on nonaccrual, when they become 90 days past due, or earlier if they enter bankruptcy, and are charged off in their entirety when deemed uncollectible, or when they become 120 days past due, whichever occurs first, at which time appropriate collection and recovery efforts against both the borrower and the underlying collateral are initiated. At December 31, 2012, $2,451,000 or 1% of consumer loans, and no commercial and medallion loans were on nonaccrual, compared to $2,264,000 or 1% of consumer loans, and no commercial and medallion loans on nonaccrual at December 31, 2011, and $2,686,000 or 1% of consumer loans, $329,000 or less than 1% of commercial loans, and no medallion loans on nonaccrual at December 31, 2010. The amount of interest income on nonaccrual loans that would have been recognized if the loans had been paying in accordance with their original terms was immaterial for all periods presented.
Medallion Bank’s loan and investment portfolios are assessed for collectability on a monthly basis, and a loan loss allowance is established for any realizability concerns on specific investments, and general reserves have also been established for any unknown factors. Adjustments to the value of this portfolio are based on the historical loan loss data obtained from the seller and our own historical loan loss data developed since 2004, adjusted for changes in delinquency trends and other factors as described previously in Note 2.
In January 2004, Medallion Bank commenced raising deposits to fund the purchase of various affiliates’ loan portfolios. The deposits were raised through the use of investment brokerage firms who package deposits qualifying for FDIC insurance into pools that are sold to Medallion Bank. The rates paid on the deposits are highly competitive with market rates paid by other financial institutions, and include a brokerage fee of 0.15% to 0.50%, depending on the maturity of the deposit, which is capitalized and amortized to interest expense over the life of the respective pool. The total amount capitalized at December 31, 2012 and 2011 was $1,249,000 and $1,250,000, and $1,140,000, $1,053,000, and $1,007,000 was amortized to interest expense during 2012, 2011, and 2010. Interest on the deposits is accrued daily and paid monthly, quarterly, semiannually, or at maturity.
The outstanding balances of fixed rate borrowings were as follows:
| Payments Due for the Fiscal Year Ending December 31, | December 31, 2012 |
December 31, 2011 |
Interest Rate(1) |
|||||||||||||||||||||||||||||||||
| (Dollars in thousands) |
2013 | 2014 | 2015 | 2016 | 2017 | Thereafter | ||||||||||||||||||||||||||||||
| Deposits and federal funds purchased |
$ | 411,909 | $ | 130,456 | $ | 38,139 | $ | 16,684 | $ | 4,963 | $ | — | $ | 602,151 | $ | 514,329 | 0.69 | % | ||||||||||||||||||
|
|
|
|
|
|
|
|
|
|
|
|
|
|
|
|
|
|
|
|||||||||||||||||||
| (1) | Weighted average contractual rate as of December 31, 2012. |
F-19
Table of Contents
Medallion Bank is subject to various regulatory capital requirements administered by the FDIC and State of Utah Department of Financial Institutions. Failure to meet minimum capital requirements can initiate certain mandatory and possibly additional discretionary actions by regulators that, if undertaken, could have a direct material effect on Medallion Bank’s and our financial statements. Under capital adequacy guidelines and the regulatory framework for prompt corrective action, Medallion Bank must meet specific capital guidelines that involve quantitative measures of Medallion Bank’s assets, liabilities, and certain off-balance sheet items as calculated under regulatory accounting practices. Medallion Bank’s capital amounts and classification are also subject to qualitative judgments by Medallion Bank regulators about components, risk weightings, and other factors.
FDIC-insured banks, including Medallion Bank, are subject to certain federal laws, which impose various legal limitations on the extent to which banks may finance or otherwise supply funds to certain of their affiliates. In particular, Medallion Bank is subject to certain restrictions on any extensions of credit to, or other covered transactions, such as certain purchases of assets, with the Company or its affiliates.
Quantitative measures established by regulation to ensure capital adequacy require Medallion Bank to maintain minimum amounts and ratios as defined in the regulations (set forth in the table below). Additionally, as conditions of granting Medallion Bank’s application for federal deposit insurance, the FDIC ordered that the leverage capital ratio (Tier 1 capital to average assets) be not less than 15%, and that an adequate allowance for loan losses be maintained. As a result, to facilitate maintenance of the capital ratio requirement and to provide the necessary capital for continued growth, the Company periodically makes capital contributions to Medallion Bank. Separately, Medallion Bank declared dividends to the Company of $10,500,000 in 2012, $5,500,000 in 2011, and $4,000,000 in 2010.
On February 27, 2009 and December 22, 2009, Medallion Bank issued, and the US Treasury purchased under the TARP Capital Purchase Program (the CPP) Medallion Bank’s fixed rate non-cumulative Perpetual Preferred Stock, Series A, B, C, and D for an aggregate purchase price of $21,498,000 in cash. On July 21, 2011, Medallion Bank issued, and the US Treasury purchased 26,303 shares of Senior Non-Cumulative Perpetual Preferred Stock, Series E (Series E) for an aggregate purchase price of $26,303,000 under the Small Business Lending Fund Program (SBLF). The SBLF is a voluntary program intended to encourage small business lending by providing capital to qualified smaller banks at favorable rates. In connection with the issuance of the Series E, the Bank exited the CPP by redeeming the Series A, B, C, and D; and received approximately $4,000,000, net of dividends due on the repaid securities. The Bank pays a dividend rate of 1% on the Series E.
The following table represents Medallion Bank’s actual capital amounts and related ratios as of December 31, 2012 and 2011, compared to required regulatory minimum capital ratios and the ratio required to be considered well capitalized. As of December 31, 2012, Medallion Bank meets all capital adequacy requirements to which it is subject, and is well-capitalized.
| Regulatory | December 31, 2012 |
December 31, 2011 |
||||||||||||||
| (Dollars in Thousands) |
Minimum | Well-capitalized | ||||||||||||||
| Tier 1 capital |
$ | — | $ | — | $ | 116,026 | $ | 107,009 | ||||||||
| Total capital |
— | — | 124,791 | 114,504 | ||||||||||||
| Average assets |
— | — | 711,794 | 604,329 | ||||||||||||
| Risk-weighted assets |
— | — | 695,306 | 592,528 | ||||||||||||
| Leverage ratio(1) |
4 | % | 5 | % | 16.3 | % | 17.7 | % | ||||||||
| Tier 1 capital ratio(2) |
4 | 6 | 16.7 | 18.1 | ||||||||||||
| Total capital ratio(2) |
8 | 10 | 18.0 | 19.3 | ||||||||||||
|
|
|
|
|
|
|
|
|
|||||||||
| (1) | Calculated by dividing Tier 1 capital by average assets. |
| (2) | Calculated by dividing Tier 1 or total capital by risk-weighted assets. |
F-20
Table of Contents
(4) FUNDS BORROWED
The outstanding balances of funds borrowed were as follows:
| Payments Due for the Fiscal Year Ending December 31, | December 31, 2012 |
December 31, 2011 |
Interest Rate(1) |
|||||||||||||||||||||||||||||||||
| (Dollars in thousands) |
2013 | 2014 | 2015 | 2016 | 2017 | Thereafter | ||||||||||||||||||||||||||||||
| Revolving lines of credit |
$ | 163,628 | $ | — | $ | — | $ | — | $ | — | $ | — | $ | 163,628 | $ | 180,566 | 1.24 | % | ||||||||||||||||||
| Notes payable to banks |
16,028 | 45,249 | 1,021 | 3,909 | — | — | 66,207 | 74,528 | 3.09 | |||||||||||||||||||||||||||
| SBA debentures |
19,450 | 12,000 | 4,500 | — | — | 23,985 | 59,935 | 69,685 | 4.91 | |||||||||||||||||||||||||||
| Preferred securities |
— | — | — | — | — | 33,000 | 33,000 | 33,000 | 2.44 | |||||||||||||||||||||||||||
|
|
|
|
|
|
|
|
|
|
|
|
|
|
|
|
|
|||||||||||||||||||||
| Total |
$ | 199,106 | $ | 57,249 | $ | 5,521 | $ | 3,909 | $ | — | $ | 56,985 | $ | 322,770 | $ | 357,779 | 2.43 | |||||||||||||||||||
|
|
|
|
|
|
|
|
|
|
|
|
|
|
|
|
|
|
|
|||||||||||||||||||
| (1) | Weighted average contractual rate as of December 31, 2012. |
(A) REVOLVING LINES OF CREDIT
In December 2008, Trust III entered into a revolving line of credit agreement with DZ Bank, to provide up to $200,000,000 of financing through a commercial paper conduit to acquire medallion loans from MFC (DZ line), of which $163,628,000 was outstanding at December 31, 2012. Borrowings under Trust III’s revolving line of credit are collateralized by Trust III’s assets. MFC is the servicer of the loans owned by Trust III. The DZ line includes a borrowing base covenant and rapid amortization in certain circumstances. In addition, if certain financial tests are not met, MFC can be replaced as the servicer. The DZ line matures in December 2013. The interest rate is the lesser of a pooled short-term commercial paper rate (which approximates LIBOR), 30 day LIBOR (0.21% at December 31, 2012) plus 0.75%, or 90 day LIBOR (0.31% at December 31, 2012) plus 0.50%; plus 0.95%.
In December 2006, Trust II entered into a revolving line of credit agreement with Citibank N.A., to provide up to $250,000,000 of financing through a commercial paper conduit to acquire medallion loans from MFC (Citi line), which was paid off in March 2010, in advance of the May 2010 maturity. In November 2008, the line of credit was reduced to $225,000,000, and was further reduced to $35,000,000 in November 2009. Borrowings under Trust II’s revolving line of credit were collateralized by Trust II’s assets. MFC was the servicer of the loans owned by Trust II. The Citi line included a borrowing base covenant and rapid amortization in certain circumstances. In addition, if certain financial tests were not met, MFC could have been replaced as the servicer. The interest rate was a pooled short-term commercial paper rate, which approximated LIBOR plus 1.07% with a facility fee of 1.50% on the aggregate Citi line.
(B) SBA DEBENTURES
In September 2010, the SBA approved a $5,000,000 commitment for MCI to issue additional debentures during a four year period upon payment of a 1% fee. The SBA also approved a $7,485,000 commitment for FSVC to issue additional debentures during a four year period upon payment of a 1% fee, for the purpose of repaying $7,485,000 of debentures which matured in September 2011, which were issued on March 1, 2011 and used to prepay the September 2011 maturing debentures. In September 2006, the SBA approved a $6,000,000 commitment for FSVC to issue additional debentures to the SBA during a four year period upon payment of a 1% fee and the infusion of $2,000,000 of additional capital. In March 2006, the SBA approved a $13,500,000 commitment for MCI to issue additional debentures to the SBA during a four year period upon payment of a 1% fee and the infusion of $6,750,000 of additional capital. In November 2003, the SBA approved an $8,000,000 commitment for FSVC, and during 2001, the SBA approved $36,000,000 each in commitments for FSVC and MCI. As of December 31, 2012, $111,985,000 of commitments had been fully utilized, and there was no remaining availability, and $59,935,000 was outstanding at December 31, 2012.
F-21
Table of Contents
The notes are collateralized by substantially all of the Company’s assets and are subject to the terms and conditions of agreements with the SBA which, among other things, restrict stock redemptions, disposition of assets, new indebtedness, dividends or distributions, and changes in management, ownership, investment policy, or operations. The debentures have been issued in various tranches for terms of ten years with interest payable semiannually.
(C) NOTES PAYABLE TO BANKS
The Company and its subsidiaries have entered into (i) note agreements and (ii) participation agreements with a variety of local and regional banking institutions over the years. The notes are typically secured by various assets of the underlying borrower. The Company believes the participation agreements represent legal true sales of the loans to the lender, but for accounting purposes these participations are treated as financings, and are included in funds borrowed as shown on our consolidated balance sheets. The table below summarizes the key attributes of our various borrowing arrangements with banks as of December 31, 2012.
| (Dollars in thousands) | ||||||||||||||||||||||||
| Borrower |
# of Banks/ Notes |
Note Dates | Maturity Dates |
Type | Note Amounts |
Balance Outstanding at December 31, 2012 |
Monthly Payment |
Average Interest |
Interest Rate | |||||||||||||||
| MFC |
3/3 | 1/10 -9/10 | 9/13 - 1/15 | Participated loans treated as financings |
$ | 1,571 | $ | 1,459 | Proportionate to the payments received on the participated loans |
4.06% | 4.06%(4) | |||||||||||||
| Medallion Chicago |
3/28 | 12/11 | 12/14 | Term loans secured by owned Chicago medallions(2) |
26,152 | 25,534 | $124 principal & interest |
3.25% | N/A | |||||||||||||||
| The Company |
3/3 | 1/09 -7/11 | 6/13 - 1/16 | Participated loans treated as financings |
11,272 | 11,214 | Proportionate to the payments received on the participated loans |
3.08% | N/A | |||||||||||||||
| The Company |
3/4 | 4/11 - 12/12 | 4/13 - 6/15 | Revolving line of credit secured by pledged loans |
35,000 | 23,000 | Interest only | 2.95% + 0.25% unused fee |
LIBOR + 2%, 3% floor; LIBOR + 2.5%; or LIBOR + 2% or Prime – 0.5%, 3% floor | |||||||||||||||
| MFC |
3/3 | 1/05 - 8/11 | 4/13 - 8/13 | Revolving line of credit secured by pledged loans(3) |
53,000 | 5,000 | Interest only | 2.71% | Prime + 0.50%; LIBOR + 2.5%, or LIBOR + 2%, 3% floor | |||||||||||||||
|
|
|
|
|
|||||||||||||||||||||
| $ | 126,995 | $ | 66,207 | |||||||||||||||||||||
|
|
|
|
|
|||||||||||||||||||||
| (1) | At December 31, 2012, 30 day LIBOR was 0.21%, 360 day LIBOR was 0.84%, and the prime rate was 3.25%. |
| (2) | $15,708 guaranteed by the Company. |
| (3) | $25,000 guaranteed by the Company, and effective April 2012, $20,000 of one of the bank notes is also available for use by the Company. |
| (4) | One $1,021 loan remains fixed to term at 3.50%, one $382 loan remains fixed to term at 5.50%, and one $56 note reprices on its one year anniversary date at the greater of the current interest rate, or the prime rate plus 0.50%. |
(D) PREFERRED SECURITIES
In June 2007, the Company issued and sold $36,083,000 aggregate principal amount of unsecured junior subordinated notes to Fin Trust which, in turn, sold $35,000,000 of preferred securities to Merrill Lynch International and issued 1,083 shares of common stock to the Company. The notes bore a fixed rate of interest of 7.68% to September 2012, and thereafter a variable rate of interest of 90 day LIBOR (0.31% at December 31, 2012) plus 2.13%. The notes mature in September 2037 and are prepayable at par. Interest is payable quarterly in arrears. The terms of the preferred securities and the notes are substantially identical. In December 2007,
F-22
Table of Contents
$2,000,000 of the preferred securities were repurchased from a third party investor. At December 31, 2012, $33,000,000 was outstanding on the preferred securities.
(E) COVENANT COMPLIANCE
In the normal course of business, the Company and its subsidiaries enter into agreements, or are subject to regulatory requirements, that result in loan restrictions. Certain of our debt agreements contain restrictions that require the Company to maintain certain financial ratios, including debt to equity and minimum net worth. In addition, the Company’s wholly-owned subsidiary Medallion Bank is subject to various regulatory requirements (see Note 3).
(5) STOCK OPTIONS AND RESTRICTED STOCK
The Company has a stock option plan (2006 Stock Option Plan) available to grant both incentive and nonqualified stock options to employees. The 2006 Stock Option Plan, which was approved by the Board of Directors on February 15, 2006 and shareholders on June 16, 2006, provides for the issuance of a maximum of 800,000 shares of common stock of the Company. At December 31, 2012, 153,155 shares of the Company’s common stock remained available for future grants. The 2006 Stock Option Plan is administered by the Compensation Committee of the Board of Directors. The option price per share may not be less than the current market value of the Company’s common stock on the date the option is granted. The term and vesting periods of the options are determined by the Compensation Committee, provided that the maximum term of an option may not exceed a period of ten years.
The Company’s Board of Directors approved the 2009 Employee Restricted Stock Plan (the Employee Restricted Stock Plan) on April 16, 2009. The Employee Restricted Stock Plan became effective upon the Company’s receipt of exemptive relief from the SEC and approval of the Employee Restricted Stock Option Plan by the Company’s shareholders on June 11, 2010. The terms of the Employee Restricted Stock Plan provide for grants of restricted stock awards to the Company’s employees. A grant of restricted stock is a grant of shares of the Company’s common stock which, at the time of issuance, is subject to certain forfeiture provisions, and thus is restricted as to transferability until such forfeiture restrictions have lapsed. A total of 800,000 shares of the Company’s common stock are issuable under the Employee Restricted Stock Plan, and as of December 31, 2012, 499,308 shares of the Company’s common stock remained available for future grants. Awards under the 2009 Employee Plan are subject to certain limitations as set forth in the Employee Restricted Stock Plan. The Employee Restricted Stock Plan will terminate when all shares of common stock authorized for delivery under the Employee Restricted Stock Plan have been delivered and the forfeiture restrictions on all awards have lapsed, or by action of the Board of Directors pursuant to the Employee Restricted Stock Plan, whichever first occurs.
The Company’s Board of Directors approved the First Amended and Restated 2006 Director Plan (the Amended Director Plan) on April 16, 2009, which was approved by the Company’s shareholders on June 5, 2009, and on which exemptive relief to implement the Amended Director Plan was received from the SEC on July 17, 2012. A total of 200,000 shares of the Company’s common stock issuable under the Amended Director Plan, and as of December 31, 2012, 100,000 shares of the Company’s common stock remained available for future grants. Under the Amended Director Plan, unless otherwise determined by a committee of the Board of Directors comprised of directors who are not eligible for grants under the Amended Director Plan, the Company will grant options to purchase 9,000 shares of the Company’s common stock to an Eligible Director upon election to the Board of Directors, with an adjustment for directors who are elected to serve less than a full term. The option price per share may not be less than the current market value of the Company’s common stock on the date the option is granted. Options granted under the 2006 Director Plan are exercisable annually, as defined in the Amended Director Plan. The term of the options may not exceed ten years.
The Company’s 1996 Stock Option Plan and 1996 Director Plan terminated on May 21, 2006 and no additional shares are available for future issuance. At December 31, 2012, 971,500 options on the Company’s common stock were outstanding under the 1996 and 2006 plans, of which 942,333 options were exercisable, and
F-23
Table of Contents
there were 300,317 unvested shares of the Company’s common stock outstanding under the Employee Restricted Stock Plan.
The fair value of each restricted stock grant is determined on the date of grant by the closing market price of the Company’s common stock on the grant date. The fair value of each option grant is estimated on the date of grant using the Black-Scholes option-pricing model. The weighted average fair value of options granted was $1.25 and $0.96 per share for the years ended December 31, 2012 and 2010, and there were no options granted during 2011. The following assumption categories are used to determine the value of any option grants.
| Year ended December 31, | ||||||||||||
| 2012 | 2011 | 2010 | ||||||||||
| Risk free interest rate |
1.09 | % | NA | 2.77 | % | |||||||
| Expected dividend yield |
7.53 | NA | 8.00 | |||||||||
| Expected life of option in years(1) |
6.00 | NA | 6.00 | |||||||||
| Expected volatility(2) |
30.00 | NA | 30.00 | |||||||||
|
|
|
|
|
|||||||||
| (1) | Expected life is calculated using the simplified method. |
| (2) | We determine our expected volatility using the Black-Scholes option pricing model based on our historical volatility. |
The following table presents the activity for the stock option program under the 1996 and 2006 Stock Option Plans and the Amended Director Plan for the years ended December 31, 2012, 2011, and 2010.
| Number of Options |
Exercise Price Per Share |
Weighted Average Exercise Price |
||||||||||
| Outstanding at December 31, 2009 |
1,475,932 | $ | 3.50-17.94 | $ | 8.93 | |||||||
| Granted |
68,500 | 7.17-8.21 | 8.06 | |||||||||
| Cancelled |
(46,264 | ) | 9.22-17.94 | 13.79 | ||||||||
| Exercised(1) |
(2,200 | ) | 4.85 | 4.85 | ||||||||
|
|
|
|
|
|
|
|||||||
| Outstanding at December 31, 2010 |
1,495,968 | 3.50-14.63 | 8.75 | |||||||||
| Granted |
— | — | — | |||||||||
| Cancelled |
(68,089 | ) | 4.85-14.63 | 12.35 | ||||||||
| Exercised(1) |
(248,316 | ) | 3.87-11.21 | 6.75 | ||||||||
|
|
|
|
|
|
|
|||||||
| Outstanding at December 31, 2011 |
1,179,563 | 3.50-13.06 | 8.96 | |||||||||
| Granted |
8,000 | 11.53-12.55 | 11.91 | |||||||||
| Cancelled |
(5,453 | ) | 4.85 | 4.85 | ||||||||
| Exercised(1) |
(210,610 | ) | 3.50-11.21 | 5.29 | ||||||||
|
|
|
|
|
|
|
|||||||
| Outstanding at December 31, 2012 (2) |
971,500 | $ | 3.50-13.06 | $ | 9.80 | |||||||
|
|
|
|
|
|
|
|||||||
| Options exercisable at |
||||||||||||
| December 31, 2010 |
1,232,807 | $ | 3.50-14.63 | $ | 8.73 | |||||||
| December 31, 2011 |
1,111,007 | 3.50-13.06 | 9.02 | |||||||||
| December 31, 2012(2) |
942,333 | 3.50-13.06 | 9.83 | |||||||||
|
|
|
|
|
|
|
|||||||
| (1) | The aggregate intrinsic value, which represents the difference between the price of the Company’s common stock at the exercise date and the related exercise price of the underlying options, was $1,308,000, $1,184,000, and $8,000 for 2012, 2011, and 2010. |
| (2) | The aggregate intrinsic value, which represents the difference between the price of the Company’s common stock at December 31, 2012 and the related exercise price of the underlying options, was $2,083,000 for outstanding options and $1,999,000 for exercisable options as of December 31, 2012. |
F-24
Table of Contents
The following table presents the activity for the restricted stock program under the 2009 Employee Restricted Stock Plan, which commenced activity during 2011.
| Number of Shares |
Grant Price Per Share |
Weighted Average Grant Price |
||||||||||
| Outstanding at December 31, 2010 |
— | $ | — | $ | — | |||||||
| Granted |
79,800 | 7.99-11.53 | 8.48 | |||||||||
| Cancelled |
(132 | ) | 7.99 | 7.99 | ||||||||
| Vested(1) |
— | — | — | |||||||||
|
|
|
|
|
|
|
|||||||
| Outstanding at December 31, 2011 |
79,668 | 7.99-11.53 | 8.48 | |||||||||
| Granted |
221,693 | 11.08-12.55 | 11.56 | |||||||||
| Cancelled |
(669 | ) | 7.99-11.53 | 10.32 | ||||||||
| Vested(1) |
(375 | ) | 7.99 | 7.99 | ||||||||
|
|
|
|
|
|
|
|||||||
| Outstanding at December 31, 2012(2) |
300,317 | $ | 7.99-12.55 | $ | 10.76 | |||||||
|
|
|
|
|
|
|
|||||||
| (1) | The aggregate fair value of the restricted stock vested was $4.000 and $0 for 2012 and 2011. |
| (2) | The aggregate fair value of the restricted stock was $3,526,000 as of December 31, 2012. |
The following table presents the activity for the unvested options outstanding under the plans for the year ended December 31, 2012.
| Number of Options |
Exercise Price Per Share |
Weighted Average Exercise Price |
||||||||||
| Outstanding at December 31, 2011 |
68,556 | $ | 7.17-8.21 | $ | 7.89 | |||||||
| Granted |
8,000 | 11.53-12.55 | 11.91 | |||||||||
| Cancelled |
— | — | — | |||||||||
| Vested |
(47,389 | ) | 7.17-11.53 | 7.94 | ||||||||
|
|
|
|
|
|
|
|||||||
| Outstanding at December 31, 2012 |
29,167 | $ | 7.17-12.55 | $ | 8.92 | |||||||
|
|
|
|
|
|
|
|||||||
The intrinsic value of the options vested was $128,000, $57,000, and $3,000 in 2012, 2011, and 2010.
The following table summarizes information regarding options outstanding and options exercisable at December 31, 2012 under the 1996 and 2006 Stock Option Plans and the Amended Director Plan.
| Options Outstanding | Options Exercisable | |||||||||||||||||||||||
| Shares at December 31, 2012 |
Weighted average | Shares at December 31, 2012 |
Weighted average | |||||||||||||||||||||
| Range of Exercise |
Remaining contractual life in years |
Exercise price | Remaining contractual life in years |
Exercise price | ||||||||||||||||||||
| $ 3.50 | 17,000 | 0.16 | $ | 3.50 | 17,000 | 0.16 | $ | 3.50 | ||||||||||||||||
| 6.89-13.06 | 954,500 | 4.61 | 9.91 | 925,333 | 4.51 | 9.94 | ||||||||||||||||||
|
|
|
|
|
|||||||||||||||||||||
| $3.50-13.06 | 971,500 | 4.54 | 9.80 | 942,333 | 4.44 | 9.83 | ||||||||||||||||||
|
|
|
|
|
|
|
|
|
|
|
|
|
|||||||||||||
F-25
Table of Contents
The following table summarizes information regarding restricted stock outstanding at December 31, 2012 under the 2009 Employee Restricted Stock Plan.
| Restricted Stock Outstanding | ||||||||||||
| Shares at December 31, 2012 |
Weighted average | |||||||||||
| Range of Grant Prices |
Remaining vesting period in years |
Grant price | ||||||||||
| $7.99-11.89 |
300,317 | 2.25 | $ | 10.76 | ||||||||
|
|
|
|
|
|
|
|||||||
(6) QUARTERLY RESULTS OF OPERATIONS (UNAUDITED)
The following table presents the Company’s quarterly results of operations for the years ended December 31, 2012, 2011, and 2010.
| (Dollars in thousands except per share data) |
March 31 | June 30 | September 30 | December 31 | ||||||||||||
| 2012 Quarter Ended |
||||||||||||||||
| Investment income |
$ | 7,863 | $ | 8,064 | $ | 7,147 | $ | 9,270 | ||||||||
| Net investment income after income taxes |
1,611 | 1,793 | 1,337 | 4,024 | ||||||||||||
| Net increase in net assets resulting from operations |
5,466 | 5,917 | 6,611 | 6,523 | ||||||||||||
| Net increase in net assets resulting from operations per common share |
||||||||||||||||
| Basic |
$ | 0.31 | $ | 0.31 | $ | 0.31 | $ | 0.31 | ||||||||
| Diluted |
0.30 | 0.30 | 0.31 | 0.30 | ||||||||||||
|
|
|
|
|
|
|
|
|
|||||||||
| 2011 Quarter Ended |
||||||||||||||||
| Investment income |
$ | 9,597 | $ | 8,413 | $ | 8,029 | $ | 11,188 | ||||||||
| Net investment income after income taxes |
2,841 | 1,479 | 1,376 | 5,067 | ||||||||||||
| Net increase in net assets resulting from operations |
4,280 | 4,416 | 4,835 | 5,632 | ||||||||||||
| Net increase in net assets resulting from operations per common share |
||||||||||||||||
| Basic |
$ | 0.25 | $ | 0.25 | $ | 0.28 | $ | 0.32 | ||||||||
| Diluted |
0.24 | 0.25 | 0.27 | 0.32 | ||||||||||||
|
|
|
|
|
|
|
|
|
|||||||||
| 2010 Quarter Ended |
||||||||||||||||
| Investment income |
$ | 9,230 | $ | 9,360 | $ | 9,553 | $ | 9,110 | ||||||||
| Net investment income after income taxes |
2,232 | 2,940 | 2,368 | 2,333 | ||||||||||||
| Net increase in net assets resulting from operations |
109 | 3,035 | 3,468 | 4,667 | ||||||||||||
| Net increase in net assets resulting from operations per common share |
||||||||||||||||
| Basic |
$ | 0.01 | $ | 0.17 | $ | 0.20 | $ | 0.27 | ||||||||
| Diluted |
0.01 | 0.17 | 0.20 | 0.27 | ||||||||||||
|
|
|
|
|
|
|
|
|
|||||||||
(7) RECENTLY ISSUED ACCOUNTING STANDARDS
In July 2012, the FASB issued Accounting Standards Update (ASU) 2012-02, “Testing Indefinite-Lived Intangible Assets for Impairment.” ASU 2012-02 revises ASC Topic 350 (Intangibles-Goodwill and Other) by allowing an entity to perform a qualitative assessment to determine whether further impairment testing of indefinite-lived intangible assets is necessary. Prior to the update, an entity was required to assess indefinite-lived intangible assets for impairment by comparing the fair value of an asset to its carrying amount. The update is effective for fiscal years beginning after September 15, 2012. The Company does not believe the adoption of the standard will have an impact on its financial condition or results of operation.
F-26
Table of Contents
In December 2011, the FASB issued Accounting Standards Update (ASU) 2011-11, “Disclosures about Offsetting Assets and Liabilities.” ASU 2011-11 adds certain additional disclosure requirements about financial instruments and derivative instruments that are subject to offsetting and related arrangements. The FASB further clarified the scope of ASU 2011-11 in January 2013 with the issuance of Accounting Standards Update (ASU) 2013-01, “Clarifying the Scope of Disclosures about Offsetting Assets and Liabilities.” The new disclosures are required for annual reporting periods beginning on or after January 1, 2013, and interim periods within those periods. As the amendment impacts disclosures only, it will not have an effect on the Company’s financial condition or results of operation.
(8) SEGMENT REPORTING
We have one business segment, our lending and investing operations. This segment originates and services medallion, secured commercial, and consumer loans, and invests in both marketable and nonmarketable securities.
(9) COMMITMENTS AND CONTINGENCIES
(a) Employment Agreements
The Company has employment agreements with certain key officers for either a one or five-year term. Annually, the contracts with a five-year term will renew for new five-year terms unless prior to the end of the first year, either the Company or the executive provides notice to the other party of its intention not to extend the employment period beyond the current five-year term. Annually, the contracts with a one-year term will renew for new one-year terms unless prior to the term either the Company or the executive provides notice to the other party of its intention not to extend the employment period beyond the current one-year term. In the event of a change in control, as defined, during the employment period, the agreements provide for severance compensation to the executive in an amount equal to the balance of the salary, bonus, and value of fringe benefits which the executive would be entitled to receive for the remainder of the employment period.
Employment agreements expire at various dates through 2017. At December 31, 2012, minimum payments under employment agreements are as follows:
| (Dollars in thousands) |
||||
| 2013 |
$ | 1,075 | ||
| 2014 |
646 | |||
| 2015 |
646 | |||
| 2016 |
646 | |||
| 2017 |
269 | |||
| Thereafter |
— | |||
|
|
|
|||
| Total |
$ | 3,282 | ||
|
|
|
|||
(b) Other Commitments
The Company had portfolio commitments outstanding of $1,050,000 at December 31, 2012. Generally, commitments are on the same terms as loans to or investments in existing borrowers or investees, and generally have fixed expiration dates. Since some commitments are expected to expire without being drawn upon, the total commitment amounts do not necessarily represent future cash requirements. In addition, the Company had approximately $35,008,000 of undisbursed funds relating to revolving credit facilities with borrowers. These amounts may be drawn upon at the customer’s request if they meet certain credit requirements.
F-27
Table of Contents
Commitments for leased premises expire at various dates through December 31, 2021. At December 31, 2012, minimum rental commitments for non-cancelable leases are as follows:
| (Dollars in thousands) |
||||
| 2013 |
$ | 1,248 | ||
| 2014 |
1,213 | |||
| 2015 |
1,207 | |||
| 2016 |
701 | |||
| 2017 |
205 | |||
| Thereafter |
449 | |||
|
|
|
|||
| Total |
$ | 5,023 | ||
|
|
|
|||
Occupancy expense was $828,000, $911,000, and $1,330,000 for the years ended December 31, 2012, 2011, and 2010.
(c) Litigation
The Company and its subsidiaries become defendants to various legal proceedings arising from the normal course of business. In the opinion of management, based on the advice of legal counsel, there is no proceeding pending, or to the knowledge of management threatened, which in the event of an adverse decision would result in a material adverse impact on the financial condition or results of operations of the Company.
(10) RELATED PARTY TRANSACTIONS
Certain directors, officers, and shareholders of the Company are also directors and officers of its wholly-owned subsidiaries, MFC, MCI, FSVC, and Medallion Bank, as well as of certain portfolio investment companies. Officer salaries are set by the Board of Directors of the Company.
A member of the Board of Directors of the Company since 1996 is also of counsel in the Company’s primary law firm. Amounts paid to the law firm were approximately $386,000, $421,000, and $468,000 in 2012, 2011, and 2010. Jeffrey Rudnick, the son of one of the Company’s directors, is an officer of LAX Group, LLC (LAX), one of the Company’s portfolio companies. Mr. Rudnick receives a salary from LAX of $160,000 per year, and certain equity from LAX consisting of 10% ownership in LAX Class B stock, vesting at 3.34% per year; 5% of any new equity raised from outside investors at a valuation of $1,500,000 or higher; and 10% of LAX’s profits as a year end bonus. In addition, Mr. Rudnick provides consulting services to the Company directly for a monthly retainer of $4,200.
At December 31, 2012, 2011, and 2010, MSC serviced $406,956,000, $370,068,000, and $332,053,000 of loans for Medallion Bank. Included in net investment income were amounts as described in the table below that were received from Medallion Bank for services rendered in originating and servicing loans, and also for reimbursement of certain expenses incurred on their behalf.
In December 2010, the Company assigned its servicing rights to the Medallion Bank portfolio to MSC, a wholly-owned unconsolidated portfolio investment. The costs of servicing are allocated to MSC by the Company, and the servicing fee income is billed and collected from Medallion Bank by MSC. As a result, $6,066,000, $5,492,000 and $412,000 of servicing fee income was earned by MSC in the years ended December 31, 2012, 2011, and 2010.
F-28
Table of Contents
The following table summarizes the net revenues received from Medallion Bank.
| Year ended December 31, | ||||||||||||
| (Dollars in thousands) |
2012 | 2011 | 2010 | |||||||||
| Loan origination fees |
$ | 408 | $ | 625 | $ | 819 | ||||||
| Reimbursement of operating expenses |
286 | 243 | 509 | |||||||||
| Servicing fees |
23 | 21 | 2,094 | |||||||||
| Interest income |
— | — | — | |||||||||
|
|
|
|
|
|
|
|||||||
| Total other income |
$ | 717 | $ | 889 | $ | 3,422 | ||||||
|
|
|
|
|
|
|
|||||||
SPAC
Included in investments in controlled subsidiaries at December 31, 2009 was $6,961,000 of investments in and loans to a special purpose acquisition company, Sports Properties Acquisition Corp. (the SPAC), 18%-owned by the Company, which consummated its initial public offering (IPO) in January 2008. Immediately prior to the IPO, the Company purchased warrants for $5,900,000 from the SPAC in a private placement which would have allowed it to acquire 5,900,000 additional shares of common stock in the future under various conditions and restrictions. The SPAC was unable to consummate an approved business combination within 24 months of the IPO, as a result, the Company’s entire investment in the SPAC became worthless in January 2010, and was therefore fully reserved for with a $6,961,000 charge to unrealized depreciation during the year ended December 31, 2009, and was fully written off to realized losses in the 2010 first quarter. All of the assets of the SPAC have been used to repay the public stockholders.
The Company had entered into a consulting agreement with ProEminent Sports, whose principal acted as a consultant to the Company for sports related investments and, included within the scope of his duties, also provided services to the SPAC, including serving as its Chief Executive Officer, and assisting generally with the SPAC’s offering and business combination. The Company had paid ProEminent Sports a monthly fee of $20,000, which during 2009 was reduced to $10,000, and then $0. The Company had previously entered into a consulting agreement with GamePlan, LLC which was terminated as of June 1, 2008, when the SPAC entered into its own consulting agreement with GamePlan, LLC. The Company had paid GamePlan, LLC a monthly fee of $10,000.
The Company had agreed to indemnify the SPAC in the event of the SPAC’s liquidation for all claims of any vendors, service providers, or other entities that were owed money by the SPAC for services rendered or contracted for, or for products sold to the SPAC, including claims of any prospective acquisition targets. At December 31, 2009, the SPAC’s liabilities exceeded its cash on hand by $1,581,000. The SPAC negotiated these liabilities downwards, and obtained forbearance from those associated with a failed deal, and during 2010, $1,292,000 of the expenses were paid, $310,000 were forgiven, and there were no remaining claims outstanding.
Certain of the Company’s officers and directors also served as officers and directors of the SPAC, and in that role entered into agreements with the SPAC and its underwriter(s) to present to the SPAC, prior to presentation to any other person or entity, opportunities to acquire entities, until the earlier of the SPAC’s consummation of a business combination, the SPAC’s liquidation, or until such time as they ceased to be an officer or director of the SPAC. The Company entered into a similar agreement.
SPAC 2
Included in deferred costs in other assets at December 31, 2009 was $759,000 of investments in and loans to a special purpose acquisition company, National Security Solutions, Inc. (SPAC 2), 74%-owned by the Company, which was in organization prior to registration with the SEC to register units for sale in an initial public offering. As a result of the market conditions which led to the failure of the SPAC, it was determined to
F-29
Table of Contents
cease activities related to SPAC 2, and as a result, the investment was fully reserved for with a $759,000 charge to unrealized depreciation during the year ended December 31, 2009, and was fully written off to realized losses in 2010. In addition, the Company had additional realized losses of $20,000 in 2010.
(11) SHAREHOLDERS’ EQUITY
On May 21, 2012, the Company sold 3,500,000 shares at an offering price of $10.72 per share, resulting in net proceeds after closing costs, underwriting commissions, etc. of $34,655,000 as of December 31, 2012.
In November 2003, the Company announced a stock repurchase program which authorized the repurchase of up to $10,000,000 of common stock during the following six months, with an option for the Board of Directors to extend the time frame for completing the purchases, which expires in May 2013. In November 2004, the repurchase program was increased by an additional $10,000,000. As of December 31, 2012, a total of 1,580,615 shares had been repurchased for $13,971,973.
(12) NONINTEREST INCOME AND OTHER OPERATING EXPENSES
The major components of noninterest income were as follows.
| Year ended December 31, | ||||||||||||
| (Dollars in thousands) |
2012 | 2011 | 2010 | |||||||||
| Prepayment fees |
$ | 584 | $ | 561 | $ | 729 | ||||||
| Servicing fees |
223 | 277 | 2,462 | |||||||||
| Late charges |
209 | 213 | 192 | |||||||||
| Other |
119 | 134 | 150 | |||||||||
|
|
|
|
|
|
|
|||||||
| Total noninterest income |
$ | 1,135 | $ | 1,185 | $ | 3,533 | ||||||
|
|
|
|
|
|
|
|||||||
Prepayment fees were up slightly in 2012 compared to 2011, and decreased from 2010 as prepayment activity has slowed now that interest rates have bottom out. The decrease in servicing fees reflected the fluctuations in the servicing and loan origination activities performed for Medallion Bank, and from 2010 also reflect the movement of servicing activities to MSC, an unconsolidated portfolio investment company.
The major components of other operating expenses were as follows.
| Year ended December 31, | ||||||||||||
| (Dollars in thousands) |
2012 | 2011 | 2010 | |||||||||
| Travel, meals, and entertainment |
$ | 855 | $ | 808 | $ | 866 | ||||||
| Miscellaneous taxes |
350 | 424 | 485 | |||||||||
| Directors’ fees |
330 | 405 | 537 | |||||||||
| Office expense |
216 | 232 | 338 | |||||||||
| Insurance |
181 | 180 | 223 | |||||||||
| Depreciation and amortization |
166 | 170 | 218 | |||||||||
| Bank charges |
145 | 130 | 165 | |||||||||
| Loan collection costs and other investment costs |
47 | 74 | (1,545 | ) | ||||||||
| Other expenses |
495 | 782 | 833 | |||||||||
|
|
|
|
|
|
|
|||||||
| Total other operating expenses |
$ | 2,785 | $ | 3,205 | $ | 2,120 | ||||||
|
|
|
|
|
|
|
|||||||
Most expense categories were lower in 2012 and 2011, compared to 2010, as a result of the costs which are being allocated to MSC for servicing-related activities. Travel, meals, and entertainment increased due to an increase in investment development activities in 2012. Miscellaneous taxes were lower in 2012 due to lower
F-30
Table of Contents
franchise and excise taxes. Director’s fees decreased as a result of expense accrual adjustments and fewer meetings. Loan collection costs and other investment costs decreased in 2012 as a result of lower bad debt expenses, and in 2010 reflected $1,312,000 of expense reversals related to the costs of winding up the operations of the SPAC’s that were reclassified to realized losses on investments, and $310,000 that was reversed as a result of favorable negotiations with the creditors of the SPAC.
(13) SELECTED FINANCIAL RATIOS AND OTHER DATA
The following table provides selected financial ratios and other data:
| Year ended December 31, | ||||||||||||||||||||
| (Dollars in thousands, except per share data) |
2012 | 2011 | 2010 | 2009 | 2008 | |||||||||||||||
| Net share data |
||||||||||||||||||||
| Net asset value at the beginning of the year |
$ | 9.68 | $ | 9.35 | $ | 9.27 | $ | 9.97 | $ | 9.86 | ||||||||||
| Net investment income |
0.43 | 0.61 | 0.56 | 0.46 | 0.85 | |||||||||||||||
| Income tax (provision) benefit |
0.00 | 0.00 | 0.00 | 0.00 | 0.00 | |||||||||||||||
| Net realized gains (losses) on investments |
(0.33 | ) | (0.03 | ) | (0.43 | ) | (0.23 | ) | (0.21 | ) | ||||||||||
| Net change in unrealized appreciation (depreciation) on investments |
1.11 | 0.51 | 0.51 | (0.17 | ) | 0.22 | ||||||||||||||
|
|
|
|
|
|
|
|
|
|
|
|||||||||||
| Net increase in net assets resulting from operations |
1.21 | 1.09 | 0.64 | 0.06 | 0.86 | |||||||||||||||
| Issuance of common stock |
(0.07 | ) | (0.04 | ) | — | — | — | |||||||||||||
| Repurchase of common stock |
— | — | 0.03 | — | — | |||||||||||||||
| Distribution of net investment income |
(0.39 | ) | (0.70 | ) | (0.60 | ) | (0.76 | ) | (0.76 | ) | ||||||||||
| Distribution of net realized gains on investments |
— | — | — | — | — | |||||||||||||||
| Return of capital |
(0.44 | ) | — | — | — | — | ||||||||||||||
| Other |
— | (0.02 | ) | 0.01 | — | 0.01 | ||||||||||||||
|
|
|
|
|
|
|
|
|
|
|
|||||||||||
| Total increase (decrease) in net asset value |
0.31 | 0.33 | 0.08 | (0.70 | ) | 0.11 | ||||||||||||||
|
|
|
|
|
|
|
|
|
|
|
|||||||||||
| Net asset value at the end of the year(1) |
$ | 9.99 | $ | 9.68 | $ | 9.35 | $ | 9.27 | $ | 9.97 | ||||||||||
|
|
|
|
|
|
|
|
|
|
|
|||||||||||
| Per share market value at beginning of year |
$ | 11.38 | $ | 8.20 | $ | 8.17 | $ | 7.63 | $ | 10.02 | ||||||||||
| Per share market value at end of year |
11.74 | 11.38 | 8.20 | 8.17 | 7.63 | |||||||||||||||
| Total return(2) |
11 | % | 49 | % | 8 | % | 18 | % | (16 | %) | ||||||||||
|
|
|
|
|
|
|
|
|
|
|
|||||||||||
| Ratios/supplemental data |
||||||||||||||||||||
| Total shareholders’ equity (net assets) |
$ | 216,318 | $ | 171,504 | $ | 162,765 | $ | 162,977 | $ | 174,946 | ||||||||||
| Average net assets |
197,504 | 166,738 | 161,620 | 172,558 | 174,082 | |||||||||||||||
| Total expense ratio(3) (4) (5) |
13 | % | 17 | % | 19 | % | 21 | % | 24 | % | ||||||||||
| Operating expenses to average net assets(4) (5) |
7.02 | 8.46 | 10.10 | 11.43 | 9.95 | |||||||||||||||
| Net investment income after taxes to average net assets(5) |
4.44 | 6.46 | 6.11 | 4.74 | 8.67 | |||||||||||||||
|
|
|
|
|
|
|
|
|
|
|
|||||||||||
| (1) | Includes $0.00, $0.06, $0.17, $0.29, and $0.08 of undistributed net investment income per share as of December 31, 2012, 2011, 2010, 2009, and 2008, and $0.00 of undistributed net realized gains per share for all years presented. |
| (2) | Total return is calculated by dividing the change in market value of a share of common stock during the year, assuming the reinvestment of dividends on the payment date, by the per share market value at the beginning of the year. |
| (3) | Total expense ratio represents total expenses (interest expense, operating expenses, and income taxes) divided by average net assets. |
| (4) | Includes $1,312 of expense reversals related to the costs of winding up the operations of the SPAC’s that were reclassified to realized losses on investments, and $310 that was reversed as a result of favorable |
F-31
Table of Contents
| negotiations with the creditors of SPAC in 2010, and includes $1,622 of costs related to winding up the operations of the SPAC’s in 2009. Excluding these amounts, the total expense ratios were 20% in 2010 and 2009, and the operating expense ratios were 11.11% and 10.49%. |
| (5) | In December 2010, MSC assumed our servicing obligations, and as a result, servicing fee income of $6,066, $5,492, and $412 and operating expenses of $6,359, $5,659, and $349 which formerly were the Company’s, were now MSC’s for the years ended December 31, 2012, 2011, and 2010. Excluding the impact of the MSC amounts, the total expense ratio, operating expense ratio, and net investment income ratio would have been 15.73%, 10.23%, and 4.29% in 2012, 20%, 12%, and 6.36% in 2011, and 20%, 11.32%, and 6.15% in 2010, also including the amounts referred to in footnote 4 to this table. |
(14) EMPLOYEE BENEFIT PLANS
The Company has a 401(k) Investment Plan (the 401(k) Plan) which covers all full-time and part-time employees of the Company who have attained the age of 21 and have a minimum of one year of service, including the employees of Medallion Bank. Under the 401(k) Plan, an employee may elect to defer not less than 1% and no more than 15% of the total annual compensation that would otherwise be paid to the employee, provided, however, that employee’s contributions may not exceed certain maximum amounts determined under the Internal Revenue Code. Employee contributions are invested in various mutual funds according to the directions of the employee. The Company matches employee contributions to the 401(k) Plan in an amount per employee up to one-third of such employee’s contribution but in no event greater than 2% of the portion of such employee’s annual salary eligible for 401(k) Plan benefits. The Company’s 401(k) plan expense, including amounts for the employees of Medallion Bank and other unconsolidated, wholly-owned portfolio companies, was approximately $153,000, $154,000, and $134,000 for the years ended December 31, 2012, 2011, and 2010.
(15) FAIR VALUE OF FINANCIAL INSTRUMENTS
FASB ASC Topic 825, “Financial Instruments,” requires disclosure of fair value information about certain financial instruments, whether assets, liabilities, or off-balance-sheet commitments, if practicable. The following methods and assumptions were used to estimate the fair value of each class of financial instrument. Fair value estimates that were derived from broker quotes cannot be substantiated by comparison to independent markets and, in many cases, could not be realized in immediate settlement of the instrument.
(a) Investments—The Company’s investments are recorded at the estimated fair value of such investments.
(b) Floating rate borrowings—Due to the short-term nature of these instruments, the carrying amount approximates fair value.
(c) Commitments to extend credit—The fair value of commitments to extend credit is estimated using the fees currently charged to enter into similar agreements, taking into account the remaining terms of the agreements and present creditworthiness of the counter parties. For fixed rate loan commitments, fair value also includes a consideration of the difference between the current levels of interest rates and the committed rates. At December 31, 2012 and 2011, the estimated fair value of these off-balance-sheet instruments was not material.
F-32
Table of Contents
(d) Fixed rate borrowings—The fair value of the debentures payable to the SBA is estimated based on current market interest rates for similar debt.
| December 31, 2012 | December 31, 2011 | |||||||||||||||
| (Dollars in thousands) |
Carrying Amount |
Fair Value | Carrying Amount |
Fair Value | ||||||||||||
| Financial assets |
||||||||||||||||
| Investments |
$ | 455,010 | $ | 455,010 | $ | 451,835 | $ | 451,835 | ||||||||
| Cash(1) |
26,875 | 26,875 | 29,352 | 29,352 | ||||||||||||
| Accrued interest receivable(2) |
957 | 957 | 1,120 | 1,120 | ||||||||||||
| Financial liabilities |
||||||||||||||||
| Funds borrowed(2) |
322,770 | 322,770 | 357,779 | 357,779 | ||||||||||||
| Accrued interest payable(2) |
1,233 | 1,233 | 1,708 | 1,708 | ||||||||||||
|
|
|
|
|
|
|
|
|
|||||||||
| (1) | Categorized as level 1 within the fair value hierarchy. |
| (2) | Categorized as level 3 within the fair value hierarchy. |
(16) FAIR VALUE OF ASSETS AND LIABILITIES
The Company follows the provisions of FASB ASC 820, which defines fair value, establishes a framework for measuring fair value, establishes a fair value hierarchy based on the quality of inputs used to measure fair value, and enhances disclosure requirements for fair value measurements. The Company accounts for substantially all of its financial instruments at fair value or considers fair value in its measurement, in accordance with the accounting guidance for investment companies. See Note 2 sections “Fair Value of Assets and Liabilities” and “Investment Valuation” for a description of our valuation methodology which is unchanged during 2012.
In accordance with FASB ASC 820, the Company has categorized its assets and liabilities measured at fair value, based on the priority of the inputs to the valuation technique, into a three-level fair value hierarchy. The fair value hierarchy gives the highest priority to quoted prices in active markets for identical assets or liabilities (level 1) and the lowest priority to unobservable inputs (level 3). Our assessment and classification of an investment within a level can change over time based upon maturity or liquidity of the investment and would be reflected at the beginning of the quarter in which the change occurred.
As required by FASB ASC 820, when the inputs used to measure fair value fall within different levels of the hierarchy, the level within which the fair value measurement is categorized is based on the lowest level input that is significant to the fair value measurement in its entirety. For example, a level 3 fair value measurement may include inputs that are observable (level 1 and 2) and unobservable (level 3). Therefore gains and losses for such assets and liabilities categorized within the level 3 table below may include changes in fair value that are attributable to both observable inputs (level 1 and 2) and unobservable inputs (level 3).
Assets and liabilities measured at fair value, recorded on the consolidated balance sheets are categorized based on the inputs to the valuation techniques as follows:
Level 1. Assets and liabilities whose values are based on unadjusted quoted prices for identical assets or liabilities in an active market that the Company has the ability to access (examples include active exchange-traded equity securities, exchange-traded derivatives, most US Government and agency securities, and certain other sovereign government obligations).
Level 2. Assets and liabilities whose values are based on quoted prices in markets that are not active or model inputs that are observable either directly or indirectly for substantially the full term of the asset or liability. Level 2 inputs include the following:
| A) | Quoted prices for similar assets or liabilities in active markets (for example, restricted stock); |
F-33
Table of Contents
| B) | Quoted price for identical or similar assets or liabilities in non-active markets (for example, corporate and municipal bonds, which trade infrequently); |
| C) | Pricing models whose inputs are observable for substantially the full term of the asset or liability (examples include most over-the-counter derivatives, including interest rate and currency swaps); and |
| D) | Pricing models whose inputs are derived principally from or corroborated by observable market data through correlation or other means for substantially the full term of the asset or liability (examples include certain residential and commercial mortgage-related assets, including loans, securities, and derivatives). |
Level 3. Assets and liabilities whose values are based on prices or valuation techniques that require inputs that are both unobservable and significant to the overall fair value measurement. These inputs reflect management’s own assumptions about the assumptions a market participant would use in pricing the assets or liability (examples include certain private equity investments, certain residential and commercial mortgage-related assets (including loans, securities, and derivatives).
A review of fair value hierarchy classification is conducted on a quarterly basis. Changes in the observability of valuation inputs may result in a reclassification for certain assets or liabilities. Reclassifications impacting level 3 of the fair value hierarchy are reported as transfers in/out of the level 3 category as of the beginning of the quarter in which the reclassifications occur.
The following tables present Medallion’s fair value hierarchy for those assets and liabilities measured at fair value on a recurring basis as of December 31, 2012 and 2011.
| 2012 (Dollars in thousands) |
Level 1 | Level 2 | Level 3 | Total | ||||||||||||
| Assets |
||||||||||||||||
| Medallion loans |
$ | — | $ | — | $ | 294,388 | $ | 294,388 | ||||||||
| Commercial loans |
— | — | 56,919 | 56,919 | ||||||||||||
| Investment in Medallion Bank and other controlled subsidiaries |
— | — | 99,083 | 99,083 | ||||||||||||
| Equity investments |
231 | — | 4,389 | 4,620 | ||||||||||||
| Other assets |
— | 52,449 | — | 52,449 | ||||||||||||
|
|
|
|
|
|
|
|
|
|||||||||
| 2011 (Dollars in thousands) |
Level 1 | Level 2 | Level 3 | Total | ||||||||||||
| Assets |
||||||||||||||||
| Medallion loans |
$ | — | $ | — | $ | 307,167 | $ | 307,167 | ||||||||
| Commercial loans |
— | — | 54,159 | 54,159 | ||||||||||||
| Investment in Medallion Bank and other controlled subsidiaries |
— | — | 85,932 | 85,932 | ||||||||||||
| Equity investments |
231 | — | 4,346 | 4,577 | ||||||||||||
| Other assets |
— | 43,822 | — | 43,822 | ||||||||||||
|
|
|
|
|
|
|
|
|
|||||||||
Included in level 3 investments in Medallion Bank and other controlled subsidiaries is the investment in Medallion Bank, MSC, and investments in a start-up business engaged in media-buying consulting. Included in level 3 equity investments are unregistered shares of common stock in a publicly-held company, as well as certain private equity positions in non-marketable securities.
F-34
Table of Contents
The following tables provide a summary of changes in fair value of Medallion’s level 3 assets and liabilities for the years ended December 31, 2012 and 2011.
| (Dollars in thousands) |
Medallion Loans | Commercial Loans | Investment in Medallion Bank & Other Controlled Subs |
Equity Investments |
Other Assets | |||||||||||||||
| December 31, 2011 |
$ | 307,167 | $ | 54,159 | $ | 85,932 | $ | 4,346 | — | |||||||||||
| Gains (losses) included in earnings |
4 | (840 | ) | 18,396 | (428 | ) | — | |||||||||||||
| Purchases, investments, and issuances |
149,726 | 18,374 | 8,553 | 950 | — | |||||||||||||||
| Sales, maturities, settlements, and distributions |
(162,509 | ) | (14,774 | ) | (13,798 | ) | (479 | ) | — | |||||||||||
|
|
|
|
|
|
|
|
|
|
|
|||||||||||
| December 31, 2012 |
294,388 | 56,919 | 99,083 | 4,389 | — | |||||||||||||||
|
|
|
|
|
|
|
|
|
|
|
|||||||||||
| Amounts related to held assets(1) |
$ | — | ($ | 758 | ) | $ | 18,396 | $ | 908 | — | ||||||||||
|
|
|
|
|
|
|
|
|
|
|
|||||||||||
| (1) | Total realized and unrealized gains (losses) included in income for the year which relate to assets held as of December 31, 2012. |
| (Dollars in thousands) |
Medallion Loans | Commercial Loans | Investment in Medallion Bank & Other Controlled Subs |
Equity Investments |
Other Assets | |||||||||||||||
| December 31, 2010 |
$ | 323,126 | $ | 76,866 | $ | 78,735 | $ | 4,509 | — | |||||||||||
| Gains (losses) included in earnings |
— | (5,754 | ) | 13,168 | 3,080 | — | ||||||||||||||
| Purchases, investments, and issuances |
191,871 | 6,213 | 3,434 | — | — | |||||||||||||||
| Sales, maturities, settlements, and distributions |
(207,830 | ) | (23,166 | ) | (9,405 | ) | (3,243 | ) | — | |||||||||||
|
|
|
|
|
|
|
|
|
|
|
|||||||||||
| December 31, 2011 |
307,167 | 54,159 | 85,932 | 4,346 | — | |||||||||||||||
|
|
|
|
|
|
|
|
|
|
|
|||||||||||
| Amounts related to held assets(1) |
$ | — | ($ | 5,708 | ) | $ | 13,168 | $ | 606 | — | ||||||||||
|
|
|
|
|
|
|
|
|
|
|
|||||||||||
| (1) | Total realized and unrealized gains (losses) included in income for the year which relate to assets held as of December 31, 2011. |
(17) SUBSEQUENT EVENTS
We have evaluated subsequent events that have occurred through March 12, 2013, the date of financial statement issuance.
On February 19, 2013, the Company’s Board of Directors declared a $0.22 per share common stock dividend, payable on March 28, 2013 to shareholders of record on March 21, 2013.
In February 2013, the SBA granted a $15,000,000 leverage commitment to FSVC, upon the payment of a $150,000 fee, which expires September 30, 2017. FSVC drew upon this commitment to pay off $15,000,000 of maturing debentures in March 2013.
In January 2013, the SBA granted a $5,000,000 leverage commitment to MCI, upon the payment of a $50,000 fee, which expires September 30, 2017.
In January 2013, the Company amended one of its note agreements to allow the facility to be used by both the Company and MFC, and also eliminated the interest rate floor.
F-35
Table of Contents
Medallion Financial Corp.
Consolidated Summary Schedule of Investments
December 31, 2012
| (Dollars in thousands) |
Obligor Name/Interest Rate Range |
Security Type (all restricted unless otherwise noted) |
Acquisition Date |
Maturity Date |
# of Invest. |
% of Net Assets |
Interest Rate(1) |
Original Cost of 2012 Acquisitions(5) |
Cost(4) | Fair Value |
||||||||||||||||||||||||
| Medallion Loans |
||||||||||||||||||||||||||||||||||
| New York |
419 | 96 | % | 3.96 | % | $ | 98,361 | $ | 208,564 | $ | 208,563 | |||||||||||||||||||||||
| Lena Cab Corp ## | Term Loan | 12/9/2011 | 12/09/15 | 1 | 2 | % | 3.60 | % | $ | 3,680 | $ | 3,665 | ||||||||||||||||||||||
| Sean Cab Corp ## | Term Loan | 12/9/2011 | 12/08/15 | 1 | 2 | % | 3.60 | % | $ | 3,680 | $ | 3,665 | ||||||||||||||||||||||
| Real Cab Corp | Term Loan | 7/20/2007 | 07/20/17 | 1 | 1 | % | 2.81 | % | $ | 2,545 | $ | 2,545 | ||||||||||||||||||||||
| Sifnos, Van-Dim, Kitriani Incs ## | Term Loan | 6/8/2010 | 05/01/15 | 1 | 1 | % | 4.00 | % | $ | 2,524 | $ | 2,513 | ||||||||||||||||||||||
| Lety Cab Corp ## | Term Loan | 10/21/2010 | 10/20/15 | 1 | 1 | % | 4.00 | % | $ | 1,605 | $ | 1,598 | ||||||||||||||||||||||
| Slo Cab Corp | Term Loan | 7/20/2007 | 07/20/17 | 1 | 1 | % | 2.81 | % | $ | 1,527 | $ | 1,527 | ||||||||||||||||||||||
| Christian Cab Corp | Term Loan | 11/27/2012 | 11/27/15 | 1 | 1 | % | 4.00 | % | $ | 1,500 | $ | 1,500 | $ | 1,502 | ||||||||||||||||||||
| Silke Hacking Corp ## | Term Loan | 12/26/2012 | 12/26/15 | 1 | 1 | % | 3.50 | % | $ | 1,450 | $ | 1,450 | $ | 1,452 | ||||||||||||||||||||
| Hoyt Cab Corp ## | Term Loan | 12/26/2012 | 12/26/15 | 1 | 1 | % | 3.50 | % | $ | 1,450 | $ | 1,450 | $ | 1,452 | ||||||||||||||||||||
| Bunty & Jyoti Inc ## | Term Loan | 12/7/2012 | 12/07/15 | 1 | 1 | % | 3.75 | % | $ | 1,450 | $ | 1,450 | $ | 1,446 | ||||||||||||||||||||
| Sonu-Seema Corp ## | Term Loan | 12/7/2012 | 12/07/15 | 1 | 1 | % | 3.75 | % | $ | 1,450 | $ | 1,450 | $ | 1,446 | ||||||||||||||||||||
| Nancy Transit Inc ## | Term Loan | 11/6/2012 | 11/06/15 | 1 | 1 | % | 4.15 | % | $ | 1,425 | $ | 1,423 | $ | 1,415 | ||||||||||||||||||||
| Perem Hacking Corp ## | Term Loan | 12/5/2012 | 12/05/15 | 1 | 1 | % | 3.50 | % | $ | 1,400 | $ | 1,398 | $ | 1,394 | ||||||||||||||||||||
| S600 Service Co Inc ## | Term Loan | 12/5/2012 | 12/05/15 | 1 | 1 | % | 3.50 | % | $ | 1,400 | $ | 1,398 | $ | 1,394 | ||||||||||||||||||||
| Daytona Hacking Corp ## | Term Loan | 6/1/2012 | 06/01/15 | 1 | 1 | % | 3.75 | % | $ | 1,400 | $ | 1,383 | $ | 1,385 | ||||||||||||||||||||
| Uddin Taxi Corp ## | Term Loan | 11/14/2012 | 11/14/15 | 1 | 1 | % | 5.25 | % | $ | 1,378 | $ | 1,378 | $ | 1,371 | ||||||||||||||||||||
| Nosilla Service Co., Inc ## | Term Loan | 8/13/2012 | 08/13/15 | 1 | 1 | % | 3.63 | % | $ | 1,350 | $ | 1,336 | $ | 1,332 | ||||||||||||||||||||
| Ming Trans Corp ## | Term Loan | 11/19/2012 | 12/01/16 | 1 | 1 | % | 3.70 | % | $ | 1,300 | $ | 1,300 | $ | 1,297 | ||||||||||||||||||||
| Orys Trans Corp ## | Term Loan | 9/26/2011 | 07/22/13 | 1 | 1 | % | 3.00 | % | $ | 1,279 | $ | 1,280 | ||||||||||||||||||||||
| Sandhu & Baath Inc/Note 2 Of 2 ## | Term Loan | 5/10/2011 | 05/10/14 | 1 | * | 4.75 | % | $ | 638 | $ | 636 | |||||||||||||||||||||||
| Sandhu & Baath Inc/Note 1 Of 2 ## | Term Loan | 5/10/2011 | 05/10/14 | 1 | * | 4.75 | % | $ | 636 | $ | 634 | |||||||||||||||||||||||
| Real Cab Corp | Term Loan | 7/20/2007 | 07/20/17 | 1 | * | 2.81 | % | $ | 350 | $ | 350 | |||||||||||||||||||||||
| Slo Cab Corp | Term Loan | 7/20/2007 | 07/20/17 | 1 | * | 2.81 | % | $ | 210 | $ | 210 | |||||||||||||||||||||||
| Various New York && |
2.22% to 10.13% | Term Loan | 12/20/00 to |
02/02/13 to 09/10/23 |
396 | 80 | % | 4.02 | % | $ | 81,408 | $ | 172,974 | $ | 173,054 | |||||||||||||||||||
| Chicago |
115 | 19 | % | 5.28 | % | $ | 31,955 | $ | 40,405 | $ | 40,449 | |||||||||||||||||||||||
| Cozy Cab Et Al ## | Term Loan | 12/22/2011 | 12/22/14 | 1 | 2 | % | 5.50 | % | $ | 3,380 | $ | 3,368 | ||||||||||||||||||||||
| Sweetgrass Peach &Chadwick Cap ## | Term Loan | 8/28/2012 | 08/28/15 | 1 | 1 | % | 5.50 | % | $ | 1,750 | $ | 1,737 | $ | 1,731 | ||||||||||||||||||||
| Chicago Medallion Nine Llc ## | Term Loan | 5/2/2012 | 05/02/17 | 1 | 1 | % | 5.75 | % | $ | 1,440 | $ | 1,413 | $ | 1,408 | ||||||||||||||||||||
| Lucky Seven Chicago One Inc ## | Term Loan | 7/19/2012 | 07/19/15 | 1 | 1 | % | 4.88 | % | $ | 1,290 | $ | 1,281 | $ | 1,278 | ||||||||||||||||||||
| Blue Eyes Cab Corp ## | Term Loan | 7/19/2012 | 07/19/15 | 1 | 1 | % | 4.88 | % | $ | 1,290 | $ | 1,281 | $ | 1,277 | ||||||||||||||||||||
F-36
Table of Contents
| (Dollars in thousands) |
Obligor Name/Interest Rate Range |
Security Type (all restricted unless otherwise noted) |
Acquisition Date |
Maturity Date |
# of Invest. |
% of Net Assets |
Interest Rate(1) |
Original Cost of 2012 Acquisitions(5) |
Cost(4) | Fair Value |
||||||||||||||||||||||||
| Various Chicago |
4.50% to 8.75% | Term Loan | 01/22/10 to 12/14/12 |
01/22/13 to 12/14/17 |
110 | 15 | % | 5.25 | % | $ | 26,185 | $ | 31,313 | $ | 31,387 | |||||||||||||||||||
| Newark && |
5.25% to 8.75% | Term Loan | 12/07/06 to 12/13/12 |
01/08/13 to 12/13/17 |
99 | 8 | % | 6.70 | % | $ | 6,214 | $ | 17,342 | $ | 17,427 | |||||||||||||||||||
| Boston |
51 | 9 | % | 5.47 | % | $ | 13,211 | $ | 19,713 | $ | 19,776 | |||||||||||||||||||||||
| Chidi Trans Inc ## | Term Loan | 11/17/2011 | 11/17/14 | 1 | * | 6.00 | % | $ | 701 | $ | 699 | |||||||||||||||||||||||
| Ngozi Trans Inc. | Term Loan | 12/31/2012 | 12/31/15 | 1 | * | 4.50 | % | $ | 660 | $ | 660 | $ | 663 | |||||||||||||||||||||
| Chidi Trans Inc | Term Loan | 4/20/2012 | 04/20/15 | 1 | * | 5.50 | % | $ | 664 | $ | 655 | $ | 657 | |||||||||||||||||||||
| Ngozi Trans Inc. ## | Term Loan | 4/20/2012 | 04/20/15 | 1 | * | 5.50 | % | $ | 377 | $ | 369 | $ | 371 | |||||||||||||||||||||
| Ngozi Trans Inc. | Term Loan | 12/31/2012 | 12/31/15 | 1 | * | 4.50 | % | $ | 330 | $ | 330 | $ | 333 | |||||||||||||||||||||
| Various Boston && 3.50% to 7.75% | Term Loan | 06/12/07 to 12/28/12 |
02/05/13 to 06/12/18 |
46 | 8 | % | 5.51 | % | $ | 11,180 | $ | 16,998 | $ | 17,053 | ||||||||||||||||||||
| Cambridge |
4.00% to 9.22% | Term Loan | 09/19/08 to 12/07/12 |
02/19/13 to 11/18/20 |
18 | 2 | % | 5.74 | % | $ | 1,720 | $ | 5,260 | $ | 5,275 | |||||||||||||||||||
| Other |
12 | 1 | % | 6.70 | % | $ | 224 | $ | 2,899 | $ | 2,898 | |||||||||||||||||||||||
| Philadelphia |
Dorit Matityahu ## | Term Loan | 8/4/2011 | 08/04/14 | 1 | 1 | % | 6.25 | % | $ | 2,132 | $ | 2,124 | |||||||||||||||||||||
| Various Other && |
6.00% to 11.50% | Term Loan | 11/26/07 to 01/09/12 |
04/28/13 to 03/10/18 |
11 | * | 7.95 | % | $ | 224 | $ | 767 | $ | 774 | ||||||||||||||||||||
|
|
|
|
|
|
|
|
|
|
|
|
|
|||||||||||||||||||||||
|
Total medallion loans ($227,521 pledged as collateral under borrowing arrangements) |
715 | 136 | % | 4.46 | % | $ | 151,685 | $ | 294,183 | $ | 294,388 | |||||||||||||||||||||||
|
|
|
|
|
|
|
|
|
|
|
|
|
|||||||||||||||||||||||
| Commercial Loans |
||||||||||||||||||||||||||||||||||
| Secured mezzanine (29% Minnesota, 14% Oklahoma, 9% North Carolina, 9% Texas, 8% New York 7% California, 6% Wisconsin, 5% Arizona, 5% Florida and 8% all other states(2) Manufacturing (68% of the total) |
||||||||||||||||||||||||||||||||||
| + | Packaging Specialists (interest rate includes PIK interest of 6.00%) (capitalized interest of $224 per footnote 2) |
Term Loan | 04/01/08 | 12/31/13 | 1 | 1 | % | 14.00 | % | $ | 2,214 | $ | 2,214 | |||||||||||||||||||||
| Process Fab & (interest rate includes PIK interest of 8.00%) |
Term Loan | 04/17/08 | 12/31/15 | 1 | 1 | % | 8.00 | % | $ | 4,500 | $ | 2,815 | ||||||||||||||||||||||
| + | PACA Foods & |
Term Loan | 12/31/10 | 12/31/15 | 1 | 1 | % | 13.00 | % | $ | 2,623 | $ | 2,021 | |||||||||||||||||||||
F-37
Table of Contents
Medallion Financial Corp.
Consolidated Summary Schedule of Investments
December 31, 2012
| (Dollars in thousands) |
Obligor Name/Interest Rate Range |
Security |
Acquisition Date |
Maturity Date |
# of Invest. |
% of Net Assets |
Interest Rate(1) |
Original Cost of 2012 Acquisitions(5) |
Cost(4) | Fair Value |
||||||||||||||||||||||
| Aeration & (interest rate includes PIK interest of 21.00%) (capitalized interest of $81 per footnote 2) |
Term Loan | 12/31/10 | 04/30/13 | 1 | 1 | % | 21.00 | % | $ | 2,416 | $ | 2,187 | ||||||||||||||||||||
| + | RespirTech | Term Loan | 04/25/12 | 04/25/17 | 1 | 1 | % | 12.00 | % | $ | 1,500 | $ | 1,500 | $ | 1,510 | |||||||||||||||||
| Motion Tech (interest rate includes PIK interest of 6.00%) (capitalized interest of $38 per footnote 2) |
Term Loan | 12/23/10 | 12/23/15 | 1 | 1 | % | 18.00 | % | $ | 1,325 | $ | 1,329 | ||||||||||||||||||||
| Dynamic Systems (interest rate includes PIK interest of 3.50%) (capitalized interest of $33 per footnote 2) |
Term Loan | 12/23/10 | 12/23/17 | 1 | 1 | % | 15.50 | % | $ | 1,858 | $ | 1,858 | ||||||||||||||||||||
| Reel Power (capitalized interest of $86 per footnote 2) |
Term Loan | 12/31/09 | 02/04/14 | 1 | 2 | % | 14.00 | % | $ | 3,587 | $ | 3,587 | ||||||||||||||||||||
| Orchard & | Term Loan | 03/10/99 | Matured | 1 | 1 | % | 13.00 | % | $ | 1,390 | $ | 1,390 | ||||||||||||||||||||
| Bluff Manufacturing (interest rate includes PIK interest of 3.50%) (capitalized interest of $5 per footnote 2) |
Term Loan | 12/14/12 | 12/14/17 | 1 | 1 | % | 15.50 | % | $ | 3,000 | $ | 3,005 | $ | 3,016 | ||||||||||||||||||
| + |
Quaker Bakery (interest rate includes PIK interest of 5.00%) (capitalized interest of $103 per footnote 2) |
Term Loan | 3/28/2012 | 3/28/2017 | 1 | 1 | % | 17.00 | % | $ | 2,600 | $ | 2,703 | $ | 2,692 | |||||||||||||||||
| Various Other && 12.00% to 14.00% (capitalized interest of $69 per footnote 2) |
Term Loan | 12/15/04 to 07/17/12 |
03/31/13 to 07/17/17 |
4 | 2 | % | 13.16 | % | $ | 1,625 | $ | 3,723 | $ | 3,738 | ||||||||||||||||||
| Administrative and Support Services (12% of the total) |
Verifications | Term Loan | 09/06/12 | 09/06/17 | 1 | 1 | % | 12.00 | % | $ | 2,500 | $ | 2,500 | $ | 2,517 | |||||||||||||||||
| + | Staff One & (interest rate includes PIK interest of 13.00%) |
Term Loan | 06/30/08 | 12/31/13 | 1 | 1 | % | 13.00 | % | $ | 3,306 | $ | 1,854 | |||||||||||||||||||
| + | Staff One & (interest rate includes PIK interest of 13.00%) |
Term Loan | 09/15/11 | 12/31/13 | 1 | * | 13.00 | % | $ | 615 | $ | 615 | ||||||||||||||||||||
F-38
Table of Contents
| (Dollars in thousands) |
Obligor Name/Interest Rate Range |
Security |
Acquisition Date |
Maturity Date |
# of Invest. |
% of Net Assets |
Interest Rate(1) |
Original Cost of 2012 Acquisitions(5) |
Cost(4) | Fair Value |
||||||||||||||||||||||
| Various Other && 19% (capitalized interest of $198 per footnote 2) |
Term Loan | 1/14/2005 | Matured | 1 | * | 19.00 | % | $ | 989 | $ | 0 | |||||||||||||||||||||
| Arts, Entertainment, and Recreation (9% of the total) |
RPAC Racing (interest rate includes PIK interest of 10.00%) (capitalized interest of $703 per footnote 2) |
Term Loan | 11/19/10 | 11/19/15 | 1 | 2 | % | 10.00 | % | $ | 3,742 | $ | 3,742 | |||||||||||||||||||
| Professional, Scientific, and Technical Services (6% of the total) + |
Portu-Sunberg |
Term Loan | 12/31/12 | 12/31/17 | 1 | 1 | % | 12.00 | % | $ | 2,500 | $ | 2,500 | $ | 2,514 | |||||||||||||||||
| Various Other && 10% (capitalized interest of $96 per footnote 2) |
Term Loan | 10/26/2011 | 11/1/2014 | 1 | * | 10.00 | % | $ | 96 | $ | 96 | |||||||||||||||||||||
| Accommodation and Food Services (2% of the total) |
Various Other && 9.25% to 10.00% (capitalized interest of $179 per footnote 2) |
Term Loan | 06/30/00 to 11/05/10 |
10/01/15 to 11/05/15 |
3 | * | 9.86 | % | $ | 3,035 | $ | 985 | ||||||||||||||||||||
| Health Care and Social Assistance (2% of the total) + |
Various Other && 7% |
Term Loan | 6/28/2007 | 6/30/2017 | 1 | * | 7.00 | % | $ | 1,219 | $ | 919 | ||||||||||||||||||||
| Retail Trade (1% of the total) |
Various Other && 10% (capitalized interest of $2 per footnote 2) |
Term Loan | 6/30/2000 | 10/1/2015 | 1 | * | 10.00 | % | $ | 610 | $ | 234 | ||||||||||||||||||||
|
|
|
|
|
|
|
|
|
|
|
|
|
|||||||||||||||||||||
| Total secured mezzanine(2) |
27 | 19 | % | 13.04 | % | $ | 13,725 | $ | 49,456 | $ | 41,833 | |||||||||||||||||||||
|
|
|
|
|
|
|
|
|
|
|
|
|
|||||||||||||||||||||
| Asset-based Other secured commercial (74% New York, 12% New Jersey, 5% Delaware and 9% all other states) |
|
|||||||||||||||||||||||||||||||
| Wholesale Trade (43% of the total) |
||||||||||||||||||||||||||||||||
| Capitalsea, LLC ## | Revolving line of credit | 11/07/05 | 11/07/13 | 1 | 1 | % | 4.50 | % | $ | 1,558 | $ | 1,530 | ||||||||||||||||||||
| Various Other 4.75% to 6.75% ## | Revolving line of credit | 01/23/99 to 06/01/12 |
01/14/13 to 11/30/13 |
9 | 1 | % | 5.87 | % | $ | 74 | $ | 2,013 | $ | 1,974 | ||||||||||||||||||
| Transportation and Warehousing (19% of the total) |
Various Other 5.75% to 8.00% ## | Revolving line of credit | 12/31/01 to 07/20/07 |
02/06/13 to 12/31/13 |
5 | 1 | % | 6.58 | % | $ | 1,459 | $ | 1,427 | |||||||||||||||||||
| Retail Trade (10% of the total) |
Various Other 4.75% to 6.31% ## | Revolving line of credit | 10/19/98 to 08/31/06 |
07/24/13 to 12/21/13 |
5 | * | 5.73 | % | $ | 738 | $ | 716 | ||||||||||||||||||||
F-39
Table of Contents
| (Dollars in thousands) |
Obligor Name/Interest Rate Range |
Security |
Acquisition Date |
Maturity Date |
# of Invest. |
% of Net Assets |
Interest Rate(1) |
Original Cost of 2012 Acquisitions(5) |
Cost(4) | Fair Value |
||||||||||||||||||||||
| Finance and Insurance (9% of the total) |
Various Other 4.25% to 8.25% | Revolving line of credit | 02/06/02 to 11/10/11 |
02/06/13 to 11/10/13 |
6 | * | 6.28 | % | $ | 678 | $ | 644 | ||||||||||||||||||||
| Construction (7% of the total) |
Various Other 5.75% to 6.00% ## | Revolving line of credit | 06/29/99 to 07/20/99 |
06/29/13 to 07/20/13 |
2 | * | 5.76 | % | $ | 555 | $ | 546 | ||||||||||||||||||||
| Manufacturing (7% of the total) |
Various Other 5.75% to 7.25% ## | Revolving line of credit | 07/07/04 to 04/20/12 |
02/18/13 to 11/29/13 |
7 | * | 6.61 | % | $ | 58 | $ | 529 | $ | 505 | ||||||||||||||||||
| Administrative and Support Services (4% of the total) |
Various Other 5.50% to 5.75% | Revolving line of credit | 06/22/04 to 06/30/07 |
06/22/13 to 06/30/13 |
2 | * | 5.63 | % | $ | 308 | $ | 295 | ||||||||||||||||||||
F-40
Table of Contents
Medallion Financial Corp.
Consolidated Summary Schedule of Investments
December 31, 2012
| (Dollars in thousands) |
Obligor Name/Interest Rate Range |
Security |
Acquisition Date |
Maturity Date |
# of Invest. |
% of Net Assets |
Interest Rate(1) |
Original Cost of 2012 Acquisitions(5) |
Cost(4) | Fair Value |
||||||||||||||||||||||
| Accommodation and Food Services (1% of the total) |
Various Other 6% | Revolving line of credit | 4/27/2011 | 4/27/2013 | 1 | * | 6.00 | % | $ | 66 | $ | 64 | ||||||||||||||||||||
| Health Care and Social Assistance (0% of the total) |
Various Other 5.75% ## | Revolving line of credit | 10/02/07 to 11/09/12 |
10/02/13 to 11/09/13 |
2 | * | 5.75 | % | $ | 15 | ($ | 273 | ) | ($ | 289 | ) | ||||||||||||||||
|
|
|
|
|
|
|
|
|
|
|
|
|
|||||||||||||||||||||
| Total asset-based ($5,755 pledged as collateral under borrowing arrangements) |
40 | 3 | % | 5.79 | % | $ | 147 | $ | 7,631 | $ | 7,412 | |||||||||||||||||||||
|
|
|
|
|
|
|
|
|
|
|
|
|
|||||||||||||||||||||
| Other secured commercial (69% New York, 29% New Jersey, 2% Illinois) |
||||||||||||||||||||||||||||||||
| Accommodation and Food Services (47% of the total) |
Dune Deck Owners Corp ## | Term Loan | 04/24/07 | 03/31/14 | 1 | 1 | % | 7.25 | % | $ | 3,081 | $ | 3,081 | |||||||||||||||||||
| Various Other && 4.50% to 10.50% | Term Loan | 05/25/05 to 07/29/08 |
03/25/13 to 02/25/15 |
3 | * | 7.12 | % | $ | 620 | $ | 557 | |||||||||||||||||||||
| Retail Trade (47% of the total) |
0.00% to 12.00% && | Term Loan | 09/13/06 to 10/09/12 |
05/19/13 to 01/09/20 |
14 | 2 | % | 9.09 | % | $ | 1,972 | $ | 3,628 | $ | 3,611 | |||||||||||||||||
| Other Services (except Public Administration) (3% of the total) |
5.50% to 6.50% | Term Loan | 01/16/04 to 05/02/09 |
01/16/14 to 05/02/14 |
2 | * | 5.88 | % | $ | 221 | $ | 221 | ||||||||||||||||||||
| Real Estate and Rental and Leasing (3% of the total) |
4.75% to 6.00% | Term Loan | 04/22/99 to 04/01/10 |
04/01/15 to 09/01/15 |
2 | * | 5.25 | % | $ | 197 | $ | 196 | ||||||||||||||||||||
| Transportation and Warehousing (0% of the total) |
6.50% to 6.50% | Term Loan | 12/02/10 to 12/02/10 |
11/22/13 to 11/22/13 |
1 | * | 6.50 | % | $ | 7 | $ | 8 | ||||||||||||||||||||
|
|
|
|
|
|
|
|
|
|
|
|
|
|||||||||||||||||||||
| Total other secured commercial loans ($3,081 pledged as collateral under borrowing arrangements) |
23 | 4 | % | 8.01 | % | $ | 1,972 | $ | 7,754 | $ | 7,674 | |||||||||||||||||||||
|
|
|
|
|
|
|
|
|
|
|
|
|
|||||||||||||||||||||
| Total commercial loans ($8,836 pledged as collateral under borrowing arrangements)(2) |
90 | 26 | % | 11.59 | % | $ | 15,844 | $ | 64,841 | $ | 56,919 | |||||||||||||||||||||
|
|
|
|
|
|
|
|
|
|
|
|
|
|||||||||||||||||||||
| Investment in Medallion Bank and other controlled subsidiaries |
||||||||||||||||||||||||||||||||
| Commercial Banking |
Medallion Bank ** | 100% of common stock | 05/16/02 | None | 1 | 43 | % | 11.39 | % | $ | 92,169 | $ | 92,169 | |||||||||||||||||||
| Art Dealer |
Medallion Fine Art, Inc. | 100% of common stock | 12/03/12 | None | 1 | 1 | % | 0.00 | % | $ | 2,843 | $ | 2,843 | $ | 2,843 | |||||||||||||||||
| Real Estate |
Medallion Hamptons Holding LLC | 100% of membership interests | 06/21/05 | None | 1 | 1 | % | 0.00 | % | $ | 2,696 | $ | 2,696 | |||||||||||||||||||
| Various Other |
12/20/04 to 5/23/12 |
None | 4 | 1 | % | 0.00 | % | $ | 900 | $ | 1,375 | $ | 1,375 | |||||||||||||||||||
|
|
|
|
|
|
|
|
|
|
|
|
|
|||||||||||||||||||||
| Investment in Medallion Bank and other controlled subsidiaries, net |
7 | 46 | % | 10.60 | % | $ | 3,743 | $ | 99,083 | $ | 99,083 | |||||||||||||||||||||
|
|
|
|
|
|
|
|
|
|
|
|
|
|||||||||||||||||||||
F-41
Table of Contents
| (Dollars in thousands) |
Obligor Name/Interest Rate Range |
Security |
Acquisition Date |
Maturity Date |
# of Invest. |
% of Net Assets |
Interest Rate(1) |
Original Cost of 2012 Acquisitions(5) |
Cost(4) | Fair Value |
||||||||||||||||||||||
| Equity investments |
||||||||||||||||||||||||||||||||
| Appliance Recycler # |
Appliance Recycling Centers of America, Inc. ** | 8.86% of common stock | 09/10/98 | None | 1 | * | 0.00 | % | $ | 0 | $ | 579 | ||||||||||||||||||||
| Commercial Finance |
Convergent Capital, Ltd | 7% of limited partnership interest | 07/20/07 | None | 1 | 1 | % | 0.00 | % | $ | 1,294 | $ | 1,793 | |||||||||||||||||||
| NASCAR Race Team |
Medallion MotorSports, LLC | 75% of limited liability interest | 11/24/10 | None | 1 | * | 0.00 | % | $ | 454 | $ | 454 | ||||||||||||||||||||
| Bakery |
Quaker Bakery* | 03/28/12 | None | 1 | * | 0.00 | % | $ | 359 | $ | 359 | |||||||||||||||||||||
| Machinery Manufacturer + |
Reel Power International, Inc. | 2% of common stock | 08/04/08 | None | 1 | * | 0.00 | % | $ | 318 | $ | 318 | ||||||||||||||||||||
| Equipment Manufacturing |
Aeration Industries International, LLC | 5.25% of limited liability interest | 12/31/10 | None | 1 | * | 0.00 | % | $ | 365 | $ | 0 | ||||||||||||||||||||
| Various Other |
** | * to 9.25% of common stock | 12/31/10 to 3/30/12 |
None | 3 | 1 | % | 4.26 | % | $ | 750 | $ | 1,786 | $ | 1,117 | |||||||||||||||||
|
|
|
|
|
|
|
|
|
|
|
|
|
|||||||||||||||||||||
| Equity investments, net |
9 | 2 | % | 1.66 | % | $ | 750 | $ | 4,576 | $ | 4,620 | |||||||||||||||||||||
|
|
|
|
|
|
|
|
|
|
|
|
|
|||||||||||||||||||||
| Investment securities |
||||||||||||||||||||||||||||||||
|
|
|
|
|
|
|
|
|
|
|
|
|
|||||||||||||||||||||
| Investment securities, net |
0 | 0 | % | 0.00 | % | $ | 0 | $ | 0 | $ | 0 | |||||||||||||||||||||
|
|
|
|
|
|
|
|
|
|
|
|
|
|||||||||||||||||||||
| Net Investments ($236,357 pledged as collateral under borrowing arrangements)(3) |
821 | 210 | % | 6.75 | % | $ | 172,022 | $ | 462,683 | $ | 455,010 | |||||||||||||||||||||
|
|
|
|
|
|
|
|
|
|
|
|
|
|||||||||||||||||||||
| (1) | Represents the actual or weighted average interest or dividend rate of the respective security or portfolio as of the date indicated. Investments without an interest rate or with a rate of 0.00% are considered non-income producing. |
| (2) | Included in secured mezzanine commercial loans was $1,817 of interest income capitalized into the outstanding investment balances, in accordance with the terms of the investment contract. |
| (3) | The ratio of restricted securities fair value to net assets is 210%. |
| (4) | Gross unrealized appreciation, gross unrealized depreciation, and net appreciation for federal income tax purposes totaled $8,571, $10,965 and $27,606, respectively. The tax cost of investments was $427,404. |
| (5) | For revolving lines of credit the amount shown is the cost at December 31, 2012. |
| * | Less than 1.0% |
| ** | Not an eligible portfolio company as such term is defined in Section 2(a)(46) of the 1940 Act. The percentage value of all non-eligible portfolio companies to totaled assets of Medallion Financial on an unconsolidated basis was up to 28% and up to 29% on a consolidated basis. |
| & | Loan is on nonaccrual status, or past due on contractual payments, and is therefore considered non-income producing. |
| && | Some or all of the securities are non-income producing as per & above. |
| # | Publicly traded but sales subject to applicable Rule 144 limitations. |
| ## | Pledged as collateral under borrowing arrangements. |
| + | Includes various warrants, all of which have a cost and fair value of zero at December 31, 2012. |
The Summary Schedule of Investments does not reflect the Company’s complete portfolio holdings. It includes the Company’s 50 largest holdings and each investment of any issuer that exceeds 1% of the Company’s net assets. “Various Other” represent all issues not required to be disclosed under the rules adopted by the U.S. Securities and Exchange Commission (“SEC”). Footnotes above may apply to securities that are included in “Various Other”. For further detail, the complete schedule of portfolio holdings is available (i) without charge, upon request, by calling (877) MEDALLION; and (ii) on the SEC’s website at http://www.sec.gov.
F-42
Table of Contents
Medallion Financial Corp.
Consolidated Schedule of Investments In and Advances to Affiliates
As Of And For the Year Ended 12/31/2012
| Name of issuer and title of issue (2) |
Number of shares (all restricted unless otherwise noted) |
Equity in net profit and (loss) for the year |
Amount of dividends or interest (1) |
Value as of 12/31/12 | ||||||||||
| (Dollars in thousands) | ||||||||||||||
| Medallion Bank—common stock |
1,000,000 shares—100% of common stock | 19,283 | 10,500 | $ | 92,169 | |||||||||
| Medallion Fine Art, Inc.—common stock |
1,000 shares—100% of common stock | (28 | ) | $ | 2,843 | |||||||||
| Medallion Hamptons Holding LLC—membership interest |
100% of membership interest | 0 | 0 | $ | 2,696 | |||||||||
| Medallion Servicing Corp.—common stock |
1,000 shares—100% of common stock | (283 | ) | 0 | $ | 613 | ||||||||
| LAX Group LLC—membership interest |
42% of membership interest | (439 | ) | 0 | $ | 461 | ||||||||
| Generation Outdoor, Inc.—common stock |
1,000 shares—100% of common stock | (137 | ) | 33 | $ | 301 | ||||||||
|
|
|
|
|
|
|
|||||||||
| Total investments in Medallion Bank and other controlled subsidiaries |
18,396 | 10,533 | $ | 99,083 | ||||||||||
|
|
|
|
|
|
|
|||||||||
| Appliance Recycling Centers of America Inc—common stock |
8% of common stock | 0 | 0 | $ | 579 | |||||||||
| RPAC Racing, LLC—membership interest |
30% of membership interest | 0 | 0 | $ | 454 | |||||||||
| Summit Medical, Inc—common stock |
9.25% of common stock | 0 | 0 | $ | 135 | |||||||||
| Aeration Industries International LLC—membership interest |
5.25% of membership interest | 0 | 0 | $ | 0 | |||||||||
| Other equity investments other than in investments in and advances to affiliates |
— | — | $ | 3,452 | ||||||||||
|
|
|
|
|
|||||||||||
| Total equity investments |
0 | 0 | $ | 4,620 | ||||||||||
|
|
|
|
|
|
|
|||||||||
| Total investments in Medallion Bank and other controlled subsidiaries and equity investments |
18,396 | 10,533 | $ | 103,703 | ||||||||||
|
|
|
|
|
|
|
|||||||||
| Other interest and dividend income other than from investments in and advances to affiliates |
|
37 | ||||||||||||
|
|
|
|||||||||||||
| Total dividend and interest income on short term investments |
|
10,570 | ||||||||||||
|
|
|
|||||||||||||
| Total investments in and advances to affiliates |
|
$ | 100,251 | |||||||||||
| Other equity investments other than in investments in and advances to affiliates |
|
$ | 3,452 | |||||||||||
|
|
|
|||||||||||||
| Total investments in Medallion Bank and other controlled subsidiaries and equity investments |
|
$ | 103,703 | |||||||||||
|
|
|
|||||||||||||
| (1) | Investments with an amount of 0 are considered non-income producing. |
F-43
Table of Contents
The table below provides a recap of the changes in the investment in the respective issuers for the year ended December 31, 2012.
| Value as of 1/1/12 | Gross Additions / Investments |
Gross Reductions / Distributions |
Net equity earnings in profit and loss, unrealized appreciation and depreciation |
Other Adjustments |
Value as of 12/31/12 | |||||||||||||||||||
| (Dollars in thousands) | ||||||||||||||||||||||||
| Medallion Bank—common stock |
$ | 82,852 | 3,230 | 13,196 | 19,283 | $ | 92,169 | |||||||||||||||||
| Medallion Hamptons Holding LLC—membership interest |
$ | 2,436 | 260 | 0 | 0 | $ | 2,696 | |||||||||||||||||
| LAX Group LLC—membership interest |
$ | 0 | 900 | 0 | (439 | ) | $ | 461 | ||||||||||||||||
| Medallion Servicing Corp.—common stock |
$ | 577 | 321 | 2 | (283 | ) | $ | 613 | ||||||||||||||||
| Generation Outdoor, Inc.—common stock |
$ | 65 | 600 | 600 | 209 | 27 | (1) | $ | 301 | |||||||||||||||
| Appliance Recycling Centers of America Inc—common stock |
$ | 2,225 | 0 | 0 | (1,646 | ) | $ | 579 | ||||||||||||||||
| Medallion Fine Art, Inc.—common stock |
$ | 0 | 2,871 | 0 | (28 | ) | $ | 2,843 | ||||||||||||||||
| Medallion Sports Media, Inc.—common stock |
$ | 2 | 371 | 0 | (346 | ) | (27 | )(1) | $ | 0 | ||||||||||||||
| (1) | Represents the net equity investment of Medallion Sports Media Inc at December 31, 2012 prior its merger into Generation Outdoor Inc. |
F-44
Table of Contents
Consolidated Summary Schedule of Investments
December 31, 2011
| (Dollars in thousands) |
Obligor Name/Interest Rate Range |
Security Type (all restricted unless otherwise noted) |
Acquisition Date |
Maturity Date |
# of Invest. |
% of Net Assets |
Interest Rate(1) |
Original Cost of 2011 Acquisitions(5) |
Cost(4) | Fair Value |
||||||||||||||||||||||||
| Medallion Loans |
||||||||||||||||||||||||||||||||||
| New York |
502 | 133 | % | 4.66 | % | $ | 154,686 | $ | 227,426 | $ | 227,480 | |||||||||||||||||||||||
| Sean Cab Corp ## |
Term loan | 12/9/2011 | 12/08/15 | 1 | 2 | % | 3.60 | % | $ | 3,774 | $ | 3,775 | $ | 3,770 | ||||||||||||||||||||
| Lena Cab Corp ## |
Term loan | 12/9/2011 | 12/09/15 | 1 | 2 | % | 3.60 | % | $ | 3,774 | $ | 3,775 | $ | 3,770 | ||||||||||||||||||||
| Sifnos, Van-Dim, Kitriani Incs ## |
Term loan | 6/8/2010 | 06/07/15 | 1 | 2 | % | 5.25 | % | $ | 2,611 | $ | 2,607 | ||||||||||||||||||||||
| Real Cab Corp ## |
Term loan | 7/20/2007 | 07/20/17 | 1 | 1 | % | 6.75 | % | $ | 2,546 | $ | 2,541 | ||||||||||||||||||||||
| Cabbo Service Corp ## |
Term loan | 9/7/2010 | 09/07/13 | 1 | 1 | % | 5.00 | % | $ | 1,801 | $ | 1,792 | ||||||||||||||||||||||
| Lety Cab Corp ## |
Term loan | 10/21/2010 | 10/20/15 | 1 | 1 | % | 4.00 | % | $ | 1,647 | $ | 1,645 | ||||||||||||||||||||||
| Slo Cab Corp ## |
Term loan | 7/20/2007 | 07/20/17 | 1 | 1 | % | 6.75 | % | $ | 1,528 | $ | 1,524 | ||||||||||||||||||||||
| Sandhu & Baath Inc ## |
Term loan | 5/10/2011 | 05/10/14 | 1 | 1 | % | 4.75 | % | $ | 1,320 | $ | 1,303 | $ | 1,304 | ||||||||||||||||||||
| Orys Trans Corp ## |
Term loan | 9/26/2011 | 09/26/14 | 1 | 1 | % | 4.00 | % | $ | 1,300 | $ | 1,296 | $ | 1,296 | ||||||||||||||||||||
| Cafe Service Co Inc ## |
Term loan | 11/9/2011 | 11/09/16 | 1 | 1 | % | 4.40 | % | $ | 1,275 | $ | 1,274 | $ | 1,274 | ||||||||||||||||||||
| Bunty & Jyoti Inc ## |
Term loan | 11/22/2011 | 11/22/14 | 1 | 1 | % | 4.25 | % | $ | 1,264 | $ | 1,263 | $ | 1,263 | ||||||||||||||||||||
| Sonu-Seema Corp ## |
Term loan | 11/22/2011 | 11/22/14 | 1 | 1 | % | 4.25 | % | $ | 1,264 | $ | 1,263 | $ | 1,263 | ||||||||||||||||||||
| Spurt Cab Corp ## |
Term loan | 4/1/2011 | 10/01/13 | 1 | 1 | % | 4.75 | % | $ | 1,275 | $ | 1,258 | $ | 1,261 | ||||||||||||||||||||
| Januko Transit Inc ## |
Term loan | 12/9/2011 | 12/09/15 | 1 | 1 | % | 3.60 | % | $ | 1,258 | $ | 1,258 | $ | 1,258 | ||||||||||||||||||||
| Nancy Transit Inc ## |
Term loan | 4/6/2011 | 04/06/14 | 1 | 1 | % | 4.50 | % | $ | 1,275 | $ | 1,258 | $ | 1,257 | ||||||||||||||||||||
| Fenway Cab Corp ## |
Term loan | 3/23/2011 | 12/08/15 | 1 | 1 | % | 3.60 | % | $ | 1,275 | $ | 1,256 | $ | 1,255 | ||||||||||||||||||||
| Slate Cab Corp ## |
Term loan | 3/23/2011 | 12/08/15 | 1 | 1 | % | 3.60 | % | $ | 1,275 | $ | 1,256 | $ | 1,255 | ||||||||||||||||||||
| Yankl Transit Inc ## |
Term loan | 3/23/2011 | 12/08/15 | 1 | 1 | % | 3.60 | % | $ | 1,275 | $ | 1,256 | $ | 1,255 | ||||||||||||||||||||
| Munkach Transit Inc ## |
Term loan | 3/23/2011 | 12/08/15 | 1 | 1 | % | 3.60 | % | $ | 1,275 | $ | 1,256 | $ | 1,255 | ||||||||||||||||||||
| Sapphire Transit Inc ## |
Term loan | 3/23/2011 | 12/08/15 | 1 | 1 | % | 3.60 | % | $ | 1,275 | $ | 1,256 | $ | 1,255 | ||||||||||||||||||||
| W Mit Trans Corp ## |
Term loan | 3/23/2011 | 12/08/15 | 1 | 1 | % | 3.60 | % | $ | 1,275 | $ | 1,256 | $ | 1,255 | ||||||||||||||||||||
| Brini Transit Inc ## |
Term loan | 3/23/2011 | 12/08/15 | 1 | 1 | % | 3.60 | % | $ | 1,275 | $ | 1,256 | $ | 1,255 | ||||||||||||||||||||
| Daf Cab Corp ## |
Term loan | 3/23/2011 | 12/08/15 | 1 | 1 | % | 3.60 | % | $ | 1,275 | $ | 1,256 | $ | 1,255 | ||||||||||||||||||||
| W. Vil Trans Corp ## |
Term loan | 3/22/2011 | 12/08/15 | 1 | 1 | % | 3.60 | % | $ | 1,275 | $ | 1,256 | $ | 1,255 | ||||||||||||||||||||
| Sabrinush Transit Inc ## |
Term loan | 3/23/2011 | 12/08/15 | 1 | 1 | % | 3.60 | % | $ | 1,275 | $ | 1,256 | $ | 1,255 | ||||||||||||||||||||
| Mamkale Transit Inc ## |
Term loan | 3/23/2011 | 12/08/15 | 1 | 1 | % | 3.60 | % | $ | 1,275 | $ | 1,256 | $ | 1,255 | ||||||||||||||||||||
| New Direction Cab Corp ## |
Term loan | 11/18/2011 | 11/18/14 | 1 | 1 | % | 4.00 | % | $ | 1,200 | $ | 1,195 | $ | 1,200 | ||||||||||||||||||||
| Ride Yellow Llc ## |
Term loan | 1/14/2011 | 02/15/16 | 1 | 1 | % | 4.88 | % | $ | 1,200 | $ | 1,200 | $ | 1,200 | ||||||||||||||||||||
| Hoyt Cab Corp ## |
Term loan | 2/18/2011 | 02/18/14 | 1 | 1 | % | 4.50 | % | $ | 1,200 | $ | 1,200 | $ | 1,200 | ||||||||||||||||||||
F-45
Table of Contents
| (Dollars in thousands) |
Obligor Name/Interest Rate Range |
Security Type (all restricted unless otherwise noted) |
Acquisition Date |
Maturity Date |
# of Invest. |
% of Net Assets |
Interest Rate(1) |
Original Cost of 2011 Acquisitions(5) |
Cost(4) | Fair Value |
||||||||||||||||||||||||
| Various New York && |
2.67% to 14.00% ## |
8/17/98 to 12/23/2011 |
12/6/11 to 9/10/2023 |
473 | 106 | % | 4.75 | % | $ | 119,282 | $ | 182,159 | $ | 182,250 | ||||||||||||||||||||
| Boston && |
3.25% to 9.66% ## |
Term loan | 6/12/07 to 11/17/2011 |
06/12/12 to 07/11/16 |
59 | 10 | % | 6.56 | % | $ | 7,118 | $ | 16,955 | $ | 17,012 | |||||||||||||||||||
| Cambridge |
5.50% to 9.22% ## |
Term loan | 3/28/08 to 11/23/11 |
03/19/12 to 11/18/20 |
21 | 4 | % | 6.62 | % | $ | 1,405 | $ | 6,179 | $ | 6,198 | |||||||||||||||||||
| Chicago |
136 | 20 | % | 5.79 | % | $ | 35,709 | $ | 34,200 | $ | 34,352 | |||||||||||||||||||||||
| Cozy Cab et al ## |
Term loan | 12/22/2011 | 12/22/14 | 1 | 2 | % | 5.50 | % | $ | 3,031 | $ | 3,031 | $ | 2,999 | ||||||||||||||||||||
| Sweetgrass Peach & Chadwick Cap ## |
Term loan | 11/23/2011 | 11/23/14 | 1 | 1 | % | 5.75 | % | $ | 1,530 | $ | 1,525 | $ | 1,527 | ||||||||||||||||||||
| Various Chicago |
5.00% to 10.30% ## |
Term loan | 4/29/05 to 12/16/2011 |
03/10/12 to 12/16/16 |
134 | 17 | % | 5.82 | % | $ | 31,148 | $ | 29,644 | $ | 29,825 | |||||||||||||||||||
| Newark && |
6.00% to 9.00% ## |
Term loan | 4/6/00 to 12/8/2011 |
01/11/12 to 12/08/21 |
109 | 10 | % | 7.38 | % | $ | 6,009 | $ | 17,693 | $ | 17,790 | |||||||||||||||||||
| Other |
21 | 3 | % | 6.54 | % | $ | 2,930 | $ | 4,318 | $ | 4,335 | |||||||||||||||||||||||
| Philadelphia |
Dorit Matityahu ## |
Term loan | 8/4/2011 | 08/04/14 | 1 | 1 | % | 6.25 | % | $ | 2,209 | $ | 2,187 | $ | 2,189 | |||||||||||||||||||
| Various Other && |
5.43% to 11.50% ## |
Term loan | 10/15/04 to 9/22/11 |
02/15/12 to 3/10/2018 |
20 | 1 | % | 6.84 | % | $ | 721 | $ | 2,131 | $ | 2,147 | |||||||||||||||||||
|
|
|
|
|
|
|
|
|
|
|
|
|
|||||||||||||||||||||||
| Total medallion loans ($243,057 pledged as collateral under borrowing arrangements) |
848 | 179 | % | 5.11 | % | $ | 207,858 | $ | 306,771 | $ | 307,167 | |||||||||||||||||||||||
|
|
|
|
|
|
|
|
|
|
|
|
|
|||||||||||||||||||||||
| Commercial Loans |
||||||||||||||||||||||||||||||||||
| Secured mezzanine (18% Florida, 14% Minnesota, 14% Oklahoma, 10% Indiana, 9% California, 7% Texas and 28% all other states)(2) |
| |||||||||||||||||||||||||||||||||
| Manufacturing |
||||||||||||||||||||||||||||||||||
| + | Reel Power (capitalized interest of $86 per footnote 2) (interest rate includes PIK interest of 2%) |
Term loan | 08/04/08 | 02/04/14 | 1 | 2 | % | 14.00 | % | $ | 3,586 | $ | 3,586 | |||||||||||||||||||||
| Process Fab (capitalized interest of $384 per footnote 2) & (interest rate includes PIK interest of 3%) |
Term loan | 04/17/08 | 04/17/15 | 1 | 2 | % | 14.00 | % | $ | 4,884 | $ | 3,358 | ||||||||||||||||||||||
F-46
Table of Contents
| (Dollars in thousands) |
Obligor Name/Interest Rate Range |
Security Type (all restricted unless otherwise noted) |
Acquisition Date |
Maturity Date |
# of Invest. |
% of Net Assets |
Interest Rate(1) |
Original Cost of 2011 Acquisitions (5) |
Cost(4) | Fair Value |
||||||||||||||||||||||||
| Motion Tech (capitalized interest of $189 per footnote 2) (interest rate includes PIK interest of 6%) |
Term loan | 12/23/10 | 12/23/15 | 1 | 2 | % | 18.00 | % | $ | 3,189 | $ | 3,195 | ||||||||||||||||||||||
| Imperial (capitalized interest of $4 per footnote 2) (interest rate includes PIK interest of 3%) |
Term loan | 12/15/11 | 12/31/16 | 1 | 2 | % | 15.00 | % | $ | 2,800 | $ | 2,804 | $ | 2,823 | ||||||||||||||||||||
| + | Packaging Specialists (capitalized interest of $191 per footnote 2) (interest rate includes PIK interest of 6%) |
Term loan | 04/01/08 | 04/01/13 | 1 | 1 | % | 14.00 | % | $ | 2,191 | $ | 2,191 | |||||||||||||||||||||
| Aeration (capitalized interest of $81 per footnote 2) & (interest rate includes PIK interest of 6%) |
Term loan | 12/31/10 | 06/30/16 | 1 | 1 | % | 18.00 | % | $ | 2,416 | $ | 2,190 | ||||||||||||||||||||||
| Dynamic Systems (capitalized interest of $74 per footnote 2) (interest rate includes PIK interest of 3.5%) |
Term loan | 12/23/10 | 12/23/17 | 1 | 1 | % | 15.50 | % | $ | 2,074 | $ | 2,074 | ||||||||||||||||||||||
| + | PACA Foods |
Term loan | 12/31/10 | 12/31/15 | 1 | 1 | % | 14.00 | % | $ | 1,500 | $ | 1,499 | |||||||||||||||||||||
| + | PACA Foods |
Term loan | 12/31/10 | 12/31/15 | 1 | 1 | % | 12.00 | % | $ | 1,500 | $ | 1,499 | |||||||||||||||||||||
| Orchard & |
Term loan | 03/10/99 | Matured | 1 | 1 | % | 13.00 | % | $ | 1,420 | $ | 1,220 | ||||||||||||||||||||||
| + | Various Other—12% to 13% (capitalized interest of $92 per footnote 2) && (interest rate includes PIK interest of 12%) |
Term loan | 12/15/04 to 10/2/06 |
03/01/12 to 03/31/13 |
3 | 1 | % | 12.34 | % | $ | 1,896 | $ | 1,891 | |||||||||||||||||||||
| Administrative and Support Services |
||||||||||||||||||||||||||||||||||
| Staff One & |
Term loan | 06/30/08 | 12/31/13 | 1 | 1 | % | 13.00 | % | $ | 3,306 | $ | 1,850 | ||||||||||||||||||||||
F-47
Table of Contents
Medallion Financial Corp.
Consolidated Summary Schedule of Investments
December 31, 2011
| (Dollars in thousands) |
Obligor Name/Interest Rate Range |
Security Type (all restricted unless otherwise noted) |
Acquisition Date |
Maturity Date |
# of Invest. |
% of Net Assets |
Interest Rate(1) |
Original Cost of 2011 Acquisitions(5) |
Cost(4) | Fair Value |
||||||||||||||||||||||||||
| Staff One & | Term loan | 09/15/11 | 12/31/13 | 1 | * | 13.00 | % | $ | 100 | $ | 100 | $ | 100 | |||||||||||||||||||||||
| Various Other (capitalized interest of $275 per footnote 2) && (interest rate includes PIK interest of 9%) |
Term loan | 01/14/05 | Matured | 1 | * | 19.00 | % | $ | 5,070 | $ | 0 | |||||||||||||||||||||||||
| Wholesale Trade |
||||||||||||||||||||||||||||||||||||
| Twin-Star (interest rate includes PIK interest of 1%) | Term loan | 06/01/07 | 04/24/14 | 1 | 2 | % | 13.00 | % | $ | 4,000 | $ | 4,000 | ||||||||||||||||||||||||
| + |
Various Other && | Term loan | 03/31/08 | 03/31/13 | 1 | * | 16.00 | % | $ | 2,484 | $ | 101 | ||||||||||||||||||||||||
| Accommodation and Food Services |
(capitalized interest of $386 per footnote 2)—9.25% to 10.00% & (interest rate includes PIK interest of 3.5%) |
Term loan | 12/22/94 to 11/5/10 |
10/1/15- 11/5/15 |
3 | 1 | % | 9.86 | % | $ | 3,540 | $ | 1,488 | |||||||||||||||||||||||
| Arts, Entertainment, and Recreation |
RPAC Racing (capitalized interest of $340 per footnote 2) (interest rate includes PIK interest of 10%) |
Term loan | 11/19/10 | 11/19/15 | 1 | 2 | % | 10.00 | % | $ | 3,379 | $ | 3,379 | |||||||||||||||||||||||
| Health Care and Social Assistance |
+ |
Various Other && | Term loan | 12/31/98 | 06/30/17 | 1 | 1 | % | 7.00 | % | $ | 1,386 | $ | 986 | ||||||||||||||||||||||
| Retail Trade |
(capitalized interest of $143 per footnote 2) && (interest rate includes PIK interest of 3.5%) |
Term loan | 09/23/97 | 10/01/15 | 1 | * | 10.00 | % | $ | 752 | $ | 376 | ||||||||||||||||||||||||
| Professional, Scientific, and Technical Services |
Various Other && | Term loan | 10/26/11 | 11/02/14 | 1 | * | 10.00 | % | $ | 150 | $ | 145 | $ | 45 | ||||||||||||||||||||||
|
|
|
|
|
|
|
|
|
|
|
|
|
|||||||||||||||||||||||||
| Total secured mezzanine(2) |
|
25 | 22 | % | 14.04 | % | $ | 3,050 | $ | 51,622 | $ | 37,851 | ||||||||||||||||||||||||
|
|
|
|
|
|
|
|
|
|
|
|
|
|||||||||||||||||||||||||
F-48
Table of Contents
Medallion Financial Corp.
Consolidated Summary Schedule of Investments
December 31, 2011
| (Dollars in thousands) |
Obligor Name/Interest Rate Range |
Security Type |
Acquisition Date |
Maturity Date |
# of Invest. |
% of Net Assets |
Interest Rate(1) |
Original Cost of 2011 Acquisitions(5) |
Cost(4) | Fair Value |
||||||||||||||||||||||
| Asset-based (82% New York, 13% New Jersey and 5% all other states) |
||||||||||||||||||||||||||||||||
| Wholesale Trade |
||||||||||||||||||||||||||||||||
| Newburg Egg Corp. ## | Revolving line of credit | 03/16/99 | 03/16/12 | 1 | 1 | % | 6.00 | % | $ | 1,446 | $ | 1,425 | ||||||||||||||||||||
| Capitalsea, LLC ## | Revolving line of credit | 11/07/05 | 11/07/12 | 1 | 1 | % | 4.50 | % | $ | 1,349 | $ | 1,320 | ||||||||||||||||||||
| Various Other |
4.75% to 6.75% ## | Revolving line of credit | 1/23/99 to 11/30/11 |
01/14/12 to 11/30/12 |
10 | 1 | % | 5.51 | % | $ | 84 | $ | 1,593 | $ | 1,564 | |||||||||||||||||
| Transportation and Warehousing |
5.75% to 8.00% ## | Revolving line of credit | 12/31/01 to 7/20/07 |
02/06/12 to 12/31/12 |
5 | 1 | % | 6.51 | % | $ | 1,885 | $ | 1,846 | |||||||||||||||||||
| Finance and Insurance |
4.25% to 8.25% | Revolving line of credit | 2/6/02 to 11/10/11 |
02/06/12 to 11/10/12 |
6 | * | 6.28 | % | $ | 38 | $ | 718 | $ | 687 | ||||||||||||||||||
| Construction |
5.75 % to 6.00% ## | Revolving line of credit | 6/29/99 to 7/20/99 |
06/29/12 to 07/20/12 |
2 | * | 5.77 | % | $ | 666 | $ | 656 | ||||||||||||||||||||
| Retail Trade |
4.75% to 6.11% ## | Revolving line of credit | 10/19/98 to 8/31/06 |
07/24/12 to 12/21/12 |
5 | * | 5.45 | % | $ | 649 | $ | 630 | ||||||||||||||||||||
| Administrative and Support Services |
5.50% to 5.75% | Revolving line of credit | 6/22/04 to 6/30/07 |
06/22/12 to 06/30/12 |
2 | * | 5.59 | % | $ | 387 | $ | 372 | ||||||||||||||||||||
| Manufacturing |
5.50% to 7.00% ## | Revolving line of credit | 7/7/04 to 5/6/11 |
02/18/12 to 11/29/12 |
7 | * | 6.55 | % | $ | 34 | $ | 348 | $ | 329 | ||||||||||||||||||
| Health Care and Social Assistance |
5.75% to 6.00% ## | Revolving line of credit | 10/2/07 to 12/1/10 |
10/02/12 to 12/01/12 |
2 | * | 5.83 | % | $ | 289 | $ | 275 | ||||||||||||||||||||
| Accommodation and Food Services |
6.00% | Revolving line of credit | 04/27/11 | 04/27/12 | 1 | * | 6.00 | % | $ | 51 | $ | 57 | $ | 60 | ||||||||||||||||||
|
|
|
|
|
|
|
|
|
|
|
|
|
|||||||||||||||||||||
| Total asset-based ($6,506 pledged as collateral under borrowing arrangements) |
42 | 5 | % | 5.77 | % | $ | 207 | $ | 9,388 | $ | 9,165 | |||||||||||||||||||||
|
|
|
|
|
|
|
|
|
|
|
|
|
|||||||||||||||||||||
| Other secured commercial (83% New York, 15% New Jersey and 2% Illinois) |
||||||||||||||||||||||||||||||||
| Accommodation and Food Services |
||||||||||||||||||||||||||||||||
| Dune Deck Owners Corp ## | Term loan | 04/24/07 | 03/31/14 | 1 | 2 | % | 7.25 | % | $ | 3,097 | $ | 3,097 | ||||||||||||||||||||
| Various Other |
8.50% to 12.50% | Term loan | 5/25/2005 to 12/23/08 |
06/25/12 to 07/29/14 |
5 | * | 10.21 | % | $ | 741 | $ | 739 | ||||||||||||||||||||
F-49
Table of Contents
| (Dollars in thousands) |
Obligor Name/Interest Rate Range |
Security Type |
Acquisition Date |
Maturity Date |
# of Invest. |
% of Net Assets |
Interest Rate(1) |
Original Cost of 2011 Acquisitions(5) |
Cost(4) | Fair Value |
||||||||||||||||||||||
| Retail Trade |
0.00% to 12.00% && | Term loan | 9/13/06 to 8/4/11 |
01/13/12 to 08/09/16 |
12 | 1 | % | 9.31 | % | $ | 2,045 | $ | 2,536 | $ | 2,263 | |||||||||||||||||
| Arts, Entertainment, and Recreation |
6.5% && | Term loan | 01/24/07 | 05/28/15 | 1 | * | 6.50 | % | $ | 390 | $ | 265 | ||||||||||||||||||||
| Other Services (except Public Administration) |
5.50% to 6.50% | Term loan | 1/16/04 to 5/2/09 |
01/16/14 to 05/02/14 |
2 | * | 5.96 | % | $ | 282 | $ | 283 | ||||||||||||||||||||
| Transportation and Warehousing |
6.00% to 6.50% | Term loan | 6/8/09 to 12/8/10 |
01/12/12 to 11/22/13 |
15 | * | 6.05 | % | $ | 276 | $ | 285 | ||||||||||||||||||||
| Real Estate and Rental and Leasing |
5.50% to 6.00% | Term loan | 4/22/99 to 4/1/10 |
04/01/15 to 09/01/15 |
2 | * | 5.68 | % | $ | 217 | $ | 211 | ||||||||||||||||||||
|
|
|
|
|
|
|
|
|
|
|
|
|
|||||||||||||||||||||
| Total other secured commercial loans ($3,097 pledged as collateral under borrowing arrangements) |
38 | 4 | % | 8.06 | % | $ | 2,045 | $ | 7,539 | $ | 7,143 | |||||||||||||||||||||
|
|
|
|
|
|
|
|
|
|
|
|
|
|||||||||||||||||||||
| Total commercial loans ($9,603 pledged as collateral under borrowing arrangements)(2) |
105 | 32 | % | 12.25 | % | $ | 5,303 | $ | 68,549 | $ | 54,159 | |||||||||||||||||||||
|
|
|
|
|
|
|
|
|
|
|
|
|
|||||||||||||||||||||
| Investment in Medallion Bank and other controlled subsidiaries |
||||||||||||||||||||||||||||||||
| Commercial Banking |
Medallion Bank | 100% of common stock | 05/16/02 | None | 1 | 48 | % | 6.58 | % | $ | 82,852 | $ | 82,852 | |||||||||||||||||||
| Real Estate |
Medallion Hamptons Holding LLC | 100% of membership interests | 06/21/05 | None | 1 | 1 | % | 0.00 | % | $ | 2,436 | $ | 2,436 | |||||||||||||||||||
| Various Other |
12/20/04 to 1/5/11 |
None | 3 | * | 0.00 | % | $ | 644 | $ | 644 | ||||||||||||||||||||||
|
|
|
|
|
|
|
|
|
|
|
|
|
|||||||||||||||||||||
| Investment in Medallion Bank and other controlled subsidiaries, net |
5 | 50 | % | 6.40 | % | $ | 85,932 | $ | 85,932 | |||||||||||||||||||||||
|
|
|
|
|
|
|
|
|
|
|
|
|
|||||||||||||||||||||
| Equity investments |
||||||||||||||||||||||||||||||||
| Appliance Recycler # |
Appliance Recycling Centers of America, Inc.** | 8% of common stock | 09/10/98 | None | 1 | 1 | % | 0.00 | % | $ | 0 | $ | 2,225 | |||||||||||||||||||
| Commercial Finance |
Convergent Capital, Ltd | 7% of limited partnership interest | 07/20/07 | None | 1 | 1 | % | 0.00 | % | $ | 1,094 | $ | 1,214 | |||||||||||||||||||
| NASCAR Race Team |
RPAC Racing | 30.6% of limited liability interest | 11/19/10 | None | 1 | * | 0.00 | % | $ | 454 | $ | 454 | ||||||||||||||||||||
| Machinery Manufacturer + |
Reel Power International, Inc. | 2% of common stock | 08/04/08 | None | 1 | * | 0.00 | % | $ | 318 | $ | 318 | ||||||||||||||||||||
| Equipment Manufacturing |
Aeration Industries International, LLC | 5.25% of limited liability interest | 12/31/10 | None | 1 | * | 0.00 | % | $ | 365 | $ | 0 | ||||||||||||||||||||
| Various Other |
12/5/02 to 11/1/10 |
None | 4 | * | 6.65 | % | $ | 1,241 | $ | 366 | ||||||||||||||||||||||
|
|
|
|
|
|
|
|
|
|
|
|
|
|||||||||||||||||||||
| Equity investments, net |
9 | 3 | % | 2.26 | % | $ | 3,472 | $ | 4,577 | |||||||||||||||||||||||
|
|
|
|
|
|
|
|
|
|
|
|
|
|||||||||||||||||||||
| Investment securities |
||||||||||||||||||||||||||||||||
|
|
|
|
|
|
|
|
|
|
|
|
|
|||||||||||||||||||||
| Investment securities, net |
0 | 0 | % | 0.00 | % | $ | 0 | $ | 0 | |||||||||||||||||||||||
|
|
|
|
|
|
|
|
|
|
|
|
|
|||||||||||||||||||||
| Net Investments ($252,660 pledged as collateral under borrowing arrangements)(3) |
967 | 263 | % | 6.36 | % | $ | 213,159 | $ | 464,724 | $ | 451,835 | |||||||||||||||||||||
|
|
|
|
|
|
|
|
|
|
|
|
|
|||||||||||||||||||||
F-50
Table of Contents
Consolidated Schedule of Investments In and Advances to Affiliates
As of and for the year ended December 31, 2011
| Name of issuer and title of issue(2) |
Number of share (all restricted unless |
Equity in net profit and (loss) for the period |
Amount of dividends or interest(1) |
Value as of 12/31/11 | ||||||||||
| (Dollars in thousands) | ||||||||||||||
| Medallion Bank—common stock |
1,000,000 shares—100% of common stock |
$ | 14,640 | $ | 5,500 | $ | 82,852 | |||||||
| Medallion Hamptons Holding LLC—membership interest |
100% of membership interest |
(1,389 | ) | 0 | 2,436 | |||||||||
| Medallion Servicing Corp.—common stock |
1,000 shares—100% of common stock |
(197 | ) | 0 | 577 | |||||||||
| Generation Outdoor, Inc.—common stock |
1,000 shares—100% of common stock |
545 | 64 | 65 | ||||||||||
| Medallion Sports Media, Inc.—common stock |
1,000 shares—100% of common stock |
(431 | ) | 0 | 2 | |||||||||
|
|
|
|
|
|
|
|||||||||
| Total investments in Medallion Bank and other controlled subsidiaries |
$ | 13,168 | $ | 5,564 | $ | 85,932 | ||||||||
|
|
|
|
|
|
|
|||||||||
| Appliance Recycling Centers of America Inc—common stock |
8% of common stock |
$ | 0 | $ | 0 | $ | 2,225 | |||||||
| RPAC Racing, LLC—membership interest |
30% of membership interest |
0 | 0 | 454 | ||||||||||
| Summit Medical, Inc—common stock |
9.25% of common stock |
0 | 0 | 135 | ||||||||||
| Aeration Industries International LLC—membership interest |
5.25% of membership interest |
0 | 0 | 0 | ||||||||||
| On Top—ownership share |
12% of ownership shares |
0 | 0 | 0 | ||||||||||
| Equity investments other than in investments in and advances to affiliates |
— | — | 1,763 | |||||||||||
|
|
|
|
|
|
|
|||||||||
| Total equity investments |
$ | 0 | $ | 0 | $ | 4,577 | ||||||||
|
|
|
|
|
|
|
|||||||||
| Total investments in Medallion Bank and other controlled subsidiaries and equity investments |
$ | 13,168 | $ | 5,564 | $ | 90,509 | ||||||||
|
|
|
|
|
|
|
|||||||||
| Other interest and dividend income other than from investments in and advances to affiliates |
42 | |||||||||||||
|
|
|
|||||||||||||
| Total dividend and interest income on short term investments |
$ | 5,606 | ||||||||||||
|
|
|
|||||||||||||
| Total investments in and advances to affiliates |
$ | 88,746 | ||||||||||||
| Other equity investments other than in investments in and advances to affiliates |
1,763 | |||||||||||||
|
|
|
|||||||||||||
| Total investments in Medallion Bank and other controlled subsidiaries and equity investments |
$ | 90,509 | ||||||||||||
|
|
|
|||||||||||||
| (1) | Investments with an amount of 0 are considered non-income producing. |
| (2) | The table below provides a recap of the changes in the investment in the respective issuers for 2011. |
F-51
Table of Contents
| Value as of 1/1/11 | Gross Additions / Investments |
Gross Reductions / Distributions |
Net equity earnings in profit and loss, unrealized appreciation and depreciation |
Value as of 12/31/11 | ||||||||||||||||
| (Dollars in thousands) | ||||||||||||||||||||
| Medallion Bank—common stock |
$ | 74,008 | $ | 704 | $ | 6,500 | $ | 14,640 | $ | 82,852 | ||||||||||
| Medallion Hamptons Holding LLC—membership interest |
3,650 | 175 | 0 | (1,389 | ) | 2,436 | ||||||||||||||
| Medallion Servicing Corp.—common stock |
33 | 741 | 0 | (197 | ) | 577 | ||||||||||||||
| Generation Outdoor, Inc.—common stock |
1,044 | 1,381 | 2,905 | 545 | 65 | |||||||||||||||
| Medallion Sports Media, Inc.—common stock |
0 | 433 | 0 | (431 | ) | 2 | ||||||||||||||
| Appliance Recycling Centers of America Inc—common stock |
1,389 | 0 | 0 | 836 | 2,225 | |||||||||||||||
| Summit Medical, Inc—common stock |
0 | 0 | 0 | 135 | 135 | |||||||||||||||
| Aeration Industries International LLC—membership interest |
500 | — | 135 | (365 | ) | 0 | ||||||||||||||
F-52
Table of Contents
(A wholly owned subsidiary of Medallion Financial Corp.)
Financial Statements for the years ended December 31, 2012, 2011, and, 2010
F-53
Table of Contents
REPORT OF INDEPENDENT REGISTERED PUBLIC ACCOUNTING FIRM
To the Board of Directors and Shareholder of Medallion Bank
We have audited the accompanying balance sheets of Medallion Bank (the “Bank”) (a wholly owned subsidiary of Medallion Financial Corp.) as of December 31, 2012 and 2011, and the related statements of comprehensive income, changes in shareholder’s equity, and cash flows for each of the three years in the three-year period ended December 31, 2012. These financial statements are the responsibility of the Bank’s management. Our responsibility is to express an opinion on these financial statements based on our audits.
We conducted our audits in accordance with the standards of the Public Company Accounting Oversight Board (United States). Those standards require that we plan and perform the audit to obtain reasonable assurance about whether the financial statements are free of material misstatement. An audit includes examining, on a test basis, evidence supporting the amounts and disclosures in the financial statements. An audit also includes assessing the accounting principles used and significant estimates made by management, as well as evaluating the overall financial statement presentation. We believe that our audits provide a reasonable basis for our opinion.
In our opinion, the financial statements referred to above present fairly, in all material respects, the financial position of the Bank as of December 31, 2012 and 2011, and the results of its operations and its cash flows for each of the three years in the three-year period ended December 31, 2012, in conformity with US generally accepted accounting principles.
/s/ WeiserMazars LLP
New York, New York
March 12, 2013
F-54
Table of Contents
Statements of Comprehensive Income
For the years ended December 31,
| 2012 | 2011 | 2010 | ||||||||||
| Interest income |
||||||||||||
| Investments |
$ | 616,896 | $ | 744,261 | $ | 733,062 | ||||||
| Loan interest including fees |
55,850,212 | 50,546,306 | 46,539,768 | |||||||||
|
|
|
|
|
|
|
|||||||
| Total interest income |
56,467,108 | 51,290,567 | 47,272,830 | |||||||||
| Interest expense |
5,094,140 | 6,057,452 | 7,477,813 | |||||||||
|
|
|
|
|
|
|
|||||||
| Net interest income |
51,372,968 | 45,233,115 | 39,795,017 | |||||||||
| Provision for loan losses |
4,879,698 | 7,346,861 | 12,137,566 | |||||||||
|
|
|
|
|
|
|
|||||||
| Net interest income after provision for loan losses |
46,493,270 | 37,886,254 | 27,657,451 | |||||||||
| Noninterest income |
436,591 | 635,098 | 520,346 | |||||||||
| Gain on sale of repossessed loan collateral |
377,655 | 139,853 | 602,501 | |||||||||
| Noninterest expense |
||||||||||||
| Loan servicing |
7,893,983 | 7,394,730 | 4,256,213 | |||||||||
| Salaries and benefits |
3,799,970 | 2,738,708 | 2,644,882 | |||||||||
| Collection costs |
1,319,561 | 1,356,067 | 1,454,941 | |||||||||
| Regulatory fees |
588,896 | 519,943 | 670,272 | |||||||||
| Professional fees |
545,973 | 613,560 | 537,919 | |||||||||
| Affiliate services |
353,952 | 81,302 | 368,666 | |||||||||
| Occupancy and equipment |
203,204 | 189,947 | 185,638 | |||||||||
| Insurance |
161,195 | 139,247 | 125,096 | |||||||||
| Credit reports |
148,738 | 110,638 | 105,282 | |||||||||
| Director’s fees |
133,026 | 134,700 | 80,842 | |||||||||
| Other |
592,284 | 477,107 | 397,350 | |||||||||
|
|
|
|
|
|
|
|||||||
| Total noninterest expense |
15,740,782 | 13,755,949 | 10,827,101 | |||||||||
|
|
|
|
|
|
|
|||||||
| Income before income taxes |
31,566,734 | 24,905,256 | 17,953,197 | |||||||||
| Provision for income taxes |
12,096,549 | 9,486,983 | 6,717,896 | |||||||||
|
|
|
|
|
|
|
|||||||
| Net income |
19,470,185 | 15,418,273 | 11,235,301 | |||||||||
| Other comprehensive income, net of tax |
||||||||||||
| Net change in unrealized gains on investment securities |
75,503 | 356,355 | 32,546 | |||||||||
|
|
|
|
|
|
|
|||||||
| Total comprehensive income |
$ | 19,545,688 | $ | 15,774,628 | $ | 11,267,847 | ||||||
|
|
|
|
|
|
|
|||||||
The accompanying notes are an integral part of these financial statements.
F-55
Table of Contents
Balance Sheets
December 31,
| 2012 | 2011 | |||||||
| Assets |
||||||||
| Cash and cash equivalents, substantially all of which are federal funds sold |
$ | 24,770,293 | $ | 28,625,549 | ||||
| Investment securities, available-for-sale |
22,122,297 | 26,536,697 | ||||||
| Loans, inclusive of net deferred loan acquisition costs |
679,015,005 | 576,421,745 | ||||||
| Allowance for loan losses |
(14,633,924 | ) | (14,556,266 | ) | ||||
|
|
|
|
|
|||||
| Loans, net |
664,381,081 | 561,865,479 | ||||||
| Repossessed loan collateral |
964,982 | 999,321 | ||||||
| Fixed assets, net |
125,334 | 122,556 | ||||||
| Deferred and other tax assets |
2,947,726 | 3,002,777 | ||||||
| Accrued interest receivable and other assets |
8,061,472 | 7,756,897 | ||||||
|
|
|
|
|
|||||
| Total assets |
$ | 723,373,185 | $ | 628,909,276 | ||||
|
|
|
|
|
|||||
| Liabilities and shareholder’s equity |
||||||||
| Liabilities |
||||||||
| Federal funds purchased |
$ | 6,000,000 | $ | — | ||||
| Time deposits |
596,151,017 | 514,329,000 | ||||||
| Accrued interest payable |
484,080 | 449,946 | ||||||
| Other liabilities |
1,642,917 | 4,315,859 | ||||||
| Due to affiliates |
1,462,079 | 964,037 | ||||||
|
|
|
|
|
|||||
| Total liabilities |
605,740,093 | 520,058,842 | ||||||
|
|
|
|
|
|||||
| Commitments and contingencies |
— | — | ||||||
| Shareholder’s equity |
||||||||
| Preferred stock, $1.00 par value, 26,303 shares at December 31, 2012 and 2011 authorized, issued, and outstanding |
26,303,000 | 26,303,000 | ||||||
| Common stock, $1 par value, 7,000,000 shares authorized, 1,000,000 issued and outstanding |
1,000,000 | 1,000,000 | ||||||
| Additional paid in capital |
51,500,000 | 51,500,000 | ||||||
| Accumulated other comprehensive income, net of tax |
521,743 | 446,240 | ||||||
| Retained earnings |
38,308,349 | 29,601,194 | ||||||
|
|
|
|
|
|||||
| Total shareholder’s equity |
117,633,092 | 108,850,434 | ||||||
|
|
|
|
|
|||||
| Total liabilities and shareholder’s equity |
$ | 723,373,185 | $ | 628,909,276 | ||||
|
|
|
|
|
|||||
The accompanying notes are an integral part of these financial statements.
F-56
Table of Contents
Medallion Bank
Statements of Changes in Shareholder’s Equity
For the years ended December 31, 2012, 2011, and 2010
| Preferred Stock | Common Stock | Additional Paid in Capital |
Accumulated Other Comprehensive Income (Loss) |
Retained Earnings |
Total Shareholder’s Equity |
|||||||||||||||||||||||||||
| Shares Outstanding |
Amount | Shares Outstanding |
Amount | |||||||||||||||||||||||||||||
| Balance at December 31, 2009 |
22,143 | $ | 21,498,000 | 1,000,000 | $ | 1,000,000 | $ | 51,500,000 | $ | 57,339 | $ | 14,812,595 | $ | 88,867,934 | ||||||||||||||||||
| Net income |
— | — | — | — | — | — | 11,235,301 | 11,235,301 | ||||||||||||||||||||||||
| Dividends declared to parent |
— | — | — | — | — | — | (4,000,000 | ) | (4,000,000 | ) | ||||||||||||||||||||||
| Dividends declared to US Treasury |
— | — | — | — | — | — | (1,230,378 | ) | (1,230,378 | ) | ||||||||||||||||||||||
| Net change in unrealized gains on investment securities, net of tax |
— | — | — | — | — | 32,546 | — | 32,546 | ||||||||||||||||||||||||
|
|
|
|
|
|
|
|
|
|
|
|
|
|
|
|
|
|||||||||||||||||
| Balance at December 31, 2010 |
22,143 | 21,498,000 | 1,000,000 | 1,000,000 | 51,500,000 | 89,885 | 20,817,518 | 94,905,403 | ||||||||||||||||||||||||
| Redemption of preferred stock to US Treasury under TARP |
(22,143 | ) | (21,498,000 | ) | — | — | — | — | — | (21,498,000 | ) | |||||||||||||||||||||
| Sale of preferred stock to US Treasury under SBLF |
26,303 | 26,303,000 | — | — | — | — | — | 26,303,000 | ||||||||||||||||||||||||
| Net income |
— | — | — | — | — | — | 15,418,273 | 15,418,273 | ||||||||||||||||||||||||
| Dividends declared to parent |
— | — | — | — | — | — | (5,500,000 | ) | (5,500,000 | ) | ||||||||||||||||||||||
| Dividends declared to US Treasury |
— | — | — | — | — | — | (1,134,597 | ) | (1,134,597 | ) | ||||||||||||||||||||||
| Net change in unrealized gains on investment securities, net of tax |
— | — | — | — | — | 356,355 | — | 356,355 | ||||||||||||||||||||||||
|
|
|
|
|
|
|
|
|
|
|
|
|
|
|
|
|
|||||||||||||||||
| Balance at December 31, 2011 |
26,303 | 26,303,000 | 1,000,000 | 1,000,000 | 51,500,000 | 446,240 | 29,601,194 | 108,850,434 | ||||||||||||||||||||||||
| Net income |
— | — | — | — | — | — | 19,470,185 | 19,470,185 | ||||||||||||||||||||||||
| Dividends declared to parent |
— | — | — | — | — | — | (10,500,000 | ) | (10,500,000 | ) | ||||||||||||||||||||||
| Dividends declared to US Treasury |
— | — | — | — | — | — | (263,030 | ) | (263,030 | ) | ||||||||||||||||||||||
| Net change in unrealized gains on investment securities, net of tax |
— | — | — | — | — | 75,503 | — | 75,503 | ||||||||||||||||||||||||
|
|
|
|
|
|
|
|
|
|
|
|
|
|
|
|
|
|||||||||||||||||
| Balance at December 31, 2012 |
26,303 | $ | 26,303,000 | 1,000,000 | $ | 1,000,000 | $ | 51,500,000 | $ | 521,743 | $ | 38,308,349 | $ | 117,633,092 | ||||||||||||||||||
|
|
|
|
|
|
|
|
|
|
|
|
|
|
|
|
|
|||||||||||||||||
The accompanying notes are an integral part of these financial statements.
F-57
Table of Contents
Medallion Bank
For the years ended December 31,
| 2012 | 2011 | 2010 | ||||||||||
| Cash flows from operating activities |
||||||||||||
| Net income from operations |
$ | 19,470,185 | $ | 15,418,273 | $ | 11,235,301 | ||||||
| Adjustments to reconcile net income to net cash flows provided by operating activities: |
||||||||||||
| Depreciation and amortization |
3,788,217 | 3,523,826 | 3,528,235 | |||||||||
| Deferred tax provision (benefit) |
235,341 | (596,375 | ) | 22,908 | ||||||||
| Provision for loan losses |
4,879,698 | 7,346,861 | 12,137,566 | |||||||||
| Loss from disposal of premises and equipment |
— | 2,177 | — | |||||||||
| (Gain) loss from sale of repossessed loan collateral |
(382,319 | ) | (147,084 | ) | (612,055 | ) | ||||||
| Changes in operating assets and liabilities: |
||||||||||||
| Interest receivable |
(654,208 | ) | 58,492 | 178,746 | ||||||||
| Other assets |
(790,316 | ) | (953,078 | ) | (338,846 | ) | ||||||
| Other tax assets |
(225,592 | ) | 2,358,358 | (1,748,202 | ) | |||||||
| Interest payable |
34,135 | (705,064 | ) | (353,517 | ) | |||||||
| Other liabilities |
(172,942 | ) | (12,481 | ) | 8,933 | |||||||
|
|
|
|
|
|
|
|||||||
| Net cash provided by operating activities |
26,182,199 | 26,293,905 | 24,059,069 | |||||||||
|
|
|
|
|
|
|
|||||||
| Cash flows from investing activities |
||||||||||||
| Increase in loans, net |
(113,334,573 | ) | (59,121,697 | ) | (117,996,963 | ) | ||||||
| Purchase of investments |
(3,609,969 | ) | (12,008,181 | ) | (8,786,206 | ) | ||||||
| Purchase of other investment assets |
— | — | (1,800,000 | ) | ||||||||
| Proceeds from maturity of investments |
7,967,999 | 6,752,366 | 9,088,732 | |||||||||
| Proceeds from sale of repossessed loan collateral |
3,935,367 | 4,619,856 | 6,547,376 | |||||||||
| Purchase of premises and equipment |
(53,308 | ) | (93,553 | ) | (9,888 | ) | ||||||
|
|
|
|
|
|
|
|||||||
| Net cash used in investing activities |
(105,094,484 | ) | (59,851,209 | ) | (112,956,949 | ) | ||||||
|
|
|
|
|
|
|
|||||||
| Cash flows from financing activities |
||||||||||||
| Issuance of time deposits |
515,872,072 | 713,319,000 | 659,538,000 | |||||||||
| Payments made at maturity of time deposits |
(434,050,055 | ) | (664,947,000 | ) | (565,300,000 | ) | ||||||
| Federal funds purchased |
33,000,000 | 19,000,000 | 33,000,000 | |||||||||
| Payments made at maturity of federal funds purchased |
(27,000,000 | ) | (22,000,000 | ) | (30,000,000 | ) | ||||||
| Issuance of preferred stock |
— | 26,303,000 | — | |||||||||
| Redemption of preferred stock |
— | (21,498,000 | ) | — | ||||||||
| Change in due to affiliates |
498,042 | (148,977 | ) | 382,637 | ||||||||
| Dividends paid to parent |
(13,000,000 | ) | (4,000,000 | ) | (4,000,000 | ) | ||||||
| Dividends paid to US Treasury |
(263,030 | ) | (825,327 | ) | (1,082,604 | ) | ||||||
|
|
|
|
|
|
|
|||||||
| Net cash provided by financing activities |
75,057,029 | 45,202,696 | 92,538,033 | |||||||||
|
|
|
|
|
|
|
|||||||
| Net change in cash and cash equivalents |
(3,855,256 | ) | 11,645,392 | 3,640,153 | ||||||||
| Cash and cash equivalents, beginning of the year |
28,625,549 | 16,980,157 | 13,340,004 | |||||||||
|
|
|
|
|
|
|
|||||||
| Cash and cash equivalents, end of the year |
$ | 24,770,293 | $ | 28,625,549 | $ | 16,980,157 | ||||||
|
|
|
|
|
|
|
|||||||
| SUPPLEMENTAL DISCLOSURE OF CASH FLOW INFORMATION |
||||||||||||
| Cash paid for interest |
$ | 3,919,477 | $ | 5,709,261 | $ | 6,824,341 | ||||||
| Cash paid for income taxes |
11,275,000 | 7,725,000 | 8,445,000 | |||||||||
| Non-cash investing activities-loans transferred to repossessed loan collateral |
7,748,430 | 8,867,986 | 13,478,072 | |||||||||
|
|
|
|
|
|
|
|||||||
The accompanying notes are an integral part of these financial statements.
F-58
Table of Contents
Medallion Bank
For the year ended December 31, 2012
| 1. | Organization and summary of significant accounting policies |
Description of business—Medallion Bank (the Bank) is a limited service industrial bank headquartered in Salt Lake City, Utah. The Bank was formed in May 2002 for the purpose of obtaining an industrial bank (IB) charter pursuant to the laws of the State of Utah. The Bank is a wholly owned subsidiary of Medallion Financial Corp. (Medallion). The Bank originates asset-based commercial loans and commercial loans to finance the purchase of taxi medallions (licenses), both of which are marketed and serviced by the Bank’s affiliates who have extensive prior experience in these asset groups. The Bank originates consumer loans on a national basis that are secured by marine, recreational vehicle and trailer products to customers with prior credit blemishes. The Bank also originates unsecured home improvement consumer loans on a national basis. The loans are financed primarily with time certificates of deposits which are originated nationally through a variety of brokered deposit relationships.
Basis of presentation—The Bank’s financial statements are presented in accordance with accounting principles generally accepted in the US and prevailing industry practices, which require management to make estimates that affect the reported amounts of assets and liabilities and disclosure of contingent assets and liabilities. Estimates, by their nature, are based upon judgment and available information. Actual results could differ materially from those estimates.
Cash and cash equivalents—The Bank considers all highly liquid instruments with an original purchased maturity of three months or less to be cash equivalents. A non-interest bearing compensating balance of $100,000 is maintained at a correspondent bank. Cash balances are generally held in accounts at large national or regional banking organizations in amounts that frequently exceed the federally insured limits.
Investment securities—FASB ASC Topic 320, “Investments—Debt and Equity Securities,” requires that all applicable investments be classified as trading securities, available-for-sale securities, or held-to-maturity securities. Investment securities are purchased from time-to-time in the open market at prices that are greater or lesser than the par value of the investment. The resulting premium or discount is deferred and recognized on a level yield basis as an adjustment to the yield of the related investment. At December 31, 2012 and 2011, the net premium on investment securities totaled $336,000 and $403,000, and $177,000, $76,000, and $67,000 was amortized to interest income for the years ended December 31, 2012, 2011, and 2010. The Bank had $22,122,000 and $26,537,000 of available-for-sale securities at fair value as of December 31, 2012 and 2011. The topic further requires that held-to-maturity securities be reported at amortized cost and available-for-sale securities be reported at fair value, with unrealized gains and losses excluded from earnings at the date of the financial statements, and reported in accumulated other comprehensive income (loss) as a separate component of shareholder’s equity, net of the effect of income taxes, until they are sold. The Bank had $835,000 and $714,000 of pretax net unrealized gains on available-for-sale securities as of December 31, 2012 and 2011. At the time of sale, any gains or losses, calculated by the specific identification method, will be recognized as a component of operating results and any amounts previously included in shareholder’s equity, which were recorded net of the income tax effect, will be reversed.
Loans—Loans are reported at the principal amount outstanding, inclusive of deferred loan acquisition costs, which primarily includes deferred fees paid to loan originators, and which is amortized to interest income over the life of the loan.
Loan origination fees and certain direct origination costs are deferred and recognized as an adjustment to the yield of the related loans. At December 31, 2012 and 2011, net loan origination costs were $7,017,000 and $5,577,000. Net amortization expense for the years ended December 31, 2012, 2011, and 2010 was $2,334,000, $2,188,000, and $2,242,000.
F-59
Table of Contents
Interest income is recognized on an accrual basis. Taxicab medallion and commercial loans are placed on nonaccrual status, and all uncollected accrued interest is reversed, when there is doubt as to the collectability of interest or principal, or if loans are 90 days or more past due, unless management has determined that they are both well-secured and in the process of collection. Interest income on nonaccrual loans is generally recognized when cash is received, unless a determination has been made to apply all cash receipts to principal. The consumer portfolio has different characteristics compared to commercial loans, typified by a larger number of lower dollar loans that have similar characteristics. A loan is considered to be impaired, or nonperforming, when based on current information and events, it is likely the Bank will be unable to collect all amounts due according to the contractual terms of the original loan agreement. Management considers loans that are in bankruptcy status, but have not been charged-off, to be impaired. These loans are placed on nonaccrual, when they become 90 days past due, or earlier if they enter bankruptcy, and are charged off in their entirety when deemed uncollectible, or when they become 120 days past due, whichever occurs first, at which time appropriate collection and recovery efforts against both the borrower and the underlying collateral are initiated. Other loans are charged off when management determines that a loss has occurred. All interest accrued but not collected for loans that are charged off is reversed against interest income. For the recreational consumer loan portfolio, the process to repossess the collateral is started at 60 days past due. If the collateral is not located and the account reaches 120 days delinquent, the account is charged off. If the collateral is repossessed, a loss is recorded to write the loan down to its fair value less selling costs, and the collateral is sent to auction. When the collateral is sold, the net auction proceeds are applied to the account, and any remaining balance is written off, and any excess proceeds are recorded as a realized gain. Proceeds collected on charged off accounts are recorded as a recovery. Total loans more than 90 days past due were $1,252,000, $1,265,000, and $2,246,000 at December 31, 2012, 2011, and 2010, or 0.2%, 0.2%, and 0.4% of the total loan portfolio.
At December 31, 2012, $2,451,000 or 1% of consumer loans, and no commercial and medallion loans were on nonaccrual, compared to $2,264,000 or 1% of consumer loans, and no commercial and medallion loans on nonaccrual at December 31, 2011, and $2,686,000 or 1% of consumer loans, $329,000 or less than 1% of commercial loans, and no medallion loans on nonaccrual at December 31, 2010. The amount of interest income on nonaccrual loans that would have been recognized if the loans had been paying in accordance with their original terms was immaterial for all periods presented.
These loans are charged-down to fair value and placed on nonaccrual status. Fair value is determined based upon comparable market prices for substantially similar collateral plus management’s estimate of disposal costs. All interest accrued but not collected for loans that are placed on nonaccrual is reversed against interest income. The interest on these loans is accounted for on the cash basis until qualifying for return to accrual status. Loans are returned to accrual status when all the principal and interest amounts contractually due are brought current and future payments are reasonably assured.
Troubled Debt Restructurings (TDRs)—In situations where, for economic or legal reasons related to a borrower’s financial difficulties, the Bank grants a concession for other than an insignificant period of time to the borrower that the Bank would not otherwise consider, the related loan is classified as a TDR. The Bank strives to identify borrowers in financial difficulty early and work with them to modify their loan to more affordable terms before it reaches nonaccrual status. These modified terms may include rate reductions, principal forgiveness, term extensions, payment forbearance and other actions intended to minimize the economic loss to the Bank and to avoid foreclosure or repossession of the collateral. For modifications where the Bank forgives principal, the entire amount of such principal forgiveness is immediately charged off. Loans classified as TDRs are considered impaired loans.
When the Bank identifies a loan as impaired, the Bank measures the impairment based on the present value of expected future cash flows, discounted at the loan’s effective interest rate. When collateral is the sole source of repayment for the loan, the Bank may measure impairment based on the fair value of the collateral. If foreclosure is probable, the Bank uses the current fair value of the collateral less selling costs, instead of discounted cash flows.
F-60
Table of Contents
If the Bank determines that the value of an impaired loan is less than the recorded investment in the loan (net of previous chargeoffs, deferred loan fees or costs and unamortized premium or discount), the Bank recognizes impairment. When the value of an impaired loan is calculated by discounting expected cash flows, interest income is recognized using the loan’s effective interest rate over the remaining life of the loan.
Allowance for loan losses—In analyzing the adequacy of the allowance for loan losses, the Bank uses historical delinquency and actual loss rates with a one year lookback period. The allowance for loan losses is evaluated on a regular basis by management and is based upon management’s periodic review of the collectability of the loans in light of historical experience, the nature and volume of the loan portfolio, adverse situations that may affect the borrower’s ability to repay, estimated value of any underlying collateral, prevailing economic conditions, and excess concentration risks. This evaluation is inherently subjective, as it requires estimates that are susceptible to significant revision as more information becomes available. Credit losses are deducted from the allowance and subsequent recoveries are added.
Fixed assets—Fixed assets are stated at cost less accumulated depreciation and amortization. Maintenance and repairs are charged to expense while significant improvements are capitalized. Depreciation and amortization are computed using the straight-line method over the estimated useful lives of the related assets. Capitalized leasehold improvements are amortized over the lesser of the estimated useful life of the asset or the remaining lease term.
Income taxes—The Bank uses the asset and liability method in providing income taxes on all transactions that have been recognized in the financial statements. Deferred tax assets and liabilities are recognized for the future tax consequences attributable to differences between the financial statement carrying amounts of existing assets and liabilities and their existing tax bases. The Bank files its tax returns on a separate company basis.
Other comprehensive income (loss)—The Bank had $76,000, $356,000, and $33,000 of net unrealized gains due to the mark-to-market of available-for-sale securities for the years ended December 31, 2012, 2011, and 2010. The Bank had no other components of comprehensive income (loss).
Restrictions on dividends, loans, and advances—Banking regulations place certain restrictions on dividends paid and loans or advances made by the Bank to Medallion. The total amount of dividends that may be paid at any date is generally limited to the retained earnings of the Bank. However, dividends paid by the Bank would be prohibited if the effect thereof would cause the Bank’s capital to be reduced below applicable minimum standards.
Financial instruments—FASB ASC Topic 825, “Financial Instruments,” requires disclosure of fair value information about certain financial instruments, whether assets, liabilities, or off-balance-sheet commitments, if practicable.
Fair value of assets and liabilities—The Bank follows FASB ASC Topic 820, “Fair Value Measurements and Disclosures,” (FASB ASC 820), which defines fair value, establishes a framework for measuring fair value, and expands disclosures about fair value measurements. FASB ASC 820 defines fair value as an exit price (i.e. a price that would be received to sell, as opposed to acquire, an asset or transfer a liability), and emphasizes that fair value is a market-based measurement. It establishes a fair value hierarchy that distinguishes between assumptions developed based on market data obtained from independent external sources and the reporting entities own assumptions. Further, it specifies that fair value measurement should consider adjustment for risk, such as the risk inherent in the valuation technique or its inputs. See also Note 12 to the financial statements.
Reclassifications—Certain reclassifications have been made to prior year balances to conform with the current year presentation. These reclassifications have no effect on the previously reported results of operations.
Recently issued accounting standards—In February 2013, the FASB issued Accounting Standards Update (ASU) No. 2013-02, “Reporting of Amounts Reclassified Out of Accumulated Other Comprehensive Income.”
F-61
Table of Contents
This guidance requires entities to provide information about the amounts reclassified out of accumulated other comprehensive income by component. Additionally, entities are required to present significant amounts reclassified out of other comprehensive income by the respective line items of net income, but only if the amount reclassified is required under U.S. GAAP to be reclassified to net income in its entirety in the same reporting period. For other amounts that are not required to be reclassified in their entirety to net income, entities are required to provide additional detail about these amounts. This guidance is effective for reporting periods beginning after December 15, 2012. Early adoption is permitted. The adoption of this standard should not have a material impact on the Bank’s financial statements.
In July 2012, the FASB issued ASU 2012-02, “Testing Indefinite-Lived Intangible Assets for Impairment.” ASU 2012-02 revises ASC Topic 350 (Intangibles-Goodwill and Other) by allowing an entity to perform a qualitative assessment to determine whether further impairment testing of indefinite-lived intangible assets is necessary. Prior to the update, an entity was required to assess indefinite-lived intangible assets for impairment by comparing the fair value of an asset to its carrying amount. The update is effective for fiscal years beginning after September 15, 2012. The Bank does not believe the adoption of the standard will have an impact on its financial condition or results of operation.
In December 2011, the FASB issued ASU 2011-11, “Disclosures about Offsetting Assets and Liabilities.” ASU 2011-11 adds certain additional disclosure requirements about financial instruments and derivative instruments that are subject to offsetting and related arrangements. The FASB further clarified the scope of ASU 2011-11 in January 2013 with the issuance of Accounting Standards Update (ASU) 2013-01, “Clarifying the Scope of Disclosures about Offsetting Assets and Liabilities.” The new disclosures are required for annual reporting periods beginning on or after January 1, 2013, and interim periods within those periods. As the amendment impacts disclosures only, it will not have an effect on the Bank’s financial condition or results of operation.
| 2. | Investment securities |
Fixed maturity securities available-for-sale at December 31, 2012 consist of the following.
| Amortized Cost |
Gross Unrealized Gains |
Gross Unrealized Losses |
Fair Value | |||||||||||||
| Mortgage-backed securities, principally obligations of US federal agencies |
$ | 17,426,470 | $ | 701,347 | $ | 14,272 | $ | 18,113,545 | ||||||||
| State and municipalities |
3,861,039 | 153,305 | 5,592 | 4,008,752 | ||||||||||||
|
|
|
|
|
|
|
|
|
|||||||||
| Total |
$ | 21,287,509 | $ | 854,652 | $ | 19,864 | $ | 22,122,297 | ||||||||
|
|
|
|
|
|
|
|
|
|||||||||
Fixed maturity securities available-for-sale at December 31, 2011 consist of the following.
| Amortized Cost |
Gross Unrealized Gains |
Gross Unrealized Losses |
Fair Value | |||||||||||||
| Mortgage-backed securities, principally obligations of US federal agencies |
$ | 23,006,404 | $ | 638,059 | $ | 48,090 | $ | 23,596,373 | ||||||||
| State and municipalities |
2,816,310 | 124,014 | — | 2,940,324 | ||||||||||||
|
|
|
|
|
|
|
|
|
|||||||||
| Total |
$ | 25,822,714 | $ | 762,073 | $ | 48,090 | $ | 26,536,697 | ||||||||
|
|
|
|
|
|
|
|
|
|||||||||
F-62
Table of Contents
The amortized cost and estimated market value of investment securities as of December 31, 2012 by contractual maturity are shown below. Actual maturities will differ from contractual maturities because borrowers may have the right to call or prepay obligations with or without call or prepayment penalties.
| Amortized Cost | Market Value | |||||||
| Due in one year or less |
$ | — | $ | — | ||||
| Due after one year through five years |
1,420,000 | 1,478,688 | ||||||
| Due after five years through ten years |
4,593,832 | 4,699,182 | ||||||
| Due after ten years |
15,273,677 | 15,944,427 | ||||||
|
|
|
|
|
|||||
| Total |
$ | 21,287,509 | $ | 22,122,297 | ||||
|
|
|
|
|
|||||
Information pertaining to securities with gross unrealized losses at December 31, 2012 and 2011 aggregated by investment category and length of time that individual securities have been in a continuous loss position follows.
| Less than Twelve Months | Twelve Months and Over | |||||||||||||||
| December 31, 2012 |
Gross Unrealized Losses |
Fair Value | Gross Unrealized Losses |
Fair Value |
||||||||||||
| Mortgage-backed securities, principally obligations of US federal agencies |
$ | 14,272 | $ | 2,391,954 | $ | — | $ | — | ||||||||
| State and municipalities |
5,592 | 1,194,408 | — | — | ||||||||||||
|
|
|
|
|
|
|
|
|
|||||||||
| Total |
$ | 19,864 | $ | 3,586,362 | $ | — | $ | — | ||||||||
|
|
|
|
|
|
|
|
|
|||||||||
| Less than Twelve Months | Twelve Months and Over | |||||||||||||||
| December 31, 2011 |
Gross Unrealized Losses |
Fair Value | Gross Unrealized Losses |
Fair Value |
||||||||||||
| Mortgage-backed securities, principally obligations of US federal agencies |
$ | 48,090 | $ | 3,020,198 | $ | — | $ | — | ||||||||
| State and municipalities |
— | — | — | — | ||||||||||||
|
|
|
|
|
|
|
|
|
|||||||||
| Total |
$ | 48,090 | $ | 3,020,198 | $ | — | $ | — | ||||||||
|
|
|
|
|
|
|
|
|
|||||||||
Unrealized losses on securities have not been recognized into income because the issuers’ bonds are of high credit quality, and the Bank has the intent and ability to hold the securities for the foreseeable future. The fair value is expected to recover as the bonds approach the maturity date.
| 3. | Loans and allowance for loan losses |
Loans are summarized as follows at December 31.
| Loans |
2012 | 2011 | ||||||
| Consumer(1) |
$ | 264,786,683 | $ | 200,025,746 | ||||
| Medallion(1) |
337,108,020 | 294,213,705 | ||||||
| Commercial:(2) |
||||||||
| Asset-based |
65,911,790 | 72,491,669 | ||||||
| Construction |
3,301,070 | 3,650,238 | ||||||
| Other commercial |
890,620 | 463,593 | ||||||
|
|
|
|
|
|||||
| Total commercial |
70,103,480 | 76,605,500 | ||||||
| Deferred loan acquisition costs, net |
7,016,822 | 5,576,794 | ||||||
|
|
|
|
|
|||||
| Total loans |
$ | 679,015,005 | $ | 576,421,745 | ||||
|
|
|
|
|
|||||
| (1) | Collectively evaluated for impairment |
| (2) | Individually evaluated for impairment |
F-63
Table of Contents
Changes in the allowance for loan losses are summarized as follows.
| Medallion(1) | Asset-based and commercial(2) |
Construction(2) | Consumer(1) | Total | ||||||||||||||||
| Balance at 12/31/09 |
$ | 724,477 | $ | 995,000 | $ | 319,605 | $ | 11,514,176 | $ | 13,553,258 | ||||||||||
| Provision for loan losses |
534,576 | 18,894 | 494,955 | 11,089,141 | 12,137,566 | |||||||||||||||
| Loan charge-offs |
— | — | (739,430 | ) | (14,350,642 | ) | (15,090,072 | ) | ||||||||||||
| Recoveries |
— | — | — | 3,013,206 | 3,013,206 | |||||||||||||||
|
|
|
|
|
|
|
|
|
|
|
|||||||||||
| Balance at 12/31/10 |
1,259,053 | 1,013,894 | 75,130 | 11,265,881 | 13,613,958 | |||||||||||||||
| Provision for loan losses |
182,030 | 73,478 | (17,207 | ) | 7,108,560 | 7,346,861 | ||||||||||||||
| Loan charge-offs |
— | — | (3,170 | ) | (9,327,362 | ) | (9,330,532 | ) | ||||||||||||
| Recoveries |
— | — | — | 2,925,979 | 2,925,979 | |||||||||||||||
|
|
|
|
|
|
|
|
|
|
|
|||||||||||
| Balance at 12/31/11 |
1,441,083 | 1,087,372 | 54,753 | 11,973,058 | 14,556,266 | |||||||||||||||
| Provision for loan losses |
245,750 | (98,698 | ) | (5,238 | ) | 4,737,884 | 4,879,698 | |||||||||||||
| Loan charge-offs |
— | — | — | (8,024,847 | ) | (8,024,847 | ) | |||||||||||||
| Recoveries |
— | — | — | 3,222,807 | 3,222,807 | |||||||||||||||
|
|
|
|
|
|
|
|
|
|
|
|||||||||||
| Balance at 12/31/12 |
$ | 1,686,833 | $ | 988,674 | $ | 49,515 | $ | 11,908,902 | $ | 14,633,924 | ||||||||||
|
|
|
|
|
|
|
|
|
|
|
|||||||||||
| (1) | Collectively evaluated for impairment |
| (2) | Individually evaluated for impairment |
The loan charge-offs and recoveries resulted primarily from the consumer portfolio. There were no loans acquired with deteriorated credit quality.
See Note 1 to the financial statements, which describes the nature of the portfolios, their collection and income recognition processes, and the methodology used to assess the adequacy of the allowance.
The medallion and asset-based loan portfolios are primarily collateral-based lending, whereby the collateral value exceeds the amount of the loan, providing sufficient excess collateral to protect against losses to the Bank. The adequacy of these amounts is demonstrated by the minimal loss experience in these portfolios since the Bank’s inception. The asset-based portfolio is analyzed and evaluated in the aggregate, as a pool of loans, until becoming nonperforming, at which time they receive individualized attention. The medallion portfolio is analyzed and evaluated in the aggregate, as a pool of loans.
The consumer loan portfolio is primarily customer driven, whereby borrowers are assessed a score based on income level, home ownership, FICO score, and other factors weighted in a credit scoring model that determines whether a borrower is qualified. Loan losses in this portfolio fluctuate with economic conditions, and can range widely over time. The consumer loan portfolio is analyzed and evaluated in the aggregate, as a pool of loans.
Other commercial or construction loans are infrequent, and made on a case by case basis, after performing thorough borrower review, credit, and collateral checks. The risk associated with these types of loans is individual to that particular credit, and they are monitored and tracked closely.
Allocations for the allowance for credit losses may be made for specific loans, but the allowance is general in nature and is available to absorb losses from any loan type.
F-64
Table of Contents
The following table provides a summary of the loan portfolio by its performance status and by type.
| Performing | Nonperforming | Total | ||||||||||||||||||||||
| 2012 | 2011 | 2012 | 2011 | 2012 | 2011 | |||||||||||||||||||
| Medallion |
$ | 337,108,020 | $ | 294,213,705 | $ | — | $ | — | $ | 337,108,020 | $ | 294,213,705 | ||||||||||||
| Asset-based and commercial |
66,802,410 | 72,955,262 | — | — | 66,802,410 | 72,955,262 | ||||||||||||||||||
| Construction |
3,301,070 | 3,650,238 | — | — | 3,301,070 | 3,650,238 | ||||||||||||||||||
| Consumer |
261,789,204 | 197,373,077 | 2,997,479 | 2,652,669 | 264,786,683 | 200,025,746 | ||||||||||||||||||
|
|
|
|
|
|
|
|
|
|
|
|
|
|||||||||||||
| Total |
$ | 669,000,704 | $ | 568,192,282 | $ | 2,997,479 | $ | 2,652,669 | $ | 671,998,183 | $ | 570,844,951 | ||||||||||||
|
|
|
|
|
|
|
|
|
|
|
|
|
|||||||||||||
The following tables provide additional information on attributes of the nonperforming loan portfolio.
| December 31, 2012 |
Recorded Investment |
Unpaid Principal Balance |
Related Allowance |
Average Recorded Investment |
Interest Income Recognized |
|||||||||||||||
| With no related allowance recorded |
||||||||||||||||||||
| Medallion |
$ | — | $ | — | $ | — | $ | — | $ | — | ||||||||||
| Asset –based and commercial |
— | — | — | — | — | |||||||||||||||
| Construction |
— | — | — | — | — | |||||||||||||||
| Consumer |
— | — | — | — | — | |||||||||||||||
| With an allowance recorded |
||||||||||||||||||||
| Medallion |
— | — | — | — | — | |||||||||||||||
| Asset –based and commercial |
— | — | — | — | — | |||||||||||||||
| Construction |
— | — | — | — | — | |||||||||||||||
| Consumer |
2,997,479 | 2,997,479 | 116,088 | 2,098,346 | 272,591 | |||||||||||||||
|
|
|
|
|
|
|
|
|
|
|
|||||||||||
| Total |
||||||||||||||||||||
| Medallion |
— | — | — | — | — | |||||||||||||||
| Asset –based and commercial |
— | — | — | — | — | |||||||||||||||
| Construction |
— | — | — | — | — | |||||||||||||||
| Consumer |
$ | 2,997,479 | $ | 2,997,479 | $ | 116,088 | $ | 2,098,346 | $ | 272,591 | ||||||||||
|
|
|
|
|
|
|
|
|
|
|
|||||||||||
| December 31, 2011 |
Recorded Investment |
Unpaid Principal Balance |
Related Allowance |
Average Recorded Investment |
Interest Income Recognized |
|||||||||||||||
| With no related allowance recorded |
||||||||||||||||||||
| Medallion |
$ | — | $ | — | $ | — | $ | — | $ | — | ||||||||||
| Asset –based and commercial |
— | — | — | — | — | |||||||||||||||
| Construction |
— | — | — | — | — | |||||||||||||||
| Consumer |
— | — | — | — | — | |||||||||||||||
| With an allowance recorded |
||||||||||||||||||||
| Medallion |
— | — | — | — | — | |||||||||||||||
| Asset –based and commercial |
— | — | — | — | — | |||||||||||||||
| Construction |
— | — | — | — | — | |||||||||||||||
| Consumer |
2,652,669 | 2,652,669 | 134,184 | 2,331,596 | 274,065 | |||||||||||||||
|
|
|
|
|
|
|
|
|
|
|
|||||||||||
| Total |
||||||||||||||||||||
| Medallion |
— | — | — | — | — | |||||||||||||||
| Asset –based and commercial |
— | — | — | — | — | |||||||||||||||
| Construction |
— | — | — | — | — | |||||||||||||||
| Consumer |
$ | 2,652,669 | $ | 2,652,669 | $ | 134,184 | $ | 2,331,596 | $ | 274,065 | ||||||||||
|
|
|
|
|
|
|
|
|
|
|
|||||||||||
F-65
Table of Contents
The table below shows the aging of all loan types as of December 31, 2012.
| Days Past Due | Current | Total | ||||||||||||||||||||||||||
| 31-60 | 61-90 | 91 + | Total Past Due | Recorded Investment >90 Days and Accruing |
||||||||||||||||||||||||
| Medallion |
$ | — | $ | — | $ | 9,753 | $ | 9,753 | $ | 337,098,267 | $ | 337,108,020 | $ | 9,753 | ||||||||||||||
| Asset –based and commercial |
— | — | — | — | 66,802,410 | 66,802,410 | — | |||||||||||||||||||||
| Construction |
— | — | — | — | 3,301,070 | 3,301,070 | — | |||||||||||||||||||||
| Consumer |
6,925,116 | 2,468,416 | 1,242,653 | 10,636,185 | 254,150,498 | 264,786,683 | — | |||||||||||||||||||||
|
|
|
|
|
|
|
|
|
|
|
|
|
|
|
|||||||||||||||
| Total |
$ | 6,925,116 | $ | 2,468,416 | $ | 1,252,406 | $ | 10,645,938 | $ | 661,352,245 | $ | 671,998,183 | $ | 9,753 | ||||||||||||||
|
|
|
|
|
|
|
|
|
|
|
|
|
|
|
|||||||||||||||
The table below shows the aging of all loan types as of December 31, 2011.
| Days Past Due | Current | Total | ||||||||||||||||||||||||||
| 31-60 | 61-90 | 91 + | Total Past Due | Recorded Investment >90 Days and Accruing |
||||||||||||||||||||||||
| Medallion |
$ | 1,749,400 | $ | — | $ | — | $ | 1,749,400 | $ | 292,464,305 | $ | 294,213,705 | $ | — | ||||||||||||||
| Asset –based and commercial |
— | — | — | — | 72,955,262 | 72,955,262 | — | |||||||||||||||||||||
| Construction |
— | — | — | — | 3,650,238 | 3,650,238 | — | |||||||||||||||||||||
| Consumer |
6,651,942 | 1,765,121 | 1,265,679 | 9,682,742 | 190,343,004 | 200,025,746 | — | |||||||||||||||||||||
|
|
|
|
|
|
|
|
|
|
|
|
|
|
|
|||||||||||||||
| Total |
$ | 8,401,342 | $ | 1,765,121 | $ | 1,265,679 | $ | 11,432,142 | $ | 559,412,809 | $ | 570,844,951 | $ | — | ||||||||||||||
|
|
|
|
|
|
|
|
|
|
|
|
|
|
|
|||||||||||||||
The table below shows loans that were modified during 2012.
| Troubled Debt Restructuring | Troubled Debt Restructuring that Subsequently Defaulted |
|||||||||||||||||||
| Number of Loans |
Pre-Modification Outstanding Recorded Investments |
Post-Modification Outstanding Recorded Investments |
Number of Loans |
Recorded Investments |
||||||||||||||||
| Troubled debt restructuring |
— | $ | — | $ | — | — | $ | — | ||||||||||||
| Commercial |
— | — | — | — | — | |||||||||||||||
| Commercial real estate |
— | — | — | — | — | |||||||||||||||
| Consumer |
11 | 169,774 | 146,123 | 1 | 2,121 | |||||||||||||||
|
|
|
|
|
|
|
|
|
|
|
|||||||||||
The table below shows loans that were modified during 2011.
| Troubled Debt Restructuring | Troubled Debt Restructuring that Subsequently Defaulted |
|||||||||||||||||||
| Number of Loans |
Pre-Modification Outstanding Recorded Investments |
Post-Modification Outstanding Recorded Investments |
Number of Loans |
Recorded Investments |
||||||||||||||||
| Troubled debt restructuring |
— | $ | — | $ | — | — | $ | — | ||||||||||||
| Commercial |
— | — | — | — | — | |||||||||||||||
| Commercial real estate |
— | — | — | — | — | |||||||||||||||
| Consumer |
34 | 658,134 | 556,206 | 2 | 39,424 | |||||||||||||||
|
|
|
|
|
|
|
|
|
|
|
|||||||||||
F-66
Table of Contents
| 4. | Fixed assets |
Fixed assets and their related useful lives at December 31 were as follows:
| Useful lives | 2012 | 2011 | ||||||||
| Computer software |
3 years | $ | 138,953 | $ | 118,907 | |||||
| Furniture and fixtures |
5-10 years | 116,337 | 97,576 | |||||||
| Leasehold improvements |
3-5 years | 83,963 | 80,829 | |||||||
| Equipment |
5 years | 119,423 | 112,557 | |||||||
| Telephone equipment |
3 years | 48,557 | 44,057 | |||||||
| Deposit system |
3 years | 13,975 | 13,975 | |||||||
|
|
|
|
|
|||||||
| 521,208 | 467,901 | |||||||||
| Less accumulated depreciation and amortization |
(395,874 | ) | (345,345 | ) | ||||||
|
|
|
|
|
|||||||
| Net fixed assets |
$ | 125,334 | $ | 122,556 | ||||||
|
|
|
|
|
|||||||
Depreciation expense was $51,000, $59,000, and $58,000 for the years ended December 31, 2012, 2011, and 2010.
| 5. | Deposits and fed funds purchased |
At December 31, 2012 the scheduled maturities of all time deposits were as follows.
| 2013 |
$ | 405,909,017 | ||
| 2014 |
130,456,000 | |||
| 2015 |
38,139,000 | |||
| 2016 |
16,684,000 | |||
| After |
4,963,000 | |||
|
|
|
|||
| Total |
$ | 596,151,017 | ||
|
|
|
All time deposits are in denominations of less than $100,000 and have been originated through Certificate of Deposit Broker relationships. The weighted average interest rate of deposits outstanding at December 31, 2012 was 0.69%.
In January 2004, Medallion Bank commenced raising deposits to fund the purchase of various affiliates’ loan portfolios. Deposits are raised through the use of investment brokerage firms who package deposits qualifying for FDIC insurance into pools that are sold to Medallion Bank. The rates paid on the deposits are highly competitive with market rates paid by other financial institutions. Additionally, a brokerage fee of 0.15% to 0.50% is paid, depending on the maturity of the deposit, which is capitalized and amortized to interest expense over the life of the respective pool. The total amount capitalized at December 31, 2012 and 2011 was $1,249,000 and $1,250,000, and $1,140,000, $1,053,000, and $1,007,000 was amortized to interest expense during 2012, 2011, and 2010. Interest on the deposits is accrued daily and paid monthly, quarterly, semiannually, or at maturity.
At December 31, 2012, the Bank had drawn $6,000,000 from its Federal Funds lines, which was repaid in January 2013, and had unsecured and undrawn Federal Funds lines with correspondent banks of $24,000,000.
F-67
Table of Contents
| 6. | Income taxes |
The components of the provisions for income taxes were as follows for the years ended December 31,
| 2012 | 2011 | 2010 | ||||||||||
| Current |
||||||||||||
| Federal |
$ | 10,325,727 | $ | 8,885,401 | $ | 5,746,992 | ||||||
| State |
1,535,481 | 1,197,957 | 947,996 | |||||||||
| Deferred |
||||||||||||
| Federal |
205,169 | (519,917 | ) | 19,971 | ||||||||
| State |
30,172 | (76,458 | ) | 2,937 | ||||||||
|
|
|
|
|
|
|
|||||||
| Net provision for income taxes |
$ | 12,096,549 | $ | 9,486,983 | $ | 6,717,896 | ||||||
|
|
|
|
|
|
|
|||||||
The following table reconciles the provision for income taxes to the US federal statutory income tax rate for the years ended December 31, 2012, 2011, and 2010.
| 2012 | 2011 | 2010 | ||||||||||
| US federal statutory tax rate |
35.0 | % | 35.0 | % | 34.0 | % | ||||||
| State taxes |
3.2 | 3.1 | 3.5 | |||||||||
| Other |
0.1 | — | (0.1 | ) | ||||||||
|
|
|
|
|
|
|
|||||||
| Effective income tax rate |
38.3 | % | 38.1 | % | 37.4 | % | ||||||
|
|
|
|
|
|
|
|||||||
The Bank files its tax returns on a separate company basis.
Deferred tax and other asset balances reflected in the balance sheet were as follows as of December 31,
| 2012 | 2011 | |||||||
| Provision for loan losses |
$ | 5,597,417 | $ | 5,534,525 | ||||
| Deferred loan acquisition costs |
(2,706,208 | ) | (2,262,509 | ) | ||||
| Unrealized gains on investments |
(313,046 | ) | (267,744 | ) | ||||
| Other |
347,349 | 130,746 | ||||||
|
|
|
|
|
|||||
| Net deferred tax asset |
2,925,512 | 3,135,018 | ||||||
| Prepaid (accrued) taxes |
22,214 | (132,241 | ) | |||||
|
|
|
|
|
|||||
| Net deferred tax and other assets |
$ | 2,947,726 | $ | 3,002,777 | ||||
|
|
|
|
|
|||||
In assessing the realizability of deferred tax assets, management considers whether it is more likely than not that some portion or all of the deferred tax assets will not be realized. The realization of deferred tax assets is dependent upon the generation of future taxable income during the periods in which temporary differences become deductible pursuant to ASC Topic 740, “Income Taxes.” Management considers the reversal of deferred tax liabilities, projected future taxable income, and tax planning strategies in making this assessment. Management’s evaluation of the realizability of deferred tax assets must consider both positive and negative evidence. The weight given to the potential effects of positive and negative evidence is based on the extent to which it can be objectively verified. Based on these considerations, no valuation allowance was deemed necessary as of December 31, 2012 and 2011.
The Bank has filed US Federal tax returns as well as tax returns with the State of Utah. Tax years 2009 through the present are open for examination.
F-68
Table of Contents
| 7. | Other transactions with affiliates |
The Bank’s taxi medallion, asset-based commercial, and certain other construction loans aggregated $406,956,000 and $370,068,000 at December 31, 2012 and 2011. These loans are sourced and serviced by its affiliates. The Bank paid $22,000, $21,000, and $2,094,000 for loan servicing fees to Medallion for 2012, 2011, and 2010, and also in 2012, 2011 and 2010, paid $6,066,000, $5,492,000, and $412,000 to another Medallion affiliate. Origination fees of $937,000, $906,000, and $1,568,000 were paid to Medallion for 2012, 2011, and 2010. Amortization costs were $748,000, $1,009,000, and $1,133,000 for 2012, 2011, and 2010.
At December 31, 2012 and 2011, the Bank owed $1,462,000 and $964,000 to affiliates for origination fees, monthly servicing fees on loans, charges for corporate overhead, and legal and business development expenses due to the affiliates, partially offset by payments due the Bank from collection of loan payments by affiliates. The Bank reimbursed the parent for expenses incurred on its behalf of $286,000, $243,000, and $509,000 for 2012, 2011, and 2010.
| 8. | 401(k) plan |
The Bank participates in the 401(k) plan offered by Medallion. The 401(k) Plan covers all full and part-time employees of the Bank who have attained the age of 21 and have a minimum of one year of service. Under the 401(k) Plan, an employee may elect to defer not less than 1% and no more than 15% of the total annual compensation that would otherwise be paid to the employee, provided however, that employees’ contributions may not exceed certain maximum amounts determined under the Internal Revenue Code. Employee contributions are invested in various mutual funds according to the directions of the employee. At the discretion of Medallion’s Board of Directors, the Bank can provide for employer matching contributions. Medallion has elected to match employee contributions up to one-third of the employee’s contribution, but not greater than 2% of the portion of the employee’s annual salary eligible for 401(k) benefits. For the years ended December 31, 2012, 2011, and 2010, the Bank provided $18,000, $19,000, and $15,000 in employer matching, which amount is included in salaries and benefits expense on the accompanying statement of operations.
| 9. | Commitments and contingencies |
Loans—At December 31, 2012, the Bank had commitments to extend credit of $31,536,000 to asset-based customers as long as there is no violation of any condition established in the contract. The Bank had commitments to extend credit of $1,933,000 to taxi medallion customers for unfunded amounts.
Leases—The Bank leases office space under two non-cancelable operating leases that expire in August 2017 and November 2017. Rental expense related to the leases was $153,000, $131,000, and $127,000 for the years ended December 31, 2012, 2011, and 2010.
Future minimum lease payments under this operating lease as of December 31, 2012 were as follows:
| 2013 |
$ | 172,867 | ||
| 2014 |
182,322 | |||
| 2015 |
187,781 | |||
| 2016 |
193,423 | |||
| 2017 |
170,838 | |||
| Thereafter |
— | |||
|
|
|
|||
| Total |
$ | 907,231 | ||
|
|
|
| 10. | Capital requirements |
The Bank is subject to various regulatory capital requirements administered by the Federal Deposit Insurance Corporation (FDIC) and the Utah Department of Financial Institutions (UDFI). Failure to meet
F-69
Table of Contents
minimum capital requirements can initiate certain mandatory and possible additional discretionary actions by regulators that, if undertaken, could have a direct material effect on the Bank’s financial statements. Under capital adequacy guidelines and the regulatory framework for prompt corrective action, the Bank must meet specific capital guidelines that involve quantitative measures of the Bank’s assets, liabilities, and certain off-balance sheet items as calculated under regulatory accounting practices. The Bank’s capital amounts and classifications are also subject to qualitative judgments by the bank regulators about components, risk weightings, and other factors.
Quantitative measures established by regulation to ensure capital adequacy require the Bank to maintain minimum amounts and ratios as defined in the regulations (set forth in the table below). Additionally, as conditions of granting the Bank’s application for federal deposit insurance, the FDIC ordered that the Tier 1 leverage capital to total assets ratio, as defined, be not less than 15%, and that an adequate allowance for loan losses be maintained. As of December 31, 2012, the Bank’s Tier 1 leverage capital ratio was 16.3%.
The Bank’s actual capital amounts and ratios as of December 31, 2012 and 2011, and the regulatory minimum ratios are presented in the following tables.
| As of December 31, 2012 |
As of December 31, 2011 |
|||||||||||||||||||||||
| Amount | Ratio | Amount | Ratio | Minimum Ratio for Capital Adequacy Purposes |
Minimum Ratio To be Well Capitalized Under Prompt Corrective Action Provisions |
|||||||||||||||||||
| Tier 1 Capital (to average assets) |
$ | 116,026,000 | 16.3 | % | $ | 107,009,000 | 17.7 | % | 4.0 | % | 5.0 | % | ||||||||||||
| Tier 1 Capital (to risk-weighted assets) |
116,026,000 | 16.7 | 107,009,000 | 18.1 | 4.0 | 6.0 | ||||||||||||||||||
| Total Capital (to risk-weighted assets) |
124,791,000 | 18.0 | 114,504,000 | 19.3 | 8.0 | 10.0 | ||||||||||||||||||
|
|
|
|
|
|
|
|
|
|
|
|
|
|||||||||||||
| 11. | Fair value of financial instruments |
FASB ASC Topic 825, “Financial Instruments,” requires disclosure of fair value information about certain financial instruments, whether assets, liabilities, or off-balance-sheet commitments, if practicable. The following methods and assumptions were used to estimate the fair value of each class of financial instrument. Fair value estimates that were derived from broker quotes cannot be substantiated by comparison to independent markets and, in many cases, could not be realized in immediate settlement of the instrument.
(a) Loans—Current fair value most closely approximates book value.
(b) Investments—The Bank’s investments are recorded at the estimated fair value of such investments.
(c) Cash—Book value equals market value.
(d) Floating rate borrowings—Due to the short-term nature of these instruments, the carrying amount approximates fair value.
(e) Commitments to extend credit—The fair value of commitments to extend credit is estimated using the fees currently charged to enter into similar agreements, taking into account the remaining terms of the agreements and present creditworthiness of the counter parties. For fixed rate loan commitments, fair value also includes a consideration of the difference between the current levels of interest rates and the committed rates. At December 31, 2012 and 2011, the estimated fair value of these off-balance-sheet instruments was not material.
F-70
Table of Contents
(f) Fixed rate borrowings—Due to the short-term nature of these instruments, the carrying amount approximates fair value.
| December 31, 2012 | December 31, 2011 | |||||||||||||||
| (Dollars in thousands) |
Carrying Amount |
Fair Value | Carrying Amount |
Fair Value | ||||||||||||
| Financial Assets |
||||||||||||||||
| Loans |
$ | 664,381 | $ | 664,381 | $ | 561,865 | $ | 561,865 | ||||||||
| Investment securities |
22,122 | 22,122 | 26,537 | 26,537 | ||||||||||||
| Cash |
24,770 | 24,770 | 28,626 | 28,626 | ||||||||||||
| Accrued interest receivable |
3,767 | 3,767 | 3,113 | 3,113 | ||||||||||||
| Financial Liabilities |
||||||||||||||||
| Funds borrowed |
602,151 | 602,151 | 514,329 | 514,329 | ||||||||||||
| Accrued interest payable |
484 | 484 | 450 | 450 | ||||||||||||
|
|
|
|
|
|
|
|
|
|||||||||
| 12. | Fair value of assets and liabilities |
The Bank follows the provisions of FASB ASC 820, which defines fair value, establishes a framework for measuring fair value, establishes a fair value hierarchy based on the quality of inputs used to measure fair value, and enhances disclosure requirements for fair value measurements.
In accordance with FASB ASC 820, the Bank has categorized its assets and liabilities measured at fair value, based on the priority of the inputs to the valuation technique, into a three-level fair value hierarchy. The fair value hierarchy gives the highest priority to quoted prices in active markets for identical assets or liabilities (level 1) and the lowest priority to unobservable inputs (level 3).
As required by FASB ASC 820, when the inputs used to measure fair value fall within different levels of the hierarchy, the level within which the fair value measurement is categorized is based on the lowest level input that is significant to the fair value measurement in its entirety. For example, a level 3 fair value measurement may include inputs that are observable (level 1 and 2) and unobservable (level 3). Therefore gains and losses for such assets and liabilities categorized within the level 3 table below may include changes in fair value that are attributable to both observable inputs (level 1 and 2) and unobservable inputs (level 3).
Assets and liabilities measured at fair value, recorded on the balance sheets are categorized based on the inputs to the valuation techniques as follows:
Level 1. Assets and liabilities whose values are based on unadjusted quoted prices for identical assets or liabilities in an active market that the Bank has the ability to access (examples include active exchange-traded equity securities, exchange-traded derivatives, most US Government and agency securities, and certain other sovereign government obligations).
Level 2. Assets and liabilities whose values are based on quoted prices in markets that are not active or model inputs that are observable either directly or indirectly for substantially the full term of the asset or liability. Level 2 inputs include the following:
| A) | Quoted prices for similar assets or liabilities in active markets (for example, restricted stock); |
| B) | Quoted price for identical or similar assets or liabilities in non-active markets (for example, corporate and municipal bonds, which trade infrequently); |
| C) | Pricing models whose inputs are observable for substantially the full term of the asset or liability (examples include most over-the-counter derivatives, including interest rate and currency swaps); and |
| D) | Pricing models whose inputs are derived principally from or corroborated by observable market data through correlation or other means for substantially the full term of the asset or liability |
F-71
Table of Contents
| (examples include certain residential and commercial mortgage-related assets, including loans, securities, and derivatives). |
Level 3. Assets and liabilities whose values are based on prices or valuation techniques that require inputs that are both unobservable and significant to the overall fair value measurement. These inputs reflect management’s own assumptions about the assumptions a market participant would use in pricing the assets or liability (examples include certain private equity investments, certain residential and commercial mortgage-related assets (including loans, securities, and derivatives).
Changes in the observability of valuation inputs may result in a reclassification for certain assets or liabilities. Reclassifications impacting level 3 of the fair value hierarchy are reported as transfers in/out of the level 3 category.
The following tables present the Bank’s fair value hierarchy for those assets and liabilities measured at fair value on a recurring basis as of December 31, 2012 and 2011.
| 2012 (Dollars in thousands) |
Level 1 | Level 2 | Level 3 | Total | ||||||||||||
| Assets |
||||||||||||||||
| Available-for-sale investment securities(1) |
$ | — | $ | 22,122 | $ | — | $ | 22,122 | ||||||||
|
|
|
|
|
|
|
|
|
|||||||||
| (1) | Total unrealized gains of $76 were included in accumulated other comprehensive income (loss) for 2012 related to these assets. |
| 2011 (Dollars in thousands) |
Level 1 | Level 2 | Level 3 | Total | ||||||||||||
| Assets |
||||||||||||||||
| Available-for-sale investment securities(1) |
$ | — | $ | 26,537 | $ | — | $ | 26,537 | ||||||||
|
|
|
|
|
|
|
|
|
|||||||||
| (1) | Total unrealized gains of $356 were included in accumulated other comprehensive income (loss) for 2011 related to these assets. |
The following tables present the Bank’s fair value hierarchy for those assets and liabilities measured at fair value on a non-recurring basis as of December 31, 2012 and 2011.
| 2012 (Dollars in thousands) |
Level 1 | Level 2 | Level 3 | Total | ||||||||||||
| Assets(1) |
||||||||||||||||
| Impaired loans |
$ | — | $ | — | $ | 2,881 | $ | 2,881 | ||||||||
| Repossessed loan collateral |
— | — | $ | 965 | $ | 965 | ||||||||||
|
|
|
|
|
|
|
|
|
|||||||||
| Total |
$ | — | $ | — | $ | 3,846 | $ | 3,846 | ||||||||
|
|
|
|
|
|
|
|
|
|||||||||
| (1) | Total unrealized losses of $116 for impaired loans and $0 for repossessed loan collateral were included in income for 2012 related to these assets. |
| 2011 (Dollars in thousands) |
Level 1 | Level 2 | Level 3 | Total | ||||||||||||
| Assets(1) |
||||||||||||||||
| Impaired loans |
$ | — | $ | — | $ | 2,518 | $ | 2,518 | ||||||||
| Repossessed loan collateral |
— | — | $ | 999 | $ | 999 | ||||||||||
|
|
|
|
|
|
|
|
|
|||||||||
| Total |
$ | — | $ | — | $ | 3,517 | $ | 3,517 | ||||||||
|
|
|
|
|
|
|
|
|
|||||||||
| (1) | Total unrealized losses of $134 for impaired loans and $0 for repossessed loan collateral were included in income for 2011 related to these assets. |
F-72
Table of Contents
| 13. | Small Business Lending Fund Program (SBLF) and Troubled Assets Relief Program (TARP) |
On February 27, 2009 and December 22, 2009, Medallion Bank issued, and the US Treasury purchased under the TARP Capital Purchase Program (the CPP) Medallion Bank’s fixed rate non-cumulative Perpetual Preferred Stock, Series A, B, C, and D for an aggregate purchase price of $21,498,000 in cash. On July 21, 2011, Medallion Bank issued, and the US Treasury purchased 26,303 shares of Senior Non-Cumulative Perpetual Preferred Stock, Series E (Series E) for an aggregate purchase price of $26,303,000 under the SBLF. The SBLF is a voluntary program intended to encourage small business lending by providing capital to qualified smaller banks at favorable rates. In connection with the issuance of the Series E, the Bank exited the CPP by redeeming the Series A, B, C, and D; and received approximately $4,000,000, net of dividends due on the repaid securities. The Bank pays an initial dividend rate of 1% on the Series E.
| 14. | Subsequent Events |
We have evaluated subsequent events that have occurred through March 12, 2013, the date of financial statement issuance.
F-73
Table of Contents
BASIS OF PREPARATION
We, Medallion Financial Corp., or the Company, are a closed-end, non-diversified management investment company organized as a Delaware corporation. We have elected to be treated as a business development company, or BDC, under the Investment Company Act of 1940, as amended, or the 1940 Act. We are a specialty finance company that has a leading position in originating, acquiring, and servicing loans that finance taxicab medallions and various types of commercial businesses. A wholly-owned portfolio company of ours, Medallion Bank, also originates consumer loans for the purchase of recreational vehicles, boats, motorcycles, and trailers, and to finance small-scale home improvements. Since 1996, the year in which we became a public company, we have increased our taxicab medallion loan portfolio at a compound annual growth rate of 5%, and our commercial loan portfolio at a compound annual growth rate of 2% (10% and 7% on a managed basis when combined with Medallion Bank). Since Medallion Bank acquired a consumer loan portfolio and began originating consumer loans in 2004, it has increased its consumer loan portfolio at a compound annual growth rate of 15%. Total assets under our management and the management of our unconsolidated wholly-owned subsidiaries, which includes assets serviced for third party investors, were $1,255,849,000 as of June 30, 2013, and $1,219,224,000 and $1,159,971,000 as of December 31, 2012 and June 30, 2012, and have grown at a compound annual growth rate of 11% from $215,000,000 at the end of 1996. Since our initial public offering in 1996, we have paid/declared dividends in excess of $195,200,000 or $11.89 per share.
We conduct our business through various wholly-owned investment company subsidiaries including:
| • | Medallion Funding LLC, or Medallion Funding, a Small Business Investment Company, or SBIC, our primary taxicab medallion lending company; |
| • | Medallion Capital, Inc., or Medallion Capital, an SBIC and a regulated investment company, or RIC, which conducts a mezzanine financing business; and |
| • | Freshstart Venture Capital Corp., or Freshstart, an SBIC and a RIC, which originates and services taxicab medallion and commercial loans. |
We have formed a wholly-owned portfolio company, Medallion Servicing Corporation, or MSC, to provide loan services to Medallion Bank, also a portfolio company wholly-owned by us. We have assigned all of our loan servicing rights for Medallion Bank, which consists of servicing taxi medallion and commercial loans originated by Medallion Bank, to MSC, which bills and collects the related service fee income from Medallion Bank, and is allocated and charged by us for MSC’s share of these servicing costs.
We also conduct business through our asset-based lending division, Medallion Business Credit, an originator of loans to small businesses for the purpose of financing inventory and receivables.
In addition, we conduct business through a wholly-owned portfolio company, Medallion Bank, a bank regulated by the FDIC and the Utah Department of Financial Institutions which originates taxicab medallion, commercial, and consumer loans, raises deposits, and conducts other banking activities. Medallion Bank generally provides us with our lowest cost of funds which it raises through bank certificates of deposit issued to its customers. To take advantage of this low cost of funds, we refer a portion of our taxicab medallion and commercial loans to Medallion Bank, which then originates these loans, which are then serviced by MSC. However, the FDIC restricts the amount of taxicab medallion loans that Medallion Bank may finance to three times Tier 1 capital, or $357,363,000 at June 30, 2013. MSC earns referral and servicing fees for these activities. As a non-investment company, Medallion Bank is not consolidated with the Company, which is an investment company under the Investment Company Act of 1940, or the 1940 Act.
The financial information is divided into two sections. The first section, Item 1, includes our unaudited consolidated financial statements including related footnotes. The second section, Item 2, consists of Management’s Discussion and Analysis of Financial Condition and Results of Operations for the three and six months ended June 30, 2013.
F-74
Table of Contents
Our consolidated balance sheet as of June 30, 2013, and the related consolidated statements of operations, changes in net assets, and cash flows for the three and six months ended June 30, 2013 and 2012 included in Item 1 have been prepared by us, without audit, pursuant to the rules and regulations of the SEC. Certain information and footnote disclosures normally included in financial statements prepared in accordance with accounting principles generally accepted in the US have been condensed or omitted pursuant to such rules and regulations. In the opinion of management, the accompanying consolidated financial statements include all adjustments, which are of a normal and recurring nature, necessary to present fairly our consolidated financial position and results of operations. The results of operations for the three and six months ended June 30, 2013 and 2012, or for any other interim period, may not be indicative of future performance. These financial statements should be read in conjunction with the financial statements and notes thereto included in our Annual Report on Form 10-K for the fiscal year ended December 31, 2012.
F-75
Table of Contents
MEDALLION FINANCIAL CORP.
CONSOLIDATED STATEMENTS OF OPERATIONS
(UNAUDITED)
| Three Months Ended June 30, | Six Months Ended June 30, | |||||||||||||||
| (Dollars in thousands, except per share data) |
2013 | 2012 | 2013 | 2012 | ||||||||||||
| Interest income on investments |
$ | 4,617 | $ | 5,199 | $ | 9,442 | $ | 10,687 | ||||||||
| Dividends and interest income on short-term investments(1) |
2,512 | 2,518 | 5,529 | 4,536 | ||||||||||||
| Medallion lease income |
414 | 347 | 818 | 704 | ||||||||||||
|
|
|
|
|
|
|
|
|
|||||||||
| Total investment income |
7,543 | 8,064 | 15,789 | 15,927 | ||||||||||||
|
|
|
|
|
|
|
|
|
|||||||||
| Total interest expense(2) |
2,121 | 2,908 | 4,187 | 6,155 | ||||||||||||
|
|
|
|
|
|
|
|
|
|||||||||
| Net interest income |
5,422 | 5,156 | 11,602 | 9,772 | ||||||||||||
|
|
|
|
|
|
|
|
|
|||||||||
| Total noninterest income |
327 | 342 | 623 | 677 | ||||||||||||
|
|
|
|
|
|
|
|
|
|||||||||
| Salaries and benefits |
2,345 | 2,287 | 4,896 | 4,337 | ||||||||||||
| Professional fees |
897 | 437 | 1,397 | 749 | ||||||||||||
| Occupancy expense |
191 | 209 | 391 | 421 | ||||||||||||
| Other operating expenses |
574 | 772 | 1,336 | 1,539 | ||||||||||||
|
|
|
|
|
|
|
|
|
|||||||||
| Total operating expenses |
4,007 | 3,705 | 8,020 | 7,046 | ||||||||||||
|
|
|
|
|
|
|
|
|
|||||||||
| Net investment income before income taxes(1)(3) |
1,742 | 1,793 | 4,205 | 3,403 | ||||||||||||
| Income tax (provision) benefit |
— | — | — | — | ||||||||||||
|
|
|
|
|
|
|
|
|
|||||||||
| Net investment income after income taxes |
1,742 | 1,793 | 4,205 | 3,403 | ||||||||||||
|
|
|
|
|
|
|
|
|
|||||||||
| Net realized gains on investments |
4 | 323 | 81 | 265 | ||||||||||||
|
|
|
|
|
|
|
|
|
|||||||||
| Net change in unrealized appreciation on investments |
3,565 | 1,834 | 6,529 | 3,847 | ||||||||||||
| Net change in unrealized appreciation on Medallion Bank and other controlled subsidiaries |
938 | 1,967 | 1,906 | 3,867 | ||||||||||||
|
|
|
|
|
|
|
|
|
|||||||||
| Net unrealized appreciation on investments |
4,503 | 3,801 | 8,435 | 7,714 | ||||||||||||
|
|
|
|
|
|
|
|
|
|||||||||
| Net realized/unrealized gains on investments |
4,507 | 4,124 | 8,516 | 7,979 | ||||||||||||
|
|
|
|
|
|
|
|
|
|||||||||
| Net increase in net assets resulting from operations |
$ | 6,249 | $ | 5,917 | $ | 12,721 | $ | 11,382 | ||||||||
|
|
|
|
|
|
|
|
|
|||||||||
| Net increase in net assets resulting from operations per common share |
||||||||||||||||
| Basic |
$ | 0.29 | $ | 0.31 | $ | 0.59 | $ | 0.62 | ||||||||
| Diluted |
0.28 | 0.30 | 0.58 | 0.61 | ||||||||||||
|
|
|
|
|
|
|
|
|
|||||||||
| Dividends declared per share |
$ | 0.22 | $ | 0.21 | $ | 0.44 | $ | 0.42 | ||||||||
|
|
|
|
|
|
|
|
|
|||||||||
| Weighted average common shares outstanding |
||||||||||||||||
| Basic |
21,633,656 | 19,353,031 | 21,527,912 | 18,505,127 | ||||||||||||
| Diluted |
22,018,060 | 19,570,383 | 21,890,556 | 18,753,671 | ||||||||||||
|
|
|
|
|
|
|
|
|
|||||||||
| (1) | Includes $2,500 and $5,500 of dividend income for the three and six months ended June 30, 2013 from Medallion Bank, and $2,500 and $4,500 for the comparable 2012 periods. |
| (2) | Average borrowings outstanding were $316,389 and $314,631, and the related average borrowing costs were 2.69% and 2.68% for the 2013 second quarter and six months, and were $320,973, $333,952, 3.64%, and 3.71% for the comparable 2012 periods. |
| (3) | Includes $197 and $363 of net revenues received from Medallion Bank for the three and six months ended June 30, 2013, and $176 and $368 for the comparable 2012 periods, primarily for servicing fees, loan origination fees, and expense reimbursements. See Notes 3 and 10 for additional information. |
The accompanying notes should be read in conjunction with these consolidated financial statements.
F-76
Table of Contents
MEDALLION FINANCIAL CORP.
| (Dollars in thousands, except per share data) |
UNAUDITED June 30, 2013 |
December 31, 2012 | ||||||
| Assets |
||||||||
| Medallion loans, at fair value |
$ | 294,029 | $ | 294,388 | ||||
| Commercial loans, at fair value(1) |
59,229 | 56,919 | ||||||
| Investment in Medallion Bank and other controlled subsidiaries, at fair value |
100,343 | 99,083 | ||||||
| Equity investments, at fair value |
6,739 | 4,620 | ||||||
| Investment securities, at fair value |
— | — | ||||||
|
|
|
|
|
|||||
| Net investments ($238,638 at June 30, 2013 and $236,357 at December 31, 2012 pledged as collateral under borrowing arrangements) |
460,340 | 455,010 | ||||||
| Cash and cash equivalents ($0 at June 30, 2013 and at December 31, 2012 restricted as to use by lender) |
41,458 | 26,875 | ||||||
| Accrued interest receivable |
955 | 957 | ||||||
| Fixed assets, net |
595 | 601 | ||||||
| Goodwill, net |
5,069 | 5,069 | ||||||
| Other assets, net |
63,329 | 54,953 | ||||||
|
|
|
|
|
|||||
| Total assets |
$ | 571,746 | $ | 543,465 | ||||
|
|
|
|
|
|||||
| Liabilities |
||||||||
| Accounts payable and accrued expenses |
$ | 4,557 | $ | 3,144 | ||||
| Accrued interest payable |
1,149 | 1,233 | ||||||
| Funds borrowed |
342,698 | 322,770 | ||||||
|
|
|
|
|
|||||
| Total liabilities |
348,404 | 327,147 | ||||||
|
|
|
|
|
|||||
| Commitments and contingencies |
— | — | ||||||
| Shareholders’ equity (net assets) |
||||||||
| Preferred stock (1,000,000 shares of $0.01 par value stock authorized—none outstanding) |
— | — | ||||||
| Common stock (50,000,000 shares of $0.01 par value stock authorized—23,569,216 shares at June 30, 2013 and 23,251,937 shares December 31, 2012 issued) |
236 | 233 | ||||||
| Treasury stock at cost (1,600,733 shares at June 30, 2013 and December 31, 2012) |
(14,304 | ) | (14,304 | ) | ||||
| Capital in excess of par value |
221,523 | 217,621 | ||||||
| Accumulated undistributed net investment loss |
(16,600 | ) | (13,189 | ) | ||||
| Accumulated undistributed net realized gains on investments |
— | — | ||||||
| Net unrealized appreciation on investments |
32,487 | 25,957 | ||||||
|
|
|
|
|
|||||
| Total shareholders’ equity (net assets) |
223,342 | 216,318 | ||||||
|
|
|
|
|
|||||
| Total liabilities and shareholders’ equity |
$ | 571,746 | $ | 543,465 | ||||
|
|
|
|
|
|||||
| Number of common shares outstanding |
21,968,483 | 21,651,204 | ||||||
| Net asset value per share |
$ | 10.17 | $ | 9.99 | ||||
|
|
|
|
|
|||||
| (1) | Includes loans of $3,647 and $3,078 to controlled subsidiaries or entities under their control at June 30, 2013, and $3,081 at December 31, 2012. |
The accompanying notes should be read in conjunction with these consolidated financial statements.
F-77
Table of Contents
MEDALLION FINANCIAL CORP.
CONSOLIDATED STATEMENTS OF CHANGES IN NET ASSETS
(UNAUDITED)
| Three Months Ended June 30, | Six Months Ended June 30, | |||||||||||||||
| (Dollars in thousands, except per share data) |
2013 | 2012 | 2013 | 2012 | ||||||||||||
| Net investment income after income taxes |
$ | 1,742 | $ | 1,793 | $ | 4,205 | $ | 3,403 | ||||||||
| Net realized gains on investments |
4 | 323 | 81 | 265 | ||||||||||||
| Net unrealized appreciation on investments |
4,503 | 3,801 | 8,435 | 7,714 | ||||||||||||
|
|
|
|
|
|
|
|
|
|||||||||
| Net increase in net assets resulting from operations |
6,249 | 5,917 | 12,721 | 11,382 | ||||||||||||
|
|
|
|
|
|
|
|
|
|||||||||
| Investment income, net |
(1,850 | ) | (3,178 | ) | (4,832 | ) | (6,389 | ) | ||||||||
| Return of capital |
(2,977 | ) | (592 | ) | (4,796 | ) | (969 | ) | ||||||||
| Realized gain from investment transactions, net |
— | — | — | — | ||||||||||||
|
|
|
|
|
|
|
|
|
|||||||||
| Dividends and distributions to shareholders(1) |
(4,827 | ) | (3,770 | ) | (9,628 | ) | (7,358 | ) | ||||||||
|
|
|
|
|
|
|
|
|
|||||||||
| Issuance of common stock(2) |
— | 34,961 | — | 34,961 | ||||||||||||
| Stock—based compensation expense, net |
366 | 222 | 764 | 393 | ||||||||||||
| Exercise of stock options |
1,506 | 86 | 3,141 | 793 | ||||||||||||
| Treasury stock acquired |
— | — | — | — | ||||||||||||
|
|
|
|
|
|
|
|
|
|||||||||
| Capital share transactions |
1,872 | 35,269 | 3,905 | 36,147 | ||||||||||||
| Other |
(33 | ) | — | 26 | — | |||||||||||
|
|
|
|
|
|
|
|
|
|||||||||
| Total increase in net assets |
3,261 | 37,416 | 7,024 | 40,171 | ||||||||||||
| Net assets at the beginning of the period |
220,081 | 174,259 | 216,318 | 171,504 | ||||||||||||
|
|
|
|
|
|
|
|
|
|||||||||
| Net assets at the end of the period(3) |
$ | 223,342 | $ | 211,675 | $ | 223,342 | $ | 211,675 | ||||||||
|
|
|
|
|
|
|
|
|
|||||||||
| Capital share activity |
||||||||||||||||
| Common stock issued, beginning of period |
23,428,333 | 19,543,243 | 23,251,937 | 19,320,303 | ||||||||||||
| Issuance of common stock(2) |
— | 3,500,000 | — | 3,500,000 | ||||||||||||
| Exercise of stock options |
141,176 | 10,243 | 316,179 | 140,243 | ||||||||||||
| Issuance (forfeiture) of restricted stock, net |
(293 | ) | — | 1,100 | 92,940 | |||||||||||
|
|
|
|
|
|
|
|
|
|||||||||
| Common stock issued, end of period |
23,569,216 | 23,053,486 | 23,569,216 | 23,053,486 | ||||||||||||
|
|
|
|
|
|
|
|
|
|||||||||
| Treasury stock, beginning of period |
(1,600,733 | ) | (1,600,733 | ) | (1,600,733 | ) | (1,600,733 | ) | ||||||||
| Treasury stock acquired |
— | — | — | — | ||||||||||||
|
|
|
|
|
|
|
|
|
|||||||||
| Treasury stock, end of period |
(1,600,733 | ) | (1,600,733 | ) | (1,600,733 | ) | (1,600,733 | ) | ||||||||
|
|
|
|
|
|
|
|
|
|||||||||
| Common stock outstanding |
21,968,483 | 21,452,753 | 21,968,483 | 21,452,753 | ||||||||||||
|
|
|
|
|
|
|
|
|
|||||||||
| (1) | Dividends declared were $0.22 and $0.44 per share for the 2013 second quarter and six months, and were $0.21 and $0.42 for the comparable 2012 periods. |
| (2) | On May 21, 2012, the Company sold 3,500,000 shares at an offering price of $10.72 per share, resulting in net proceeds after closing costs, underwriting commissions, etc. of $34,961 as of June 30, 2012. |
| (3) | Includes $0 and $0 of undistributed net investment income and $0 and $0 of undistributed net realized gains on investments at June 30, 2013 and 2012. |
The accompanying notes should be read in conjunction with these consolidated financial statements.
F-78
Table of Contents
MEDALLION FINANCIAL CORP.
CONSOLIDATED STATEMENTS OF CASH FLOWS
(UNAUDITED)
| Six Months Ended June 30, |
||||||||
| (Dollars in thousands) |
2013 | 2012 | ||||||
| CASH FLOWS FROM OPERATING ACTIVITIES |
||||||||
| Net increase in net assets resulting from operations |
$ | 12,721 | $ | 11,382 | ||||
| Adjustments to reconcile net increase in net assets resulting from operations to net cash provided by operating activities: |
||||||||
| Depreciation and amortization |
588 | 698 | ||||||
| Amortization of origination costs |
134 | 74 | ||||||
| Net change in unrealized appreciation on investments |
(6,529 | ) | (3,847 | ) | ||||
| Increase in unrealized appreciation on Medallion Bank and other controlled subsidiaries |
(1,906 | ) | (3,867 | ) | ||||
| Net realized gains on investments |
(81 | ) | (265 | ) | ||||
| Stock-based compensation expense |
764 | 393 | ||||||
| Decrease in accrued interest receivable |
2 | 53 | ||||||
| Increase in other assets, net |
(2,978 | ) | (15 | ) | ||||
| Increase (decrease) in accounts payable and accrued expenses |
1,414 | (1,463 | ) | |||||
| Decrease in accrued interest payable |
(83 | ) | (324 | ) | ||||
|
|
|
|
|
|||||
| Net cash provided by operating activities |
4,046 | 2,819 | ||||||
|
|
|
|
|
|||||
| CASH FLOWS FROM INVESTING ACTIVITIES |
||||||||
| Investments originated |
(134,100 | ) | (67,314 | ) | ||||
| Proceeds from principal receipts, sales, and maturities of investments |
130,642 | 95,428 | ||||||
| Investments in Medallion Bank and other controlled subsidiaries, net |
645 | 764 | ||||||
| Capital expenditures |
(91 | ) | (69 | ) | ||||
|
|
|
|
|
|||||
| Net cash provided by (used for) investing activities |
(2,904 | ) | 28,809 | |||||
|
|
|
|
|
|||||
| CASH FLOWS FROM FINANCING ACTIVITIES |
||||||||
| Proceeds from funds borrowed |
152,087 | 28,729 | ||||||
| Repayments of funds borrowed |
(130,859 | ) | (80,680 | ) | ||||
| Issuance of SBA debentures |
15,000 | — | ||||||
| Repayments of SBA debentures |
(16,300 | ) | (11,250 | ) | ||||
| Proceeds from issuance of common stock, net |
— | 34,961 | ||||||
| Proceeds from exercise of stock options |
3,141 | 793 | ||||||
| Payments of declared dividends |
(9,628 | ) | (7,358 | ) | ||||
|
|
|
|
|
|||||
| Net cash provided by (used for) financing activities |
13,441 | (34,805 | ) | |||||
|
|
|
|
|
|||||
| NET INCREASE (DECREASE) IN CASH AND CASH EQUIVALENTS |
14,583 | (3,177 | ) | |||||
| Cash and cash equivalents, beginning of period |
26,875 | 29,352 | ||||||
|
|
|
|
|
|||||
| Cash and cash equivalents, end of period |
$ | 41,458 | $ | 26,175 | ||||
|
|
|
|
|
|||||
| SUPPLEMENTAL INFORMATION |
||||||||
| Cash paid during the period for interest |
$ | 3,778 | $ | 5,858 | ||||
| Cash paid during the period for income taxes |
— | — | ||||||
| Non-cash investing activities—net transfer to (from) other assets |
— | — | ||||||
|
|
|
|
|
|||||
The accompanying notes should be read in conjunction with these consolidated financial statements.
F-79
Table of Contents
MEDALLION FINANCIAL CORP.
NOTES TO CONSOLIDATED FINANCIAL STATEMENTS
JUNE 30, 2013
(1) ORGANIZATION OF MEDALLION FINANCIAL CORP. AND ITS SUBSIDIARIES
Medallion Financial Corp. (the Company) is a closed-end management investment company organized as a Delaware corporation. The Company has elected to be regulated as a business development company (BDC) under the Investment Company Act of 1940, as amended (the 1940 Act). The Company conducts its business through various wholly-owned subsidiaries including its primary operating company, Medallion Funding LLC (MFC), a Small Business Investment Company (SBIC) which originates and services taxicab medallion and commercial loans. For federal and most state tax purposes, Medallion Funding LLC is treated as a disregarded entity, and is subsumed in the tax return of the Company.
The Company formed a wholly-owned portfolio company, Medallion Servicing Corporation (MSC), to provide loan services to Medallion Bank, also a portfolio company wholly-owned by the Company. The Company has assigned all of its loan servicing rights for Medallion Bank, which consists of servicing taxi medallion and commercial loans originated by Medallion Bank, to MSC, who bills and collects the related service fee income from Medallion Bank, and is allocated and charged by the Company for MSC’s share of these servicing costs.
The Company also conducts business through Medallion Capital, Inc. (MCI), an SBIC which conducts a mezzanine financing business, and Freshstart Venture Capital Corp. (FSVC), an SBIC which originates and services taxicab medallion and commercial loans. MFC, MCI, and FSVC, as SBICs, are regulated by the Small Business Administration (SBA). MCI and FSVC are financed in part by the SBA. The Company also conducts business through its asset-based lending division, Medallion Business Credit (MBC), an originator of loans to small businesses for the purpose of financing inventory and receivables.
MFC established a wholly-owned subsidiary, Taxi Medallion Loan Trust III (Trust III), for the purpose of owning medallion loans originated by MFC or others. Trust III is a separate legal and corporate entity with its own creditors who, in any liquidation of Trust III, will be entitled to be satisfied out of Trust III’s assets prior to any value in Trust III becoming available to Trust III’s equity holders. The assets of Trust III, aggregating $216,750,000 at June 30, 2013, are not available to pay obligations of its affiliates or any other party, and the assets of affiliates or any other party are not available to pay obligations of Trust III. Trust III’s loans are serviced by MFC.
The Company established a wholly-owned subsidiary, Medallion Financing Trust I (Fin Trust) for the purpose of issuing unsecured preferred securities to investors. Fin Trust is a separate legal and corporate entity with its own creditors who, in any liquidation of Fin Trust, will be entitled to be satisfied out of Fin Trust’s assets prior to any value in Fin Trust becoming available to Fin Trust’s equity holders. The assets of Fin Trust, aggregating $36,159,000 at June 30, 2013, are not available to pay obligations of its affiliates or any other party, and the assets of affiliates or any other party are not available to pay obligations of Fin Trust.
MFC through several wholly-owned subsidiaries (together, Medallion Chicago), purchased certain City of Chicago taxicab medallions out of foreclosure which are leased to fleet operators while being held for sale. The 159 medallions are carried at a fair value of $49,452,000 in other assets on the consolidated balance sheet at June 30, 2013, compared to $43,588,000 and $38,833,000 at December 31, 2012 and June 30, 2012.
A wholly-owned portfolio investment, Medallion Bank, a Federal Deposit Insurance Corporation (FDIC) insured industrial bank, originates medallion loans, commercial loans, and consumer loans, raises deposits, and conducts other banking activities (see Note 3). Medallion Bank is subject to competition from other financial institutions and to the regulations of certain federal and state agencies, and undergoes examinations by those agencies.
F-80
Table of Contents
Medallion Bank is not an investment company, and therefore, is not consolidated with the Company, but instead is treated as a portfolio investment. It was initially formed for the primary purpose of originating commercial loans in three categories: 1) loans to finance the purchase of taxicab medallions (licenses), 2) asset-based commercial loans, and 3) SBA 7(a) loans. The loans are marketed and serviced by Medallion Bank’s affiliates who have extensive prior experience in these asset groups.
(2) SUMMARY OF SIGNIFICANT ACCOUNTING POLICIES
Use of Estimates
The preparation of the consolidated financial statements in conformity with accounting principles generally accepted in the US requires management to make estimates that affect the amounts reported in the consolidated financial statements and the accompanying notes. Accounting estimates and assumptions are those that management considers to be the most critical to an understanding of the consolidated financial statements because they inherently involve significant judgments and uncertainties. All of these estimates reflect management’s best judgment about current economic and market conditions and their effects based on information available as of the date of these consolidated financial statements. If such conditions persist longer or deteriorate further than expected, it is reasonably possible that the judgments and estimates could change, which may result in future impairments of loans receivable, loans held for sale, and investments, among other effects.
Principles of Consolidation
The consolidated financial statements include the accounts of the Company and its wholly-owned subsidiaries, except for Medallion Bank and other portfolio investments. All significant intercompany transactions, balances, and profits have been eliminated in consolidation. As a non-investment company, Medallion Bank is not consolidated with the Company, which is an investment company under the 1940 Act. See Note 3 for the presentation of financial information for Medallion Bank and other controlled subsidiaries.
Cash and Cash Equivalents
The Company considers all highly liquid instruments with an original purchased maturity of three months or less to be cash equivalents. Cash balances are generally held in accounts at large national or regional banking organizations in amounts that frequently exceed the federally insured limits, and includes $1,000,000 related to a compensating balance requirement of a regional banking organization.
Fair Value of Assets and Liabilities
The Company follows FASB Accounting Standards Codification Topic 820, Fair Value Measurements and Disclosures, (FASB ASC 820), which defines fair value, establishes a framework for measuring fair value, and expands disclosures about fair value measurements. FASB ASC 820 defines fair value as an exit price (i.e. a price that would be received to sell, as opposed to acquire, an asset or transfer a liability), and emphasizes that fair value is a market-based measurement. It establishes a fair value hierarchy that distinguishes between assumptions developed based on market data obtained from independent external sources and the reporting entities own assumptions. Further, it specifies that fair value measurement should consider adjustment for risk, such as the risk inherent in the valuation technique or its inputs. See also Notes 2, 11, and 12 to the consolidated financial statements.
Investment Valuation
The Company’s loans, net of participations and any unearned discount, are considered investment securities under the 1940 Act and are recorded at fair value. As part of the fair value methodology, loans are valued at cost adjusted for any unrealized appreciation (depreciation). Since no ready market exists for these loans, the fair value is determined in good faith by the Board of Directors. In determining the fair value, the Board of Directors considers factors such as the financial condition of the borrower, the adequacy of the collateral, individual credit
F-81
Table of Contents
risks, historical loss experience, and the relationships between current and projected market rates and portfolio rates of interest and maturities. Foreclosed properties, which represent collateral received from defaulted borrowers, and which are carried in other assets on the consolidated balance sheet, are valued similarly.
Equity investments (common stock and stock warrants, including certain controlled subsidiary portfolio investments) and investment securities (US Treasuries and mortgage backed bonds), in total representing 23% of the investment portfolio at June 30, 2013 and December 31, 2012, are recorded at fair value, represented as cost, plus or minus unrealized appreciation or depreciation. The fair value of investments that have no ready market are determined in good faith by the Board of Directors, based upon the financial condition and operating performance of the underlying investee companies as well as general market trends for businesses in the same industry. Included in equity investments were marketable securities of $1,341,000 and $811,000 at June 30, 2013 and December 31, 2012, and non-marketable securities of $5,398,000 and $3,809,000 in the comparable periods. The $100,343,000 and $99,083,000 related to portfolio investments in controlled subsidiaries at June 30, 2013 and December 31, 2012 were all non-marketable in each period. Because of the inherent uncertainty of valuations, the Board of Directors’ estimates of the values of the investments may differ significantly from the values that would have been used had a ready market for the investments existed, and the differences could be material.
The Company’s investment in Medallion Bank, as a wholly owned portfolio investment, is also subject to quarterly assessments of fair value. The Company conducts a thorough valuation analysis as described previously, and determines whether any factors give rise to a valuation different than recorded book value, including various regulatory restrictions that were established at Medallion Bank’s inception, by the FDIC and State of Utah, and also by additional regulatory restrictions, such as the prior moratorium imposed by the Dodd-Frank Act on the acquisition of control of an industrial bank by a “commercial firm” (a company whose gross revenues are primarily derived from non-financial activities) which expired in July 2013. Because of these restrictions and other factors, the Company’s Board of Directors has determined that Medallion Bank has little value beyond its recorded book value. As a result of this valuation process, the Company used Medallion Bank’s actual results of operations as the best estimate of changes in fair value, and recorded the results as a component of unrealized appreciation (depreciation) on investments, although changes in these restrictions and other applicable factors could change these conclusions in the future. See Note 3 for additional information about Medallion Bank.
A majority of the Company’s investments consist of long-term loans to persons defined by SBA regulations as socially or economically disadvantaged, or to entities that are at least 50% owned by such persons. Approximately 64% and 65% of the Company’s investment portfolio at June 30, 2013 and December 31, 2012 had arisen in connection with the financing of taxicab medallions, taxicabs, and related assets, of which 70% and 71% were in New York City at June 30, 2013 and December 31, 2012.
These loans are secured by the medallions, taxicabs, and related assets, and are personally guaranteed by the borrowers, or in the case of corporations, are generally guaranteed personally by the owners. A portion of the Company’s portfolio (13% and 12% at June 30, 2013 and December 31, 2012) represents loans to various commercial enterprises, in a wide variety of industries, including manufacturing, administrative and support services, accommodation and food services, retail trade and various other industries. Approximately 26% of these loans are made primarily in the metropolitan New York City area, with the balance widely scattered across the United States. Investments in controlled unconsolidated subsidiaries, equity investments, and investment securities were 22%, 1%, and 0% at June 30, 2013 and 22%, 1%, and 0% at December 31, 2012.
On a managed basis, which includes the investments of Medallion Bank after eliminating the Company’s investment in Medallion Bank, medallion loans were 58% and 60% at June 30, 2013 and December 31, 2012 (76% and 78% in New York City), commercial loans were 11% and 12%, and 28% and 25% were consumer loans in all 50 states collateralized by recreational vehicles, boats, motorcycles, and trailers, and home improvements. Investment securities were 2% at June 30, 2013 and December 31, 2012, and equity investments (including investments in controlled subsidiaries) were 1%.
F-82
Table of Contents
Investment Transactions and Income Recognition
Loan origination fees and certain direct origination costs are deferred and recognized as an adjustment to the yield of the related loans. At June 30, 2013 and December 31, 2012, net loan origination costs were $43,000 and $127,000. Net amortization expense for the three months ended June 30, 2013 and 2012 was $59,000 and $13,000, and was $134,000 and $74,000 for the comparable six months periods.
Investment securities are purchased from time-to-time in the open market at prices that are greater or lesser than the par value of the investment. The resulting premium or discount is deferred and recognized as an adjustment to the yield of the related investment. At June 30, 2013 and December 31, 2012, there were no premiums or discounts on investment securities, and their related income accretion or amortization was immaterial for 2013 and 2012.
Interest income is recorded on the accrual basis. Taxicab medallion and commercial loans are placed on nonaccrual status, and all uncollected accrued interest is reversed, when there is doubt as to the collectability of interest or principal, or if loans are 90 days or more past due, unless management has determined that they are both well-secured and in the process of collection. Interest income on nonaccrual loans is generally recognized when cash is received, unless a determination has been made to apply all cash receipts to principal. At June 30, 2013, December 31, 2012, and June 30, 2012, total nonaccrual loans were $21,412,000, $20,607,000, and $27,757,000, and represented 6%, 6%, and 8% of the gross medallion and commercial loan portfolio at each period end, and were primarily concentrated in the secured mezzanine portfolio. The amount of interest income on nonaccrual loans that would have been recognized if the loans had been paying in accordance with their original terms was $10,202,000, $8,496,000, and $14,988,000 as of June 30, 2013, December 31, 2012, and June 30, 2012, of which $889,000 and $1,418,000 would have been recognized in the quarters ended June 30, 2013 and 2012, and $1,705,000 and $2,689,000 would have been recognized in the comparable six months. The reduction in nonaccrual interest foregone and principal balances reflects the recognition of certain loans as realized losses, and hence removal from the nonaccrual disclosures.
Loan Sales and Servicing Fee Receivable
The Company accounts for its sales of loans in accordance with FASB Accounting Standards Codification Topic 860, Transfers and Servicing (FASB ASC 860). FASB ASC 860 provides accounting and reporting standards for transfers and servicing of financial assets and extinguishments of liabilities. In accordance with FASB ASC 860, the Company has elected the fair value measurement method for its servicing assets and liabilities. The principal portion of loans serviced for others by the Company and its affiliates was $422,172,000 and $452,057,000 at June 30, 2013 and December 31, 2012, and included $408,922,000 and $406,956,000 of loans serviced for Medallion Bank. The Company has evaluated the servicing aspect of its business in accordance with FASB ASC 860, most of which relates to servicing assets held by Medallion Bank, and determined that no material servicing asset or liability exists as of June 30, 2013 and December 31, 2012. The Company has assigned its servicing rights to the Medallion Bank portfolio to MSC, a wholly-owned unconsolidated portfolio investment. The costs of servicing are allocated to MSC by the Company, and the servicing fee income is billed to and collected from Medallion Bank by MSC.
Unrealized Appreciation (Depreciation) and Realized Gains (Losses) on Investments
Unrealized appreciation (depreciation) on investments is the amount by which the fair value estimated by the Company is greater (less) than the cost basis of the investment portfolio. Realized gains or losses on investments are generated through sales of investments, foreclosure on specific collateral, and writeoffs of loans or assets acquired in satisfaction of loans, net of recoveries. Unrealized appreciation (depreciation) on investments was $32,487,000, $25,957,000, and $15,218,000 as of June 30, 2013, December 31, 2012, and June 30, 2012. The Company’s investment in Medallion Bank, a wholly owned portfolio investment, is also subject to quarterly assessments of fair value. The Company conducts a thorough valuation analysis as described previously, and determines whether any factors give rise to valuation different than recorded book value, including various
F-83
Table of Contents
regulatory restrictions that were established at Medallion Bank’s inception, by the FDIC and State of Utah, and also by additional regulatory restrictions, such as the prior moratorium imposed by the Dodd-Frank Act on the acquisition of control of an industrial bank by a “commercial firm” (a company whose gross revenues are primarily derived from non-financial activities) which expired in July 2013 to transfer industrial bank charters. As a result of this valuation process, the Company used Medallion Bank’s actual results of operations as the best estimate of changes in fair value, and recorded the results as a component of unrealized appreciation (depreciation) on investments, although changes in these restrictions and other applicable factors could change these conclusions in the future. See Note 3 for the presentation of financial information for Medallion Bank.
The following tables set forth the changes in the Company’s unrealized appreciation (depreciation) on investments, other than investments in controlled subsidiaries, for the 2013 and 2012 quarters shown below.
| (Dollars in thousands) |
Medallion Loans |
Commercial Loans |
Equity Investments |
Foreclosed Properties(1) |
Total | |||||||||||||||
| Balance December 31, 2012 |
$ | — | ($ | 7,844 | ) | $ | 44 | $ | 33,757 | $ | 25,957 | |||||||||
| Net change in unrealized |
||||||||||||||||||||
| Appreciation on investments |
— | — | (11 | ) | 3,012 | 3,001 | ||||||||||||||
| Depreciation on investments |
— | (50 | ) | 14 | — | (36 | ) | |||||||||||||
| Reversal of unrealized appreciation (depreciation) related to realized |
||||||||||||||||||||
| Gains on investments |
— | — | — | — | — | |||||||||||||||
| Losses on investments |
— | — | — | — | — | |||||||||||||||
|
|
|
|
|
|
|
|
|
|
|
|||||||||||
| Balance March 31, 2013 |
— | (7,894 | ) | 47 | 36,769 | 28,922 | ||||||||||||||
| Net change in unrealized |
||||||||||||||||||||
| Appreciation on investments |
— | — | 505 | 2,853 | 3,358 | |||||||||||||||
| Depreciation on investments |
— | (66 | ) | 273 | — | 207 | ||||||||||||||
| Reversal of unrealized appreciation (depreciation) related to realized |
||||||||||||||||||||
| Gains on investments |
— | — | — | — | — | |||||||||||||||
| Losses on investments |
— | — | — | — | — | |||||||||||||||
|
|
|
|
|
|
|
|
|
|
|
|||||||||||
| Balance June 30, 2013 |
$ | — | ($ | 7,960 | ) | $ | 825 | $ | 39,622 | $ | 32,487 | |||||||||
|
|
|
|
|
|
|
|
|
|
|
|||||||||||
| (1) | Foreclosed properties are held in other assets on the consolidated balance sheet. |
F-84
Table of Contents
| (Dollars in thousands) |
Medallion Loans |
Commercial Loans |
Equity Investments |
Foreclosed Properties(1) |
Total | |||||||||||||||
| Balance December 31, 2011 |
$ | — | ($ | 14,298 | ) | $ | 1,105 | $ | 24,564 | $ | 11,371 | |||||||||
| Net change in unrealized |
||||||||||||||||||||
| Appreciation on investments |
— | — | (213 | ) | 2,377 | 2,164 | ||||||||||||||
| Depreciation on investments |
— | (659 | ) | 51 | 33 | (575 | ) | |||||||||||||
| Reversal of unrealized appreciation (depreciation) related to realized |
||||||||||||||||||||
| Gains on investments |
— | — | — | — | — | |||||||||||||||
| Losses on investments |
— | 424 | — | — | 424 | |||||||||||||||
|
|
|
|
|
|
|
|
|
|
|
|||||||||||
| Balance March 31, 2012 |
— | (14,533 | ) | 943 | 26,974 | 13,384 | ||||||||||||||
| Net change in unrealized |
||||||||||||||||||||
| Appreciation on investments |
— | — | (92 | ) | 1,997 | 1,905 | ||||||||||||||
| Depreciation on investments |
— | (27 | ) | (28 | ) | (18 | ) | (73 | ) | |||||||||||
| Reversal of unrealized appreciation (depreciation) related to realized |
||||||||||||||||||||
| Gains on investments |
— | — | — | — | — | |||||||||||||||
| Losses on investments |
— | — | 2 | — | 2 | |||||||||||||||
|
|
|
|
|
|
|
|
|
|
|
|||||||||||
| Balance June 30, 2012 |
$ | — | ($ | 14,560 | ) | $ | 825 | $ | 28,953 | $ | 15,218 | |||||||||
|
|
|
|
|
|
|
|
|
|
|
|||||||||||
| (1) | Foreclosed properties are held in other assets on the consolidated balance sheet. |
The table below summarizes components of unrealized and realized gains and losses in the investment portfolio for the three and six months ended June 30, 2013 and 2012.
| Three Months Ended June 30, |
Six Months Ended June 30, |
|||||||||||||||
| (Dollars in thousands) |
2013 | 2012 | 2013 | 2012 | ||||||||||||
| Net change in unrealized appreciation (depreciation) on investments |
||||||||||||||||
| Unrealized appreciation |
$ | 505 | ($ | 92 | ) | $ | 494 | ($ | 306 | ) | ||||||
| Unrealized depreciation |
207 | (55 | ) | 170 | (662 | ) | ||||||||||
| Net unrealized appreciation on investment in Medallion Bank and other controlled subsidiaries |
938 | 1,967 | 1,906 | 3,867 | ||||||||||||
| Realized gains |
— | — | — | — | ||||||||||||
| Realized losses |
— | 2 | — | 426 | ||||||||||||
| Unrealized gains on foreclosed properties and other assets |
2,853 | 1,979 | 5,865 | 4,389 | ||||||||||||
|
|
|
|
|
|
|
|
|
|||||||||
| Total |
$ | 4,503 | $ | 3,801 | $ | 8,435 | $ | 7,714 | ||||||||
|
|
|
|
|
|
|
|
|
|||||||||
| Net realized gains (losses) on investments |
||||||||||||||||
| Realized gains |
$ | — | $ | — | $ | — | $ | — | ||||||||
| Realized losses |
— | (2 | ) | — | (426 | ) | ||||||||||
| Other gains |
— | — | — | 359 | ||||||||||||
| Direct recoveries |
4 | 325 | 81 | 332 | ||||||||||||
| Realized gains on foreclosed properties and other assets |
— | — | — | — | ||||||||||||
|
|
|
|
|
|
|
|
|
|||||||||
| Total |
$ | 4 | $ | 323 | $ | 81 | $ | 265 | ||||||||
|
|
|
|
|
|
|
|
|
|||||||||
F-85
Table of Contents
The following table provides additional information on attributes of the nonperforming loan portfolio as of June 30, 2013, December 31, 2012, and June 30, 2012.
| (Dollars in thousands) |
Recorded Investment(1) |
Unpaid Principal Balance |
Average Recorded Investment |
|||||||||
| With no related allowance recorded, June 30, 2013 |
||||||||||||
| Medallion |
$ | — | $ | — | $ | — | ||||||
| Commercial(2)(3) |
21,412 | 30,631 | 20,945 | |||||||||
| With no related allowance recorded, December 31, 2012 |
||||||||||||
| Medallion |
— | — | — | |||||||||
| Commercial(2)(3) |
20,607 | 28,391 | 25,367 | |||||||||
| With no related allowance recorded, June 30, 2012 |
||||||||||||
| Medallion |
— | — | — | |||||||||
| Commercial(2)(3) |
27,757 | 34,910 | 27,086 | |||||||||
|
|
|
|
|
|
|
|||||||
| (1) | Unrealized depreciation had been recorded as a valuation allowance on these commercial loans. |
| (2) | Interest income of $2 and $59 was recognized in the three and six months ended June 30, 2013, compared to $14 and $104 for the comparable 2012 periods on these commercial loans. |
| (3) | Included in the unpaid principal balance is unearned paid in-kind interest on nonaccrual loans of $9,219, which is included in the nonaccrual disclosures in the section titled “Investment Transactions and Income Recognition” on page F-83 as of June 30, 2013, December 31, 2012, and June 30, 2012. |
The following table shows the aging of medallion and commercial loans as of June 30, 2013.
| Days Past Due | Current | Total | Recorded Investment > 90 Days and Accruing |
|||||||||||||||||||||||||
| (Dollars in thousands) |
31 - 60 | 61 - 90 | 91+ | Total | ||||||||||||||||||||||||
| Medallion loans |
$ | 289 | $ | 486 | $ | — | $ | 775 | $ | 293,170 | $ | 293,945 | $ | — | ||||||||||||||
|
|
|
|
|
|
|
|
|
|
|
|
|
|
|
|||||||||||||||
| Commercial loans |
||||||||||||||||||||||||||||
| Secured mezzanine |
1,020 | — | 2,182 | 3,202 | 44,999 | 48,201 | — | |||||||||||||||||||||
| Asset-based receivable |
— | 849 | 205 | 1,054 | 6,153 | 7,207 | — | |||||||||||||||||||||
| Other secured commercial |
— | — | 492 | 492 | 11,329 | 11,821 | — | |||||||||||||||||||||
|
|
|
|
|
|
|
|
|
|
|
|
|
|
|
|||||||||||||||
| Total commercial loans |
1,020 | 849 | 2,879 | 4,748 | 62,481 | 67,229 | — | |||||||||||||||||||||
|
|
|
|
|
|
|
|
|
|
|
|
|
|
|
|||||||||||||||
| Total |
$ | 1,309 | $ | 1,335 | $ | 2,879 | $ | 5,523 | $ | 355,651 | $ | 361,174 | $ | — | ||||||||||||||
|
|
|
|
|
|
|
|
|
|
|
|
|
|
|
|||||||||||||||
In addition to the loan portfolio delinquencies as described above, the receivable from bonuses related to certain investments of $6,468,000 was delinquent for more than 91 days at June 30, 2013, and is carried in other assets on the consolidated balance sheet.
The Company entered into no troubled debt restructuring during the quarter and six months ended June 30, 2013.
F-86
Table of Contents
The following table shows troubled debt restructurings which the Company entered into during the quarter ended June 30, 2012.
| Troubled Debt Restructuring that Subsequently Defaulted |
||||||||||||||||||||
| (Dollars in thousands) |
Number of Loans | Pre-Modification Investment |
Post-Modification Investment |
Number of Loans | Recorded Investment |
|||||||||||||||
| Medallion loans |
— | $ | — | $ | — | — | $ | — | ||||||||||||
|
|
|
|
|
|
|
|
|
|
|
|||||||||||
| Commercial loans |
||||||||||||||||||||
| Secured mezzanine |
1 | 2,176 | 2,176 | — | — | |||||||||||||||
| Asset-based receivable |
— | — | — | — | — | |||||||||||||||
| Other secured commercial |
— | — | — | — | — | |||||||||||||||
|
|
|
|
|
|
|
|
|
|
|
|||||||||||
| Total commercial loans |
1 | 2,176 | 2,176 | — | — | |||||||||||||||
|
|
|
|
|
|
|
|
|
|
|
|||||||||||
| Total |
1 | $ | 2,176 | $ | 2,176 | — | $ | — | ||||||||||||
|
|
|
|
|
|
|
|
|
|
|
|||||||||||
The following table shows troubled debt restructurings which the Company entered into during the six months ended June 30, 2012.
| Troubled Debt Restructuring that Subsequently Defaulted |
||||||||||||||||||||
| (Dollars in thousands) |
Number of Loans | Pre-Modification Investment |
Post-Modification Investment |
Number of Loans | Recorded Investment |
|||||||||||||||
| Medallion loans |
— | $ | — | $ | — | — | $ | — | ||||||||||||
|
|
|
|
|
|
|
|
|
|
|
|||||||||||
| Commercial loans |
||||||||||||||||||||
| Secured mezzanine |
2 | 5,560 | 5,010 | — | — | |||||||||||||||
| Asset-based receivable |
— | — | — | — | — | |||||||||||||||
| Other secured commercial |
— | — | — | — | — | |||||||||||||||
|
|
|
|
|
|
|
|
|
|
|
|||||||||||
| Total commercial loans |
2 | 5,560 | 5,010 | — | — | |||||||||||||||
|
|
|
|
|
|
|
|
|
|
|
|||||||||||
| Total |
2 | $ | 5,560 | $ | 5,010 | — | $ | — | ||||||||||||
|
|
|
|
|
|
|
|
|
|
|
|||||||||||
Goodwill
In accordance with ASC Topic 350, “Intangibles – Goodwill and Other,” the Company has determined that it is more likely than not that the relevant reporting unit’s fair value is greater than its carrying amount as of June 30, 2013 and December 31, 2012, and that the impairment testing of goodwill is not required. The results of this evaluation demonstrated no impairment in goodwill for any period evaluated, and management believes, and the Board of Directors concurs, that there is no impairment as of June 30, 2013. The Company conducts annual, and if necessary, more frequent, appraisals of its goodwill, and will recognize any impairment in the period any impairment is identified as a charge to operating expenses.
Fixed Assets
Fixed assets are carried at cost less accumulated depreciation and amortization, and are depreciated on a straight-line basis over their estimated useful lives of 3 to 10 years. Leasehold improvements are amortized on a straight-line basis over the shorter of the lease term or the estimated economic useful life of the improvement. Depreciation and amortization expense was $48,000 and $36,000 for the quarters ended June 30, 2013 and 2012, and was $96,000 and $76,000 for the comparable six months.
Deferred Costs
Deferred financing costs, included in other assets, represents costs associated with obtaining the Company’s borrowing facilities, and is amortized on a straight line basis over the lives of the related financing agreements.
F-87
Table of Contents
Amortization expense was $267,000 and $186,000 for the quarters ended June 30, 2013 and 2012, and was $483,000 and $586,000 for the comparable six months. In addition, the Company capitalizes certain costs for transactions in the process of completion (other than business combinations), including those for potential investments, and the sourcing of other financing alternatives. Upon completion or termination of the transaction, any accumulated amounts will be amortized against income over an appropriate period, or written off. The amounts on the balance sheet for all of these purposes were $1,520,000, $1,337,000, and $1,650,000 as of June 30, 2013, December 31, 2012, and June 30, 2012.
Federal Income Taxes
The Company and each of its major subsidiaries other than Medallion Bank and Medallion Funding LLC (the RIC subsidiaries) have qualified to be treated for federal income tax purposes as regulated investment companies (RICs) under the Internal Revenue Code of 1986, as amended (the Code). As RICs, the Company and each of the RIC subsidiaries are not subject to US federal income tax on any gains or investment company taxable income (which includes, among other things, dividends and interest income reduced by deductible expenses) that it distributes to its shareholders, if at least 90% of its investment company taxable income for that taxable year is distributed. It is the Company’s and the RIC subsidiaries’ policy to comply with the provisions of the Code. The Company’s RIC qualification is determined on an annual basis, and it qualified and filed its federal tax returns as a RIC for 2011 and 2010, and anticipates qualifying and filing as a RIC for 2013 and 2012. As a result, no provisions for income taxes have been recorded for the three and six months ended June 30, 2013 and 2012. State and local tax treatment follows the federal model.
The Company has filed tax returns in many states. Federal, New York State, and New York City tax filings of the Company for the tax years 2009 through the present are the more significant filings that are open for examination.
Medallion Bank is not a RIC and is taxed as a regular corporation. Fin Trust, Medallion Funding LLC, and Trust III are not subject to federal income taxation, instead their taxable income is treated as having been earned by the Company.
Net Increase in Net Assets Resulting from Operations per Share (EPS)
Basic earnings per share are computed by dividing net increase in net assets resulting from operations available to common shareholders by the weighted average number of common shares outstanding for the period. Diluted earnings per share reflect the potential dilution that could occur if option contracts to issue common stock were exercised, or if restricted stock vests, and has been computed after giving consideration to the weighted average dilutive effect of the Company’s stock options and restricted stock. The Company uses the treasury stock method to calculate diluted EPS, which is a method of recognizing the use of proceeds that could be obtained upon exercise of options and warrants, including unvested compensation expense related to the shares, in computing diluted EPS. It assumes that any proceeds would be used to purchase common stock at the average market price during the period.
F-88
Table of Contents
The table below shows the calculation of basic and diluted EPS.
| Three Months Ended June 30, | Six Months Ended June 30, | |||||||||||||||
| (Dollars in thousands) |
2013 | 2012 | 2013 | 2012 | ||||||||||||
| Net increase in net assets resulting from operations available to common shareholders |
$ | 6,249 | $ | 5,917 | $ | 12,721 | $ | 11,382 | ||||||||
|
|
|
|
|
|
|
|
|
|||||||||
| Weighted average common shares outstanding applicable to basic EPS |
21,633,656 | 19,353,031 | 21,527,912 | 18,505,127 | ||||||||||||
| Effect of dilutive stock options |
228,124 | 164,387 | 228,138 | 202,502 | ||||||||||||
| Effect of restricted stock grants |
156,280 | 52,965 | 134,506 | 46,042 | ||||||||||||
|
|
|
|
|
|
|
|
|
|||||||||
| Adjusted weighted average common shares outstanding applicable to diluted EPS |
22,018,060 | 19,570,383 | 21,890,556 | 18,753,671 | ||||||||||||
|
|
|
|
|
|
|
|
|
|||||||||
| Basic earnings per share |
$ | 0.29 | $ | 0.31 | $ | 0.59 | $ | 0.62 | ||||||||
| Diluted earnings per share |
0.28 | 0.30 | 0.58 | 0.61 | ||||||||||||
|
|
|
|
|
|
|
|
|
|||||||||
Potentially dilutive common shares excluded from the above calculations aggregated 18,000 and 284,336 shares as of June 30, 2013 and 2012.
Stock Compensation
The Company follows FASB Accounting Standard Codification Topic 718 (ASC 718), “Compensation – Stock Compensation”, for its stock option and restricted stock plans, and accordingly, the Company recognizes the expense of these grants as required. Stock-based employee compensation costs pertaining to stock options is reflected in net increase in net assets resulting from operations, for any new grants, using the fair values established by usage of the Black-Scholes option pricing model, expensed over the vesting period of the underlying option. Stock-based employee compensation costs pertaining to restricted stock are reflected in net increase in net assets resulting from operations for any new grants, using the grant date fair value of the shares granted, expensed over the vesting period of the underlying stock.
During the six months ended June 30, 2013 and 2012, the Company issued 1,393 and 92,957 restricted shares of stock-based compensation awards, and 18,000 and 5,000 shares of other stock-based compensation awards, and recognized $366,000 and $764,000, or $0.02 and $0.03 per diluted common share for the 2013 second quarter and six months, and $222,000 and $393,000, or $0.01 and $0.02 per share in the comparable 2012 periods, of non-cash stock-based compensation expense related to the grants. As of June 30, 2013, the total remaining unrecognized compensation cost related to unvested stock options and restricted stock was $1,488,000, which is expected to be recognized over the next twelve quarters (see Note 5).
Derivatives
The Company manages its exposure to increases in market rates of interest by periodically purchasing interest rate caps to lock in the cost of funds of its variable-rate debt in the event of a rapid run up in interest rates. The Company entered into contracts to purchase interest rate caps on $160,000,000 of notional value of principal from various multinational banks, with termination dates ranging to July 2015. The caps provide for payments to the Company if various LIBOR thresholds are exceeded during the cap terms. Total cap purchases were generally fully expensed when paid, including $17,000 and $39,000 for the three and six months ended June 30, 2013, and $42,000 for both comparable 2012 periods, and all are carried at $0 on the balance sheet at June 30, 2013.
Reclassifications
Certain reclassifications have been made to prior year balances to conform with the current quarter’s presentation. These reclassifications have no effect on the previously reported results of operations.
F-89
Table of Contents
(3) INVESTMENT IN MEDALLION BANK AND OTHER CONTROLLED SUBSIDIARIES
The following table presents information derived from Medallion Bank’s statement of comprehensive income and other valuation adjustments on other controlled subsidiaries for the three and six months ended June 30, 2013 and 2012.
| Three Months Ended June 30, |
Six Months Ended June 30, |
|||||||||||||||
| (Dollars in thousands) |
2013 | 2012 | 2013 | 2012 | ||||||||||||
| Statement of comprehensive income |
||||||||||||||||
| Investment income |
$ | 15,301 | $ | 13,682 | $ | 29,965 | $ | 26,608 | ||||||||
| Interest expense |
1,279 | 1,223 | 2,606 | 2,414 | ||||||||||||
|
|
|
|
|
|
|
|
|
|||||||||
| Net interest income |
14,022 | 12,459 | 27,359 | 24,194 | ||||||||||||
| Noninterest income |
53 | 101 | 145 | 219 | ||||||||||||
| Operating expenses |
4,178 | 3,872 | 8,344 | 7,531 | ||||||||||||
|
|
|
|
|
|
|
|
|
|||||||||
| Net investment income before income taxes |
9,897 | 8,688 | 19,160 | 16,882 | ||||||||||||
| Income tax provision |
(2,398 | ) | (2,898 | ) | (5,489 | ) | (5,492 | ) | ||||||||
|
|
|
|
|
|
|
|
|
|||||||||
| Net investment income after income taxes |
7,499 | 5,790 | 13,671 | 11,390 | ||||||||||||
| Net realized/unrealized losses of Medallion Bank |
(4,186 | ) | (962 | ) | (5,707 | ) | (2,437 | ) | ||||||||
|
|
|
|
|
|
|
|
|
|||||||||
| Net increase in net assets resulting from operations of Medallion Bank |
3,313 | 4,828 | 7,964 | 8,953 | ||||||||||||
| Unrealized depreciation on Medallion Bank(1) |
(2,566 | ) | (2,566 | ) | (5,632 | ) | (4,632 | ) | ||||||||
| Net realized/unrealized losses on controlled subsidiaries other than Medallion Bank |
191 | (295 | ) | (426 | ) | (454 | ) | |||||||||
|
|
|
|
|
|
|
|
|
|||||||||
| Net increase in net assets resulting from operations of Medallion Bank and other controlled subsidiaries |
$ | 938 | $ | 1,967 | $ | 1,906 | $ | 3,867 | ||||||||
|
|
|
|
|
|
|
|
|
|||||||||
| (1) | Unrealized depreciation on Medallion Bank reflects the adjustment to the investment carrying amount to reflect the dividends declared to the Company and the US Treasury. |
The following table presents Medallion Bank’s balance sheets and the net investment in other controlled subsidiaries as of June 30, 2013 and December 31, 2012.
| (Dollars in thousands) |
2013 | 2012 | ||||||
| Loans |
$ | 712,183 | $ | 664,381 | ||||
| Investment securities, at fair value |
22,676 | 22,122 | ||||||
|
|
|
|
|
|||||
| Net investments(1) |
734,859 | 686,503 | ||||||
| Cash |
20,885 | 24,770 | ||||||
| Other assets, net |
12,142 | 12,100 | ||||||
|
|
|
|
|
|||||
| Total assets |
$ | 767,886 | $ | 723,373 | ||||
|
|
|
|
|
|||||
| Other liabilities |
$ | 4,071 | $ | 1,643 | ||||
| Due to affiliates |
871 | 1,462 | ||||||
| Deposits and other borrowings, including accrued interest payable |
642,978 | 602,635 | ||||||
|
|
|
|
|
|||||
| Total liabilities |
647,920 | 605,740 | ||||||
| Medallion Bank equity(2) |
119,966 | 117,633 | ||||||
|
|
|
|
|
|||||
| Total liabilities and equity |
$ | 767,886 | $ | 723,373 | ||||
|
|
|
|
|
|||||
| Investment in other controlled subsidiaries |
$ | 6,294 | $ | 6,914 | ||||
| Total investment in Medallion Bank and other controlled subsidiaries |
$ | 100,343 | 99,083 | |||||
|
|
|
|
|
|||||
F-90
Table of Contents
| (1) | Included in Medallion Bank’s net investments is $60 and $96 for purchased loan premium at June 30, 2013 and December 31, 2012. |
| (2) | Includes $26,303 of preferred stock issued to the US Treasury under the Small Business Lending Fund Program (SBLF). |
The following paragraphs summarize the accounting and reporting policies of Medallion Bank, and provide additional information relating to the tables presented above.
Investment securities are purchased from time-to-time in the open market at prices that are greater or lesser than the par value of the investment. The resulting premium or discount is deferred and recognized on a level yield basis as an adjustment to the yield of the related investment. At June 30, 2013 and December 31, 2012, the net premium on investment securities totaled $315,000 and $336,000, and $27,000 and $67,000 was amortized into interest income for the quarter and six months ended June 30, 2013, and $42,000 and $89,000 was amortized in the comparable 2012 periods.
Loan origination fees and certain direct origination costs are deferred and recognized as an adjustment to the yield of the related loans. At June 30, 2013 and December 31, 2012, net loan origination costs were $8,525,000 and $7,019,000. Net amortization expense for the quarter and six months ended June 30, 2013 was $810,000 and $1,455,000, and was $533,000 and $1,048,000 for the comparable 2012 periods.
Medallion Bank’s policies regarding nonaccrual of medallion and commercial loans are similar to those of the Company. The consumer portfolio has different characteristics compared to commercial loans, typified by a larger number of lower dollar loans that have similar characteristics. These loans are placed on nonaccrual when they become 90 days past due, or earlier if they enter bankruptcy, and are charged off in their entirety when deemed uncollectible, or when they become 120 days past due, whichever occurs first, at which time appropriate collection and recovery efforts against both the borrower and the underlying collateral are initiated. At June 30, 2013, $2,111,000 or 1% of consumer loans, 12,933,000 or 20% of commercial loans, and no medallion loans were on nonaccrual, compared to $2,451,000 or 1% of consumer loans, and no commercial and medallion loans on nonaccrual at December 31, 2012, and $1,711,000 or 1% of consumer loans, and no commercial or medallion loans on nonaccrual at June 30, 2012. The amount of interest income on nonaccrual loans that would have been recognized if the loans had been paying in accordance with their original terms was $169,000, $0 and $0 as of June 30, 2013, December 31, 2012, and June 30, 2012.
Medallion Bank’s loan and investment portfolios are assessed for collectability on a monthly basis, and a loan loss allowance is established for any realizability concerns on specific investments, and general reserves have also been established for any unknown factors. Adjustments to the value of this portfolio are based on the Company’s own historical loan loss data developed since 2004, adjusted for changes in delinquency trends and other factors as described previously in Note 2.
Medallion Bank raises deposits to fund loan originations. The deposits were raised through the use of investment brokerage firms who package deposits qualifying for FDIC insurance into pools that are sold to Medallion Bank. The rates paid on the deposits are highly competitive with market rates paid by other financial institutions, and include a brokerage fee of 0.15% to 0.50%, depending on the maturity of the deposit, which is capitalized and amortized to interest expense over the life of the respective pool. The total amount capitalized at June 30, 2013 and December 31, 2012 was $1,393,000 and $1,249,000, and $303,000 and $611,000 was amortized to interest expense during the quarter and six months ended June 30, 2013, and $269,000 and $530,000 was amortized in the comparable 2012 periods. Interest on the deposits is accrued daily and paid monthly, quarterly, semiannually, or at maturity.
F-91
Table of Contents
The outstanding balances of fixed rate borrowings were as follows.
| (Dollars in |
Payments Due for the Fiscal Year Ending June 30, | June 30, 2013 |
December 31, 2012 |
Interest Rate(1) |
||||||||||||||||||||||||||||||||
| 2014 | 2015 | 2016 | 2017 | 2018 | Thereafter | |||||||||||||||||||||||||||||||
| Deposits and other borrowings |
$ | 349,736 | $ | 146,011 | $ | 129,016 | $ | 7,692 | $ | 10,016 | $ | — | $ | 642,471 | $ | 602,151 | 0.60 | % | ||||||||||||||||||
|
|
|
|
|
|
|
|
|
|
|
|
|
|
|
|
|
|
|
|||||||||||||||||||
| (1) | Weighted average contractual rate as of June 30, 2013. |
Medallion Bank is subject to various regulatory capital requirements administered by the FDIC and State of Utah Department of Financial Institutions. Failure to meet minimum capital requirements can initiate certain mandatory and possibly additional discretionary actions by regulators that, if undertaken, could have a direct material effect on Medallion Bank’s and the Company’s financial statements. Under capital adequacy guidelines and the regulatory framework for prompt corrective action, Medallion Bank must meet specific capital guidelines that involve quantitative measures of Medallion Bank’s assets, liabilities, and certain off-balance sheet items as calculated under regulatory accounting practices. Medallion Bank’s capital amounts and classification are also subject to qualitative judgments by Medallion Bank regulators about components, risk weightings, and other factors.
FDIC-insured banks, including Medallion Bank, are subject to certain federal laws, which impose various legal limitations on the extent to which banks may finance or otherwise supply funds to certain of their affiliates. In particular, Medallion Bank is subject to certain restrictions on any extensions of credit to, or other covered transactions, such as certain purchases of assets, with the Company or its affiliates.
Quantitative measures established by regulation to ensure capital adequacy require Medallion Bank to maintain minimum amounts and ratios as defined in the regulations (set forth in the table below). Additionally, as conditions of granting Medallion Bank’s application for federal deposit insurance, the FDIC ordered that the leverage capital ratio (Tier 1 capital to average assets) be not less than 15%, and that an adequate allowance for loan losses be maintained. As a result, to facilitate maintenance of the capital ratio requirement and to provide the necessary capital for continued growth, the Company periodically makes capital contributions to Medallion Bank. Separately, Medallion Bank declared dividends to the Company of $2,500,000 and $5,500,000 in the 2013 second quarter and six months, and $2,500,000 and $4,500,000 in the comparable 2012 periods.
On February 27, 2009 and December 22, 2009, Medallion Bank issued, and the US Treasury purchased under the TARP Capital Purchase Program (the CPP) Medallion Bank’s fixed rate non-cumulative Perpetual Preferred Stock, Series A, B, C, and D for an aggregate purchase price of $21,498,000 in cash. On July 21, 2011, Medallion Bank issued, and the US Treasury purchased 26,303 shares of Senior Non-Cumulative Perpetual Preferred Stock, Series E (Series E) for an aggregate purchase price of $26,303,000 under the Small Business Lending Fund Program (SBLF). The SBLF is a voluntary program intended to encourage small business lending by providing capital to qualified smaller banks at favorable rates. In connection with the issuance of the Series E, the Bank exited the CPP by redeeming the Series A, B, C, and D; and received approximately $4,000,000, net of dividends due on the repaid securities. The Bank pays a dividend rate of 1% on the Series E.
F-92
Table of Contents
The following table represents Medallion Bank’s actual capital amounts and related ratios as of June 30, 2013 and December 31, 2012, compared to required regulatory minimum capital ratios and the ratio required to be considered well capitalized. As of June 30, 2013, Medallion Bank meets all capital adequacy requirements to which it is subject, and is well-capitalized.
| Regulatory | ||||||||||||||||
| (Dollars in Thousands) |
Minimum | Well-capitalized | June 30, 2013 | December 31, 2012 | ||||||||||||
| Tier 1 capital |
— | — | $ | 119,120 | $ | 116,026 | ||||||||||
| Total capital |
— | — | 128,534 | 124,791 | ||||||||||||
| Average assets |
— | — | 742,456 | 711,794 | ||||||||||||
| Risk-weighted assets |
— | — | 745,245 | 695,306 | ||||||||||||
| Leverage ratio(1) |
4 | % | 5 | % | 16.0 | % | 16.3 | % | ||||||||
| Tier 1 capital ratio(2) |
4 | 6 | 16.0 | 16.7 | ||||||||||||
| Total capital ratio(2) |
8 | 10 | 17.3 | 18.0 | ||||||||||||
|
|
|
|
|
|
|
|
|
|||||||||
| (1) | Calculated by dividing Tier 1 capital by average assets. |
| (2) | Calculated by dividing Tier 1 or total capital by risk-weighted assets. |
(4) FUNDS BORROWED
The outstanding balances of funds borrowed were as follows.
| Payments Due for the Fiscal Year Ending June 30, | June 30, 2012 |
December 31, 2012 |
Interest Rate(1) |
|||||||||||||||||||||||||||||||||
| (Dollars in thousands) |
2014 | 2015 | 2016 | 2017 | 2018 | Thereafter | ||||||||||||||||||||||||||||||
| Revolving lines of credit |
$ | 166,255 | $ | — | $ | — | $ | — | $ | — | $ | — | $ | 166,255 | $ | 163,628 | 1.21 | % | ||||||||||||||||||
| Notes payable to banks |
47,747 | 24,468 | 229 | 12,364 | — | — | 84,808 | 66,207 | 2.82 | % | ||||||||||||||||||||||||||
| SBA debentures |
9,150 | 6,500 | 4,000 | — | — | 38,985 | 58,635 | 59,935 | 4.44 | % | ||||||||||||||||||||||||||
| Preferred securities |
— | — | — | — | — | 33,000 | 33,000 | 33,000 | 2.40 | % | ||||||||||||||||||||||||||
|
|
|
|
|
|
|
|
|
|
|
|
|
|
|
|
|
|||||||||||||||||||||
| Total |
$ | 223,152 | $ | 30,968 | $ | 4,229 | $ | 12,364 | $ | — | $ | 71,985 | $ | 342,698 | $ | 322,770 | 2.28 | % | ||||||||||||||||||
|
|
|
|
|
|
|
|
|
|
|
|
|
|
|
|
|
|
|
|||||||||||||||||||
| (1) | Weighted average contractual rate as of June 30, 2013. |
(A) REVOLVING LINES OF CREDIT
In December 2008, Trust III entered into a revolving line of credit agreement with DZ Bank, to provide up to $200,000,000 of financing through a commercial paper conduit to acquire medallion loans from MFC (DZ line), of which $166,255,000 was outstanding at June 30, 2013. Borrowings under Trust III’s revolving line of credit are collateralized by Trust III’s assets. MFC is the servicer of the loans owned by Trust III. The DZ line includes a borrowing base covenant and rapid amortization in certain circumstances. In addition, if certain financial tests are not met, MFC can be replaced as the servicer. The DZ line matures in December 2013. The interest rate is the lesser of a pooled short-term commercial paper rate (which approximates LIBOR), 30 day LIBOR (0.19% at June 30, 2013) plus 0.75%, or 90 day LIBOR (0.27% at June 30, 2013) plus 0.50%; plus 0.95%.
(B) SBA DEBENTURES
In the 2013 first quarter, the SBA approved a $15,000,000 commitment for FSVC and a $5,000,000 commitment for MCI to issue additional debentures until September 30, 2017 upon payment of a 1% fee. FSVC issued $15,000,000 of debentures on March 1, 2013 and used the proceeds to repay debentures maturing on that date. In September 2010, the SBA approved a $5,000,000 commitment for MCI to issue additional debentures
F-93
Table of Contents
during a four year period upon payment of a 1% fee. The SBA also approved a $7,485,000 commitment for FSVC to issue additional debentures during a four year period upon payment of a 1% fee, for the purpose of repaying $7,485,000 of debentures which matured in September 2011, which were issued on March 1, 2011 and used to prepay the September 2011 maturing debentures. In September 2006, the SBA approved a $6,000,000 commitment for FSVC to issue additional debentures to the SBA during a four year period upon payment of a 1% fee and the infusion of $2,000,000 of additional capital. In March 2006, the SBA approved a $13,500,000 commitment for MCI to issue additional debentures to the SBA during a four year period upon payment of a 1% fee and the infusion of $6,750,000 of additional capital. In November 2003, the SBA approved an $8,000,000 commitment for FSVC, and during 2001, the SBA approved $36,000,000 each in commitments for FSVC and MCI. As of June 30, 2013, $126,985,000 of commitments had been fully utilized, $5,000,000 of commitments were available, and $58,635,000 was outstanding.
The notes are collateralized by substantially all the Company’s assets and are subject to the terms and conditions of agreements with the SBA which, among other things, restrict stock redemptions, disposition of assets, new indebtedness, dividends or distributions, and changes in management, ownership, investment policy, or operations. The debentures have been issued in various tranches for terms of ten years with interest payable semiannually.
(C) NOTES PAYABLE TO BANKS
The Company and its subsidiaries have entered into (i) note agreements and (ii) participation agreements with a variety of local and regional banking institutions over the years, as well as other non-bank lenders. The notes are typically secured by various assets of the underlying borrower. The Company believes the participation agreements represent legal true sales of the loans to the lender, but for accounting purposes these participations are treated as financings, and are included in funds borrowed as shown on the Company’s consolidated balance sheets.
The table below summarizes the key attributes of the Company’s various borrowing arrangements with banks as of June 30, 2013.
| (Dollars in thousands) | ||||||||||||||||||||||||||||
| Borrower |
# of Lenders / Notes |
Note Dates |
Maturity Dates |
Type |
Note Amounts |
Balance Outstanding at June 30, 2013 |
Monthly Payment |
Average Interest Rate at June 30, 2013 |
Interest Rate | |||||||||||||||||||
| The Company |
3/4 | 1/09 - 6/13 | 10/16 -11/16 | Participated loans treated as financings | $ | 9,834 | $ | 9,827 | Proportionate to the payments received on the participated loans | 2.67% | N/A | |||||||||||||||||
| Medallion Chicago |
3/28 | 12/11 | 12/14 | Term loans secured by owned Chicago medallions(2) | 26,152 | 25,177 | $124 principal & interest | 3.04% | N/A | |||||||||||||||||||
| The Company |
4/5 | 4/11 - 12/12 | 8/13 - 6/15 | Revolving line of credit secured by pledged loans | 57,500 | 44,500 | Interest only | 2.69% + 0.25% unused fee |
LIBOR + 2%, 3% floor; LIBOR + 2.5% or; LIBOR + 2% or Prime - 0.50%, 3% floor | |||||||||||||||||||
| MFC |
3/3 | 1/05 - 8/11 | 8/13 - 5/14 | Revolving line of credit secured by pledged loans | 30,500 | (4) | 2,300 | (4) | Interest only | 2.69% | Prime + 0.50%; LIBOR +2.50%, or LIBOR +2% | |||||||||||||||||
| MFC |
5/6 | 1/10 - 6/13 | 9/13 - 11/16 | Participated loans treated as financings | 3,010 | 2,929 | Proportionate to the payments received on the participated loans | 2.74% | 2.74%(3) | |||||||||||||||||||
| FSVC |
2/3 | 2/12 - 3/13 | 2/15 - 3/16 | Participated loans treated as financings | 76 | 75 | Proportionate to the payments received on the participated loans | 10.32% | N/A | |||||||||||||||||||
|
|
|
|
|
|||||||||||||||||||||||||
| $ | 127,072 | $ | 84,808 | |||||||||||||||||||||||||
|
|
|
|
|
|||||||||||||||||||||||||
| (1) | At June 30, 2013, 30 day LIBOR was 0.19%, 360 day LIBOR was 0.69%, and the prime rate was 3.25%. |
| (2) | $15,483 guaranteed by the Company. |
F-94
Table of Contents
| (3) | One $47 note reprices on its one year anniversary date at the greater of the current interest rate, or the prime rate plus 0.50%, the balance was fixed to term at an average rate of 4.51% |
| (4) | $22,500 guaranteed by the Company and, $22,500 of two of the bank notes is also available for use by the Company. |
(D) PREFERRED SECURITIES
In June 2007, the Company issued and sold $36,083,000 aggregate principal amount of unsecured junior subordinated notes to Fin Trust which, in turn, sold $35,000,000 of preferred securities to Merrill Lynch International and issued 1,083 shares of common stock to the Company. The notes bore a fixed rate of interest of 7.68% to September 2012, and thereafter a variable rate of interest of 90 day LIBOR (0.27% at June 30, 2013) plus 2.13%. The notes mature in September 2037 and are prepayable at par. Interest is payable quarterly in arrears. The terms of the preferred securities and the notes are substantially identical. In December 2007, $2,000,000 of the preferred securities were repurchased from a third party investor. At June 30, 2013, $33,000,000 was outstanding on the preferred securities.
(E) COVENANT COMPLIANCE
In the normal course of business, the Company and its subsidiaries enter into agreements, or are subject to regulatory requirements, that result in loan restrictions. Certain of the Company’s debt agreements contain restrictions that require the Company to maintain certain financial ratios, including debt to equity and minimum net worth. In addition, the Company’s wholly-owned subsidiary Medallion Bank is subject to various regulatory requirements (see Note 3).
(5) STOCK OPTIONS AND RESTRICTED STOCK
The Company has a stock option plan (2006 Stock Option Plan) available to grant both incentive and nonqualified stock options to employees. The 2006 Stock Option Plan, which was approved by the Board of Directors on February 15, 2006 and shareholders on June 16, 2006, provides for the issuance of a maximum of 800,000 shares of common stock of the Company. At June 30, 2013, 153,155 shares of the Company’s common stock remained available for future grants. The 2006 Stock Option Plan is administered by the Compensation Committee of the Board of Directors. The option price per share may not be less than the current market value of the Company’s common stock on the date the option is granted. The term and vesting periods of the options are determined by the Compensation Committee, provided that the maximum term of an option may not exceed a period of ten years.
The Company’s Board of Directors approved the 2009 Employee Restricted Stock Plan (the Employee Restricted Stock Plan) on April 16, 2009. The Employee Restricted Stock Plan became effective upon the Company’s receipt of exemptive relief from the SEC and approval of the Employee Restricted Stock Option Plan by the Company’s shareholders on June 11, 2010. The terms of the Employee Restricted Stock Plan provide for grants of restricted stock awards to the Company’s employees. A grant of restricted stock is a grant of shares of the Company’s common stock which, at the time of issuance, is subject to certain forfeiture provisions, and thus is restricted as to transferability until such forfeiture restrictions have lapsed. A total of 800,000 shares of the Company’s common stock are issuable under the Employee Restricted Stock Plan, and as of June 30, 2013, 498,207 shares of the Company’s common stock remained available for future grants. Awards under the 2009 Employee Plan are subject to certain limitations as set forth in the Employee Restricted Stock Plan. The Employee Restricted Stock Plan will terminate when all shares of common stock authorized for delivery under the Employee Restricted Stock Plan have been delivered and the forfeiture restrictions on all awards have lapsed, or by action of the Board of Directors pursuant to the Employee Restricted Stock Plan, whichever first occurs.
The Company’s Board of Directors approved the First Amended and Restated 2006 Director Plan (the Amended Director Plan) on April 16, 2009, which was approved by the Company’s shareholders on June 5, 2009, and on which exemptive relief to implement the Amended Director Plan was received from the SEC on July 17, 2012. A total of 200,000 shares of the Company’s common stock are issuable under the Amended
F-95
Table of Contents
Director Plan, and as of June 30, 2013, 82,000 shares of the Company’s common stock remained available for future grants. Under the Amended Director Plan, unless otherwise determined by a committee of the Board of Directors comprised of directors who are not eligible for grants under the Amended Director Plan, the Company will grant options to purchase 9,000 shares of the Company’s common stock to an Eligible Director upon election to the Board of Directors, with an adjustment for directors who are elected to serve less than a full term. The option price per share may not be less than the current market value of the Company’s common stock on the date the option is granted. Options granted under the Amended Director Plan are exercisable annually, as defined in the Amended Director Plan. The term of the options may not exceed ten years.
The Company’s 1996 Stock Option Plan and 1996 Director Plan terminated on May 21, 2006 and no additional shares are available for future issuance. At June 30, 2013, 673,321 options on the Company’s common stock were outstanding under the 1996 and 2006 plans, of which 648,988 options were exercisable, and there were 270,551 unvested shares of the Company’s common stock outstanding under the Employee Restricted Stock Plan.
The fair value of each restricted stock grant is determined on the date of grant by the closing market price of the Company’s common stock on the grant date. The fair value of each option grant is estimated on the date of grant using the Black-Scholes option-pricing model. The weighted average fair value of options granted was $1.41 and $1.25 for the six months ended June 30, 2013 and 2012. The following assumption categories are used to determine the value of any option grants.
| Three Months Ended June 30, | Six Months Ended June 30, | |||||||||||||||
| 2013 | 2012 | 2013 | 2012 | |||||||||||||
| Risk free interest rate |
1.24 | % | NA | 1.24 | % | 1.09 | % | |||||||||
| Expected dividend yield |
8.07 | NA | 8.07 | 7.53 | ||||||||||||
| Expected life of option in years(1) |
6.00 | NA | 6.00 | 6.00 | ||||||||||||
| Expected volatility(2) |
30.00 | NA | 30.00 | 30.00 | ||||||||||||
|
|
|
|
|
|
|
|
|
|||||||||
| (1) | Expected life is calculated using the simplified method. |
| (2) | We determine our expected volatility using the Black-Scholes option pricing model based on our historical volatility. |
The following table presents the activity for the stock option program under the 1996 and 2006 Stock Option Plans and the 1996 and 2006 Director Plans for the 2013 quarters and the 2012 full year.
| Number of Options |
Exercise Price Per Share |
Weighted Average Exercise Price |
||||||||||
| Outstanding at December 31, 2011 |
1,179,563 | $ | 3.50-13.06 | $ | 8.96 | |||||||
| Granted |
8,000 | 11.53-12.55 | 11.91 | |||||||||
| Cancelled |
(5,453 | ) | 4.85 | 4.85 | ||||||||
| Exercised(1) |
(210,610 | ) | 3.50-11.21 | 5.29 | ||||||||
|
|
|
|
|
|
|
|||||||
| Outstanding at December 31, 2012 |
971,500 | 3.50-13.06 | 9.80 | |||||||||
| Granted |
— | — | — | |||||||||
| Cancelled |
— | — | — | |||||||||
| Exercised(1) |
(175,003 | ) | 3.50-11.24 | 9.34 | ||||||||
|
|
|
|
|
|
|
|||||||
| Outstanding at March 31, 2013 |
796,497 | 7.17-13.06 | 9.90 | |||||||||
| Granted |
18,000 | 13.84 | 13.84 | |||||||||
| Cancelled |
— | — | — | |||||||||
| Exercised(1) |
(141,176 | ) | 7.49-13.06 | 10.67 | ||||||||
|
|
|
|
|
|
|
|||||||
| Outstanding at June 30, 2013(2) |
673,321 | $ | 7.17-13.84 | $ | 9.84 | |||||||
|
|
|
|
|
|
|
|||||||
| Options exercisable at June 30, 2013(2) |
648,988 | $ | 7.17-13.06 | $ | 9.71 | |||||||
|
|
|
|
|
|
|
|||||||
F-96
Table of Contents
| (1) | The aggregate intrinsic value, which represents the difference between the price of the Company’s common stock at the exercise date and the related exercise price of the underlying options, was $613,000 and $1,280,000 for the 2013 second quarter and six months, and was $28,000 and $779,000 for the comparable 2012 periods. |
| (2) | The aggregate intrinsic value, which represents the difference between the price of the Company’s common stock at June 30, 2013 and the related exercise price of the underlying options, was $2,737,000 for outstanding options and $2,724,000 for exercisable options as of June 30, 2013. |
The following table presents the activity for the restricted stock program under the 2009 Employee Restricted Stock Plan for the 2013 quarters and the 2012 full year.
| Number of Shares |
Grant Price Per Share |
Weighted Average Grant Price |
||||||||||
| Outstanding at December 31, 2011 |
79,668 | $ | 7.99-11.53 | $ | 8.48 | |||||||
| Granted |
221,693 | 11.08-12.55 | 11.56 | |||||||||
| Cancelled |
(669 | ) | 7.99-11.53 | 10.32 | ||||||||
| Vested(1) |
(375 | ) | 7.99 | 7.99 | ||||||||
|
|
|
|
|
|
|
|||||||
| Outstanding at December 31, 2012 |
300,317 | 7.99-12.55 | 10.76 | |||||||||
| Granted |
1,393 | 13.12 | 13.12 | |||||||||
| Cancelled |
— | — | — | |||||||||
| Vested(1) |
(30,866 | ) | 11.08 | 11.08 | ||||||||
|
|
|
|
|
|
|
|||||||
| Outstanding at March 31, 2013 |
270,844 | 7.99-13.12 | 10.72 | |||||||||
| Granted |
— | — | — | |||||||||
| Cancelled |
(293 | ) | 7.99-13.12 | 11.06 | ||||||||
| Vested(1) |
— | — | — | |||||||||
|
|
|
|
|
|
|
|||||||
| Outstanding at June 30, 2013(2) |
270,551 | $ | 7.99-13.12 | $ | 10.71 | |||||||
|
|
|
|
|
|
|
|||||||
| (1) | The aggregate fair value of the restricted stock vested was $0 and $342,000 for the 2013 second quarter and six months, and was $0 for the comparable 2012 periods. |
| (2) | The aggregate fair value of the restricted stock was $3,763,000 as of June 30, 2013. |
The following table presents the activity for the unvested options outstanding under the plans for the quarter and six months ended June 30, 2013.
| Number of Options |
Exercise Price Per Share |
Weighted Average Exercise Price |
||||||||||
| Outstanding at December 31, 2012 |
29,167 | $ | 7.17-12.55 | $ | 8.92 | |||||||
| Granted |
— | — | — | |||||||||
| Cancelled |
— | — | — | |||||||||
| Vested |
— | — | — | |||||||||
|
|
|
|
|
|
|
|||||||
| Outstanding at March 31, 2013 |
29,167 | 7.17-12.55 | 8.92 | |||||||||
| Granted |
18,000 | 13.84 | 13.84 | |||||||||
| Cancelled |
— | — | — | |||||||||
| Vested |
(22,833 | ) | 7.17-8.21 | 8.06 | ||||||||
|
|
|
|
|
|
|
|||||||
| Outstanding at June 30, 2013 |
24,334 | $ | 11.53-13.84 | $ | 13.36 | |||||||
|
|
|
|
|
|
|
|||||||
The intrinsic value of the options vested was $135,000 for the 2013 second quarter and six months.
F-97
Table of Contents
The following table summarizes information regarding options outstanding and options exercisable at June 30, 2013 under the 1996 and 2006 Stock Option Plans and the 1996 and the Amended Director Plan.
| Options Outstanding | Options Exercisable | |||||||||||||||||||||||
| Weighted average | Weighted average | |||||||||||||||||||||||
| Range of Exercise Prices | Shares at June 30, 2013 |
Remaining contractual life in years |
Exercise price | Shares at June 30, 2013 |
Remaining contractual life in years |
Exercise price | ||||||||||||||||||
| $7.17-13.84 | 673,321 | 4.20 | 9.84 | 648,988 | 4.00 | 9.71 | ||||||||||||||||||
|
|
|
|
|
|
|
|
|
|
|
|
|
|
||||||||||||
The following table summarizes information regarding restricted stock outstanding at June 30, 2013 under the 2009 Employee Restricted Stock Plan.
| Restricted Stock Outstanding | ||||||||||||
| Weighted average | ||||||||||||
| Range of Grant Prices | Shares at June 30, 2013 |
Remaining vesting period in years |
Grant price | |||||||||
| $7.99-13.12 | 270,551 | 1.78 | $ | 10.71 | ||||||||
|
|
|
|
|
|
|
|
||||||
(6) SEGMENT REPORTING
The Company has one business segment, its lending and investing operations. This segment originates and services medallion, secured commercial, and consumer loans, and invests in both marketable and nonmarketable securities.
(7) NONINTEREST INCOME AND OTHER OPERATING EXPENSES
The major components of noninterest income were as follows.
| Three Months Ended June 30, | Six Months Ended June 30, | |||||||||||||||
| (Dollars in thousands) |
2013 | 2012 | 2013 | 2012 | ||||||||||||
| Prepayment fees |
$ | 221 | $ | 212 | $ | 365 | $ | 356 | ||||||||
| Servicing fees |
69 | 52 | 108 | 122 | ||||||||||||
| Late charges |
20 | 50 | 72 | 137 | ||||||||||||
| Other |
17 | 28 | 78 | 62 | ||||||||||||
|
|
|
|
|
|
|
|
|
|||||||||
| Total noninterest income |
$ | 327 | $ | 342 | $ | 623 | $ | 677 | ||||||||
|
|
|
|
|
|
|
|
|
|||||||||
Late charges declined in both periods as delinquencies have improved in all business units.
The major components of other operating expenses were as follows.
| Three Months Ended June 30, | Six Months Ended June 30, | |||||||||||||||
| (Dollars in thousands) |
2013 | 2012 | 2013 | 2012 | ||||||||||||
| Travel, meals, and entertainment |
$ | 247 | $ | 189 | $ | 410 | $ | 430 | ||||||||
| Directors’ fees |
101 | 116 | 203 | 158 | ||||||||||||
| Office expense |
52 | 53 | 100 | 104 | ||||||||||||
| Depreciation and amortization |
48 | 36 | 96 | 76 | ||||||||||||
| Insurance |
44 | 48 | 90 | 90 | ||||||||||||
| Miscellaneous taxes |
(28 | ) | 90 | 53 | 185 | |||||||||||
| Other expenses |
110 | 240 | 384 | 496 | ||||||||||||
|
|
|
|
|
|
|
|
|
|||||||||
| Total other operating expenses |
$ | 574 | $ | 772 | $ | 1,336 | $ | 1,539 | ||||||||
|
|
|
|
|
|
|
|
|
|||||||||
F-98
Table of Contents
Travel, meals, and entertainment increased in 2013 second quarter due to an increase in investment development activities. Directors’ fees fluctuations reflected accrual adjustments in prior periods. Franchise tax benefit recognized in the 2013 second quarter was reflected in lower miscellaneous taxes. Other operating expenses were lower reflecting expense reduction efforts and reversals of accrued liabilities.
(8) SELECTED FINANCIAL RATIOS AND OTHER DATA
The following table provides selected financial ratios and other data.
| Three Months Ended June 30, | Six Months Ended June 30, | |||||||||||||||
| (Dollars in thousands, except per share data) |
2013 | 2012 | 2013 | 2012 | ||||||||||||
| Net share data |
||||||||||||||||
| Net asset value at the beginning of the period |
$ | 10.08 | $ | 9.71 | $ | 9.99 | $ | 9.68 | ||||||||
| Net investment income |
0.08 | 0.09 | 0.19 | 0.18 | ||||||||||||
| Income tax (provision) benefit |
— | — | — | — | ||||||||||||
| Net realized gains (losses) on investments |
— | 0.02 | — | 0.02 | ||||||||||||
| Net change in unrealized appreciation on investments |
0.20 | 0.19 | 0.39 | 0.41 | ||||||||||||
|
|
|
|
|
|
|
|
|
|||||||||
| Net increase in net assets resulting from operations |
0.28 | 0.30 | 0.58 | 0.61 | ||||||||||||
| Issuance of common stock |
0.03 | 0.06 | 0.02 | (0.02 | ) | |||||||||||
| Repurchase of common stock |
— | — | — | — | ||||||||||||
| Distribution of net investment income |
(0.08 | ) | (0.21 | ) | (0.22 | ) | (0.41 | ) | ||||||||
| Distribution of net realized gains on investments |
— | — | — | — | ||||||||||||
| Return of capital |
(0.14 | ) | — | (0.22 | ) | — | ||||||||||
| Other |
— | 0.01 | 0.02 | 0.01 | ||||||||||||
|
|
|
|
|
|
|
|
|
|||||||||
| Total increase (decrease) in net asset value |
0.09 | 0.16 | 0.18 | 0.19 | ||||||||||||
|
|
|
|
|
|
|
|
|
|||||||||
| Net asset value at the end of the period(1) |
$ | 10.17 | $ | 9.87 | $ | 10.17 | $ | 9.87 | ||||||||
|
|
|
|
|
|
|
|
|
|||||||||
| Per share market value at beginning of period |
$ | 13.22 | $ | 11.16 | $ | 11.74 | $ | 11.38 | ||||||||
| Per share market value at end of period |
13.91 | 10.62 | 13.91 | 10.62 | ||||||||||||
| Total return(2) |
27 | % | (12 | )% | 45 | % | (6 | )% | ||||||||
|
|
|
|
|
|
|
|
|
|||||||||
| Ratios/supplemental data |
||||||||||||||||
| Total shareholders’ equity (net assets) |
$ | 223,342 | $ | 211,675 | $ | 223,342 | $ | 211,675 | ||||||||
| Average net assets |
$ | 219,730 | $ | 192,250 | $ | 218,837 | $ | 183,838 | ||||||||
| Total expense ratio(3)(4) |
11.19 | % | 13.84 | % | 11.25 | % | 14.44 | % | ||||||||
| Operating expenses to average net assets(4) |
7.32 | 7.75 | 7.39 | 7.71 | ||||||||||||
| Net investment income after income taxes to average net assets(4) |
3.18 | 3.75 | 3.87 | 3.72 | ||||||||||||
|
|
|
|
|
|
|
|
|
|||||||||
| (1) | Includes $0.00 and $0.00 of undistributed net investment income per share and $0.00 and $0.00 of undistributed net realized gains per share as of June 30, 2013 and 2012. |
| (2) | Total return is calculated by dividing the change in market value of a share of common stock during the period, assuming the reinvestment of dividends on the payment date, by the per share market value at the beginning of the period. |
| (3) | Total expense ratio represents total expenses (interest expense, operating expenses, and income taxes) divided by average net assets. |
| (4) | MSC has assumed certain of the Company’s servicing obligations, and as a result, servicing fee income of $1,488 and $1,497, and operating expenses of $1,919 and $1,614, which formerly were the Company’s were now MSC’s for the three months ended June 30, 2013 and 2012, and used $2,976 and $2,973 of servicing |
F-99
Table of Contents
| fee income, and $3,720 and $3,132 of operating expenses for the comparable six months. Excluding the impact of the MSC amounts, the total expense ratio, operating expense ratio, and net investment income ratio would have been 15%, 11%, and 2.39% in the 2013 quarter, 17%, 11%, and 3.51% in the 2012 quarter, 15%, 11%, and 3.18% in the 2013 six months, and 18%, 11%, and 3.55% in the 2012 six months. |
(9) RECENTLY ISSUED ACCOUNTING STANDARDS
In July 2013, the FASB issued Accounting Standards Update (ASU) 2013-11, “Income Tax (Topic 740) Presentation of an Unrecognized Tax Benefit When a Net Operating Loss Carryforward, a Similar Tax Loss, or a Tax Credit Carryforward Exists—a consensus of the FASB Emerging Issues Task Force”. ASU 2013-11 requires, with limited exception, that an unrecognized tax benefit be presented in the financial statements as a reduction to a deferred tax asset. The update applies to all entities that have unrecognized tax benefits with a net operating loss carryforward, a similar tax loss, or a tax credit carryforward which exists as of the reporting date. The update is effective for periods beginning after December 15, 2013, with early adoption permitted. As a BDC which has elected to be treated as a RIC for federal income tax purposes, the Company does not have any unrecognized tax benefits and as such the Company does not believe that adoption of this standard will have a material impact on its financial condition or results of operations.
In July 2013, the FASB issued Accounting Standards Update (ASU) 2013-10, “Derivatives and Hedging (Topic 815) Inclusion of the Fed Funds Effective Swap Rate (or Overnight Index Swap Rate) as a Benchmark Interest Rate for Hedge Accounting Purposes—a consensus of the FASB Emerging Issues Task Force.” ASU 2013-10 permits the Fed Funds Effective Swap Rate to be used as a U.S. benchmark interest rate for hedge accounting purposes under Topic 815. The update also removes the restriction on using different benchmark rates for similar hedges. The update applied to all entities that elect to apply hedge accounting of the benchmark interest rate under Topic 815. The update is prospectively for qualifying new or redesignated hedging relationships entered into on or after July 17, 2013. The Company does not believe that adoption of this standard will have a material impact on its financial condition or results of operations.
In June 2013, the FASB issued Accounting Standards Update (ASU) 2013-08, “Financial Services—Investment Companies (Topic 946) Amendments to the Scope, Measurement, and Disclosure Requirements.” ASU 2013-08 clarifies the characteristics of an investment company, provides a comprehensive guide for assessing whether an entity is an investment company, requires an investment company to measure noncontrolling ownership interests in other investment companies at fair value, requires disclosure that an entity is an investment company applying the guidance in Topic 946, as well as requiring the disclosure of any changes in the entity’s status as an investment company. The update specifies that an entity regulated under the 1940 Act is an investment company with respect to Topic 946. The update is effective for periods beginning after December 15, 2013. As a BDC, regulated under the 1940 Act, the Company has presented itself as an investment company, as such the company does not believe that adoption of this standard will have a material impact on its financial condition or results of operations.
(10) RELATED PARTY TRANSACTIONS
Certain directors, officers, and shareholders of the Company are also directors and officers of its wholly-owned subsidiaries, MFC, MCI, FSVC, and Medallion Bank, as well as of certain portfolio investment companies. Officer salaries are set by the Board of Directors of the Company.
A member of the Board of Directors of the Company since 1996 is also of counsel in the Company’s primary law firm. Amounts paid to the law firm were $251,000 and $165,000 for the 2013 and 2012 second quarters, and were $277,000 and $204,000 for the comparable six months.
Jeffrey Rudnick, the son of one of the Company’s directors, is an officer of LAX Group, LLC (LAX), one of the Company’s portfolio companies. Mr. Rudnick receives a salary from LAX of $160,000 per year, and
F-100
Table of Contents
certain equity from LAX consisting of 10% ownership in LAX Class B stock, vesting at 3.34% per year; 5% of any new equity raised from outside investors at a valuation of $1,500,000 or higher; and 10% of LAX’s profits as a year end bonus. In addition, Mr. Rudnick provides consulting services to the Company directly for a monthly retainer of $4,200.
At June 30, 2013, December 31, 2012, and June 30, 2012, MSC serviced $408,922,000, $406,956,000, and $388,071,000 of loans for Medallion Bank. Included in net investment income were amounts as described in the table below that were received from Medallion Bank for services rendered in originating and servicing loans, and also for reimbursement of certain expenses incurred on their behalf.
The Company has assigned its servicing rights to the Medallion Bank portfolio to MSC, a wholly-owned unconsolidated portfolio investment. The costs of servicing are allocated to MSC by the Company, and the servicing fee income is billed and collected from Medallion Bank by MSC. As a result, $1,488,000 and $2,976,000 of servicing fee income was earned by MSC in the 2013 second quarter and six months, and $1,497,000 and $2,973,000 was earned in the comparable 2012 periods.
The following table summarizes is the net revenues received from Medallion Bank.
| Three Months Ended June 30, | Six Months Ended June 30, | |||||||||||||||
| (Dollars in thousands) |
2013 | 2012 | 2013 | 2012 | ||||||||||||
| Loan origination fees |
$ | 113 | $ | 101 | $ | 200 | $ | 216 | ||||||||
| Reimbursement of operating expenses |
80 | 70 | 153 | 141 | ||||||||||||
| Servicing fees |
4 | 5 | 10 | 11 | ||||||||||||
| Interest income |
— | — | — | — | ||||||||||||
|
|
|
|
|
|
|
|
|
|||||||||
| Total other income |
$ | 197 | $ | 176 | $ | 363 | $ | 368 | ||||||||
|
|
|
|
|
|
|
|
|
|||||||||
(11) FAIR VALUE OF FINANCIAL INSTRUMENTS
FASB ASC Topic 825, “Financial Instruments,” requires disclosure of fair value information about certain financial instruments, whether assets, liabilities, or off-balance-sheet commitments, if practicable. The following methods and assumptions were used to estimate the fair value of each class of financial instrument. Fair value estimates that were derived from broker quotes cannot be substantiated by comparison to independent markets and, in many cases, could not be realized in immediate settlement of the instrument.
(a) Investments—The Company’s investments are recorded at the estimated fair value of such investments.
(b) Floating rate borrowings—Due to the short-term nature of these instruments, the carrying amount approximates fair value.
(c) Commitments to extend credit—The fair value of commitments to extend credit is estimated using the fees currently charged to enter into similar agreements, taking into account the remaining terms of the agreements and present creditworthiness of the counter parties. For fixed rate loan commitments, fair value also includes a consideration of the difference between the current levels of interest rates and the committed rates. At June 30, 2013 and December 31, 2012, the estimated fair value of these off-balance-sheet instruments was not material.
F-101
Table of Contents
(d) Fixed rate borrowings—The fair value of the debentures payable to the SBA is estimated based on current market interest rates for similar debt.
| June 30, 2013 | December 31, 2012 | |||||||||||||||
| (Dollars in thousands) |
Carrying Amount |
Fair Value | Carrying Amount |
Fair Value | ||||||||||||
| Financial assets |
||||||||||||||||
| Investments |
$ | 460,340 | $ | 460,340 | $ | 455,010 | $ | 455,010 | ||||||||
| Cash(1) |
41,458 | 41,458 | 26,875 | 26,875 | ||||||||||||
| Accrued interest receivable(2) |
955 | 955 | 957 | 957 | ||||||||||||
| Financial liabilities |
||||||||||||||||
| Funds borrowed(2) |
342,698 | 342,698 | 322,770 | 322,770 | ||||||||||||
| Accrued interest payable(2) |
1,149 | 1,149 | 1,233 | 1,233 | ||||||||||||
|
|
|
|
|
|
|
|
|
|||||||||
| (1) | Categorized as level 1 within the fair value hierarchy. |
| (2) | Categorized as level 3 within the fair value hierarchy. |
(12) FAIR VALUE OF ASSETS AND LIABILITIES
The Company follows the provisions of FASB ASC 820, which defines fair value, establishes a framework for measuring fair value, establishes a fair value hierarchy based on the quality of inputs used to measure fair value, and enhances disclosure requirements for fair value measurements. The Company accounts for substantially all of its financial instruments at fair value or considers fair value in its measurement, in accordance with the accounting guidance for investment companies. See Note 2 sections “Fair Value of Assets and Liabilities” and “Investment Valuation” for a description of the Company’s valuation methodology which is unchanged during 2013.
In accordance with FASB ASC 820, the Company has categorized its assets and liabilities measured at fair value, based on the priority of the inputs to the valuation technique, into a three-level fair value hierarchy. The fair value hierarchy gives the highest priority to quoted prices in active markets for identical assets or liabilities (level 1) and the lowest priority to unobservable inputs (level 3). The Company’s assessment and classification of an investment within a level can change over time based upon maturity or liquidity of the investment and would be reflected at the beginning of the quarter in which the change occurred.
As required by FASB ASC 820, when the inputs used to measure fair value fall within different levels of the hierarchy, the level within which the fair value measurement is categorized is based on the lowest level input that is significant to the fair value measurement in its entirety. For example, a level 3 fair value measurement may include inputs that are observable (level 1 and 2) and unobservable (level 3). Therefore gains and losses for such assets and liabilities categorized within the level 3 table below may include changes in fair value that are attributable to both observable inputs (level 1 and 2) and unobservable inputs (level 3).
Assets and liabilities measured at fair value, recorded on the consolidated balance sheets, are categorized based on the inputs to the valuation techniques as follows:
Level 1. Assets and liabilities whose values are based on unadjusted quoted prices for identical assets or liabilities in an active market that the Company has the ability to access (examples include active exchange-traded equity securities, exchange-traded derivatives, most US Government and agency securities, and certain other sovereign government obligations).
Level 2. Assets and liabilities whose values are based on quoted prices in markets that are not active or model inputs that are observable either directly or indirectly for substantially the full term of the asset or liability. Level 2 inputs include the following:
| A) | Quoted prices for similar assets or liabilities in active markets (for example, restricted stock); |
F-102
Table of Contents
| B) | Quoted price for identical or similar assets or liabilities in non-active markets (for example, corporate and municipal bonds, which trade infrequently); |
| C) | Pricing models whose inputs are observable for substantially the full term of the asset or liability (examples include most over-the-counter derivatives, including interest rate and currency swaps); and |
| D) | Pricing models whose inputs are derived principally from or corroborated by observable market data through correlation or other means for substantially the full term of the asset or liability (examples include certain residential and commercial mortgage-related assets, including loans, securities, and derivatives). |
Level 3. Assets and liabilities whose values are based on prices or valuation techniques that require inputs that are both unobservable and significant to the overall fair value measurement. These inputs reflect management’s own assumptions about the assumptions a market participant would use in pricing the assets or liability (examples include certain private equity investments and, certain residential and commercial mortgage-related assets (including loans, securities, and derivatives).
A review of fair value hierarchy classification is conducted on a quarterly basis. Changes in the observability of valuation inputs may result in a reclassification for certain assets or liabilities. Reclassifications impacting level 3 of the fair value hierarchy are reported as transfers in/out of the level 3 category as of the beginning of the quarter in which the reclassifications occur.
The following tables present the Company’s fair value hierarchy for those assets and liabilities measured at fair value on a recurring basis as of June 30, 2013 and December 31, 2012.
| June 30, 2013 (Dollars in thousands) |
Level 1 | Level 2 | Level 3 | Total | ||||||||||||
| Assets |
||||||||||||||||
| Medallion loans |
$ | — | $ | — | $ | 294,029 | $ | 294,029 | ||||||||
| Commercial loans |
— | — | 59,229 | 59,229 | ||||||||||||
| Investment in Medallion Bank and other controlled subsidiaries |
— | — | 100,343 | 100,343 | ||||||||||||
| Equity investments |
268 | — | 6,471 | 6,739 | ||||||||||||
| Other assets |
— | 58,313 | — | 58,313 | ||||||||||||
|
|
|
|
|
|
|
|
|
|||||||||
| December 31, 2012 (Dollars in thousands) |
Level 1 | Level 2 | Level 3 | Total | ||||||||||||
| Assets |
||||||||||||||||
| Medallion loans |
$ | — | $ | — | $ | 294,388 | $ | 294,388 | ||||||||
| Commercial loans |
— | — | 56,919 | 56,919 | ||||||||||||
| Investment in Medallion Bank and other controlled subsidiaries |
— | — | 99,083 | 99,083 | ||||||||||||
| Equity investments |
231 | — | 4,389 | 4,620 | ||||||||||||
| Other assets |
— | 52,449 | — | 52,449 | ||||||||||||
|
|
|
|
|
|
|
|
|
|||||||||
Included in level 3 investments in Medallion Bank and other controlled subsidiaries is the investment in Medallion Bank, MSC, and investments in a start-up business engaged in media-buying consulting. Included in level 3 equity investments are unregistered shares of common stock in a publicly-held company, as well as certain private equity positions in non-marketable securities.
F-103
Table of Contents
The following tables provide a summary of changes in fair value of the Company’s level 3 assets and liabilities for the quarters and six months ended June 30, 2013 and 2012.
| (Dollars in thousands) |
Medallion Loans |
Commercial Loans |
Investment in Medallion Bank & Other Controlled Subs |
Equity Investments |
Other Assets |
|||||||||||||||
| March 31, 2013 |
$ | 288,873 | $ | 62,096 | $ | 98,973 | $ | 4,378 | $ | — | ||||||||||
| Gains (losses) included in earnings |
— | (62 | ) | 3,438 | 755 | — | ||||||||||||||
| Purchases, investments, and issuances |
68,060 | 2,515 | 803 | 1,500 | — | |||||||||||||||
| Sales, maturities, settlements, and distributions |
(62,904 | ) | (5,320 | ) | (2,852 | ) | (162 | ) | — | |||||||||||
|
|
|
|
|
|
|
|
|
|
|
|||||||||||
| June 30, 2013 |
$ | 294,029 | $ | 59,229 | $ | 100,362 | $ | 6,471 | $ | — | ||||||||||
|
|
|
|
|
|
|
|
|
|
|
|||||||||||
| Amounts related to held assets(1) |
$ | — | ($ | 66 | ) | $ | 3,438 | $ | 755 | $ | — | |||||||||
|
|
|
|
|
|
|
|
|
|
|
|||||||||||
| (1) | Total realized and unrealized gains (losses) included in income for the period which relate to assets held as of June 30, 2013. |
| (Dollars in thousands) |
Medallion Loans |
Commercial Loans |
Investment in Medallion Bank & Other Controlled Subs |
Equity Investments |
Other Assets |
|||||||||||||||
| December 31, 2012 |
$ | 294,388 | $ | 56,919 | $ | 99,083 | $ | 4,389 | $ | — | ||||||||||
| Gains (losses) included in earnings |
40 | (75 | ) | 7,406 | 744 | — | ||||||||||||||
| Purchases, investments, and issuances |
123,914 | 7,316 | 1,656 | 1,500 | — | |||||||||||||||
| Sales, maturities, settlements, and distributions |
(124,313 | ) | (6,301 | ) | (6,432 | ) | (162 | ) | — | |||||||||||
| Transfers in (out)(1) |
— | 1,370 | (1,370 | ) | — | — | ||||||||||||||
|
|
|
|
|
|
|
|
|
|
|
|||||||||||
| June 30, 2013 |
$ | 294,029 | $ | 59,229 | $ | 100,343 | $ | 6,471 | $ | — | ||||||||||
|
|
|
|
|
|
|
|
|
|
|
|||||||||||
| Amounts related to held assets(2) |
$ | — | ($ | 116 | ) | $ | 7,406 | $ | 744 | $ | — | |||||||||
|
|
|
|
|
|
|
|
|
|
|
|||||||||||
| (1) | During the six months ended June 30, 2013 $1,370 of investments in Medallion Fine Art, Inc. as reclassified as a loan. |
| (2) | Total realized and unrealized gains (losses) included in income for the period which relate to assets held as of June 30, 2013. |
| (Dollars in thousands) |
Medallion Loans |
Commercial Loans |
Investment in Medallion Bank & Other Controlled Subs |
Equity Investments |
Other Assets |
|||||||||||||||
| March 31, 2012 |
$ | 291,025 | $ | 56,111 | $ | 88,207 | $ | 5,242 | $ | — | ||||||||||
| Gains (losses) included in earnings |
— | (22 | ) | 4,467 | 228 | — | ||||||||||||||
| Purchases, investments, and issuances |
29,038 | 3,746 | 1,556 | — | — | |||||||||||||||
| Sales, maturities, settlements, and distributions |
(42,307 | ) | (5,555 | ) | (5,195 | ) | (321 | ) | — | |||||||||||
|
|
|
|
|
|
|
|
|
|
|
|||||||||||
| June 30, 2012 |
$ | 277,756 | $ | 54,280 | $ | 89,035 | $ | 5,149 | $ | — | ||||||||||
|
|
|
|
|
|
|
|
|
|
|
|||||||||||
| Amounts related to held assets(1) |
$ | — | ($ | 27 | ) | $ | 4,467 | ($ | 93 | ) | $ | — | ||||||||
|
|
|
|
|
|
|
|
|
|
|
|||||||||||
| (2) | Total realized and unrealized gains (losses) included in income for the period which relate to assets held as of June 30, 2012. |
F-104
Table of Contents
| (Dollars in thousands) |
Medallion Loans |
Commercial Loans |
Investment in Medallion Bank & Other Controlled Subs |
Equity Investments |
Other Assets |
|||||||||||||||
| December 31, 2011 |
$ | 307,167 | $ | 54,159 | $ | 85,932 | $ | 4,346 | $ | — | ||||||||||
| Gains (losses) included in earnings |
— | (674 | ) | 8,367 | 374 | — | ||||||||||||||
| Purchases, investments, and issuances |
58,274 | 8,290 | 1,931 | 750 | — | |||||||||||||||
| Sales, maturities, settlements, and distributions |
(87,685 | ) | (7,495 | ) | (7,195 | ) | (321 | ) | — | |||||||||||
|
|
|
|
|
|
|
|
|
|
|
|||||||||||
| June 30, 2012 |
$ | 277,756 | $ | 54,280 | $ | 89,035 | $ | 5,149 | $ | — | ||||||||||
|
|
|
|
|
|
|
|
|
|
|
|||||||||||
| Amounts related to held assets(1) |
$ | — | ($ | 686 | ) | $ | 8,367 | $ | 53 | $ | — | |||||||||
|
|
|
|
|
|
|
|
|
|
|
|||||||||||
| (1) | Total realized and unrealized gains (losses) included in income for the period which relate to assets held as of June 30, 2012. |
(13) SUBSEQUENT EVENTS
We have evaluated subsequent events that have occurred through August 6, 2013, the date of financial statement issuance.
On July 25, 2013 Freshstart accepted an $8,000,000 commitment from the SBA to purchase debentures until September 30, 2017 upon payment of 1% fee, which was paid and of which $3,150,000 will be issued on September 1, 2013 to redeem maturing debentures.
On July 24, 2013, the Company’s board of directors declared a $0.22 per share common stock dividend, payable on August 23, 2013 to shareholders of record on August 16, 2013.
On July 31, 2013 and July 16, 2013, the Company entered into $20,000,000 and $25,000,000 revolving credit agreements for a one year term and a three year term, respectively, with regional banks, to be secured by medallion loans, with rates, terms, and conditions that are generally comparable to other existing bank lines.
F-105
Table of Contents
Medallion Financial Corp.
Consolidated Summary Schedule of Investments
June 30, 2013
| (Dollars in thousands) |
Obligor Name/Interest Rate Range |
Security Type (all restricted unless otherwise noted) |
Acquisition Date |
Maturity Date |
# of Invest. |
% of Net Assets |
Interest Rate(1) |
Original Cost of 2013 Acquisitions(5) |
Cost(4) | Fair Value |
||||||||||||||||||||||||
| Medallion Loans |
||||||||||||||||||||||||||||||||||
| New York |
374 | 92 | % | 3.58 | % | $ | 97,706 | $ | 204,578 | $ | 204,472 | |||||||||||||||||||||||
| Sean Cab Corp ## |
Term Loan | 12/9/2011 | 12/08/15 | 1 | 2 | % | 3.60 | % | $ | 3,631 | $ | 3,613 | ||||||||||||||||||||||
| Real Cab Corp |
Term Loan | 7/20/2007 | 07/20/17 | 1 | 1 | % | 2.81 | % | $ | 2,545 | $ | 2,545 | ||||||||||||||||||||||
| Real Cab Corp |
Term Loan | 7/20/2007 | 07/20/17 | 1 | * | 2.81 | % | $ | 350 | $ | 350 | |||||||||||||||||||||||
| Sifnos, Van-Dim, Kitriani Incs ## |
Term Loan | 6/8/2010 | 05/01/15 | 1 | 1 | % | 4.00 | % | $ | 2,492 | $ | 2,479 | ||||||||||||||||||||||
| Whispers Taxi Inc ## |
Term Loan | 5/28/2013 | 05/28/16 | 1 | 1 | % | 3.35 | % | $ | 2,197 | $ | 2,197 | $ | 2,188 | ||||||||||||||||||||
| Slo Cab Corp |
Term Loan | 7/20/2007 | 07/20/17 | 1 | 1 | % | 2.81 | % | $ | 1,527 | $ | 1,527 | ||||||||||||||||||||||
| Slo Cab Corp |
Term Loan | 7/20/2007 | 07/20/17 | 1 | * | 2.81 | % | $ | 210 | $ | 210 | |||||||||||||||||||||||
| Lety Cab Corp ## |
Term Loan | 10/21/2010 | 10/20/15 | 1 | 1 | % | 3.13 | % | $ | 1,582 | $ | 1,574 | ||||||||||||||||||||||
| Nancy Transit Inc ## |
Term Loan | 3/11/2013 | 03/11/16 | 1 | 1 | % | 3.50 | % | $ | 1,575 | $ | 1,566 | $ | 1,562 | ||||||||||||||||||||
| Bunty & Jyoti Inc ## |
Term Loan | 3/13/2013 | 03/13/16 | 1 | 1 | % | 3.75 | % | $ | 1,575 | $ | 1,567 | $ | 1,561 | ||||||||||||||||||||
| Junaid Trans Corp ## |
Term Loan | 4/30/2013 | 04/30/16 | 1 | 1 | % | 3.75 | % | $ | 1,550 | $ | 1,543 | $ | 1,537 | ||||||||||||||||||||
| Christian Cab Corp |
Term Loan | 11/27/2012 | 11/27/15 | 1 | 1 | % | 4.00 | % | $ | 1,500 | $ | 1,501 | ||||||||||||||||||||||
| Benson Hacking Corp ## |
Term Loan | 5/28/2013 | 05/28/16 | 1 | 1 | % | 3.35 | % | $ | 1,465 | $ | 1,465 | $ | 1,460 | ||||||||||||||||||||
| Dayna Hacking Corp ## |
Term Loan | 5/28/2013 | 05/28/16 | 1 | 1 | % | 3.35 | % | $ | 1,465 | $ | 1,465 | $ | 1,460 | ||||||||||||||||||||
| Devin Taxi Corp ## |
Term Loan | 5/28/2013 | 05/28/16 | 1 | 1 | % | 3.35 | % | $ | 1,465 | $ | 1,465 | $ | 1,460 | ||||||||||||||||||||
| Silke Hacking Corp |
Term Loan | 6/28/2013 | 06/28/16 | 1 | 1 | % | 2.90 | % | $ | 1,450 | $ | 1,450 | $ | 1,452 | ||||||||||||||||||||
| Hoyt Cab Corp ## |
Term Loan | 12/26/2012 | 12/26/15 | 1 | 1 | % | 3.50 | % | $ | 1,450 | $ | 1,452 | ||||||||||||||||||||||
| Sonu-Seema Corp ## |
Term Loan | 12/7/2012 | 12/07/15 | 1 | 1 | % | 3.75 | % | $ | 1,431 | $ | 1,425 | ||||||||||||||||||||||
| S600 Service Co Inc ## |
Term Loan | 2/21/2013 | 02/21/16 | 1 | 1 | % | 3.00 | % | $ | 1,396 | $ | 1,382 | $ | 1,377 | ||||||||||||||||||||
| Perem Hacking Corp ## |
Term Loan | 2/21/2013 | 02/21/16 | 1 | 1 | % | 3.00 | % | $ | 1,396 | $ | 1,381 | $ | 1,376 | ||||||||||||||||||||
| Daytona Hacking Corp |
Term Loan | 6/28/2013 | 06/28/16 | 1 | 1 | % | 2.90 | % | $ | 1,364 | $ | 1,364 | $ | 1,366 | ||||||||||||||||||||
| Uddin Taxi Corp ## |
Term Loan | 11/14/2012 | 11/14/15 | 1 | 1 | % | 5.25 | % | $ | 1,368 | $ | 1,362 | ||||||||||||||||||||||
| Nosilla Service Co., Inc ## |
Term Loan | 2/21/2013 | 02/21/16 | 1 | 1 | % | 3.00 | % | $ | 1,333 | $ | 1,320 | $ | 1,315 | ||||||||||||||||||||
| Anniversary Taxi Corp ## | Term Loan | 5/17/2013 | 05/17/16 | 1 | 1 | % | 3.50 | % | $ | 1,300 | $ | 1,300 | $ | 1,295 | ||||||||||||||||||||
| Apple Cab Corp ## | Term Loan | 5/17/2013 | 05/17/16 | 1 | 1 | % | 3.50 | % | $ | 1,300 | $ | 1,300 | $ | 1,295 | ||||||||||||||||||||
| Kby Taxi Inc ## |
Term Loan | 5/17/2013 | 05/17/16 | 1 | 1 | % | 3.50 | % | $ | 1,300 | $ | 1,300 | $ | 1,295 | ||||||||||||||||||||
| Various New York && |
2.22% to 10.13% |
Term Loan | 12/20/00 to 06/28/13 |
07/01/13 to 09/10/23 |
348 | 74 | % | 3.62 | % | $ | 75,575 | $ | 164,427 | $ | 164,435 | |||||||||||||||||||
| Chicago |
98 | 18 | % | 5.00 | % | $ | 23,859 | $ | 39,260 | $ | 39,296 | |||||||||||||||||||||||
| Cozy Cab Et Al ## |
Term Loan | 12/22/2011 | 12/22/14 | 1 | 1 | % | 5.50 | % | $ | 3,347 | $ | 3,327 | ||||||||||||||||||||||
| Sweetgrass Peach &Chadwick Cap ## |
Term Loan | 8/28/2012 | 08/28/15 | 1 | 1 | % | 5.50 | % | $ | 1,718 | $ | 1,708 | ||||||||||||||||||||||
| Chicago Medallion Nine LLC ## | Term Loan | 5/2/2012 | 05/02/17 | 1 | 1 | % | 5.75 | % | $ | 1,392 | $ | 1,384 | ||||||||||||||||||||||
| Various Chicago |
3.75% to 8.50% | Term Loan | 01/22/10 to 06/28/13 |
03/10/14 to 06/28/18 |
95 | 15 | % | 4.89 | % | $ | 23,859 | $ | 32,803 | $ | 32,877 | |||||||||||||||||||
| Newark |
5.00% to 8.00% | Term Loan | 12/07/06 to 06/13/13 |
07/08/13 to 01/10/23 |
98 | 9 | % | 5.98 | % | $ | 7,411 | $ | 19,109 | $ | 19,210 | |||||||||||||||||||
| Boston && |
54 | 10 | % | 5.26 | % | $ | 4,810 | $ | 21,975 | $ | 22,014 | |||||||||||||||||||||||
| Ngozi Trans Inc. |
Term Loan | 12/31/2012 | 12/31/15 | 1 | * | 4.50 | % | $ | 652 | $ | 654 | |||||||||||||||||||||||
| Ngozi Trans Inc. ## |
Term Loan | 4/20/2012 | 04/20/15 | 1 | * | 5.50 | % | $ | 364 | $ | 365 | |||||||||||||||||||||||
| Ngozi Trans Inc. |
Term Loan | 12/31/2012 | 12/31/15 | 1 | * | 4.50 | % | $ | 326 | $ | 328 | |||||||||||||||||||||||
| Chidi Trans Inc ## |
Term Loan | 11/17/2011 | 11/17/14 | 1 | * | 6.00 | % | $ | 694 | $ | 691 | |||||||||||||||||||||||
| Chidi Trans Inc |
Term Loan | 4/20/2012 | 04/20/15 | 1 | * | 5.50 | % | $ | 645 | $ | 646 | |||||||||||||||||||||||
| Various Boston && 4.00% to 7.25% | Term Loan | 06/12/07 to 04/05/13 |
07/24/13 to 06/12/18 |
49 | 9 | % | 5.26 | % | $ | 4,810 | $ | 19,294 | $ | 19,330 | ||||||||||||||||||||
| Cambridge |
4.00% to 7.40% | Term Loan | 01/29/10 to 05/13/13 |
07/29/13 to 11/18/20 |
17 | 3 | % | 5.40 | % | $ | 1,632 | $ | 5,745 | $ | 5,762 | |||||||||||||||||||
| Other |
14 | 1 | % | 6.40 | % | $ | 689 | $ | 3,279 | $ | 3,275 | |||||||||||||||||||||||
| Philadelphia |
Dorit Matityahu ## | Term Loan | 8/4/2011 | 08/04/14 | 1 | 1 | % | 6.25 | % | $ | 2,103 | $ | 2,093 | |||||||||||||||||||||
| Various Other |
5.00% to 11.50% |
Term Loan | 11/26/07 to 04/23/13 |
08/17/13 to 04/28/18 |
13 | 1 | % | 6.68 | % | $ | 689 | $ | 1,176 | $ | 1,182 | |||||||||||||||||||
|
|
|
|
|
|
|
|
|
|
|
|
|
|||||||||||||||||||||||
| Total medallion loans ($231,045 pledged as collateral under borrowing arrangements) |
655 | 132 | % | 4.12 | % | $ | 136,107 | $ | 293,946 | $ | 294,029 | |||||||||||||||||||||||
|
|
|
|
|
|
|
|
|
|
|
|
|
|||||||||||||||||||||||
F-106
Table of Contents
Medallion Financial Corp.
Consolidated Summary Schedule of Investments
June 30, 2013
| (Dollars in thousands) |
Obligor Name/Interest Rate Range |
Security Type (all restricted unless otherwise noted) |
Acquisition Date |
Maturity Date |
# of Invest. |
% of Net Assets |
Interest Rate(1) |
Original Cost of 2013 Acquisitions(5) |
Cost(4) | Fair Value |
||||||||||||||||||||||||
| Commercial Loans | ||||||||||||||||||||||||||||||||||
| Secured mezzanine (37% Minnesota, 10% North Carolina, 8% New York, 8% Texas, |
| |||||||||||||||||||||||||||||||||
| 7% California, 7% Wisconsin, 6% Oklahoma, 5% Arizona, 5% Florida and 7% all other states)(2) |
| |||||||||||||||||||||||||||||||||
| Aeration & (interest rate includes PIK interest of 21.00%) (capitalized interest of $81 per footnote 2) |
Term Loan | 12/31/10 | Matured | 1 | 1 | % | 21.00 | % | $ | 2,416 | $ | 2,185 | ||||||||||||||||||||||
| Bluff Manufacturing (interest rate includes PIK interest of 3.50%) |
Term Loan | 12/14/12 | 12/14/17 | 1 | 1 | % | 15.50 | % | $ | 3,000 | $ | 3,010 | ||||||||||||||||||||||
| Dynamic Systems (interest rate includes PIK interest of 3.50%) (capitalized interest of $66 per footnote 2) |
Term Loan | 12/23/10 | 12/23/17 | 1 | 1 | % | 15.50 | % | $ | 1,891 | $ | 1,891 | ||||||||||||||||||||||
| Orchard & |
Term Loan | 03/10/99 | Matured | 1 | 1 | % | 13.00 | % | $ | 1,390 | $ | 1,390 | ||||||||||||||||||||||
| + |
PACA Foods & |
Term Loan | 12/31/10 | 12/31/15 | 1 | 1 | % | 13.00 | % | $ | 2,500 | $ | 1,898 | |||||||||||||||||||||
| + |
Packaging Specialists (interest rate includes PIK interest of 6.00%) (capitalized interest of $224 per footnote 2) |
Term Loan | 04/01/08 | 12/31/13 | 1 | 1 | % | 14.00 | % | $ | 2,214 | $ | 2,214 | |||||||||||||||||||||
| Process Fab & (interest rate includes PIK interest of 8.00%) |
Term Loan | 04/17/08 | 12/31/15 | 1 | 1 | % | 8.00 | % | $ | 4,500 | $ | 2,820 | ||||||||||||||||||||||
| Quaker Bakery (interest rate includes PIK interest of 5.00%) (capitalized interest of $171 per footnote 2) |
Term Loan | 03/28/12 | 03/28/17 | 1 | 1 | % | 17.00 | % | $ | 2,771 | $ | 2,761 | ||||||||||||||||||||||
| + |
RespirTech |
Term Loan | 04/25/12 | 04/25/17 | 1 | 1 | % | 12.00 | % | $ | 1,500 | $ | 1,509 | |||||||||||||||||||||
| +
|
Various Other && 12.00% to 14.00% |
Term Loan | 12/15/04 to 07/17/12 |
Matured to 07/17/17 |
4 | 2 | % | 13.17 | % | $ | 3,708 | $ | 3,721 | |||||||||||||||||||||
| Professional, Scientific, and Technical Services (13% of the total) |
Barton Walter (interest rate includes PIK interest of 3.00%) (capitalized interest of $30 per footnote 2) |
Term Loan | 01/15/13 | 01/15/18 | 1 | 1 | % | 15.00 | % | $ | 2,600 | $ | 2,630 | $ | 2,634 | |||||||||||||||||||
| + |
Portu-Sunberg |
Term Loan | 12/31/12 | 12/31/17 | 1 | 1 | % | 12.00 | % | $ | 2,500 | $ | 2,512 | |||||||||||||||||||||
| Various Other && 10.00% (capitalized interest of $72 per footnote 2) |
Term Loan | 10/26/11 | 11/01/14 | 1 | * | 10.00 | % | $ | 72 | $ | 72 | |||||||||||||||||||||||
| Administrative and Support Services (12% of the total) + |
Staff One & (interest rate includes PIK interest of 13.00%) |
Term Loan | 09/15/11 | 12/31/14 | 1 | * | 13.00 | % | $ | 615 | $ | 615 | ||||||||||||||||||||||
| + |
Staff One & (interest rate includes PIK interest of 13.00%) |
Term Loan | 06/30/08 | 12/31/14 | 1 | 1 | % | 13.00 | % | $ | 3,306 | $ | 1,856 | |||||||||||||||||||||
| Verifications |
Term Loan | 09/06/12 | 09/06/17 | 1 | 1 | % | 12.00 | % | $ | 2,500 | $ | 2,515 | ||||||||||||||||||||||
| Various Other && 0.00% (capitalized interest of $44 per footnote 2) |
Term Loan | 01/14/05 | Matured | 1 | * | 0.00 | % | $ | 792 | $ | 0 | |||||||||||||||||||||||
| Arts, Entertainment, and Recreation (10% of the total) |
RPAC Racing (interest rate includes PIK interest of 10.00%) (capitalized interest of $892 per footnote 2) |
Term Loan | 11/19/10 | 11/19/15 | 1 | 2 | % | 10.00 | % | $ | 3,931 | $ | 3,931 | |||||||||||||||||||||
| Information (4% of the total) |
US Internet |
Term Loan | 06/12/13 | 06/12/20 | 1 | 1 | % | 14.50 | % | $ | 3,000 | $ | 1,500 | $ | 1,513 | |||||||||||||||||||
| Health Care and Social Assistance (2% of the total) + |
Various Other && 7.00% |
Term Loan | 06/28/07 | 06/30/17 | 1 | * | 7.00 | % | $ | 1,148 | $ | 918 | ||||||||||||||||||||||
| Accommodation and Food Services (2% of the total) |
Various Other && 9.25% to 10.00% (capitalized interest of $74 per footnote 2) |
Term Loan | 06/30/00 to 11/05/10 |
10/01/15 to 11/05/15 |
3 | * | 9.85 | % | $ | 2,777 | $ | 728 | ||||||||||||||||||||||
| Retail Trade (0% of the total) |
Various Other && 10.00% |
Term Loan | 06/30/00 | 10/01/15 | 1 | * | 10.00 | % | $ | 539 | $ | 163 | ||||||||||||||||||||||
|
|
|
|
|
|
|
|
|
|
|
|
|
|||||||||||||||||||||||
| Total secured mezzanine(2) |
27 | 18 | % | 12.68 | % | $ | 5,600 | $ | 48,200 | $ | 40,856 | |||||||||||||||||||||||
|
|
|
|
|
|
|
|
|
|
|
|
|
|||||||||||||||||||||||
F-107
Table of Contents
Medallion Financial Corp.
Consolidated Summary Schedule of Investments
June 30, 2013
| (Dollars in thousands) |
Obligor Name/Interest Rate Range |
Security Type (all restricted unless otherwise noted) |
Acquisition Date |
Maturity Date |
# of Invest. |
% of Net Assets |
Interest Rate(1) |
Original Cost of 2013 Acquisitions(5) |
Cost(4) | Fair Value | ||||||||||||||||||||||
| Asset-based (70% New York, 21% New Jersey and 9% all other states) |
||||||||||||||||||||||||||||||||
| Wholesale Trade (51% of the total) |
||||||||||||||||||||||||||||||||
| Capitalsea, LLC ## |
Revolving line of credit | 11/07/05 | 11/07/13 | 1 | 1 | % | 4.50 | % | $ | 1,352 | $ | 1,338 | ||||||||||||||||||||
| Various Other && 4.75% to 6.75% ## |
Revolving line of credit | 01/23/99 to 06/01/12 |
08/15/13 to 06/01/14 |
9 | 1 | % | 5.78 | % | $ | 2,221 | $ | 2,140 | ||||||||||||||||||||
| Transportation and Warehousing (18% of the total) |
Various Other && 5.75% to 8.00% ## |
Revolving line of credit | 12/31/01 to 07/20/07 |
07/20/13 to 05/02/14 |
5 | 1 | % | 6.25 | % | $ | 1,283 | $ | 1,230 | |||||||||||||||||||
| Retail Trade (10% of the total) |
Various Other 4.75% to 6.31% ## |
Revolving line of credit | 10/19/98 to 08/31/06 |
07/24/13 to 12/21/13 |
5 | * | 5.44 | % | $ | 683 | $ | 675 | ||||||||||||||||||||
| Finance and Insurance (7% of the total) |
Various Other && 4.25% to 8.25% |
Revolving line of credit | 02/06/02 to 11/10/11 |
07/25/13 to 02/14/14 |
6 | * | 6.25 | % | $ | 659 | $ | 509 | ||||||||||||||||||||
| Manufacturing (7% of the total) |
Various Other 5.75% to 6.50% ## |
Revolving line of credit | 07/07/04 to 06/22/10 |
07/07/13 to 06/22/14 |
5 | * | 6.25 | % | $ | 526 | $ | 507 | ||||||||||||||||||||
| Construction (4% of the total) |
Various Other 5.75% to 6.25% ## |
Revolving line of credit | 07/20/99 to 02/26/13 |
07/20/13 to 02/26/14 |
2 | * | 6.38 | % | $ | 363 | $ | 284 | $ | 275 | ||||||||||||||||||
| Administrative and Support Services (3% of the total) |
Various Other 5.50% to 5.75% |
Revolving line of credit | 06/22/04 to 06/30/07 |
06/22/14 to 06/30/14 |
2 | * | 5.64 | % | $ | 205 | $ | 201 | ||||||||||||||||||||
| Health Care and Social Assistance (0% of the total) |
Various Other 5.75% 5.80% ## |
Revolving line of credit | 10/02/07 to 11/09/12 |
10/02/13 to 11/09/13 |
2 | * | 5.42 | % | ($ | 6 | ) | ($ | 12 | ) | ||||||||||||||||||
|
|
|
|
|
|
|
|
|
|
|
|
|
|||||||||||||||||||||
| Total asset-based ($4,515 pledged as collateral under borrowing arrangements) |
37 | 3 | % | 5.69 | % | $ | 363 | $ | 7,207 | $ | 6,863 | |||||||||||||||||||||
|
|
|
|
|
|
|
|
|
|
|
|
|
|||||||||||||||||||||
| Other secured commercial (76% New York, 23% New Jersey, 1% Illinois) |
||||||||||||||||||||||||||||||||
| Retail Trade (64% of the total) |
Medallion Fine Art Inc (includes rate includes PIK interest of 12.00% | Term Loan | 12/17/12 | 12/17/17 | 1 | 2 | % | 12.00 | % | $ | 3,647 | $ | 3,647 | |||||||||||||||||||
| (capitalized interest of $147 per footnote 2) | * | |||||||||||||||||||||||||||||||
| Various Other && 0.00% to 12.00% | Term Loan | 09/13/06 to 05/09/13 |
09/16/13 to 01/09/20 |
14 | 2 | % | 8.99 | % | $ | 650 | $ | 3,994 | $ | 3,742 | ||||||||||||||||||
| Accommodation and Food Services (31% of the total) |
Dune Deck Owners Corp ## | Term Loan | 4/24/2007 | 3/31/2014 | 1 | 1 | % | 7.25 | % | $ | 3,078 | $ | 3,078 | |||||||||||||||||||
| Various Other 7.50% to 10.50% && | Term Loan | 05/25/05 to 07/29/08 |
03/18/14 to 03/25/15 |
3 | * | 8.61 | % | $ | 584 | $ | 521 | |||||||||||||||||||||
| Other Services (except Public Administration) (2% of the total) |
Various Other 5.50% to 6.50% | Term Loan | 01/16/04 to 05/02/09 |
01/16/14 to 05/02/14 |
2 | * | 5.81 | % | $ | 186 | $ | 186 | ||||||||||||||||||||
F-108
Table of Contents
Medallion Financial Corp.
Consolidated Summary Schedule of Investments
June 30, 2013
| (Dollars in thousands) |
Obligor Name/Interest Rate Range |
Security Type (all restricted unless otherwise noted) |
Acquisition Date |
Maturity Date |
# of Invest. |
% of Net Assets |
Interest Rate(1) |
Original Cost of 2013 Acquisitions(5) |
Cost(4) | Fair Value |
||||||||||||||||||||||
| Real Estate and Rental and Leasing (2% of the total) |
Various Other 4.75% to 6.00% | Term Loan | 04/22/99 to 04/01/10 |
04/01/15 to 09/01/15 |
2 | * | 5.29 | % | $ | 184 | $ | 185 | ||||||||||||||||||||
| Health Care and Social Assistance (1% of the total) |
Various Other 7.50% to 7.50% | Term Loan | 05/14/13 to 05/14/13 |
05/14/18 to 05/14/18 |
1 | * | 7.50 | % | $ | 150 | $ | 148 | $ | 150 | ||||||||||||||||||
| Transportation and Warehousing (0% of the total) |
Various Other 6.50% 6.50% | Term Loan | 12/02/10 12/02/10 |
11/22/13 11/22/13 |
1 | * | 6.50 | % | $ | 1 | $ | 1 | ||||||||||||||||||||
|
|
|
|
|
|
|
|
|
|
|
|
|
|||||||||||||||||||||
| Total other secured commercial loans ($3,078 pledged as collateral under borrowing arrangements) |
25 | 5 | % | 9.32 | % | $ | 800 | $ | 11,822 | $ | 11,510 | |||||||||||||||||||||
|
|
|
|
|
|
|
|
|
|
|
|
|
|||||||||||||||||||||
| Total commercial loans ($7,593 pledged as collateral under borrowing arrangements)(2) |
89 | 27 | % | 11.34 | % | $ | 6,763 | $ | 67,229 | $ | 59,229 | |||||||||||||||||||||
|
|
|
|
|
|
|
|
|
|
|
|
|
|||||||||||||||||||||
| Investment in Medallion Bank and other controlled subsidiaries |
|
|||||||||||||||||||||||||||||||
| Commercial Banking |
Medallion Bank ** | 100% of common stock | 05/16/02 | None | 1 | 42 | % | 12.23 | % | $ | 94,049 | $ | 94,049 | |||||||||||||||||||
| Art Dealer |
Medallion Fine Art, Inc. | 100% of common stock | 12/03/12 | None | 1 | 1 | % | 0.00 | % | $ | 1,240 | $ | 1,240 | |||||||||||||||||||
| Real Estate |
Medallion Hamptons Holding LLC | 100% of membership interests |
06/21/05 | None | 1 | 2 | % | 0.00 | % | $ | 3,750 | $ | 3,750 | |||||||||||||||||||
| Various Other |
12/20/04 to 5/23/12 |
None | 3 | 1 | % | 0.00 | % | $ | 1,304 | $ | 1,304 | |||||||||||||||||||||
|
|
|
|
|
|
|
|
|
|
|
|||||||||||||||||||||||
| Investment in Medallion Bank and other controlled subsidiaries, net |
6 | 45 | % | 11.46 | % | $ | 100,343 | $ | 100,343 | |||||||||||||||||||||||
|
|
|
|
|
|
|
|
|
|
|
|||||||||||||||||||||||
| Equity investments |
||||||||||||||||||||||||||||||||
| Commercial Finance |
Convergent Capital, Ltd | 7% of limited partnership interest |
07/20/07 | None | 1 | 1 | % | 0.00 | % | $ | 1,133 | $ | 1,882 | |||||||||||||||||||
| NASCAR Race Team |
Medallion MotorSports, LLC | 75% of limited liability interest |
11/24/10 | None | 1 | 1 | % | 0.00 | % | $ | 1,954 | $ | 1,954 | |||||||||||||||||||
| Bakery |
Quaker Bakery | * of senior preferred stock |
03/28/12 | None | 1 | * | 0.00 | % | $ | 359 | $ | 359 | ||||||||||||||||||||
| Equipment Manufacturing |
Aeration Industries International, LLC | 5.25% of limited liability interest |
12/31/10 | None | 1 | * | 0.00 | % | $ | 364 | $ | 0 | ||||||||||||||||||||
| Various Other |
** | * to 9.25% of common stock |
09/10/98 to 3/30/12 |
None | 5 | 1 | % | 2.76 | % | $ | 2,104 | $ | 2,544 | |||||||||||||||||||
|
|
|
|
|
|
|
|
|
|
|
|||||||||||||||||||||||
| Equity investments, net |
9 | 3 | % | 0.98 | % | $ | 5,914 | $ | 6,739 | |||||||||||||||||||||||
|
|
|
|
|
|
|
|
|
|
|
|||||||||||||||||||||||
| Investment securities |
||||||||||||||||||||||||||||||||
| Investment securities, net |
0 | 0 | % | 0.00 | % | $ | 0 | $ | 0 | |||||||||||||||||||||||
|
|
|
|
|
|
|
|
|
|
|
|
|
|||||||||||||||||||||
| Net Investments ($238,638 pledged as collateral under borrowing arrangements)(3) |
759 | 206 | % | 6.69 | % | $ | 142,870 | $ | 467,432 | $ | 460,340 | |||||||||||||||||||||
|
|
|
|
|
|
|
|
|
|
|
|
|
|||||||||||||||||||||
| (1) | Represents the actual or weighted average interest or dividend rate of the respective security or portfolio as of the date indicated. Investments without an interest rate or with a rate of 0.00% are considered non-income producing. |
| (2) | Included in secured mezzanine commercial loans and other commercial loans was $1,855 of interest income capitalized into the outstanding investment balances, in accordance with the terms of the investment contract. |
| (3) | The ratio of restricted securities fair value to net assets is 206%. |
F-109
Table of Contents
Medallion Financial Corp.
Consolidated Summary Schedule of Investments
June 30, 2013
| (4) | Gross unrealized appreciation, gross unrealized depreciation, and net appreciation for federal income tax purposes totaled $42,720, $13,814 and $28,906, respectively. The tax cost of investments was $431,434. |
| (5) | For revolving lines of credit the amount shown is the cost at June 30, 2013. |
| * | Less than 1.0% |
| ** | Not an eligible portfolio company as such term is defined in Section 2(a)(46) of the 1940 Act. The percentage value of all non-eligible portfolio companies to totaled assets of Medallion Financial on an unconsolidated basis was up to 25% and up to 27% on a consolidated basis. |
| & | Loan is on nonaccrual status, or past due on contractual payments, and is therefore considered non-income producing. |
| && | Some or all of the securities are non-income producing as per & above. |
| # | Publicly traded but sales subject to applicable Rule 144 limitations. |
| ## | Pledged as collateral under borrowing arrangements. |
| + | Includes various warrants, all of which have a cost and fair value of zero at June 30, 2013. |
The Summary Schedule of Investments does not reflect the Company’s complete portfolio holdings. It includes the Company’s 50 largest holdings and each investment of any issuer that exceeds 1% of the Company’s net assets. “Various Other” represents all issues not required to be disclosed under the rules adopted by the U.S. Securities and Exchange Commission (“SEC”). Footnotes above may apply to securities that are included in “Various Other”. For further detail, the complete schedule of portfolio holdings is available (i) without charge, upon request, by calling (877) MEDALLION; and (ii) on the SEC’s website at http://www.sec.gov.
F-110
Table of Contents
Medallion Financial Corp.
Consolidated Schedule of Investments In and Advances to Affiliates
As Of And For the Quarter Ended 6/30/2013
| Name of issuer and title of issue |
Number of shares (all restricted |
Equity in net profit and (loss) for the three months ended June 30, 2013 |
Equity in net profit and (loss) for the six months ended June 30, 2013 |
Amount of dividends or interest(1) for the three months ended June 30, 2013 |
Amount of dividends or interest(1) for the six months ended June 30, 2013 |
Value as of 6/30/13 |
||||||||||||||||
| (Dollars in thousands) | ||||||||||||||||||||||
| Medallion Bank—common stock |
1,000,000 shares—100% of common stock | 3,247 | 7,832 | 2,500 | 5,500 | $ | 94,048 | |||||||||||||||
| Medallion Hamptons Holding LLC—membership interest |
100% of membership interest | 869 | 869 | 0 | 0 | $ | 3,750 | |||||||||||||||
| Medallion Fine Art, Inc.—common stock(2) |
1,000 shares—100% of common stock | (155 | ) | (232 | ) | 0 | 0 | $ | 1,240 | |||||||||||||
| LAX Group LLC—membership interest |
42% of membership interest | (133 | ) | (93 | ) | 0 | 0 | $ | 585 | |||||||||||||
| Medallion Servicing Corp.—common stock |
1,000 shares—100% of common stock | (430 | ) | (750 | ) | 0 | 0 | $ | 571 | |||||||||||||
| Generation Outdoor, Inc.—common stock |
1,000 shares—100% of common stock | 40 | (220 | ) | 5 | 11 | $ | 149 | ||||||||||||||
|
|
|
|
|
|
|
|
|
|
|
|||||||||||||
| Total investments in Medallion Bank and other controlled subsidiaries |
3,438 | 7,406 | 2,505 | 5,511 | $ | 100,343 | ||||||||||||||||
|
|
|
|
|
|
|
|
|
|
|
|||||||||||||
| Medallion Motor Sports, LLC—membership interest |
75% of membership interest | 0 | 0 | 0 | 0 | $ | 1,954 | |||||||||||||||
| Appliance Recycling Centers of America Inc—common stock |
8% of common stock | 0 | 0 | 0 | 0 | $ | 1,073 | |||||||||||||||
| Summit Medical, Inc—common stock |
9.25% of common stock | 0 | 0 | 0 | 0 | $ | 135 | |||||||||||||||
| Aeration Industries International LLC—membership interest |
5.25% of membership interest | 0 | 0 | 0 | 0 | $ | 0 | |||||||||||||||
| Other equity investments other than in investments in and advances to affiliates |
— | — | — | — | $ | 3,577 | ||||||||||||||||
|
|
|
|
|
|
|
|
|
|
|
|||||||||||||
| Total equity investments |
0 | 0 | 0 | 0 | $ | 6,739 | ||||||||||||||||
|
|
|
|
|
|
|
|
|
|
|
|||||||||||||
| Total investments in Medallion Bank and other controlled subsidiaries and equity investments |
3,438 | 7,406 | 2,505 | 5,511 | $ | 107,082 | ||||||||||||||||
|
|
|
|
|
|
|
|
|
|
|
|||||||||||||
| Other interest and dividend income other than from investments in and advances to affiliates |
|
7 | 18 | |||||||||||||||||||
|
|
|
|
|
|||||||||||||||||||
| Total dividend and interest income on short term investments |
|
2,512 | 5,529 | |||||||||||||||||||
|
|
|
|
|
|||||||||||||||||||
| Total investments in and advances to affiliates |
|
$ | 103,505 | |||||||||||||||||||
| Other equity investments other than in investments in and advances to affiliates |
|
$ | 3,577 | |||||||||||||||||||
|
|
|
|||||||||||||||||||||
| Total investments in Medallion Bank and other controlled subsidiaries and equity investments |
|
$ | 107,082 | |||||||||||||||||||
|
|
|
|||||||||||||||||||||
| (1) | Investments with an amount of 0 are considered non-income producing. |
| (2) | Additionally, the Company has a loan due from Medallion Fine Art, Inc in the amount of $3,647 as of June 30, 2013. |
F-111
Table of Contents
The table below provides a recap of the changes in the investment in the respective issuers for the 2013 quarters.
| Value as of 12/31/12 |
Gross Additions / Investments |
Gross Reductions / Distributions |
Net equity earnings in profit and loss, unrealized appreciation and depreciation |
Other Adjustments |
Values as of 3/31/13 |
Gross Additions / Investments |
Gross Reductions / Distributions |
Net equity earnings in profit and loss, unrealized appreciation and depreciation |
Other Adjustments |
Value as of 6/30/13 |
||||||||||||||||||||||||||||||||||
| (Dollars in thousands) | ||||||||||||||||||||||||||||||||||||||||||||
| Medallion Bank—common stock |
$ | 92,169 | 0 | 3,275 | 4,585 | — | $ | 93,479 | 2,678 | 3,247 | $ | 94,048 | ||||||||||||||||||||||||||||||||
| Medallion Hamptons Holding LLC—membership interest |
$ | 2,696 | 65 | 0 | 0 | — | $ | 2,761 | 120 | 869 | $ | 3,750 | ||||||||||||||||||||||||||||||||
| Medallion Motor Sports, LLC—membership interest |
$ | 454 | 0 | 0 | — | — | $ | 454 | 1,500 | — | $ | 1,954 | ||||||||||||||||||||||||||||||||
| Medallion Fine Art, Inc.—common stock(1) |
$ | 2,843 | 0 | 1,370 | (77 | ) | — | $ | 1,396 | (155 | ) | (1 | ) | $ | 1,240 | |||||||||||||||||||||||||||||
| Appliance Recycling Centers of America Inc—common stock |
$ | 579 | 0 | 0 | (11 | ) | — | $ | 568 | 505 | $ | 1,073 | ||||||||||||||||||||||||||||||||
| LAX Group LLC—membership interest |
$ | 461 | — | 0 | 39 | — | $ | 500 | 218 | (133 | ) | $ | 585 | |||||||||||||||||||||||||||||||
| Medallion Servicing Corp.—common stock |
$ | 613 | 426 | 100 | (320 | ) | — | $ | 619 | 400 | 18 | (430 | ) | $ | 571 | |||||||||||||||||||||||||||||
| Generation Outdoor, Inc.—common stock |
$ | 301 | 377 | 200 | (260 | ) | — | $ | 218 | 65 | 175 | 40 | 1 | $ | 149 | |||||||||||||||||||||||||||||
| (1) | Additionally, the Company has made a loan to Medallion Fine Art, Inc in the amount of $3,647 as of June 30, 2013, the full amount of which was advanced during the six months ended June 30, 2013. |
F-112
Table of Contents
PRELIMINARY PROSPECTUS
$100,000,000
Common Stock
Preferred Stock
Debt Securities
Subscription Rights
Warrants
Dealer Prospectus Delivery Obligation
Until [ ], all dealers that effect transactions in these securities, whether or not participating in this offering, may be required to deliver a prospectus. This is in addition to the dealers’ obligation to deliver a prospectus when acting as underwriters and with respect to their unsold allotments or subscriptions.
Table of Contents
PART C
Other Information
| ITEM 25. | FINANCIAL STATEMENTS AND EXHIBITS |
(1) Financial Statements
(2) Exhibits
| Number | Description | |
| a.1 | Restated Medallion Financial Corp. Certificate of Incorporation. Filed as Exhibit 2(a) to our Registration Statement on Form N-2 (File No. 333-1670) and incorporated by reference herein. | |
| a.2 | Amendment to Restated Certificate of Incorporation. Filed as Exhibit 3.1.1 to the Quarterly Report on Form 10-Q for the quarterly period ended June 30, 1998 (File No. 814-00188) and incorporated by reference herein. | |
| b. | Restated By-Laws. Filed as Exhibit (b) to our Registration Statement on Form N-2 (File No. 333-1670) and incorporated by reference herein. | |
C-1
Table of Contents
| Number | Description | |
| c. | Not applicable. | |
| d.1 | Instruments defining the rights of holders of securities. See Restated Certificate of Incorporation. Filed as Exhibit 2(a) to our Registration Statement on Form N-2 (File No. 333-1670) and incorporated by reference herein. | |
| d.2 | Instruments defining the rights of holders of securities. See Amendment to Restated Certificate of Incorporation. Filed as Exhibit 3.1.1 to the Quarterly Report on Form 10-Q for the quarterly period ended June 30, 1998 (File No. 814-00188) and incorporated by reference herein. | |
| d.3 | Instruments defining the rights of holders of securities. See Restated By-Laws. Filed as Exhibit (b) to our Registration Statement on Form N-2 (File No. 333-1670) and incorporated by reference herein. | |
| e. | Dividend Reinvestment Plan. Filed as Exhibit (e) to the Post-Effective Amendment No. 1 to our Registration Statement on Form N-2 (File No. 333-178644) and incorporated by reference herein. | |
| f. | Not applicable. | |
| g. | Not applicable. | |
| h.** | Form of Underwriting Agreement. | |
| i.1 | First Amended and Restated Employment Agreement, between Medallion Financial Corp. and Alvin Murstein dated May 29, 1998. Filed as Exhibit 10.19 to the Annual Report on Form 10-K for the fiscal year ended December 31, 1998 (File No. 814-00188) and incorporated by reference herein. | |
| i.2 | First Amended and Restated Employment Agreement, between Medallion Financial Corp. and Andrew M. Murstein dated May 29, 1998. Filed as Exhibit 10.20 to the Annual Report on Form 10-K for the fiscal year ended December 31, 1998 (File No. 814-00188) and incorporated by reference herein. | |
| i.3 | Employment Agreement, between Medallion Financial Corp. and Michael Kowalsky dated August 3, 2006. Filed as Exhibit 10.1 to the Current Report on Form 8-K filed on August 4, 2006 (File No. 814-0018) and incorporated by reference herein. | |
| i.4 | Medallion Financial Corp. Amended and Restated 1996 Stock Option Plan. Filed as Exhibit 10.1 to the Quarterly Report on Form 10-Q for the quarterly period ended June 30, 2002 (File No. 814-0018) and incorporated by reference herein. | |
| i.5 | 2006 Employee Stock Option Plan. Filed as Exhibit II to our definitive proxy statement for our 2006 Annual Meeting of Shareholders filed on April 28, 2006 (File No. 814-0018) and incorporated by reference herein. | |
| i.6 | First Amended and Restated 2006 Non-Employee Director Stock Option Plan. Filed as Exhibit B to Amendment No. 3 to Form 40-APP filed on June 18, 2012 (File No. 812-13666) and incorporated by reference herein. | |
| i.7 | Medallion Funding Corp. 401(k) Savings Plan. Filed as Exhibit (i.2) to our Registration Statement on Form N-2A (File No. 333-1670) and incorporated by reference herein. | |
| i.8 | 2009 Employee Restricted Stock Plan. Filed as Exhibit I to our definitive proxy statement for our 2010 Annual Meeting of Shareholders filed on April 29, 2010 (File No. 814-0018) and incorporated by reference herein. | |
| j.1 | Custodian Agreement, effective July 23, 2003, among Wells Fargo Bank Minnesota, National Association, as custodian, and Medallion Financial Corp., Medallion Funding Corp. and Freshstart Venture Capital Corp.† | |
C-2
Table of Contents
| Number | Description | |
| j.2 | Custodial Agreement, dated as of December 12, 2008, among DZ Bank AG Deutsche Zentral-Genossenschaftsbank, Frankfurt am Main, Taxi Medallion Loan Trust III, Wells Fargo Bank, National Association, and Medallion Funding Corp.† | |
| k.1 | Indenture of Lease, dated October 31, 1997, by and between Sage Realty Corporation, as Agent and Landlord, and Medallion Financial Corp., as Tenant. Filed as Exhibit 10.64 to the Annual Report on Form 10-K for the fiscal year ended December 31, 1997 (File No. 814-0018) and incorporated by reference herein. | |
| k.2 | First Amendment of Lease, dated September 6, 2005, by and between Medallion Financial Corp. and Sage Realty Corporation. Filed as Exhibit 10.1 to the Current Report on Form 8-K filed on September 12, 2005 (File No. 814-0018) and incorporated by reference herein. | |
| k.3 | Commitment Letter, dated March 1, 2006, by the Small Business Administration to Medallion Capital, Inc., accepted and agreed to by Medallion Capital, Inc. on March 8, 2006. Filed as Exhibit 4.1 to the Current Report on Form 8-K filed on March 9, 2006 (File No. 000-27812) and incorporated by reference herein. | |
| k.4 | Commitment Letter, dated September 20, 2006, by the Small Business Administration to Freshstart Venture Capital Corp., accepted and agreed to by Freshstart Venture Capital Corp. on October 10, 2006. Filed as Exhibit 10.1 to the Current Report on Form 8-K filed on October 11, 2006 (File No. 814-00188) and incorporated by reference herein. | |
| k.5 | Commitment Letter, dated September 1, 2010, by the Small Business Administration to Medallion Capital, Inc., accepted and agreed to by Medallion Capital, Inc. on September 7, 2010. Filed as Exhibit 10.2 to the Current Report on Form 8-K filed on September 13, 2010 (File No. 814-00188) and incorporated by reference herein. | |
| k.6 | Commitment Letter, dated September 1, 2010, by the Small Business Administration to Freshstart Venture Capital Corp., accepted and agreed to by Freshstart Venture Capital Corp. on September 8, 2010. Filed as Exhibit 10.1 to the Current Report on Form 8-K filed on September 13, 2010 (File No. 814-00188) and incorporated by reference herein. | |
| k.7 | Commitment Letter, dated January 25, 2013, by the Small Business Administration to Medallion Capital, Inc., accepted and agreed to by Medallion Capital, Inc. on January 28, 2013. Filed as Exhibit 10.1 to the Current Report on Form 8-K filed on January 30, 2013 (File No. 814-00188) and incorporated by reference herein. | |
| k.8 | Commitment Letter, dated February 6, 2013, by the Small Business Administration to Freshstart Venture Capital Corp., accepted and agreed to by Freshstart Venture Capital Corp. on February 13, 2013. Filed as Exhibit 10.1 to the Current Report on Form 8-K filed on February 14, 2013 (File No. 814-00188) and incorporated by reference herein. | |
| k.9 | Commitment Letter, dated July 29, 2013, by the Small Business Administration to Freshstart Venture Capital Corp., accepted and agreed to by Freshstart Venture Capital Corp. on August 1, 2013. Filed as Exhibit 10.1 to the Current Report on Form 8-K filed on August 5, 2013 (File No. 814-00188) and incorporated by reference herein. | |
| k.10 | Fixed/Floating Rate Junior Subordinated Note, dated June 7, 2007, by Medallion Financial Corp., in favor of Medallion Financing Trust I. Filed as Exhibit 4.1 to the Current Report on Form 8-K filed on June 11, 2007 (File No. 814-00188) and incorporated by reference herein. | |
| k.11 | Junior Subordinated Indenture, dated as of June 7, 2007, between Medallion Financing Trust I and Wilmington Trust Company as trustee. Filed as Exhibit 10.1 to the Current Report on Form 8-K filed on June 11, 2007 (File No. 814-00188) and incorporated by reference herein. | |
C-3
Table of Contents
| Number | Description | |
| k.12 | Amended and Restated Trust Agreement, dated as of June 7, 2007, among Medallion Financial Corp. as depositor, Wilmington Trust Company as property trustee and Delaware trustee and the Administrative Trustees named therein. Filed as Exhibit 10.2 to the Current Report on Form 8-K filed on June 11, 2007 (File No. 814-00188) and incorporated by reference herein. | |
| k.13 | Purchase Agreement, dated as of June 7, 2007, among Medallion Financial Corp., Medallion Financing Trust I, and Merrill Lynch International. Filed as Exhibit 10.3 to the Current Report on Form 8-K filed on June 11, 2007 (File No. 814-00188) and incorporated by reference herein. | |
| k.14 | Loan and Security Agreement, dated as of December 12, 2008, among Taxi Medallion Loan Trust III, Autobahn Funding Company LLC, as Lender, and DZ Bank AG Deutsche Zentral-Genossenschaftsbank, Frankfurt am Main, as Agent. Filed as Exhibit 10.1 to the Current Report on Form 8-K filed on December 16, 2008 (File No. 814-00188) and incorporated by reference herein. | |
| k.15 | Amendment No. 1 to Loan and Security Agreement, dated as of August 5, 2009, by and among Taxi Medallion Loan Trust III, Autobahn Funding Company LLC, as Lender, and DZ Bank AG Deutsche Zentral-Genossenschaftsbank, Frankfurt am Main, as Agent. Filed as Exhibit 10.1 to the Current Report on Form 8-K filed on August 10, 2009 (File No. 814-00188) and incorporated by reference herein. | |
| k.16 | Servicing Agreement, dated as of December 12, 2008, by and among Taxi Medallion Loan Trust III, Medallion Funding Corp., and DZ Bank AG Deutsche Zentral-Genossenschaftsbank, Frankfurt am Main. Filed as Exhibit 10.2 to the Current Report on Form 8-K filed on December 16, 2008 (File No. 814-00188) and incorporated by reference herein. | |
| k.17 | Loan Sale and Contribution Agreement, dated December 12, 2008, by and between Medallion Funding Corp. and Taxi Medallion Loan Trust III. Filed as Exhibit 10.3 to the Current Report on Form 8-K filed on December 16, 2008 (File No. 814-00188) and incorporated by reference herein. | |
| k.18 | Amended and Restated Trust Agreement, dated as of December 12, 2008, by and between Medallion Funding Corp. and U.S. Bank Trust, N.A. Filed as Exhibit 10.4 to the Current Report on Form 8-K filed on December 16, 2008 (File No. 814-00188) and incorporated by reference herein. | |
| k.19 | Limited Recourse Guaranty, dated as of December 12, 2008, by Medallion Funding Corp., in favor of Autobahn Funding Company LLC, as Lender, and DZ Bank AG Deutsche Zentral-Genossenschaftsbank, Frankfurt am Main, as Agent. Filed as Exhibit 10.5 to the Current Report on Form 8-K filed on December 16, 2008 (File No. 814-00188) and incorporated by reference herein. | |
| k.20 | Performance Guaranty, dated as of December 12, 2008, by Medallion Financial Corp., in favor of Taxi Medallion Loan Trust III, Autobahn Funding Company LLC, as Lender, and DZ Bank AG Deutsche Zentral-Genossenschaftsbank, Frankfurt am Main, as Agent. Filed as Exhibit 10.6 to the Current Report on Form 8-K filed on December 16, 2008 (File No. 814-00188) and incorporated by reference herein. | |
| k.21 | Reaffirmation Agreement, dated as of February 26, 2010, by and among Medallion Funding LLC, Taxi Medallion Loan Trust III, DZ Bank AG Deutsche Zentral-Genossenschaftsbank, Frankfurt am Main, in its capacity as Agent, and Wells Fargo Bank, National Association. Filed as Exhibit 10.2 to the Current Report on Form 8-K filed on March 5, 2010 (File No. 814-00188) and incorporated by reference herein. | |
| k.22 | Amended and Restated Loan and Security Agreement, dated as of March 28, 2011, by and among Medallion Financial Corp., Medallion Funding LLC and Sterling National Bank. Filed as Exhibit 10.1 to the Current Report on Form 8-K filed on April 1, 2011 (File No. 814-00188) and incorporated by reference herein. | |
| k.23 | Amended and Restated Unlimited Guaranty, dated March 28, 2011, by Medallion Funding LLC, in favor of Sterling National Bank. Filed as Exhibit 10.2 to the Current Report on Form 8-K filed on April 1, 2011 (File No. 814-00188) and incorporated by reference herein. | |
C-4
Table of Contents
| Number | Description | |
| k.24 | First Amendment to Amended and Restated Loan and Security Agreement, dated September 1, 2011, by and among Medallion Financial Corp., Medallion Funding LLC and Sterling National Bank. Filed as Exhibit 10.1 to the Current Report on Form 8-K filed on September 7, 2011 (File No. 814-00188) and incorporated by reference herein. | |
| k.25 | Second Amendment to Amended and Restated Loan and Security Agreement, dated January 8, 2013, by and among Medallion Financial Corp., Medallion Funding LLC and Sterling National Bank. Filed as Exhibit 10.1 to the Current Report on Form 8-K filed on January 11, 2013 (File No. 814-00188) and incorporated by reference herein. | |
| l. | Opinion of Willkie Farr & Gallagher LLP and consent to its use.† | |
| m. | Not applicable. | |
| n.1* | Consent of WeiserMazars LLP, independent registered public accounting firm. | |
| n.2* | Opinion of WeiserMazars LLP, independent registered public accounting firm, regarding “Senior Securities” table contained herein. | |
| o. | Not applicable. | |
| p. | Not applicable. | |
| q. | Not applicable. | |
| r. | Code of Ethical Conduct and Insider Trading Policy.† | |
| * | Filed herewith. |
| ** | To be filed by amendment. |
| † | Previously filed |
| ITEM 26. | MARKETING ARRANGEMENTS |
The information contained under the heading “Plan of Distribution” on this Registration Statement is incorporated herein by reference and any information concerning any underwriters for a particular offering will be contained in the prospectus supplement related to that offering.
| ITEM 27. | OTHER EXPENSES OF ISSUANCE AND DISTRIBUTION* |
| Commission registration fee |
$ | 11,460 | ||
| NASDAQ Listing Fee |
** | |||
| NASD filing fee |
** | |||
| Accounting fees and expenses |
** | |||
| Legal fees and expenses |
** | |||
| Printing and engraving |
** | |||
| Registrar and transfer agent’s fees |
** | |||
| Miscellaneous fees and expenses |
** | |||
|
|
|
|||
| Total |
$ | ** | ||
|
|
|
| * | Estimated for filing purposes. |
| ** | To be filed by amendment. |
All of the expenses set forth above shall be borne by us.
C-5
Table of Contents
| ITEM 28. | PERSONS CONTROLLED BY OR UNDER COMMON CONTROL |
| Name |
Percentage of Voting Securities Owned By Us |
Jurisdiction of Organization | ||||
| Medallion Funding LLC(1) |
100 | % | New York | |||
| Medallion Capital, Inc.(1) |
100 | % | Minnesota | |||
| Freshstart Venture Capital Corp.(1) |
100 | % | New York | |||
| Medallion Bank(2) |
100 | % | Utah | |||
| Generation Outdoor, Inc.(2) |
100 | % | Delaware | |||
| Medallion Hamptons Holding LLC(2) |
100 | % | Delaware | |||
| Taxi Medallion Loan Trust III(1) |
100 | % | Delaware | |||
| Medallion Servicing Corp.(2) |
100 | % | Delaware | |||
| Medallion Fine Art, Inc.(2) |
100 | % | Delaware | |||
| LAX Group, LLC(2) |
42 | % | Delaware | |||
| (1) | These subsidiaries are included in our Consolidated Financial Statements. |
| (2) | These subsidiaries are not included in our Consolidated Financial Statements because Securities and Exchange Commission regulations prohibit the consolidation of non-investment companies with investment companies. |
ITEM 29. NUMBER OF HOLDERS OF SECURITIES
The following table sets forth the approximate number of record holders of our common stock as of September 19, 2013.
| Title of Class |
NUMBER OF RECORD HOLDERS |
|||
| Common stock, $0.01 par value |
253 | |||
| ITEM 30. | INDEMNIFICATION |
Section 145 of the DGCL grants us the power to indemnify each person who was or is a party or is threatened to be made a party to any threatened, pending or completed action, suit or proceeding, whether civil, criminal, administrative or investigative by reason of the fact that he is or was our director, officer, employee or agent, or is or was serving at our request as a director, officer, employee or agent of another corporation, partnership, joint venture, trust or other enterprise, against expenses (including attorneys’ fees), judgments, fines and amounts paid in settlement actually and reasonably incurred by him in connection with such action, suit or proceeding if he acted in good faith and in a manner he reasonably believed to be in or not opposed to our best interests, and, with respect to any criminal action or proceeding, had no reasonable cause to believe his conduct was unlawful, provided, however, no indemnification shall be made in connection with any proceeding brought by or in our right where the person involved is adjudged to be liable to us except to the extent approved by a court. Article TENTH of our certificate of incorporation as currently in effect provides that we shall, to the fullest extent permitted by the DGCL, as amended from time to time, indemnify each person who was or is a party or is threatened to be made a party to any threatened, pending or completed action, suit or proceeding by reason of the fact that he is or was, or has agreed to become, our director or officer, or is or was serving, or has agreed to serve, at our request, as a director, officer or trustee of, or in a similar capacity with, another corporation, partnership, joint venture, trust or other enterprise. The indemnification provided for in Article TENTH is expressly not exclusive of any other rights to which those seeking indemnification may be entitled under any law, agreement or vote of shareholders or disinterested directors or otherwise, and shall inure to the benefit of the heirs, executors and administrators of such persons. Article TENTH permits the Board of Directors to authorize the grant of indemnification rights to our other employees and agents and such rights may be equivalent to, or greater or less than, those set forth in Article TENTH.
C-6
Table of Contents
Article V, Section 2 of our by-laws provides that we shall have the power to purchase and maintain insurance on behalf of any person who is or was our director, officer, employee or agent, or is or was serving at our request, as a director, officer or trustee of, or in a similar capacity with, another corporation, partnership, joint venture, trust or other enterprise, against any liability asserted against and incurred by such person in any such capacity.
Pursuant to Section 102(b)(7) of the DGCL, Article NINTH of our certificate of incorporation eliminates a director’s personal liability for monetary damages to us and its shareholders for breaches of fiduciary duty as a director, except to the extent that the elimination or limitation of liability is not then permitted under the DGCL.
Our by-laws and certificate of incorporation provide indemnification to the maximum extent permitted by Delaware law and the 1940 Act.
We have agreed to indemnify the Underwriters against certain liabilities, including liabilities under the Securities Act of 1933, or to contribute to payments that the Underwriters may be required to make in respect thereof.
Insofar as indemnification for liabilities arising under the Securities Act of 1933 may be permitted to our directors, officers and controlling persons pursuant to the provisions described above, or otherwise, we have been advised that in the opinion of the SEC such indemnification is against public policy as expressed in the Securities Act of 1933 and is, therefore, unenforceable. In the event that a claim for indemnification against such liabilities (other than the payment by us of expenses incurred or paid by a director, officer or controlling person in the successful defense of an action, suit or proceeding) is asserted by a director, officer or controlling person in connection with the securities being registered, we will, unless in the opinion of its counsel the matter has been settled by controlling precedent, submit to a court of appropriate jurisdiction the question whether such indemnification by it is against public policy as expressed in the Securities Act of 1933 and will be governed by the final adjudication of such issue.
| ITEM 31. | BUSINESS AND OTHER CONNECTIONS OF INVESTMENT ADVISER |
Not Applicable.
| ITEM 32. | LOCATION OF ACCOUNTS AND RECORDS |
All accounts, books and other documents required to be maintained by Section 31(a) of the 1940 Act, pursuant to Section 64 of the 1940 Act, and the rules thereunder are maintained at the offices of:
| (1) | Medallion Financial Corp., 437 Madison Avenue, 38th Floor, New York, New York 10022; |
| (2) | the transfer agent, American Stock Transfer & Trust Company, LLC, 6201 15th Avenue, Brooklyn, New York 11219; and |
| (3) | the custodian, Wells Fargo Bank, National Association, 1055 Tenth Avenue S.E., Minneapolis, Minnesota 55414. |
| ITEM 33. | MANAGEMENT SERVICES |
Not Applicable.
| ITEM 34. | UNDERTAKINGS |
1. We undertake to suspend the offering of the securities until the prospectus is amended if (1) subsequent to the effective date of its registration statement, the net asset value declines more than ten percent from its net asset value as of the effective date of the registration statement; or (2) the net asset value increases to an amount greater than the net proceeds as stated in the prospectus.
C-7
Table of Contents
2. We undertake:
(a) to file, during any period in which offers or sales are being made, a post-effective amendment to this Registration Statement:
(i) to include any prospectus required by Section 10(a)(3) of the Securities Act of 1933;
(ii) to reflect in the prospectus any facts or events arising after the effective date of this Registration Statement (or the most recent post-effective amendment thereof) which, individually or in the aggregate, represent a fundamental change in the information set forth in this Registration Statement.; and
(iii) to include any material information with respect to the plan of distribution not previously disclosed in this Registration Statement or any material change to such information in the Registration Statement;
(b) that for the purpose of determining any liability under the Securities Act of 1933, each such post-effective amendment shall be deemed to be a new registration statement relating to the securities offered therein, and the offering of those securities at that time shall be deemed to be the initial bona fide offering thereof; and
(c) to remove from registration by means of a post-effective amendment any of the securities being registered which remain unsold at the termination of the offering.
3. We undertake:
(a) that for the purpose of determining any liability under the Securities Act of 1933, the information omitted from the form of prospectus filed as part of this Registration Statement in reliance upon Rule 430A and contained in a form of prospectus filed by the Registrant pursuant to Rule 497(h) under the Securities Act of 1933 shall be deemed to be part of this Registration Statement as of the time it was declared effective; and
(b) that for the purpose of determining any liability under the Securities Act of 1933, each post-effective amendment that contains a form of prospectus shall be deemed to be a new registration statement relating to the securities offered therein, and the offering of the securities at that time shall be deemed to be the initial bona fide offering thereof.
C-8
Table of Contents
SIGNATURES
Pursuant to the requirements of the Securities Act of 1933, the Registrant has duly caused this Registration Statement on Form N-2 to be signed on its behalf by the undersigned, thereunto duly authorized, in the City of New York, and the State of New York, on the 20th day of September, 2013.
| MEDALLION FINANCIAL CORP. | ||
| By: | /S/ ALVIN MURSTEIN | |
| Chairman and Chief Executive Officer | ||
Pursuant to the requirements of the Securities Act of 1933, this registration statement has been signed by the following persons in the capacities and on the dates indicated.
| Signatures |
Title |
Date | ||
| /S/ ALVIN MURSTEIN Alvin Murstein |
Chairman of the Board of Directors and Chief Executive Officer (Principal Executive Officer) |
September 20, 2013 | ||
| /S/ LARRY D. HALL Larry D. Hall |
Senior Vice President and Chief Financial Officer (Principal Financial and Accounting Officer) |
September 20, 2013 | ||
| /S/ ANDREW M. MURSTEIN Andrew M. Murstein |
President and Director |
September 20, 2013 | ||
| * Henry L. Aaron |
Director |
September 20, 2013 | ||
| * Mario M. Cuomo |
Director |
September 20, 2013 | ||
| * Henry D. Jackson |
Director |
September 20, 2013 | ||
| * Stanley Kreitman |
Director |
September 20, 2013 | ||
| * Frederick A. Menowitz |
Director |
September 20, 2013 | ||
| * David L. Rudnick |
Director |
September 20, 2013 | ||
| * Lowell P. Weicker, Jr. |
Director |
September 20, 2013 | ||
| *By: | /S/ ALVIN MURSTEIN | |
| Alvin Murstein | ||
| /S/ ANDREW M. MURSTEIN | ||
| Andrew M. Murstein As Attorneys-In-Fact | ||
C-9
Table of Contents
EXHIBIT INDEX
| Number | Description | |
| n.1 | Consent of WeiserMazars LLP, independent registered public accounting firm. | |
| n.2 | Opinion of WeiserMazars LLP, independent registered public accounting firm, regarding “Senior Securities” table contained herein. | |