Table of Contents
INTERIM REPORT JANUARY — JUNE 2013
HELPING THE WORLD RUN BETTER

|
THE BEST-RUN BUSINESSES RUN SAP™ |
Table of Contents
INTERIM REPORT JANUARY — JUNE 2013
| 3 | ||||
| HALF-YEAR FINANCIAL STATEMENTS (UNAUDITED) |
||||
| 4 | ||||
| 25 | ||||
| 52 | ||||
| SUPPLEMENTARY FINANCIAL INFORMATION (UNAUDITED) |
||||
| 53 | ||||
| 59 | ||||
| ADDITIONAL INFORMATION |
||||
| Financial Calendar, Investor Services, Addresses, and Imprint |
60 | |||
Table of Contents
This interim group report meets the requirements of German Accounting Standard No. 16 “Zwischenberichterstattung” (DRS 16). We prepared the financial data in the Quarterly Half-Year Financial Statements (Unaudited) section for SAP AG and its subsidiaries in accordance with International Financial Reporting Standards (IFRS). In doing so, we observed the IFRS (including the interpretations by the International Financial Reporting Interpretations Committee (IFRIC)) both as issued by the International Accounting Standards Board (IASB) and as endorsed by the European Union (EU). This does not apply to numbers expressly identified as non-IFRS. For additional IFRS and non-IFRS information, see the Supplementary Financial Information (Unaudited) section.
This interim group report complies with the legal requirements in accordance with the German Securities
Trading Act (Wertpapierhandelsgesetz, WpHG) for a half-year financial report, and comprises the interim
management report, consolidated interim financial statements, and the responsibility
statement in accordance with the German Securities Trading Act, section 37w (2).
This half-year financial report updates our consolidated financial statements 2012, presents significant events and transactions of the second quarter 2013 and the first half of 2013, and updates the forward-looking information contained in our Management Report 2012. Both the 2012 consolidated financial statements and the 2012 Management Report are part of our 2012 Integrated Report which is available at www.sapintegratedreport.de.
All of the information in this interim group report is unaudited. This means the information has been subject neither to any audit nor to any review by an independent auditor.
| INTERIM REPORT JANUARY – JUNE 2013 | 3 |
Table of Contents
GENERAL INFORMATION
Forward-Looking Statements
This half-year financial report contains forward-looking statements and information based on the beliefs of, and assumptions made by, our management using information currently available to them. Any statements contained in this report that are not historical facts are forward-looking statements as defined in the U.S. Private Securities Litigation Reform Act of 1995. We have based these forward-looking statements on our current expectations, assumptions, and projections about future conditions and events. As a result, our forward-looking statements and information are subject to uncertainties and risks, many of which are beyond our control. If one or more of these uncertainties or risks materializes, or if management’s underlying assumptions prove incorrect, our actual results could differ materially from those described in or inferred from our forward-looking statements and information.
We describe these risks and uncertainties in the Risk and Opportunity Management section, respectively in the there-mentioned sources.
The words “aim,” “anticipate,” “assume,” “believe,” “continue,” “could,” “counting on,” “development,” “is confident,” “estimate,” “expect,” “forecast,” “future trends,” “guidance,” “intend,” “may,” “might,” “outlook,” “plan,” “project,” “predict,” “seek,” “should,” “strategy,” “want,” “will,” “would,” and similar expressions as they relate to us are intended to identify such forward-looking statements. Such statements include, for example, those made in the Operating Results section, the Risk and Opportunity Management section, our Forecast for SAP, and other forward-looking information appearing in other parts of this half-year financial report. To fully consider the factors that could affect our future financial results, both our Annual Report for December 31, 2012, (extract from the SAP Integrated Report 2012) and Annual Report on Form 20-F for December 31, 2012, should be considered, as well as all of our other filings with the Securities and Exchange Commission (SEC). Readers are cautioned not to place undue reliance on these forward-looking statements, which speak only as of the date specified or the date of this report. Except where legally required, we undertake no obligation to publicly update or revise any forward-looking statements as a result of new information that we receive about conditions that existed upon issuance of this report, future events, or otherwise unless we are required to do so by law.
Statistical Data
This report includes statistical data about the IT industry and global economic trends that comes from information published by sources including International Data Corporation (IDC), a provider of market information and advisory services for the information technology, telecommunications, and consumer technology markets; the European Central Bank (ECB); and the International Monetary Fund (IMF). This type of data represents only the estimates of IDC, ECB, IMF, and other sources of industry data. SAP does not adopt or endorse any of the statistical information provided by sources such as IDC, ECB, IMF, or other similar sources that is contained in this report. In addition, although we believe that data from these sources is generally reliable, this type of data is imprecise. We caution readers not to place undue reliance on this data.
All of the information in this report relates to the situation on June 30, 2013, or the half year ended on that date unless otherwise stated.
Non-IFRS Financial Information
This half-year financial report contains non-IFRS measures as well as financial data prepared in accordance with IFRS. We present and discuss the reconciliation of these non-IFRS measures to the respective IFRS measures in the Supplementary Financial Information (Unaudited) section. For more information about non-IFRS measures, see our Web site www.sap.com/corporate-en/investors/newsandreports/reporting-framework.epx under “Non-IFRS Measures and Estimates.”
| 4 | INTERIM MANAGEMENT REPORT |
Table of Contents
ECONOMIC CONDITIONS
Global Economic Trends
Figures published by the European Central Bank (ECB) indicate that the world economy picked up speed in the first half of 2013, but that the upswing on the whole remained cautious. While many emerging markets recorded more noticeable growth, the economies of most industrialized countries improved only slightly.
According to ECB, economic growth in the Europe, Middle East, and Africa (EMEA) region remained at a slightly negative level in the first two quarters of the year. This was mainly attributable to declining domestic demand and subdued exports. A moderate improvement was recorded in the Americas region, where a gradual increase in private domestic demand lifted a U.S. economy still suffering from government spending cuts. The Latin American economy continued to recover, but at a moderate pace. The Asia-Pacific-Japan (APJ) region, meanwhile, continued to develop very differently from country to country: Japan’s economy grew only marginally in the first half of the year, whereas the emerging and developing economies of Asia continued to perform very well. China, however, failed to reach its excellent growth rates of recent years.
The IT Market
In its current quarterly report, American market research firm International Data Corporation (IDC) reveals that global IT spending grew faster than the overall economy in the first half of 2013. However, growth slowed down. This was mostly due to developments in the hardware segment, such as declining PC sales and a drop in the prices for hardware. Thanks to significant double-digit growth in the mobile sector, however, the hardware segment was ultimately able to record an overall positive result. In the software segment, cloud and SaaS (Software as a Service) products increasingly outranked traditional software and service offerings when it came to IT spending.
The weak growth of the economy in the EMEA region impacted IT market growth, especially in Western and Southern Europe. The IT market in the Americas region – most notably in the United States – was also weaker than expected due to uncertainty about that country’s future economic and fiscal policy stance. The APJ region fared better than the global average, despite the fact that Japan posted continued weak IT sales as well as its economy as a whole showed weakness. Asia’s emerging and developing economies recorded comparatively higher IT revenues in the second quarter, although China – as well as for its economy as a whole – did not quite reach the same turnover rates as in recent years.
Impact on SAP
Companies are shifting their investments to the cloud and are radically simplifying their IT landscape on in-memory technology. While we are driving this fundamental industry transformation it has also impacted our business. SAP’s single-digit growth performance in software license and cloud subscription revenue was mainly due to the slowdown in our on-premise software revenue. This slowdown resulted from the combination of a challenging macroeconomic environment and the accelerating industry shift to the cloud, which is impacting traditional customer buying patterns. Our regional performance shows how SAP benefits by offering customers a seamless choice of software – on premise or in a public or private cloud with broad industry expertise and a broad ecosystem.
The Americas delivered a strong 18% growth rate in software and cloud subscription revenue. We are driving the transition to the cloud in North America, with cloud contributing more than 25% of our overall software and cloud subscription revenues this quarter. American companies are moving to the cloud faster and much more broadly than companies in other geographies, and we are benefiting from this shift.
We achieved excellent growth in Latin America both in our software and cloud business. While many tech companies saw a slowdown in Brazil, we performend very well in this market, with triple-digit software revenue growth. Clearly, customers are choosing SAP innovations to drive their growth agenda.
EMEA delivered a solid performance, with 3% growth in software and cloud subscription revenue, impressive in light of continued market uncertainty in Europe and a tough year-on-year comparison. We saw continued strong growth in our home market Germany, with high single-digit software revenue growth. We are growing in strong double-digits in Africa and the Middle East.
Our performance in APJ was below our expectations mainly due to continued macroeconomic challenges. This trend is also consistent with what our competitors and partners are experiencing in the market. In China, the GDP slowdown has impacted state-owned enterprise IT spending and our revenues from China were below expectations. Additionally we were impacted by the IT purchasing slowdown in Australia and Japan, two of our largest markets in the APJ region. On a positive note, our leadership changes in India and SE Asia had a strong impact, with strong software revenue growth in these regions.
VISION, MISSION, AND STRATEGY
We did not change our vision, mission, or strategy in the first six months of 2013. For a detailed description, see our 2012 Integrated Report and item 4 in our 2012 Annual Report on Form 20-F.
PORTFOLIO OF SOFTWARE AND SERVICES
In the first half of 2013, we made the following enhancements to our portfolio of software and services. For a detailed description of our complete portfolio, see our 2012 Integrated Report and item 4 in our 2012 Annual Report on Form 20-F.
| INTERIM REPORT JANUARY – JUNE 2013 | 5 |
Table of Contents
Our first half of 2013 was marked by SAPPHIRE NOW in Orlando, our premier business technology event for executives, lines of business, and IT decision makers. Many customers and partners took the stage to share how, together with SAP, they are reinventing their businesses and their industries with in-memory technology, cloud computing, and mobility. Major announcements included innovations for line-of-business cloud applications, our next generation user experience with SAP Fiori, the general availability of SAP Business Suite powered by SAP HANA, details of SAP HANA Enterprise Cloud, and the launch of our newest industry vertical, Sports & Entertainment.
Applications
SAP continued to innovate its leading applications portfolio in the first half of 2013, with particular focus on enabling the SAP Business Suite powered by SAP HANA, and delivering a consumer-grade user experience.
SAP Business Suite powered by SAP HANA, a new option for SAP Business Suite customers, was first introduced in January, and was announced as generally available at SAPPHIRE NOW in May together with the general availability of 21 industry solutions. SAP now provides an integrated family of business applications that captures and analyzes transactional data in real time on a single in-memory platform. SAP Business Suite powered by SAP HANA empowers customers to manage all mission-critical business processes such as planning, execution, reporting, and analysis in real time, by using the same relevant live data.
Customers of our applications for small and midsize enterprises can also benefit from the power of SAP HANA. In early March at CeBIT 2013 in Hanover, Germany, SAP announced SAP Business One, version for SAP HANA, the first business management solution for small and midsize enterprises (SMEs) that is run completely in-memory. The application is a scalable, affordable solution with embedded analytics capabilities and high-volume transactions that empower SMEs to run their businesses in real time.
We also made significant progress in enabling a rich user experience with the launch of two solutions:
| • | SAP Fiori is a collection of applications that provide an intuitive user experience. They access SAP software functions, across a variety of devices – desktop, tablet, smartphone. The first release of SAP Fiori includes 25 apps for the most common business functions, such as workflow approvals, information lookups and self-service tasks. |
| • | SAP Screen Personas provides a simple, drag and drop approach to modify most SAP GUI screens. It enables IT and business users to simplify business application screens quickly and easily without any programming knowledge. SAP Screen Personas improves the end-user productivity, visual appeal, and performance of SAP. |
At SAPPHIRE NOW in Orlando, SAP also introduced the SAP for Sports & Entertainment solution portfolio. As SAP’s 25th and newest vertical industry market solution, this portfolio is designed to help the sports and entertainment industry run better – from the fans, athletes, performers and the media to venues, teams, leagues and entertainment companies.
In early June, we announced that we are working with Microsoft to develop real-time incorporation of shop floor information using the SAP Manufacturing Integration and Intelligence (SAP MII) application and Microsoft Office 365, bringing greater manufacturing visibility to the flexible Microsoft Office solutions.
Industry Recognition:
SAP has been positioned by Forrester Research as a Global Power Seller in its “Global Banking Platform Deals in 2012” report. In the evaluation, Forrester recognized 39 new named deals closed by SAP in seven regions, ranking SAP as a top vendor for new banking deals.
SAP has also retained its position as the overall leader in worldwide supply chain management (SCM) according to the recent “Gartner, Market Share Analysis: Supply Chain Management Software, Worldwide, 2012” report.
Analytics
SAP continues to extend its leadership in analytics, enabling business users to turn big data into valuable information through self-service visualizations and predictive analytics. These capabilities help decision-makers quickly identify untapped opportunities and respond to unforeseen risks. At the same time, SAP aims to simplify IT landscapes with our leading enterprise business intelligence suite.
In June, at BI2013 in Amsterdam, SAP announced updates to predictive analytics software that empowers everyone – from sophisticated statisticians to business users – with predictive insight. Now generally available, version 1.0.11 of SAP Predictive Analysis software offers more flexible modeling and performance, which can help users uncover new opportunities from big data in real time. SAP Predictive Analysis includes features to expand predictive model execution to other SAP applications, including SAP Customer Relationship Management and SAP Fraud Management.
| 6 | INTERIM MANAGEMENT REPORT |
Table of Contents
The new version of the predictive analytics software can be combined with SAP Lumira, formerly known as SAP Visual Intelligence software. SAP Lumira enables business users to visualize any amount of data in real time, in a repeatable, self-service way. SAP Lumira Cloud, leveraging SAP HANA, extends SAP Lumira beyond the desktop to the cloud, for simple deployment.
At SAPPHIRE NOW, we introduced the 4.1 version of SAP BusinessObjects BI solutions. This release aims to empower business users with anytime, anywhere access to key insights delivered in context for increased responsiveness, reduced IT costs and workload, and better decision making across the enterprise.
In May, SAP announced a new initiative with Emerging Markets Private Equity Association (EMPEA), a community of more than 300 leading fund managers and institutional investors from nearly 60 countries and representing over US $1 trillion of managed assets. With analytics solutions donated by SAP, EMPEA can now offer both the general public and its members an interactive dashboard that allows investors, private equity fund managers, or governments to look closely at capital flows in emerging markets, identify trends and explore regional details. With better insight, they can make more informed decisions about how, where, and with whom to invest their money.
In February, SAP and the National Basketball Association (NBA) announced the launch of NBA Stats, providing fans with interactive access to official NBA statistics and analyses. Powered by the real-time SAP HANA platform and free to all fans and media, the NBA’s statistical offering will allow users to interact and analyze official league, team, and player statistics in real time through an intuitive, highly visual interface.
In January, we introduced an online analytics dashboard based on SAP HANA that provided National Football League (NFL) fans with insights into the selection of the NFL.com Fantasy Player of the Year for the 2012 season. The dashboard, now live at NFL.com/honors, displays the statistics of the top eight Fantasy Player finalists in a visually rich format.
Industry Recognition:
SAP has been positioned by Gartner as the leader in its “Market Share Analysis: Business Intelligence, Analytics and Performance Management, 2012” report, with a 22.1 percent market share. SAP was also recognized as a leader in the 2013 Gartner Magic Quadrant for Corporate Performance Management (CPM) Suites.
Forrester Research has ranked SAP Predictive Analysis as a leader in its “The Forrester Wave: Big Data Predictive Analytics Solutions, Q1 2013” report.
Cloud
The first half of 2013 brought announcements that further establish SAP’s position in the rapidly-growing cloud market. With over 30 million users in the cloud, SAP has the largest subscriber base in the cloud market.
In early May, SAP announced SAP HANA Enterprise Cloud, a managed cloud offering designed to provide organizations with the ability to deploy SAP HANA and SAP applications powered by SAP HANA quickly and securely via the cloud. SAP HANA Enterprise Cloud speeds up and simplifies deployment of the powerful in-memory database. The option to consume SAP HANA as-a-service means customers can reap the benefits of ‘Big Data’ free of the scalability constraints, the complexity associated with heterogeneous landscapes, and without significant upfront investments in hardware.
One week later, at SAPPHIRE NOW, we announced our unified strategy for SAP’s comprehensive cloud portfolio across four focus areas: People, Customer, Money, and Supplier. SAP’s cloud portfolio combines the proven depth of enterprise solutions and strong line-of-business focus with the speed and simplicity of the cloud. The portfolio includes solutions from SAP companies Ariba and SuccessFactors as well as the SAP Cloud for Customer (formerly SAP Customer OnDemand), SAP Cloud for Financials (formerly SAP Financials OnDemand,), SAP Cloud for Travel (formerly SAP Travel OnDemand), and SAP Business ByDesign solutions. We further announced that the SAP HANA Cloud platform will serve as the foundation for our entire cloud portfolio.
In May, we introduced the new SuccessFactors Onboarding solution. This solution’s capabilities outpace existing solutions in the market today because it has more guidance for hiring managers and richer socialization for new hires.
In January, SAP expanded its SAP PartnerEdge program, allowing us to offer a broader portfolio of SAP cloud solutions through our sales partners.
Industry Recognition:
SuccessFactors, an SAP company, became the first company in the human capital management (HCM) industry to be positioned as a leader in 10 industry analyst reports within the past year. Recognition was garnered based on the company’s comprehensive offerings across the full HCM landscape.
In the cloud-based collaborative commerce market, Ariba, an SAP company, was recognized as a leader for Sourcing and Vendor Management (SVM) tool sets in Forrester Research’s “The Forrester Wave: SVM Tool Set, Q1 2013” report. The citation is based on the firm’s evaluation of Ariba Sourcing, Ariba Contract Management, Ariba Supplier Information and Performance Management, and Ariba Spend Visibility.
| INTERIM REPORT JANUARY – JUNE 2013 | 7 |
Table of Contents
Mobile
SAP delivers new and better ways for customers to securely access data and business processes – from anywhere, at any time.
At SAPPHIRE NOW, we unveiled SAP Mobile Secure, an enterprise mobility management solution portfolio designed to provide customers with enterprise-grade security for devices, apps, and content. This new portfolio optimizes the mobile experience for users of today’s most popular mobile devices.
Also at SAPPHIRE NOW, we announced a partnership with Mocana, one of the fastest-growing global security platform startups, to resell the leading mobile security product Mocana Mobile App Protection (MAP).
In April, we announced a new rapid-deployment solution that simplifies access to analytics on mobile devices, enabling enterprise customers to put real-time insight in the hands of their workers for better, more informed decisions on the go. The SAP Mobile Analytics rapid-deployment solution offers preconfigured software, implementation services, content, and end-user enablement.
Also in April, at the utility customer service conference CS Week in Tampa, Florida, SAP announced the SAP Utilities Customer Engagement mobile app, which offers rich customer service capabilities and allows utility companies to improve relationships with customers while helping to reduce costs.
In February, at the 2013 Mobile World Congress (MWC) in Barcelona, Spain, SAP introduced the SAP Mobile Documents solution designed to meet the demand for simple, highly secure file synchronization and sharing in the enterprise. The new mobile content management solution provides a single point of entry to personal business documents and corporate content via any device.
Also at MWC, SAP announced the launch of the cloud-based SAP Rich Communication Services 365 (SAP RCS 365) mobile service. For mobile subscribers, RCS makes services such as instant messaging, video, and file sharing as simple and intuitive as sending a text message. In addition, it enables mobile operators to create new innovative services, respond to competition in today’s expanding mobile ecosystem, and increase potential revenue per subscriber.
Addressing the growing demand for machine-to-machine (M2M) applications, SAP and Ericsson took advantage of the MWC forum to announce an agreement to jointly market and sell cloud-based M2M solutions and services to enterprises via operators around the globe. The solutions will be based on a combined software-as-a-service (SaaS) offering from SAP and Ericsson, and will provide the infrastructure and business solutions for automatic data transmission between technical devices such as vehicles, freight containers, alarm systems, or vending machines.
Industry Recognition:
SAP has been positioned by Gartner in the leaders’ quadrant of the “Magic Quadrant for Mobile Device Management (MDM)” report. This makes SAP the only Leader recognized by Gartner in both Magic Quadrants related to Enterprise Mobility – Mobile Device Management (MDM) and Mobile Application Development Platforms (MADP).
IT market research advisory firm IDC has again recognized SAP as the market share leader based on 2012 revenue in the mobile enterprise management (MEM) enterprise software market. SAP has been recognized as a leader for the 12th consecutive year in the “Worldwide Mobile Enterprise Management Software 2012 – 2016 Forecast and Analysis and 2012 Vendor Shares” report for its SAP Mobile Secure portfolio.
Database and Technology
SAP innovations in database and technology, in particular SAP HANA, have captured the imagination of customers looking to re-invent their businesses as real-time enterprises. The first half of 2013 brought developments that solidify the place of these innovations at the very core of our portfolio.
At SAPPHIRE NOW 2013, SAP announced three major developments related to SAP HANA:
| • | Ecosystem innovation: Working together with a vibrant ecosystem, SAP aims to make it fast and easy for established partners, ISVs and new startups to build, market, and sell a diverse set of applications for customers of all sizes and across all industries. |
| • | Platform innovation: SAP unveiled a new SAP HANA smart data access technology to help enterprises dynamically derive real-time insights across heterogeneous sources such as Hadoop. New in-memory spatial capabilities in SAP HANA will help businesses uncover richer and meaningful signals from business and geospatial data. |
| • | Joint initiative with HP: The initiative focuses on SAP HANA, enabling customers to reduce the time required to rapidly transact, analyze, and process large amounts of data within a single server. A test system, built from years of HP server technology innovations and optimized with the in-memory SAP HANA database for SAP Business Suite, was demonstrated for the first time at SAPPHIRE NOW. |
In June, SAP Sybase IQ 16 software, a critical component of the SAP Real-Time Data Platform, achieved a Guinness World Record for loading and indexing big data with an audited result of 34.3 terabytes per hour, far surpassing the previous record of 14 terabytes per hour. The SAP Real-Time Data Platform combines SAP HANA with SAP Sybase IQ and other SAP technologies as well as with non-SAP technologies, especially Apache Hadoop.
| 8 | INTERIM MANAGEMENT REPORT |
Table of Contents
In April, SAP announced the availability of the SAP Sybase SQL Anywhere 16 suite, the latest release of data management and synchronization technology. A key element of and satellite server within the SAP Real-Time Data Platform, the suite helps extend business transactions to remote office locations.
Also in April, SAP announced the newest version of SAP Sybase Replication Server, a core component of the SAP Real-Time Data Platform that is designed to provide high-performance, secure and reliable delivery of data across the enterprise.
In late February, at the Strata Conference in California, SAP and Intel announced a technical and business partnership that will help organizations in data-intensive industries become more competitive and agile by leveraging insights across business operations from all their data assets at the pace of business. The two companies plan to build and bring to market a breakthrough Big Data solution for enterprise customers centered on the SAP HANA platform and Intel Distribution for Apache Hadoop software.
Industry Recognition:
On the strength of our advances in database and technology, GRC 20/20, a leading analyst firm, named SAP as one of 12 winners of the 2013 GRC Technology Innovator Awards. SAP was recognized for advancing governance, risk, and compliance (GRC) analytics with SAP HANA Analytics Foundation for SAP solutions for GRC.
| INTERIM REPORT JANUARY – JUNE 2013 | 9 |
Table of Contents
RESEARCH AND DEVELOPMENT
Our total research and development expense rose by 3% to €1,124 million in the first half of 2013, compared to €1,091 million in the corresponding period in 2012.
On our IFRS numbers, the portion of total revenue we spent on research and development in the first half of 2013 was 14.7%, which decreased by 0.4 percentage points compared to the 15.1% recorded for the first half of 2012. On the non-IFRS numbers, the portion of total revenue we spent on R & D in the first half of 2013 was 14.1%, which remained unchanged from the first half of the previous year.
We had 17,374 full-time equivalent (FTE) employees working in research and development teams on June 30, 2013, which remained virtually stable year-on-year (June 30, 2012: 17,331).
ACQUISITIONS
On June 5, 2013, SAP and hybris announced that SAP plans to acquire hybris. The acquisition will enable SAP to deliver the next-generation e-commerce platform based on latest technology, with the choice of on-premise or on-demand deployment. The combination of industry-leading enterprise solutions from SAP with the agile omni-channel commerce solutions of hybris will offer enhanced data access and faster analyses, enabling enterprises to optimize margins and customer loyalty.
Upon completion of the acquisition, which is expected in the third quarter of 2013 and is subject to regulatory approval and other closing conditions, hybris will operate as an independent business unit.
In addition, SAP acquired Ticket-Web, KMS Software Company, Camilion Solutions, and SmartOps in March and April, 2013.
EMPLOYEES
Our vision to help the world run better and improve people’s lives relies on the power of human thinking, innovation, and creativity. For this reason, nothing is more critical to the long-term success of SAP and our customers than our employees. They deliver value to our customers and drive our sustainable growth and profitability.
An important factor for our long-term success is our ability to attract and retain talented employees. In the second quarter of 2013, the employee retention rate was 94% (unchanged from the second quarter of 2012). We define employee retention rate as the ratio between the average number of employees less voluntary employee departures (fluctuation) and the average number of employees (in full-time equivalents).
One of SAP’s overall non-financial goals is fostering a diverse workforce, specifically increasing the number of women in management. At the end of the second quarter of 2013, the company employed 19.8% women in management, compared to 19.0% at the end of the second quarter of 2012 and 19.4% at the end of 2012. SAP has set a long-term target to increase the share of women in management to 25% by the year 2017.
At the end of the first half of 2013, we had 64,937 full-time equivalent (FTE) employees worldwide (June 30, 2012: 60,972; December 31, 2012: 64,422) – an increase of 515 compared to year end 2012.
Our overall employee headcount on June 30, 2013, included 16,683 FTEs based in Germany (June 30, 2012: 16,531), and 13,550 FTEs based in the United States (June 30, 2012: 12,246).
ORGANIZATION
On March 21, 2013, the Supervisory Board of SAP AG approved the proposal of the Executive Board to prepare the conversion of the legal form of SAP AG into a European Company (Societas Europaea, SE).
The Executive Board and the Supervisory Board believe that the planned change of legal form reflects SAP’s position as an internationally-oriented company with European roots. The legal form of European Company takes into account SAP’s European and international business activities. Furthermore, this legal form offers the possibility to optimize both the corporate governance structure and work of the corporate bodies of SAP AG. With the conversion into an SE, the shareholders of SAP AG automatically become shareholders of SAP SE. Shareholders’ rights remain unchanged.
The conversion of legal form requires the approval of the shareholders. This is planned to be secured at the Annual General Meeting of Shareholders in 2014. On June 3, 2013, management invited the employees and appropriate employee representatives in all EU countries and European Economic Area (EEA) countries to elect or nominate their delegates to a Special Negotiating Body (SNB). Once the SNB has been elected, we expect negotiations with the European employees regarding employee involvement in the SE to begin in September 2013 and last six months.
Lars Dalgaard has stepped down from the Executive Board and left the company with effect from June 1, 2013, to join a private equity firm. He will continue to play an active role as an advisor to the SAP Cloud business in the Cloud Governance Board. SAP’s co-CEOs Bill McDermott and Jim Hagemann Snabe will become Executive Board sponsors for all aspects of SAP’s cloud business.
To further accelerate the success in SAP’s cloud business, the company will consolidate its cloud go-to-market under the leadership of Bob Calderoni. Calderoni is president of
| 10 | INTERIM MANAGEMENT REPORT |
Table of Contents
Ariba, an SAP company, and member of the Global Managing Board of SAP AG, and will also continue to lead the Ariba business network activities. He will work closely with Rob Enslin, a fellow member of the Global Managing Board of SAP AG and president of Global Customer Operations responsible for SAP’s worldwide sales and customer operations. The close collaboration between the two SAP managers will ensure a stronger market positioning of SAP’s cloud solutions.
In this context, the responsibilities, especially regarding innovation, have changed. SAP will consolidate all innovation areas under Vishal Sikka, member of the Executive Board of SAP AG. As of June 1, 2013, all SAP On-Premise Delivery, networks (Ariba) and Cloud unit development leaders report directly to Sikka. Additionally, the Executive Board has nominated Bernd Leukert, executive vice president for Application Innovation, to the Global Managing Board of SAP AG with effect from July 1, 2013. In this capacity, Leukert reports directly to Vishal Sikka.
Luisa Deplazes Delgado, member of the Executive Board of SAP AG, Human Resources, and Labor Relations Director, has decided to leave SAP with effect from June 30, 2013 to pursue a responsibility as CEO of another company.
In addition to his role as chief financial officer of SAP AG, Werner Brandt has taken on Executive Board responsibility for Human Resources and became the Labor Relations Director in Germany. In this context, Luka Mucic has become the new head of Finance to support Brandt in his expanded responsibilities. The Executive Board has nominated Mucic to the Global Managing Board of SAP with effect from July 1, 2013.
| INTERIM REPORT JANUARY – JUNE 2013 | 11 |
Table of Contents
ASSETS, FINANCES, AND OPERATING RESULTS
In the sections that follow, our assets, finances, and operating results are discussed in detail.
In the discussion of our assets, finances, and operating results, the financial data presented of 2013 fully contains the revenue and expenses, assets, liabilities, and cash flows from SuccessFactors and Ariba. Comparator amounts contain SuccessFactors numbers on a pro rata basis effective February 21, 2012. Ariba numbers are not included – Ariba was acquired on October 1, 2012.
Performance Against Our Outlook for 2013 (Non-IFRS)
In this section, all discussion of the first halfs’ contribution to target achievement is based exclusively on non-IFRS measures. However, in the following section, the discussion of results refers to IFRS figures only, so those figures are not expressly identified as IFRS figures.
We present, discuss, and explain the reconciliation from IFRS measures to non-IFRS measures in the Supplementary Financial Information (Unaudited) section.
Operational Targets for 2013 (Non-IFRS)
For our outlook based on non-IFRS numbers, see the Forecast for SAP passage in this interim management report.
Key Figures — SAP Group 4/1/ to 6/30/2013 (Non-IFRS)
| Non-IFRS | ||||||||||||||||
| € millions, unless otherwise stated |
4/1/ - 6/30/2013 |
4/1/ - 6/30/2012 |
Change in % |
Change in % (Constant Currency) |
||||||||||||
| Software |
982 | 1,059 | –7 | –3 | ||||||||||||
| Cloud subscriptions and support |
183 | 69 | 166 | 171 | ||||||||||||
| Software and cloud subscription |
1,165 | 1,127 | 3 | 7 | ||||||||||||
| Support |
2,182 | 2,014 | 8 | 11 | ||||||||||||
| Software and software-related service revenue |
3,347 | 3,142 | 7 | 10 | ||||||||||||
| Total revenue |
4,091 | 3,916 | 4 | 8 | ||||||||||||
| Operating expense |
–2,873 | –2,743 | 5 | 7 | ||||||||||||
| Operating profit |
1,219 | 1,173 | 4 | 10 | ||||||||||||
| Operating margin in % |
29.8 | 30.0 | –0.2pp | 0.6pp | ||||||||||||
| Profit after tax |
874 | 831 | 5 | n.a. | ||||||||||||
| Effective tax rate in % |
26.8 | 25.6 | 1.2pp | n.a. | ||||||||||||
| Earnings per share – basic (in €) |
0.73 | 0.70 | 4 | n.a. | ||||||||||||
| Deferred cloud subscriptions and support revenue (June 30) |
361 | 215 | 68 | n.a. | ||||||||||||
Actual Performance in the Second Quarter of 2013 (Non-IFRS)
In the second quarter of 2013, software and software-related service revenue (non-IFRS) increased 7% compared with the same period in the previous year to €3,347 million (Q2 2012: €3,142 million). At constant currencies, the increase was 10%.
Included in our non-IFRS software and software-related service revenue, our revenue from cloud subscriptions and support was €183 million (Q2 2012: €69 million), an increase of 166% compared to the same period in 2012. The amounts for 2013 include full cloud subscriptions and cloud support revenue from SuccessFactors and Ariba; comparator amounts contain SuccessFactors numbers only. Deferred cloud subscriptions and support revenue was €361 million on June 30, 2013 (June 30, 2012: €215 million).
Non-IFRS total revenue in the same period was €4,091 million (Q2 2012: €3,916 million), an increase of 4%. On a constant currency basis, the increase was 8%.
Non-IFRS operating profit was €1,219 million (Q2 2012: €1,173 million), an increase of 4% (10% at constant currencies).
Non-IFRS operating margin was 29.8%, a decrease of 0.2 percentage points compared to the prior year (Q2 2012: 30.0%). The decrease was caused by currency effects: At constant currencies, the non-IFRS operating margin was 30.6%, an increase of 0.6 percentage points.
Non-IFRS operating profit and operating margin for the second quarter of 2013 were affected by the acquisition of Ariba, which impacted the operating margin by approximately 40 basis points.
In the second quarter of 2013, non-IFRS profit after tax was €874 million (Q2 2012: €831 million), an increase of 5%. Non-IFRS basic earnings per share was €0.73 (Q2 2012: €0.70), an increase of 4%.
| 12 | INTERIM MANAGEMENT REPORT |
Table of Contents
The non-IFRS effective tax rate in the second quarter of 2013 was 26.8% (Q2 2012: 25.6%). The year over year increase in the effective tax rate mainly resulted from tax effects on changes in foreign currency exchange rates and from valuation allowances on deferred tax assets which were partly compensated by tax effects relating to changes in the regional allocation of income and by prior year taxes.
| INTERIM REPORT JANUARY – JUNE 2013 | 13 |
Table of Contents
Key Figures — SAP Group 1/1/ to 6/30/2013 (Non-IFRS)
| € millions, unless otherwise stated |
1/1/ - 6/30/2013 |
1/1/ - 6/30/2012 |
Change in % |
Non-IFRS Change in % (Constant Currency) |
||||||||||||
| Software |
1,638 | 1,696 | –3 | 0 | ||||||||||||
| Cloud subscriptions and support |
350 | 104 | 238 | 243 | ||||||||||||
| Software and cloud subscription |
1,989 | 1,799 | 11 | 14 | ||||||||||||
| Support |
4,295 | 3,968 | 8 | 11 | ||||||||||||
| Software and software-related service revenue |
6,284 | 5,768 | 9 | 12 | ||||||||||||
| Total revenue |
7,727 | 7,273 | 6 | 9 | ||||||||||||
| Operating expense |
–5,607 | –5,266 | 6 | 8 | ||||||||||||
| Operating profit |
2,120 | 2,007 | 6 | 11 | ||||||||||||
| Operating margin in % |
27.4 | 27.6 | –0.2pp | 0.4pp | ||||||||||||
| Profit after tax |
1,563 | 1,414 | 11 | n.a. | ||||||||||||
| Effective tax rate in % |
24.5 | 26.7 | –2.2pp | n.a. | ||||||||||||
| Earnings per share – basic (in €) |
1.31 | 1.19 | 10 | n.a. | ||||||||||||
| Deferred cloud subscriptions and support revenue (June 30) |
361 | 215 | 68 | n.a. | ||||||||||||
Actual Performance in the First Half of 2013 (Non-IFRS)
In the first half of 2013, software and software-related service revenue (non-IFRS) increased 9% compared with the same period in the previous year to €6,284 million (first half of 2012: €5,768 million). At constant currencies, the increase was 12%.
Included in our non-IFRS software and software-related service revenue, our revenue from cloud subscriptions and support was €350 million (first half of 2012: €104 million), an increase of 238% compared to the same period in 2012. The amounts for 2013 include full cloud subscriptions and cloud support revenue from SuccessFactors and Ariba; comparator amounts contain SuccessFactors numbers on a pro rata basis with effect from February 21, 2012, only.
Non-IFRS total revenue in the same period was €7,727 million (first half of 2012: €7,273 million), an increase of 6%. On a constant currency basis, the increase was 9%.
Non-IFRS operating profit was €2,120 million (first half of 2012: €2,007 million), an increase of 6% (11% at constant currencies).
Non-IFRS operating margin was 27.4%, a decrease of 0.2 percentage points compared to the prior year (first half of 2012: 27.6%). Non-IFRS operating margin was 28.0% at constant currencies, an increase of 0.4 percentage points.
The operating profit and operating margin (non-IFRS) were adversely affected in a like manner by the acquisitions of SuccessFactors and Ariba. The operating margin thus declined by a total of around 60 basis points.
In the first half of 2013, non-IFRS profit after tax was €1,563 million (first half of 2012: €1,414 million), an increase of 11%. Non-IFRS basic earnings per share was €1.31 (first half of 2012: €1.19), an increase of 10%.
The non-IFRS effective tax rate in the first half of 2013 was 24.5% (first half of 2012: 26.7%). The year over year decrease in the effective tax rate mainly resulted from taxes for prior years and from changes in the regional allocation of income which were partly compensated by valuation allowances on deferred tax assets.
Overall, during the first six months, our non-IFRS numbers at actual currencies experienced a negative currency impact compared to what they would have been if translated at the exchange rates from last year: SSRS revenue was impacted by €163 million or –2.6%, while total revenue was impacted by €194 million or –2.5%, which impacted the SSRS and total revenue growth rates by 3 percentage points each. The operating margin was negatively impacted by 60 basis points.
If exchange rates remained unchanged at the June 2013 level for the remainder of the year, our 2013 full-year non-IFRS SSRS revenue and non-IFRS total revenue at actual currencies would both be approximately 4% lower than the respective constant currency numbers, representing a negative impact of approximately 4 percentage points to the SSRS and total revenue growth rates. Our non-IFRS operating margin at actual currencies would be approximately 80 basis points lower than the respective constant currency margin.
SEGMENT INFORMATION
Since the third quarter of 2012, SAP reports under a new segment structure. For information about the changes to our segment reporting and a description of the activities of our new segments, see the Notes to the Interim Financial Statements section, Note (17).
| 14 | INTERIM MANAGEMENT REPORT |
Table of Contents
SAP has two divisions – On-Premise and Cloud, which are further divided into operating segments. Our On-Premise division is comprised of two operating segments: On-Premise Products and On-Premise Services. In the third quarter of 2012, our Cloud division was comprised of one operating segment: Cloud Applications. Following the acquisition of Ariba, we established a second operating segment in the Cloud division, mainly consisting of the acquired Ariba business (Ariba). The operations of Crossgate, which we acquired in 2011, are also included in the operating segment containing the acquired Ariba business. All operating segments are reportable segments.
Key Figures in SAP Segment Reporting in the Second Quarter of 2013
In the second quarter of 2013, revenue in the On-Premise division increased by 1% to €3,858 million (Q2 2012: €3,824 million). Of this, €3,153 million (Q2 2012: €3,070 million) was revenue from the Products segment, representing an increase of 3%. Revenue from the Services segment decreased by 7% to €705 million (Q2 2012: €754 million).
In the second quarter of 2013, segment revenue in the Cloud division achieved €233 million (Q2 2012: €92 million). Of this, €118 million (Q2 2012: €87 million) was revenue from the Cloud Applications segment, €115 million (Q2 2012: €5 million) was revenue from the Ariba segment. For the Ariba segment, the trailing twelve month network spend volume was approximately US$465 billion, an increase of 27% year-over-year.
The annual cloud revenue run rate is already €932 million. The annual revenue run rate is the second quarter 2013 Cloud division revenue multiplied by 4.
Segment profit for the On-Premise division was €1,945 million (Q2 2012: €1,918 million). Of this, €1,789 million (Q2 2012: €1,756 million) was from the Products segment and €156 million (Q2 2012: €163 million) from the Services segment. In the second quarter of 2013, the operating segment margin (ratio of segment profit divided by segment revenue) for the reportable segments was 57% (Q2 2012: 57%) for the Products segment, and 22% (Q2 2012: 22%) for the Services segment. This resulted in an operating margin of 50% (Q2 2012: 50%) for the entire On-Premise division.
Segment profit for the Cloud division was €23 million (Q2 2012: –€19 million). Of this, –€11 million (Q2 2012: –€14 million) was from the Cloud Applications segment due to additional investments in sales and marketing and €34 million (Q2 2012: –€5 million) from the Ariba segment. In the second quarter of 2013, the operating segment margin for the reportable segments was –9% (Q2 2012: –16%) for the Cloud Applications segment, and 30% (Q2 2012: –100%) for the Ariba segment. This resulted in an operating margin of 10% (Q2 2012: –21%) for the entire Cloud division.
Key Figures in SAP Segment Reporting in the First Half of 2013
In the first half of 2013, revenue in the On-Premise division increased by 2% to €7,270 million (first half of 2012: €7,133 million). Of this, €5,909 million (first half of 2012: €5,659 million) was revenue from the Products segment, representing an increase of 4%. Revenue from the Services segment rose by 8% to €1,360 million (first half of 2012: €1,474 million).
In the first half of 2013, segment revenue in the Cloud division achieved €457 million (first half of 2012: €140 million). Of this, €233 million (first half of 2012: €130 million) was revenue from the Cloud Applications segment, €224 million (first half of 2012: €9 million) was revenue from the Ariba segment.
Segment profit for the On-Premise division was €3,545 million (first half of 2012: €3,463 million, including €3,273 million (first half of 2012: €3,163 million) from the Products segment and €273 million (first half of 2012: €300 million) from the Services segment. In the first half of 2013, the operating segment margin for the reportable segments was 55% (first half of 2012: 56%) for the Products segment, and 20% (first half of 2012: 20%) for the Services segment. This resulted in an operating margin of 49% (first half of 2012: 49%) for the entire On-Premise division.
Segment profit for the Cloud division was €51 million (first half of 2012: –€44 million), including –€9 million (first half of 2012: –€33 million) from the Cloud Applications segment and €60 million (first half of 2012: –€10 million) from the Ariba segment. In the first half of 2013, the operating segment margin for the reportable segments was –4% (first half of 2012: –25%) for the Cloud Applications segment, and 27% (first half of 2012: –108%) for the Ariba segment. This resulted in an operating margin of 11% (first half of 2012: –31%) for the entire Cloud division.
| INTERIM REPORT JANUARY – JUNE 2013 | 15 |
Table of Contents
Key Figures SAP Group in the Second Quarter of 2013 (IFRS)
| € millions, unless otherwise stated |
4/1/ - 6/30/2013 |
4/1/ - 6/30/2012 |
Change | Change in % |
||||||||||||
| Software |
982 | 1,059 | –77 | –7 | ||||||||||||
| Cloud subscriptions and support |
159 | 52 | 107 | 206 | ||||||||||||
| Software and cloud subscription |
1,141 | 1,110 | 30 | 3 | ||||||||||||
| Support |
2,177 | 2,013 | 164 | 8 | ||||||||||||
| Software and software-related service revenue |
3,318 | 3,124 | 194 | 6 | ||||||||||||
| Total revenue |
4,062 | 3,898 | 164 | 4 | ||||||||||||
| Operating expense |
–3,074 | –2,977 | –97 | 3 | ||||||||||||
| Operating profit |
988 | 921 | 68 | 7 | ||||||||||||
| Operating margin in % |
24.3 | 23.6 | 0.7pp | n.a. | ||||||||||||
| Profit after tax |
724 | 661 | 64 | 10 | ||||||||||||
| Effective tax rate in % |
24.8 | 23.6 | 1.2pp | n.a. | ||||||||||||
| Headcount in full-time equivalents (June 30) |
64,598 | 60,972 | 3,626 | 6 | ||||||||||||
| Days sales outstanding in days (June 30) |
62 | 61 | 1 | 2 | ||||||||||||
| Earnings per share – basic (in €) |
0.61 | 0.55 | 0.05 | 11 | ||||||||||||
| Deferred cloud subscriptions and support revenue (June 30) |
354 | 155 | 199 | 128 | ||||||||||||
OPERATING RESULTS IN THE SECOND QUARTER (IFRS)
Orders
The total number of On-Premise software deals we closed decreased by 5% from the comparator amount in the second quarter of 2013 to 13,936 (Q2 2012: 14,681). In addition, the average value of On-Premise software orders we received showed a decrease of 13% compared with the previous year. In the second quarter of 2013, 14% (Q2 2012: 26%) of the value of new software orders came from orders whose volume exceeded €5 million, while 51% (Q2 2012: 44%) came from orders worth less than €1 million.
Revenue
In the second quarter of 2013, software revenue was €982 million (Q2 2012: €1,059 million), a decrease of 7% compared to the same period in 2012. Software revenue in the second quarter of 2013 included amounts of €102 million (Q2 2012: €85 million) from SAP HANA.
Our revenue from cloud subscriptions and support was €159 million (Q2 2012: €52 million), an increase of 206% compared to the same period in 2012. The amounts for 2012 include cloud subscriptions and cloud support revenue from SuccessFactors – Ariba is not included in prior year numbers.
Total revenue was €4,062 million (Q2 2012: €3,898 million), an increase of 4% compared to the same period in 2012.
Operating Expenses
In the second quarter of 2013, our operating expenses increased by 3% to €3,074 million (Q2 2012: €2,977 million).
The increase in operating expenses is mainly due to the increased headcount.
Operating Profit and Margin
In the second quarter of 2013, operating profit increased by 7% compared with the same period in the previous year to €988 million (Q2 2012: €921 million).
Our operating margin increased by 0.7 percentage points to 24.3% (Q2 2012: 23.6%).
Profit After Tax and Earnings per Share
In the second quarter of 2013, profit after tax was €724 million (Q2 2012: €661 million), an increase of 10%. Basic earnings per share was €0.61 (Q2 2012: €0.55), an increase of 11%.
The effective tax rate in the second quarter of 2013 was 24.8% (Q2 2012: 23.6%). The year over year increase in the effective tax rate mainly resulted from tax effects on changes in foreign currency exchange rates and from valuation allowances on deferred tax assets which were partly compensated by tax effects relating to changes in the regional allocation of income and by prior year taxes.
| 16 | INTERIM MANAGEMENT REPORT |
Table of Contents
Key Figures SAP Group in the First Half of 2013 (IFRS)
| € millions, unless otherwise stated |
1/1/ - 6/30/2013 |
1/1/ - 6/30/2012 |
Change | Change in % |
||||||||||||
| Software |
1,638 | 1,696 | –57 | –3 | ||||||||||||
| Cloud subscriptions and support |
296 | 81 | 215 | 266 | ||||||||||||
| Software and cloud subscription |
1,935 | 1,777 | 158 | 9 | ||||||||||||
| Support |
4,286 | 3,966 | 319 | 8 | ||||||||||||
| Software and software-related service revenue |
6,220 | 5,743 | 477 | 8 | ||||||||||||
| Total revenue |
7,663 | 7,248 | 415 | 6 | ||||||||||||
| Operating expense |
–6,029 | –5,696 | –333 | 6 | ||||||||||||
| Operating profit |
1,634 | 1,551 | 83 | 5 | ||||||||||||
| Operating margin in % |
21.3 | 21.4 | –0.1pp | n.a. | ||||||||||||
| Profit after tax |
1,244 | 1,104 | 140 | 13 | ||||||||||||
| Effective tax rate in % |
21.5 | 25.0 | –3.5pp | n.a. | ||||||||||||
| Earnings per share – basic (in €) |
1.04 | 0.93 | 0.12 | 12 | ||||||||||||
| Deferred cloud subscriptions and support revenue (June 30) |
354 | 155 | 199 | 128 | ||||||||||||
OPERATING RESULTS IN THE FIRST HALF (IFRS)
Orders
The total number of On-Premise software deals we closed decreased by 8% from the comparator amount in the first half of 2013 to 25,923 (first half of 2012: 28,207). In contrast, the average value of On-Premise software orders we received remained stable compared with the previous year. In the first half of 2013, 17% (first half of 2012: 21%) of the value of new software orders came from orders whose volume exceeded €5 million, while 50% (first half of 2012: 49%) came from orders worth less than €1 million.
Revenue
In the first half of 2013, software revenue was €1,638 million (first half of 2012: €1,696 million), a decrease of 3% compared to the same period in 2012. Software revenue in the first half of 2013 included amounts of €188 million (first half of 2012: €113 million) from SAP HANA.
Our revenue from cloud subscriptions and support was €1,935 million (first half of 2012: €1,777 million), an increase of 9% compared to the same period in 2012. The amounts for 2012 include cloud subscriptions and cloud support revenue from SuccessFactors since its acquisition date (February 21, 2012). Ariba is not included in prior year numbers.
Total revenue was €7,663 million (first half of 2012: €7,248 million), an increase of 6% compared to the same period in 2012.
Operating Expenses
In the first half of 2013, our operating expenses increased by 6% to €6,029 million (first half of 2012: €5,696 million).
The increase in operating expenses is mainly due to the increased headcount.
Operating Profit and Margin
In the first half of 2013, operating profit increased by 5% compared with the same period in the previous year to €1,634 million (first half of 2012: €1,551 million).
Our operating margin decreased by 0.1 percentage points to 21.3% (first half of 2012: 21.4%).
Profit After Tax and Earnings per Share
In the first half of 2013, profit after tax was €1,244 million (first half of 2012: €1,104 million), an increase of 13%. Basic earnings per share was €1.04 (first half of 2012: €0.93), an increase of 12%.
The effective tax rate in the first half of 2013 was 21.5% (first half of 2012: 25.0%). The year over year decrease in the effective tax rate mainly resulted from taxes for prior years and from changes in the regional allocation of income which were partly compensated by valuation allowances on deferred tax assets.
| INTERIM REPORT JANUARY – JUNE 2013 | 17 |
Table of Contents
FINANCES (IFRS)
Cash Flow and Liquidity
Operating cash flow for the first six months of 2013 was €2,482 million (first half of 2012: €2,400 million). As such, the consistently strong operating cash flow increased slightly over the same period in the previous year, marking SAP’s highest ever cash flow for the first half of a year.
Group liquidity stood at €3,527 million on June 30, 2013 (December 31, 2012: €2,492 million). Group liquidity comprised cash and cash equivalents totaling €3,386 million (December 31, 2012: €2,477 million) and short-term investments totaling €141 million (December 31, 2012: €15 million).
Group Liquidity of SAP Group
| € millions |
June 30, 2013 |
December 31, 2012 |
Change | |||||||||
| Cash and cash equivalents |
3,386 | 2,477 | 909 | |||||||||
| Short-term investments |
141 | 15 | 126 | |||||||||
| Group Liquidity — gross |
3,527 | 2,492 | 1,035 | |||||||||
| Current private placement transactions |
86 | 0 | 86 | |||||||||
| Current bonds |
1,100 | 600 | 500 | |||||||||
| Net liquidity 1 |
2,341 | 1,892 | 449 | |||||||||
| Non-current private placement transactions |
2,026 | 2,094 | –68 | |||||||||
| Non-current bonds |
1,800 | 2,300 | –500 | |||||||||
| Net liquidity 2 |
–1,485 | –2,502 | 1,017 | |||||||||
Net liquidity 1 is total group liquidity minus current bonds which increased on a year-to-date basis by €449 million to €2,341 million .
Net liquidity 2, defined as net liquidity 1 minus non-current private placement transactions, and bonds, was –€1,485 million (December 31, 2012: –€2,502 million).
Thus, net liquidity improved compared to December 31, 2012: dividends paid led to cash outflows which were overcompensated by a positive operating cash flow in the first half of 2013.
Free Cash Flow and Days Sales Outstanding (DSO)
Our free cash flow and our DSO on June 30, 2013, were as follows:
Free Cash Flow
| € millions |
1/1
- 6/30/ 2013 |
1/1
- 6/30/ 2012 |
Change in % |
|||||||||
| Free cash flow |
2,217 | 2,125 | 4 | |||||||||
We calculate free cash flow as net cash from operating activities minus purchases of intangible assets and property, plant, and equipment.
Days Sales Outstanding
| June 30, 2013 |
June 30, 2012 |
Change in Days |
||||||||||
| Days sales outstanding (DSO) in days |
62 | 61 | 1 | |||||||||
DSO measures the length of time it takes to collect receivables. SAP calculates DSO by dividing the average invoiced accounts receivables balance of the last 12 months by the average monthly sales of the last 12 months.
ASSETS (IFRS)
Analysis of Consolidated Statements of Financial Position
The total assets of the Group were €27,494 million on June 30, 2013, an increase of €784 million since December 31, 2012, resulting mainly from an increase in cash and cash equivalents from the operating cash flow, compensated by dividends paid.
The equity ratio on June 30, 2013, was 52% (December 31, 2012: 53%), which remained virtually stable.
Investments
Investments in intangible assets and property, plant, and equipment decreased significantly in the first half of 2013 to €346 million (first half of 2012: €3,324 million). This decrease is due to our prior year acquisition of SuccessFactors and is mainly attributable to additions to goodwill and intangible assets.
Off-Balance-Sheet Financial Instruments
There are no off-balance-sheet financial instruments, such as sale-and-lease-back transactions, asset-backed securities, or liabilities related to special-purpose entities, that are not disclosed in our interim Consolidated Financial Statements. Any factoring contracts are not material in volume.
| 18 | INTERIM MANAGEMENT REPORT |
Table of Contents
Competitive Intangibles
The assets that are the basis for our current and future success do not appear on the Consolidated Statements of Financial Position. This is apparent from a comparison of the market capitalization of SAP AG, which was €69.1 billion, with the equity of the SAP Group on the Consolidated Statements of Financial Position, which was €14.4 billion at the end of the first half of 2013 (December 31, 2012: €14.2 billion). This means that the market capitalization of our equity is more than four times higher than the book value.
Customer capital, our employees and their knowledge and skills, our ecosystem of partners, the SAP brand, and our past investments in research and development are some of the most important competitive intangibles that influence our market value.
According to the 2012 Interbrand annual survey of the Top 100 Best Global Brands, SAP is ranked the 25th most valued brand in the world. Interbrand determined a value of US$15.6 billion.
ENERGY AND EMISSIONS
As we create solutions for our customers to better manage resources, we must also look to ourselves and improve our own environmental performance. We also acknowledge greenhouse gas (GHG) emissions as a proxy measure for inefficient operations and excess spending.
SAP’s greenhouse gas (GHG) emissions for the second quarter 2013 totaled 135 kilotons compared to 130 kilotons in the second quarter of 2012. For the first two quarters 2013, SAP’s GHG emissions totaled 280 kilotons – an increase of 11% compared to the first two quarters of 2012. This rise is primarily due to the acquisitions of SuccessFactors and Ariba, an increase in the number of company cars, as well as an increase in energy consumption of our data centers. If our efforts to reduce emissions do not take hold, there is a risk that we might not meet our year-end emissions target of 460 kilotons. Comparator amounts contain SuccessFactors numbers on a pro rata basis with effect from February 21, 2012. Ariba numbers are not included – Ariba was acquired on October 1, 2012.
As we measure our emissions per employee and per euro of revenue, we gain insight into our efficiency as we grow. Since 2007, we have increased our efficiency according to both measures, lowering our emissions per employee by about 30% and per euro of revenue by about 44% at the end of June 2013 (rolling four quarters).
Since the beginning of 2008, SAP has achieved a €240 million cost avoidance compared to a business-as-usual scenario, through energy saving and emission reduction initiatives.
Our customers benefit from our experience that drives our innovation. For example, in April 2013, we released TwoGo by SAP, a mobility solution that was initially piloted internally. TwoGo helps companies and their employees save fuel by organizing ride-sharing for their daily commute or business travel. At SAP, TwoGo contributes to reducing emissions per employee. Similarly, TwoGo helps organizations demonstrate their commitment to sustainability, by reducing carbon emissions and engaging employees in that mission.
| INTERIM REPORT JANUARY – JUNE 2013 | 19 |
Table of Contents
SAP STOCK
SAP AG common stock is listed on the Frankfurt Stock Exchange as well as a number of other German exchanges. On the New York Stock Exchange (NYSE), SAP American depositary receipts (ADRs), each representing one common share, trade under the symbol SAP. SAP is a component of the DAX (the index of 30 German blue chip companies), the Dow Jones EURO STOXX 50, and the S&P North American Technology Software Index.
Key Facts About SAP Stock / SAP ADRs
| Listings |
||||
| Germany |
Berlin, Frankfurt, Stuttgart | |||
| United States (ADR) |
New York Stock Exchange | |||
| IDs and symbols |
||||
| WKN/ISIN |
716460/DE0007164600 | |||
| NYSE (ADR) |
803054204 (CUSIP | ) | ||
| Reuters |
SAPG.F or .DE | |||
| Bloomberg |
SAP GR | |||
| Weight (%) in indices at 6/30/2013 |
||||
| DAX 30 |
7.59 | % | ||
| Prime All Share |
6.03 | % | ||
| CDAX |
6.16 | % | ||
| HDAX |
6.34 | % | ||
| Dow Jones STOXX 50 |
1.90 | % | ||
| Dow Jones EURO STOXX 50 |
3.38 | % |
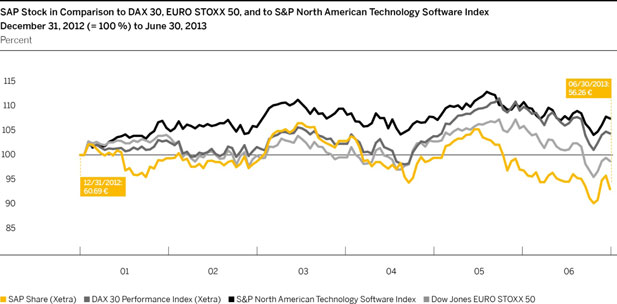
The second quarter of 2013 saw SAP stock lose ground to the two major benchmark indices for the first time since the second quarter of 2012. The SAP share price fell 10.0%, whereas the EURO STOXX 50 declined 0.8% and the DAX 30 gained a modest 2.1%.
SAP stock started the three-month period with an Xetra closing price of €62.50 at the end of March, and soon came under pressure in a weak environment. It picked up momentum again shortly after the Q1 results were published on April 19, reaching €64.05, its high for the quarter, on May 15. Contributing to this climb was a general market sentiment reflecting hopes of economic recovery, increased enterprise profits, and most importantly, a persistently liberal central bank policy. Against this backdrop, the DAX recorded an all-time high of 8,530.89 points on May 22.
Disappointing figures from China at the end of May, however, halted the stock markets’ upwards trend. The announcement of personnel changes on the SAP Executive Board as well as the ex-dividend markdown following the Annual General Meeting of Shareholders on June 4 put additional pressure on SAP stock during this period. News of SAP’s planned acquisition of e-commerce specialist hybris subsequently stabilized the SAP share price until concerns about a change in the generous money policy of central banks, a drop in the Japanese share prices, and fears of a financial crisis in China put downward pressure on global share prices. Finally, weaker-than-expected company figures dampened sentiment in the software sector, causing SAP stock to fall to a quarterly low of €54.42 on June 24, before ultimately closing the month at €56.26.
| 20 | INTERIM MANAGEMENT REPORT |
Table of Contents
Capital Stock
SAP’s capital stock on June 30, 2013, was €1,228,504,232 (December 31, 2012: €1,228,504,232). It is issued as 1,228,504,232 no-par shares, each with an attributable value of €1 in relation to the capital stock.
Free Float
On June 30, 2013, the proportion of our stock in free float, applying the definition accepted on the Frankfurt Stock Exchange – which excludes treasury stock from the free float – stood at 72.0% (December 31, 2012: 74.4%).
Market Capitalization
With the Xetra closing price at €56.26 on the last trading day in the second quarter, SAP’s market capitalization was €69.1 billion based on 1,228,504,232 million outstanding shares. SAP was therefore the largest DAX company based on market capitalization.
Deutsche Börse uses the free-float factor to weight companies in the DAX. The free-float factor for SAP was 72.0% on the last trading day in the second quarter, resulting in a free-float market capitalization of approximately €49.7 billion. When measured by its free-float market capitalization, SAP was the fourth-largest company listed on the DAX at the end of the quarter.
For more information about SAP common stock, see the SAP Web site at www.sap.com/investor.
RISK AND OPPORTUNITY MANAGEMENT
We have comprehensive risk-management structures in place, which are intended to enable us to recognize and analyze risks early and to take the appropriate action. For changes in our legal liability risks since our last annual report, see Note 14 in the Notes to the Interim Financial Statements. The other risk factors remain largely unchanged since 2012, and are discussed more fully in our 2012 Integrated Report and our Annual Report on Form 20-F for 2012. We do not believe the risks we have identified jeopardize our ability to continue as a going concern. Opportunities also remain largely unchanged since 2012.
SUPPLEMENTARY REPORT
No events have occurred after June 30, 2013, which have a material significance for the Group’s assets, finances, and operating results.
OUTLOOK
Future Trends in the Global Economy
According to EBC’s current overall economic forecast, the global economy will see more dynamic growth as the year progresses. The IMF, for its part, anticipates the world economy will expand 3.1% over the year as a whole, with economic development varying significantly from country to country.
Looking at the EMEA region, ECB believes that rising global demand will slow the decline of the euro area economy over the remainder of the year. IMF predicts a full-year decrease of 0.6%. The euro area economy is expected to grow again in 2014. Analysts foresee the Americas region, meanwhile, being influenced by contrary effects in the second half of 2013: On the one hand, favorable financing conditions and strong corporate liquidity in the United States will bring about a steady increase in domestic demand; on the other hand, tax increases and federal spending cuts will likely have a restraining effect on the economy. The IMF hence expects the U.S. economy to improve 1.7% over the full year 2013. In Latin America, robust domestic demand and a gradually improving external demand are expected to drive growth. As for the APJ region, experts anticipate that economic development will remain mixed, with cautious expansion in Japan (IMF: +2.0%) and accelerated growth in the region’s emerging and developing economies. For China, the IMF still expects 7.8% full-year growth.
| INTERIM REPORT JANUARY – JUNE 2013 | 21 |
Table of Contents
Economic Trends – Year-Over-Year GDP Growth
| % |
||||||||||||
| World |
2012e | 2013p | 2014p | |||||||||
| World |
3.1 | 3.1 | 3.8 | |||||||||
| Advanced economies |
1.2 | 1.2 | 2.1 | |||||||||
| Developing and emerging economies |
4.9 | 5.0 | 5.4 | |||||||||
| Europe, the Middle East, and Africa (EMEA) |
||||||||||||
| European Union |
–0.2 | –0.1 | 1.2 | |||||||||
| Euro area |
–0.6 | –0.6 | 0.9 | |||||||||
| Germany |
0.9 | 0.3 | 1.3 | |||||||||
| Central and Eastern Europe |
1.4 | 2.2 | 2.8 | |||||||||
| Middle East and North Africa |
4.5 | 3.0 | 3.7 | |||||||||
| Sub-Saharan Africa |
4.9 | 5.1 | 5.9 | |||||||||
| Americas |
||||||||||||
| United States |
2.2 | 1.7 | 2.7 | |||||||||
| Canada |
1.7 | 1.7 | 2.2 | |||||||||
| Central and South America, Caribbean |
3.0 | 3.0 | 3.4 | |||||||||
| Asia Pacific Japan |
||||||||||||
| Asian developing economies |
6.5 | 6.9 | 7.0 | |||||||||
| Japan |
1.9 | 2.0 | 1.2 | |||||||||
| China |
7.8 | 7.8 | 7.7 |
e = Estimate; p = Projection
Source: Internationaler Währungsfonds (IWF), World Economic Outlook Update, Growing Pains, Juli 2013, p. 2.
Future Trends in the IT Market
The global IT market is expected to remain heterogeneous throughout the rest of 2013, growing almost 5% and thus outperforming the overall economy. That is the view expressed by International Data Corporation (IDC), a market research firm based in the United States. Economic uncertainty will probably cause companies to hold back on their IT investments until the end of the year, despite the fact that demand for new products and services exists. According to the experts, mobile solutions and cloud computing will be the segments to see increased spending.
The IT market in EMEA region, particularly in the Western and Southern European countries, is expected to continue growing at rates below the global IT market’s growth rates for the rest of the year yet still outperform the region’s overall economy. Meanwhile, uncertainty will remain in the American IT market due to restrained corporate investment in the USA. IDC therefore forecasts moderate growth for the Americas region at a rate slightly above the global average. The researchers predict that the APJ region will also grow faster than the global average, but with significant regional differences: Spending in Japan will stagnate, whereas emerging and developing countries, especially China, can expect double-digit growth.
Trends in the IT Market – Increased IT Spending Year-Over-Year
| % |
||||||||||||
| World |
2012e | 2013p | 2014p | |||||||||
| Total IT |
5.6 | 4.9 | 5.0 | |||||||||
| Hardware |
7.0 | 5.4 | 5.0 | |||||||||
| Packaged software |
6.2 | 5.6 | 6.3 | |||||||||
| Applications |
6.0 | 5.6 | 6.0 | |||||||||
| IT services |
3.1 | 3.8 | 4.2 | |||||||||
| Europe, Middle East, Africa (EMEA) |
||||||||||||
| IT total |
4.8 | 3.3 | 4.2 | |||||||||
| Packaged software |
4.7 | 4.7 | 5.4 | |||||||||
| Applications |
4.3 | 4.5 | 5.1 | |||||||||
| IT services |
1.0 | 2.2 | 3.6 | |||||||||
| Americas |
||||||||||||
| IT total |
3.9 | 5.3 | 5.2 | |||||||||
| Packaged software |
6.9 | 6.1 | 6.8 | |||||||||
| Applications |
7.0 | 6.2 | 6.5 | |||||||||
| IT services |
4.3 | 4.5 | 4.2 | |||||||||
| Asia Pacific Japan |
||||||||||||
| IT total |
8.9 | 6.3 | 5.5 | |||||||||
| Packaged software |
6.9 | 5.9 | 6.4 | |||||||||
| Applications |
6.0 | 5.7 | 6.4 | |||||||||
| IT services |
4.7 | 5.1 | 5.4 |
e = Estimate, p = Projection
source: IDC Worldwide Black Book Q1 2013
| 22 | INTERIM MANAGEMENT REPORT |
Table of Contents
Impact on SAP
The world is being transformed by the rapid adoption of cloud and in-memory technologies, and in this past quarter this trend became very prominent. Companies are shifting their investments to the cloud and radically simplifying their IT landscape on in-memory technology. In 2010, SAP embarked on a strategy of innovation – in cloud, in-memory, and mobile, all on a stable and consistent core. This foresight is now paying off and we are driving this next evolution of the software industry.
As long as they develop as currently forecast, SAP expects to outperform the global economy and IT industry for the remainder of 2013 although we adjusted our goals for 2013. We are confident we can achieve this thanks to our five innovative market categories Applications, Analytics, Mobile, Cloud, and Database and Technology, which give us a competitive edge even in difficult economic environments. In addition, we benefit from our established innovation strategy and clear customer focus in more than 180 countries and 25 industries.
In the second half of 2013, we will continue to invest in countries in which we expect significant growth, such as Brazil, China, India, Russia, the Middle East and Africa. As such, we see sufficient growth potential, and expect to reach our goals for 2013 as well as our mid-term goals for 2015. For more information, see the Operational Targets for 2013 (Non-IFRS) section.
Forecast for SAP
Operational Targets for 2013 (Non-IFRS)
Revenue and Operating Profit Outlook
SAP reaffirms its full year 2013 non-IFRS operating profit outlook to be in a range of €5.85 billion – €5.95 billion at constant currencies (2012: €5.21 billion). Although the difficult macroeconomic environment in particular in Asia Pacific Japan and the rapid transition to the cloud have resulted in lower software revenue expectations, SAP remains committed to be a double-digit growth company with at least 10% growth in non-IFRS software and software-related service revenue at constant currencies in full year 2013 (2012: €13.25 billion). This replaces the previous growth outlook for non-IFRS software and software-related service revenue of 11% – 13% at constant currencies and the underlying guidance for software and cloud subscription revenue.
In addition, SAP reaffirms its outlook for the fast-growing innovation categories cloud and in-memory. The company continues to expect full year 2013 non-IFRS cloud subscription and support revenue of around €750 million at constant currencies (2012: €343 million) and full year 2013 SAP HANA software revenue in a range of €650 – €700 million (2012: €392 million).
The Company now projects a full-year 2013 IFRS effective tax rate of 24.0% – 25.0% (previously 25.5% – 26.5%) (2012: 26.2%) and a non-IFRS effective tax rate of 25.5% – 26.5% (previously 27.0% – 28.0%) (2012: 27.5%).
We expect our professional services and other service revenue to remain flat in 2013 on a constant currency basis compared to 2012. Taking currency effects into account, we expect to see a slight decline in professional services and other service revenue. We therefore predict that the increase in total revenue in 2013 will be influenced by the expected growth in software and software-related service revenue.
We expect that total revenue (non-IFRS) will continue to depend largely on the revenues from the On-Premise Products segment. The expected growth in revenue from this segment, however, is below the outlook provided for software and cloud subscription revenue (non-IFRS). In light of the above expectations for professional services and other service revenue, we therefore expect a decline in the On-Premise Services segment.
Looking at our above forecast for cloud subscriptions and support revenue (non-IFRS, at constant currencies), we anticipate a similar level of growth for segment revenues in the Cloud division (combining the Cloud Applications and Ariba segments). Particularly strong growth results are expected in the Ariba segment, since we only began including Ariba figures in the 2012 segment revenues at the beginning of the fourth quarter following the first consolidation.
We expect an increase in segment profit in our On-Premise division with the On-Premise Products segment profit growing faster than the On-Premise Services segment, for which we expect a decline in segment results as compared to 2012. The Cloud division is expected to achieve, for the first time, a positive segment profit resulting from a reduced segment loss in the Cloud Applications segment and a strong increase in the Ariba segment profit.
We expect that software revenue from SAP HANA will range between €650 million and €700 million (2012: €392 million). Total cloud revenue is expected to approach €1 billion in 2013.
| INTERIM REPORT JANUARY – JUNE 2013 | 23 |
Table of Contents
Differences Between IFRS and Non-IFRS Measures
As noted above, our guidance is based on non-IFRS measures at constant currencies. The following provides additional insight into the impact of the constant currency notion and the items by which our IFRS measures and non-IFRS measures differ.
The following amounts represent estimates for 2013 and a comparison of the actual differences between IFRS and non-IFRS measures on operating profit for the first six months of 2013 and 2012:
Non-IFRS Measures
| (€ millions) |
Estimated amounts for 1/1 – 12/31/20131) |
Actual Amounts from 1/1 – 6/30/2013 |
Actual Amounts from 1/1 – 6/30/2012 |
|||||||||
| Deferred revenue write-down |
|
Between 65 and 75 |
|
64 | 25 | |||||||
| Discontinued activities 2) |
< 10 | 0 | –5 | |||||||||
| Share-based payment expenses 3),4) |
|
Between 350 and 390 |
|
109 | 181 | |||||||
| Acquisition-related charges 5) |
|
Between 560 and 600 |
|
283 | 250 | |||||||
| Restructuring |
|
Between 50 and 70 |
|
31 | 4 | |||||||
| 1) | All adjusting items are partly incurred in currencies other than the euro. Consequently, the amounts are subject to currency volatility. All estimates for 2013 provided in the table are at actual currency and are calculated based on certain assumptions regarding the developments of the different currency exchange rates. Depending on the future development of these exchange rates, the total amounts for 2013 may differ significantly from the estimates provided in the table above. The reader should remember that SAP’s outlook is based on constant currency. |
| 2) | We will consider all new information that emerges from further developments of the TomorrowNow lawsuit to determine if the provision should be adjusted in the future, which could result in a change to the estimate provided in the table above. |
| 3) | Our share-based payment expenses are subject, among other factors, to share price volatility, volatility in SAP’s performance against the Tech PGI index, anticipated achievement of financial KPI objectives, and fluctuations in SAP’s workforce. The estimates in the table above are based on certain assumptions regarding these factors. Depending on how these factors change in the future, the total expense for 2013 may differ significantly from these estimates. |
| 4) | The estimates provided above for share-based compensation expenses include grants under existing programs. New share-based compensation plans or changes to the existing plans may make the total amounts for 2013 differ significantly from these estimates. |
| 5) | The estimates provided above for acquisition-related charges are based on the acquisitions performed by SAP until the day of this document. Further acquisitions may make the total amounts for 2013 differ significantly from these estimates. |
Goals for Liquidity, Finance, Investments, and Dividends
Our goals for liquidity, finance, investments, and dividends as discussed in our 2012 Integrated Report have changed as follows:
On June 30, 2013, we had a negative net liquidity. We believe that our liquid assets combined with our undrawn credit facilities are sufficient to meet our present operating financing needs in 2013 and, together with expected cash flows from operations, will support our currently planned capital expenditure requirements over the near term and medium term. We intend to reduce our financial debt as and when the debt falls due. We will consider issuing new debt, such as bonds or U.S. private placements, on an as-needed basis only and if market conditions are advantageous. We currently have no concrete plans for future share buybacks.
Excepting acquisitions, our planned capital expenditures for 2013 and 2014 can be covered in full by operating cash flow and will chiefly be spent on increasing data center capacity in our locations in Newtown Square, Pennsylvania, United States, and St. Leon-Rot, Germany. New buildings are planned in Potsdam, Bangalore (India), São Leopoldo (Brazil), and Ra’anana (Israel). We also plan to renovate and expand our office buildings in Vancouver and Palo Alto.
As part of our growth and innovation strategy, we plan to spend around US$2 billion in China by 2015. This demonstrates our long-term strategic commitment to China, the world’s second-largest economy. SAP continues to invest and increase its presence and market share in countries experiencing high growth.
We plan to continue our dividend policy, which is that the payout ratio should be more than 30%.
Premises on Which Our Outlook Is Based
In preparing our outlook guidance, we have taken into account all events known to us at the time we prepared this report that could influence SAP’s business going forward. Among the premises on which this outlook is based are those presented concerning economic development. This outlook does not take into consideration any effects in 2013 from major acquisitions.
Medium-Term Prospects
Our medium-term prospects as discussed in our 2012 Integrated Report and our 2012 Annual Report on Form 20-F did not change in the first six months of 2013. We still aim to increase our total revenue to more than €20 billion by 2015. In the same period, we aim to widen our non-IFRS operating margin to 35%. To achieve these goals, we want to further strengthen our position in our five market categories and have one billion users by 2015.
| • | We want to extend our leadership in the applications segment. |
| • | We want to extend our market share in analytics. |
| • | We want to extend our leadership in mobile computing. |
| • | We want to become a profitable market leader in cloud computing, generating around €2 billion total revenue in this segment by 2015. |
Our plan is for indirect sales (partner revenue) to contribute up to 40% of software revenue by 2015.
| 24 | INTERIM MANAGEMENT REPORT |
Table of Contents
CONSOLIDATED INTERIM FINANCIAL STATEMENTS – IFRS (Unaudited)
| 26 | ||||
| 27 | ||||
| 28 | ||||
| 29 | ||||
| Consolidated Statements of Financial Position – June 30, 2013 |
30 | |||
| 32 | ||||
| 33 |
NOTES TO THE CONSOLIDATED INTERIM FINANCIAL STATEMENTS
| (1) General Information About Consolidated Financial Statements |
34 | |||
| 34 | ||||
| 34 | ||||
| 35 | ||||
| 36 | ||||
| 37 | ||||
| 37 | ||||
| 38 | ||||
| 38 | ||||
| 39 | ||||
| 39 | ||||
| 39 | ||||
| 40 | ||||
| 40 | ||||
| 42 | ||||
| 42 | ||||
| 46 | ||||
| 51 | ||||
| 51 |
| CONSOLIDATED INTERIM FINANCIAL STATEMENTS - IFRS | 25 |
Table of Contents
CONSOLIDATED INCOME STATEMENTS
For the three months ended June 30
| € millions, unless otherwise stated |
Note | 2013 | 2012 | Change in % |
||||||||||||
| Software |
982 | 1,059 | –7 | |||||||||||||
| Cloud subscriptions and support |
159 | 52 | 206 | |||||||||||||
| Software and cloud subscriptions |
1,141 | 1,110 | 3 | |||||||||||||
| Support |
2,177 | 2,013 | 8 | |||||||||||||
| Software and software-related service revenue |
3,318 | 3,124 | 6 | |||||||||||||
| Consulting |
580 | 617 | –6 | |||||||||||||
| Other services |
165 | 157 | 5 | |||||||||||||
| Professional services and other service revenue |
744 | 774 | –4 | |||||||||||||
| Total revenue |
4,062 | 3,898 | 4 | |||||||||||||
| Cost of software and software-related services |
–598 | –568 | 5 | |||||||||||||
| Cost of professional services and other services |
–609 | –644 | –5 | |||||||||||||
| Total cost of revenue |
–1,207 | –1,212 | 0 | |||||||||||||
| Gross profit |
2,855 | 2,686 | 6 | |||||||||||||
| Research and development |
–567 | –568 | 0 | |||||||||||||
| Sales and marketing |
–1,059 | –972 | 9 | |||||||||||||
| General and administration |
–232 | –222 | 5 | |||||||||||||
| Restructuring |
–17 | –4 | <-100 | |||||||||||||
| TomorrowNow litigation |
0 | –2 | <-100 | |||||||||||||
| Other operating income/expense, net |
9 | 3 | >100 | |||||||||||||
| Total operating expenses |
–3,074 | –2,977 | 3 | |||||||||||||
| Operating profit |
988 | 921 | 7 | |||||||||||||
| Other non-operating income/expense, net |
–2 | –45 | –95 | |||||||||||||
| Finance income |
26 | 28 | –6 | |||||||||||||
| Finance costs |
–49 | –39 | 27 | |||||||||||||
| Financial income, net |
–23 | –11 | <-100 | |||||||||||||
| Profit before tax |
963 | 865 | 11 | |||||||||||||
| Income tax expense |
(6 | ) | –239 | –204 | 17 | |||||||||||
| Profit after tax |
724 | 661 | 10 | |||||||||||||
| Profit attributable to non-controlling interests |
0 | 0 | N/A | |||||||||||||
| Profit attributable to owners of parent |
725 | 661 | 10 | |||||||||||||
| Earnings per share – basic (in €)* |
(7 | ) | 0.61 | 0.55 | 11 | |||||||||||
| Earnings per share – diluted (in €)* |
(7 | ) | 0.61 | 0.55 | 11 | |||||||||||
| * | For the three months ended June 30, 2013 and 2012, the weighted average number of shares was 1,193 million (diluted 1,195 million) and 1,191 million (diluted: 1,192 million), respectively (treasury stock excluded). |
| 26 | INTERIM REPORT JANUARY – JUNE 2013 |
Table of Contents
CONSOLIDATED STATEMENTS OF COMPREHENSIVE INCOME
For the three months ended June 30
| € millions |
2013 | 2012 | ||||||
| Profit after tax |
724 | 661 | ||||||
| Items that will not be reclassified to profit and loss |
||||||||
| Remeasurements on defined benefit pension plans |
5 | –6 | ||||||
| Income tax relating to items that will not be reclassified |
–3 | 2 | ||||||
| Other comprehensive income after tax for items that will not be reclassified to profit and loss |
2 | –4 | ||||||
| Items that will be reclassified subsequently to profit and loss |
||||||||
| Exchange differences on translation |
–319 | 335 | ||||||
| Available-for-sale financial assets |
5 | –2 | ||||||
| Cash flow hedges |
18 | –17 | ||||||
| Income tax relating to items that will be reclassified |
–8 | 16 | ||||||
| Other comprehensive income after tax for items that will be reclassified to profit and loss |
–304 | 332 | ||||||
| Other comprehensive income net of tax |
–302 | 328 | ||||||
| Total comprehensive income |
422 | 989 | ||||||
| – Attributable to owners of parent |
423 | 989 | ||||||
| – Attributable to non-controlling interests |
0 | 0 | ||||||
| CONSOLIDATED INTERIM FINANCIAL STATEMENTS - IFRS | 27 |
Table of Contents
CONSOLIDATED INCOME STATEMENTS
For the six months ended June 30
| € millions, unless otherwise stated |
Note | 2013 | 2012 | Change in % |
||||||||||||
| Software |
1,638 | 1,696 | –3 | |||||||||||||
| Cloud subscriptions and support |
296 | 81 | 266 | |||||||||||||
| Software and cloud subscriptions |
1,935 | 1,777 | 9 | |||||||||||||
| Support |
4,286 | 3,966 | 8 | |||||||||||||
| Software and software-related service revenue |
6,220 | 5,743 | 8 | |||||||||||||
| Consulting |
1,136 | 1,214 | –6 | |||||||||||||
| Other services |
306 | 291 | 5 | |||||||||||||
| Professional services and other service revenue |
1,443 | 1,505 | –4 | |||||||||||||
| Total revenue |
7,663 | 7,248 | 6 | |||||||||||||
| Cost of software and software-related services |
–1,202 | –1,106 | 9 | |||||||||||||
| Cost of professional services and other services |
–1,215 | –1,268 | –4 | |||||||||||||
| Total cost of revenue |
–2,416 | –2,374 | 2 | |||||||||||||
| Gross profit |
5,246 | 4,874 | 8 | |||||||||||||
| Research and development |
–1,124 | –1,091 | 3 | |||||||||||||
| Sales and marketing |
–2,034 | –1,802 | 13 | |||||||||||||
| General and administration |
–429 | –431 | –1 | |||||||||||||
| Restructuring |
–31 | –4 | <-100 | |||||||||||||
| TomorrowNow litigation |
0 | 5 | –92 | |||||||||||||
| Other operating income/expense, net |
5 | 1 | >100 | |||||||||||||
| Total operating expenses |
–6,029 | –5,696 | 6 | |||||||||||||
| Operating profit |
1,634 | 1,551 | 5 | |||||||||||||
| Other non-operating income/expense, net |
–13 | –53 | –76 | |||||||||||||
| Finance income |
56 | 52 | 8 | |||||||||||||
| Finance costs |
–93 | –78 | 19 | |||||||||||||
| Financial income, net |
–37 | –26 | 41 | |||||||||||||
| Profit before tax |
1,584 | 1,472 | 8 | |||||||||||||
| Income tax expense |
(6 | ) | –340 | –368 | –8 | |||||||||||
| Profit after tax |
1,244 | 1,104 | 13 | |||||||||||||
| Profit attributable to non-controlling interests |
0 | 0 | N/A | |||||||||||||
| Profit attributable to owners of parent |
1,245 | 1,104 | 13 | |||||||||||||
| Earnings per share – basic (in €)* |
(7 | ) | 1.04 | 0.93 | 12 | |||||||||||
| Earnings per share – diluted (in €)* |
(7 | ) | 1.04 | 0.93 | 12 | |||||||||||
| * | For the six months ended June 30, 2013 and 2012, the weighted average number of shares was 1,193 million (diluted 1,195 million) and 1,191 million (diluted: 1,191 million), respectively (treasury stock excluded). |
Due to rounding, numbers may not add up precisely.
| 28 | INTERIM REPORT JANUARY – JUNE 2013 |
Table of Contents
CONSOLIDATED STATEMENTS OF COMPREHENSIVE INCOME
For the six months ended June 30
| € millions |
2013 | 2012 | ||||||
| Profit after tax |
1,244 | 1,104 | ||||||
| Items that will not be reclassified to profit and loss |
||||||||
| Remeasurements on defined benefit pension plans |
3 | –3 | ||||||
| Income tax relating to items that will not be reclassified |
–3 | 1 | ||||||
| Other comprehensive income after tax for items that will not be reclassified to profit and loss |
0 | –2 | ||||||
| Items that will be reclassified subsequently to profit and loss |
||||||||
| Exchange differences on translation |
–90 | 171 | ||||||
| Available-for-sale financial assets |
5 | 33 | ||||||
| Cash flow hedges |
18 | 6 | ||||||
| Income tax relating to items that will be reclassified |
–2 | 4 | ||||||
| Other comprehensive income after tax for items that will be reclassified to profit and loss |
–69 | 214 | ||||||
| Other comprehensive income net of tax |
–69 | 212 | ||||||
| Total comprehensive income |
1,175 | 1,316 | ||||||
| – Attributable to owners of parent |
1,175 | 1,316 | ||||||
| – Attributable to non-controlling interests |
0 | 0 | ||||||
| CONSOLIDATED INTERIM FINANCIAL STATEMENTS - IFRS | 29 |
Table of Contents
CONSOLIDATED STATEMENTS OF FINANCIAL POSITION
As at June 30, 2013, and December 31, 2012
| € millions |
Notes | 2013 | 2012 | |||||||||
| Cash and cash equivalents |
3,386 | 2,477 | ||||||||||
| Other financial assets |
(8 | ) | 296 | 154 | ||||||||
| Trade and other receivables |
(9 | ) | 3,379 | 3,917 | ||||||||
| Other non-financial assets |
408 | 294 | ||||||||||
| Tax assets |
308 | 156 | ||||||||||
| Total current assets |
7,776 | 6,998 | ||||||||||
| Goodwill |
13,333 | 13,227 | ||||||||||
| Intangible assets |
2,996 | 3,234 | ||||||||||
| Property, plant, and equipment |
1,751 | 1,708 | ||||||||||
| Other financial assets |
(8 | ) | 495 | 509 | ||||||||
| Trade and other receivables |
(9 | ) | 92 | 88 | ||||||||
| Other non-financial assets |
97 | 68 | ||||||||||
| Tax assets |
192 | 170 | ||||||||||
| Deferred tax assets |
761 | 708 | ||||||||||
| Total non-current assets |
19,717 | 19,711 | ||||||||||
| Total assets |
27,494 | 26,710 | ||||||||||
| 30 | INTERIM REPORT JANUARY – JUNE 2013 |
Table of Contents
| € millions |
Notes | 2013 | 2012 | |||||||||
| Trade and other payables |
883 | 870 | ||||||||||
| Tax liabilities |
395 | 511 | ||||||||||
| Financial liabilities |
(10 | ) | 1,365 | 802 | ||||||||
| Other non-financial liabilities |
1,404 | 2,136 | ||||||||||
| Provision TomorrowNow litigation |
235 | 234 | ||||||||||
| Other provisions |
390 | 609 | ||||||||||
| Provisions |
624 | 843 | ||||||||||
| Deferred income |
(11 | ) | 3,125 | 1,386 | ||||||||
| Total current liabilities |
7,797 | 6,547 | ||||||||||
| Trade and other payables |
47 | 63 | ||||||||||
| Tax liabilities |
396 | 388 | ||||||||||
| Financial liabilities |
(10 | ) | 3,859 | 4,446 | ||||||||
| Other non-financial liabilities |
107 | 98 | ||||||||||
| Provisions |
330 | 361 | ||||||||||
| Deferred tax liabilities |
518 | 574 | ||||||||||
| Deferred income |
(11 | ) | 62 | 62 | ||||||||
| Total non-current liabilities |
5,319 | 5,991 | ||||||||||
| Total liabilities |
13,116 | 12,538 | ||||||||||
| Issued capital |
1,229 | 1,229 | ||||||||||
| Share premium |
521 | 492 | ||||||||||
| Retained earnings |
14,212 | 13,973 | ||||||||||
| Other components of equity |
–263 | –194 | ||||||||||
| Treasury shares |
–1,330 | –1,337 | ||||||||||
| Equity attributable to owners of parent |
14,369 | 14,163 | ||||||||||
| Non-controlling interests |
9 | 8 | ||||||||||
| Total equity |
(12 | ) | 14,378 | 14,171 | ||||||||
| Equity and liabilities |
27,494 | 26,710 | ||||||||||
| CONSOLIDATED INTERIM FINANCIAL STATEMENTS - IFRS | 31 |
Table of Contents
CONSOLIDATED STATEMENTS OF CHANGES IN EQUITY
For the six months ended June 30
| € millions |
Equity Attributable to Owners of Parent | Non- Controlling Interests |
Total Equity |
|||||||||||||||||||||||||||||||||||||
| Issued Capital |
Share Premium |
Retained Earnings |
Other Components of Equity | Treasury Shares |
Total | |||||||||||||||||||||||||||||||||||
| Exchange Differ- ences |
Available- for-Sale Financial Assets |
Cash Flow Hedges |
||||||||||||||||||||||||||||||||||||||
| 1/1/2012 |
1,228 | 419 | 12,466 | –19 | 9 | –27 | –1,377 | 12,699 | 8 | 12,707 | ||||||||||||||||||||||||||||||
| Profit after tax |
1,104 | 1,104 | 1,104 | |||||||||||||||||||||||||||||||||||||
| Other comprehensive income |
–2 | 177 | 33 | 4 | 212 | 212 | ||||||||||||||||||||||||||||||||||
| Comprehensive income |
1,102 | 177 | 33 | 4 | 1,316 | 1,316 | ||||||||||||||||||||||||||||||||||
| Share-based payments |
14 | 14 | 14 | |||||||||||||||||||||||||||||||||||||
| Dividends |
–1,310 | –1,310 | –1,310 | |||||||||||||||||||||||||||||||||||||
| Issuance of shares under share-based payments |
10 | 10 | 10 | |||||||||||||||||||||||||||||||||||||
| Purchase of treasury shares |
–53 | –53 | –53 | |||||||||||||||||||||||||||||||||||||
| Reissuance of treasury shares under share-based payments |
13 | 83 | 96 | 96 | ||||||||||||||||||||||||||||||||||||
| Other changes |
2 | 2 | 1 | 3 | ||||||||||||||||||||||||||||||||||||
| 6/30/2012 |
1,228 | 456 | 12,260 | 158 | 42 | –23 | –1,347 | 12,774 | 9 | 12,783 | ||||||||||||||||||||||||||||||
| 1/1/2013 |
1,229 | 492 | 13,973 | –236 | 22 | 20 | –1,337 | 14,163 | 8 | 14,171 | ||||||||||||||||||||||||||||||
| Profit after tax |
1,245 | 1,245 | 1,244 | |||||||||||||||||||||||||||||||||||||
| Other comprehensive income |
0 | –87 | 5 | 13 | –69 | –69 | ||||||||||||||||||||||||||||||||||
| Comprehensive income |
1,245 | –87 | 5 | 13 | 1,175 | 1,175 | ||||||||||||||||||||||||||||||||||
| Share-based payments |
25 | 25 | 25 | |||||||||||||||||||||||||||||||||||||
| Dividends |
–1,013 | –1,013 | –1,013 | |||||||||||||||||||||||||||||||||||||
| Reissuance of treasury shares under share-based payments |
4 | 7 | 11 | 11 | ||||||||||||||||||||||||||||||||||||
| Other changes |
7 | 7 | 1 | 8 | ||||||||||||||||||||||||||||||||||||
| 6/30/2013 |
1,229 | 521 | 14,212 | –323 | 27 | 33 | –1,330 | 14,369 | 9 | 14,378 | ||||||||||||||||||||||||||||||
| 32 | INTERIM REPORT JANUARY – JUNE 2013 |
Table of Contents
CONSOLIDATED STATEMENTS OF CASH FLOWS
For the six months ended June 30
| € millions |
2013 | 2012 | ||||||
| Profit after tax |
1,244 | 1,104 | ||||||
| Adjustments to reconcile profit after taxes to net cash provided by operating activities: |
||||||||
| Depreciation and amortization |
478 | 402 | ||||||
| Income tax expense |
340 | 368 | ||||||
| Financial income, net |
37 | 26 | ||||||
| Decrease/increase in sales and bad debt allowances on trade receivables |
38 | 26 | ||||||
| Other adjustments for non-cash items |
44 | 24 | ||||||
| Decrease/increase in trade and other receivables |
470 | 362 | ||||||
| Decrease/increase in other assets |
–129 | –134 | ||||||
| Decrease/increase in trade payables, provisions, and other liabilities |
–945 | –752 | ||||||
| Decrease/increase in deferred income |
1,735 | 1,629 | ||||||
| Cash outflows due to TomorrowNow litigation |
–1 | –4 | ||||||
| Interest paid |
–80 | –96 | ||||||
| Interest received |
33 | 47 | ||||||
| Income taxes paid, net of refunds |
–782 | –602 | ||||||
| Net cash flows from operating activities |
2,482 | 2,400 | ||||||
| Business combinations, net of cash and cash equivalents acquired |
–99 | –2,757 | ||||||
| Purchase of intangible assets and property, plant, and equipment |
–265 | –275 | ||||||
| Proceeds from sales of intangible assets or property, plant, and equipment |
23 | 22 | ||||||
| Purchase of equity or debt instruments of other entities |
–1,200 | –558 | ||||||
| Proceeds from sales of equity or debt instruments of other entities |
1,079 | 941 | ||||||
| Net cash flows from investing activities |
–462 | –2,627 | ||||||
| Dividends paid |
–1,013 | –1,310 | ||||||
| Purchase of treasury shares |
0 | –53 | ||||||
| Proceeds from reissuance of treasury shares |
9 | 69 | ||||||
| Proceeds from issuing shares (share-based payments) |
0 | 14 | ||||||
| Proceeds from borrowings |
0 | 1,002 | ||||||
| Repayments of borrowings |
0 | –1,023 | ||||||
| Net cash flows from financing activities |
–1,004 | –1,301 | ||||||
| Effect of foreign exchange rates on cash and cash equivalents |
–107 | –61 | ||||||
| Net decrease/increase in cash and cash equivalents |
909 | –1,589 | ||||||
| Cash and cash equivalents at the beginning of the period |
2,477 | 4,965 | ||||||
| Cash and cash equivalents at the end of the period |
3,386 | 3,376 | ||||||
| CONSOLIDATED INTERIM FINANCIAL STATEMENTS - IFRS | 33 |
Table of Contents
NOTES TO THE CONSOLIDATED INTERIM FINANCIAL STATEMENTS
(1) General Information About Consolidated Interim Financial Statements
The accompanying Consolidated Interim Financial Statements of SAP AG and its subsidiaries (collectively, “we,” “us,” “our,” “SAP,” “Group,” and “Company”) have been prepared in accordance with the International Financial Reporting Standards (IFRS) and in particular in compliance with International Accounting Standard (IAS) 34. The designation IFRS includes all standards issued by the International Accounting Standards Board (IASB) and related interpretations issued by the International Financial Reporting Interpretations Committee (IFRIC). The variances between the applicable IFRS standards as issued by the IASB and the standards as used by the European Union are not relevant to these financial statements.
Certain information and disclosures normally included in the notes to annual financial statements prepared in accordance with IFRS have been condensed or omitted. We believe that the disclosures made are adequate and that the information gives a true and fair view.
Our business activities are influenced by certain seasonal effects. Historically, our overall revenue tends to be highest in the fourth quarter. Interim results are therefore not necessarily indicative of results for a full year.
Amounts reported in previous years have been reclassified as appropriate to conform to the presentation in this interim report.
These unaudited condensed Consolidated Interim Financial Statements should be read in conjunction with SAP’s audited Consolidated IFRS Financial Statements for the Year Ended December 31, 2012, included in our 2012 Annual Report (extract from the SAP Integrated Report 2012) and our Annual Report 2012 on Form 20-F.
Due to rounding, numbers presented throughout these Interim Financial Statements may not add up precisely to the totals we provide and percentages may not precisely reflect the absolute figures.
The following table summarizes the change in the number of legal entities included in the Consolidated Financial Statements.
Number of Legal Entities Consolidated in the Financial Statements
| German | Foreign | Total | ||||||||||
| January 1, 2012 |
23 | 176 | 199 | |||||||||
| Additions |
4 | 92 | 96 | |||||||||
| Disposals |
–5 | –23 | –28 | |||||||||
| December 31, 2012 |
22 | 245 | 267 | |||||||||
| Additions |
0 | 3 | 3 | |||||||||
| Disposals |
0 | –12 | –12 | |||||||||
| June 30, 2013 |
22 | 236 | 258 | |||||||||
The additions during the first half year of 2013 relate to legal entities added in connection with foundations and acquisitions. The disposals are due to mergers and liquidations of operating and non-operating acquired legal entities.
Our changes in the scope of consolidation in the first half year of 2013 were not significant to our Consolidated Financial Statements.
For more information about our business combinations and the effect on our Consolidated Financial Statements, see Note (4) and our Consolidated Financial Statements for 2012.
(3) Summary of Significant Accounting Policies
With the exception of the newly adopted accounting standards described below, the interim financial statements were prepared based on the same accounting policies as those applied and described in the Consolidated Financial Statements as at December 31, 2012. Our significant accounting policies are summarized in the Notes to the Consolidated Financial Statements. For more information, see Note (3) in our Annual Report for 2012.
Newly Adopted Accounting Standards
The following accounting standards newly adopted in the first half year of 2013 were relevant for the group:
| • | Amendments to IFRS 7 (Financial Instruments: Disclosures): Offsetting financial assets and financial liabilities; |
| • | IFRS 10 (Consolidated Financial Statements), IFRS 11 (Joint Arrangements), and IFRS 12 (Disclosure of Interests in Other Entities) including amendments to the transition guidance for IFRS 10–12 issued in June 2012 (in other words, we adopted the new standards earlier than required by the European Union); |
| 34 | INTERIM REPORT JANUARY – JUNE 2013 |
Table of Contents
| • | IFRS 13 (Fair Value Measurement); |
| • | Amendments to IAS 1 (Presentation of Financial Statements); |
| • | Amendments to IAS 19 (Employee Benefits). |
The retrospective application of the revised IAS 19 has resulted in the netting of balance sheet items (mandatory netting of plan assets with time credits and early retirement obligations). Prior year numbers were restated accordingly (netting of financial assets with provisions in the amount of €124 million). Apart from that, the adoption of the standards/amendments does not have a material impact on the Consolidated Financial Statements but results, for example, in additional disclosures and reclassifications.
New Accounting Standards Not Yet Adopted
For detailed information about new accounting standards not yet adopted, see Note (3) in our Annual Report for 2012.
We acquired the following businesses in the first half year in 2013:
Acquired Businesses
| Acquired Businesses | Sector | Acquisition Type |
Acquired Voting Interest |
Acquisition Date | ||||
| Ticket-Web GmbH & Co. KG Wildau, Germany | Solution provider of ticketing & customer relationship management. |
Asset Deal | n/a | March 4, 2013 | ||||
| KMS Software Company LLC. Los Angeles, CA USA |
Provider of employee onboarding solutions | Asset Deal | n/a | April 1, 2013 | ||||
| Camilion Solutions, Inc., Toronto, Canada | Solutions for the insurance industry | Share Deal | 100% | April 2, 2013 | ||||
| SmartOps Corporation, Pittsburgh, PA USA | Provider of inventory and service-level optimization software solutions | Share Deal | 100% | April 12, 2013 |
We acquire businesses in specific areas of strategic interest to us. All of the acquisitions listed in the above table are neither individually nor in aggregate material to SAP.
Acquisitions made in the preceding year, including the acquisition of SuccessFactors on February 21, 2012, and Ariba on October 1, 2012, are described in the Consolidated Financial Statements in our 2012 Annual Report.
| CONSOLIDATED INTERIM FINANCIAL STATEMENTS - IFRS | 35 |
Table of Contents
(5) Employee Benefits Expense and Headcount
Employee benefits expense comprises the following:
Employee Benefits Expense
| € millions |
Q2 2013 | 1/1-6/30/2013 | Q2 2012 | 1/1-6/30/2012 | ||||||||||||
| Salaries |
1,530 | 2,929 | 1,405 | 2,682 | ||||||||||||
| Social security expense |
203 | 441 | 186 | 387 | ||||||||||||
| Share-based payments |
39 | 109 | 98 | 181 | ||||||||||||
| Pension expense |
50 | 114 | 39 | 101 | ||||||||||||
| Termination benefits |
9 | 21 | 31 | 41 | ||||||||||||
| Employee-related restructuring expenses |
17 | 23 | 4 | 4 | ||||||||||||
| Employee Benefits Expense |
1,848 | 3,637 | 1,763 | 3,396 | ||||||||||||
Acquired companies are only included in the employee benefits expense as of the company’s acquisition date. SuccessFactors is therefore included in the employee benefits expense of prior year numbers as of February 21, 2012, Ariba is not included.
On June 30, 2013, the breakdown of our full-time equivalent employee numbers by function in SAP and by region was as shown in the table below. The increase in headcount in the SAP Group to 64,937 includes 3,043 employees from additions from business combinations (especially Ariba).
Number of Employees (in Full-Time Equivalents)
| June 30, 2013 | June 30, 2012 | |||||||||||||||||||||||||||||||
| Full-Time Equivalents | EMEA | Americas | APJ | Total | EMEA | Americas | APJ | Total | ||||||||||||||||||||||||
| Software and software-related services |
4,622 | 2,739 | 3,350 | 10,711 | 4,414 | 2,292 | 3,131 | 9,837 | ||||||||||||||||||||||||
| Professional services and other services |
6,916 | 4,388 | 2,892 | 14,197 | 6,857 | 4,187 | 2,687 | 13,731 | ||||||||||||||||||||||||
| Research and development |
8,525 | 3,516 | 5,334 | 17,374 | 8,851 | 3,487 | 4,993 | 17,331 | ||||||||||||||||||||||||
| Sales and marketing |
6,301 | 6,498 | 3,050 | 15,849 | 5,493 | 5,436 | 2,860 | 13,789 | ||||||||||||||||||||||||
| General and administration |
2,285 | 1,417 | 661 | 4,363 | 2,119 | 1,289 | 616 | 4,024 | ||||||||||||||||||||||||
| Infrastructure |
1,309 | 823 | 312 | 2,443 | 1,241 | 738 | 281 | 2,260 | ||||||||||||||||||||||||
| SAP Group (June 30) |
29,957 | 19,380 | 15,600 | 64,937 | 28,975 | 17,429 | 14,568 | 60,972 | ||||||||||||||||||||||||
| SAP Group (average first six months) |
29,866 | 19,296 | 15,593 | 64,756 | 28,612 | 16,980 | 13,834 | 59,426 | ||||||||||||||||||||||||
| 36 | INTERIM REPORT JANUARY – JUNE 2013 |
Table of Contents
The allocations of expenses for share-based payments to the various expense items are as follows:
Share-Based Payments
| € millions |
Q2 2013 | 1/1- 6/30/ 2013 |
Q2 2012 | 1/1- 6/30/ 2012 |
||||||||||||
| Cost of software and software-related services |
4 | 13 | 12 | 18 | ||||||||||||
| Cost of professional services and other services |
8 | 20 | 24 | 48 | ||||||||||||
| Research and development |
14 | 33 | 29 | 44 | ||||||||||||
| Sales and marketing |
10 | 31 | 24 | 45 | ||||||||||||
| General and administration |
3 | 12 | 9 | 26 | ||||||||||||
| Share-based payments |
39 | 109 | 98 | 181 | ||||||||||||
In the second quarter and the first half year of 2013, income taxes and the effective tax rate, each compared with the second quarter and the first half year of 2012, were as follows:
Income Taxes
| € millions, unless stated otherwise |
Q2 2013 | 1/1- 6/30/ 2013 |
Q2 2012 | 1/1- 6/30/ 2012 |
||||||||||||
| Profit before income tax |
963 | 1,584 | 865 | 1,472 | ||||||||||||
| Income tax expense |
–239 | –340 | –204 | –368 | ||||||||||||
| Effective tax rate in % |
24.8 | 21.5 | 23.6 | 25.0 | ||||||||||||
Earnings per Share
| € millions, unless otherwise stated |
Q2 2013 | 1/1- 6/30/2013 |
Q2 2012 | 1/1- 6/30/2012 |
||||||||||||
| Profit attributable to owners of parent |
725 | 1,245 | 661 | 1,104 | ||||||||||||
| Issued ordinary shares |
1,229 | 1,229 | 1,228 | 1,228 | ||||||||||||
| Effect of treasury shares |
–36 | –36 | –37 | –37 | ||||||||||||
| Weighted average number of shares in millions – basic |
1,193 | 1,193 | 1,191 | 1,191 | ||||||||||||
| Dilutive effect of free-matching shares in millions |
2 | 2 | 1 | 0 | ||||||||||||
| Weighted average number of shares in millions – diluted |
1,195 | 1,195 | 1,192 | 1,191 | ||||||||||||
| Earnings per share, attributable to owners of parent – basic (in €) |
0.61 | 1.04 | 0.55 | 0.93 | ||||||||||||
| Earnings per share, attributable to owners of parent – diluted (in €) |
0.61 | 1.04 | 0.55 | 0.93 | ||||||||||||
| CONSOLIDATED INTERIM FINANCIAL STATEMENTS - IFRS | 37 |
Table of Contents
Other financial assets comprise:
Other Financial Assets
| June 30, 2013 | ||||||||||||
| € millions | Current | Non-Current | Total | |||||||||
| Loans and other financial receivables |
147 | 207 | 354 | |||||||||
| Debt investments |
42 | 1 | 43 | |||||||||
| Equity investments |
0 | 236 | 236 | |||||||||
| Available-for-sale financial assets |
42 | 237 | 279 | |||||||||
| Derivatives |
107 | 1 | 108 | |||||||||
| Investments in associates |
0 | 50 | 50 | |||||||||
| Total |
296 | 495 | 791 | |||||||||
| December 31, 2012 | ||||||||||||
| € millions | Current | Non-Current | Total | |||||||||
| Loans and other financial receivables |
35 | 208 | 243 | |||||||||
| Debt investments |
15 | 14 | 29 | |||||||||
| Equity investments |
0 | 201 | 201 | |||||||||
| Available-for-sale financial assets |
15 | 215 | 230 | |||||||||
| Derivatives |
104 | 40 | 144 | |||||||||
| Investments in associates |
0 | 46 | 46 | |||||||||
| Total |
154 | 509 | 663 | |||||||||
(9) Trade and Other Receivables
Trade and other receivables comprise:
Trade and Other Receivables
| June 30, 2013 | ||||||||||||
| € millions | Current | Non-Current | Total | |||||||||
| Trade receivables, net |
3,349 | 0 | 3,349 | |||||||||
| Other receivables |
30 | 92 | 122 | |||||||||
| Total |
3,379 | 92 | 3,471 | |||||||||
| December 31, 2012 | ||||||||||||
| € millions | Current | Non-Current | Total | |||||||||
| Trade receivables, net |
3,837 | 0 | 3,837 | |||||||||
| Other receivables |
80 | 88 | 168 | |||||||||
| Total |
3,917 | 88 | 4,005 | |||||||||
The carrying amounts of our trade receivables and related allowances were as follows:
Carrying Amounts of Trade Receivables
| € millions | June 30, 2013 |
December 31, 2012 |
||||||
| Gross carrying amount |
3,491 | 3,943 | ||||||
| Sales allowances charged to revenue |
–106 | –73 | ||||||
| Allowance for doubtful accounts charged to expense |
–36 | –33 | ||||||
| Carrying amount trade receivables, net |
3,349 | 3,837 | ||||||
| 38 | INTERIM REPORT JANUARY – JUNE 2013 |
Table of Contents
Financial liabilities comprise:
Financial Liabilities
| June 30, 2013 | ||||||||||||
| € millions | Current | Non-Current | Total | |||||||||
| Bank loans |
0 | 0 | 0 | |||||||||
| Private placement transactions |
86 | 2,020 | 2,106 | |||||||||
| Bonds |
1,099 | 1,789 | 2,888 | |||||||||
| Other financial liabilities |
180 | 50 | 230 | |||||||||
| Financial liabilities |
1,365 | 3,859 | 5,224 | |||||||||
| December 31, 2012 | ||||||||||||
| € millions | Current | Non-Current | Total | |||||||||
| Bank loans |
0 | 0 | 0 | |||||||||
| Private placement transactions |
0 | 2,088 | 2,088 | |||||||||
| Bonds |
600 | 2,287 | 2,887 | |||||||||
| Other financial liabilities |
202 | 71 | 273 | |||||||||
| Financial liabilities |
802 | 4,446 | 5,248 | |||||||||
On June 30, 2013, our current deferred income was €3.125 million (December 31, 2012: €1.386 million) and our non-current deferred income was €62 million (December 31, 2012: €62 million). On June 30, 2013, current deferred income includes a total of €354 million in deferred revenue (December 31, 2012: €317 million; June 30, 2012: €155 million), which in future will likely be recognized as revenue from cloud subscriptions and support.
Issued Shares
On June 30, 2013, SAP AG had 1,228,504,232 no-par issued shares (December 31, 2012: 1,228,504,232) issued with a calculated nominal value of €1 per share. Thus, issued shares remain unchanged in the first half of 2013. In the first half of 2012, the number of issued shares increased by 256,216 shares (Q2 2012: 0), resulting from the exercise of awards granted under certain share-based payments.
Treasury Shares
On June 30, 2013, we held 36 million treasury shares, representing €36 million or 2.94% of capital stock.
In the first half of 2013, we did not acquire shares for treasury and disposed 0.2 million (Q2 2013: 0.1 million) shares at an average price of approximately €36.80 (Q2 2013: €36.80) per share.
In the first half of 2012, we acquired 1.1 million shares (Q2 2012: 0 million) with a purchase price of approximately €48.14 per share and disposed 2.3 million (Q2 2012: 1.0 million) shares at an average price of approximately €36.64 (Q2 2012: €36.80) per share.
Share purchases and share sales in 2013 and 2012 were in connection with our share-based payments, which are described in Note (27) in the Annual Report for 2012.
Other Comprehensive Income
The component of other comprehensive income before tax that will be reclassified to profit or loss in the future includes the following items for the second quarter:
| € millions | Q2 2013 | Q2 2012 | ||||||
| Gains (losses) on exchange differences on translation |
–319 | 335 | ||||||
| Reclassification adjustments on exchange differences on translation |
0 | 0 | ||||||
| Exchange differences on translation |
–319 | 335 | ||||||
| Gains (losses) on remeasuring available-for-sale financial assets |
5 | –3 | ||||||
| Reclassification adjustments on available-for-sale financial assets |
0 | 1 | ||||||
| Available-for-sale financial assets |
5 | –2 | ||||||
| Gains (losses) on cash flow hedges |
37 | –28 | ||||||
| Reclassification adjustments on cash flow hedges |
–19 | 11 | ||||||
| Cash flow hedges |
18 | –17 | ||||||
| CONSOLIDATED INTERIM FINANCIAL STATEMENTS - IFRS | 39 |
Table of Contents
The component of other comprehensive income before tax that will be reclassified to profit or loss in the future includes the following items for the first half year:
| € millions | 1/1- 6/30/ 2013 |
1/1- 6/30/ 2012 |
||||||
| Gains (losses) on exchange differences on translation |
–90 | 171 | ||||||
| Reclassification adjustments on exchange differences on translation |
0 | 0 | ||||||
| Exchange differences on translation |
–90 | 171 | ||||||
| Gains (losses) on remeasuring available-for-sale financial assets |
5 | 32 | ||||||
| Reclassification adjustments on available-for-sale financial assets |
0 | 1 | ||||||
| Available-for-sale financial assets |
5 | 33 | ||||||
| Gains (losses) on cash flow hedges |
50 | –12 | ||||||
| Reclassification adjustments on cash flow hedges |
–32 | 18 | ||||||
| Cash flow hedges |
18 | 6 | ||||||
For a detailed description of our contingent liabilities, see our 2012 Annual Report, Notes to the Consolidated Financial Statements section, Note (22). There have been no significant changes in contingent liabilities since December 31, 2012.
For information about contingent liabilities related to litigation, see Note (14).
We are subject to a variety of claims and lawsuits that arise from time to time in the ordinary course of our business, including proceedings and claims that relate to companies we have acquired, and claims that relate to customers demanding indemnification for proceedings initiated against them based on their use of SAP software. We will continue to vigorously defend against all claims and lawsuits against us. We record a provision for such matters when it is probable that we have a present obligation that results from a past event, is reliably estimable, and the settlement of which is probable to require an outflow of resources embodying economic benefits. For the TomorrowNow litigation, we have recorded a provision of US$306 million (US$272 million on December 31, 2011, US$1.3 billion on December 31, 2010). We currently believe that resolving all other claims and lawsuits against us, individually or in the aggregate, did not and will not have a material adverse effect on our business, financial position, profit, or cash flows. Consequently, the provisions currently recorded for these other claims and lawsuits are neither individually nor in aggregate material to SAP.
However, the outcome of litigation and other claims or lawsuits is intrinsically subject to considerable uncertainty. Management’s view of the litigation may also change in the future. Actual outcomes of litigation and other claims or lawsuits may differ from the assessments made by management in prior periods, which could result in a material impact on our business, financial position, profit, cash flows, or reputation. We cannot reliably estimate the maximum possible loss in case of an unfavorable outcome.
For a description of the development of the provisions recorded for litigation, see our Annual Report 2012, Notes to the Consolidated Financial Statements section, Note (18b).
Among the claims and lawsuits are the following:
Intellectual Property Litigation
In March 2007, United States-based Oracle Corporation and certain of its subsidiaries (Oracle) instituted legal proceedings in the United States against TomorrowNow, Inc., its parent company SAP America, Inc. and SAP America’s parent company SAP AG (SAP). Oracle filed several amended complaints between 2007 and 2009. As amended, the lawsuit alleges copyright infringement, violations of the Federal Computer Fraud and Abuse Act and the California Computer Data Access and Fraud Act, unfair competition, intentional and negligent interference with prospective economic advantage, and civil conspiracy. The lawsuit alleges that SAP unlawfully copied and misappropriated proprietary, copyrighted software products and other confidential materials developed by Oracle to service its own customers. The lawsuit sought injunctive relief and monetary damages, including punitive damages, alleged by Oracle to be in the billions of U.S. dollars. The trial was held in November 2010. Prior to trial, SAP AG, SAP America and TomorrowNow stipulated to liability for certain claims, and SAP agreed to pay Oracle US$120 million for attorneys’ fees. After the trial, the jury returned a damages verdict of US$1.3 billion. The judgment which was issued on February 3, 2011, additionally provided for prejudgment interest of US$15 million. The judgment amount is also subject to post-judgment interest, which accrues from the time judgment is entered.
The jury based its verdict on the theory of a hypothetical license, that is, the value of what TomorrowNow would have paid if it had negotiated with Oracle a license for the copyrights infringed by TomorrowNow. Before and during the course of the trial, various damages amounts had been presented by the parties to the litigation. They included the following:
a) Before the trial, Oracle had requested damages in excess of US$3.5 billion based on alleged “saved acquisition costs,” the court dismissed that damage claim based on a pretrial motion, but Oracle has the right to appeal that dismissal.
b) During the trial, Oracle’s damages experts presented an amount of US$408 million based on lost profits and disgorgement of infringer’s profit.
c) During the trial, members of Oracle management presented, as part of their testimonies, amounts of up to US$5 billion. Oracle’s damages expert presented a damages estimate of “at least” US$1.655 billion under a hypothetical license theory. Oracle’s counsel asked the jury to award “somewhere between US$1.65 and US$3 billion.”
d) During the trial, the damages expert for TomorrowNow and SAP presented an amount of US$28 million based on lost profits and infringer’s profits or, alternatively, US$40.6 million based on a hypothetical license theory. Counsel for SAP and TomorrowNow asked the jury to award US$28 million.
| 40 | INTERIM REPORT JANUARY – JUNE 2013 |
Table of Contents
We believed both before and during the trial and continue to believe that the hypothetical license theory is not an appropriate basis for calculating the damages. Instead, we believe that damages should be based on lost profits and infringer’s profits. As such, SAP filed post-trial motions asking the judge to overturn the judgment. A hearing on the post-trial motions was held in July 2011. On September 1, 2011, the trial judge issued an order which set aside the jury verdict and vacated that part of the judgment awarding US$1.3 billion in damages. The trial judge also gave Oracle the choice of accepting reduced damages of US$272 million or having a new trial based on lost profits and infringer’s profits. Oracle filed a motion seeking an early appeal from the ruling vacating the jury’s damages award, which was denied by the judge. Consequently, Oracle elected to proceed with a new trial. In lieu of a new trial, the parties stipulated to a judgment of US$306 million while each preserving all rights for appeal. Both parties have filed their respective notice of appeal. On appeal, Oracle is seeking three forms of relief: (1) reinstatement of the November 2010 $1.3 billion verdict; (2) as a first alternative, a new trial at which Oracle may again seek hypothetical license damages (based in part on evidence of alleged saved development costs) plus SAP’s alleged infringer’s profits without any deduction of expenses (Oracle does not put a number on its claim for the requested new trial); and (3) as a second alternative, increase of the remittitur (alternative to new trial) to $408.7 million (versus the $272 million Oracle had previously rejected). SAP has dismissed its cross-appeal. The hearing is not yet scheduled.
Additionally, in June 2007, SAP became aware that the United States Department of Justice (U.S. DOJ) had opened an investigation concerning related issues and had issued subpoenas to SAP and TomorrowNow. The DOJ investigation has been resolved by way of a plea agreement which includes TomorrowNow pleading guilty to 11 counts of violations of the Computer Fraud and Abuse Act, one count of criminal copyright infringement, the payment of a US$20 million fine and three years probation. No charges were brought against SAP AG or subsidiaries thereof other than TomorrowNow.
In April 2007, United States-based Versata Software, Inc. (formerly Trilogy Software, Inc.) (Versata) instituted legal proceedings in the United States against SAP. Versata alleged that SAP’s products infringe one or more of the claims in each of five patents held by Versata. In its complaint, Versata sought unspecified monetary damages and permanent injunctive relief. The first trial was held in August 2009. The jury returned a verdict in favor of Versata and awarded Versata US$138.6 million for past damages. In January 2011, the court vacated the jury’s damages award and ordered a new trial on damages. The re-trial was held in May 2011. The jury returned a verdict in favor of Versata and awarded Versata US$345 million for past damages. In September 2011, the judge denied SAP’s post-trial motions with the exception of reducing the damages verdict by US$16 million to approximately US$329 million. The judge also ordered approximately US$60 million in pre-judgment interest. Additionally, the judge granted Versata’s request for a broad injunction which prohibits SAP from 1) selling products in the United States with the infringing functionality, 2) providing maintenance to or accepting maintenance revenue from existing customers in the United States until such customers disable the infringing functionality and verify such disablement, and 3) licensing additional users to existing customers in the United States until such customers disable the infringing functionality and verify such disablement. Finally, the judge stayed the injunction pending the outcome of an appeal. Both parties appealed. The hearing occurred in February 2013 and a decision was issued on May 1, 2013. The three judge panel ruled in Versata’s favor on infringement and damages, leaving both fully intact. The past damages verdict currently stands at approximately $390 million. Regarding the injunction, the court ruled that the injunction was too broad, stating that SAP should be able to provide maintenance or additional seats for prior customers of the infringing products, so long as the maintenance or the additional seat does not involve, or allow access to, the “enjoined capability” where enjoined capability is defined as the capability to execute a pricing procedure using hierarchical access of customer and product data. SAP has filed a petition seeking rehearing by the 3-judge panel that issued this decision and/or by the entire appeals court. The appeals court has requested that Versata respond to SAP’s petition no later than July 29, 2013.
Additionally, SAP filed a petition with the United States Patent Office (USPTO) challenging the validity of the asserted Versata patent. In January 2013, the USPTO granted SAP’s request to reconsider the validity of Versata’s patent and instituted the relevant procedure (transitional post grant review). A decision issued in June 2013 rendering all challenged patent claims (including all the patent claims SAP was found to have infringed) unpatentable. Versata has filed with the USPTO a request seeking reconsideration of the decision on six different grounds. The USPTO invited SAP to file an opposition responding to two of the six grounds.
In June, 2013, SAP filed a request with the appeals court to stay the litigation pending review of the USPTO decision. That request was denied in early July, 2013.
In August 2007, United States-based elcommerce.com, Inc. (elcommerce) instituted legal proceedings in the United States against SAP. elcommerce alleged that SAP’s products infringe one or more of the claims in one patent held by elcommerce. In its complaint, elcommerce sought unspecified monetary damages and permanent injunctive relief. The court in East Texas granted SAP’s request to transfer the litigation from East Texas to Pennsylvania. Subsequent to the Markman ruling by the court, the parties agreed to the entry of final judgment regarding non-infringement by SAP. elcommerce has appealed the court’s Markman ruling. The hearing for the appeal was held in May 2012.
| CONSOLIDATED INTERIM FINANCIAL STATEMENTS - IFRS | 41 |
Table of Contents
In February 2010, United States-based TecSec, Inc. (TecSec) instituted legal proceedings in the United States against SAP, Sybase, IBM, and many other defendants. TecSec alleged that SAP’s products infringe one or more of the claims in five patents held by TecSec. In its complaint, TecSec seeks unspecified monetary damages and permanent injunctive relief. The trial has not yet been scheduled. The legal proceedings have been stayed against all defendants pending the outcome of an appeal by TecSec regarding the court’s determination that IBM does not infringe the patents. SAP, along with the other defendants, is now appealing. The hearing occurred in March 2013 and a decision is expected mid-year 2013 or later.
In April 2010, SAP instituted legal proceedings (a Declaratory Judgment action) in the United States against Wellogix, Inc. and Wellogix Technology Licensing, LLC (Wellogix). The lawsuit seeks a declaratory judgment that five patents owned by Wellogix are invalid and/or not infringed by SAP. The trial has not yet been scheduled. The legal proceedings have been stayed pending the outcome of re-examinations filed with the U.S. Patent and Trademark Office.
Other Litigation
In April 2008, South African-based Systems Applications Consultants (PTY) Limited (Securinfo) instituted legal proceedings in South Africa against SAP. Securinfo alleges that SAP has caused one of its subsidiaries to breach a software distribution agreement with Securinfo. In its complaint, Securinfo seeks damages of approximately €610 million plus interest. In September 2009, SAP filed a motion to dismiss which was rejected. A trial date which was scheduled for June 2011 has been postponed.
In November 2012, SAP filed a motion to dismiss based on a procedural aspect of the case. The court followed SAP’s argument and dismissed the claim by Securinfo. Securinfo appealed against this decision on December 19, 2012.
We are subject to ongoing audits by domestic and foreign tax authorities. Along with many other companies operating in Brazil, we are involved in various proceedings with Brazilian authorities regarding assessments and litigation matters on non-income taxes on intercompany royalty payments and intercompany services. The total potential amount related to these matters for all applicable years is approximately €87 million. We have not recorded a provision for these matters, as we believe that we will prevail on these matters.
For more information about income tax risk-related litigation, see our Annual Report 2012, Notes to the Consolidated Financial Statements section, Note 10.
For a detailed description of our share-based payment plans, see our Annual Report 2012, Notes to the Consolidated Financial Statements section, Note (27).
The outstanding bonus shares under the Share Matching Plan are:
Outstanding Restricted Shares
| Number in thousands | June 30, 2013 |
December 31, 2012 |
||||||
| Share Matching Plan 2010 (Bonus shares) |
487 | 497 | ||||||
| Share Matching Plan 2011 (Bonus shares) |
436 | 448 | ||||||
| Share Matching Plan 2012 (Bonus shares) |
3,034 | 3,124 | ||||||
(16) Other Financial Instruments
A detailed overview of our other financial instruments, financial risk factors, and the management of financial risks are presented in Notes (24) to (26) to our Consolidated Financial Statements for 2012, which are included in our 2012 Integrated Report, and our Annual Report 2012 on Form 20-F.
There have been no significant changes with regards to our financial risk profile since December 31, 2012, except for the following: With regard to the planned acquisition of hybris and to safeguard our liquidity, SAP AG secured a €1.0 billion dual-currency credit facility agreement with an initial term of 12 months allowing a drawdown in EUR or USD. Borrowings under the facility bear interest of EURIBOR or LIBOR for the respective currency plus a margin of 60 basis points to 90 basis points.
In the following, we disclose the fair value of financial instruments, valuation techniques and inputs used and the level of the fair value hierarchy within which the fair value measurements are categorized.
Fair Value of Financial Instruments
We use various types of financial instruments in the ordinary course of business which are grouped into the following categories: loans and receivables (L&R), available-for-sale (AFS), held-for-trading (HFT), and amortized cost (AC). The table below shows the carrying amounts and fair values of financial assets and liabilities by category of financial instrument as well as by category of IAS 39. Since the line items “Trade receivables,” “Trade payables,” and “Other financial assets” contain both financial and non-financial assets or liabilities (such as other taxes or advance payments), the non-financial assets or liabilities are shown in the column headed “Not in Scope of IFRS 7” to allow a reconciliation to the corresponding line items in the Consolidated Statements of Financial Position. The carrying amounts and fair values of our financial instruments on June 30, 2013, were as follows:
| 42 | INTERIM REPORT JANUARY – JUNE 2013 |
Table of Contents
Fair Values of Financial Instruments
| 2013 | ||||||||||||||||||||||||||||
| Measurement Categories | Not in Scope of IFRS 7 |
|||||||||||||||||||||||||||
| € millions |
Category | Book Value 6/30/ 2013 |
At Amortized Cost |
At Cost |
At Fair Value |
Fair Value 6/30/ 2013 |
||||||||||||||||||||||
| Assets |
||||||||||||||||||||||||||||
| Cash and cash equivalents |
L&R | 3,386 | 3,386 | 3,386 | ||||||||||||||||||||||||
| Trade receivables |
L&R | 3,471 | 3,349 | 3,349 | 122 | |||||||||||||||||||||||
| Other financial assets |
791 | |||||||||||||||||||||||||||
| Debt securities |
L&R/AFS | 43 | 43 | |||||||||||||||||||||||||
| Equity securities |
AFS/- | 169 | 67 | 67 | 50 | |||||||||||||||||||||||
| Other nonderivative financial assets |
L&R | 256 | 256 | 98 | ||||||||||||||||||||||||
| Derivative assets |
||||||||||||||||||||||||||||
| With hedging relationship |
– | 47 | 47 | |||||||||||||||||||||||||
| Without hedging relationship |
HFT | 61 | 61 | |||||||||||||||||||||||||
| Liabilities |
||||||||||||||||||||||||||||
| Trade payables |
AC | –930 | –700 | –700 | –230 | |||||||||||||||||||||||
| Financial liabilities |
–5,224 | |||||||||||||||||||||||||||
| Nonderivative financial liabilities |
AC | –5,068 | –5,130 | |||||||||||||||||||||||||
| Derivatives |
||||||||||||||||||||||||||||
| With hedging relationship |
– | –3 | –3 | |||||||||||||||||||||||||
| Without hedging relationship |
HFT | –153 | –153 | |||||||||||||||||||||||||
| Total financial instruments, net |
1,494 | 1,223 | 169 | 62 | 1,223 | 40 | ||||||||||||||||||||||
| Aggregation according to IAS 39 |
||||||||||||||||||||||||||||
| Financial assets |
||||||||||||||||||||||||||||
| At fair value through profit or loss |
HFT | 61 | 61 | 61 | ||||||||||||||||||||||||
| Available-for-sale |
AFS | 279 | 169 | 110 | 110 | |||||||||||||||||||||||
| Loans and receivables |
L&R | 7,113 | 6,991 | 6,991 | 122 | |||||||||||||||||||||||
| Financial liabilities |
||||||||||||||||||||||||||||
| At fair value through profit or loss |
HFT | –153 | –153 | –153 | ||||||||||||||||||||||||
| At amortized cost |
AC | –5,998 | –5,768 | –5,830 | –230 | |||||||||||||||||||||||
| Outside scope of IAS 39 |
||||||||||||||||||||||||||||
| Financial instruments related to employee benefit plans |
98 | 98 | ||||||||||||||||||||||||||
| Investment in associates |
50 | 50 | ||||||||||||||||||||||||||
| Derivatives with hedging relationship |
44 | 44 | 44 | |||||||||||||||||||||||||
| Total financial instruments, net |
1,494 | 1,223 | 169 | 62 | 1,223 | 40 | ||||||||||||||||||||||
| INTERIM REPORT JANUARY – JUNE 2013 | 43 |
Table of Contents
| € millions |
2012 | |||||||||||||||||||||||||||
| Book
Value 12/31/ 2012 |
Measurement Categories | Fair
Value 12/31/ 2012 |
Not in Scope of IFRS 7 |
|||||||||||||||||||||||||
| Category | At Amortized Cost |
At Cost | At Fair Value |
|||||||||||||||||||||||||
| Assets |
||||||||||||||||||||||||||||
| Cash and cash equivalents |
L&R | 2,477 | 2,477 | 2,477 | ||||||||||||||||||||||||
| Trade receivables |
L&R | 4,005 | 3,837 | 3,837 | 168 | |||||||||||||||||||||||
| Other financial assets |
663 | |||||||||||||||||||||||||||
| Debt securities |
L&R/AFS | 29 | 29 | |||||||||||||||||||||||||
| Equity securities |
AFS/- | 149 | 52 | 52 | 46 | |||||||||||||||||||||||
| Other nonderivative financial assets |
L&R | 159 | 159 | 84 | ||||||||||||||||||||||||
| Derivative assets |
||||||||||||||||||||||||||||
| With hedging relationship |
– | 29 | 29 | |||||||||||||||||||||||||
| Without hedging relationship |
HFT | 115 | 115 | |||||||||||||||||||||||||
| Liabilities |
||||||||||||||||||||||||||||
| Trade payables |
AC | –933 | –684 | –684 | –249 | |||||||||||||||||||||||
| Financial liabilities |
–5,248 | |||||||||||||||||||||||||||
| Nonderivative financial liabilities |
AC | –5,051 | –5,228 | |||||||||||||||||||||||||
| Derivatives |
||||||||||||||||||||||||||||
| With hedging relationship |
- | –2 | –2 | |||||||||||||||||||||||||
| Without hedging relationship |
HFT | –195 | –195 | |||||||||||||||||||||||||
| Total financial instruments, net |
964 | 738 | 149 | 28 | 589 | 49 | ||||||||||||||||||||||
| Aggregation according to IAS 39 |
||||||||||||||||||||||||||||
| Financial assets |
||||||||||||||||||||||||||||
| At fair value through profit or loss |
HFT | 115 | 115 | 115 | ||||||||||||||||||||||||
| Available-for-sale |
AFS | 230 | 149 | 81 | 81 | |||||||||||||||||||||||
| Loans and receivables |
L&R | 6,641 | 6,473 | 6,473 | 168 | |||||||||||||||||||||||
| Financial liabilities |
||||||||||||||||||||||||||||
| At fair value through profit or loss |
HFT | –195 | –195 | –195 | ||||||||||||||||||||||||
| At amortized cost |
AC | –5,984 | –5,735 | –5,912 | –249 | |||||||||||||||||||||||
| Outside scope of IAS 39 |
||||||||||||||||||||||||||||
| Financial instruments related to employee benefit plans |
84 | 84 | ||||||||||||||||||||||||||
| Investment in associates |
46 | 46 | ||||||||||||||||||||||||||
| Derivatives with hedging relationship |
27 | 27 | 27 | |||||||||||||||||||||||||
| Total financial instruments, net |
964 | 738 | 149 | 28 | 589 | 49 | ||||||||||||||||||||||
Determination of Fair Value
IFRS 13 defines fair value as the price that would be received to sell an asset or paid to transfer a liability in an orderly transaction between market participants on the measurement date.
Accordingly, best evidence of fair value provides quoted prices in an active market. Where market prices are not readily available, valuation techniques have to be used to establish fair value. Depending on the inputs used in and their significance for the valuation techniques, we have categorized our financial instruments at fair value into a three-level fair value hierarchy as mandated by IFRS 13.
The fair value hierarchy gives the highest priority to quoted prices in active markets for identical assets or liabilities (Level 1) and the lowest priority to unobservable inputs (Level 3). The inputs used to measure fair value for one single instrument may fall into different levels of the fair value hierarchy. In such cases, the level in the fair value hierarchy within which the fair value measurement in its entirety falls has been determined based on the lowest level input that is significant to the fair value measurement in its entirety. Our assessment of the significance of a particular input to the fair value measurement in its entirety requires judgment, and considers factors specific to the asset or liability.
| 44 | CONSOLIDATED INTERIM FINANCIAL STATEMENTS – IFRS |
Table of Contents
The levels of the fair value hierarchy, its application to our financial assets and liabilities, and the respective determination of fair value are described below:
| • | Level 1: Quoted prices in active markets for identical assets or liabilities. |
| • | Marketable available-for-sale debt and equity investments: The fair values of these securities are based on quoted market prices on June 30. |
| • | Level 2: Inputs other than quoted prices included within Level 1 that are observable for the asset or liability, either directly or indirectly. |
| • | Derivative financial instruments: The fair value of foreign exchange forward contracts is based on discounting the expected future cash flows over the respective remaining term of the contracts, using the respective market interest rates appropriate to the remaining term of the forwards contracts. The fair value of our foreign currency options is calculated taking into account current spot rates and strike prices, the volatility of the respective currencies, the remaining term of the options, as well as market interest rates. The fair value of the derivatives entered into to hedge our share-based payments are calculated considering risk-free interest rates, the remaining term of the derivatives, the dividend yields, the stock price, and the volatility of our share. |
| • | Available-for-sale equity investments in public companies: Certain of our equity investments in public companies were restricted from being sold for a limited period. Therefore, fair value is determined based on quoted market prices on June 30, deducting a discount for the disposal restriction based on the premium for a respective put option. |
| • | Level 3: Unobservable inputs for the assets or liabilities. |
The following table allocates those financial assets and liabilities that are measured at fair value in accordance with IAS 39 either through profit or loss or other comprehensive income on June 30, 2013, to the three levels of the fair value hierarchy according to IFRS 13.
Classification of Financial Instruments
| June 30, 2013 | December 31, 2012 | |||||||||||||||||||||||||||||||
| € millions |
Level 1 | Level 2 | Level 3 | Total | Level 1 | Level 2 | Level 3 | Total | ||||||||||||||||||||||||
| Financial assets |
||||||||||||||||||||||||||||||||
| Corporate Bonds |
25 | 0 | 0 | 25 | 27 | 0 | 0 | 27 | ||||||||||||||||||||||||
| Government securities |
3 | 0 | 0 | 3 | 0 | 0 | 0 | 0 | ||||||||||||||||||||||||
| Municipal bonds |
15 | 0 | 0 | 15 | 2 | 0 | 0 | 2 | ||||||||||||||||||||||||
| Debt investments |
43 | 0 | 0 | 43 | 29 | 0 | 0 | 29 | ||||||||||||||||||||||||
| Software industry |
52 | 15 | 0 | 67 | 52 | 0 | 0 | 52 | ||||||||||||||||||||||||
| Equity investments |
52 | 15 | 0 | 67 | 52 | 0 | 0 | 52 | ||||||||||||||||||||||||
| Available-for-sale financial assets |
95 | 15 | 0 | 110 | 81 | 0 | 0 | 81 | ||||||||||||||||||||||||
| FX forward contracts |
0 | 59 | 0 | 59 | 0 | 76 | 0 | 76 | ||||||||||||||||||||||||
| Call options for share-based payments |
0 | 49 | 0 | 49 | 0 | 68 | 0 | 68 | ||||||||||||||||||||||||
| Derivative financial assets |
0 | 108 | 0 | 108 | 0 | 144 | 0 | 144 | ||||||||||||||||||||||||
| Total |
95 | 123 | 0 | 218 | 81 | 144 | 0 | 225 | ||||||||||||||||||||||||
| Financial liabilities |
||||||||||||||||||||||||||||||||
| FX forward contracts |
0 | 156 | 0 | 156 | 0 | 197 | 0 | 197 | ||||||||||||||||||||||||
| Derivative financial liabilities |
0 | 156 | 0 | 156 | 0 | 197 | 0 | 197 | ||||||||||||||||||||||||
| Total |
0 | 156 | 0 | 156 | 0 | 197 | 0 | 197 | ||||||||||||||||||||||||
It is our policy to recognize transfers at the beginning of the respective quarter when the event or change in circumstances occurred that caused the transfer.
| INTERIM REPORT JANUARY – JUNE 2013 | 45 |
Table of Contents
(17) Segment and Geographic Information
General Information
Our internal reporting system produces reports in which business activities are presented in a variety of ways, for example, by line of business, geography, and areas of responsibility of the individual Board members. Based on these reports, the Executive Board, which is responsible for assessing the performance of various company components and making resource allocation decisions as our Chief Operating Decision Maker (CODM), evaluates business activities in a number of different ways.
SAP has two divisions – On-Premise and Cloud, which are further divided into operating segments. Our On-Premise division is comprised of two operating segments: On-Premise Products and On-Premise Services, and our Cloud division of two operating segments: Cloud Applications and Ariba. All operating segments are reportable segments.
The most important factors we use to identify operating segments are distinctions among our product and service offerings, notably:
| • | Between divisions, the software delivery model (software to be installed on the customer’s hardware (on-premise software), distinct from software for delivery in the cloud) |
| • | Within the On-Premise division, the types of services offered |
| • | Within the Cloud division, the fields in which the cloud applications are used |
The On-Premise division derives its revenues primarily from the sale of on-premise software (that is, software designed for use on hardware on the customer’s premises), mobile software (that is, software designed for use on mobile devices), and services relating to such software. Within the On-Premise division, the On-Premise Products segment is primarily engaged in marketing and licensing our on-premise and mobile software products and providing support services for these software products. The On-Premise Services segment primarily performs various professional services, mainly implementation services of our software products and educational services on the use of our software products.
The Cloud division derives its revenues primarily from the sale of cloud software (that is, software designed for delivery through the cloud) and services relating to such software (including support services, from its cloud-based collaborative business network.
Professional services, and educational services). Within the Cloud division, the Cloud Applications segment is primarily engaged in marketing and selling subscriptions to the cloud software offerings developed by SAP and SuccessFactors. The Ariba segment primarily markets and sells the cloud software offerings developed by Ariba and derives revenue.
| 46 | CONSOLIDATED INTERIM FINANCIAL STATEMENTS – IFRS |
Table of Contents
Information About Profit or Loss, Assets and Liabilities
Operating Segments Revenue and Profit or Loss
| On-Premise Division | Cloud Division | Total | ||||||||||||||||||||||||||
| € millions |
On-Premise Products |
On-Premise Services |
Division Total |
Cloud Applications |
Ariba | Division Total |
||||||||||||||||||||||
| Q2 2013 |
||||||||||||||||||||||||||||
| Software |
982 | 0 | 982 | 0 | 0 | 0 | 982 | |||||||||||||||||||||
| Cloud subscriptions and support |
0 | 0 | 0 | 97 | 86 | 183 | 183 | |||||||||||||||||||||
| Software and cloud subscriptions |
982 | 0 | 982 | 97 | 86 | 183 | 1,165 | |||||||||||||||||||||
| Support |
2,172 | 0 | 2,172 | 3 | 8 | 11 | 2,182 | |||||||||||||||||||||
| Software and software-related service revenue |
3,153 | 0 | 3,153 | 100 | 94 | 194 | 3,347 | |||||||||||||||||||||
| Professional services and other service revenue |
0 | 705 | 705 | 18 | 21 | 39 | 744 | |||||||||||||||||||||
| Total revenue |
3,153 | 705 | 3,858 | 118 | 115 | 233 | 4,091 | |||||||||||||||||||||
| Cost of revenue |
–471 | –549 | –1,020 | –46 | –42 | –88 | –1,108 | |||||||||||||||||||||
| Gross profit |
2,683 | 156 | 2,838 | 72 | 73 | 145 | 2,984 | |||||||||||||||||||||
| Cost of sales and marketing |
–894 | 0 | –894 | –82 | –39 | –122 | –1,015 | |||||||||||||||||||||
| Reportable segment profit/loss |
1,789 | 156 | 1,945 | –11 | 34 | 23 | 1,968 | |||||||||||||||||||||
| Q2 2012 |
||||||||||||||||||||||||||||
| Software |
1,058 | 0 | 1,058 | 0 | 0 | 0 | 1,059 | |||||||||||||||||||||
| Cloud subscriptions and support |
0 | 0 | 0 | 66 | 3 | 69 | 69 | |||||||||||||||||||||
| Software and cloud subscriptions |
1,058 | 0 | 1,058 | 67 | 3 | 69 | 1,127 | |||||||||||||||||||||
| Support |
2,012 | 0 | 2,012 | 2 | 0 | 3 | 2,014 | |||||||||||||||||||||
| Software and software-related service revenue |
3,070 | 0 | 3,070 | 69 | 3 | 72 | 3,142 | |||||||||||||||||||||
| Professional services and other service revenue |
0 | 754 | 754 | 18 | 2 | 20 | 774 | |||||||||||||||||||||
| Total revenue |
3,070 | 754 | 3,824 | 87 | 5 | 92 | 3,916 | |||||||||||||||||||||
| Cost of revenue |
–460 | –592 | –1,052 | –41 | –8 | –49 | –1,101 | |||||||||||||||||||||
| Gross profit |
2,609 | 163 | 2,772 | 46 | –3 | 43 | 2,815 | |||||||||||||||||||||
| Cost of sales and marketing |
–854 | 0 | –854 | –61 | –1 | –62 | –916 | |||||||||||||||||||||
| Reportable segment profit/loss |
1,756 | 163 | 1,918 | –14 | –5 | –19 | 1,900 | |||||||||||||||||||||
| 1/1/-6/30/2013 |
||||||||||||||||||||||||||||
| Software |
1,638 | 0 | 1,638 | 0 | 0 | 0 | 1,638 | |||||||||||||||||||||
| Cloud subscriptions and support |
0 | 0 | 0 | 184 | 167 | 350 | 350 | |||||||||||||||||||||
| Software and cloud subscriptions |
1,638 | 0 | 1,638 | 184 | 167 | 351 | 1,989 | |||||||||||||||||||||
| Support |
4,271 | 0 | 4,271 | 9 | 15 | 24 | 4,295 | |||||||||||||||||||||
| Software and software-related service revenue |
5,909 | 0 | 5,909 | 193 | 182 | 375 | 6,284 | |||||||||||||||||||||
| Professional services and other service revenue |
0 | 1,360 | 1,360 | 40 | 42 | 82 | 1,443 | |||||||||||||||||||||
| Total revenue |
5,909 | 1,360 | 7,270 | 233 | 224 | 457 | 7,727 | |||||||||||||||||||||
| Cost of revenue |
–928 | –1,088 | –2,016 | –88 | –88 | –176 | –2,192 | |||||||||||||||||||||
| Gross profit |
4,982 | 273 | 5,254 | 144 | 136 | 281 | 5,535 | |||||||||||||||||||||
| Cost of sales and marketing |
–1,709 | 0 | –1,709 | –154 | –76 | –230 | –1,939 | |||||||||||||||||||||
| Reportable segment profit/loss |
3,273 | 273 | 3,545 | –9 | 60 | 51 | 3,596 | |||||||||||||||||||||
| INTERIM REPORT JANUARY – JUNE 2013 | 47 |
Table of Contents
| 1/1/-6/30/2012 |
||||||||||||||||||||||||||||
| Software |
1,695 | 0 | 1,695 | 1 | 0 | 1 | 1,696 | |||||||||||||||||||||
| Cloud subscriptions and support |
0 | 0 | 0 | 98 | 5 | 104 | 104 | |||||||||||||||||||||
| Software and cloud subscriptions |
1,695 | 0 | 1,695 | 99 | 6 | 105 | 1,799 | |||||||||||||||||||||
| Support |
3,964 | 0 | 3,964 | 3 | 1 | 4 | 3,968 | |||||||||||||||||||||
| Software and software-related service revenue |
5,659 | 0 | 5,659 | 102 | 6 | 109 | 5,768 | |||||||||||||||||||||
| Professional services and other service revenue |
0 | 1,474 | 1,474 | 28 | 3 | 31 | 1,505 | |||||||||||||||||||||
| Total revenue |
5,659 | 1,474 | 7,133 | 130 | 9 | 140 | 7,273 | |||||||||||||||||||||
| Cost of revenue |
–903 | –1,174 | –2,076 | –69 | –16 | –85 | –2,162 | |||||||||||||||||||||
| Gross profit |
4,756 | 300 | 5,057 | 61 | –7 | 55 | 5,111 | |||||||||||||||||||||
| Cost of sales and marketing |
–1,594 | 0 | –1,594 | –95 | –3 | –98 | –1,692 | |||||||||||||||||||||
| Reportable segment profit/loss |
3,163 | 300 | 3,463 | –33 | –10 | –44 | 3,419 |
Segment asset/liability information is not regularly provided to our CODM. Goodwill by operating segment is disclosed in our Annual Report 2012, Notes to the Consolidated Financial Statements section, Note (15).
For information about the measurement and presentation of the segment reporting, see our Annual Report 2012, Notes to the Consolidated Financial Statements section, Note (28).
| 48 | CONSOLIDATED INTERIM FINANCIAL STATEMENTS – IFRS |
Table of Contents
Reconciliation of Revenues and Segment Results
| € millions |
Q2/2013 | 1/1/- 6/30/2013 |
Q2/2012 | 1/1/- 6/30/2012 |
||||||||||||
| Total revenues for reportable segments |
4,091 | 7,727 | 3,916 | 7,273 | ||||||||||||
| Adjustment recurring revenues |
–29 | –64 | –18 | –25 | ||||||||||||
| Adjustment recurring cloud subscriptions and support revenues |
–24 | –54 | –17 | –23 | ||||||||||||
| Adjustment recurring support revenues |
–5 | –10 | –1 | –2 | ||||||||||||
| Total revenue |
4,062 | 7,663 | 3,898 | 7,248 | ||||||||||||
| Total profit for reportable segments |
1,968 | 3,596 | 1,900 | 3,419 | ||||||||||||
| Adjustment recurring revenues |
–29 | –64 | –18 | –25 | ||||||||||||
| Research and development expense |
–551 | –1,086 | –523 | –1,023 | ||||||||||||
| General and administration expense |
–208 | –396 | –206 | –391 | ||||||||||||
| Other operating income/expense, net |
9 | 5 | 3 | 1 | ||||||||||||
| Restructuring |
–17 | –31 | –4 | –4 | ||||||||||||
| Share-based payment expense |
–39 | –109 | –98 | –181 | ||||||||||||
| TomorrowNow litigation / Loss from discontinued operations |
0 | 0 | –2 | 5 | ||||||||||||
| Acquisition-related charges |
–145 | –283 | –130 | –250 | ||||||||||||
| Operating profit |
988 | 1,634 | 921 | 1,551 | ||||||||||||
| Other non-operating income/expense, net |
–2 | –13 | –45 | –53 | ||||||||||||
| Finance income, net |
–23 | –37 | –11 | –26 | ||||||||||||
| Profit before tax |
963 | 1,584 | 865 | 1,472 | ||||||||||||
The research and development expense as well as the general and administration expense presented in the reconciliation differs from the corresponding expense in the consolidated income statement because the portions of share-based payments-related expenses, restructuring expenses, and acquisition-related expenses that are included in the research and development line item respectively the general and administration expense line item in the income statement, are presented as separate items in the reconciliation.
| INTERIM REPORT JANUARY – JUNE 2013 | 49 |
Table of Contents
Geographic Information
The tables below show the geographical breakdown of revenue according to specific criteria:
| • | The management view is the geographic revenue breakdown that the SAP Executive Board, SAP’s chief operating decision-maker, uses primarily when reviewing revenue by sales destination. Under this view, the software revenue from a software contract is attributed to the country in which the contract was negotiated. Such reporting presumes that the software contract was negotiated in the country in which the customer is domiciled. The only circumstances in which this presumption is not applied is where there is objective evidence that all contract negotiations took place in a country other than the domicile of the legal entity contracting on the customer’s behalf. Software revenue from a given software contract is always attributed to a single geographical region; in other words, the software revenue it is not split between geographical regions. Because cloud subscriptions and support revenue is earned largely from contracts that were negotiated in various periods in the past, it is allocated without exception to the country in which the customer is domiciled. |
| • | In the presentation by customer location, all revenue is attributed to the country in which the customer is domiciled. |
Revenue by Region
Software Revenue by Location Where Contracts Were Negotiated
| € millions |
Q2/2013 | 1/1/- 6/30/2013 |
Q2/2012 | 1/1/- 6/30/2012 |
||||||||||||
| EMEA |
417 | 715 | 419 | 694 | ||||||||||||
| Americas |
391 | 645 | 435 | 674 | ||||||||||||
| APJ |
174 | 278 | 205 | 328 | ||||||||||||
| SAP Group |
982 | 1,638 | 1,059 | 1,696 | ||||||||||||
Software Revenue by Location of Negotiation and Cloud Subscription Revenue by Location of Customers
| € millions |
Q2/2013 | 1/1/- 6/30/2013 |
Q2/2012 | 1/1/- 6/30/2012 |
||||||||||||
| EMEA |
441 | 766 | 437 | 722 | ||||||||||||
| Americas |
518 | 875 | 465 | 721 | ||||||||||||
| APJ |
181 | 294 | 209 | 333 | ||||||||||||
| SAP Group |
1,141 | 1,935 | 1,110 | 1,777 | ||||||||||||
Software Revenue by Location of Customers
| € millions |
Q2/2013 | 1/1/- 6/30/2013 |
Q2/2012 | 1/1/- 6/30/2012 |
||||||||||||
| EMEA |
416 | 716 | 453 | 731 | ||||||||||||
| Americas |
391 | 643 | 395 | 631 | ||||||||||||
| APJ |
175 | 280 | 210 | 333 | ||||||||||||
| SAP Group |
982 | 1,638 | 1,059 | 1,696 | ||||||||||||
Cloud Subscriptions and Support Revenue by Location of Customers
| € millions |
Q2/2013 | 1/1/- 6/30/2013 |
Q2/2012 | 1/1/- 6/30/2012 |
||||||||||||
| EMEA |
24 | 51 | 18 | 28 | ||||||||||||
| Americas |
127 | 230 | 30 | 47 | ||||||||||||
| APJ |
8 | 15 | 4 | 5 | ||||||||||||
| SAP Group |
159 | 296 | 52 | 81 | ||||||||||||
Software and Cloud Subscriptions Revenue by Location of Customers
| € millions |
Q2/2013 | 1/1/- 6/30/2013 |
Q2/2012 | 1/1/- 6/30/2012 |
||||||||||||
| EMEA |
440 | 766 | 471 | 759 | ||||||||||||
| Americas |
518 | 873 | 426 | 678 | ||||||||||||
| APJ |
183 | 295 | 214 | 339 | ||||||||||||
| SAP Group |
1,141 | 1,935 | 1,110 | 1,777 | ||||||||||||
Software and Software-Related Service Revenue by Location of Customers
| € millions |
Q2/2013 | 1/1/- 6/30/2013 |
Q2/2012 | 1/1/- 6/30/2012 |
||||||||||||
| Germany |
455 | 854 | 436 | 807 | ||||||||||||
| Rest of EMEA |
1,054 | 1,990 | 1,026 | 1,887 | ||||||||||||
| Total EMEA |
1,509 | 2,844 | 1,462 | 2,694 | ||||||||||||
| United States |
953 | 1,760 | 843 | 1,535 | ||||||||||||
| Rest of Americas |
337 | 644 | 292 | 546 | ||||||||||||
| Total Americas |
1,290 | 2,405 | 1,135 | 2,081 | ||||||||||||
| Japan |
128 | 263 | 171 | 315 | ||||||||||||
| Rest of APJ |
390 | 709 | 356 | 652 | ||||||||||||
| Total APJ |
519 | 971 | 527 | 967 | ||||||||||||
| SAP Group |
3,318 | 6,220 | 3,124 | 5,743 | ||||||||||||
| 50 | CONSOLIDATED INTERIM FINANCIAL STATEMENTS – IFRS |
Table of Contents
Total Revenue by Location of Customers
| € millions |
Q2/2013 | 1/1/– 6/30/2013 |
Q2/2012 | 1/1/– 6/30/2012 |
||||||||||||
| Germany |
591 | 1,116 | 575 | 1,092 | ||||||||||||
| Rest of EMEA |
1,254 | 2,385 | 1,233 | 2,291 | ||||||||||||
| EMEA |
1,845 | 3,502 | 1,808 | 3,383 | ||||||||||||
| United States |
1,185 | 2,209 | 1,085 | 1,998 | ||||||||||||
| Rest of Americas |
419 | 796 | 382 | 715 | ||||||||||||
| Americas |
1,604 | 3,005 | 1,468 | 2,714 | ||||||||||||
| Japan |
145 | 296 | 195 | 360 | ||||||||||||
| Rest of APJ |
467 | 860 | 427 | 791 | ||||||||||||
| APJ |
612 | 1,156 | 622 | 1,151 | ||||||||||||
| SAP Group |
4,062 | 7,663 | 3,898 | 7,248 | ||||||||||||
(18) Related Party Transactions
Certain Executive Board and Supervisory Board members of SAP AG currently hold (or have held within the last year) positions of significant responsibility with other entities (see the SAP Annual Report 2012, Notes to the Consolidated Financial Statements section, Note (29)). We have relationships with certain of these entities in the ordinary course of business whereby we buy and sell a wide variety of services and products at prices believed to be consistent with those negotiated at arm’s length between unrelated parties.
During the reporting period, we had no related party transactions that had a material effect on our business, financial position, or results in the reporting period.
For more information about related party transactions, see the SAP Integrated Report 2012, Notes to the Consolidated Financial Statements section, Note (30).
No events have occurred after June 30, 2013, which have a material impact on the Company’s consolidated financial statements.
Release of the Interim Financial Statements
The Executive Board of SAP AG approved these Consolidated Interim Financial Statements for the period ended June 30, 2013, for issuance on July 17, 2013.
| INTERIM REPORT JANUARY – JUNE 2013 | 51 |
Table of Contents
To the best of our knowledge, and in accordance with the applicable reporting principles for interim financial reporting, the consolidated interim financial statements give, in compliance with the principles of proper accounting, a true and fair view of the assets, finances and operating results of the Group, and the interim Management Report of the Group includes a fair review of the development and performance of the business and the position of the Group, together with a description of the principal opportunities and risks associated with the expected development of the Group for the remaining months of the financial year.
Walldorf, July 17, 2013
SAP AG
Walldorf, Baden
The Executive Board
| Bill McDermott |
Jim Hagemann Snabe | |
| Werner Brandt |
Gerhard Oswald | |
| Vishal Sikka |
||
| 52 | RESPONSIBILITY STATEMENT |
Table of Contents
SUPPLEMENTARY FINANCIAL INFORMATION
(UNAUDITED)
RECONCILIATION FROM NON-IFRS NUMBERS TO IFRS NUMBERS
The following tables present a reconciliation from our non-IFRS numbers (including our non-IFRS at constant currency numbers) to the respective most comparable IFRS numbers. Note: Our non-IFRS numbers are not prepared under a comprehensive set of accounting rules or principles.
| for the three months ended June 30 | ||||||||||||||||||||||||||||||||||||||||||||
| € millions, unless |
2013 | 2012 | Change in % | |||||||||||||||||||||||||||||||||||||||||
| IFRS | Adj.* | Non-IFRS* | Currency impact** |
Non-IFRS constant currency** |
IFRS | Adj.* | Non-IFRS* | IFRS | Non-IFRS* | Non-IFRS constant currency** |
||||||||||||||||||||||||||||||||||
| Revenue Numbers |
||||||||||||||||||||||||||||||||||||||||||||
| Software |
982 | 0 | 982 | 41 | 1,022 | 1,059 | 0 | 1,059 | –7 | –7 | –3 | |||||||||||||||||||||||||||||||||
| Cloud subscriptions and support |
159 | 24 | 183 | 4 | 187 | 52 | 17 | 69 | 206 | 166 | 171 | |||||||||||||||||||||||||||||||||
| Software and cloud subscriptions |
1,141 | 24 | 1,165 | 45 | 1,209 | 1,110 | 17 | 1,127 | 3 | 3 | 7 | |||||||||||||||||||||||||||||||||
| Support |
2,177 | 5 | 2,182 | 62 | 2,245 | 2,013 | 1 | 2,014 | 8 | 8 | 11 | |||||||||||||||||||||||||||||||||
| Software and software-related service revenue |
3,318 | 29 | 3,347 | 107 | 3,454 | 3,124 | 18 | 3,142 | 6 | 7 | 10 | |||||||||||||||||||||||||||||||||
| Consulting |
580 | 0 | 580 | 16 | 595 | 617 | 0 | 617 | –6 | –6 | –3 | |||||||||||||||||||||||||||||||||
| Other services |
165 | 0 | 165 | 4 | 169 | 157 | 0 | 157 | 5 | 5 | 7 | |||||||||||||||||||||||||||||||||
| Professional services and other service revenue |
744 | 0 | 744 | 19 | 764 | 774 | 0 | 774 | –4 | –4 | –1 | |||||||||||||||||||||||||||||||||
| Total revenue |
4,062 | 29 | 4,091 | 127 | 4,218 | 3,898 | 18 | 3,916 | 4 | 4 | 8 | |||||||||||||||||||||||||||||||||
| Operating Expense Numbers |
||||||||||||||||||||||||||||||||||||||||||||
| Cost of software and software-related services |
–598 | 76 | –522 | –568 | 77 | –491 | 5 | 6 | ||||||||||||||||||||||||||||||||||||
| Cost of professional services and other services |
–609 | 23 | –586 | –644 | 34 | –610 | –5 | –4 | ||||||||||||||||||||||||||||||||||||
| Total cost of revenue |
–1,207 | 99 | –1,108 | –1,212 | 111 | –1,101 | 0 | 1 | ||||||||||||||||||||||||||||||||||||
| Gross profit |
2,855 | 129 | 2,984 | 2,686 | 129 | 2,815 | 6 | 6 | ||||||||||||||||||||||||||||||||||||
| Research and development |
–567 | 17 | –551 | –568 | 45 | –523 | 0 | 5 | ||||||||||||||||||||||||||||||||||||
| Sales and marketing |
–1,059 | 44 | –1,015 | –972 | 56 | –916 | 9 | 11 | ||||||||||||||||||||||||||||||||||||
| General and administration |
–232 | 24 | –208 | –222 | 16 | –206 | 5 | 1 | ||||||||||||||||||||||||||||||||||||
| Restructuring |
–17 | 17 | 0 | –4 | 4 | 0 | <-100 | N/A | ||||||||||||||||||||||||||||||||||||
| TomorrowNow litigation |
0 | 0 | 0 | –2 | 2 | 0 | <-100 | N/A | ||||||||||||||||||||||||||||||||||||
| Other operating income/expense, net |
9 | 0 | 9 | 3 | 0 | 3 | >100 | >100 | ||||||||||||||||||||||||||||||||||||
| Total operating expenses |
–3,074 | 201 | –2,873 | –54 | –2,926 | –2,977 | 234 | –2,743 | 3 | 5 | 7 | |||||||||||||||||||||||||||||||||
| Profit Numbers |
||||||||||||||||||||||||||||||||||||||||||||
| Operating profit |
988 | 230 | 1,219 | 73 | 1,292 | 921 | 252 | 1,173 | 7 | 4 | 10 | |||||||||||||||||||||||||||||||||
| Other non-operating income/expense, net |
–2 | 0 | –2 | –45 | 0 | –45 | –95 | –95 | ||||||||||||||||||||||||||||||||||||
| Finance income |
26 | 0 | 26 | 28 | 0 | 28 | –6 | –6 | ||||||||||||||||||||||||||||||||||||
| Finance costs |
–49 | 0 | –49 | –39 | 0 | –39 | 27 | 27 | ||||||||||||||||||||||||||||||||||||
| Financial income, net |
–23 | 0 | –23 | –11 | 0 | –11 | <-100 | <-100 | ||||||||||||||||||||||||||||||||||||
| Profit before tax |
963 | 230 | 1,194 | 865 | 252 | 1,117 | 11 | 7 | ||||||||||||||||||||||||||||||||||||
| Income tax expense |
–239 | –81 | –320 | –204 | –82 | –286 | 17 | 12 | ||||||||||||||||||||||||||||||||||||
| Profit after tax |
724 | 149 | 874 | 661 | 170 | 831 | 10 | 5 | ||||||||||||||||||||||||||||||||||||
| Profit attributable to non-controlling interests |
0 | 0 | 0 | 0 | 0 | 0 | N/A | N/A | ||||||||||||||||||||||||||||||||||||
| Profit attributable to owners of parent |
725 | 149 | 874 | 661 | 170 | 831 | 10 | 5 | ||||||||||||||||||||||||||||||||||||
| Key Ratios |
||||||||||||||||||||||||||||||||||||||||||||
| Operating margin in % |
24.3 | 29.8 | 30.6 | 23.6 | 30.0 | 0.7pp | –0.2pp | 0.6pp | ||||||||||||||||||||||||||||||||||||
| Effective tax rate in % |
24.8 | 26.8 | 23.6 | 25.6 | 1.2pp | 1.2pp | ||||||||||||||||||||||||||||||||||||||
| Earnings per share – basic (in €)* |
0.61 | 0.73 | 0.55 | 0.70 | 11 | 4 | ||||||||||||||||||||||||||||||||||||||
| Deferred cloud subscriptions and support revenue (June 30) |
354 | 7 | 361 | 155 | 60 | 215 | >100 | 68 | ||||||||||||||||||||||||||||||||||||
| INTERIM REPORT JANUARY – JUNE 2013 | 53 |
Table of Contents
| for the six months ended June 30 | ||||||||||||||||||||||||||||||||||||||||||||
| € millions, unless |
2013 | 2012 | Change in % | |||||||||||||||||||||||||||||||||||||||||
| IFRS | Adj.* | Non-IFRS* | Currency impact** |
Non-IFRS constant currency** |
IFRS | Adj.* | Non-IFRS* | IFRS | Non-IFRS* | Non-IFRS constant currency** |
||||||||||||||||||||||||||||||||||
| Revenue Numbers |
||||||||||||||||||||||||||||||||||||||||||||
| Software |
1,638 | 0 | 1,638 | 52 | 1,690 | 1,696 | 0 | 1,696 | –3 | –3 | 0 | |||||||||||||||||||||||||||||||||
| Cloud subscriptions and support |
296 | 54 | 350 | 6 | 356 | 81 | 23 | 104 | 266 | 238 | 243 | |||||||||||||||||||||||||||||||||
| Software and cloud subscriptions |
1,935 | 54 | 1,989 | 57 | 2,046 | 1,777 | 23 | 1,799 | 9 | 11 | 14 | |||||||||||||||||||||||||||||||||
| Support |
4,286 | 10 | 4,295 | 106 | 4,402 | 3,966 | 2 | 3,968 | 8 | 8 | 11 | |||||||||||||||||||||||||||||||||
| Software and software-related service revenue |
6,220 | 64 | 6,284 | 163 | 6,448 | 5,743 | 25 | 5,768 | 8 | 9 | 12 | |||||||||||||||||||||||||||||||||
| Consulting |
1,136 | 0 | 1,136 | 24 | 1,160 | 1,214 | 0 | 1,214 | –6 | –6 | –4 | |||||||||||||||||||||||||||||||||
| Other services |
306 | 0 | 306 | 6 | 313 | 291 | 0 | 291 | 5 | 5 | 7 | |||||||||||||||||||||||||||||||||
| Professional services and other service revenue |
1,443 | 0 | 1,443 | 30 | 1,473 | 1,505 | 0 | 1,505 | –4 | –4 | –2 | |||||||||||||||||||||||||||||||||
| Total revenue |
7,663 | 64 | 7,727 | 194 | 7,921 | 7,248 | 25 | 7,273 | 6 | 6 | 9 | |||||||||||||||||||||||||||||||||
| Operating Expense Numbers |
||||||||||||||||||||||||||||||||||||||||||||
| Cost of software and software-related services |
–1,202 | 173 | –1,028 | –1,106 | 149 | –957 | 9 | 7 | ||||||||||||||||||||||||||||||||||||
| Cost of professional services and other services |
–1,215 | 51 | –1,164 | –1,268 | 64 | –1,204 | –4 | –3 | ||||||||||||||||||||||||||||||||||||
| Total cost of revenue |
–2,416 | 224 | –2,192 | –2,374 | 213 | –2,161 | 2 | 1 | ||||||||||||||||||||||||||||||||||||
| Gross profit |
5,246 | 288 | 5,535 | 4,874 | 238 | 5,112 | 8 | 8 | ||||||||||||||||||||||||||||||||||||
| Research and development |
–1,124 | 38 | –1,086 | –1,091 | 68 | –1,023 | 3 | 6 | ||||||||||||||||||||||||||||||||||||
| Sales and marketing |
–2,034 | 96 | –1,939 | –1,802 | 110 | –1,692 | 13 | 15 | ||||||||||||||||||||||||||||||||||||
| General and administration |
–429 | 33 | –396 | –431 | 40 | –391 | –1 | 1 | ||||||||||||||||||||||||||||||||||||
| Restructuring |
–31 | 31 | 0 | –4 | 4 | 0 | <-100 | N/A | ||||||||||||||||||||||||||||||||||||
| TomorrowNow litigation |
0 | 0 | 0 | 5 | –5 | 0 | –92 | N/A | ||||||||||||||||||||||||||||||||||||
| Other operating income/expense, net |
5 | 0 | 5 | 1 | 0 | 1 | >100 | >100 | ||||||||||||||||||||||||||||||||||||
| Total operating expenses |
–6,029 | 422 | –5,607 | –94 | –5,701 | –5,696 | 430 | –5,266 | 6 | 6 | 8 | |||||||||||||||||||||||||||||||||
| Profit Numbers |
||||||||||||||||||||||||||||||||||||||||||||
| Operating profit |
1,634 | 486 | 2,120 | 100 | 2,220 | 1,551 | 456 | 2,007 | 5 | 6 | 11 | |||||||||||||||||||||||||||||||||
| Other non-operating income/expense, net |
–13 | 0 | –13 | –53 | 0 | –53 | –76 | –76 | ||||||||||||||||||||||||||||||||||||
| Finance income |
56 | 0 | 56 | 52 | 0 | 52 | 8 | 8 | ||||||||||||||||||||||||||||||||||||
| Finance costs |
–93 | 0 | –93 | –78 | 1 | –77 | 19 | 21 | ||||||||||||||||||||||||||||||||||||
| Financial income, net |
–37 | 0 | –37 | –26 | 1 | –25 | 41 | 48 | ||||||||||||||||||||||||||||||||||||
| Profit before tax |
1,584 | 486 | 2,070 | 1,472 | 457 | 1,929 | 8 | 7 | ||||||||||||||||||||||||||||||||||||
| Income tax expense |
–340 | –167 | –507 | –368 | –147 | –515 | –8 | –2 | ||||||||||||||||||||||||||||||||||||
| Profit after tax |
1,244 | 318 | 1,563 | 1,104 | 310 | 1,414 | 13 | 11 | ||||||||||||||||||||||||||||||||||||
| Profit attributable to non-controlling interests |
0 | 0 | 0 | 0 | 0 | 0 | N/A | N/A | ||||||||||||||||||||||||||||||||||||
| Profit attributable to owners of parent |
1,245 | 318 | 1,563 | 1,104 | 310 | 1,414 | 13 | 11 | ||||||||||||||||||||||||||||||||||||
| Key Ratios |
||||||||||||||||||||||||||||||||||||||||||||
| Operating margin in % |
21.3 | 27.4 | 28.0 | 21.4 | 27.6 | –0.1pp | –0.2pp | 0.4pp | ||||||||||||||||||||||||||||||||||||
| Effective tax rate in % |
21.5 | 24.5 | 25.0 | 26.7 | –3.5pp | –2.2pp | ||||||||||||||||||||||||||||||||||||||
| Earnings per share – basic (in €)* |
1.04 | 1.31 | 0.93 | 1.19 | 12 | 10 | ||||||||||||||||||||||||||||||||||||||
| Deferred cloud subscriptions and support revenue (June 30) |
354 | 7 | 361 | 155 | 60 | 215 | >100 | 68 | ||||||||||||||||||||||||||||||||||||
| * | Adjustments in the revenue line items are for support revenue, cloud subscription revenue, and other similarly recurring revenues that entities acquired by SAP would have recognized had they remained stand-alone entities but that SAP is not permitted to recognize as revenue under IFRS as a result of business combination accounting rules. Adjustments in the operating expense line items are for acquisition-related charges, share-based compensation expenses, restructuring expenses, and discontinued activities. |
| ** | Constant currency revenue and operating income figures are calculated by translating revenue and operating income of the current period using the average exchange rates from the previous year’s respective period instead of the current period. Constant currency period-over-period changes are calculated by comparing the current year’s non-IFRS constant currency numbers with the non-IFRS number of the previous year’s respective period. |
Due to rounding, numbers may not add up precisely.
| 54 | SUPPLEMENTARY FINANCIAL INFORMATION |
Table of Contents
REVENUE BY REGION
The following table presents our IFRS and non-IFRS revenue by region. Details regarding the different views (based on location of contract negotiation respectively by customer location are described in the note “Segment and Geographic Information” of our Consolidated Financial Statements. The table also presents a reconciliation from our non-IFRS revenue (including our non-IFRS revenue at constant currency) to the respective most comparable IFRS revenue.
Note: Our non- IFRS revenues are not prepared under a comprehensive set of accounting rules or principles.
Revenues by Region –Management View
| for the three months ended June 30 | ||||||||||||||||||||||||||||||||||||||||||||
| € millions |
2013 | 2012 | Change in % | |||||||||||||||||||||||||||||||||||||||||
| IFRS | Adj.* | Non-IFRS* | Currency impact** |
Non-IFRS constant currency** |
IFRS | Adj.* | Non-IFRS* | IFRS | Non-IFRS* | Non-IFRS constant currency** |
||||||||||||||||||||||||||||||||||
| Software revenue by region |
||||||||||||||||||||||||||||||||||||||||||||
| EMEA |
417 | 0 | 417 | 7 | 424 | 419 | 0 | 419 | –1 | –1 | 1 | |||||||||||||||||||||||||||||||||
| Americas |
391 | 0 | 391 | 21 | 412 | 435 | 0 | 435 | –10 | –10 | –5 | |||||||||||||||||||||||||||||||||
| APJ |
174 | 0 | 174 | 13 | 187 | 205 | 0 | 205 | –15 | –15 | –9 | |||||||||||||||||||||||||||||||||
| Software revenue |
982 | 0 | 982 | 41 | 1,022 | 1,059 | 0 | 1,059 | –7 | –7 | –3 | |||||||||||||||||||||||||||||||||
| Software revenue by location of negotiation and cloud subscription revenue by region |
||||||||||||||||||||||||||||||||||||||||||||
| EMEA |
441 | 0 | 441 | 7 | 448 | 437 | 0 | 437 | 1 | 1 | 3 | |||||||||||||||||||||||||||||||||
| Americas |
518 | 24 | 542 | 24 | 566 | 465 | 17 | 482 | 11 | 13 | 18 | |||||||||||||||||||||||||||||||||
| APJ |
181 | 0 | 181 | 14 | 195 | 209 | 0 | 209 | –13 | –13 | –7 | |||||||||||||||||||||||||||||||||
| Software revenue by location of negotiation and cloud subscription revenue |
1,141 | 24 | 1,165 | 45 | 1,209 | 1,110 | 17 | 1,127 | 3 | 3 | 7 | |||||||||||||||||||||||||||||||||
| Revenues by Regions – Location of Customers |
|
|||||||||||||||||||||||||||||||||||||||||||
| for the three months ended June 30 | ||||||||||||||||||||||||||||||||||||||||||||
| € millions |
2013 | 2012 | Change in % | |||||||||||||||||||||||||||||||||||||||||
| IFRS | Adj.* | Non-IFRS* | Currency impact** |
Non-IFRS constant currency** |
IFRS | Adj.* | Non-IFRS* | IFRS | Non-IFRS* | Non-IFRS constant currency** |
||||||||||||||||||||||||||||||||||
| Software revenue by region |
||||||||||||||||||||||||||||||||||||||||||||
| EMEA |
416 | 0 | 416 | 7 | 423 | 453 | 0 | 453 | –8 | –8 | –7 | |||||||||||||||||||||||||||||||||
| Americas |
391 | 0 | 391 | 20 | 411 | 395 | 0 | 395 | –1 | –1 | 4 | |||||||||||||||||||||||||||||||||
| APJ |
175 | 0 | 175 | 14 | 189 | 210 | 0 | 210 | –17 | –17 | –10 | |||||||||||||||||||||||||||||||||
| Software revenue |
982 | 0 | 982 | 41 | 1,022 | 1,059 | 0 | 1,059 | –7 | –7 | –3 | |||||||||||||||||||||||||||||||||
| Cloud subscriptions and support revenue by region |
||||||||||||||||||||||||||||||||||||||||||||
| EMEA |
24 | 0 | 24 | 1 | 25 | 18 | 0 | 18 | 35 | 35 | 37 | |||||||||||||||||||||||||||||||||
| Americas |
127 | 24 | 151 | 3 | 154 | 30 | 17 | 47 | >100 | >100 | >100 | |||||||||||||||||||||||||||||||||
| APJ |
8 | 0 | 8 | 0 | 8 | 4 | 0 | 4 | 97 | 97 | 103 | |||||||||||||||||||||||||||||||||
| Cloud subscriptions and support revenue |
159 | 24 | 183 | 4 | 187 | 52 | 17 | 69 | 206 | 166 | 171 | |||||||||||||||||||||||||||||||||
| Software and cloud subscription revenue by region |
||||||||||||||||||||||||||||||||||||||||||||
| EMEA |
440 | 0 | 440 | 7 | 447 | 471 | 0 | 471 | –6 | –6 | –5 | |||||||||||||||||||||||||||||||||
| Americas |
518 | 24 | 542 | 23 | 565 | 426 | 16 | 442 | 22 | 22 | 28 | |||||||||||||||||||||||||||||||||
| APJ |
183 | 0 | 183 | 14 | 197 | 214 | 0 | 214 | –15 | –15 | –8 | |||||||||||||||||||||||||||||||||
| Software and cloud subscription revenue |
1,141 | 24 | 1,165 | 45 | 1,209 | 1,110 | 17 | 1,127 | 3 | 3 | 7 | |||||||||||||||||||||||||||||||||
| INTERIM REPORT JANUARY – JUNE 2013 | 55 |
Table of Contents
| Software and software-related service revenue by region |
||||||||||||||||||||||||||||||||||||||||||||
| Germany |
455 | 0 | 455 | 0 | 455 | 436 | 0 | 436 | 4 | 4 | 4 | |||||||||||||||||||||||||||||||||
| Rest of EMEA |
1,054 | 0 | 1,054 | 19 | 1,073 | 1,026 | 0 | 1,026 | 3 | 3 | 5 | |||||||||||||||||||||||||||||||||
| Total EMEA |
1,509 | 0 | 1,509 | 20 | 1,529 | 1,462 | 0 | 1,462 | 3 | 3 | 5 | |||||||||||||||||||||||||||||||||
| United States |
953 | 29 | 982 | 26 | 1,008 | 843 | 18 | 861 | 13 | 14 | 17 | |||||||||||||||||||||||||||||||||
| Rest of Americas |
337 | 0 | 337 | 18 | 355 | 292 | 0 | 292 | 16 | 16 | 22 | |||||||||||||||||||||||||||||||||
| Total Americas |
1,290 | 29 | 1,319 | 43 | 1,362 | 1,135 | 18 | 1,153 | 14 | 14 | 18 | |||||||||||||||||||||||||||||||||
| Japan |
128 | 0 | 128 | 34 | 162 | 171 | 0 | 171 | –25 | –25 | –6 | |||||||||||||||||||||||||||||||||
| Rest of APJ |
390 | 0 | 390 | 11 | 401 | 356 | 0 | 356 | 10 | 10 | 13 | |||||||||||||||||||||||||||||||||
| Total APJ |
519 | 0 | 519 | 44 | 563 | 527 | 0 | 527 | –2 | –2 | 7 | |||||||||||||||||||||||||||||||||
| Software and software-related service revenue |
3,318 | 29 | 3,347 | 107 | 3,454 | 3,124 | 18 | 3,142 | 6 | 7 | 10 | |||||||||||||||||||||||||||||||||
| Total revenue by region |
||||||||||||||||||||||||||||||||||||||||||||
| Germany |
591 | 0 | 591 | 0 | 591 | 575 | 0 | 575 | 3 | 3 | 3 | |||||||||||||||||||||||||||||||||
| Rest of EMEA |
1,254 | 0 | 1,254 | 24 | 1,278 | 1,233 | 0 | 1,233 | 2 | 2 | 4 | |||||||||||||||||||||||||||||||||
| Total EMEA |
1,845 | 0 | 1,845 | 24 | 1,869 | 1,808 | 0 | 1,808 | 2 | 2 | 3 | |||||||||||||||||||||||||||||||||
| United States |
1,185 | 29 | 1,214 | 30 | 1,244 | 1,085 | 18 | 1,103 | 9 | 10 | 13 | |||||||||||||||||||||||||||||||||
| Rest of Americas |
419 | 0 | 420 | 21 | 441 | 382 | 0 | 382 | 10 | 10 | 15 | |||||||||||||||||||||||||||||||||
| Total Americas |
1,604 | 29 | 1,634 | 51 | 1,685 | 1,468 | 18 | 1,486 | 9 | 10 | 13 | |||||||||||||||||||||||||||||||||
| Japan |
145 | 0 | 145 | 38 | 183 | 195 | 0 | 195 | –25 | –25 | –6 | |||||||||||||||||||||||||||||||||
| Rest of APJ |
467 | 0 | 467 | 14 | 481 | 427 | 0 | 427 | 9 | 9 | 13 | |||||||||||||||||||||||||||||||||
| Total APJ |
612 | 0 | 612 | 52 | 664 | 622 | 0 | 622 | –2 | –2 | 7 | |||||||||||||||||||||||||||||||||
| Total revenue |
4,062 | 29 | 4,091 | 127 | 4,218 | 3,898 | 18 | 3,916 | 4 | 4 | 8 |
| 56 | SUPPLEMENTARY FINANCIAL INFORMATION |
Table of Contents
Revenues by Region – Management View
| for the six months ended June 30 | ||||||||||||||||||||||||||||||||||||||||||||
| € millions |
2013 | 2012 | Change in % | |||||||||||||||||||||||||||||||||||||||||
| IFRS | Adj.* | Non-IFRS* | Currency impact** |
Non-IFRS constant currency** |
IFRS | Adj.* | Non-IFRS* | IFRS | Non-IFRS* | Non-IFRS constant currency** |
||||||||||||||||||||||||||||||||||
| Software revenue by region |
||||||||||||||||||||||||||||||||||||||||||||
| EMEA |
715 | 0 | 715 | 11 | 726 | 694 | 0 | 694 | 3 | 3 | 4 | |||||||||||||||||||||||||||||||||
| Americas |
645 | 0 | 645 | 24 | 669 | 674 | 0 | 674 | –4 | –4 | –1 | |||||||||||||||||||||||||||||||||
| APJ |
278 | 0 | 278 | 17 | 295 | 328 | 0 | 328 | –15 | –15 | –10 | |||||||||||||||||||||||||||||||||
| Software revenue |
1,638 | 0 | 1,638 | 52 | 1,690 | 1,696 | 0 | 1,696 | –3 | –3 | 0 | |||||||||||||||||||||||||||||||||
| Software revenue by location of negotiation and cloud subscription revenue by region |
||||||||||||||||||||||||||||||||||||||||||||
| EMEA |
766 | 0 | 766 | 11 | 777 | 722 | 0 | 722 | 6 | 6 | 8 | |||||||||||||||||||||||||||||||||
| Americas |
875 | 55 | 930 | 28 | 958 | 721 | 23 | 744 | 21 | 25 | 29 | |||||||||||||||||||||||||||||||||
| APJ |
294 | 0 | 294 | 17 | 311 | 333 | 0 | 333 | –12 | –12 | –7 | |||||||||||||||||||||||||||||||||
| Software revenue by location of negotiation and cloud subscription revenue |
1,935 | 54 | 1,989 | 57 | 2,046 | 1,777 | 23 | 1,799 | 9 | 11 | 14 | |||||||||||||||||||||||||||||||||
| Revenues by Regions – Location of Customers |
| |||||||||||||||||||||||||||||||||||||||||||
| for the six months ended June 30 | ||||||||||||||||||||||||||||||||||||||||||||
| € millions |
2013 | 2012 | Change in % | |||||||||||||||||||||||||||||||||||||||||
| IFRS | Adj.* | Non-IFRS* | Currency impact** |
Non-IFRS constant currency** |
IFRS | Adj.* | Non-IFRS* | IFRS | Non-IFRS* | Non-IFRS constant currency** |
||||||||||||||||||||||||||||||||||
| Software revenue by region |
||||||||||||||||||||||||||||||||||||||||||||
| EMEA |
716 | 0 | 716 | 11 | 727 | 731 | 0 | 731 | –2 | –2 | –1 | |||||||||||||||||||||||||||||||||
| Americas |
643 | 0 | 643 | 23 | 666 | 631 | 0 | 631 | 2 | 2 | 6 | |||||||||||||||||||||||||||||||||
| APJ |
280 | 0 | 280 | 17 | 297 | 333 | 0 | 333 | –16 | –16 | –11 | |||||||||||||||||||||||||||||||||
| Software revenue |
1,638 | 0 | 1,638 | 52 | 1,690 | 1,696 | 0 | 1,696 | –3 | –3 | 0 | |||||||||||||||||||||||||||||||||
| Cloud subscriptions and support revenue by region |
||||||||||||||||||||||||||||||||||||||||||||
| EMEA |
51 | 0 | 51 | 0 | 51 | 28 | 0 | 28 | 81 | 80 | 83 | |||||||||||||||||||||||||||||||||
| Americas |
230 | 54 | 284 | 5 | 289 | 47 | 23 | 70 | >100 | >100 | >100 | |||||||||||||||||||||||||||||||||
| APJ |
15 | 0 | 15 | 1 | 16 | 5 | 0 | 5 | >100 | >100 | >100 | |||||||||||||||||||||||||||||||||
| Cloud subscriptions and support revenue |
296 | 54 | 350 | 6 | 356 | 81 | 23 | 104 | 266 | 238 | 243 | |||||||||||||||||||||||||||||||||
| Software and cloud subscription revenue by region |
||||||||||||||||||||||||||||||||||||||||||||
| EMEA |
766 | 0 | 766 | 12 | 778 | 759 | 0 | 759 | 1 | 1 | 2 | |||||||||||||||||||||||||||||||||
| Americas |
873 | 54 | 927 | 28 | 955 | 678 | 23 | 701 | 29 | 32 | 36 | |||||||||||||||||||||||||||||||||
| APJ |
295 | 0 | 295 | 18 | 313 | 339 | 0 | 339 | –13 | –13 | –8 | |||||||||||||||||||||||||||||||||
| Software and cloud subscription revenue |
1,935 | 54 | 1,989 | 57 | 2,046 | 1,777 | 23 | 1,799 | 9 | 11 | 14 | |||||||||||||||||||||||||||||||||
| INTERIM REPORT JANUARY – JUNE 2013 | 57 |
Table of Contents
| Software and software-related service revenue by region |
||||||||||||||||||||||||||||||||||||||||||||
| Germany |
854 | 0 | 854 | 0 | 854 | 807 | 0 | 807 | 6 | 6 | 6 | |||||||||||||||||||||||||||||||||
| Rest of EMEA |
1,990 | 0 | 1,990 | 33 | 2,023 | 1,887 | 1 | 1,888 | 5 | 5 | 7 | |||||||||||||||||||||||||||||||||
| Total EMEA |
2,844 | 0 | 2,844 | 33 | 2,877 | 2,694 | 1 | 2,695 | 6 | 6 | 7 | |||||||||||||||||||||||||||||||||
| United States |
1,760 | 63 | 1,824 | 30 | 1,854 | 1,535 | 24 | 1,559 | 15 | 17 | 19 | |||||||||||||||||||||||||||||||||
| Rest of Americas |
644 | 0 | 645 | 32 | 677 | 546 | 0 | 546 | 18 | 18 | 24 | |||||||||||||||||||||||||||||||||
| Total Americas |
2,405 | 64 | 2,469 | 62 | 2,531 | 2,081 | 24 | 2,105 | 16 | 17 | 20 | |||||||||||||||||||||||||||||||||
| Japan |
263 | 0 | 263 | 55 | 318 | 315 | 0 | 315 | –17 | –17 | 1 | |||||||||||||||||||||||||||||||||
| Rest of APJ |
709 | 0 | 709 | 12 | 721 | 652 | 0 | 652 | 9 | 9 | 11 | |||||||||||||||||||||||||||||||||
| Total APJ |
971 | 0 | 971 | 68 | 1,039 | 967 | 0 | 967 | 0 | 0 | 7 | |||||||||||||||||||||||||||||||||
| Software and software-related service revenue |
6,220 | 64 | 6,284 | 163 | 6,448 | 5,743 | 25 | 5,768 | 8 | 9 | 12 | |||||||||||||||||||||||||||||||||
| Total revenue by region |
||||||||||||||||||||||||||||||||||||||||||||
| Germany |
1,116 | 0 | 1,116 | 0 | 1,116 | 1,092 | 0 | 1,092 | 2 | 2 | 2 | |||||||||||||||||||||||||||||||||
| Rest of EMEA |
2,385 | 0 | 2,385 | 40 | 2,425 | 2,291 | 1 | 2,292 | 4 | 4 | 6 | |||||||||||||||||||||||||||||||||
| Total EMEA |
3,502 | 0 | 3,502 | 39 | 3,541 | 3,383 | 1 | 3,384 | 4 | 3 | 5 | |||||||||||||||||||||||||||||||||
| United States |
2,209 | 63 | 2,272 | 36 | 2,308 | 1,998 | 24 | 2,022 | 11 | 12 | 14 | |||||||||||||||||||||||||||||||||
| Rest of Americas |
796 | 0 | 797 | 39 | 836 | 715 | 0 | 715 | 11 | 11 | 17 | |||||||||||||||||||||||||||||||||
| Total Americas |
3,005 | 64 | 3,069 | 75 | 3,144 | 2,714 | 24 | 2,738 | 11 | 12 | 15 | |||||||||||||||||||||||||||||||||
| Japan |
296 | 0 | 296 | 63 | 359 | 360 | 0 | 360 | –18 | –18 | 0 | |||||||||||||||||||||||||||||||||
| Rest of APJ |
860 | 0 | 860 | 16 | 876 | 791 | 0 | 791 | 9 | 9 | 11 | |||||||||||||||||||||||||||||||||
| Total APJ |
1,156 | 0 | 1,156 | 79 | 1,235 | 1,151 | 0 | 1,151 | 0 | 0 | 7 | |||||||||||||||||||||||||||||||||
| Total revenue |
7,663 | 64 | 7,727 | 194 | 7,921 | 7,248 | 25 | 7,273 | 6 | 6 | 9 |
| * | Adjustments in the revenue line items are for support revenue, cloud subscription revenue, and other similarly recurring revenues that entities acquired by SAP would have recognized had they remained stand-alone entities but that SAP is not permitted to recognize as revenue under IFRS as a result of business combination accounting rules. |
| ** | Constant currency revenue figures are calculated by translating revenue of the current period using the average exchange rates from the previous year’s respective period instead of the current period. Constant currency period-over-period changes are calculated by comparing the current year’s non-IFRS constant currency numbers with the non-IFRS number of the previous year’s respective period. |
For a more detailed description of these adjustments and their limitations as well as our constant currency figures, see our Web site www.sap.com/corporate-en/investors/newsandreports/reporting-framework.epx under “Non-IFRS Measures and Estimates.”
Due to rounding, numbers may not add up precisely.
| 58 | SUPPLEMENTARY FINANCIAL INFORMATION |
Table of Contents
(IFRS AND NON-IFRS)
| € millions, unless otherwise stated |
Q1/2012 | Q2/2012 | Q3/2012 | Q4/2012 | TY 2012 | Q1/2013 | Q2/2013 | |||||||||||||||||||||||
| Software (IFRS) |
637 | 1,059 | 1,026 | 1,937 | 4,658 | 657 | 982 | |||||||||||||||||||||||
| Revenue adjustment* |
0 | 0 | 0 | 0 | 0 | 0 | 0 | |||||||||||||||||||||||
| Software (non-IFRS) |
637 | 1,059 | 1,026 | 1,937 | 4,658 | 657 | 982 | |||||||||||||||||||||||
| Cloud subscriptions and support (IFRS) |
29 | 52 | 63 | 126 | 270 | 137 | 159 | |||||||||||||||||||||||
| Revenue adjustment* |
6 | 17 | 17 | 33 | 73 | 30 | 24 | |||||||||||||||||||||||
| Cloud subscriptions and support (non-IFRS) |
35 | 69 | 80 | 159 | 343 | 167 | 183 | |||||||||||||||||||||||
| Support (IFRS) |
1,953 | 2,013 | 2,105 | 2,166 | 8,237 | 2,109 | 2,177 | |||||||||||||||||||||||
| Revenue adjustment* |
1 | 1 | 1 | 5 | 9 | 4 | 5 | |||||||||||||||||||||||
| Support (non-IFRS) |
1,954 | 2,014 | 2,106 | 2,171 | 8,246 | 2,113 | 2,182 | |||||||||||||||||||||||
| Software and software-related service revenue (IFRS) |
2,619 | 3,124 | 3,194 | 4,228 | 13,165 | 2,903 | 3,318 | |||||||||||||||||||||||
| Revenue adjustment* |
7 | 18 | 18 | 38 | 81 | 35 | 29 | |||||||||||||||||||||||
| Software and software-related service revenue (non-IFRS) |
2,626 | 3,142 | 3,212 | 4,266 | 13,246 | 2,937 | 3,347 | |||||||||||||||||||||||
| Total revenue (IFRS) |
3,350 | 3,898 | 3,952 | 5,023 | 16,223 | 3,601 | 4,062 | |||||||||||||||||||||||
| Revenue adjustment* |
7 | 18 | 18 | 38 | 81 | 35 | 29 | |||||||||||||||||||||||
| Total revenue (non-IFRS) |
3,357 | 3,916 | 3,970 | 5,062 | 16,304 | 3,636 | 4,091 | |||||||||||||||||||||||
| Operating profit (IFRS) |
631 | 921 | 921 | 1,592 | 4,065 | 646 | 988 | |||||||||||||||||||||||
| Revenue adjustment* |
7 | 18 | 18 | 38 | 81 | 35 | 29 | |||||||||||||||||||||||
| Expense adjustment* |
196 | 234 | 300 | 338 | 1,067 | 221 | 201 | |||||||||||||||||||||||
| Operating profit (non-IFRS) |
834 | 1,173 | 1,239 | 1,969 | 5,214 | 901 | 1,219 | |||||||||||||||||||||||
| Operating margin (IFRS) in % |
18.8 | 23.6 | 23.3 | 31.7 | 25.1 | 17.9 | 24.3 | |||||||||||||||||||||||
| Operating margin (non-IFRS) in % |
24.8 | 30.0 | 31.2 | 38.9 | 32.0 | 24.8 | 29.8 | |||||||||||||||||||||||
| Effective tax rate (IFRS) in % |
26.9 | 23.6 | 24.8 | 28.0 | 26.2 | 16.3 | 24.8 | |||||||||||||||||||||||
| Effective tax rate (non-IFRS) in % |
28.1 | 25.6 | 26.7 | 28.7 | 27.5 | 21.4 | 26.8 | |||||||||||||||||||||||
| Earnings per share – basic (IFRS) in € |
0.37 | 0.55 | 0.52 | 0.92 | 2.37 | 0.44 | 0.61 | |||||||||||||||||||||||
| Earnings per share – basic (non- IFRS) in € |
0.49 | 0.70 | 0.70 | 1.14 | 3.03 | 0.58 | 0.73 | |||||||||||||||||||||||
| Net cash flows from operating activities |
2,071 | 329 | 657 | 765 | 3,822 | 2,162 | 320 | |||||||||||||||||||||||
| Purchases of intangible assets, and property, plant and equipment |
–113 | –162 | –95 | –171 | –541 | –113 | –152 | |||||||||||||||||||||||
| Free cash flow |
1,958 | 167 | 562 | 594 | 3,281 | 2,049 | 168 | |||||||||||||||||||||||
| Deferred cloud subscriptions and support revenue (quarter end) (IFRS) |
120 | 155 | 169 | 317 | 317 | 344 | 354 | |||||||||||||||||||||||
| Revenue adjustment* |
72 | 60 | 44 | 40 | 40 | 33 | 7 | |||||||||||||||||||||||
| Deferred cloud subscriptions and support revenue (quarter end) (non-IFRS) |
193 | 215 | 213 | 358 | 358 | 377 | 361 | |||||||||||||||||||||||
| Days` sales outstanding (DSO) in days** |
60 | 61 | 60 | 59 | 59 | 61 | 62 | |||||||||||||||||||||||
| Headcount*** |
59,420 | 60,972 | 61,344 | 64,422 | 64,422 | 64,598 | 64,937 | |||||||||||||||||||||||
| Employee retention in % (rolling 12 months) |
93 | 94 | 94 | 94 | 94 | 94 | 94 | |||||||||||||||||||||||
| Women in management in % (quarter end) |
18.7 | 19.0 | 19.3 | 19.4 | 19.4 | 19.9 | 19.8 | |||||||||||||||||||||||
| Greenhouse gas emissions in kilotons |
130 | 120 | 115 | 120 | 485 | 140 | 135 | |||||||||||||||||||||||
| * | Adjustments in the revenue line items are for support revenue, cloud subscription revenue, and other similarly recurring revenues that entities acquired by SAP would have recognized had they remained stand-alone entities but that SAP is not permitted to recognize as revenue under IFRS as a result of business combination accounting rules. Adjustments in the operating expense line items are for acquisition-related charges, share-based compensation expenses, restructuring expenses, and discontinued activities. |
| ** | Days’ Sales Outstanding measures the length of time it takes to collect receivables. SAP calculates DSO by dividing the average invoiced accounts receivables balance of the last 12 months by the average monthly sales of the last 12 months. |
| *** | In full-time equivalents at quarter end |
| INTERIM REPORT JANUARY – JUNE 2013 | 59 |
Table of Contents
| 60 | ADDITIONAL INFORMATION |
Table of Contents
| INTERIM REPORT JANUARY – JUNE 2013 | 61 |
Table of Contents
GROUP HEADQUARTERS
SAP AG
Dietmar-Hopp-Allee 16
69190 Walldorf
Germany
www.sap.com
www.sap.com/investor