UNITED STATES
SECURITIES AND EXCHANGE COMMISSION
Washington, D.C. 20549
FORM 10-K
| (Mark One) | ||
ý |
ANNUAL REPORT PURSUANT TO SECTION 13 OR 15(D) OF THE SECURITIES EXCHANGE ACT OF 1934 |
|
For the fiscal year ended December 31, 2012 |
||
or |
||
o |
TRANSITION REPORT PURSUANT TO SECTION 13 OR 15(D) OF THE SECURITIES EXCHANGE ACT OF 1934 |
|
For the transition period from to
Commission File Number 001-13711
WALTER ENERGY, INC.
(Exact name of registrant as specified in its charter)
| Delaware (State or other jurisdiction of incorporation or organization) |
13-3429953 (I.R.S. Employer Identification No.) |
|
3000 Riverchase Galleria, Suite 1700 Birmingham, Alabama (Address of principal executive offices) |
35244 (Zip Code) |
|
(205) 745-2000 Registrant's telephone number, including area code: |
||
Securities registered pursuant to Section 12(b) of the Act: |
||
Title of Each Class |
Name of Exchange on Which Registered |
|
| Common Stock, par value $0.01 | New York Stock Exchange Toronto Stock Exchange |
|
Securities registered pursuant to Section 12(g) of the Act: None
Indicate by check mark if the registrant is a well-known seasoned issuer, as defined in Rule 405 of the Securities Act. Yes ý No o
Indicate by check mark if the registrant is not required to file reports pursuant to Section 13 or Section 15(d) of the Act. Yes o No ý
Indicate by check mark whether the registrant (1) has filed all reports required to be filed by Section 13 or 15(d) of the Securities Exchange Act of 1934 during the preceding 12 months (or for such shorter period that the registrant was required to file such reports), and (2) has been subject to such filing requirements for the past 90 days. Yes ý No o
Indicate by check mark whether the registrant has submitted electronically and posted on its corporate Web site, if any, every Interactive Data File required to be submitted and posted pursuant to Rule 405 of Regulation S-T (§232.405 of this chapter) during the preceding 12 months (or for such shorter period that the registrant was required to submit and post such files). Yes ý No o
Indicate by check mark if disclosure of delinquent filers pursuant to Item 405 of Regulation S-K (§229.405) is not contained herein, and will not be contained, to the best of registrant's knowledge, in definitive proxy or information statements incorporated by reference in Part III of this Form 10-K or any amendment to this Form 10-K. o
Indicate by check mark whether the registrant is a large accelerated filer, an accelerated filer, a non-accelerated filer, or a smaller reporting company. See the definitions of "large accelerated filer," "accelerated filer" and "smaller reporting company" in Rule 12b-2 of the Exchange Act.
| Large accelerated filer ý | Accelerated filer o | Non-accelerated filer o (Do not check if a smaller reporting company) |
Smaller reporting company o |
Indicate by check mark whether the registrant is a shell company (as defined in Rule 12b-2 of the Exchange Act). Yes o No ý
The aggregate market value of voting stock held by non-affiliates of the registrant, based on the closing price of the Common Stock on June 30, 2012, the registrant's most recently completed second fiscal quarter, as reported by the New York Stock Exchange, was approximately $2.8 billion.
Number of shares of common stock outstanding as of January 31, 2013: 62,522,420
Documents Incorporated by Reference
Applicable portions of the Proxy Statement for the 2013 Annual Meeting of Stockholders of the Company are incorporated by reference in Part III of this Form 10-K.
WALTER ENERGY, INC. AND SUBSIDIARIES
ANNUAL REPORT ON FORM 10-K
TABLE OF CONTENTS
i
CAUTIONARY NOTE REGARDING FORWARD LOOKING STATEMENTS
This report includes statements of our expectations, intentions, plans and beliefs that constitute "forward-looking statements" within the meaning of Section 27A of the Securities Act of 1933, as amended (the "Securities Act") and Section 21E of the Securities Exchange Act of 1934, as amended (the "Exchange Act"), and are intended to come within the safe harbor protection provided by those sections. These statements, which involve risks and uncertainties, relate to analyses and other information that are based on forecasts of future results and estimates of amounts not yet determinable and may also relate to our future prospects, developments and business strategies. We have used the words "anticipate," "believe," "could," "estimate," "expect," "intend," "may," "plan," "predict," "project," "should" and similar terms and phrases, including references to assumptions, in this report to identify forward-looking statements. These forward-looking statements are made based on expectations and beliefs concerning future events affecting us and are subject to uncertainties and factors relating to our operations and business environment, all of which are difficult to predict and many of which are beyond our control, that could cause our actual results to differ materially from those matters expressed in or implied by these forward-looking statements. These risks and uncertainties include, but are not limited to:
- •
- Unfavorable economic, financial and business conditions;
- •
- Global economic crisis;
- •
- Market conditions beyond our control;
- •
- Prolonged decline in the price of coal;
- •
- Decline in global coal or steel demand;
- •
- Prolonged or dramatic shortages or difficulties in coal production;
- •
- Our customer's refusal to honor or renew contracts;
- •
- Our ability to collect payments from our customers;
- •
- Weather patterns and conditions affecting production;
- •
- Geological, equipment and other operational risks associated with mining;
- •
- Availability of adequate skilled employees and other labor relations matters;
- •
- Title defects preventing us from (or resulting in additional costs for) mining our mineral interests;
- •
- Availability of licenses, permits, and other authorizations may be subject to challenges;
- •
- Concentration of our mineral operations in a limited number of areas subjects us to risk;
- •
- A significant reduction of, or loss of purchases by our largest customer;
- •
- Unavailability of cost-effective transportation for our coal;
- •
- Availability, performance and costs of railroad, barge, truck and other transportation;
- •
- Disruptions or delays at the port facilities used by the Company;
- •
- Risks associated with our reclamation and mine closure obligations; including failure to obtain or renew surety bonds;
- •
- Inaccuracies in our estimates of coal reserves;
- •
- Estimates concerning economically recoverable coal reserves;
1
- •
- Significant cost increases and delays in the delivery of raw materials, mining equipment and purchased components;
- •
- Failure to meet project development and expansion targets;
- •
- Risks associated with operating in foreign jurisdictions;
- •
- Significant increase in competitive pressures and foreign currency fluctuations;
- •
- New laws and regulations to reduce greenhouse gas emissions that impact the demand for our coal reserves;
- •
- Greater than anticipated costs incurred for compliance with environmental liabilities or limitations on our ability to
produce or sell coal;
- •
- Future regulations that may increase our costs or limit our ability to produce coal;
- •
- Risks related to our indebtedness and our ability to generate cash for our financial obligations;
- •
- Inability to access needed capital;
- •
- Events beyond our control may result in an event of default under one or more of our debt instruments;
- •
- Costs related to our post-retirement benefit obligations and workers' compensation obligations;
- •
- Downgrade in our credit rating;
- •
- Adverse rulings in current or future litigation;
- •
- Our ability to attract and retain key personnel;
- •
- Our ability to identify suitable acquisition candidates to promote growth;
- •
- Our ability to successfully integrate acquisitions, including the acquisition of Western Coal Corp.;
- •
- Volatility in the price of our common stock;
- •
- Our ability to pay regular dividends to stockholders;
- •
- Our exposure to indemnification obligations; and
- •
- Other factors, including the other factors discussed in Item 1A, "Risk Factors," as updated by any subsequent Form 10-Qs or other documents that are on file with the Securities and Exchange Commission.
When considering forward-looking statements made by us in this Annual Report on Form 10-K ("Form 10-K"), or elsewhere, such statements speak only as of the date on which we make them. New risks and uncertainties arise from time to time, and it is impossible for us to predict these events or how they may affect us. We have no duty to, and do not intend to, update or revise the forward-looking statements in this Form 10-K after the date of this Form 10-K, except as may be required by law. In light of these risks and uncertainties, keep in mind that any forward-looking statement made in this Form 10-K or elsewhere might not occur.
2
GLOSSARY OF SELECTED MINING TERMS
Anthracite coal. A hard natural coal containing few volatile hydrocarbons which burns slowly and gives intense heat almost without flame.
Ash. Impurities consisting of silica, iron, alumina and other incombustible matter that are contained in coal. Since ash increases the weight of coal, it adds to the cost of handling and can affect the burning characteristics of coal.
Assigned reserves. Coal that is planned to be mined at an operation that is currently operating, currently idled, or for which permits have been submitted and plans are eventually to develop the mine and begin mining operations.
Bituminous coal. A common type of coal with moisture content less than 20% by weight. It is dense and black and often has well-defined bands of bright and dull material.
British thermal unit, or "Btu". A measure of the thermal energy required to raise the temperature of one pound of pure liquid water one degree Fahrenheit at the temperature at which water has its greatest density (39 degrees Fahrenheit).
Coal seam. Coal deposits occur in layers. Each layer is called a "seam."
Coke. A hard, dry carbon substance produced by heating coal to a very high temperature in the absence of air. Coke is used in the manufacture of iron and steel. Its production results in a number of useful by-products.
Compliance coal. Coal which, when burned, emits 1.2 pounds or less of sulfur dioxide per million Btus, as required by Phase II of the Clean Air Act.
Continuous miner. A machine used in underground mining to cut coal from the seam and load onto conveyers or shuttle cars in a continuous operation. In contrast, a conventional mining unit must stop extracting in order to begin loading.
Continuous mining. A form of underground mining that cuts the coal from the seam and loads the coal on to a conveyor system continuously, thus eliminating the separate cycles of cutting, drilling, shooting and loading.
Hard coking coal. Hard coking coal is a type of metallurgical coal that is a necessary ingredient in the production of strong coke. It is evaluated based on the strength, yield and size distribution of coke produced from such coal which is dependent on rank and plastic properties of the coal. Hard coking coals trade at a premium to other coals due to their importance in producing strong coke and as they are a limited resource.
Industrial coal. Coal generally used as a heat source in the production of lime, cement, or for other industrial uses and is not considered thermal coal or metallurgical coal.
Longwall mining. A form of underground mining that employs a shearer with two rotating drums pulled mechanically back and forth across a long exposed coal face. A hydraulic system supports the roof of the mine while the drums are mining the coal. Conveyors move the loosened coal to an underground mine conveyor which transports to the surface. Longwall mining is the most efficient underground mining method.
Metallurgical coal. The various grades of coal with suitable carbonization properties to make coke or be used as a pulverized injection ingredient for steel manufacture, including hard coking coal (see definition above), semi-soft coking coal (SSCC) and PCI coal (see definition below). Also known as "met" coal, its quality depends on four important criteria: (1) volatility, which affects coke yield; (2) the
3
level of impurities including sulfur and ash, which affect coke quality; (3) composition, which affects coke strength; and (4) other basic characteristics that affect coke oven safety. Met coal typically has particularly high Btu characteristics but low ash and sulfur content.
Nitrogen oxide (NOx). Produced as a gaseous by-product of coal combustion. It is a harmful pollutant that contributes to smog.
Overburden. Layers of earth and rock covering a coal seam. In surface mining operations, overburden must be removed prior to coal extraction.
PCI Coal. Coal used by steelmakers for pulverized coal injection (PCI) into blast furnaces to use in combination with the coke used to produce steel. The use of PCI allows a steel maker to reduce the amount of coke needed in the steel making process.
Preparation plant. Preparation plants are usually located on a mine site, although one plant may serve several mines. A preparation plant is a facility for crushing, sizing and washing coal to remove impurities and prepare it for use by a particular customer. The washing process has the added benefit of removing some of the coal's sulfur content.
Probable reserves. Reserves for which quantity and grade and/or quality are computed from information similar to that used for proven reserves, but the sites for inspection, sampling and measurement are farther apart or are otherwise less adequately spaced. The degree of assurance, although lower than that for proven reserves, is high enough to assume continuity between points of observation.
Proven reserves. Reserves for which: (a) quantity is computed from dimensions revealed in outcrops (part of a rock formation that appears at the surface of the ground), trenches, workings or drill holes; (b) grade and/or quality are computed from the results of detailed sampling; and (c) the sites for inspection, sampling and measurement are spaced so closely and the geologic character is so well defined that size, shape, depth and mineral content of reserves are well-established.
Recoverable reserves. Tons of mineable coal which can be extracted and marketed after deduction for coal to be left behind within the seam (i.e. pillars left to hold up the ceiling, coal not economical to recover within the mine, etc.) and adjusted for reasonable preparation and handling losses.
Reclamation. The process of restoring land and the environment to their original or otherwise rehabilitated state following mining activities. The process commonly includes "recontouring" or reshaping the land to its approximate original appearance, restoring topsoil and planting native grass and ground covers. Reclamation operations are usually underway before the mining of a particular site is completed. Reclamation is closely regulated by both state and federal law.
Reserve. That part of a mineral deposit that could be economically and legally extracted or produced at the time of the reserve determination.
Roof. The stratum of rock or other mineral above a coal seam; the overhead surface of a coal working place.
Sulfur. One of the elements present in varying quantities in coal that contributes to environmental degradation when coal is burned. Sulfur dioxide is produced as a gaseous by-product of coal combustion.
Surface mine. A mine in which the coal lies near the surface and can be extracted by removing the covering layer of soil (see "Overburden") without tunneling underground. About two-thirds of total U.S. coal production comes from surface mines.
4
Thermal coal. Coal used by power plants and industrial steam boilers to produce electricity, steam or both. It generally is lower in Btu heat content and higher in volatile matter than metallurgical coal.
Tons. A "short" or net ton is equal to 2,000 pounds. A "metric" ton is approximately 2,205 pounds; a "long" or British ton is equal to 2,240 pounds. Unless otherwise indicated, the metric ton is the unit of measure referred to in this document. The international standard for quoting price per ton is based in U.S. dollars per metric ton.
Unassigned reserves. Coal that is likely to be mined in the future, but which is not considered Assigned reserves.
Underground mine. Also known as a "deep" mine, it is usually located several hundred feet or more below the earth's surface, an underground mine's coal is typically removed mechanically and transferred by shuttle car and conveyor to the surface. Underground mines account for about one-third of annual U.S. coal production.
5
Introduction and History
We are a leading producer and exporter of metallurgical coal for the global steel industry and also produce thermal coal and industrial coal, anthracite, metallurgical coke, coal bed methane gas ("natural gas") and other related products. We trace our roots back to 1946 when Jim Walter began a homebuilding business in Tampa, Florida. Although initially focused on Homebuilding, the company Mr. Walter founded later became Jim Walter Corporation and branched out into different businesses, including the 1972 development of four underground coal mines in the Blue Creek coal seam near Brookwood, Alabama. In 1987 a group of investors that included Jim Walter formed a new company, subsequently named Walter Industries, Inc., and the following year completed a leveraged buyout of most of the businesses of Jim Walter Corporation. In 1997, Walter Industries, Inc. began trading on the New York Stock Exchange. In 2009 we closed our Homebuilding business, spun off our Financing business and certain other businesses and closed others to focus on the operations related to mining. With our remaining businesses concentrated in coal and natural gas, we changed our name to Walter Energy, Inc. in April 2009.
On April 1, 2011, we completed the acquisition of all the outstanding common shares of Western Coal Corp. ("Western Coal"). The acquisition included high quality metallurgical coal mines in Northeast British Columbia (Canada), high quality metallurgical coal and compliant thermal coal from mines in West Virginia (United States), and high quality anthracite coal and compliant thermal coal from the mines in South Wales (United Kingdom, "U.K."). The acquisition of Western Coal substantially increased our reserves available for future production, the majority of which is metallurgical coal, and created a diverse geographical footprint with strategic access to high-growth steel-producing countries in both the Atlantic and Pacific basins.
On May 6, 2011, we acquired mineral rights for approximately 68 million metric tons of recoverable Blue Creek metallurgical coal reserves to the Northwest of our existing Alabama mines from a subsidiary of Chevron Corporation. The mineral leases form the core of the Blue Creek Energy Project which is a planned new underground metallurgical coal mine. In addition, we acquired Chevron Corporation's existing North River thermal coal mine in Fayette and Tuscaloosa Counties of Alabama and a barge load-out facility near the Port of Mobile terminal in Mobile, Alabama.
Overview
Our primary business, the mining and exporting of metallurgical coal for the steel industry, is conducted by two business segments, our U.S. Operations segment and our Canadian and U.K. Operations segment. Beginning with the second quarter of 2011, as a result of the Western Coal acquisition, the Company revised its reportable segments by arranging them geographically. We now report all of our operations located in the U.S. under the U.S. Operations segment, including the West Virginia mining operations acquired through the acquisition of Western Coal. We report our mining operations acquired through the Western Coal acquisition located in Northeast British Columbia and South Wales under the Canadian and U.K. Operations segment.
The U.S. Operations segment includes the operations of our underground mines, surface mines, coke plant and natural gas operations located in Alabama and our underground and surface mining operations located in West Virginia. Our Alabama mining operations mine metallurgical coal from both underground and surface mines. At our legacy Alabama underground mining operations we mine high quality metallurgical coal from the Blue Creek coal seam. Our legacy Alabama underground mines are 1,400 to 2,100 feet underground, making them some of the deepest vertical shaft coal mines in North America. Metallurgical coal mined from the Blue Creek seam contains very low sulfur, has strong
6
coking properties and high heat value making it ideally suited as a coking coal for steel makers. The Alabama operations also mine thermal coal for sale to industrial and electric utility customers at our surface mines and the underground North River Mine. Our Alabama mining operations have convenient access to the port of Mobile, Alabama through barge and railroad allowing us to minimize our transportation costs. In 2012, the Alabama mining operations produced 6.5 million metric tons of hard coking coal and 2.7 million metric tons of thermal coal.
The U.S. Operations segment also extracts methane gas, principally from the Blue Creek coal seam. Our natural gas business represents one of the most extensive and comprehensive commercial programs for coal seam degasification in the country, producing approximately 50 million cubic feet of gas daily from over 1,740 wells.
Through the acquisition of Western Coal, we acquired two underground and two surface mines located in West Virginia, which produce both metallurgical coal and thermal coal. The West Virginia mining operations lie within the Appalachian coal-producing region. In 2011 and 2012, we temporarily idled the underground and surface operations, respectively, at the Gauley Eagle properties until such time as coal prices improve. Our West Virginia mining operations operate a rail-loading facility and utilize an extensive network of public roads to transport coal to markets or independent river terminals for transfer to barges along the Kanawha River. In 2012, the West Virginia mining operations produced approximately 480 thousand metric tons of metallurgical coal and 390 thousand metric tons of thermal coal.
The Canadian and U.K. Operations segment includes the operations of surface mines in Northeast British Columbia (Canada) and an underground mine and surface mine in South Wales (U.K.) The Canadian operations consist of three surface mines that produce primarily hard coking and low-volatile PCI coals. The Canadian mines are located adjacent to or nearby existing infrastructure established for the Northeast British Columbia coalfields, including established rail and road networks that are available all year round. Coal produced from the mines is shipped by rail to a coal terminal facility at the Port of Prince Rupert, British Columbia. The U.K. mining operation mined anthracite coal from its underground mine and thermal coal from its surface mine. In 2012, the Company idled the development of the underground operations until such future time as coal prices adequately rebound and in 2013 the surface mine operations will be closed. All coal mined is processed at the Company's nearby preparation plants where both road and rail coal transportation are available. In 2012, the Canadian and U.K. mining operations produced 2.0 million metric tons of hard coking coal and 2.5 million metric tons of low volatile PCI coal.
The financial results of our industry segments are included in Note 21 of "Notes to Consolidated Financial Statements" included in this Form 10-K.
Business Strategy
Our objective is to increase shareholder value through sustained earnings growth and free cash flow generation. Our key strategies to achieve this objective are described below:
Increasing Metallurgical Coal Production Capacity. Full year 2012 metallurgical coal production was 11.5 million metric tons, of which 78% was hard coking coal and the remainder low-volatile PCI coal. We expect full year 2013 metallurgical coal production to be in line with production levels in 2012. We believe we are well positioned to increase production when market conditions warrant. Our long-term production growth is expected to be balanced between existing production assets and growth assets such as Blue Creek Energy, Belcourt-Saxon and Aberpergwm.
Capitalizing on Favorable Long-Term Industry Dynamics. Although coal prices have been volatile over the past several years, we believe the long-term fundamentals of the global metallurgical coal industry are favorable. Given our premium product and diverse operations, we believe we are well
7
positioned to capitalize on the expected growth by delivering high quality metallurgical coal to the European, Asian and Latin American markets.
Focusing on Reducing Costs. We seek to maintain our focus on reducing costs. We plan on leveraging our infrastructure to increase production and to drive down our cost per ton through economies of scale. We anticipate reducing costs further through, among other initiatives, increased utilization of the Falling Creek Connector Road in Canada, longer panels on the Blue Creek No. 4 mine in Alabama, efficiencies from transitioning Brule to an owner-operated mine and a more centralized supply chain. We anticipate these improvements, combined with competitive transportation costs and a premium product, will expand our margins further.
Continuing to Provide a Mix of Coal Types and Quantities to Satisfy Our Customers' Needs Across a Variety of Geographic Markets. By having the ability to produce a variety of metallurgical coal types in three different countries with direct access to Atlantic and Pacific markets, we are able to source and blend our coal from multiple mines to meet the specific needs of our customers. Our broad geographic scope and mix of coal qualities provide us with the opportunities to work with leading steel producers across the globe and provide premium met coal to regions with high and/or growing demand for coal.
Upholding Our Commitment to Excellence in Safety and Environmental Stewardship. We intend to maintain our recognized leadership in operating safe mines and in achieving environmental excellence. In addition, our ability to minimize workplace incidents and environmental violations improves our operating efficiency, which directly improves our cost structure and operational performance.
The Coal Industry
Coal is one of the most important energy sources in the world, providing approximately 30% of the world's primary energy needs according to the World Coal Association ("WCA"). Per the WCA, the largest coal users are in China, the U.S., India, Russia and Japan. The most significant uses for coal are for electricity generation, steel production, cement manufacturing and as a liquid fuel. According to the WCA, approximately 70% of global steel production relies directly on inputs of metallurgical coal. After coking coal is converted to coke it is used in blast furnaces to smelt iron ore which is subsequently used to produce steel. The steel industry uses coking coal which is distinguishable from other types of coal by its characteristics: lower volatility, lower sulfur and ash content and favorable coking characteristics (higher coke strength). Additionally, metallurgical coal has a higher Btu value. Approximately 29% of steel is also produced in electric arc furnaces. The top five steel producing countries are China, Japan, the United States, India and Russia. In 2012, approximately 1.5 billion metric tons of steel was produced globally, relatively equal to that in 2011.
According to the WCA, approximately 41% of the world's electricity is generated from coal while its use is expected to rise to over 50% to 2030 primarily to meet the expanded use of electricity. According to the International Energy Agency ("IEA"), during 2012, coal was used to generate approximately 45% of the electricity in the United States. Per the IEA, coal's share of the global energy mix will continue to rise, and by 2017 coal will come close to surpassing oil as the world's top energy source.
Coal reserves, primarily thermal, are available in almost every country worldwide, with recoverable reserves in around 70 countries. According to the WCA it has been estimated that there are over 861 billion tons of proven coal reserves worldwide, which is enough coal to last approximately 112 years at current rates of consumption. The largest coal reserves are in the U.S., Russia, China and India. Coal's appeal is that it is readily available from a wide variety of sources; its prices have been lower and more stable than oil and gas prices over the long-term; and it is likely to remain the most affordable fuel available for power generation in many developing and industrialized nations for several decades per the WCA.
8
U.S. coal production declined 6.9% in 2012 driven by the decrease in domestic consumption, according to the Energy Information Administration's ("EIA") short-term energy outlook. U.S. coal production is expected to decline by a further 1.2% in 2013, as drawdowns for stock piled inventory combined with a small increase in coal imports are used to meet the small anticipated consumption increase in 2013. The top five coal producing countries in the world are China, the United States, India, Australia and Indonesia.
Coal is traded all over the world, with coal shipped significant distances by sea to reach certain markets. Over the last 20 years, seaborne trade in thermal coal has increased on average by about 7% each year and seaborne coking coal trade has increased by 1.6% per year, according to the WCA. According to the WCA, the largest exporters of coal in 2012 were Australia, Indonesia, Russia and the United States. The leading exporters of metallurgical coal for steel making, per the WCA, are Australia, the United States and Canada. According to the EIA, U.S. coal exports are currently projected to total a record 125 million short tons in 2012 and are anticipated to decline in 2013. Although exports are anticipated to decline in 2013, exports are still expected to remain in excess of 100 million short tons making 2013 the third straight year at such levels. The primary reasons for the expected decline in coal exports include anticipated continuing economic weakness in Europe, lower international coal prices, and increasing production in Asia.
Coal Characteristics
Coal is generally classified as either metallurgical coal or thermal coal (also known as steam and industrial coal). Sulfur, ash and moisture content as well as coking characteristics are key attributes in grading metallurgical coal while heat value, ash and sulfur content are important variables in rating thermal coal. We currently mine, process, market and ship coal with the characteristics described below.
Heat Value: The heating value of coal is supplied by its carbon content and volatile matter and commonly measured in British thermal units ("Btus"). Coal deposits are generally classified into four categories, ranging from lignite, subbituminous, bituminous and anthracite, reflecting their response to increasing heat and pressure. We primarily mine bituminous coal which is used to make coke and PCI coal for the steel industry or generate electricity with a heating value ranging between 10,500 and 15,500 Btus per pound. Anthracite coal has the highest carbon content and a heat value nearing 15,000 Btus per pound. Approximately 89% of our proven and probable reserves have heat value characteristics above 13,500 Btus per pound, which make it very desirable to our customers.
Sulfur Content: Although sulfur content can differ from seam to seam, approximately 95% of our estimated 401.0 million metric tons of proven and probable reserves are low sulfur coals, which are preferred by our customers. Low sulfur coals have a sulfur content of 1.5% or less. Coal produces undesirable sulfur dioxide when it burns, the amount of which depends on the concentration of sulfur in the coal as well as the chemical composition of the coal itself.
Ash and Moisture Content: Ash is the residue that remains after the combustion of coal. Low ash is desirable because businesses must dispose of ash after the coal is used. High moisture content decreases the heat value of the coal and increases the coal's weight both of which are undesirable. Our metallurgical coal, particularly the coal from the Blue Creek seam in Alabama, has a low ash rating and moisture content which is highly desirable to our customers.
Coking Characteristics (metallurgical coal only): Two important coking characteristics are coke strength and volatility. Volatility of coking coal is used to determine the percentage of coke that a given type of coal would produce. This measure is known as coke yield. A low volatility results in a higher coke yield. Our metallurgical coal, particularly the coal from the Blue Creek seam in Alabama, has both a high rating for coke strength as well as a low measure of volatility.
9
Types of Coal
Metallurgical coal is classified into three major categories of hard coking coal ("HCC"), semi-soft coking coal, and pulverized coal injection coal ("PCI"). Coking coals are the basic ingredients for manufacture of metallurgical coke. PCI coal is not used in coke making but is rather injected directly into the lower region of blast furnaces to supply both energy and carbon for iron reduction. The use of PCI can be a substitute for some of the metallurgical coke that would otherwise have been used.
Thermal and industrial coal is the most abundant form of coal and is commonly referred to as steam coal. Such coal has a relatively high heat value and has long been used for steam generation in electric power and industrial boiler plants.
Anthracite coal is commonly used as a reduction agent for various applications such as briquetting, charcoal and iron ore pellets. Due to our low production levels of anthracite thus far, we have been selling anthracite primarily as a domestic fuel in either hand fired stoker or automatic stoker furnaces. Once the Aberpergwm mine development is completed, our intent is to sell anthracite coal into the PCI coal market. Anthracite is a crossover coal and has been successfully used in the PCI coal market.
Coal Mining Methods
We mine coal using both underground and surface mining methods. The mining methods that we employ are determined by the geological characteristics of our coal reserves.
Underground Mining: We employ underground mining methods when our coal reserves are located deep beneath the surface. Our underground mines typically use the two different mining techniques of longwall mining and room-and-pillar mining. In 2012, approximately 60% of the coal we produced was from underground mining operations.
In longwall mining, mechanized shearers are used to cut and remove the coal from long rectangular blocks of medium to thick seams. Continuous miners are used to develop access to these coal blocks. After the coal is removed, it drops onto a conveyor system, that will ultimately take the coal to production shafts or slopes where it will be hoisted to the surface. In longwall mining, mobile hydraulic powered roof supports hold up the roof throughout the extraction process. This method of mining has proven to be more efficient than other mining methods, with an extraction rate of nearly 100 percent. The equipment is however more expensive than that for other conventional mining methods and cannot be used in all geological circumstances. In longwall mining, only the gate entries are bolted. The longwall panel is allowed to collapse behind the shields which hold the roof as coal is extracted and the shields progress through the coal block.
Underground mining with longwall technology drives greater production efficiency, improved safety, higher coal recovery and lower production costs. We currently operate four longwall mining systems at our Alabama underground mining operations for primary production and four to six continuous miner sections in each mine for the development of main and longwall panel entries. Our operating plan is a longwall to continuous miner production ratio of approximately 80% to 20%.
In room-and-pillar mining, a network of rooms are cut into the coal seam by remote-controlled continuous miners, while also leaving a series of coal pillars to support the mine roof. Shuttle cars and battery coal haulers transport coal to conveyor belt systems for further transportation to the surface. Ultimate seam recovery is typically less than that achieved with longwall mining as the pillars left behind as part of this mining method can constitute up to 40% of the total coal seam. We employ this method to mine smaller blocks of coal where longwall mining is not feasible.
Surface Mining: We employ surface mining methods when our coal reserves are located close to the surface. In 2012, approximately 40% of the coal we produced came from surface mining operations.
10
Surface mining involves removing the topsoil followed by a process of drilling and blasting the earth (overburden) covering the coal seam with explosives. The overburden is then removed with heavy earth-moving equipment such as draglines, power shovels, excavators and loaders exposing the coal seam. Once exposed, the coal seam is extracted and loaded into haul trucks for transportation to a preparation plant or load-out facility. After the coal is removed as part of our normal mining activities, we use the topsoil and overburden removed at the beginning of the process to backfill the excavated coal pits and reclaims disturbed areas. Once we replace the overburden and topsoil, we reestablish vegetation and plant life into the reclaimed area and make other improvements that provide local community and environmental benefits. Ultimate seam recovery for surface mining typically exceeds 80% and is dependent on overburden, coal thickness, geological factors, and equipment used.
Description of Our Business
We operate our business through two principal business segments of the U.S. Operations and Canadian and U.K. Operations. Our business segment financial information is included in Note 21 within the "Notes to Consolidated Financial Statements" included herein. During 2012, we actively operated 11 mines. For a comprehensive summary of all of our coal properties and of our coal reserves and production levels, see the tables summarizing our coal reserves and production in "Item 2. Properties" contained within this Form 10-K.
The following map shows the major locations of our mining operations:
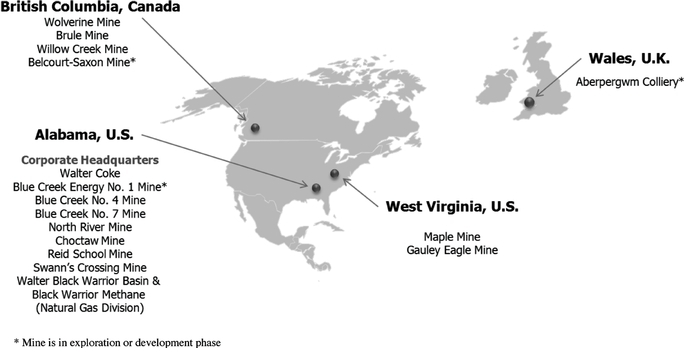
U.S. Operations
The U.S. Operations segment includes hard coking coal and thermal coal mines in both Alabama and West Virginia, a coke plant in Alabama, and coal bed methane extraction operations also located in Alabama. Metallurgical coal production totaled 7.0 million metric tons and thermal coal production totaled 3.1 million metric tons in 2012.
11
Alabama Operations: Our mining operations in Alabama consist of two underground hard coking coal mines in Southern Appalachia's Blue Creek coal seam (the No. 7 Mine, which includes No. 7 East, and the No. 4 Mine), one underground thermal coal mine (the North River Mine), one surface hard coking coal mine (the Reid School Mine) and two surface hard coking and thermal coal mines (the Swann's Crossing Mine and the Choctaw Mine).
Our Alabama underground mining operations are headquartered in Brookwood, Alabama and as of December 31, 2012 were estimated to have approximately 203.4 million metric tons of recoverable reserves located in west central Alabama between the cities of Birmingham and Tuscaloosa. Operating at approximately 2,000 feet below the surface, the No. 4 and No. 7 mines are two of the deepest underground coal mines in North America. The coal is mined using longwall extraction technology with development support from continuous miners. We extract coal primarily from Alabama's Blue Creek seam, which contains high-quality bituminous coal. Blue Creek coal offers high coking strength with low coking pressure, low sulfur and low-to-medium ash content with high Btu values that can be sold either as hard coking coal (used to produce coke) or as compliance thermal coal (used by electric utilities because it meets current environmental compliance specifications).
The coal from our No. 4 and 7 mines is currently sold as a high quality low and mid-vol hard coking coal. At forecasted production levels, we estimate the current reserves at these mines to have a 20 to 29 year life. As described previously, in May 2011 we acquired mineral rights for approximately 68 million additional metric tons of recoverable Blue Creek hard coking coal reserves located to the northwest of our No. 4 mine. The related mineral leases are expected to form the core of the Blue Creek Energy Project which is for the development of a new underground hard coking coal mine that has an estimated life of 40 to 45 years. Mines No. 4 and No.7 are located near Brookwood, Alabama, and are serviced by CSX rail. Both mines also have access to our barge load-out facility on the Black Warrior River. Service via both rail and barge culminates in delivery to the Port of Mobile, where shipments are exported to our international customers via ocean vessels. Approximately 96% of the hard coking coal sales from our Alabama underground mining operations consist of sales to international customers.
A coal producer is typically responsible for transporting the coal from the mine to an export coal-loading facility. Exported coal is usually sold at the loading port, with the buyer responsible for further transportation from the port to their location. Our Alabama mines are conveniently located near both river barge load-out facilities and railroad transportation (CSX rail) with direct access to the Port of Mobile, minimizing our transportation costs.
In May 2011 we acquired Chevron Corporation's existing North River thermal coal mine in Alabama. The North River Mine is near the end of its life and mining is currently expected to be completed in 2014.
Our Alabama natural gas operations extract and sell coal bed methane gas from the coal seams owned or leased by the Company and others. Prior to May 2010, our natural gas operations consisted solely of the Black Warrior Methane Corp., an equal ownership venture with E&P Company, a subsidiary of EP Energy LLC (EP Energy). In May 2010, we acquired HighMount Exploration and Production Alabama, LLC's coal bed methane business. The acquisition of this business included approximately 1,300 conventional gas wells, pipeline infrastructure and related equipment located adjacent to our existing underground mining and coal bed methane business. In addition, these wells degasify methane from the area where our new Blue Creek Energy mine is located. As of December 31, 2012, we had 1,746 wells that produced approximately 18.1 billion cubic feet of natural gas in 2012. The degasification operations have improved mining operations and safety by reducing methane gas levels in our mines.
We are currently operating three surface mines in Alabama. The Choctaw Mine is located near Parrish in Walker County, Alabama and produces thermal and hard coking coal. The mine has an
12
onsite rail facility serviced by Norfolk Southern rail. Access to Highway 269 provides delivery access to local customers via truck. The Reid School Mine is located in Blount County, Alabama and primarily produces hard coking coal. Access to Highway 79 provides delivery to local customers via truck. Hard coking coal mined at the Reid School Mine is primarily sold to our Coke plant and underground mining operations for resale. The Swann's Crossing Mine is located in Tuscaloosa County near Brookwood, Alabama and produces both hard coking and thermal coal. The mine has access to our barge load-out facility on the Black Warrior River.
We also own other surface mine coal reserves including the Flat Top surface mine that is a thermal mine and is ready for operation once market conditions permit. This mine is located in Adamsville, Alabama near Highway 78 and expectations are that any coal produced would be delivered to local customers via truck.
Additionally, we operate the, Walter Coke Plant, located in Birmingham, Alabama. The plant's major product line is metallurgical coke, which includes coke for furnace and foundry applications. Foundry coke is marketed to ductile iron pipe plants and foundries producing castings, such as for the automotive and agricultural equipment industries. Furnace coke is sold to the domestic and international steel industry for producing steel in blast furnaces. The plant utilizes up to 120 coke ovens with a capacity to annually produce up to 381,000 tons of metallurgical coke and is the second largest merchant foundry coke producer in the United States.
West Virginia Operations: We acquired four mines on two properties in West Virginia through the acquisition of Western Coal on April 1, 2011. Mines on these properties produce both hard coking and thermal coal. The two properties are the Gauley Eagle and Maple properties and each has an underground mine and surface mine.
The Maple Coal mines, located in Fayette and Kanawha counties and the Gauley Eagle mines located in Nicholas and Webster counties of West Virginia are estimated to contain approximately 46.3 million metric tons of recoverable reserves within the Appalachian coal-producing region as of December 31, 2012. The Maple underground coal mine mines in the Eagle coal seam and employs room-and-pillar mining method with continuous miners to produce premium high volatile coking coal, which can be used in the steelmaking process. Due to the challenges in the short-term market outlook and the weak backdrop in demand in 2012, we reduced production at the Maple underground mine. The Gauley Eagle underground mine also employs the room-and-pillar mining method to produce a semisoft coking coal, which can be used in the steelmaking process or as a premium low-sulfur thermal coal. Coal produced at the Maple and Gauley Eagle surface mines is primarily sold in the thermal market. The Gauley Eagle underground mine and Gauley Eagle surface mine were temporarily idled in mid-2011 and mid-2012; respectively, due to economic conditions. The personnel and equipment at these mines was reallocated to the Maple underground and surface mines. At forecasted production levels, we estimate the current reserves in these properties to have a 20-25 year life.
Coal from the Gauley Eagle and Maple mines is either transported by rail or by barge on the river systems to our customers. Coal shipped from our rail load-out facility can access regional markets and ports on the eastern U.S. seaboard. Coal shipped by barge on the river systems is trucked to the Kanawha River and shipped locally or offshore via the Mississippi River or Tennessee-Tombigbee river system. The transportation infrastructure and strategic location of the mines near its customers, ensures continuous and reliable delivery of our products.
The coking coal produced by our West Virginia operations is sold to domestic coke plants and international steel mills, while the thermal coal is sold domestically to regional electrical power plants on the eastern U.S. seaboard. Production comes from approximately 20 mineable seams which allow us to blend coal to many quality specifications that our customers request.
13
Canadian and U.K. Operations
Canadian Operations: The Canadian mining operations currently operate three surface metallurgical coal mines in Northeast British Columbia's coalfields (the Wolverine Mine, the Brule Mine, and the Willow Creek Mine). Within British Columbia, the Company holds the right to two large multi-deposit coal property groups: the Wolverine group, including the Perry Creek (Wolverine Mine), EB and Hermann deposits; and the Brazion group, including the Brule Mine and the Willow Creek Mine and less explored portions of these properties and adjacent properties. We also have a 50% interest in the Belcourt-Saxon multi-deposit coal property groups described below.
Our Canadian surface mining operations are located in Northeast British Columbia near the towns of Tumbler Ridge and Chetwynd. Our Canadian operations are estimated to have approximately 135.8 million metric tons of recoverable coal reserves including 72.1 million metric tons at potential future mine sites as of December 31, 2012. The Wolverine surface mine is located near the town of Tumbler Ridge and produces a high grade hard coking coal. We expect mining at the Wolverine mine to continue until approximately 2017. Future projects at Wolverine include the EB and Hermann surface mines which are currently expected to each have lives of 10 years. The Brule surface mine is located near the town of Chetwynd and produces a premium grade low-volatile PCI coal. We expect mining at the Brule mine to continue until approximately 2023. The Willow Creek surface mine, also located near the town of Chetwynd, produces metallurgical coal with production plans of one third hard coking coal and two thirds low-volatile PCI coal over the mine's life which is currently expected to be through 2024.
A key strategic advantage of the Canadian operations is the proximity to existing infrastructure. Our wholly-owned properties are located near rail and port infrastructure that is operational all year around. The rail line covers approximately 590 miles from our mines to the port at Prince Rupert, British Columbia. From the port facility, shipments are exported to our international customers via ocean vessels. This combined infrastructure provides cost effective and reliable delivery of our products to our customers.
Our Falling Creek connector road project was substantially commissioned near the end of the 2011 third quarter and truck hauling volumes on the road have continued to increase throughout 2012. The road connects the Brule mine to the Willow Creek mine where Brule's coal is processed and loaded at the rail load-out facility. The new road allowed us to increase our hauling capacity per truck and reduces the hauling distance as compared to the previous route from just over 62 miles down to 37 miles.
The metallurgical coal produced by our Canadian operations is sold to international customers located primarily in Asia to meet the demand for steel produced in the region. Our Wolverine mine's hard coking coal forms a key coke oven blend component with many of the leading steel mills in Asia. The Brule and Willow Creek low-volatile PCI coal is ranked as a premium PCI coal and can replace up to 30% of the coke requirement in a blast furnace. Willow Creek also has hard coking coal reserves that we began to mine in 2012. These high quality metallurgical coals, in conjunction with the infrastructure present in Northeast British Columbia, provide us with an opportunity to grow and diversify our customer base.
Additionally, we have a 50% interest in the Belcourt Saxon Coal Limited Partnership which includes two multi-deposit metallurgical coal properties comprising approximately 28.5 million metric tons of recoverable reserves which are located approximately 40 to 80 miles south of our Wolverine mine. We believe that the area has the potential to support significant mining operations and we expect that the partnership will develop these properties in the future. We also own or hold an interest in a number of other property assets located in Southeast British Columbia that are in the early stages of development.
14
Mine planning is progressing for the proposed EB and Hermann mines located near our existing Wolverine mine. These mines have approximately 19 million metric tons of recoverable high quality metallurgical coal reserves. Exploration has been completed within the proposed mining areas and production is expected to commence in EB as early as 2016.
U.K. Operation: Our U.K. mining operation consists of an underground and surface mine located in South Wales.
Our U.K. underground operation is estimated to have approximately 15.5 million metric tons of recoverable reserves as of December 31, 2012. The U.K. operation's primary activity has been the development and expansion of the Aberpergwm underground coal mine located at Glynneath in the Neath Valley. In the fall of 2011, we stopped continuous miner development operations to allow us to focus our attention on completing the new drift opening. While we were able to complete the upper section of the drift during 2012, due to challenges related to an oversupply of coal and decreased demand, we took steps to reduce development spending in this U.K. mine until market conditions improve. This mine produces anthracite coal, which can be sold as a low-volatile PCI coal. The surface mine operations produced thermal coal and were temporarily idled in 2012 until such future time as coal prices adequately rebound.
The U.K. operation is well located to take advantage of improved demand from U.K. steel mills and the European export market upon recovery of the global economy. Coal is processed in the operation's new preparation plant and loaded at a nearby rail load-out facility or transported to customers by road. In 2012 the mine supplied thermal coal and anthracite coal to a nearby electrical power plant and for various other commercial purposes.
Coal Preparation and Blending
Our coal mines have coal preparation and blending facilities convenient to each mine. The coal preparation and blending facilities receive, blend, process and ship coal that is produced from the mines. Using these facilities, we are able to ensure a consistent quality and efficiently blend our coal to meet our customers' specifications.
Marketing, Sales and Customers
Coal prices differ substantially by region and are impacted by many factors including the overall economy, demand for steel, demand for electricity, location, market, quality and type of coal, mine operation costs and the cost of customer alternatives. The major factors influencing our business are the economy and the demand for steel. Our Alabama operations' high quality Blue Creek coal and our Canadian operations' high quality hard coking coal are considered among the highest quality coals in the world and are preferred as a base coal in our customers' blends. The low-volatile PCI coal produced by our Canadian operations has proven itself in the marketplace as a desired source for our Asian steel makers. Our marketing strategy is to focus on international markets mostly in Europe, South America and Asia where we have a transportation cost advantage and where our coal is in high demand.
During 2012, approximately 48% of our metallurgical coal shipments were to customers in Europe, approximately 33% to Asia and approximately 16% to South America. We focus on long-term customer relationships where we have a competitive advantage. We sell most of our metallurgical coal under fixed price supply contracts primarily with terms of three months. Some of our sales of metallurgical coal can, however, occur in the spot market as dictated by available supply and market demand.
15
The Company's revenues by coal destination for the year ended December 31, 2012, were as follows:
| |
December 31, 2012 (in thousands) |
|||
|---|---|---|---|---|
Europe |
$ | 922,727 | ||
Asia |
633,162 | |||
North America |
532,078 | |||
South America |
311,928 | |||
Total |
$ | 2,399,895 | ||
During 2012, our five largest customers represented approximately 27% of our sales and, for the year ended December 31, 2012, no single customer accounted for 10% or more of our consolidated revenues. Even in this challenging economy we believe that the loss of these customers would not have a material adverse effect on our results of operations as we believe the loss of volume from these customers would be replaced with sales to other existing or new customers due to the demand for our metallurgical coal.
Our thermal coal is primarily marketed to customers in the United States, generally under long-term contracts.
Trade Names, Trademarks and Patents
The names of each of our subsidiaries are well established in the respective markets they serve. Management believes that customer recognition of such trade names is of significant importance. Our subsidiaries have numerous trademarks. Management does not believe, however, that any one such trademark is material to our individual segments or to the business as a whole.
Competition
Virtually all of our metallurgical coal sales are exported. Our major competitors are businesses that sell into our core business areas of Europe, South America and Asia. We primarily compete with producers of premium metallurgical coal from Australia, Canada and the United States. The principal factors on which we compete are coal prices at the port of shipment, coal quality and characteristics, customer relationships and the reliability of supply. The demand for our hard coking coal is significantly dependent on the general economy and the worldwide demand for steel. Although there are significant challenges in this current difficult economy, we believe that we have competitive strengths in our business areas that provide us with distinct advantages.
Competitive Strengths
Leading "Pure-Play" Metallurgical Coal Producer. We are a leading, global, publicly traded producer and exporter of metallurgical coal for the global steel industry. We had total coal reserves of 401.0 million metric tons as of December 31, 2012, which primarily consists of high quality, premium metallurgical coal. We expect 2013 metallurgical coal production to be in line with production levels in 2012. We believe we are well positioned to increase production when market conditions warrant.
Premium, High Quality Product. Blue Creek coal from our Alabama mining operations is recognized to be among the highest quality coals in the world. Its characteristics include very low sulfur, low ash and low volatility. These high quality characteristics and high heat value make it ideally suited for steel makers as a coking coal. Contract prices for our premium hard coking coal are consistently equal to the benchmark for premium coking coals. Hard coking coal produced from the Canadian mining operations has been well accepted by steel makers, currently having six of the top ten
16
largest steel mills in the region served as customers. The low-volatile PCI coal from the Canadian operations has also been widely accepted by customers.
Attractive Industry Dynamics. We expect that international demand for our metallurgical coal will increase in the future, driven by favorable projected global growth trends and the high quality of our coal compared to many other coal producing regions around the world. Metallurgical coal demand is underpinned by projected growth in world steel production of 3.2% in 2013, according to the World Steel Association. Steel producers are also rebuilding inventories and new supply of metallurgical coal is constrained by rail and port capacity in emerging supply basins.
Sales and Geographic Diversification. We operate up to twelve mines in three countries and have access to both the Atlantic and Pacific Seaborne markets. This geographical advantage provides important diversity in terms of production, markets, transportation and labor. We have operational flexibility due to this diversification, which makes us less reliant on any single mine for a significant portion of our earnings or cash flows. We believe the diversity of our operations and reserves also provides us with a significant advantage over competitors with operations in a single coal producing region as it allows us to diversify our customer base, with no one customer responsible for a significant portion of our revenues. This geographic diversification also allows us to source the high quality coals we produce from multiple sources and to blend to meet the exact specifications of our customers. In addition, with access to both the Atlantic and the Pacific markets, we believe that we are well positioned to take advantage of any growth in the seaborne coal market and to supply metallurgical coal to Latin America, Asia and Europe.
Significant Organic Growth Opportunities. We believe that our organic growth opportunities in metallurgical coal are well balanced between existing production assets and growth development projects such as Willow Creek, Aberpergwm, Blue Creek Energy and Belcourt Saxon. As the demand for high quality metallurgical coal in the global marketplace grows, we expect that we will be able to provide customers with increasing quantities of premium metallurgical coal.
Strong Financial Profile. Our premium priced coal and emphasis on low cost production provides strong margins and free cash flow generation over the long-term. As of December 31, 2012, we had $444.8 million of cash on hand and undrawn capacity under our revolving credit facility and no significant amount of debt maturing until 2015. With a significant portion of total debt prepayable, we expect to further enhance our credit profile through deleveraging.
Port Capacity and Low Cost Transportation Infrastructure. We believe we have sufficient port capacity to ship all of our current production and forecasted production growth. We have an agreement with the Port of Mobile in Alabama through July 31, 2016 with current capacity of approximately 6.5 million metric tons a year and capability to develop our port location properties to add additional capacity as needed. In Canada, Ridley Terminals, located in the port utilized by our Canadian operations, can handle 12 million metric tons per year of coal with the potential to expand to 24 million metric tons per year. We are able to minimize transportation costs due to the close proximity of our mines to our ports, as well as leverage our transportation infrastructure. Our principal mines in our Alabama operations are located a short distance from the Port of Mobile and are serviced by CSX rail. We also have port access through our barge load-out facility on the Black Warrior River. Because customers for our Alabama hard coking coal are primarily in Europe and South America, we are able to ship our coal quickly and at a relatively favorable cost. Our Canadian operations are located on CN Rail's rail lines, minimizing transportation costs to Ridley Terminal.
Highly Regarded and Experienced Management Team. Our top nine officers have an average of more than 30 years of experience. Our management team has demonstrated a history of increasing productivity, increasing production and maintaining strong customer relationships. We are committed to the safety and well-being of our employees and communities, respecting the environment in which we
17
do business, the continued growth of the Company's assets, and putting in place a conservative capital structure while creating long-term shareholder value.
We maintain excellent relationships with our customers. Customers want high quality products, delivered on a timely basis at a fair price. Given our premium products and our production and transportation efficiencies, we have historically been able to reliably deliver premium products at competitive prices on a timely basis. As a result, we have maintained excellent relationships with our customers over many years.
We are able to purchase and blend coal to the customer's specifications. To meet the exact needs of our customers, we are able to blend the high quality coals we produce to meet our customer's requirements at competitive prices.
Environmental and Other Regulatory Matters
Our businesses are subject to numerous federal, state, provincial and local laws and regulations with respect to matters such as permitting and licensing, employee health and safety, reclamation and restoration of property and protection of the environment. In the United States, environmental laws and regulations include, but are not limited to, the federal Clean Air Act ("CAA") and its state and local counterparts with respect to air emissions; the Clean Water Act ("CWA") and its state counterparts with respect to water discharges; the Resource Conservation and Recovery Act ("RCRA") and its state counterparts with respect to solid and hazardous waste generation, treatment, storage and disposal, as well as the regulation of underground storage tanks; and the Comprehensive Environmental Response, Compensation and Liability Act ("CERCLA") and its state counterparts with respect to releases, threatened releases, and remediation of hazardous substances. In Canada, the Company's operations are primarily regulated by provincial legislation, with some regional and federal authorizations required. Applicable environmental laws and regulations include, but are not limited to, the federal Fisheries Act with respect to protection of fish and fish habitat; the Species at Risk Act ("SARA") with respect to protection of identified species at risk, particularly caribou; the British Columbia Environmental Assessment Act with respect to conditions of applicable environmental assessment certificates; the Canadian Environmental Assessment Act with respect to potential federal environmental assessment processes; the British Columbia Mines Act (including the Health, Safety and Reclamation Code); the British Columbia Environmental Management Act and associated regulations with respect to waste discharges, air emissions, hazardous waste disposal, contaminated sites and spills; and the British Columbia Greenhouse Gas Reduction (Cap and Trade) Act with respect to reporting greenhouse gas emissions. Other environmental laws and regulations require reporting, even though the impact of that reporting is unknown. Compliance with these laws and regulations may be costly and time-consuming and may delay commencement, continuation or expansion of exploration or production at our operations. These laws are constantly evolving and becoming increasingly stringent. The ultimate impact of complying with existing laws and regulations is not always clearly known or determinable due in part to the fact that certain implementing regulations for these environmental laws have not yet been promulgated and in certain instances are undergoing revision. These laws and regulations, particularly new legislative or administrative proposals (or judicial interpretations of existing laws and regulations) related to the protection of the environment, could result in substantially increased capital, operating and compliance costs and could have a material adverse effect on our operations and/or our customers' ability to use our products.
We strive to conduct our mining, natural gas and coke operations in compliance with all applicable federal, provincial, state and local laws and regulations. However, due in part to the extensive and comprehensive regulatory requirements, along with changing interpretations of these requirements, violations occur from time to time in our industry and at our operations. In recent years, expenditures for regulatory or environmental obligations in the United States have been mainly for safety or process changes, although some expenditures continue to be made at several facilities to comply with ongoing
18
monitoring or investigation obligations. Expenditures relating to environmental compliance are a major cost consideration for our operations and environmental compliance is a significant factor in mine design, both to meet regulatory requirements and to minimize long-term environmental liabilities. To the extent these expenditures, as with all costs, are not ultimately reflected in the prices of our products and services, operating results will be reduced. We believe that our major North American competitors are confronted by substantially similar conditions and thus do not believe that our relative position with regard to such competitors is materially affected by the impact of environmental laws and regulations. However, the costs and operating restrictions necessary for compliance with environmental laws and regulations may have an adverse effect on our competitive position with regard to foreign producers and operators who may not be required to undertake equivalent costs in their operations. In addition, the specific impact on each competitor may vary depending on a number of factors, including the age and location of its operating facilities, applicable legislation and its production methods.
Permitting and Approvals
Numerous governmental permits and approvals are required for mining operations. We are required to prepare and present to federal, state, provincial and local authorities data pertaining to the effect or impact that any proposed exploration project for production of coal or gas may have upon the environment, the public and our employees. In addition, we must also submit a comprehensive plan for mining and restoring, upon the completion of mining operations, the mined property to its prior state, productive use or other permitted condition. The requirements are costly and time-consuming and may delay commencement or continuation of exploration, production or expansion at our operations. Typically we submit necessary mining permit applications several months, or even years, before we anticipate mining a new area.
Our coking operation is subject to numerous regulatory permits and approvals, including air and water permits. These permits subject us to certain monitoring and reporting requirements. We typically submit necessary permit renewal applications several months prior to expiration.
Applications for permits and permit renewals at our mining, coking and gas operations are subject to public comment and may be subject to litigation from third parties seeking to deny issuance of a permit or to overturn the agency's grant of the permit application, which may also delay commencement, continuation or expansion of our mining, coking and gas operations. Further, regulations provide that applications for certain permits or permit modifications in the United States can be delayed, refused or revoked if an officer, director or a stockholder with a 10% or greater interest in the entity is affiliated with or is in a position to control another entity that has outstanding permit violations. In the current regulatory environment, we anticipate approvals will take even longer than previously experienced, and some permits may not be issued at all. Significant delays in obtaining, or denial of, permits could have a material adverse effect on our business.
U.S. Operations
Mine Safety and Health
The Mine Safety and Health Administration ("MSHA") under the Federal Mine Safety and Health Act of 1977 (the "Mine Act"), and the Mine Improvement and New Emergency Response Act of 2006 (the "MINER Act"), as well as regulations adopted under these federal laws, impose rigorous safety and health standards on mining operations. Such standards are comprehensive and affect numerous aspects of mining operations, including but not limited to: training of mine personnel, mining procedures, ventilation, blasting, use of mining equipment, dust and noise control, communications, and emergency response procedures. MSHA monitors compliance with these laws and standards by regularly inspecting mining operations and taking enforcement actions where MSHA believes there to be non-compliance. Maximum civil penalties for violations of these laws and standards are $70,000 per violation, unless the violation is deemed to be flagrant which can result in a maximum civil penalty of
19
$220,000. These federal mine safety and health laws and regulations have a significant effect on our operating costs.
The MINER Act mandated increased regulations in some of the areas listed above, and some of those regulations are now effective. The MINER Act and other legislative and regulatory initiatives, such as the Dodd-Frank Wall Street Reform and Consumer Protection Act (the "Dodd-Frank Act") passed by the U.S. Congress and signed into law on July 21, 2010 are still ongoing. While the Dodd-Frank Act is focused primarily on the regulation and oversight of financial institutions, it also provides for regulatory compliance requirements related to mining safety and health matters. Section 1503 of the Dodd-Frank Act requires public companies that own or operate a "coal or other mine" in the United States to include certain specified disclosures regarding health and safety violations that may have previously been considered immaterial in their periodic reports filed under the Exchange Act. Section 1503 of the Dodd-Frank Act also requires a reporting company operating coal mines or with subsidiaries that operate coal mines to file a Current Report on Form 8-K upon receipt of written notice from MSHA of an imminent danger order under Section 107(a) of the Mine Act or of any warning from MHSA that the mine either has a pattern of health or safety violations, or has the potential for such a pattern. On August 13, 2012, our wholly-owned subsidiary, Jim Walter Resources, Inc. and the operator of our No. 7 Mine, received imminent danger Order No. 8522884 (the "Order") under section 107(a) of the Mine Act. In the Order, MSHA asserted that methane was allowed to accumulate in a roof cavity in a long crosscut on the underground No. 8 Continuous Miner Section. Shortly thereafter, according to the Order, a line curtain was used "to sweep the methane out," and the Order was quickly terminated. No injuries resulted from the condition described in the Order. See "Exhibit 95" included in this Form 10-K for information concerning mine safety violations and other regulatory matters pursuant to the requirements of Section 1503(a) of the Dodd-Frank Act and Item 104 of Regulation S-K (17 CFR 229.104).
Workers' Compensation and Black Lung
We are insured for workers' compensation benefits for work related injuries that occur within our U.S. operations. We retain the first $1 million to $2 million per accident for all of our U.S. subsidiaries and are insured above the deductible for statutory limits, with the exception of Jim Walter Resources located in Alabama, where we retain any amount in excess of $10 million per accident. Workers' compensation liabilities, including those related to claims incurred but not reported, are recorded principally using annual valuations based on discounted future expected payments using historical data of the division or combined insurance industry data when historical data is limited. In addition, certain of our subsidiaries are responsible for medical and disability benefits for black lung disease under the Federal Coal Mine Health and Safety Act of 1969 and the Mine Act, as amended, and are self-insured against black lung related claims. We perform periodic evaluations of our black lung liability, using assumptions regarding rates of successful claims, discount factors, benefit increases and mortality rates, among others. See "Item 7. Management's Discussion and Analysis of Financial Condition and Results of Operations and Financial Condition" for further information on assumptions utilized.
Surface Mining Control and Reclamation Act
The Surface Mining Control and Reclamation Act of 1977 ("SMCRA"), requires that comprehensive environmental protection and reclamation standards be met during the course of and following completion of mining activities. Permits for all mining operations must be obtained from the Federal Office of Surface Mining Reclamation and Enforcement or, where state regulatory agencies have adopted federally approved state programs under the Act, the appropriate state regulatory authority. In Alabama, the Alabama Surface Mining Commission reviews and approves SMCRA permits and the West Virginia Department of Environmental Protection reviews and approves SMCRA permits in West Virginia.
20
SMCRA permit provisions include requirements for coal prospecting, mine plan development, topsoil removal, storage and replacement, selective handling of overburden materials, mine pit backfilling and grading, subsidence control for underground mines, surface drainage control, mine drainage and mine discharge control, treatment and revegetation. These requirements seek to limit the adverse impacts of coal mining and more restrictive requirements may be adopted from time to time.
Before a SMCRA permit is issued, a mine operator must submit a bond or otherwise secure the performance of reclamation obligations. The Abandoned Mine Land Fund, which is part of SMCRA, imposes a general funding fee on all coal produced. The proceeds are used to reclaim mine lands closed or abandoned prior to 1977. On December 7, 2006, the Abandoned Mine Land Program was extended for another 15 years.
SMCRA stipulates compliance with many other major environmental statutes, including: the Clean Air Act, the Clean Water Act, the Resource Conservation and Recovery Act, and the Comprehensive Environmental Response, Compensation and Liability Act.
On December 12, 2008, the Office of Surface Mining (OSM), finalized rulemaking regarding the interpretation of the stream buffer zone provisions of SMCRA which confirmed that excess spoil from mining and refuse from coal preparation could be placed in permitted areas of a mine site that constitute waters of the United States. The rule was challenged in U.S. District Court. A settlement agreement staying the litigation established a timeframe for revision of the regulations. This settlement agreement did not prescribe any specific provisions that must be included in either the proposed or the final rule. While this ongoing rulemaking takes place, the 2008 rule remains in effect on lands for which OSM is the regulatory authority. The OSM anticipates publishing a proposed rule and draft impact statement during 2013.
We accrue for future reclamation costs anticipated for mine closures. Estimates of our total reclamation and mine-closing liabilities are based upon permit requirements and our experience related to similar activities. The amounts recorded are dependent upon a number of variables, including the estimated future retirement costs, estimated proven reserves, assumptions involving profit margins, inflation rates, timing of reclamation expenditures, and the assumed credit-adjusted risk-free interest rates. Furthermore, these obligations are typically unfunded. If these accruals are insufficient or our liability in a particular year is greater than currently anticipated, our future operating results could be adversely affected. As of December 31, 2012, we accrued $55.5 million for our asset retirement obligations for all of our U.S. mining operations, most of which will be incurred at our underground mining operations near the end of the mines' lives. As of December 31, 2012, we had accrued $89.5 million for all our asset retirement obligations.
Surety Bonds/Financial Assurance
We use surety bonds, trusts and letters of credit to provide financial assurance for certain transactions and business activities. Federal and state laws require us to obtain surety bonds to secure payment of certain long-term obligations including mine closure or reclamation costs and other miscellaneous obligations. The bonds are renewable on a yearly basis.
Surety bond costs have increased in recent years while the market terms of such bonds have generally become more unfavorable. In addition, the number of companies willing to issue surety bonds has decreased. Bonding companies may also require posting of collateral, typically in the form of letters of credit, to secure the surety bonds. As of December 31, 2012, we had outstanding surety bonds with parties for post-mining reclamation at all of our U.S. mining operations totaling $68.6 million, plus $14.3 million for miscellaneous purposes. As of December 31, 2012, we maintained letters of credit totaling $10.8 million to secure these surety bonds.
21
Climate Change
Global climate change continues to attract considerable public and scientific attention with widespread concern about the impacts of human activity, especially the emission of greenhouse gases ("GHGs"), such as carbon dioxide and methane. Combustion of fossil fuels, primarily the thermal coal and methane gas we produce results in the creation of carbon dioxide that is currently emitted into the atmosphere by coal and gas end-users. Further, some of our operations such as coal mining and coke production directly emit GHGs. Laws and regulations governing emissions of GHGs have been adopted by foreign governments, including the European Union and member countries, individual states in the United States and regional governmental authorities. Further, numerous proposals have been made and are likely to continue to be made at the international, national, regional, and state levels of government that are intended to limit emissions of GHGs by enforceable requirements and voluntary measures. In addition, the United States and over 160 other nations are signatories to the 1992 Framework Convention on Climate Change, which is intended to limit emissions of GHGs. In December 1997, in Kyoto, Japan, the signatories to the convention established a binding set of emission targets for developed nations. Although the specific emission targets vary from country to country, had the Senate ratified the Kyoto Protocol, which it did not, the United States would have been required to reduce emissions to 93% of 1990 levels from 2008 through 2012. Efforts to reach additional international agreements to regulate GHGs are on-going.
In April 2009, in response to a 2007 U.S. Supreme Court decision, the Environmental Protection Agency ("EPA") proposed findings that emissions of GHGs from motor vehicles are contributing to air pollution which, in turn, is endangering the public health and welfare. These proposed findings (which were made final in December 2009) set in motion the process for the EPA to regulate GHGs from mobile sources, which in turn resulted in some initial regulation of GHGs from stationary sources under the Clean Air Act. The EPA's findings focus on six GHGs, including carbon dioxide and nitrous oxide (which are emitted from coal combustion) and methane (which is emitted from coal beds). Although the EPA has stated a preference that GHG reduction be based on new federal legislation rather than through agency regulation pursuant to the existing Clean Air Act, the EPA is nonetheless taking steps to regulate many sources of GHGs without further legislation (see Clean Air Act below). It is difficult to predict reliably how such regulation will develop and when or whether it will take effect, as the EPA's finalized findings that underpin such regulation are the subject of a number of lawsuits. Also, bills have been introduced in Congress that would, if enacted, prevent the EPA from regulating GHGs under the Clean Air Act.
In June 2010, the U.S. House of Representatives passed a bill that would regulate GHG emissions through a "cap and trade" system and related programs, which generally would require emitters of GHGs to purchase or otherwise obtain allowances to emit GHGs. However, the bill failed to make it through the U.S. Senate. Thus, it is uncertain whether Congress will enact "cap and trade" or other legislation to address climate change and, if it does, when it will occur and what it will require.
Coal bed methane must be expelled from our underground coal mines for mining safety reasons. Our gas operations extract coal bed methane from our underground coal mines prior to mining. With the exception of some coal bed methane which is vented into the atmosphere when the coal is mined, much of the methane is captured and sold into the natural gas market and used as a clean fuel. If regulation of GHG emissions does not exempt the release of coal bed methane, we may have to curtail coal production, pay higher taxes, or incur costs to purchase credits that allow us to continue operations as they now exist at our underground coal mines. The amount of coal bed methane we capture is recorded, on a voluntary basis, with the U.S. Department of Energy. We have recorded the amounts we have captured since 1992. In 2009, Jim Walter Resources partnered with Biothermica Technologies to capture and mitigate the methane that is vented into the atmosphere as a result of the mining process. This project resulted in the listing of the project with the Climate Action Reserve on February 2, 2010, a national offsets program working to ensure integrity, transparency and financial
22
value in the U.S. carbon market by establishing regulatory-quality standards for the development, quantification and verification of GHG emissions reduction projects in North America. If regulation of GHGs does not give us credit for capturing methane that would otherwise be released into the atmosphere at our coal mines, any value associated with our historical or future credits could be reduced or eliminated.
The EPA releases annual GHG reports that are filed by approximately 6,700 entities with GHG emissions over 25,000 tons per year. The data is available to the public online in a form similar to Toxic Release Inventory data (i.e., searchable by state, industry sector, and source). A three-judge panel of the U.S. Court of Appeals in Washington ruled that the EPA properly concluded that greenhouse gases are pollutants that endanger human health and that opponents don't have the legal right to challenge rules determining when states and industries must comply with regulations curtailing these emissions.
On August 12, 2012, the Obama Administration finalized standards that require automakers to nearly double the average fuel economy of new cars and light-duty trucks to 54.5 miles per gallon by Model Year 2025. The standards issued by the U.S. Department of Transportation (DOT) and the EPA build on the standards for cars and light-duty trucks for Model Years 2011-2016 which raised average fuel efficiency by 2016 to the equivalent of 35.5 miles per gallon.
At the 17th Conference of the Parties (COP-17) of the U.N. Framework Convention on Climate Change in Durban, South Africa, negotiations extended beyond the planned conclusion of the meeting and led to a somewhat vague agreement that would obligate major GHG emitting countries (including the U.S., China and India) to begin reducing emissions beyond 2020. The agreement sets 2015 as a target date to complete a text for a legally binding agreement. A second commitment period for the Kyoto Protocol was also agreed to, although several major countries (Canada, Japan, and Russia) opted out, and a decision on the second commitment period of eight years was decided during COP-18. Meanwhile, Canada has withdrawn from the original Kyoto Protocol, opting instead to commit to the Copenhagen Accord, which called for reducing GHG emissions to 2005 levels by 2020.
Additional laws or regulations regarding GHG emissions or other actions to limit GHG emissions could result in the fuel source of energy production switching from coal, or to a lesser degree natural gas, to other fuel sources. Alternative fuels (non-fossil fuels) could become more attractive than coal, or to a lesser degree natural gas, in order to reduce GHG emissions. This could result in a reduction in the demand for our coal, and to a lesser degree our natural gas, and therefore negatively impacting our revenues as well as reduce the value of our reserves (although switching to a cleaner alternative fuel could increase demand for our natural gas, which emits less GHG when burned than an equivalent quantity of coal). The anticipation of such requirements could also lead to reduced demand for some of our products. Additional GHG laws or regulations could also increase our costs, such as those to produce natural gas and manufacture coke. Although the potential impacts on us of additional climate change regulation are difficult to reliably quantify, they could be material.
Clean Air Act
The federal Clean Air Act ("CAA") and comparable state laws that regulate air emissions affect coal mining and coking operations both directly and indirectly. Direct impacts on coal mining may occur through permitting requirements and/or emission control requirements relating to particulate matter, such as fugitive dust, or fine particulate matter measuring 2.5 micrometers in diameter or smaller. The CAA indirectly affects our mining operations and directly affects our coking operations by extensively regulating the air emissions of sulfur dioxide, nitrogen oxides, mercury and other compounds emitted by coal-fired utilities, steel manufacturers and coke ovens. As described below, proposed regulations would also subject GHG emissions to regulation under the CAA.
The CAA requires, among other things, the regulation of hazardous air pollutants through the development and promulgation of Maximum Achievable Control Technology ("MACT") Standards. The
23
EPA has developed various industry-specific MACT standards pursuant to this requirement. The CAA requires the EPA to promulgate regulations establishing emission standards for each category of Hazardous Air Pollutants. The EPA must also conduct risk assessments on each source category that is already subject to MACT standards and determine if additional standards are needed to reduce residual risks.
Our coking facility is subject to certain MACT standards and National Emissions Standards for Hazardous Air Pollutants ("NESHAPS"). Relative to MACT, these standards apply to pushing, quenching, and under-firing stacks and went into effect in April 2006. Concerning NESHAPS, the standards include Coke Oven NESHAPS (1993), Benzene NESHAPS and Benzene Waste NESHAPS, which were enacted in the early 1990's. The portion of NESHAP which applies to coke ovens addresses emissions from charging, coke oven battery tops, and coke oven doors. With regard to this standard, Walter Coke chose the LAER (Lowest Achievable Emissions Rate) track, and therefore is not required to comply with residual risk until 2020.
On January 9, 2012, the DC U.S. District Court overturned the EPA's stay of the Boiler MACT and solid waste incinerator (CISWI) rules based on the Sierra Club's challenge of the stay, which was intended to provide time for the EPA to reconsider and re-propose the rule. This means the 3-year period for existing sources to comply with the previously issued rule in March 2011 is effective, although the December 23, 2011 re-proposed rule, subject to comments by February 21, 2012 would re-set the compliance timetable when finalized. In a January 18, 2012 letter responding to a Congressional inquiry, the EPA stated that no enforcement action would be taken relative to notification requirements in the original (no longer stayed) rule until a final rule is issued and the EPA re-sets these dates. On December 21, 2012, the EPA released its final rules setting requirements for industrial boilers and process heaters, as well as commercial and industrial waste incinerators. The magnitude of the impact of any such anticipated changes cannot be estimated at this time.
The CAA also requires the EPA to develop and implement National Ambient Air Quality Standards ("NAAQS") for criteria pollutants, which include sulfur dioxide, particulate matter, nitrogen oxides, and ozone. Areas that are not in compliance with these standards, referred to as non-attainment areas, must take steps to reduce emission levels. Individual states must identify the sources of emissions and develop emission reduction plans. These plans may be state-specific or regional in scope. It is anticipated that the EPA's fine particle programs will affect many power plants, especially coal-fueled power plants and all plants in non-attainment areas, and could result in significant costs; however, it is impossible to estimate the magnitude of these costs at this time as state and federal agencies are still developing regulations for the programs and implementation.
The EPA announced on January 6, 2010 a proposal to adopt a new, more stringent primary ambient air quality standard for ground-level ozone and to change the way in which the secondary standard is calculated. The EPA has entered into a consent decree with environmental groups that committed the agency to publish designations for areas not attaining the 2008 ozone ambient air standard by May 31, 2012.
Litigation over the EPA's missed deadlines for implementing state implementation plans and air permitting requirements relative to the 2008 standard is not addressed in the consent decree and is continuing. The agency is also working on guidance for states to implement those standards. Meanwhile, environmental groups continue to pursue their challenge to the 2008 standard as well as separate litigation challenging the Administration's September 2011 decision to withdraw its proposal to tighten the 2008 standard and instead delay consideration of a new standard into the ongoing review that would lead to a new proposal in 2014. Should these NAAQS withstand scrutiny, additional emission control expenditures will likely be required at coal-fueled power plants and may adversely affect the demand for coal.
24
On April 30, 2012, the EPA published a final rule designating areas of the country not meeting the 2008 revisions to the ozone ambient air standards and attainment deadlines for meeting those standards. On May 31, 2012, the EPA completed area designations for the Chicago metropolitan area. The State of Indiana and industry groups have filed, in the U.S. Court of Appeals for the DC Circuit, a petition for review challenging the EPA's designation of the 11 county greater Chicago area as "nonattainment" of the 2008 ozone ambient air quality standards. On December 14, 2012, the EPA denied petitions from environmental and industry groups to reconsider the agency's final ozone attainment designations published in April.
On December 16, 2011, the EPA signed a rule to reduce emissions of toxic air pollutants from power plants. Specifically, these mercury and air toxics standards for power plants will reduce emissions from new and existing coal and oil-fired eclectic utility steam generating units. The required reduction in emissions may require the installation of additional costly control technology or the implementation of other measures, including trading of emission allowances and transitioning to alternative clean fuels. These reductions in permissible emission levels will likely make it more costly to operate coal-fired power plants and may adversely affect the demand for coal. The EPA has proposed to update emission limits for new power plants under the Mercury and Air Toxics Standards (MATS). The new proposed standards affect only new coal- and oil-fired power plants that will be built in the future. The proposal, issued on November 16, 2012, does not change the final emission limits for existing power plants. The EPA says it has reconsidered the new source limits for MATS based on new information and analysis that became available to the agency after the rule was finalized. The EPA says it projects that the proposed updates will result in no significant change in costs, emission reductions or health benefits from MATS. The EPA is also proposing to revise and clarify requirements that apply during periods of startup and shutdown in MATS and startup and shutdown for particulate matter in the Utility New Source Performance Standards (NSPS), and is proposing other minor technical corrections. The EPA is expected to issue a final rule in March 2013.
On January 22, 2010, the EPA set a new one-hour Nitrogen Dioxide (NO2) standard and retained the annual average. The new standard must be taken into account when permitting new or modified major sources of NO2 emissions such as fossil-fueled power plants, boilers, and a variety of manufacturing operations. On January 20, 2012, the EPA designated all areas of the country as "unclassifiable/attainment" for the 2010 NO2 NAAQS. The available air quality data show that all monitored areas in the country meet the 2010 NO2 NAAQS for 2008-2010. Additional emission control expenditure may be required at coal-fueled power plants and may adversely affect the demand for coal.
On June 2, 2010, the EPA revised the NAAQS for Sulfur Dioxide (SO2) by establishing a new one-hour standard and revoking the existing 24-hour and annual standards. On August 3, 2012, the EPA published a rule extending the deadline for designating areas not attaining the standard to June 3, 2013 and requires state implementation plans by 2014 and standards to be met by August, 2017. Additional emission control expenditures may be required at coal-fueled power plants and may adversely affect the demand for coal.
The EPA has initiated a regional haze program designed to protect and improve visibility at and around national parks, national wilderness areas and international parks. This program may result in additional emissions restrictions from new coal-fired power plants whose operation may impair visibility at and around federally protected areas. This program may also require certain existing coal-fired power plants to install additional control measures designed to limit haze-causing emissions, such as sulfur dioxide, nitrogen oxides, volatile organic chemicals and particulate matter. The EPA's finding concerning GHG endangerment of public health and welfare (see Climate Change above) may lead to regulation of GHG emissions from stationary sources under the Clean Air Act. In connection with that finding, the EPA also finalized a tailoring rule which would set emission thresholds for GHG regulation under the EPA's current Clean Air Act stationary source permitting requirements. Finalized on May 13,
25
2010 and effective January 2, 2011, this rule has drawn legal challenges. Accordingly, the impact of such regulation on us cannot be reliably estimated at this time, although it could be material.
Clean Water Act
The federal Clean Water Act ("CWA") and corresponding state laws affect our operations by imposing restrictions on discharges of wastewater into creeks and streams. These restrictions, more often than not, require us to pre-treat the wastewater prior to discharging it. Permits requiring regular monitoring and compliance with effluent limitations and reporting requirements govern the discharge of pollutants into regulated waters. Our mining and coking operations maintain water discharge permits as required under the National Pollutant Discharge Elimination System program of the CWA, and conduct their operations to be in compliance with such permits. We believe we have obtained all permits required under the CWA and corresponding state laws and are in substantial compliance with such permits. However, new requirements under the CWA and corresponding state laws may cause us to incur significant additional costs that could adversely affect our operating results.
Resource Conservation and Recovery Act
The Resource Conservation and Recovery Act ("RCRA") and corresponding state laws establish standards for the management of solid and hazardous wastes generated at our various facilities. Besides affecting current waste disposal practices, the RCRA also addresses the environmental effects of certain past hazardous waste treatment, storage and disposal practices. In addition, the RCRA also requires certain of our facilities to evaluate and respond to any past release, or threatened release, of a hazardous substance that may pose a risk to human health or the environment.
The RCRA may affect coal mining operations by establishing requirements for the proper management, handling, transportation and disposal of solid and hazardous wastes. Currently, certain coal mine wastes, such as earth and rock covering a mineral deposit (commonly referred to as overburden) and coal cleaning wastes, are exempted from hazardous waste management under the RCRA. Any change or reclassification of this exemption could significantly increase our coal mining costs.
Our coking operations entered into a RCRA Section 3008(h) Administrative Order on Consent (Order) with an effective date of September 24, 2012 with the EPA. The objectives of the 2012 Order are to perform Corrective Measure Studies, implement remedies if necessary, as well as implement and maintain institutional controls if necessary at the Walter Coke facility. As of December 31, 2012, the Company had an amount accrued that is probable and can be reasonably estimated for the costs to be incurred to identify and define remediation actions, as well as to perform certain remediation tasks which can be quantified. The amount of this accrual is not material to the financial statements. While it is probable that the Company will incur additional future costs to remediate environmental liabilities at the Walter Coke facility, the amount of such additional costs cannot be reasonably estimated at this time. For additional information regarding significant enforcement actions, capital expenditures and costs of compliance, see Part I, "Item 3. Legal Proceedings" and "Environmental Matters" in Note 18 of "Notes to Consolidated Financial Statements" included in this Form 10-K.
Comprehensive Environmental Response, Compensation and Liability Act
The Comprehensive Environmental Response, Compensation and Liability Act ("CERCLA" or "Superfund") and similar state laws affect our coal mining and coking operations by, among other things, imposing investigation and cleanup requirements for threatened or actual releases of hazardous substances. Under CERCLA, joint and several liability may be imposed on operators, generators, site owners, lessees and others regardless of fault or the legality of the original activity that caused or resulted in the release of the hazardous substances. Although the EPA excludes most wastes generated
26
by coal mining and processing operations from the hazardous waste laws, the universe of materials and wastes governed by CERCLA is broader than "hazardous waste" and as such even non-hazardous wastes can, in certain circumstances, contain hazardous substances, which if released into the environment are governed by CERCLA. Alabama's version of CERCLA mirrors the federal version with the important difference that there is no joint and several liability. Liability is consistent with one's contribution to the contamination. In addition, the disposal, release or spilling of some products used by coal and coking companies in operations, such as chemicals, could trigger the liability provisions of CERCLA or similar state laws because, at that point they are deemed to be waste and the activity, even though inadvertent, is deemed to constitute disposal or a covered CERCLA release. Thus, we may be subject to liability under CERCLA and similar state laws for properties that (1) we currently own, lease or operate, (2) we, our predecessors, or former subsidiaries have previously owned, leased or operated, (3) sites to which we, our predecessors or former subsidiaries sent waste materials, and (4) sites at which hazardous substances from our facilities' operations have otherwise come to be located.
Other Environmental Laws
We are required to comply with numerous other federal, state and local environmental laws and regulations in addition to those previously discussed. These additional laws include, for example, the Endangered Species Act, the Safe Drinking Water Act, the Toxic Substance Control Act and the Emergency Planning and Community Right-to-Know Act.
Canadian and U.K. Operations
Endangered Species Legislation
We have operations within Canada that may be affected by ongoing and proposed planning to protect certain species that are listed as threatened under the federal Species at Risk Act. The Species at Risk Act prohibits killing, harming, harassing, capturing or taking an individual of a wildlife species that is listed as threatened, and also makes it an offense to damage or destroy that species' residence, meaning a den, nest or other similar area or place that is occupied or habitually occupied by one for more individuals of their species during all or part of their life cycles. The Act is federal legislation, which is generally applicable only on federal lands and to species under federal jurisdiction (fish and migratory birds), but under certain circumstances, the provisions of the Species at Risk Act may be extended by the federal government to apply on provincial lands.
Species considered to be at risk by the province of British Columbia are identified by order of the provincial Minister of Environment under the authority of the British Columbia Forest and Range Practices Act and managed under the Identified Wildlife Management Strategy ("IWMS"), an initiative of the Ministry of Environment in partnership with the Ministry of Forests and Range. The IWMS provides direction, policy, procedures and guidelines for managing identified species, which may entail restoration of previously occupied habitats, particularly for those species most at risk, and the establishment of wildlife habitat areas and wildlife habitat area management objectives.
The species of the highest concern in respect of our operations is the caribou, although we continue to consider the impacts of our operations on other threatened species in the area. While we take great care to cause little or no impact on caribou in the area of our operations, protection of caribou and their habitat has attracted significant attention in areas where we operate due to the drastic reduction in caribou herd numbers in those areas. Delays in obtaining new or amended permits and mining tenures in areas frequented by caribou could have a significant impact on the continued development of our Canadian operations. Further, infractions under the federal Act could attract penalties of up to $1.0 million Canadian dollars ("CAD"). In addition, in November 2012, the province of British Columbia announced the development of an implementation plan to increase the current
27
population of Northern Caribou in the South Peace Region. Although the implementation plan to date has not been finalized, we could be required to pay certain in-lieu payments to offset the impact of our industrial activity in Northern Caribou habitat regions. These amounts would be paid into a trust fund set aside to support measures to increase the Northern Caribou population in the South Peace Region.
Environmental Management Act
The Environmental Management Act affects our operations by requiring us to obtain authorizations to introduce "waste" into the environment, including air contaminants, effluent, and hazardous and solid waste. Permits requiring regular monitoring and compliance with waste discharge limitations and reporting requirements govern the discharge of various substances into the environment, including air and water. We have obtained all permits required under the Environmental Management Act and corresponding regulations and are in substantial compliance with such permits, subject to the considerations relating to selenium, nitrate and sulphate levels described below. However, any new requirements under the Environmental Management Act and corresponding regulations may cause us to incur significant additional costs that could adversely affect our operating results.
We are currently not meeting revised provincial water quality guidelines relating to selenium, nitrate and sulphate levels at the Brule mine, and are cooperating with the British Columbia Ministry of Environment to reduce selenium levels and other contaminants of concern in our effluent to meet these guidelines. As a result, we are considering various alternatives for water management and treatment at the Brule mine, which could lead to significantly increased compliance costs at the operation and increased bonding requirements.
The Environmental Management Act and the Contaminated Sites Regulation also affect our operations by, among other things, imposing investigation and cleanup requirements for contaminated sites. Part 5 of the Environmental Management Act makes specific provision for "Remediation of Mineral Exploration Sites and Mines" and gives general jurisdiction to the Chief Inspector of Mines, who is also responsible for the reclamation requirements imposed under the Mines Act and the Mine Code, with respect to "core areas" of a producing mine site. The Contaminated Sites Regulation continues to govern any contamination at "non-core areas", such as maintenance shops, storage facilities and crushing or processing plants, as well as the disposal, release or spilling of some chemical products used by coal and coking companies in their operations. Under the Contaminated Sites Regulation, joint and several liability may be imposed on current operators or owners of a site, previous operators or owners of a site, producers or transporters of a substance that caused contamination and others regardless of fault or the legality of the original activity that caused or resulted in the release of the hazardous substances.
First Nations Considerations
Canadian law recognizes the existence of Aboriginal and Treaty rights, including Aboriginal title to lands. The Canadian courts have confirmed that when the federal and provincial governments contemplate conduct that may adversely affect the Aboriginal or Treaty rights of a First Nation, they must consult with and accommodate the First Nation. In the regulatory context, the government's duty to consult may be triggered by a variety of decisions, including the decision to issue or amend a permit. In order to meet their duties to consult and accommodate in this context, the federal and provincial governments require a company seeking a new or amended permit or other authorization to engage and consult with the First Nation about the potential effects of granting the requested authorization. Based on this process, the company is then expected to assist the government in determining what accommodations of the First Nation's rights by the company may be necessary prior to granting the requested authorization and therefore could detrimentally impact the development, production or expansion of our mining operations.
28
As we are governed by a significant number of permits in British Columbia and anticipate the need to both obtain new permits and amend existing permits in connection with our current and future operations, the government's duty to consult with First Nations may have a significant impact on our ability to operate in the future. If a governmental authority determines that it has a duty to consult in a permitting matter, the consultation process could add significant delays in, and additional costs relating to the eventual issuance or amendment of the relevant permit. Further, where a governmental authority fails to meet its duty to consult in granting a government authorization, such a failure may expose our permits and authorizations to judicial review, lengthy court processes and the risk of cancellation of the government authorization.
We strive to build beneficial relationships with the First Nations in our areas of operation and participate in any consultation process that relates to our operations. Although ultimately the duty to consult is a duty of the government, the consultation process would not progress without our involvement and our strong interest in ensuring that the process is carried out effectively and comprehensively. We are committed to engaging with First Nations in a meaningful way and devote significant time and resources to working proactively and cooperatively with local First Nations to acknowledge and address their concerns.
Fisheries Act
The Fisheries Act (Canada) affects our Canadian operations by, among other things, prohibiting the harmful alteration, disruption or destruction of fish habitat without authorization as well as the deposit of deleterious substances into fish-bearing waters. We may be exposed to liability in the event that we cause harmful alteration, disruption or destruction of fish habitat or that we discharge, or are responsible for the discharge of, deleterious substances (as defined in the Act) into waters frequented by fish. Offenses under the Act resulting in the harmful alteration, disruption or destruction of fish habitat or the deposit of deleterious substances into fish habitat could attract fines of up to CAD$1.0 million for each day that an offense continues. Liability under the Act is for owners of the property or substance, as well as their directors, officers, agents, tenants, occupiers, partners or persons actually in charge of the property or substance.
We are cooperating with regulatory authorities to address concerns relating to a release in April 2011 of sediment and debris into Willow Creek from the forest service road leading to the Willow Creek mine. Although the investigation into the matter is being led by the provincial Ministry of Environment, there is the potential that the discharge and deposit of sediment in the stream bed could be determined to be a harmful alteration, disruption or destruction of fish habitat contrary to the Fisheries Act. If such determination is made, it could have an adverse impact on our development, production and expansion of mine operations and the related operational costs in the area.
Provincial and Federal Environmental Assessment Acts
Our Canadian operations have been subject to an environmental assessment under the provincial Environmental Assessment Act. Each project was issued an environmental assessment certificate that sets out the criteria according to which the project must be designed and constructed, along with a schedule that sets out the commitments we have made to address concerns raised through the environmental assessment process. If, for any reason our operations are not conducted in accordance with the environmental assessment certificate, then our operations may be temporarily suspended until such time as our operations are brought back into compliance.
Any significant changes to our current operations or further development of our properties in British Columbia may trigger a federal or provincial environmental assessment or both. In particular, the proposed project amendments at the EB mine have the potential to trigger an assessment under the Canadian Environmental Assessment Act. Although we consider that a federal environmental
29
assessment would be unlikely, an additional environmental assessment, including the requirement for a substantive public review and First Nations consultation process, could result in significant delays for the operation.
Our environmental assessment certificate in respect of our Hermann mine project is expiring in November 2013. We have submitted an application for a one-time five year extension of this environmental assessment certificate until November 2018.
Mines Act and the Health, Safety and Reclamation Code for Mines in British Columbia (the "Mine Code")
Our Canadian operations require permits issued pursuant to the Mines Act outlining the details of the work at the mine and a program for the conservation of cultural heritage resources and for the protection and reclamation of the land, watercourses and cultural heritage resources affected by the mine. The Chief Inspector of Mines may issue a permit with conditions, including requiring that the owner, agent, manager or permittee give security in an amount and form specified by the Chief Inspector for mine reclamation and to provide for the protection of watercourses and cultural heritage resources affected by the mine. The reclamation security may be applied towards mine closure or reclamation costs and other miscellaneous obligations if permit conditions are not met. Detailed reclamation and closure requirements are contained in the Mine Code.
Under the Mines Act and the Mine Code, we have filed mine plans and reclamation programs for each of our operations. We accrue for reclamation costs to be incurred related to the closure of our mines once they have reached the end of their life. Additionally, under the terms of each mine permit, we are required to submit an updated mine plan every five years. We are currently in the process of submitting an updated five year mine plan for Wolverine mine by March 2013 and Brule mine by December 2013.
Estimates of our total reclamation and mine-closing liabilities are based upon permit requirements and our experience for similar activities. As of December 31, 2012, we accrued $29.0 million for our asset retirement obligations at all of our Canadian mining operations.
As of December 31, 2012, we had posted letters of credit for post-mining reclamation, as required by our Mines Act permits, totaling $22.7 million for all of our Canadian operations.
Climate Change
While initially a signatory to the December 1997 Kyoto Protocol that established a set of greenhouse gas emission targets for developed countries, Canada withdrew from the Kyoto Protocol at the Conference of Parties 17 of the United Nations Framework Convention on Climate Change in December 2011. While the government of Canada has a previously stated goal of reducing Canada's total greenhouse gas emissions by 17 percent from 2005 levels by 2020, it has not indicated how it will achieve such a reduction. The Canadian government has also publicly stated that any legislative action to reduce greenhouse gas emissions at the federal level must be integrated with U.S. legislation. While there are currently no federal emissions targets affecting the Company's operations, the Company is currently required to report its emissions from the Wolverine mine, and may in the future be required to report emissions for its other Canadian operations, pursuant to the federal Canadian Environmental Protection Act. This Act requires operators of facilities emitting greater than 50,000 metric tons per year of carbon dioxide equivalent to report emissions annually.
In British Columbia, the provincial government has legislated targets of greenhouse gas emissions reductions of 33% below 2007 emissions levels by 2020 and 80% below 2007 emissions levels by 2050. British Columbia has also imposed a carbon tax on fuel since 2008. In 2008, the provincial government introduced legislation that was intended to establish a cap and trade system by January 1, 2012. The establishment of the cap and trade system in British Columbia has been delayed, however, and the provincial government has not released the regulatory details of the proposed cap and trade system,
30
nor has it announced a start date. British Columbia remains a member of the Western Climate Initiative ("WCI"), which is a cooperative effort of the State of California and participating Canadian provinces to design a comprehensive regional model cap and trade program. It is expected that any cap and trade system to be implemented under the provincial legislation will be based on the model program developed by WCI. In preparation for the implementation of an emissions cap and trade system, in November 2009 the provincial government enacted a reporting regulation that requires facilities emitting greater than 10,000 metric tons of carbon dioxide equivalent per year to register and report emissions annually for periods beginning on January 1, 2010. Each of the Company's Canadian operations is required to report emissions under the provincial legislation.
Although the costs currently associated with emissions reporting under federal and provincial legislation are not material, the implementation of emissions targets or the proposed provincial cap and trade system may result in material financial impacts on our Canadian operations. As in the United States, it is unclear in the current political climate (both federally and provincially) whether or not a cap and trade system or other emissions reductions programs will be enacted and if so, when it would be enacted or what the program would require as well as any impact such enactment may have on our operations. Any such impact would have a significant adverse impact on our operations.
U.K. Environmental Laws
Our operations in Wales are subject to certain environmental laws and regulations of the United Kingdom, including the Environmental Protection Act 1990, Environment Act 1995, Environmental Permitting Regulations 2010, and Town and Country Planning Act 1990. The costs of compliance with these environmental laws have not had a material impact on our results of operations in the most recently completed financial year and we do not expect that compliance with these laws will have a material impact on our results of operations in the current or future financial years. As of December 31, 2012, we have accrued $5.0 million for our asset retirement obligations at all of our U.K mining operations. Further, as of December 31, 2012, we had posted cash bonds for post-mining reclamation totaling $2.1 million for all of our U.K. operations.
Other Environmental Laws
We are required to comply with numerous other federal, state, provincial and local environmental laws and regulations in addition to those previously discussed. These additional laws include, for example, the Endangered Species Act, the Safe Drinking Water Act, the Toxic Substance Control Act, the Emergency Planning and Community Right-to-Know Act, the British Columbia Water Act and the British Columbia Forest Act.
Seasonality
Our primary business is not materially impacted by seasonal fluctuations. Demand for coal is generally more heavily influenced by other factors such as the general economy, interest rates and commodity prices.
Employees
As of December 31, 2012, we employed approximately 4,100 employees, of whom approximately 3,100 were hourly employees and 1,000 were salaried employees. As of December 31, 2012, unions represented approximately 2,300 employees under collective bargaining agreements, of which approximately 1,600 were covered by one contract with the United Mine Workers of America that expires on December 31, 2016.
31
Additional Information
We were incorporated in Delaware in 1987. Our principal executive offices are located at 3000 Riverchase Galleria, Suite 1700, Birmingham, Alabama 35244, and our telephone number at that address is (205) 745-2000.
We make our Annual Report on Form 10-K, Quarterly Reports on Form 10-Q and Current Reports on Form 8-K and amendments thereto available on our website at www.walterenergy.com without charge as soon as reasonably practical after filing or furnishing these reports to the Securities and Exchange Commission ("SEC"). We also make available through our website other reports filed with or furnished to the SEC under the Exchange Act, including our proxy statements and reports filed by officers and directors under Section 16(a) of the Exchange Act. We do not intend for information contained in our website to be part of this Form 10-K. Additionally, we also provide, without charge, a copy of our Form 10-K to any shareholder by mail. Requests should be sent to Walter Energy, Inc., Attention: Shareholder Relations, 3000 Riverchase Galleria, Suite 1700, Birmingham, Alabama 35244. You may read and copy any document the Company files at the SEC's public reference room at 100 F Street, N.E., Washington, D.C. 20549. Please call the SEC at 1-800-SEC-0330 for further information on the public reference room. Our SEC filings are also available to the public from the SEC's website at http://www.sec.gov.
Executive Officers of the Registrant
Incorporated by reference into this Part I is the information set forth in Part III, "Item 10. Directors, Executive Officers and Corporate Governance."
32
Our business is subject to general risks and uncertainties which could materially adversely affect our business, financial condition, results of operations or stock price. Additional risks and uncertainties not currently known to us or that we may deem immaterial may also materially adversely affect our business, financial condition, results of operations or stock price.
Risks Related to our Current Continuing Operations
Unfavorable global economic, financial and business conditions may adversely affect our businesses.
The global financial markets have been experiencing volatility and disruption over the last several years. These markets have experienced, among other things, volatility in security prices, commodities and currencies; diminished liquidity and credit availability, rating downgrades and declining valuations of certain investments. Weaknesses in global economic conditions could have a material adverse effect on the demand for our coal, coke and natural gas products and on our sales, pricing and profitability. We are not able to predict whether the global economic conditions will continue or worsen or the impact these events may have on our operations and the industry in general.
Our businesses may suffer as a result of a substantial or extended decline in pricing, demand and other factors beyond our control, which could negatively affect our operating results and cash flows.
Our businesses are cyclical and have experienced significant difficulties in the past. Our financial performance depends, in large part, on varying conditions in the international and domestic markets we serve, which fluctuate in response to various factors beyond our control. The prices at which we sell our coal, coke and natural gas are largely dependent on prevailing market prices for those products. We have experienced significant price fluctuations in our coal, coke and natural gas businesses, and we expect that such fluctuations will continue. Demand for and, therefore, the price of, coal, coke and natural gas are driven by a variety of factors, including, but not limited to, the following:
- •
- the domestic and foreign supply and demand for coal;
- •
- the quantity and quality of coal available from competitors;
- •
- adverse weather, climatic or other natural conditions, including natural disasters;
- •
- domestic and foreign economic conditions, including economic slowdowns;
- •
- global or regional political events;
- •
- legislative, regulatory and judicial developments, environmental regulatory changes or changes in energy policy and energy
conservation measures that could adversely affect the coal industry, such as legislation limiting carbon emissions or providing for increased funding and incentives for alternative energy sources;
- •
- the proximity to, capacity, reliability and availability of and cost of transportation and port facilities; and
- •
- market price fluctuations for sulfur dioxide emission allowances.
In addition, reductions in the demand for metallurgical coal caused by reduced steel production by our customers, increases in the use of substitutes for steel (such as aluminum, composites or plastics) and the use of steel-making technologies that use less or no metallurgical coal can significantly affect our financial results and impede growth. Demand for thermal coal is primarily driven by the price of thermal coal as it compares to that of natural gas and the consumption patterns of the domestic electric power generation industry, which, in turn, is influenced by demand for electricity and
33
technological developments. We estimate that a 10% decrease in the price of metallurgical coal for the full year 2012 would have resulted in an increase in our pre-tax loss by $194.0 million.
The failure of our customers to honor or renew contracts could adversely affect our business.
A significant portion of the sales of our coal, coke and natural gas are to long-term customers. The success of our businesses depends on our ability to retain our current customers, renew our existing customer contracts and solicit new customers. Our ability to do so generally depends on a variety of factors, including the quality and price of our products, our ability to market these products effectively, our ability to deliver on a timely basis and the level of competition we face. If current customers do not honor current contract commitments, terminate agreements or exercise force majeure provisions allowing for the temporary suspension of performance, our revenues will be adversely affected. If we are unsuccessful in renewing contracts with our long-term customers and they discontinue purchasing coal, coke or natural gas from us, renew contracts on terms less favorable than in the past, or if we are unable to sell our coal, coke or natural gas to new customers on terms favorable to us, our revenues could suffer significantly.
Our ability to collect payments from our customers could be impaired if their creditworthiness deteriorates.
Our ability to receive payment for coal sold and delivered depends on the continued creditworthiness of our customers. If we determine that a customer is not creditworthy, we may not be required to deliver coal under the customer's coal sales contract. If this occurs, we may decide to sell the customer's coal on the spot market, which may be at prices lower than the contracted price, or we may be unable to sell the coal at all. Furthermore, the bankruptcy of any of our customers could materially and adversely affect our financial position. In addition, competition with other coal suppliers could cause us to extend credit to customers and on terms that could increase the risk of payment default.
Coal mining is subject to inherent risks and is dependent upon many factors and conditions beyond our control, which may cause our profitability and our financial position to decline.
Coal mining is subject to inherent risks and is dependent upon a number of conditions beyond our control that can affect our costs and production schedules at particular mines. These risks and conditions include, but are not limited to:
- •
- variations in geological conditions, such as the thickness of the coal seam and amount of rock embedded in the coal
deposit and variations in rock and other natural materials overlying the coal deposit;
- •
- mining, process and equipment or mechanical failures and unexpected maintenance problems;
- •
- adverse weather and natural disasters, such as heavy rains or snow, flooding and other natural events affecting the
operations, transportation or customers;
- •
- environmental hazards, such as subsidence and excess water ingress;
- •
- delays and difficulties in acquiring, maintaining or renewing necessary permits or mining rights;
- •
- availability of adequate skilled employees and other labor relations matters;
- •
- unexpected mine accidents, including rock-falls and explosions caused by the ignition of coal dust, natural
gas or other explosive sources at our mine sites or fires caused by the spontaneous combustion of coal or similar mining accidents; and
- •
- competition and/or conflicts with other natural resource extraction activities and production within our operating areas, such as coalbed methane extraction or oil and gas development.
34
These risks and conditions could result in damage to or the destruction of our mineral properties or production facilities, personal injury or death, environmental damage, delays in mining, monetary losses and legal liability. For example, an explosion and fire occurred in our underground No. 5 mine in Alabama in September 2001. This accident resulted in the deaths of thirteen employees and caused extensive damage to the mine. Our insurance coverage may not be available or sufficient to fully cover claims which may arise from these risks and conditions.
We have also experienced adverse geological conditions in our mines, such as variations in coal seam thickness, variations in the competency and make-up of the roof strata, fault-related discontinuities in the coal seam and the potential for ingress of excessive amounts of methane gas or water. We do not have meaningful excess capacity over current production needs, and we are not able to quickly increase production at one mine to offset an interruption in production at another mine. Such adverse conditions may increase our cost of sales and reduce our profitability, and may cause us to decide to close a mine. Any of these risks or conditions could have a negative impact on our profitability, the cash available from our operations or our financial position.
Defects in title of any real property or leasehold interests in our properties or associated coal and gas reserves could limit our ability to mine or develop these properties or result in significant unanticipated costs.
Our right to mine some of our coal reserves and extract natural gas may be materially adversely affected by defects in title or boundaries. We may not verify title to our leased properties or associated coal or gas reserves until we have committed to developing those properties or coal or gas reserves. We may not commit to develop property or coal or gas reserves until we have obtained necessary permits and completed exploration. Any challenge to our title could delay the development of the property and could ultimately result in the loss of some or all of our interest in the property or coal or gas reserves and could increase our costs. In addition, if we mine or conduct our natural gas operations on property that we do not own or lease, we could incur liability for such mining and gas operations. Some leases have minimum production requirements or require us to commence mining or gas operations in a specified term to retain the lease. Failure to meet those requirements could result in losses of prepaid royalties and, in some rare cases, could result in a loss of the lease itself.
Currently we have significant mining operations located predominately in central Alabama and northeast British Columbia, making us vulnerable to risks associated with having our production concentrated in two geographic areas.
Our mining operations are primarily geographically concentrated in central Alabama and Northeast British Columbia. As a result of this concentration, we may be disproportionately exposed to the impact of delays or interruptions of production caused by significant governmental regulation, transportation capacity constraints, curtailment of production, extreme weather conditions, natural disasters or interruption of transportation or other events which impact these areas.
A significant reduction of, or loss of, purchases by our largest customers could adversely affect our profitability.
For the year ended December 31, 2012, we derived approximately 27% of our total sales revenues from sales to our five largest customers. We expect to renew, extend or enter into new supply agreements with these and other customers. However, we may be unsuccessful in obtaining such agreements with these customers and these customers may discontinue purchasing coal from us. If any of our major customers were to significantly reduce the quantities of coal they purchase from us and we are unable to replace these customers with new customers, or if we are otherwise unable to sell coal to those customers or on terms favorable to us, our profitability could suffer significantly.
35
If transportation for our coal becomes unavailable or uneconomic for our customers, our ability to sell coal could suffer.
Transportation costs can represent a significant portion of the total cost of coal to be delivered to the customer and, as a result, overall price increases in our transportation costs could make our coal less competitive with the same or alternative products from competitors with lower transportation costs. We typically depend upon overland conveyor, trucks, rail or barge to transport our products. Disruption of any of these transportation services because of weather related problems, which are variable and unpredictable; strikes, lock-outs; accidents; transportation delays or other events could impair our ability to supply our products to our customers, thereby resulting in lost sales and reduced profitability.
All of our U.S. metallurgical mines are served by only one rail carrier, which increases our vulnerability to these risks, although our access to barge transportation partially mitigates that risk. In addition, the majority of the metallurgical coal produced by our Alabama underground mining operations is sold to coal customers who typically arrange and pay for transportation through the state-run docks at the Port of Mobile, Alabama to the point of use. As a result, disruption at the docks, port congestion and delayed coal shipments may result in demurrage fees to us. If this disruption were to persist over an extended period of time, demurrage costs could significantly impact our profits. In addition, there are limited cost effective alternatives to the port. Similar to the U.S. operations, substantially all of the coal produced by our Canadian operations is exported to port facilities by one railway for which there are limited alternatives. Additionally, all of our Canadian export sales are loaded through one port facility, for which there are limited cost-effective alternatives. The cost of securing additional facilities and services of this nature could significantly increase transportation and other costs. An interruption of rail or port services could significantly limit our ability to operate and to the extent that alternate sources of port and rail services are available, it could increase transportation and port costs significantly. Further, the inconsistent nature of the shipping industry could affect our revenues as a result of delays of ocean vessels and could significantly affect our costs and relative competitiveness compared to the supply of coal and other products from our competitors.
Significant competition and foreign currency fluctuations could harm our sales, profitability and cash flows.
The consolidation of the coal industry over the last several years has contributed to increased competition among coal producers. Some of our competitors have significantly greater financial resources than we do. This competition may affect domestic and foreign coal prices and impact our ability to retain or attract coal customers. In addition, our metallurgical coal business faces competition from foreign producers that sell their coal in the export market. The general economic conditions in foreign markets and changes in currency exchange rates are factors outside of our control that may affect international coal prices. If our competitors' currencies decline against our local currency or against our customers' currencies, those competitors may be able to offer lower prices to our customers. Furthermore, if the currencies of our overseas customers were to significantly decline in value in comparison to our local currency, those customers may seek decreased prices for the coal we sell to them. In addition, these factors may negatively impact our collection of trade receivables from our customers. These factors could reduce our profitability or result in lower coal sales.
Expenses from our Canadian operations are typically incurred and paid in Canadian dollars and our United Kingdom operations revenues and expenses are incurred and paid in British pounds. We have elected not to adopt a formal foreign currency hedging strategy and as a result any significant fluctuation in foreign exchange rates could adversely affect our financial position and operating results.
36
Our businesses are subject to risk of cost increases and fluctuations and delay in the delivery of raw materials, mining equipment and purchased components.
Our businesses require significant amounts of raw materials, mining equipment and labor and, therefore, shortages or increased costs of raw materials, mining equipment and labor could adversely affect our business or results of operations. Our coal mining operations rely on the availability of steel, petroleum products and other raw materials for use in various mining operations. The availability and market prices of these materials are influenced by various factors that are beyond our control. Over the last year petroleum prices have fluctuated significantly and pricing for steel scrap has fluctuated markedly. Any inability to secure a reliable supply of these materials or shortages in raw materials used in the operation and manufacturing of mining equipment or replacement parts could negatively impact our operating results.
Work stoppages, labor shortages and other labor relations matters may harm our business.
The majority of employees of our underground mining operations in Alabama are represented by the United Mine Workers of America ("UMWA"). Normally, our negotiations with the UMWA follow the national contract negotiated with the UMWA by the Bituminous Coal Operators Association. Our collective bargaining agreement expires on December 31, 2016. The majority of our employees in our surface mines in Alabama are represented by the UMWA, and we are currently negotiating initial labor agreements with the UMWA for these operations. At our coking operation, our contract with the United Steelworkers of America expires on December 6, 2015. We experienced a strike at our coke facilities at the end of 2001 that lasted eight months.
A majority of our employees at our Wolverine and Willow Creek mining operations in Canada are also unionized. The Wolverine employees are represented by the United Steelworkers, Local 1-424, and our collective agreement with the Steelworkers for that location expires on July 31, 2015. The employees at our Willow Creek mining operations are represented by Christian Labour Association of Canada ("CLAC"), and our collective agreement with CLAC for that location expires on November 30, 2013.
Future work stoppages, labor union issues or labor disruptions at our key customers or service providers could impede our ability to produce and deliver our products, to receive critical equipment and supplies or to collect payment. This may increase our costs or impede our ability to operate one or more of our operations.
We require a skilled workforce to run our business. If we cannot hire qualified people to meet replacement or expansion needs, we may not be able to achieve planned results.
The demand for coal in recent years has caused a significant constriction of the labor supply resulting in higher labor costs. Efficient coal mining using modern techniques and equipment requires skilled laborers with mining experience and proficiency as well as qualified managers and supervisors. As coal producers compete for skilled miners, employee turnover rates have increased which negatively affects operating costs. If the shortage of skilled workers continues and we are unable to train and retain the necessary number of miners, it could adversely affect our productivity, costs and ability to expand production.
We have reclamation and mine closure obligations. If the assumptions underlying our accruals are inaccurate, we could be required to expend greater amounts than anticipated.
The Surface Mining Control and Reclamation Act and counterpart state laws and regulations in the United States; the Mines Act (British Columbia) and the Reclamation Code for Mines in British Columbia in Canada; and the Environmental Protection Act 1990, Environment Act 1995, Environmental Permitting Regulations 2010, and Town and Country Planning Act 1990 in the U.K.
37
have established operational, reclamation and closure standards for all aspects of surface mining as well as most aspects of deep mining. We accrue for reclamation costs associated with final mine closure. Estimates of our total reclamation and mine-closing liabilities are based upon permit requirements and our experience for similar activities. The amounts recorded are dependent upon a number of variables, including the estimated future retirement costs, estimated proven reserves, assumptions involving profit margins, inflation rates, and the assumed credit-adjusted risk-free interest rates. Furthermore, these obligations are unfunded. If these accruals are insufficient or our liability in a particular year is greater than currently anticipated, our future operating results could be adversely affected. As of December 31, 2012, we had accrued $89.5 million for all our asset retirement obligations.
Inaccuracies in our estimates of our coal reserves could result in decreased profitability from lower than expected revenues or higher than expected costs.
Our future performance depends on, among other things, the accuracy of our estimates of our proven and probable coal reserves. Reserve estimates are based on a number of sources of information, including engineering, geological, mining and property control maps, our operational experience of historical production from similar areas with similar conditions and assumptions governing future pricing and operational costs. We update our estimates of the quantity and quality of proven and probable coal reserves at least annually to reflect the production of coal from the reserves, updated geological models and mining recovery data, the tonnage contained in new lease areas acquired and estimated costs of production and sales prices. There are numerous factors and assumptions inherent in estimating the quantities and qualities of, and costs to mine, coal reserves, including many factors beyond our control, such as the following:
- •
- quality of the coal;
- •
- geological and mining conditions, which may not be fully identified by available exploration data and/or may differ from
our experiences in areas where we currently mine;
- •
- the percentage of coal ultimately recoverable;
- •
- the assumed effects of regulation, including the issuance of required permits, taxes, including severage and excise taxes
and royalties, and other payments to governmental agencies;
- •
- assumptions concerning the timing of the development of the reserves; and
- •
- assumptions concerning the equipment and operational productivity, future coal prices, operating costs, including for critical supplies such as fuel, tires and explosives, capital expenditures and development and reclamation costs.
As a result, estimates of the quantities and qualities of economically recoverable coal attributable to any particular group of properties, classifications of reserves based on risk of recovery, estimated cost of production, and estimates of future net cash flows expected from these properties as prepared by different engineers, or by the same engineers at different times, may vary materially due to changes in the above factors and assumptions. Actual production recovered from identified reserve areas and properties, and revenues and expenditures associated with our mining operations, may vary materially from estimates. Any inaccuracy in our estimates related to our reserves could result in decreased profitability from lower than expected revenues and/or higher than expected costs.
Canadian licenses, permits and other authorizations may be subject to challenges based on Aboriginal or Treaty rights.
Canadian judicial decisions have recognized the continued existence of Aboriginal and Treaty rights in Canada, including title to lands continuously used or occupied by Aboriginal groups. Our Northeast British Columbia operations are located within Treaty 8 territory, to which nine First Nations in British
38
Columbia are signatories. Current operations are in or near the traditional territories of the West Moberly, Saulteau and Halfway River First Nations, and the McLeod Lake Indian Band. The Province of British Columbia has signed an Economic Benefits Agreement and related land and resource use agreements with several of the First Nations, including the West Moberly First Nation, over the last few years. The Treaty 8, as well as the Economic Benefits Agreement and related agreements, establish First Nations rights and define roles for their involvement in land and resource use. As a means of protecting Treaty and Aboriginal rights, as well as undetermined aboriginal rights, Canadian courts continue to confirm a duty to consult with Aboriginal groups when the Crown has knowledge of existing rights or the potential existence of an Aboriginal right, such as title or hunting rights, and contemplates conduct that might adversely impact such First Nations rights. As issues relating to Aboriginal and Treaty rights and consultation continue to be heard, developed and resolved in Canadian courts, we will continue to cooperate, communicate and exchange information and views with Aboriginal groups and government, and participate with the Crown in its consultation processes with Aboriginal groups in order to foster good relationships and minimize risks to our mineral rights and operational plans. Due to their complexity, it is not expected that the issues regarding Aboriginal and Treaty rights or consultation will be finally resolved in the short term and, accordingly, the impact of these issues on mineral resources and on our mining operations is unknown at this time. We believe in building mutually beneficial and lasting relationships with local First Nations whose Treaty rights or potential Aboriginal rights overlap with our areas of operations. We are in the process of formalizing our relationships with local First Nations through agreements that generally seek to increase First Nations' participation in our planning and operational activities. Should a dispute arise between the First Nations and the Crown, it could significantly restrict our ability to operate and transport coal within the region. Also, such action could have a detrimental impact on our financial condition and results of operations as well as on our customers.
Failure to meet our project development and expansion targets could have a material adverse effect on our business.
There can be no assurance that we will be able to manage effectively the expansion of our operations or that our current personnel, systems, procedures and controls will be adequate to support our operations. Any failure of management to effectively manage our growth and development could have a material adverse effect on our business, financial condition and results of operations.
Our operational targets are subject to the completion of planned operational goals on time and within budget, and are dependent on the effective support of our personnel, systems, procedures and controls. Any failure of these may result in delays in the achievement of operational targets with a consequent material adverse impact on our business, operations and financial performance.
Our operations in foreign jurisdictions are subject to risks and uncertainties which may have a negative impact on our profitability.
We operate and sell to customers in a number of foreign countries where there are added risks and uncertainties due to the different economic, cultural and political environments. We face risks in securing additional property licenses, as the process for obtaining these is likely to be different from that in the jurisdictions in which we have operated historically. Such risks could result in failed attempts to obtain licenses which would have used up management time and financial resources. We also face risks from trade barriers, exchange controls and material changes in taxation which could negatively impact our ability to sell into foreign markets, as well as our profitability.
39
Extensive environmental, health and safety laws and regulations impose significant costs on our operations and future regulations could increase those costs, limit our ability to produce or adversely affect the demand for our products.
Our businesses are subject to numerous federal, state, provincial and local laws and regulations with respect to matters such as:
- •
- permitting and licensing requirements;
- •
- employee health and safety, including:
- •
- occupational safety and health;
- •
- mine health and safety;
- •
- workers' compensation;
- •
- black lung;
- •
- reclamation and restoration of property;
- •
- environmental laws and regulations, including:
- •
- greenhouse gases and climate change;
- •
- air quality standards;
- •
- water quality standards;
- •
- management of materials generated by mining and coking operations;
- •
- the storage, treatment and disposal of wastes;
- •
- remediation of contaminated soil and groundwater; and
- •
- protection of human health, plant-life and wildlife, including endangered species, and emergency planning and community right to know.
Compliance with these regulations may be costly and time-consuming and may delay commencement or continuation of exploration or production at one or more of our operations. These laws are constantly evolving and becoming increasingly stringent. The ultimate impact of complying with existing laws and regulations is not always clearly known or determinable due in part to the fact that certain implementing regulations for these laws have not yet been promulgated and in certain instances are undergoing revision. These laws and regulations, particularly new legislative or administrative proposals (or judicial interpretations of existing laws and regulations), could result in substantially increased capital, operating and compliance costs and could have a material adverse effect on our operations and/or our customers' ability to use our products. In addition, the industry in the United States is affected by significant legislation mandating certain benefits for current and retired coal miners.
We strive to conduct our mining, natural gas and coke operations in compliance with all applicable federal, provincial, state and local laws and regulations. However, due in part to the extensive and comprehensive regulatory requirements, along with changing interpretations of these requirements, violations occur from time to time in our industry and at our operations. In recent years, expenditures at our U.S. operations for regulatory or environmental obligations have been mainly for safety or process changes. Although it is not possible at this time to predict the final outcome of these rule-making and standard-setting efforts, it is possible that the magnitude of these changes will require an unprecedented compliance effort on our part, could divert management's attention, and may require significant expenditures. To the extent these expenditures, as with all costs, are not ultimately reflected in the prices of our products and services, operating results will be reduced. We believe that our major
40
North American competitors are confronted by substantially similar conditions and thus do not believe that our relative position with regard to such competitors is materially affected by the impact of environmental laws and regulations. However, the costs and operating restrictions necessary for compliance with environmental laws and regulations, which is a major cost consideration for our operations, may have an adverse effect on our competitive position with regard to foreign producers and operators who may not be required to undertake equivalent costs in their operations. In addition, the specific impact on each competitor may vary depending on a number of factors, including the age and location of its operating facilities, applicable state or provincial legislation and its production methods.
Federal, state or provincial regulatory agencies have the authority to order certain of our mines to be temporarily or permanently closed under certain circumstances, which could materially and adversely affect our ability to meet our customers' demands.
Federal, state or provincial regulatory agencies have the authority under certain circumstances following significant health and safety incidents, such as fatalities, to order a mine to be temporarily or permanently closed. If this occurred, we may be required to incur capital expenditures to re-open the mine. In the event that these agencies order the closing of our mines, our coal sales contracts generally permit us to issue force majeure notices which suspend our obligations to deliver coal under these contracts. However, our customers may challenge our issuances of force majeure notices. If these challenges are successful, we may have to purchase coal from third-party sources, if it is available, to fulfill these obligations, incur capital expenditures to re-open the mines and/or negotiate settlements with the customers, which may include price reductions, the reduction of commitments or the extension of time for delivery or terminate customers' contracts. Any of these actions could have a material adverse effect on our business and results of operations.
Increased focus by regulatory authorities on the effects of (surface) coal mining on the environment and recent regulatory developments related to surface coal mining operations could make it more difficult or increase our costs to receive new permits or to comply with our existing permits to mine coal or otherwise adversely affect us.
Regulatory agencies are increasingly focused on the effects of coal mining on the environment, particularly as it relates to water quality, which has resulted in more rigorous permitting requirements and enforcement efforts.
Section 404 of the CWA requires mining companies to obtain U.S. Army Corps of Engineers permits to place material in streams for the purpose of creating slurry ponds, water impoundments, refuse areas, valley fills or other mining activities. As is the case with other coal mining companies, our construction and mining activities require Section 404 permits. The issuance of permits to construct valley fills and refuse impoundments under Section 404 of the CWA has been the subject of many court cases and increased regulatory oversight, resulting in additional permitting requirements that are expected to delay or even prevent the opening of new mines. Stringent water quality standards for materials such as selenium and arsenic have recently been issued. We have begun to incorporate these new requirements into our current permit applications; however, there can be no guarantee that we will be able to meet these or any other new standards with respect to our permit applications.
In April 2010, the EPA issued comprehensive guidance to provide clarification as to the water quality standards that should apply when reviewing CWA permit applications for Appalachian surface coal mining operations. This guidance establishes threshold conductivity levels to be used as a basis for evaluating compliance with narrative water quality standards. To obtain necessary permits, we and other mining companies are required to meet these requirements. The U.S. District Court for the District of Columbia ruled that the EPA overstepped its statutory authority under the CWA and SMCRA, and
41
infringed on the authority reserved to state regulators under those statutes when it issued the guidance. The EPA is appealing the decision.
Additionally, in January 2011, the EPA rescinded a federal CWA permit held by another coal mining company for a surface mine in Appalachia citing associated environmental damage and degradation. While our operations are not directly impacted, this could be an indication that other surface mining water permits could be subject to more substantial review in the future. A federal judge reversed the decision by the EPA to revoke the permit and the EPA has appealed the decision.
It is unknown what future changes will be implemented to the permitting review and issuance process or to other aspects of surface mining operations, but the increased regulatory focus, future laws and judicial decisions and any other future changes could materially and adversely affect all coal mining companies operating in Appalachia, including us.
Regulatory agencies in Canada are also increasingly focused on the effects of coal mining on the environment, particularly as it relates to water quality and to wildlife habitat. The British Columbia Ministry of Environment is updating its existing selenium guidelines which could affect water quality issues and effluent discharge standards. Expansion of existing coal mines and development of new coal mines in northeast British Columbia have also been the focus of consideration with respect to the effects on caribou habitat, particularly in areas where caribou have been identified as a threatened species under the federal Species at Risk Act. It is unknown what future changes will be implemented to the permitting review and issuance process or to other aspects of surface mining operations in British Columbia but the increased regulatory focus, future laws and judicial decisions, and any other future changes could materially and adversely affect all coal mining companies operating in British Columbia, including us.
In particular, in each jurisdiction in which we operate, we will incur additional permitting and operating costs, could be unable to obtain new permits or maintain existing permits and could incur fines, penalties and other costs, any of which could materially adversely affect our business. If surface coal mining methods are limited or prohibited, it could significantly increase our operational costs and make it more difficult to economically recover a significant portion of our reserves. In the event that we cannot increase the price we charge for coal to cover the higher production costs without reducing customer demand for our coal, there could be a material adverse effect on our financial condition and results of operations. In addition, increased public focus on the environmental, health and aesthetic impacts of surface coal mining could harm our reputation and reduce demand for coal.
Climate change concerns could negatively affect our results of operations and cash flows.
The combustion of fossil fuels, such as the coal, coke and natural gas we produce, results in the creation of carbon dioxide that is currently emitted into the atmosphere by coal, coke and gas end-users. Further, some of our operations emit GHGs directly, such as methane release resulting from coal mining and carbon dioxide during our coke production. Carbon dioxide is considered a greenhouse gas and is a major source of concern with respect to global warming, also known as climate change. Climate change continues to attract public and scientific attention and increasing government attention is being paid to reducing GHG emissions.
There are many legal and regulatory approaches currently in effect or being considered to address GHGs, including possible future U.S. treaty commitments, new federal or state legislation that may impose a carbon emissions tax or establish a "cap and trade" program, and regulation by the U.S. EPA. As part of the Fiscal Year 2008 Consolidated Appropriations Act, signed into law on December 26, 2007, the EPA was ordered to publish a rule requiring public reporting of GHG emissions from large sources. The GHG Reporting Program database was published for the first time on January 11, 2012 and includes data reported under the rule and provides the first comprehensive nationwide GHG
42
emissions database for the United States, even though electric power plants have been reporting their carbon dioxide emissions for two decades under the CAA Amendments of 1990.
Canadian legal and regulatory approaches include both federal and provincial regulations requiring the reporting of GHG emissions. Both the federal and provincial level governments are considering the implementation of GHG regulatory structures such as a "cap and trade" program and emissions trading. These programs could force reductions in total GHG emissions on an industry or facility basis. In British Columbia, the government imposes a carbon emissions tax with scheduled increases.
These existing laws and regulations or other current and future efforts to stabilize or reduce GHG emissions, could adversely impact the demand for, price of and the value of our products and reserves. Passage of additional state, provincial, federal or foreign laws or regulations regarding GHG emissions or other actions to limit GHG emissions could result in users switching from coal to other alternative clean fuel substitutes. The anticipation of such additional requirements could also lead to reduced demand for some of our products. Alternative clean fuels, including non-fossil fuels, could become more attractive than coal in order to reduce GHG emissions, which could result in a reduction in the demand for coal and, therefore, our revenues. As our operations also emit GHGs directly, current or future laws or regulations limiting GHG emissions could increase our own costs. Although the potential impacts on us of additional climate change regulation are difficult to reliably quantify, they could be material.
Our operations may impact the environment or cause exposure to hazardous substances and our properties may have environmental contamination, which could result in material liabilities to us.
Our operations currently use hazardous materials and generate limited quantities of hazardous wastes from time to time. We could become subject to claims for toxic torts, natural resource damages and other damages as well as for the investigation and clean up of soil, surface water, groundwater, and other media. Such claims may arise, for example, out of conditions at sites that we currently own or operate, as well as at sites that we previously owned or operated, or may acquire. Our liability for such claims may be joint and several, so that we may be held responsible for more than our share of the contamination or other damages, or even for the entire amount of damages assessed.
We maintain extensive coal refuse areas and slurry impoundments or underground injection at our mining complexes. Such areas and impoundments are subject to extensive regulation. Slurry impoundments have been known to fail, releasing large volumes of coal slurry into the surrounding environment. Structural failure of an impoundment can result in extensive damage to the environment and natural resources, such as bodies of water that the coal slurry reaches, as well as create liability for related personal injuries, property damages and injuries to wildlife. Some of our impoundments overlie mined out areas, which can pose a heightened risk of failure and the assessment of damages arising out of such failure. If one of our impoundments were to fail, we could be subject to substantial claims for the resulting environmental contamination and associated liability, as well as for related fines and penalties.
Drainage flowing from or caused by mining activities can be acidic with elevated levels of dissolved metals, a condition referred to as "acid mine drainage" ("AMD"). Treatment of AMD can be costly. Although we do not currently face material costs associated with AMD, it is possible that we could incur significant costs in the future.
These and other similar unforeseen impacts that our operations may have on the environment, as well as exposures to hazardous substances or wastes associated with our operations, could result in costs and liabilities that could materially and adversely affect us.
See also "Environmental and Other Regulatory Matters" in Part I of this Annual Report.
43
Other Business Risks
Our substantial indebtedness could adversely affect our financial position and our ability to meet our obligations under our debt instruments.
We have a significant amount of indebtedness. As of December 31, 2012, we had indebtedness of approximately $2.4 billion outstanding under a $2.7 billion credit agreement ("Credit Agreement") and $500 million aggregate principal amount of 9.875% senior notes due in 2020. Under the repayment schedule relating to the Credit Agreement, we will not be required to make mandatory principal payments in 2013; however, in 2014 we will be required to make a minimum payment of $77 million. In addition, we will be required to pay a percentage of excess cash flow, as defined in the Credit Agreement, to reduce the principal balance of the indebtedness. We may be unable to generate sufficient cash flow from operations and future borrowings, or other financing may be unavailable in an amount sufficient to enable us to fund our future financial obligations or our other liquidity needs.
Our substantial indebtedness could make it more difficult for us to borrow money in the future and may reduce the amount of money available to finance our operations and other business activities and may have other detrimental consequences, including the following:
- •
- we may have to dedicate a substantial portion of our cash flow from operations to the payment of principal, premium, if
any, and interest on our debt, which will reduce funds available for other purposes;
- •
- limiting our ability to obtain additional financing to fund growth for areas such as new mergers and acquisitions, working
capital and capital expenditure needs, or our ability to meet debt service requirements or other cash requirements;
- •
- exposing us to the risk of increased interest costs if the underlying interest rates rise on our existing credit facility
or other variable rate debt;
- •
- making it more difficult to obtain surety bonds, letters of credit or other financing, particularly during periods in
which credit markets are weak;
- •
- causing a decline in our credit ratings;
- •
- limiting our ability to compete with companies that are not as leveraged and that may be better positioned to withstand
economic downturns;
- •
- limiting our ability to acquire new coal reserves and/or plant and equipment needed to conduct operations; and
- •
- limiting our flexibility in planning for, or reacting to, and increasing our vulnerability to, changes in our business, the industry in which we compete and general economic and market conditions.
If we further increase our indebtedness, the related risks that we now face, including those described above, could intensify.
Our ability to generate the significant amount of cash needed to service our debt and financial obligations, to refinance all or a portion of our indebtedness or obtain additional financing depends on many factors beyond our control.
Our ability to make payments on and to refinance our indebtedness depends on our ability to generate cash in the future. We are subject to general economic, climatic, industry, financial, competitive, legislative, regulatory and other factors that are beyond our control. In particular, economic conditions have previously caused and could in the future continue to cause the price of coal to fall and our revenue to decline and could adversely affect our ability to repay our indebtedness. As a
44
result, we may need to refinance all or a portion of our indebtedness on or before maturity. Our ability to refinance our debt or obtain additional financing will depend on, among other things:
- •
- our financial condition at the time;
- •
- restrictions in the agreements governing our indebtedness; and
- •
- other factors, including conditions in the financial and capital markets or coal industry.
If our cash flows and capital resources are insufficient to fund our debt service obligations, we could face substantial liquidity problems and could be forced to reduce or delay investments and capital expenditures or to dispose of material assets or operations, seek additional debt or equity capital or restructure or refinance our indebtedness. We may not be able to affect any such alternative measures on commercially reasonable terms or at all and, even if successful, those alternative actions may not allow us to meet our scheduled debt service obligations. The Credit Agreement and the indenture governing our notes restrict our ability to dispose of assets and use the proceeds from those dispositions and may also restrict our ability to raise capital from debt or equity financings to repay other indebtedness when it becomes due. Additionally, we may not be able to consummate such dispositions or to obtain proceeds in an amount sufficient to meet any debt service obligations when due.
In addition, we conduct a substantial portion of our operations through our subsidiaries. Accordingly, repayment of our indebtedness is dependent on the generation of cash flow by our subsidiaries and their ability to make such cash available to us, by dividend, debt repayment or otherwise. Unless they are guarantors of the notes or other indebtedness, our subsidiaries do not have any obligation to pay amounts due to our indebtedness or to make funds available for that purpose. Our subsidiaries may not be able to, or may not be permitted to, make distributions to enable us to make payments in respect to our indebtedness. Each subsidiary is a distinct legal entity and under certain circumstances, legal and contractual restrictions may limit our ability to obtain cash from our subsidiaries. While the indenture governing the notes and the Credit Agreement limit the ability of our subsidiaries to incur consensual restrictions on their ability to pay dividends or make other intercompany payments to us, these limitations are subject to qualifications and exceptions. In the event that we do not receive distributions from our subsidiaries we may be unable to make required principal and interest payments on our indebtedness.
We may not be able to refinance any of our indebtedness on commercially reasonable terms or at all. If our operations do not generate sufficient cash flows, and additional borrowings or refinancing are not available to us, we may not have sufficient cash to enable us to meet all of our obligations.
If we cannot make scheduled payments on our debt or are not in compliance with our covenants and are not able to amend those covenants, we will be in default and holders of the notes could declare all outstanding principal and interest to be due and payable, the lenders under the Credit Agreement could terminate their commitments to loan money, the lenders could foreclose against the assets securing their borrowings and we could be forced into bankruptcy or liquidation. If we are not able to generate sufficient cash flow from operations, we may need to seek an amendment to our Credit Agreement to prevent us from potentially being in breach of our covenants.
A "change in control" under the Credit Agreement, which may occur as a result of events beyond our control, would result in an event of default that could materially and adversely affect our results of operations and our financial condition.
A "change in control" as defined in our Credit Agreement is considered an event of default and is deemed to occur when any person or group beneficially owns 35% or more of our common stock or where our Board of Directors ceases to consist of a majority of continuing directors. Upon a change in control, the lenders could elect to declare due and payable immediately all amounts due, including
45
principal and accrued interest. We may be unable to prevent a change in control from occurring at a time when we are unable to repay or refinance such indebtedness and the holders of such debt could proceed against the collateral securing that indebtedness. In addition, a change of control under our Credit Agreement could also result in an event of default under one or more of our other debt instruments.
Failure to obtain or renew surety bonds on acceptable terms could affect our ability to secure reclamation and coal lease obligations and, therefore, our ability to mine or lease coal.
Federal, state and provincial laws require us to obtain surety bonds or post other financial security to secure performance or payment of certain long-term obligations, such as mine closure or reclamation costs, federal and state workers' compensation costs, coal leases and other obligations. We may have difficulty procuring or maintaining our surety bonds. Our bond issuers may demand higher fees or additional collateral, including letters of credit or other terms less favorable to us upon those renewals. Because we are required by state and federal law to have these bonds in place before mining can commence or continue, our failure to maintain surety bonds, letters of credit or other guarantees or security arrangements would materially and adversely affect our ability to mine or lease coal. That failure could result from a variety of factors, including lack of availability, higher expense or unfavorable market terms, the exercise by third party surety bond issuers of their right to refuse to renew the surety and restrictions on availability of collateral for current and future third party surety bond issuers under the terms of our financing arrangements.
Our expenditures for postretirement benefit and pension obligations are significant and could be materially higher than we have predicted if our underlying assumptions prove to be incorrect.
We provide a range of benefits to our employees and retirees, including pensions and postretirement healthcare. We record annual amounts relating to these plans based on calculations specified by generally accepted accounting principles, which include various actuarial assumptions. As of December 31, 2012, we estimated that our pension plans' aggregate projected benefit obligation had a present value of approximately $295.9 million, and the fair value of plan assets was approximately $233.0 million. As of December 31, 2012, we estimated that our postretirement health care and life insurance plans' aggregate projected benefit obligation had a present value of approximately $662.5 million and such benefits are not required to be funded. In respect to the funding obligations for our pension plans, we must make minimum cash contributions on a quarterly basis. Weakening of the economic environment and uncertainty in the equity markets have caused investment income and the values of investment assets held in our pension trust to decline in the past and to lose value. As a result, in such circumstances we may be required to increase the amount of cash contributions we make into the pension trust in the future in order to meet the funding level requirements of the Pension Protection Act of 2006 (Pension Act). Our estimated minimum funding obligation relating to the pension plan in 2013 is $6.8 million. We have estimated these obligations based on assumptions described under the heading "Critical Accounting Estimates—Employee Benefits" in Part II, "Item 7. Management's Discussion and Analysis of Financial Condition and Results of Operations," and in the notes to our consolidated financial statements. Assumed health care cost trend rates, discount rates, expected return on plan assets and salary increases have a significant effect on the amounts reported for the pension and health care plans. If our assumptions do not materialize as expected, cash expenditures and costs that we incur could be materially higher. Moreover, regulatory changes could increase our obligations to provide these or additional benefits.
The 2010 healthcare legislation impacts our costs to provide healthcare benefits to our eligible active and certain retired employees and to provide workers' compensation benefits related to occupational disease resulting from black lung disease. The 2010 healthcare legislation has both short-term and long-term implications on healthcare benefit plan standards. Implementation of the
46
2010 healthcare legislation will occur in phases, with plan standard changes taking effect beginning in 2010, but to a greater extent with the 2011 benefit plan year and extending through 2018. Plan standard changes that affect us in the short term include raising the maximum age for covered dependents to continue to receive benefits, the elimination of lifetime dollar limits per covered individual and restrictions on annual dollar limits per covered individual, among other standard requirements. Plan standard changes that could affect us in the long-term include a tax on "high cost" plans (excise tax) and the elimination of annual dollar limits per covered individual, among other standard changes.
Beginning in 2018, the 2010 healthcare legislation will impose a 40% excise tax on employers to the extent that the value of their healthcare plan coverage exceeds certain dollar thresholds. We anticipate that certain government agencies will provide additional regulations or interpretations concerning the application of this excise tax. Until these regulations or interpretations are published, it is impractical to reasonably estimate the ultimate impact of the excise tax on our future healthcare costs or postretirement benefit obligations. We have incorporated changes to our actuarial assumptions to determine our postretirement benefit obligations utilizing preliminary estimates and basic assumptions around the pending interpretations of these regulations.
In addition, certain of our subsidiaries participate in multiemployer pension and healthcare plan trusts established for union employees. Contributions to these funds could increase as a result of future collective bargaining with the UMWA, a shrinking contribution base as a result of the insolvency of other coal companies who currently contribute to these funds, failure of the Plan to meet ERISA's minimum funding requirements, lower than expected returns on pension fund assets, or other funding deficiencies.
We face risks and uncertainties by participating in the 1974 Pension Plan. All assets contributed to the plan are pooled and available to provide benefits for all participants and beneficiaries. As a result, contributions made by us benefit the employees of other employers. If the 1974 Pension Plan fails to meet ERISA's minimum funding requirements or fails to develop and adopt a rehabilitation plan, a nondeductible excise tax of five percent of the accumulated funding deficiency may be imposed on an employer's contribution to this multi-employer pension plan. As a result of the 1974 Pension Plan's "seriously endangered" status, steps must be taken under the Pension Act to improve the funded status of the plan. In an effort to improve the Plan's funding situation, the Plan Settlors adopted a Funding Improvement Plan as of May 25, 2012. The Funding Improvement Plan states that the Plan must avoid a funding deficiency for any plan year during the funding improvement period and improve the Plan's funded status by at least 20% over a 15-year period. The funding improvement period begins July 1, 2014 and ends June 30, 2029. The Funding Improvement Plan calls for increased contributions beginning January 1, 2017 and lasting throughout the improvement period so that the Plan can meet the applicable benchmarks and emerge from seriously endangered status by the end of the Funding Improvement Period.
Under current law governing multi-employer defined benefit plans, if we voluntarily withdrew from the 1974 Pension Plan, the currently underfunded multi-employer defined benefit plan would require us to make payments to the plan which would approximate the proportionate share of the multiemployer plan's unfunded vested benefit liabilities at the time of the withdrawal.
We have no current intention to withdraw from any multiemployer pension plan, but if we were to do so, under the Employee Retirement Income Security Act of 1974, as amended, we would be liable for a proportionate share of the plan's unfunded vested benefit liabilities upon our withdrawal. Through June 30, 2013, our estimated withdrawal liability for the multiemployer pension plans amounted to $627.6 million.
Changes in our credit ratings could adversely affect our costs and expenses.
Any downgrade in our credit ratings could adversely affect our ability to borrow and result in more restrictive borrowing terms, including increased borrowing costs and more restrictive covenants. This could affect our internal cost of capital estimates and therefore impact operational and investment decisions.
47
We are responsible for portions of our workers' compensation and certain medical and disability benefits, and greater than expected claims could reduce our profitability.
We are responsible for portions of our workers' compensation benefits for work-related injuries. Workers' compensation liabilities, including those related to claims incurred but not reported, are recorded principally using annual valuations based on discounted future expected payments using historical data of the specific subsidiary or combined insurance industry data when historical data is limited. In addition, certain of our subsidiaries are responsible for medical and disability benefits for black lung disease under the Federal Coal Mine Health and Safety Act of 1969 and the Federal Mine Safety and Health Act of 1977, as amended, and are self-insured for portions of this liability against black lung related claims. We perform periodic evaluations of our black lung liability, using assumptions regarding rates of successful claims, discount factors, benefit increases and mortality rates, among others. See additional information under the heading "Critical Accounting Estimates—Employee Benefits" in "Item 7. Management's Discussion and Analysis of Financial Condition and Results of Operations."
If the number or severity of claims increases, or we are required to accrue or pay additional amounts because the claims prove to be more severe than our original assessment, our operating results could be reduced.
We may be subject to litigation, the disposition of which could negatively affect our profitability and cash flow in a particular period, or have a material adverse effect on our business, financial condition or results of operations.
Our profitability or cash flow in a particular period could be affected by an adverse ruling in any litigation currently pending in the courts or by litigation that may be filed against us in the future. In addition, such litigation could have a material adverse effect on our business, financial condition or results of operations. For information regarding our current significant legal proceedings, see Part I, "Item 3. Legal Proceedings," "Note 11—Income Taxes" and "Note 18—Commitments and Contingencies" to the "Notes to Consolidated Financial Statements" included in this Annual Report on Form 10-K.
Our executive officers and other key personnel are important to our success and the loss of one or more of these individuals could harm our business.
Our executive officers and other key personnel have significant experience in the businesses in which we operate and the loss of certain of these individuals could harm our business. Although we have been successful in attracting qualified individuals for key management and corporate positions in the past, as our business develops and expands, there can be no assurance that we will continue to be successful in attracting and retaining a sufficient number of qualified personnel in the future. The loss of key management personnel could harm our ability to successfully manage our business functions, prevent us from executing our business strategy and have an adverse effect on our results of operations and cash flows.
We may be unsuccessful in identifying or integrating suitable acquisitions and this could impair our growth.
Our ability to grow depends in part upon our ability to identify, negotiate, complete and integrate suitable acquisitions. This strategy depends on the availability of acquisition candidates with businesses that can be successfully integrated into our existing business and that will provide us with complementary capabilities, products or services. There are many challenges to integrating acquired companies and businesses, including eliminating redundant operations, facilities and systems, coordinating management and personnel, retaining key employees, managing different corporate
48
cultures and achieving cost reductions and cross-selling opportunities. We may be unable to successfully complete potential acquisitions which could impair our growth.
The price of our common stock may be volatile and may be affected by market conditions beyond our control.
Our share price is likely to fluctuate in the future because of the volatility of the stock market in general and a variety of factors, many of which are beyond our control, including:
- •
- general global economic conditions that impact infrastructure activity, including interest rate and currency movements and
the effect this could have on commodity prices for our products;
- •
- quarterly variations in actual or anticipated results of our operations;
- •
- speculation in the press or investment community;
- •
- changes in financial estimates by securities analysts;
- •
- actions or announcements by our competitors or customers;
- •
- actions by our principal stockholders;
- •
- trading volumes of our common stock;
- •
- regulatory actions;
- •
- litigation;
- •
- U.S. and international economic, legal and regulatory factors unrelated to our performance;
- •
- loss or gain of a major customer;
- •
- additions or departures of key personnel; and
- •
- future issuances of our common stock.
Market fluctuations could result in extreme volatility in the price of shares of our common stock, which could cause a decline in the value of our stock. Price volatility may be greater if the public float and trading volume of shares of our common stock is low. In addition, if our operating results and net income fail to meet the expectations of stock analysts and investors, we may experience an immediate and significant decline in the trading price of our stock.
Our ability to pay regular dividends to our stockholders is subject to the discretion of our Board of Directors and may be limited by our holding company structure, the covenants in our debt instruments and applicable provisions of Delaware law.
Our Board of Directors may, in its discretion, decrease the level of dividends or discontinue the payment of dividends entirely. In addition, as a holding company, we will be dependent upon the ability of our subsidiaries to generate earnings and cash flows and distribute them to us so that we may fund our obligations and pay dividends to our stockholders. Our ability to pay future dividends and the ability of our subsidiaries to make distributions to us will be subject to our and their respective operating results, cash requirements and financial condition, the applicable laws of the State of Delaware (which may limit the amount of funds available for distribution), compliance with covenants and required financial ratios related to existing or future indebtedness and other agreements with third parties. If, as a consequence of these various limitations and restrictions, we are unable to generate sufficient distributions from our business, we may not be able to make, or may have to reduce or eliminate, the payment of dividends on our shares.
49
We may be required to satisfy certain indemnification obligations to Mueller Water or may not be able to collect on indemnification rights from Mueller Water.
In connection with the spin-off of Mueller Water Products, Inc. ("Mueller Water") on December 14, 2006, we entered into certain agreements with Mueller Water, including an income tax allocation agreement and a joint litigation agreement. Under the terms of those agreements, we and Mueller Water agreed to indemnify each other with respect to the indebtedness, liabilities and obligations that will be retained by our respective companies, including certain tax and litigation liabilities. These indemnification obligations could be significant. For example, to the extent that we or Mueller Water takes any action that would be inconsistent with the treatment of the spin-off of Mueller Water as a tax-free transaction under Section 355 of the Internal Revenue Code, any tax resulting from such actions would be attributable to the acting company. The ability to satisfy these indemnities if called upon to do so will depend upon the future financial strength of each of our companies. We cannot determine whether we will have to indemnify Mueller Water for any substantial obligations after the distribution. If Mueller Water has to indemnify us for any substantial obligations, Mueller Water may not have the ability to satisfy those obligations. If Mueller Water is unable to satisfy its obligations under its indemnity to us, we may have to satisfy those obligations.
Terrorist attacks and threats, escalation of military activity in response to such attacks or acts of war may negatively affect our business, financial condition and results of operations.
Terrorist attacks against U.S. targets, rumors or threats of war, actual conflicts involving the U.S. or its allies, or military or trade disruptions affecting our customers or the economy as a whole may materially adversely affect our operations or those of our customers. As a result, there could be delays or losses in transportation and deliveries of coal to our customers, decreased sales of our coal and extension of time for payment of accounts receivable from our customers. Strategic targets such as energy-related assets may be at greater risk of future terrorist attacks than other targets in the United States. In addition, disruption or significant increases in energy prices could result in government-imposed price controls. Any of these occurrences, or a combination of them, could have a material adverse effect on our business, financial condition or results of operations.
Item 1B. Unresolved Staff Comments
None
50
The administrative headquarters and production facilities of the Company and its subsidiaries as of December 31, 2012 are summarized as follows:
| |
|
|
|
Building Square Footage |
||||||||||
|---|---|---|---|---|---|---|---|---|---|---|---|---|---|---|
| |
Business Unit /Location | |
Land Acreage(1) |
|||||||||||
Reportable Segment
|
Principal Operations | Leased | Owned | |||||||||||
U.S. Operations |
Alabama Operations: | |||||||||||||
|
Blue Creek Coal Sales | |||||||||||||
|
Mobile, AL |
Administrative headquarters |
1,151 | |||||||||||
|
Mobile, AL |
River terminal—Owned |
49 | |||||||||||
|
Blue Creek Energy, Inc. | |||||||||||||
|
Tuscaloosa County, AL |
Coal mines and land holdings—Owned |
714 | |||||||||||
|
Tuscaloosa County, AL |
Coal mines and land holdings—Leased |
20,806 | |||||||||||
|
Jim Walter Resources | |||||||||||||
|
Brookwood, AL |
Administrative headquarters & mine support facilities |
732,855 | |||||||||||
|
Various Counties in AL |
Coal mines, land holdings and coal bed methane fields—Owned |
16,423 | |||||||||||
|
Various Counties in AL |
Coal mines, land holdings and coal bed methane fields—Leased |
31,292 | |||||||||||
|
Walter Black Warrior Basin | |||||||||||||
|
Tuscaloosa County, AL |
Administrative headquarters & mine support facilities |
31 | 15,425 | ||||||||||
|
Tuscaloosa County, AL |
Coal bed methane fields—Leased, developed |
366,568 | |||||||||||
|
Walter Minerals | |||||||||||||
|
Tuscaloosa County, AL |
Mine support facilities—Barge load-out |
61 | 140 | ||||||||||
|
Various Counties in AL |
Real estate—Owned |
31,792 | |||||||||||
|
Various Counties in AL |
Real estate—Owned, mineral interest only |
171,750 | |||||||||||
|
Tuscaloosa Resources | |||||||||||||
|
Tuscaloosa County, AL |
Administrative headquarters & mine support facilities |
664 | 7,764 | ||||||||||
|
Tuscaloosa County, AL |
Real estate—Owned |
696 | |||||||||||
|
Taft | |||||||||||||
|
Walker County, AL |
Administrative headquarters & mine support facilities |
3,680 | 11,075 | ||||||||||
|
Walker County, AL |
Coal mines and land holdings—Owned |
1,512 | |||||||||||
|
Walker County, AL |
Coal mines and land holdings—Leased |
1,820 | |||||||||||
|
Blount County, AL |
Mine support facilities |
1,200 | |||||||||||
|
Blount County, AL |
Coal mines and land holdings—Leased |
820 | |||||||||||
|
Walter Coke | |||||||||||||
|
Birmingham, AL |
Administrative headquarters |
12,000 | |||||||||||
|
Birmingham, AL |
Furnace & foundry coke battery—Owned |
411 | 200,400 | ||||||||||
U.S. Operations |
West Virginia Operations |
|||||||||||||
|
Atlantic Leaseco | |||||||||||||
|
Nicholas County, WV |
Administrative headquarters |
6,038 | |||||||||||
|
Nicholas County, WV |
Coal mines and land holdings—Owned |
2,090 | 50,083 | ||||||||||
|
Nicholas County, WV |
Coal mines and land holdings—Leased |
17,497 | |||||||||||
|
Maple Coal | |||||||||||||
|
Fayette & Kanawha Counties, WV |
Coal mines and land holdings—Owned |
5 | 47,100 | ||||||||||
|
Fayette & Kanawha Counties, WV |
Coal mines and land holdings—Leased |
35,704 | |||||||||||
|
JW Walter, Inc. | |||||||||||||
|
Various Counties in WV |
Coal mines and land holdings—Owned |
6,240 | |||||||||||
51
| |
|
|
|
Building Square Footage |
||||||||||
|---|---|---|---|---|---|---|---|---|---|---|---|---|---|---|
| |
Business Unit /Location | |
Land Acreage(1) |
|||||||||||
Reportable Segment
|
Principal Operations | Leased | Owned | |||||||||||
Canadian and U.K. Operations |
|
|||||||||||||
|
Walter Canada | |||||||||||||
|
Northeast, B.C. |
Chetwynd and Tumbler Ridge headquarters |
4,913 | |||||||||||
|
Wolverine's Perry Creek | |||||||||||||
|
Northeast, B.C. |
Coal mines and land holdings—Leased |
35,801 | |||||||||||
|
Northeast, B.C. |
Coal mines and land holdings—Owned |
24 | |||||||||||
|
Northeast, B.C. |
Administrative headquarters & mine support facilities |
44,737 | |||||||||||
|
Brazion's Brule | |||||||||||||
|
Northeast, B.C. |
Coal mines and land holdings—Leased |
28,434 | |||||||||||
|
Brazion's Willow Creek | |||||||||||||
|
Northeast, B.C. |
Coal mines and land holdings—Leased |
49,992 | |||||||||||
|
Northeast, B.C. |
Coal mines and land holdings—Owned |
263 | |||||||||||
|
Northeast, B.C. |
Administrative headquarters & mine support facilities |
9,250 | |||||||||||
|
U.K. Operations |
|||||||||||||
|
Energybuild | |||||||||||||
|
South Wales, U.K |
Administrative headquarters & mine support facilities |
34,623 | 61,799 | ||||||||||
|
South Wales, U.K |
Coal mines and land holdings—Leased |
7,549 | |||||||||||
|
South Wales, U.K |
Real estate—Leased |
247 | |||||||||||
Other |
Other |
|||||||||||||
|
Birmingham, AL |
Executive headquarters |
43,680 | |||||||||||
|
Vancouver, B.C |
Administrative headquarters |
16,472 | |||||||||||
- (1)
- Real estate and land holdings include mineral interests owned and leased.
As of December 31, 2012, we had estimated reserves totaling 401.0 million metric tons, of which 240.3 million tons, or approximately 60% are "assigned" recoverable reserves that are either currently being mined, are controlled and accessible from a currently active mine or located at idled facilities where limited capital expenditures would be required to initiate operations when conditions warrant. The remaining 160.7 million tons are classified as "unassigned", representing coal at currently non-producing locations which we anticipate mining in the future, but would require additional development capital before operations could begin.
Our reserve estimates are predicated on engineering, economic and geological data assembled and analyzed by our internal engineers, geologists and finance associates, as well as, third party consultants. We update our reserve estimates annually to reflect the impacts of past coal production, new drilling information and other geological or mining data and acquisitions or sales of coal properties. During the year ended December 31, 2012, 57.7 million tons were added to proven and probable reserves as a result of on-going exploration projects.
52
The following table provides the location and coal reserves associated with each mine or potential mine as of December 31, 2012:
ESTIMATED RECOVERABLE(1) COAL RESERVES
AS OF DECEMBER 31, 2012
(In Thousands of Metric Tons)
| |
|
|
|
|
|
|
|
Reserve Control(4) |
||||||||||||||||
|---|---|---|---|---|---|---|---|---|---|---|---|---|---|---|---|---|---|---|---|---|---|---|---|---|
| |
|
|
|
|
Recoverable Reserves(1) | |||||||||||||||||||
| |
|
Status of Operation(5) |
|
Assigned/ Unassigned(3) |
||||||||||||||||||||
Location/Mine
|
Type(8) | Coal Bed | Reserves(1) | Proven(2) | Probable(2) | Owned | Leased | |||||||||||||||||
Alabama: |
||||||||||||||||||||||||
Jim Walter Resources, Inc. |
||||||||||||||||||||||||
No. 4 |
U | Production | Mary Lee | Assigned | 61,843 | 60,120 | 1,723 | 1,017 | 60,826 | |||||||||||||||
No. 7 |
U | Production | Mary Lee | Assigned | 53,463 | 48,691 | 4,772 | 2,450 | 51,013 | |||||||||||||||
North River |
U | Production | Pratt | Assigned | 2,438 | 2,438 | — | 327 | 2,111 | |||||||||||||||
Blue Creek Energy, Inc. |
||||||||||||||||||||||||
Blue Creek No. 1 |
U | Development | Mary Lee | Unassigned | 74,882 | 71,789 | 3,093 | — | 74,882 | |||||||||||||||
Tuscaloosa Resources, Inc. |
||||||||||||||||||||||||
Carter/Swann's Crossing |
S | Production | Brookwood | Assigned | 2,919 | 2,919 | — | 2,919 | — | |||||||||||||||
Panther 3 |
S | Idled | Brookwood | Assigned | 262 | 262 | — | 262 | — | |||||||||||||||
Taft Coal Sales & Associates |
||||||||||||||||||||||||
Choctaw |
S | Production | Pratt | Assigned | 1,193 | 1,193 | — | — | 1,193 | |||||||||||||||
Reid School |
S | Production | Black Creek | Assigned | 34 | 34 | — | — | 34 | |||||||||||||||
Gayosa South |
S | Development | Pratt | Assigned | 352 | 352 | — | — | 352 | |||||||||||||||
Robbins Road |
S | Development | Pratt | Assigned | 1,225 | 1,225 | — | — | 1,225 | |||||||||||||||
Walter Minerals, Inc. |
||||||||||||||||||||||||
Flat Top |
S | Development | Pratt | Unassigned | 1,929 | 1,929 | — | 1,929 | — | |||||||||||||||
Beltona East |
S | Development | Black Creek | Unassigned | 1,013 | 1,013 | — | 1,013 | — | |||||||||||||||
Morris |
S | Development | Mary Lee | Unassigned | 1,801 | 525 | 1,276 | 1,801 | — | |||||||||||||||
Total Alabama |
203,354 | 192,490 | 10,864 | 11,718 | 191,636 | |||||||||||||||||||
West Virginia: |
||||||||||||||||||||||||
Atlantic Leasco |
||||||||||||||||||||||||
Gauley Eagle |
U | Idled | Allegheny, Kanawha | Assigned | 7,102 | 6,267 | 835 | — | 7,102 | |||||||||||||||
Gauley Eagle |
S | Idled | Allegheny, Kanawha | Assigned | 6,633 | 5,922 | 711 | — | 6,633 | |||||||||||||||
Maple Coal Company |
||||||||||||||||||||||||
Eagle |
U | Production | Allegheny, Kanawha | Assigned | 10,088 | 7,615 | 2,473 | — | 10,088 | |||||||||||||||
Peerless |
U | Exploration | Allegheny, Kanawha | Unassigned | 6,406 | 4,769 | 1,637 | — | 6,406 | |||||||||||||||
Powellton |
U | Exploration | Allegheny, Kanawha | Unassigned | 2,555 | 2,530 | 25 | — | 2,555 | |||||||||||||||
Maple |
S | Production | Allegheny, Kanawha | Assigned | 13,496 | 12,503 | 993 | — | 13,496 | |||||||||||||||
Total West Virginia |
46,280 | 39,606 | 6,674 | — | 46,280 | |||||||||||||||||||
53
| |
|
|
|
|
|
|
|
Reserve Control(4) |
||||||||||||||||
|---|---|---|---|---|---|---|---|---|---|---|---|---|---|---|---|---|---|---|---|---|---|---|---|---|
| |
|
|
|
|
Recoverable Reserves(1) | |||||||||||||||||||
| |
|
Status of Operation(5) |
|
Assigned/ Unassigned(3) |
||||||||||||||||||||
Location/Mine
|
Type(8) | Coal Bed | Reserves(1) | Proven(2) | Probable(2) | Owned | Leased | |||||||||||||||||
Northeast B.C., Canada: |
||||||||||||||||||||||||
Walter Canada |
||||||||||||||||||||||||
Wolverine's Perry Creek |
S | Production | Gates | Assigned | 11,027 | 11,027 | — | — | 11,027 | |||||||||||||||
Wolverine's Mt. Spieker (EB) |
S | Development | Gates | Unassigned | 9,856 | 9,856 | — | — | 9,856 | |||||||||||||||
Wolverine's Hermann |
S | Exploration | Gates | Unassigned | 9,075 | 6,775 | 2,300 | — | 9,075 | |||||||||||||||
Brazion's Brule |
S | Production | Gething | Assigned | 19,369 | 19,369 | — | — | 19,369 | |||||||||||||||
Brazion's Willow Creek |
S | Production | Gething | Assigned | 19,029 | 17,749 | 1,280 | — | 19,029 | |||||||||||||||
Brazion's Willow South |
S | Exploration | Gething | Assigned | 14,252 | 7,186 | 7,066 | — | 14,252 | |||||||||||||||
Brazion's Hudette |
S | Exploration | Gething | Unassigned | 24,658 | 24,193 | 465 | — | 24,658 | |||||||||||||||
Belcourt Saxon(6) |
S | Exploration | Gates | Unassigned | 28,523 | 28,273 | 250 | — | 28,523 | |||||||||||||||
Total Canada |
135,789 | 124,428 | 11,361 | — | 135,789 | |||||||||||||||||||
South Wales, U.K.: |
||||||||||||||||||||||||
Energybuild's Aberpergwm |
U | Development | 9' & 18'(7) | Assigned | 15,547 | 2,327 | 13,220 | — | 15,547 | |||||||||||||||
Total Walter Energy |
400,970 | 358,851 | 42,119 | 11,718 | 389,252 | |||||||||||||||||||
- (1)
- Reserves
are that part of a mineral deposit which can be economically and legally extracted or produced at the time of the reserve determination.
Recoverable reserves represent the amount of proven and probable reserves that can actually be recovered taking into account all mining and preparation losses involved in producing a saleable product
using existing methods under current law.
- (2)
- Reserves
are further categorized as Proven and Probable as defined by Securities and Exchange Commission Guide 7 as follows: Proven Reserves are reserves
for which (a) quantity is computed from dimensions revealed in outcrops, trenches, workings or drill holes; grade and/or quality are computed from the results of detailed sampling and
(b) the sites of inspection, sampling and measurement are spaced so closely and the geologic character is so well defined that size, shape, depth and mineral content of reserves are
well-established. Probable Reserves are reserves for which quantity and grade and/or quality are computed from information similar to that used for proven reserves, but the sites for
inspection, sampling, and measurement are further apart or are otherwise less adequately spaced. The degree of assurance, although lower than that for proven reserves, is high enough to assume
continuity between points of observation.
- (3)
- "Assigned"
reserves represent recoverable reserves that are either currently being mined, reserves that are controlled or accessible from a currently active
mine or reserves at idled facilities where limited capital expenditures would be required to re-establish operations. "Unassigned" reserves represent coal at currently
non-producing locations which would require significant additional capital spending before operations could begin.
- (4)
- "Reserve
Control" of recoverable reserves is either through direct ownership of the property or through third party leases. Third party leases generally
provide for terms or renewals through the anticipated life of the associated mine.
- (5)
- The
"Status of Operation" for each mine is classified as follows: Exploration—mines where exploration has been conducted sufficient to define
recoverable reserves, but the mine is not yet in development or production stage; Development—we are engaged in the preparation of an established commercially minable deposit (reserves)
for extraction but are not yet in production; Production—the mine is actively operating; Idled—previously active mines that have been idled until such time as reinitiating
operations are considered feasible. If conditions warrant, the mines could be re-opened with less capital investment than would be required to develop a new mine.
- (6)
- The
Belcourt Saxon Properties are part of a joint venture partnership in which Walter Energy has a 50% ownership interest. The reserves reported represent
50% of the reserves held by the joint venture.
- (7)
- The
reserves of this mine are contained within two seams named the "9' seam" and the "18' seam" which are contained in the South Wales Coal
Basin—Lower Coal Measures coal bed.
- (8)
- Type of Mine: U = Underground; S = Surface
Note: Also see Glossary for definitions of technical terms
54
The following table provides a summary of the quality of our reserves as of December 31, 2012:
ESTIMATED RECOVERABLE COAL RESERVES (Continued)
AS OF DECEMBER 31, 2012
(In Thousands of Metric Tons)
| |
|
|
Quality (Wet Basis)(3) | |
|||||||||||||||
|---|---|---|---|---|---|---|---|---|---|---|---|---|---|---|---|---|---|---|---|
| |
|
|
Average Coal Seam Thickness (in Feet) |
||||||||||||||||
Location/Mine
|
Reserves | Type(1) | % Ash | % Sulfur | BTU/lb. | ||||||||||||||
Alabama: |
|||||||||||||||||||
Jim Walter Resources, Inc. |
|||||||||||||||||||
No. 4 |
61,843 | C | 9.00 | 0.80 | 13,909 | 4.74 | |||||||||||||
No. 7 |
53,463 | C | 9.00 | 0.75 | 13,952 | 4.19 | |||||||||||||
North River |
2,438 | T | 13.00 | 2.07 | 13,711 | 3.83 | |||||||||||||
Blue Creek Energy, Inc. |
|||||||||||||||||||
Blue Creek No. 1 |
74,882 | C | 9.00 | 0.69 | 13,791 | 4.70 | |||||||||||||
Tuscaloosa Resources, Inc. |
|||||||||||||||||||
Carter/Swann's Crossing |
2,919 | C/T | 12.00 | 1.26 | 12,497 | 9.41 | |||||||||||||
Panther 3 |
262 | T | 9.00 | 4.21 | 13,636 | 1.99 | |||||||||||||
Taft Coal Sales & Associates |
|||||||||||||||||||
Choctaw(2) |
1,193 | C/T | 12.36 | 1.87 | 12,927 | 6.47 | |||||||||||||
Reid School |
34 | C | 2.92 | 0.89 | 15,041 | 2.46 | |||||||||||||
Gayosa South(2) |
352 | C/T | 14.69 | 1.32 | 12,484 | 4.79 | |||||||||||||
Robbins Road(2) |
1,225 | C/T | 12.36 | 1.55 | 12,887 | 4.70 | |||||||||||||
Walter Minerals, Inc. |
|||||||||||||||||||
Flat Top |
1,929 | T | 10.90 | 2.13 | 13,590 | 5.66 | |||||||||||||
Beltona East |
1,013 | C/T | 7.79 | 2.58 | 1,462 | 4.88 | |||||||||||||
Morris |
1,801 | T | 20.80 | 1.60 | 12,175 | 5.46 | |||||||||||||
Total Alabama |
203,354 | ||||||||||||||||||
West Virginia: |
|||||||||||||||||||
Atlantic Leasco |
|||||||||||||||||||
Gauley Eagle underground |
7,102 | C/T | 7.45 | 1.04 | 12,944 | 3.80 | |||||||||||||
Gauley Eagle surface |
6,633 | C/T | 12.22 | 1.09 | 12,450 | 18.56 | |||||||||||||
Maple Coal Company |
|||||||||||||||||||
Eagle |
10,088 | C | 6.21 | 0.87 | 13,643 | 4.14 | |||||||||||||
Peerless |
6,406 | T | 5.13 | 2.08 | 13,333 | 3.59 | |||||||||||||
Powellton |
2,555 | C | 5.87 | 0.80 | 13,275 | 3.05 | |||||||||||||
Maple |
13,496 | C/T | 12.98 | 0.85 | 11,800 | 33.59 | |||||||||||||
Total West Virginia |
46,280 | ||||||||||||||||||
55
| |
|
|
Quality (Wet Basis)(3) | |
|||||||||||||||
|---|---|---|---|---|---|---|---|---|---|---|---|---|---|---|---|---|---|---|---|
| |
|
|
Average Coal Seam Thickness (in Feet) |
||||||||||||||||
Location/Mine
|
Reserves | Type(1) | % Ash | % Sulfur | BTU/lb. | ||||||||||||||
Northeast B.C., Canada: |
|||||||||||||||||||
Walter Canada |
|||||||||||||||||||
Wolverine's Perry Creek |
11,027 | C | 7.85 | 0.47 | 14,261 | 33.70 | |||||||||||||
Wolverine's Mt. Spieker (EB) |
9,856 | C | 8.72 | 0.49 | 14,116 | 39.80 | |||||||||||||
Wolverine's Hermann |
9,075 | C | 8.12 | 0.41 | 14,220 | 55.90 | |||||||||||||
Brazion's Brule |
19,369 | P | 7.43 | 0.51 | 14,242 | 36.80 | |||||||||||||
Brazion's Willow Creek |
19,029 | C/P | 7.50 | 0.58 | 14,500 | 32.50 | |||||||||||||
Brazion's Willow South |
14,252 | P | (2) | 8.00 | 0.60 | 14,200 | 42.30 | ||||||||||||
Brazion's Hudette |
24,658 | P | (2) | 8.00 | 0.60 | 14,250 | 55.30 | ||||||||||||
Belcourt Saxon Properties |
28,523 | C | 8.00 | 0.35 | 14,227 | 62.50 | |||||||||||||
Total Canada |
135,789 | ||||||||||||||||||
South Wales, U.K.: |
|||||||||||||||||||
Energybuild's Aberpergwm |
15,547 | C/T | 5.80 | 0.80 | 14,428 | 9.29 | |||||||||||||
Total Walter Energy |
400,970 | ||||||||||||||||||
- (1)
- Coal
Type: C—Coking Coal; T—Thermal; P—Pulverized Coal Injection
- (2)
- Coals
in this reserve area typically have metallurgical properties and, at a minimum, characterization of coal quality is sufficient to classify this
reserve as Pulverized Coal Injection. Data suggests that a portion of this reserve may be coking coal, however, additional sampling and analysis is necessary before the classification can be confirmed
and revised from PCI.
- (3)
- The majority of our reserves are marketed and sold into the metallurgical market. However some reserves are thermal (steam) coal that are marketed as compliant coal and used for industrial or power generation purposes. Compliant coal, when burned, emits 1.2 pounds or less of sulfur dioxide per million Btus' as required by Phase II of the Clean Air Act. However, electricity generators are able to use coal that exceeds these specifications by using emissions reduction technology, using emissions allowance credits or blending higher sulfur coal with low sulfur coal.
Note: Also see Glossary for definitions of technical terms.
56
The following table provides a summary of information regarding our mining operations as of December 31, 2012:
| |
|
|
|
|
|
Preparation Plant | |
||||||||||||
|---|---|---|---|---|---|---|---|---|---|---|---|---|---|---|---|---|---|---|---|
| |
|
|
|
Transportation | |
||||||||||||||
| |
|
|
Mining Equipment(2) |
Capacity (metric tons per hr) |
Utilization % |
Source of Power(5) |
|||||||||||||
Location/Mine
|
Reserves | Type(1) | Rail | Other(3) | |||||||||||||||
Alabama: |
|||||||||||||||||||
Jim Walter Resources, Inc |
|||||||||||||||||||
No. 4 |
61,843 | U | LW,CM | CSX | T,B | 1,180 | 92% | APCO | |||||||||||
No. 7 |
53,463 | U | LW,CM | CSX | T,B | 2,180 | 90% | APCO | |||||||||||
North River |
2,438 | U | LW,CM | NS | N/A | 900 | 87% | APCO | |||||||||||
Blue Creek Energy, Inc. |
|||||||||||||||||||
Blue Creek No. 1 |
74,882 | U | In exploration or development | ||||||||||||||||
Tuscaloosa Resources, Inc. |
|||||||||||||||||||
Carter/Swann's Crossing |
2,919 | S | E,L,T | T,B | N/A | N/A | APCO | ||||||||||||
Panther 3 |
262 | S | E,L,T | T,B | N/A | N/A | APCO | ||||||||||||
Taft Coal Sales & Associates |
|||||||||||||||||||
Choctaw(2) |
1,193 | S | D,E,L,T | NS | T | 110 | 85% | APCO | |||||||||||
Reid School |
34 | S | E,L,T | T | N/A | N/A | APCO | ||||||||||||
Gayosa South(2) |
352 | S | In exploration or development | ||||||||||||||||
Robbins Road(2) |
1,225 | S | In exploration or development | ||||||||||||||||
Walter Minerals, Inc. |
|||||||||||||||||||
Flat Top |
1,929 | S | In exploration or development | ||||||||||||||||
Beltona East |
1,013 | S | In exploration or development | ||||||||||||||||
Morris |
1,801 | S | In exploration or development | ||||||||||||||||
Total Alabama |
203,354 | ||||||||||||||||||
West Virginia: |
|||||||||||||||||||
Atlantic Leasco |
|||||||||||||||||||
Gauley Eagle |
7,102 | U | In exploration or development | ||||||||||||||||
Gauley Eagle |
6,633 | S | E,L,T | CSX | T,B | N/A | N/A | Allegheny | |||||||||||
Maple Coal Company |
|||||||||||||||||||
Eagle |
10,088 | U | E,L,T | T,B | 410 | 86% | AEP | ||||||||||||
Peerless |
6,406 | U | In exploration or development | ||||||||||||||||
Powellton |
2,555 | U | In exploration or development | ||||||||||||||||
Maple |
13,496 | S | E,L,T | T,B | N/A | N/A | AEP | ||||||||||||
Total West Virginia |
46,280 | ||||||||||||||||||
Northeast B.C., Canada: |
|||||||||||||||||||
Walter Canada |
|||||||||||||||||||
Wolverine's Perry Creek |
11,027 | S | E,L,T | CN | 770 | 70% | BC Hydro | ||||||||||||
Wolverine's Mt. Spieker (EB) |
9,856 | S | In exploration or development | ||||||||||||||||
Wolverine's Hermann |
9,075 | S | In exploration or development | ||||||||||||||||
Brazion's Brule |
19,369 | S | E,L,T | CN | T | N/A | N/A | BC Hydro | |||||||||||
Brazion's Willow Creek |
19,029 | S | E,L,T | CN | 660 | 50% | (4) | BC Hydro | |||||||||||
Brazion's Willow South |
14,252 | S | In exploration or development | ||||||||||||||||
Brazion's Hudette |
24,658 | S | In exploration or development | ||||||||||||||||
Belcourt Saxon |
28,523 | S | In exploration or development | ||||||||||||||||
Total Canada |
135,789 | ||||||||||||||||||
South Wales, U.K.: |
|||||||||||||||||||
Energybuild's Aberpergwm |
15,547 | U | CM | 450 | Idle | E. ON | |||||||||||||
Total Walter Energy |
400,970 | ||||||||||||||||||
- (1)
- Type
of Mine: S = Surface; U = Underground
- (2)
- Mining Equipment: D = Dragline; S = Shovel/Excavator/Loader; T = Trucks; LW = Longwall; CM = Continuous Miner
57
- (3)
- Transportation
Other: T = Trucks; B = Barge Load-out Availability
- (4)
- Estimated
Utilization; Plant began production in first quarter 2012.
- (5)
- Source of Power: APCO = Alabama Power Company; Allegheny = Allegheny Energy; AEP = American Electric Power; BC Hydro = BC Hydro and Power Authority; E.ON = E.ON Group
Note: Also see Glossary for definitions of technical terms.
The following table provides the production (in thousands) and average coal selling price per metric ton for each of the three years in the period ended December 31, 2012:
| |
|
|
|
|
|
|
Date Mine: | |||||||||||||||
|---|---|---|---|---|---|---|---|---|---|---|---|---|---|---|---|---|---|---|---|---|---|---|
| |
Production/Average Coal Selling Price Per Ton | |||||||||||||||||||||
| |
Acq/ Opened |
Ceased/ Idled |
||||||||||||||||||||
Location/Mine
|
2012 | 2011 | 2010 | |||||||||||||||||||
Alabama: |
||||||||||||||||||||||
Jim Walter Resources, Inc |
||||||||||||||||||||||
No. 4 |
1,727 | $ | 186.36 | 1,926 | $ | 272.61 | 2,537 | $ | 204.11 | 1976 | N/A | |||||||||||
No. 7 |
4,322 | $ | 206.60 | 3,275 | $ | 275.88 | 3,511 | $ | 202.25 | 1978 | N/A | |||||||||||
North River |
2,040 | $ | 59.33 | 1,539 | $ | 43.56 | — | — | May-11 | N/A | ||||||||||||
Tuscaloosa Resources, Inc. |
||||||||||||||||||||||
Carter/Swann's Crossing |
325 | $ | 107.38 | 183 | $ | 105.73 | — | — | May-11 | N/A | ||||||||||||
East Brookwood |
— | — | 97 | $ | 112.59 | 421 | $ | 104.86 | Sep-07 | Jul-11 | ||||||||||||
Taft Coal Sales & Associates |
||||||||||||||||||||||
Choctaw |
558 | $ | 101.90 | 549 | $ | 90.74 | 601 | $ | 70.45 | Sep-08 | N/A | |||||||||||
Reid School |
195 | $ | 155.27 | 221 | $ | 163.45 | 147 | $ | 150.98 | May-10 | N/A | |||||||||||
Walter Minerals, Inc. |
||||||||||||||||||||||
Hwy 59 |
— | — | 192 | $ | 105.19 | 201 | $ | 89.54 | Aug-09 | Aug-11 | ||||||||||||
Total Alabama |
9,167 | 7,982 | 7,418 | |||||||||||||||||||
West Virginia: |
||||||||||||||||||||||
Atlantic Leasco |
||||||||||||||||||||||
Gauley Eagle underground |
— | — | 8 | $ | 114.17 | — | — | Apr-11 | June-11 | |||||||||||||
Gauley Eagle surface |
187 | $ | 70.48 | 519 | $ | 64.79 | — | — | Apr-11 | June-12 | ||||||||||||
Maple Coal Company |
||||||||||||||||||||||
Eagle |
431 | $ | 163.82 | 448 | $ | 173.63 | — | — | Apr-11 | N/A | ||||||||||||
Maple |
252 | $ | 79.74 | 391 | $ | 71.36 | — | — | Apr-11 | N/A | ||||||||||||
Total West Virginia |
870 | 1,366 | — | |||||||||||||||||||
Northeast B.C., Canada: |
||||||||||||||||||||||
Walter Canada |
||||||||||||||||||||||
Wolverine's Perry Creek |
1,824 | $ | 201.59 | 1,083 | $ | 265.79 | — | — | Apr-11 | N/A | ||||||||||||
Brazion's Brule |
1,831 | $ | 159.43 | 1,100 | $ | 210.10 | — | — | Apr-11 | N/A | ||||||||||||
Brazion's Willow Creek |
868 | $ | 169.13 | 568 | $ | 215.22 | — | — | Apr-11 | N/A | ||||||||||||
Belcourt Saxon |
— | — | — | — | — | — | Apr-11 | N/A | ||||||||||||||
Total Canada |
4,523 | 2,751 | — | |||||||||||||||||||
South Wales, U.K.: |
||||||||||||||||||||||
Energybuild's Aberpergwm(1) |
63 | $ | 122.96 | 100 | $ | 121.67 | — | — | Apr-11 | Nov-11 | ||||||||||||
Total Walter Energy |
14,623 | 12,199 | 7,418 | |||||||||||||||||||
- (1)
- Tons produced and sold while under development.
58
Information provided within the previous tables concerning our properties has been prepared in accordance with applicable United States federal securities laws. All mineral reserve estimates have been prepared in accordance with SEC Industry Guide 7—Description of Property by Issuers Engaged or to be Engaged in Significant Mining Operations. We are also required to comply with the requirements of applicable Canadian securities law and, in particular, National Instrument 43-101—Standards of Disclosure for Mineral Projects ("NI 43-101") of the Canadian Securities Administrators which contains requirements and standards for mineral disclosure which differ from SEC Industry Guide 7. In this regard, we have filed technical reports with the Canadian Securities regulatory authorities in respect of certain of our properties to comply with the requirements of NI 43-101 and these filings are available at www.sedar.com. Investors resident in Canada should be aware that Canadian standards for mineral disclosure, including NI 43-101, differ significantly from the requirements of the SEC. Without limiting the generality of the foregoing, the requirements of NI 43-101 for identification of "mineral reserves" are not the same as those of the SEC and reserves reported in compliance with NI 43-101 may not qualify as "reserves" under SEC Industry Guide 7. Accordingly, information contained in this annual report relating to descriptions of mineral reserves may not be comparable to similar information made public by Canadian companies subject to the reporting and disclosure requirements under NI 43-101.
See the section entitled "Business-Environmental and Other Regulatory Matters" in Part I, "Item 1." and Note 18 of "Notes to Consolidated Financial Statements," which are incorporated herein by reference.
Item 4. Mine Safety Disclosures
The information concerning mine safety violations and other regulatory matters is filed as Exhibit 95 to this Form 10-K pursuant to the requirements of Section 1503(a) of the Dodd-Frank Wall Street Reform and Consumer Protection Act and Item 104 of Regulation S-K (17 CFR 229.104).
59
Item 5. Market for the Registrant's Common Equity, Related Stockholder Matters and Issuer Purchases of Equity Securities
Our common stock (the "Common Stock") has been listed on the New York Stock Exchange under the trading symbol "WLT" since December 18, 1997 and the Toronto Stock Exchange under the trading symbol "WLT" since April 12, 2011. The table below sets forth the range of high and low closing sales prices of the Common Stock for the fiscal periods indicated.
| |
Year ended December 31, 2012 |
||||||
|---|---|---|---|---|---|---|---|
| |
High | Low | |||||
1st Fiscal quarter |
$ | 76.28 | $ | 56.87 | |||
2nd Fiscal quarter |
$ | 68.30 | $ | 43.34 | |||
3rd Fiscal quarter |
$ | 45.71 | $ | 30.73 | |||
4th Fiscal quarter |
$ | 40.14 | $ | 28.46 | |||
| |
Year ended December 31, 2011 |
||||||
|---|---|---|---|---|---|---|---|
| |
High | Low | |||||
1st Fiscal quarter |
$ | 138.58 | $ | 114.12 | |||
2nd Fiscal quarter |
$ | 141.17 | $ | 105.59 | |||
3rd Fiscal quarter |
$ | 131.71 | $ | 60.01 | |||
4th Fiscal quarter |
$ | 81.25 | $ | 56.90 | |||
During the year ended December 31, 2012, we declared and paid a dividend of $0.125 per share to shareholders of record on each of February 20, May 7, August 6, and November 12. During the year ended December 31, 2011, we declared and paid a dividend of $0.125 per share to shareholders of record on each of February 18, May 6, August 12, and November 4. Covenants contained in certain of the debt instruments referred to in Note 14 of "Notes to Consolidated Financial Statements" may restrict the amount the Company can pay in cash dividends. Future dividends will be declared at the discretion of the Board of Directors and will depend on our future earnings, financial condition and other factors affecting dividend policy. See also "Item 1A. Risk Factors" in Part I. As of February 22, 2013, there were 626 shareholders of record of the Common Stock.
60
The following graph shows changes over the past five-year period based on the value of $100 invested in (1) Walter Energy's Common stock; (2) the Russell 3000 Stock Index; and (3) the Dow Jones U.S. Coal Index. The values of each investment are based on price change plus reinvestment of all dividends reported to shareholders. The information below is being furnished pursuant to Regulation S-K, Item 201 (e) (Performance Graph).
| |
2007 | 2008 | 2009 | 2010 | 2011 | 2012 | |||||||||||||
|---|---|---|---|---|---|---|---|---|---|---|---|---|---|---|---|---|---|---|---|
Walter Energy, Inc. |
100.0 | 48.7 | 209.6 | 355.8 | 168.6 | 99.9 | |||||||||||||
Russell 3000 Stock Index |
100.0 | 61.3 | 76.9 | 88.3 | 87.4 | 99.7 | |||||||||||||
Dow Jones U.S. Coal Index |
100.0 | 37.6 | 78.9 | 105.1 | 55.7 | 38.8 | |||||||||||||

The following table sets forth certain information relating to our equity compensation plans as of December 31, 2012:
| |
Number of Securities to be Issued upon Exercise of Outstanding Options, Warrants and Rights |
Weighted Average Exercise Price of Outstanding Options, Warrants and Rights |
Number of Securities Remaining Available for Future Issuance |
|||||||
|---|---|---|---|---|---|---|---|---|---|---|
Equity compensation plans approved by security holders: |
||||||||||
2002 Long-term Incentive Award Plan |
675,731 | $ | 37.17 | 1,896,597 | ||||||
1995 Long-term Incentive Stock Plan |
14,909 | $ | 6.58 | — | ||||||
1996 Employee Stock Purchase Plan |
— | — | 1,027,807 | |||||||
Sales of Unregistered Securities
On April 1, 2011, we issued 8,951,558 shares of Common Stock to partially fund the acquisition of Western Coal. Our Common Stock was issued without registration in reliance on Section 3(a)(10) of the Securities Act.
61
Purchase of Equity Securities by the Company and Affiliated Purchasers
Period
|
Total Number of Shares Purchased(1) |
Average Price Paid per Share |
Total Number of Shares Purchased as Part of Publicly Announced Plans or Programs |
Approximate Dollar Value of Shares that May Yet Be Purchased Under the Plans or Programs (in millions)(1) |
|||||||||
|---|---|---|---|---|---|---|---|---|---|---|---|---|---|
January 1, 2012–January 31, 2012 |
— | — | — | $ | 0.2 | ||||||||
February 1, 2012–February 29, 2012 |
7,846 | $ | 66.35 | — | $ | 0.2 | |||||||
March 1, 2012–March 31, 2012 |
2,221 | $ | 63.24 | — | $ | 0.2 | |||||||
April 1, 2012–April 30, 2012 |
186 | $ | 64.29 | — | $ | 0.2 | |||||||
May 1, 2012–May 31, 2012 |
— | — | — | $ | 0.2 | ||||||||
June 1, 2012–June 30, 2012 |
— | — | — | $ | 0.2 | ||||||||
July 1, 2012–July 31, 2012 |
964 | $ | 36.87 | — | $ | 0.2 | |||||||
August 1, 2012–August 31, 2012 |
324 | $ | 36.27 | — | $ | 0.2 | |||||||
September 1, 2012–September 30, 2012 |
262 | $ | 32.65 | — | $ | 0.2 | |||||||
October 1, 2012–October 31, 2012 |
— | — | — | $ | 0.2 | ||||||||
November 1, 2012–November 30, 2012 |
— | — | — | $ | 0.2 | ||||||||
December 1, 2012–December 31, 2012 |
— | — | — | $ | 0.2 | ||||||||
Total |
11,803 | — | |||||||||||
- (1)
- These shares were acquired to satisfy certain employees' tax withholding obligations associated with the lapse of restrictions on certain stock awards granted under the Amended and Restated 2002 Long-Term Incentive Award Plan. Upon acquisition, these shares were retired.
Item 6. Selected Financial Data
The following data has been derived from our annual consolidated financial statements, including the consolidated balance sheets and the related consolidated statements of operations, comprehensive income, changes in stockholders' equity and cash flows and the notes thereto as they relate to our continuing operations. The information presented below should be read in conjunction with our consolidated financial statements and the notes thereto, including Note 2 related to significant
62
accounting policies, Note 3 for acquisitions and Note 6 related to discontinued operations, and the other information contained elsewhere in this Form 10-K.
| |
Years ended December 31, | |||||||||||||||
|---|---|---|---|---|---|---|---|---|---|---|---|---|---|---|---|---|
(in thousands, except per share data)
|
2012 | Recast 2011 | 2010 | 2009 | 2008 | |||||||||||
Revenues |
$ | 2,399,895 | $ | 2,571,358 | $ | 1,587,730 | $ | 966,827 | $ | 1,149,684 | ||||||
Income (loss) from continuing operations |
$ |
(1,065,555 |
) |
$ |
363,598 |
$ |
389,425 |
$ |
141,850 |
$ |
231,192 |
|||||
Basic income (loss) per share from continuing operations |
$ |
(17.04 |
) |
$ |
6.03 |
$ |
7.32 |
$ |
2.67 |
$ |
4.30 |
|||||
Number of shares used in calculation of basic income (loss) per share from continuing operations |
62,536 |
60,257 |
53,179 |
53,076 |
53,791 |
|||||||||||
Diluted income (loss) per share from continuing operations |
$ |
(17.04 |
) |
$ |
6.00 |
$ |
7.25 |
$ |
2.64 |
$ |
4.24 |
|||||
Number of shares used in calculation of diluted income (loss) per share from continuing operations |
62,536 |
60,611 |
53,700 |
53,819 |
54,585 |
|||||||||||
Capital expenditures |
$ |
391,512 |
$ |
414,566 |
$ |
157,476 |
$ |
96,298 |
$ |
141,627 |
||||||
Net minerals, property, plant and equipment |
$ |
4,697,688 |
$ |
4,687,591 |
$ |
790,001 |
$ |
522,931 |
$ |
504,585 |
||||||
Total assets(1) |
$ |
5,768,420 |
$ |
6,856,508 |
$ |
1,651,853 |
$ |
1,244,159 |
$ |
1,195,695 |
||||||
Debt: |
||||||||||||||||
2011 term loan A |
$ |
756,974 |
$ |
894,837 |
$ |
— |
$ |
— |
$ |
— |
||||||
2011 term loan B |
$ |
1,127,770 |
$ |
1,333,163 |
$ |
— |
$ |
— |
$ |
— |
||||||
2011 revolving credit facility |
$ |
— |
$ |
10,000 |
$ |
— |
$ |
— |
$ |
— |
||||||
2005 Walter term loan |
$ |
— |
$ |
— |
$ |
136,062 |
$ |
137,498 |
$ |
138,934 |
||||||
2005 Walter revolving credit facility |
$ |
— |
$ |
— |
$ |
— |
$ |
— |
$ |
40,000 |
||||||
9.875% senior notes due December 15, 2020 |
$ |
496,510 |
$ |
— |
$ |
— |
$ |
— |
$ |
— |
||||||
Miscellaneous debt(2) |
$ |
34,911 |
$ |
87,715 |
$ |
32,411 |
$ |
39,000 |
$ |
46,451 |
||||||
Quarterly cash dividend per common share |
$ |
0.125 |
$ |
0.125 |
$ |
0.125 |
$ |
0.10 |
$ |
0.10 |
||||||
- (1)
- Excludes
assets of discontinued operations.
- (2)
- This balance includes capital lease obligations and an equipment financing agreement.
63
Item 7. Management's Discussion and Analysis of Financial Condition and Results of Operations
The following discussion and analysis should be read in conjunction with our Consolidated Financial Statements and related Notes thereto included elsewhere in this Annual Report on Form 10-K.
OVERVIEW
We are a leading producer and exporter of metallurgical coal for the global steel industry from underground and surface mines located in the United States, Canada and the United Kingdom. We also produce thermal coal, anthracite coal, metallurgical coke and coal bed methane gas. As of December 31, 2012, we had approximately 401.0 million metric tons of recoverable reserves throughout the world.
We currently operate 11 active coal mines, a coke plant and a coal bed methane extraction operation located throughout Alabama, West Virginia, Northeast British Columbia, and the U.K. We operate our business through two principal business segments: the U.S. Operations and Canadian and U.K. Operations. The U.S. Operations segment includes hard coking coal and thermal coal mines in both Alabama and West Virginia, a coke plant in Alabama, and coal bed methane extraction operations also located in Alabama. Our U.S. Operations are estimated to have approximately 249.6 million metric tons of recoverable reserves. The Canadian mining operations currently operate three surface metallurgical coal mines in Northeast British Columbia's coalfields (the Wolverine Mine, the Brule Mine, and the Willow Creek Mine). The Canadian mining operations is estimated to have approximately 135.8 million metric tons of recoverable reserves. Our U.K. mining operation consists of an idled underground and an idled surface mine located in South Wales. The underground mine produced anthracite coal, which can be sold as a low-volatile PCI coal and the surface mine operations produced thermal coal. Our U.K. mining operations is estimated to have approximately 15.5 million metric tons of recoverable reserves.
Our sales of metallurgical coal in 2012, 2011 and 2010, which generally sells at a premium over our thermal coal, accounted for approximately 76%, 70% and 85%, respectively, of our annual coal sales volume, and our sales of thermal coal in 2012, 2011 and 2010 accounted for approximately 24%, 30% and 15%, respectively, of our annual coal sales volume. Our sales of metallurgical coal were made primarily to steel companies located in Europe, Asia and South America and our sales of thermal coal were made primarily to large utilities and industrial customers located primarily throughout Alabama, West Virginia, and the U.K. Approximately 78%, 76% and 76% of our total revenues in 2012, 2011 and 2010, respectively, were derived from sales made to customers outside of the United States, primarily in Japan, Brazil, Germany, Korea and Luxemborg.
Although 2012 was a difficult year, we produced a total of 11.5 million metric tons of metallurgical coal in 2012, an increase of 30% as compared to 2011 metallurgical coal production of 8.8 million metric tons. We sold 10.4 million metric tons of metallurgical coal in 2012, up 19% from 8.7 million metric tons of metallurgical coal sales in 2011. We also achieved revenue of $2.4 billion, a decrease of 7% compared with $2.6 billion in 2011 while our average selling price for metallurgical coal decreased to $187.44 in 2012 from $236.55 in 2011, representing a decrease of 21%.
The weakness in the metallurgical coal market during 2012 resulted from a combination of slowing Chinese demand growth, the weak economic environment in Europe, and the recovery of Australian supply, all of which resulted in an oversupply of metallurgical coal. This oversupply of metallurgical coal put pressure on the selling price of metallurgical coal reducing the price to levels not experienced in several years.
In response to the weak metallurgical coal markets, we curtailed operations and projects, reduced costs and enhanced productivity. On August 1, 2012, we announced plans to reduce 2012 capital spending to approximately $400 million. We also reduced production and spending at two of our three
64
Canadian mines in the fourth quarter, reduced production at the Maple mine in West Virginia, converted our Brule mine from contractor-operated to owner-operated, idled our Gauley Eagle surface mine operation in West Virginia and significantly reduced development spending at our Aberpergwm underground coal mine operations in the U.K.
INDUSTRY OVERVIEW AND OUTLOOK
Global steel production for 2012 increased 1.2% to a record 1.55 billion metric tons from the previous record of 1.53 billion metric tons set in 2011. Annual 2012 steel production for Asia was 1.01 billion metric tons, an increase of 2.6% compared to 2011 making Asia's share of global steel production in 2012 65.4% as compared to 64.5% in 2011. Steel production in North America increased 2.5% for the year to 121.9 million metric tons, while production in South America and Europe decreased 3.0% and 2.7%, respectively, compared to 2011.
According to the World Steel Association, global steel consumption is projected to increase approximately 3% in 2013 from 2012, driven largely by the China market which accounts for 40-50% of global steel demand. Although the short-term outlook for metallurgical coal is questionable, our long-term outlook remains constructive. The long-term demand for metallurgical coal within all of our geographic markets is anticipated to remain strong as industry projections continue to suggest that global steelmaking will continue to require increasing amounts of high quality metallurgical coal. While we remain positive on the long term outlook for metallurgical coal, we are focused on reducing spending and production until such time that coal prices and demand improve.
We expect our 2013 metallurgical coal production to be in line with production levels in 2012 of which approximately 75% will be hard coking coal and 25% will be low-volatile PCI coal. We also expect our sales tons to significantly exceed production in 2013. We are well positioned to increase our production to capitalize on anticipated improvements in pricing and demand when market conditions warrant.
RESULTS OF CONTINUING OPERATIONS
2012 Summary Operating Results
| |
For the Year Ended December 31, 2012 | ||||||||||||
|---|---|---|---|---|---|---|---|---|---|---|---|---|---|
(in thousands)
|
U.S. Operations | Canadian and U.K. Operations |
Other | Total | |||||||||
Sales |
$ | 1,712,872 | $ | 668,261 | $ | 627 | $ | 2,381,760 | |||||
Miscellaneous income |
15,491 | 52 | 2,592 | 18,135 | |||||||||
Revenues |
1,728,363 | 668,313 | 3,219 | 2,399,895 | |||||||||
Cost of sales (exclusive of depreciation and depletion) |
1,153,271 | 642,021 | 1,699 | 1,796,991 | |||||||||
Depreciation and depletion |
173,140 | 141,713 | 1,379 | 316,232 | |||||||||
Selling, general and administrative |
45,674 | 43,972 | 43,821 | 133,467 | |||||||||
Postretirement benefits |
53,301 | — | (449 | ) | 52,852 | ||||||||
Asset impairment and restructuring |
39,961 | 9,109 | — | 49,070 | |||||||||
Goodwill impairment |
74,320 | 990,089 | — | 1,064,409 | |||||||||
Operating income (loss) |
$ | 188,696 | $ | (1,158,591 | ) | $ | (43,231 | ) | (1,013,126 | ) | |||
Interest expense, net |
(138,552 | ) | |||||||||||
Other loss |
(13,081 | ) | |||||||||||
Income tax benefit |
99,204 | ||||||||||||
Loss from continuing operations |
$ | (1,065,555 | ) | ||||||||||
65
| |
For the Year Ended December 31, 2011, recast | ||||||||||||
|---|---|---|---|---|---|---|---|---|---|---|---|---|---|
(in thousands)
|
U.S. Operations | Canadian and U.K. Operations |
Other | Total | |||||||||
Sales |
$ | 1,850,015 | $ | 711,322 | $ | 988 | $ | 2,562,325 | |||||
Miscellaneous income (loss) |
21,167 | (13,268 | ) | 1,134 | 9,033 | ||||||||
Revenues |
1,871,182 | 698,054 | 2,122 | 2,571,358 | |||||||||
Cost of sales (exclusive of depreciation and depletion) |
1,050,743 | 509,213 | 1,156 | 1,561,112 | |||||||||
Depreciation and depletion |
155,702 | 74,203 | 776 | 230,681 | |||||||||
Selling, general and administrative |
61,622 | 28,100 | 76,027 | 165,749 | |||||||||
Postretirement benefits |
41,745 | — | (1,360 | ) | 40,385 | ||||||||
Operating income (loss) |
$ | 561,370 | $ | 86,538 | $ | (74,477 | ) | 573,431 | |||||
Interest expense, net |
(96,214 | ) | |||||||||||
Other income, net |
17,606 | ||||||||||||
Income tax expense |
(131,225 | ) | |||||||||||
Income from continuing operations |
$ | 363,598 | |||||||||||
| |
Increase (Decrease) for the Year Ended December 31, 2012 | ||||||||||||
|---|---|---|---|---|---|---|---|---|---|---|---|---|---|
(in thousands)
|
U.S. Operations | Canadian and U.K. Operations |
Other | Total | |||||||||
Sales |
$ | (137,143 | ) | $ | (43,061 | ) | $ | (361 | ) | $ | (180,565 | ) | |
Miscellaneous income (loss) |
(5,676 | ) | 13,320 | 1,458 | 9,102 | ||||||||
Revenues |
(142,819 | ) | (29,741 | ) | 1,097 | (171,463 | ) | ||||||
Cost of sales (exclusive of depreciation and depletion) |
102,528 | 132,808 | 543 | 235,879 | |||||||||
Depreciation and depletion |
17,438 | 67,510 | 603 | 85,551 | |||||||||
Selling, general and administrative |
(15,948 | ) | 15,872 | (32,206 | ) | (32,282 | ) | ||||||
Postretirement benefits |
11,556 | — | 911 | 12,467 | |||||||||
Asset impairment and restructuring |
39,961 | 9,109 | — | 49,070 | |||||||||
Goodwill impairment |
74,320 | 990,089 | — | 1,064,409 | |||||||||
Operating income (loss) |
$ | (372,674 | ) | $ | (1,245,129 | ) | $ | 31,246 | (1,586,557 | ) | |||
Interest expense, net |
(42,338 | ) | |||||||||||
Other income (loss) |
(30,687 | ) | |||||||||||
Income tax benefit (expense) |
230,429 | ||||||||||||
Income (loss) from continuing operations |
$ | (1,429,153 | ) | ||||||||||
Year Ended December 31, 2012 as Compared to the Year Ended December 31, 2011
Overview of Consolidated Financial Results of Continuing Operations
Our loss from continuing operations for the year ended December 31, 2012 was $1.1 billion, or $17.04 per diluted share, which compares to income of $363.6 million, or $6.00 per diluted share for the year ended December 31, 2011.
Revenues in 2012 decreased $171.5 million, or 6.7% from 2011 due to lower global coal pricing on both metallurgical and thermal coals, partially offset by the impact of a full year of revenue from the Western Coal acquisition compared to only nine months in 2011 and increased sales volume at our legacy Alabama mines.
66
Cost of sales, exclusive of depreciation and depletion, increased $235.9 million to $1.8 billion in 2012 as compared to 2011, primarily due to the impact of a full year of results from the acquired Western Coal operations compared to only nine months for the prior year. Cost of sales also increased due to the acquisition of the North River mine in May of 2011. Cost of sales from these acquired operations was $857.7 million and $700.3 million during the years ended December 31, 2012 and 2011, respectively. Excluding the impact of the timing of acquisitions, the increase in cost of sales was primarily due to increased sales volumes.
Depreciation and depletion expense in 2012 increased $85.6 million as compared to 2011 primarily due to the impact of a full year of results from the acquired Western Coal operations compared to only nine months for the prior year. The increase was also due to a full year of the North River mining operations in our U.S. segment compared to only eight months in the prior year. Depreciation and depletion from these acquired operations was $185.1 million during the year ended December 31, 2012, an increase of $74.7 million from the prior year comparable period.
Selling, general & administrative expenses includes costs for corporate and direct administrative functions not directly assignable to an individual mine. Selling, general & administrative expenses decreased $32.3 million for the year ended December 31, 2012 as compared to 2011. The decrease was primarily attributable to a decrease of $23.2 million of costs incurred in 2011 associated with the acquisition of Western Coal combined with cost savings derived from integrating the operations, offset in part by a full year of expenses associated with these operations.
The Company performed an interim goodwill impairment test as of July 31, 2012 and recorded a goodwill impairment charge of $1.1 billion to reduce the carrying value of goodwill to its implied fair value for two reporting units in the U.S. Operations segment and two reporting units in the Canadian and U.K. Operations segment. The Company also recorded an impairment charge of $40 million associated with the impairment of a capitalized shale natural gas exploratory project during the third quarter of 2012. Further, in connection with plans to reduce development spending at the Aberpergwm underground coal mine in the fourth quarter of 2012, the Company recorded a restructuring and asset impairment charge of $9.1 million, of which $6.0 million related to severance and other obligations and $3.1 million related to the impairment of property, plant and equipment as the carrying values of certain assets exceeded their fair value.
The $13.1 million other loss for the year ended December 31, 2012 is primarily attributable to losses on the sale and remeasurement to fair value of equity investments acquired through the Western Coal acquisition. Other income of $17.6 million for the year ended December 31, 2011 was primarily attributable to a gain of $20.5 million recognized on April 1, 2011 as a result of remeasuring to fair value the Western Coal shares acquired from Audley Capital in January 2011, partially offset by a net loss on the sale and remeasurement to fair value of other equity investments that were acquired through the Western Coal acquisition.
Interest expense, net of interest income was $138.6 million in 2012, an increase of $42.3 million compared to 2011. The increase reflects a full year of interest on borrowings of $2.35 billion on April 1, 2011 to fund a portion of the Western Coal acquisition as well as an increase in interest rates in the fourth quarter of 2012 due to the Third Amendment to the Credit Agreement combined with interest on the 2020 Notes issued on November 21, 2012.
The Company recognized an income tax benefit of $99.2 million for the year ended December 31, 2012, compared to a tax provision of $131.2 million for the year ended December 31, 2011. The 2012 income tax benefit as compared to expense in 2011 was primarily due to the pretax operating loss for 2012 as compared to the pretax operating income for the same period in 2011. The level of ordinary income in 2012 decreased substantially from 2011, leading to income tax benefits in excess of income tax expense. The 2012 and 2011 effective rates also reflect the benefit of our Canadian and U.K. operations which are taxed at statutory rates lower than the statutory U.S. rate, and the benefits of tax
67
losses in excess of losses from continuing operations related to foreign financing activities. Additionally, the Company recorded an impairment charge of $1.1 billion of nondeductible goodwill in 2012. See Note 4 of "Notes to Consolidated Financial Statements" included in this Form 10-K for further discussion.
The current and prior year results also included the effect of the factors discussed in the following segment analysis.
Segment Analysis
U.S. Operations
Hard coking coal sales totaled 6.7 million metric tons in 2012, an increase of 18.6% as compared to 5.7 million metric tons during 2011. The average selling price of hard coking coal in 2012 was $191.87 per metric ton, a 19.5% decrease as compared to an average selling price of $238.27 per metric ton in 2011. The decrease in the average selling price of hard coking coal reflects the weak global economy and the resulting decrease in demand for hard coking coal. Hard coking coal production totaled 7.0 million metric tons in 2012, representing an increase of 17.8% as compared to 2011, primarily due to increased production at the Alabama underground mines.
Thermal coal sales totaled 3.2 million metric tons in 2012 as compared to 3.7 million metric tons during 2011. The decrease was primarily due to decreased thermal coal sales at our West Virginia operations as we idled a thermal coal surface mine in response to softening demand. The average selling price in 2012 was $67.79 per metric ton, down 4.2% from the average selling price of $70.78 per metric ton in 2011. Lower average pricing also reflected the impact of a full year of lower prices for tons sold by the North River mine. Thermal coal production totaled 3.1 million metric tons in 2012, as compared to 3.4 million metric tons in 2011.
Statistics for U.S. Operations are presented in the following table:
| |
For the year ended December 31, |
||||||
|---|---|---|---|---|---|---|---|
| |
2012 | 2011 | |||||
Tons of hard coking coal sold(1) (in thousands) |
6,705 | 5,655 | |||||
Tons of hard coking coal produced (in thousands) |
6,956 | 5,905 | |||||
Average hard coking coal selling price(1) (per metric ton) |
$ | 191.87 | $ | 238.27 | |||
Tons of thermal coal sold (in thousands) |
3,235 | 3,673 | |||||
Tons of thermal coal produced (in thousands) |
3,081 | 3,443 | |||||
Average thermal coal selling price (per metric ton) |
$ | 67.79 | $ | 70.78 | |||
- (1)
- Includes sales of both coal produced and purchased coal.
Our U.S. Operations segment reported revenues of $1.7 billion in 2012, a decrease of $142.8 million from 2011. The decrease in revenues was attributable to lower average selling prices for both hard coking coal and thermal coal, partially offset by increased hard coking coal sales volumes primarily due to a full year of sales volume from the West Virginia and North River mining operations acquired in the second quarter of 2011. The decrease in average selling prices reflects the weak global economy.
Cost of sales, exclusive of depreciation and depletion, increased $102.5 million to $1.2 billion during the year ended December 31, 2012 as compared to the same period in 2011. The increase in cost of sales was primarily a result of an increase in hard coking coal sales volume and a full year of cost of sales from the West Virginia and North River mining operations. Cost of sales related to these acquired operations were $215.7 million and $191.1 million during the years ended December 31, 2012 and 2011, respectively.
68
U.S. Operations reported operating income of $188.7 million in 2012, as compared to $561.4 million in 2011. The $372.7 million decrease in operating income was primarily due to a goodwill impairment charge of $74.3 million and an impairment of a capitalized shale natural gas exploratory project of $40.0 million coupled with lower average hard coking coal and thermal coal selling prices and increased cost of sales as a result of increased sales volumes.
Canadian and U.K. Operations
The Canadian and U.K. Operations segment was acquired during the second quarter of 2011 as part of the Western Coal acquisition. Metallurgical coal sales for the year ended December 31, 2012 totaled 1.7 million metric tons of hard coking coal at an average selling price of $202.79 per metric ton and 2.0 million metric tons of low-volatile PCI coal at an average selling price of $160.00 per metric ton. Metallurgical coal sales for the year ended December 31, 2011 totaled 1.3 million metric tons of hard coking coal at an average selling price of $263.44 per metric ton and 1.7 million metric tons of low-volatile PCI coal at an average selling price of $210.40 per metric ton. The increase in sales volumes was primarily due to a full year of sales volume from these operations compared to only nine months for the prior year. The decrease in the average selling price of metallurgical coal was due to weaker worldwide demand.
The Canadian and U.K. Operations segment produced a total of 2.0 million metric tons of hard coking coal and 2.5 million metric tons of low-volatile PCI coal for the year ended December 31, 2012. During the year ended December 31, 2011, the Canadian and U.K. Operations segment produced 1.1 million metric tons of hard coking coal and 1.8 million metric tons of low-volatile PCI coal. The increase in production volumes was primarily due to the impact of a full year of production volume from these operations acquired through the Western Coal acquisition compared to only nine months for the prior year coupled with significant improvements in productivity at both the Wolverine and Brule mines. Due to the strong production of these operations combined with the weak market demand, beginning in the third quarter, we reduced production at two of our three Canadian mines and made plans to reduce inventory while we await better market conditions. We also are taking steps to restrain spending in our Canadian and U.K. Operations segment and significantly reduced development spending in the Aberpergwm mine in the U.K. until market conditions improve.
Statistics for Canadian and U.K. Operations are presented in the following table:
| |
For the year ended December 31, |
||||||
|---|---|---|---|---|---|---|---|
| |
2012 | 2011 | |||||
Tons of hard coking coal sold(1) (in thousands) |
1,662 | 1,321 | |||||
Tons of hard coking coal produced (in thousands) |
2,039 | 1,109 | |||||
Average hard coking coal selling price(1) (per metric ton) |
$ | 202.79 | $ | 263.44 | |||
Tons of low-volatile PCI coal sold (in thousands) |
2,011 | 1,732 | |||||
Tons of low-volatile PCI coal produced (in thousands) |
2,491 | 1,826 | |||||
Average low-volatile PCI coal selling price (per metric ton) |
$ | 160.00 | $ | 210.40 | |||
Tons of thermal coal sold (in thousands) |
63 | 94 | |||||
Tons of thermal coal produced (in thousands) |
63 | 91 | |||||
Average thermal coal selling price (per metric ton) |
$ | 122.71 | $ | 112.95 | |||
- (1)
- Includes sales of both coal produced and purchased coal.
Our Canadian and U.K. Operations segment reported revenues of $668.3 million in 2012, a decrease of $29.7 million from 2011 reported revenues of $698.1 million. The decrease in the Canadian and U.K. Operations segment reported revenues was due to lower average selling prices for both hard coking coal and low-volatile PCI coal, partially offset by increased sales volumes.
69
Cost of sales, exclusive of depreciation and depletion, increased $132.8 million to $642.0 million during the year ended December 31, 2012 as compared to $509.2 million for the year ended December 31, 2011. The increase in cost of sales was primarily attributable to an increase in sales volume primarily due to the inclusion of a full year of results from these operations acquired through the Western Coal acquisition compared to only nine months included within the prior year.
Our Canadian and U.K. Operations segment reported an operating loss of $1.2 billion for the year ended December, 2012 as compared to operating income of $86.5 million for the year ended December 31, 2011. The $1.2 billion decrease in operating income was primarily due to a goodwill impairment charge of $990.1 million and asset impairment and restructuring charges of $9.1 million for the year ended December 31, 2012, coupled with lower average hard coking coal and low-volatile PCI coal prices, in some cases to a point below cost.
2011 Summary Operating Results
| |
For the Year Ended December 31, 2011 | ||||||||||||
|---|---|---|---|---|---|---|---|---|---|---|---|---|---|
(in thousands)
|
U.S. Operations | Canadian and U.K. Operations |
Other | Total | |||||||||
Sales |
$ | 1,850,015 | $ | 711,322 | $ | 988 | $ | 2,562,325 | |||||
Miscellaneous income (loss) |
21,167 | (13,268 | ) | 1,134 | 9,033 | ||||||||
Revenues |
1,871,182 | 698,054 | 2,122 | 2,571,358 | |||||||||
Cost of sales (exclusive of depreciation and depletion) |
1,050,743 | 509,213 | 1,156 | 1,561,112 | |||||||||
Depreciation and depletion |
155,702 | 74,203 | 776 | 230,681 | |||||||||
Selling, general and administrative |
61,622 | 28,100 | 76,027 | 165,749 | |||||||||
Postretirement benefits |
41,745 | — | (1,360 | ) | 40,385 | ||||||||
Operating income (loss) |
$ | 561,370 | $ | 86,538 | $ | (74,477 | ) | 573,431 | |||||
Interest expense, net |
(96,214 | ) | |||||||||||
Other income, net |
17,606 | ||||||||||||
Income tax expense |
(131,225 | ) | |||||||||||
Income from continuing operations |
$ | 363,598 | |||||||||||
| |
For the Year Ended December 31, 2010 | ||||||||||||
|---|---|---|---|---|---|---|---|---|---|---|---|---|---|
(in thousands)
|
U.S. Operations | Canadian and U.K. Operations |
Other | Total | |||||||||
Sales |
$ | 1,569,939 | $ | — | $ | 906 | $ | 1,570,845 | |||||
Miscellaneous income |
14,795 | — | 2,090 | 16,885 | |||||||||
Revenues |
1,584,734 | — | 2,996 | 1,587,730 | |||||||||
Cost of sales (exclusive of depreciation and depletion) |
766,279 | — | 237 | 766,516 | |||||||||
Depreciation and depletion |
98,170 | — | 532 | 98,702 | |||||||||
Selling, general and administrative |
42,615 | — | 44,357 | 86,972 | |||||||||
Postretirement benefits |
43,228 | — | (1,750 | ) | 41,478 | ||||||||
Operating income (loss) |
$ | 634,442 | $ | — | $ | (40,380 | ) | 594,062 | |||||
Interest expense, net |
(16,466 | ) | |||||||||||
Income tax expense |
(188,171 | ) | |||||||||||
Income from continuing operations |
$ | 389,425 | |||||||||||
70
| |
Increase (Decrease) for the Year Ended December 31, 2011 | ||||||||||||
|---|---|---|---|---|---|---|---|---|---|---|---|---|---|
(in thousands)
|
U.S. Operations | Canadian and U.K. Operations |
Other | Total | |||||||||
Sales |
$ | 280,076 | $ | 711,322 | $ | 82 | $ | 991,480 | |||||
Miscellaneous income (loss) |
6,372 | (13,268 | ) | (956 | ) | (7,852 | ) | ||||||
Revenues |
286,448 | 698,054 | (874 | ) | 983,628 | ||||||||
Cost of sales (exclusive of depreciation and depletion) |
284,464 | 509,213 | 919 | 794,596 | |||||||||
Depreciation and depletion |
57,532 | 74,203 | 244 | 131,979 | |||||||||
Selling, general and administrative |
19,007 | 28,100 | 31,670 | 78,777 | |||||||||
Postretirement benefits |
(1,483 | ) | — | 390 | (1,093 | ) | |||||||
Operating income (loss) |
$ | (73,072 | ) | $ | 86,538 | $ | (34,097 | ) | (20,631 | ) | |||
Interest expense, net |
(79,748 | ) | |||||||||||
Other income, net |
17,606 | ||||||||||||
Income tax expense |
56,946 | ||||||||||||
Income from continuing operations |
$ | (25,827 | ) | ||||||||||
Year Ended December 31, 2011 as Compared to the Year Ended December 31, 2010
Overview of Consolidated Financial Results of Continuing Operations
Our income from continuing operations for the year ended December 31, 2011 was $363.6 million or $6.00 per diluted share, which compares to $389.4 million, or $7.25 per diluted share for the year ended December 31, 2010.
Revenues in 2011 increased $983.6 million, or 62.0% from 2010. The increase in revenues was primarily attributable to the addition of the Canadian and U.K. Operations segment and the West Virginia and North River mining operations within our U.S. Operations segment. These recently acquired operations contributed $942.6 million of the increase. The remainder of the increase was driven by higher hard coking coal pricing from our U.S. Operations, partially offset by lower hard coking coal sales volumes.
Cost of sales, exclusive of depreciation and depletion, increased $794.6 million to $1.6 billion in 2011 as compared to 2010, primarily as a result of the addition of the Canadian and U.K. Operations segment and the West Virginia and North River mining operations within our U.S. Operations segment, which accounted for 88.1% of the increase. The remainder of the increase was attributable to increased production costs at our Alabama underground mining operations, primarily due to difficult geological conditions, higher royalties and freight costs during 2011 as well as difficult weather conditions during the second quarter of 2011. Cost of sales, exclusive of depreciation and depletion, represented 60.7% of revenues in 2011 versus 48.3% of revenues for 2010.
Depreciation and depletion expense in 2011 increased $132.0 million as compared to 2010. The addition of the Canadian and U.K. Operations segment and the West Virginia and North River mining operations in our U.S. Operations segment represents $110.5 million of the increase. The remainder of the increase is primarily due to higher depreciation and depletion in our U.S. Operations resulting from the acquisition of the Walter Black Warrior Basin coal bed methane operations on May 28, 2010.
Selling, general & administrative expenses includes costs for corporate and direct administrative functions not directly assignable to an individual mine. Selling, general & administrative expenses increased $78.8 million, or 90.6%, from 2010 primarily attributable to $48.4 million due to the addition of the Canadian and U.K. Operations segment and the West Virginia and North River mining operations in our U.S. Operations segment. The remainder of the increase was primarily attributable to $23.2 million of costs associated with the acquisition of Western Coal and increases in professional fees.
71
Other income for the year ended December 31, 2011 is primarily attributable to a gain of $20.5 million recognized on April 1, 2011 as a result of remeasuring to fair value the Western Coal shares acquired from Audley Capital in January 2011, partially offset by a net loss on the sale and remeasurement to fair value of other equity investments.
Interest expense, net of interest income was $96.2 million in 2011, an increase of $79.7 million compared to 2010. The increase reflects interest on borrowings of $2.35 billion on April 1, 2011 to fund a portion of the Western Coal acquisition.
Our effective tax rate for 2011 and 2010 was 26.5% and 32.6%, respectively. Our effective tax rate for 2011 declined primarily due to certain undistributed foreign earnings for which no U.S. taxes are provided because such earnings are intended to be indefinitely reinvested outside of the U.S. In addition, the tax expense for 2010 included a one-time tax charge of $20.7 million related to the elimination of the favorable tax treatment of Medicare Part D subsidies due to the passage of the Health Care Reform Act in March 2010, as well as a one-time tax benefit of $17.4 million related to nonconventional fuel source credits for our Walter Coke operations for the years 2006 through 2009.
Segment Analysis
U.S. Operations
Our U.S. Operations segment reported revenues of $1.9 billion in 2011, an increase of $286.4 million from 2010. The increase in revenues was primarily due to the addition of the West Virginia and North River mining operations acquired in the second quarter of 2011 which added $244.5 million in revenues to the segment, however at lower gross margins than those of the legacy operations. Increased revenues were also due to higher average selling prices for hard coking coal, partially offset by lower hard coking coal sales volumes. The lower hard coking coal sales volumes in 2011 as compared to 2010 reflects lower production at our Alabama underground mines due to geology issues during 2011 and weather related issues in the second quarter of 2011. Statistics for U.S. Operations are presented in the following table:
| |
For the year ended December 31, |
||||||
|---|---|---|---|---|---|---|---|
| |
2011 | 2010 | |||||
Average hard coking coal selling price(1) (per metric ton) |
$ | 238.27 | $ | 200.28 | |||
Tons of hard coking coal sold(1) (in thousands) |
5,655 | 6,270 | |||||
Average thermal coal selling price(1) (per metric ton) |
$ | 70.78 | $ | 83.24 | |||
Tons of thermal coal sold(1) (in thousands) |
3,673 | 1,077 | |||||
- (1)
- Includes sales of both coal produced and purchased coal.
U.S. Operations reported operating income of $561.4 million in 2011, as compared to $634.4 million in 2010. The $73.1 million decrease in operating income was primarily due to the increase in cost of sales, a higher mix of lower margin thermal coal sales, and increased depreciation and depletion and selling, general and administrative expenses associated with the recently acquired North River and West Virginia operations. Cost of sales increased as a result of increased production costs at our Alabama underground operations primarily due to difficult geological conditions and higher thermal coal sales volumes as well as higher royalty and freight costs.
Canadian and U.K. Operations
Results for 2011 represent the results of the segment since the April 1, 2011 date of acquisition. The segment reported revenues of $698.1 million and operating income of $86.5 million.
Results for 2011 were adversely impacted by challenging weather conditions during the second quarter and their lingering effects during the third quarter, delays in the issuance of mining permits at
72
the Willow Creek mine, delays in the commissioning of the Falling Creek connector road and higher mining ratios at our Northeast British Columbia mining operations. These conditions and delays impacted sales and production volumes during the year as well as production and transportation costs. Cost of sales during the fourth quarter for hard coking coal was negatively impacted by purchased coal related to the Ridley terminal upgrade. Fourth quarter cost of sales for PCI coal was also negatively impacted by our expediting the migration from a contractor base to owner base for our Willow Creek mine workers. Although this move will help lower overall future costs, it caused some short term increases as we prepared for the move. Statistics for Canadian and U.K. Operations are presented in the following table:
| |
For the year ended December 31, |
|||
|---|---|---|---|---|
| |
2011 | |||
Average hard coking coal selling price (per metric ton)(1) |
$ | 262.67 | ||
Tons of hard coking coal sold (in thousands)(1) |
1,321 | |||
Average low-volatile PCI coal selling price (per metric ton) |
$ | 211.34 | ||
Tons of low-volatile PCI coal sold (in thousands) |
1,732 | |||
Average thermal coal selling price (per metric ton) |
$ | 119.03 | ||
Tons of thermal coal sold (in thousands) |
94 | |||
- (1)
- Includes sales of both coal produced and purchased coal.
FINANCIAL CONDITION
Cash and cash equivalents decreased by $11.8 million to $116.6 million at December 31, 2012 from $128.4 million at December 31, 2011, primarily resulting from the use of cash during 2012 for capital expenditures of $391.5 million, $343.3 million of principal payments on our 2011 term loans in advance of scheduled maturity, $39.5 million of principal payments on capital lease obligations and dividends paid of $31.2 million. Offsetting these uses of cash was $329.9 million in cash flows provided by operating activities during 2012 and proceeds of $496.5 million related to the issuance of our 2020 Notes. See additional discussion in the Statement of Cash Flows section that follows.
Net receivables were $257.0 million at December 31, 2012, a decrease of $56.4 million from December 31, 2011 primarily attributable to a decline in the average net selling price per metric ton of our hard coking and PCI coals.
Inventories increased by $65.6 million at December 31, 2012 as compared to December 31, 2011 primarily due to increased production volumes coupled with decreased sales volumes.
Net property, plant and equipment increased by $100.8 million at December 31, 2012 as compared to December 31, 2011, primarily due to capital expenditures during 2012 of $391.5 million, partially offset by depreciation expense.
Accrued expenses were $184.9 million at December 31, 2012, a decrease of $44.2 million from December 31, 2011, primarily due to reduced capital spending resulting in lower capital accruals at year end.
The long-term portion of the accumulated postretirement benefits obligation was $633.3 million at December 31, 2012, up $82.6 million from $550.7 million at December 31, 2011. The increase was primarily attributed to a decrease in the discount rate offset by a decrease in health care cost trend rates. This adjustment is recognized as a corresponding decrease to stockholders' equity.
Other current liabilities and other long-term liabilities were $206.5 million and $251.3 million, respectively, at December 31, 2012 an increase and decrease of $142.7 million and $130.3 million, respectively, from December 31, 2011 primarily due to the reclassification of approximately $153.0 million in accrued interest, penalties, and liabilities related to uncertain tax positions from other long-term liabilities to other current liabilities. See Note 11 of "Notes to Consolidated Financial Statements" included in this Form 10-K for further discussion.
73
LIQUIDITY AND CAPITAL RESOURCES
Overview
Our principal sources of short-term funding are our existing cash balances, operating cash flows and borrowings under our revolving credit facility. Our principal sources of long-term funding are our bank term loans entered into on April 1, 2011 and our senior notes issued on November 21, 2012, as discussed below. Our available liquidity as of December 31, 2012 was $445 million, consisting of cash and cash equivalents of $117 million and $328 million available under the Company's $375 million revolving credit facility, net of outstanding letters of credit of $47 million.
We were in compliance with all covenants under our Credit Agreement and the indenture governing our notes as of December 31, 2012. If operating results fall below our fiscal year 2012 results or other adverse factors occur, they could result in our being unable to comply with covenants in our Credit Agreement. A breach of covenants in the Credit Agreement, including the covenants that stipulate ratios based on Adjusted EBITDA, could result in a default under the Credit Agreement and the lenders thereunder could elect to declare all amounts borrowed due and payable. Any acceleration under the Credit Agreement could result in a default under the indenture governing our notes.
Based on current forecasts and anticipated market conditions, we believe that funding provided by operating cash flows and available sources of liquidity will be sufficient to meet substantially all of our operating needs, to make planned capital expenditures and to make all required interest and principal payments on indebtedness for the next twelve to eighteen months. However, our operating cash flows and liquidity are significantly influenced by numerous factors including prices of coal, coal production, costs of raw materials, interest rates and the general economy. Although we have observed recent improvement in the market for our products, renewed deterioration of economic conditions or deteriorating mining conditions could adversely impact our operating cash flows. Additionally, although financial market conditions have improved, there remains volatility and uncertainty, limited availability of credit, potential counterparty defaults, sovereign credit concerns and commercial and investment bank stress. While we have no indication that the uncertainty in the financial markets would impact our current credit facility or current credit providers, the possibility does exist.
Senior Notes
On November 21, 2012, we issued $500.0 million in aggregate principal amount of 9.875% senior notes due December 15, 2020 (the "2020 Notes") at an initial price of 99.302% of their face amount. The 2020 Notes are unconditionally guaranteed, jointly and severally, on an unsecured basis, by each of our current and future wholly-owned domestic restricted subsidiaries. Interest on the 2020 Notes accrues at the rate of 9.875% per year and is payable semi-annually in arrears on June 15 and December 15, beginning on June 15, 2013. We may redeem the 2020 Notes, in whole or in part, at any time prior to December 15, 2016, at a price equal to 100.000% of the aggregate principal amount of the 2020 Notes plus a "make-whole" premium, plus accrued and unpaid interest, if any, to but not including the applicable redemption date. We may redeem the 2020 Notes, in whole or in part, at any time during the twelve months commencing December 15, 2016, at 104.938% of the aggregate principal amount of the 2020 Notes, at any time during the twelve months commencing December 15, 2017, at 102.469% of the aggregate principal amount of the 2020 Notes, and at any time after December 15, 2018, at 100.000% of the aggregate principal amount of the 2020 Notes, in each case plus accrued and unpaid interest, if any, to but not including the applicable redemption date.
As market conditions warrant, we may from time to time repurchase our debt securities in privately negotiated transactions, in open market purchases, by tender offer or otherwise.
74
2011 Credit Agreement
On April 1, 2011, we entered into a $2.725 billion credit agreement (the "2011 Credit Agreement") to partially fund the acquisition of Western Coal and to pay off all outstanding loans under the 2005 Credit Agreement. The 2011 Credit Agreement consists of (1) a $950.0 million principal amortizing term loan A facility maturing in April 2016, at which time the remaining outstanding principal is due, (2) a $1.4 billion principal amortizing term loan B facility maturing in April 2018, at which time the remaining outstanding principal is due and (3) a $375.0 million multi-currency revolving credit facility ("Revolver") maturing in April 2016, at which time any remaining balance is due. The Revolver provides for operational needs and letters of credit. Our obligations under the 2011 Credit Agreement are secured by our domestic and foreign real, personal and intellectual property. The 2011 Credit Agreement contains customary events of default and covenants, including among other things, covenants that do not prevent but restrict us and our subsidiaries' ability to incur certain additional indebtedness, create or permit liens on assets, pay dividends and repurchase stock, engage in mergers or acquisitions, and make investments and loans. The 2011 Credit Agreement also includes certain financial covenants that must be maintained.
First Amendment
On January 20, 2012, the Company entered into an amendment (the "First Amendment") to the 2011 Credit Agreement among the Company, the various lenders, and Morgan Stanley Senior Funding, Inc. as administrative agent. The First Amendment provides for, among other things, an increase in the Revolver sublimit in Canada from $150 million to $275 million.
Second Amendment
On August 16, 2012, the Company entered into an amendment (the "Second Amendment") to the 2011 Credit Agreement among the Company, the various lenders, and Morgan Stanley Senior Funding, Inc. as administrative agent, and other agents named therein, which provided, among other things:
- •
- interest margins on the loans under the Credit Agreement increased by 0.25% once the total leverage ratio of the Company
is greater than 3.25:1;
- •
- the Company may subtract from total indebtedness, all unrestricted cash and cash equivalents in calculating its total
leverage ratio;
- •
- the Company may incur secured notes in lieu of secured credit facilities under the Company's incremental facility;
- •
- increased the general investment basket to $325 million; and
- •
- the total leverage ratio covenant was made less restrictive, beginning with the fiscal quarter ended September 30, 2012 and each fiscal quarter thereafter for the remaining term of the Credit Agreement.
Third Amendment
On October 29, 2012, the Company entered into another amendment (the "Third Amendment") to the 2011 Credit Agreement, as amended, among the Company, the various lenders, Morgan Stanley Senior Funding, Inc. as administrative agent, and other agents named therein, which provides, among other things:
- •
- interest margins on the loans under the Credit Agreement increased by 1.25-1.50% from their existing levels and the leverage ratios at which the interest rate margins step down was increased;
75
- •
- permitted acquisitions and unlimited unsecured debt are subject to compliance with a 4.50:1.0 total leverage ratio;
- •
- additional flexibility to incur up to an additional $1 billion of senior unsecured notes (of which we have secured
$500 million in November 2012); provided that a minimum of 50% of the proceeds from any such offering are used to repay the term loans under the 2011 Credit Agreement, as amended; and
- •
- total leverage ratio covenant and the interest coverage covenant levels were modified.
The Revolver, term loan A and term loan B interest rates are tied to the London Interbank Offer Rate ("LIBOR") or the Canadian Dealer Offered Rate ("CDOR"), plus a credit spread ranging from 350 to 450 basis points for the Revolver and term loan A, and 475 basis points on the term loan B, adjusted quarterly based on our total leverage ratio as defined by the 2011 Credit Agreement. The term loan B has a minimum LIBOR floor of 1.0%. The Revolver loans can be denominated in either U.S. dollars or Canadian dollars at our option. The commitment fee on the unused portion of the Revolver is 0.5% per year for all pricing levels.
As of December 31, 2012, borrowings under the 2011 Credit Agreement consisted of a term loan A balance of $757.0 million with a weighted average interest rate of 4.82%, a term loan B balance of $1.128 billion with a weighted average interest rate of 5.75% and no borrowings under the Revolver, with $46.8 million in outstanding stand-by letters of credit and $328.2 million of availability for future borrowings. On June 28, 2012 and November 21, 2012, the Company prepaid $100 million and $243 million, respectively, of the outstanding principal balances of the term loans. As a result of these prepayments, the remaining balance of the term loan B facility is due upon maturity.
Statements of Cash Flows
Cash balances were $116.6 million and $128.4 million at December 31, 2012 and December 31, 2011, respectively. The decrease in cash during the year ended December 31, 2012 of $11.8 million primarily resulted from capital expenditures of $391.5 million, $343.3 million of principal payments on our 2011 term loans, $39.5 million of principal payments on capital lease obligations and dividends paid of $31.2 million, partially offset by $496.5 million of cash proceeds from the issuance of the 2020 Notes and cash provided by operating activities of $329.9 million.
The following table sets forth, for the periods indicated, selected consolidated cash flow information (in thousands):
| |
For the years ended December 31, |
||||||
|---|---|---|---|---|---|---|---|
| |
2012 | 2011 | |||||
Cash flows provided by operating activities |
$ | 329,907 | $ | 706,866 | |||
Cash flows used in investing activities |
(377,375 | ) | (2,840,660 | ) | |||
Cash flows provided by financing activities |
27,155 | 1,971,947 | |||||
Cash flows provided by discontinued operations |
9,500 | — | |||||
Effect of foreign exchange rates on cash |
(1,016 | ) | (3,668 | ) | |||
Cash flows used in continuing operations |
(11,829 | ) | (165,515 | ) | |||
Add: Cash and cash equivalents of discontinued operations at beginning of year |
— | 535 | |||||
Net decrease in cash and cash equivalents |
$ | (11,829 | ) | $ | (164,980 | ) | |
Net cash provided by operating activities of continuing operations was $329.9 million for the year ended December 31, 2012 as compared to $706.9 million for 2011, representing a decrease of $377.0 million. Exclusive of goodwill impairment and restructuring charges, the decrease in income from
76
continuing operations as compared to 2011 was $332.9 million. The increases in inventories and deferred income tax credits were substantially offset by increases in current liabilities.
Cash flows used in investing activities for the year ended December 31, 2012 were $377.4 million as compared to $2.8 billion for 2011. The decrease in cash flows used in investing activities of $2.5 billion was primarily attributable to $2.4 billion of cash used in the acquisition of Western Coal during the second quarter of 2011.
Cash flows provided by financing activities for the year ended December 31, 2012 were $27.2 million as compared to $2.0 billion for the same period in 2011. The decrease in cash flows provided by financing activities of $1.9 billion was primarily attributable to $2.4 billion of proceeds under the 2011 Credit Agreement to fund a portion of the Western Coal acquisition, offset by proceeds of $496.5 million from the issuance of the 2020 Notes in 2012.
Capital Expenditures
Capital expenditures totaled $391.5 million for the year ended December 31, 2012. For 2013, we currently expect to reduce capital expenditures to approximately $220 million with reductions in project spending and greater efficiencies in maintenance capital.
Contractual Obligations and Commercial Commitments
We have certain contractual obligations and commercial commitments. Contractual obligations are those that will require cash payments in accordance with the terms of a contract, such as a borrowing or lease agreement. Commercial commitments represent potential obligations for performance in the event of demands by third parties or other contingent events, such as lines of credit or guarantees of debt.
The following table summarizes our contractual obligations and commercial commitments as of December 31, 2012 (in thousands)(5):
| |
|
Payments Due by Period | ||||||||||||||||||||
|---|---|---|---|---|---|---|---|---|---|---|---|---|---|---|---|---|---|---|---|---|---|---|
| |
Total | 2013 | 2014 | 2015 | 2016 | 2017 | Thereafter | |||||||||||||||
2011 credit agreement(1) |
$ | 2,322,765 | $ | 102,638 | $ | 177,878 | $ | 602,875 | $ | 229,880 | $ | 65,379 | $ | 1,144,115 | ||||||||
9.875% senior notes |
890,200 | 49,375 | 49,375 | 49,375 | 49,375 | 49,375 | 643,325 | |||||||||||||||
Other debt(2) |
34,911 | 18,793 | 10,090 | 5,948 | 80 | — | — | |||||||||||||||
Operating leases |
31,895 | 12,812 | 9,051 | 3,068 | 2,647 | 2,551 | 1,766 | |||||||||||||||
Long-term purchase obligations(3) |
555,880 | 139,146 | 104,066 | 96,332 | 88,180 | 41,393 | 86,763 | |||||||||||||||
Capital expenditure obligations |
6,290 | 4,793 | 1,497 | — | — | — | — | |||||||||||||||
Total contractual cash obligations |
3,841,941 | 327,557 | 351,957 | 757,598 | 370,162 | 158,698 | 1,875,969 | |||||||||||||||
Other long-term liabilities(4) |
406,352 | 37,595 | 38,579 | 38,821 | 39,456 | 39,885 | 212,016 | |||||||||||||||
Total cash obligations |
$ | 4,248,293 | $ | 365,152 | $ | 390,536 | $ | 796,419 | $ | 409,618 | $ | 198,583 | $ | 2,087,985 | ||||||||
- (1)
- As of December 31, 2012, we had $1.9 billion outstanding under the 2011 Credit Agreement. Interest on the debt is tied to LIBOR or the Canadian Dealer Offered Rate ("CDOR"), plus a credit spread ranging from 350 to 450 basis points for the Revolver and term loan A, and 475 basis points on the term loan B adjusted quarterly based on our total leverage ratio as defined by the 2011 Credit Agreement. Future interest obligations on the debt were calculated based on the interest rates in effect as of December 31, 2012. See Note 14 of "Notes to Consolidated Financial Statements" for further discussion of the 2011 Credit Agreement.
77
- (2)
- Primarily
includes capital lease obligations and equipment financing agreements. See Note 18 of "Notes to Consolidated Financial Statements" for
further discussion regarding capital lease obligations.
- (3)
- Represents
minimum throughput and royalty obligations and minimum maintenance payments due for assets under capital lease.
- (4)
- Other
long-term liabilities include workers' compensation and black lung obligations as well as postretirement benefit liabilities. See the
section "Critical Accounting Policies and Estimates" for further discussion regarding these obligations.
- (5)
- The
table above excludes certain other obligations including estimated funding for our pension plans and asset retirement obligations, as discussed in the
section "Critical Accounting Policies and Estimates". The timing of contributions to our pension plans varies as pension contributions depend on government-mandated minimum funding requirements. Our
minimum pension plan funding requirement for 2013 is approximately $1.0 million. Our asset retirement obligations are recognized at fair value in the period in which they are incurred and the
carrying amount of the related long-lived asset is correspondingly increased. Over time, the liability is accreted to its future value and the corresponding asset cost is amortized over
the useful life of the asset. At December 31, 2012, we had recorded asset retirement obligation liabilities of $89.5 million, including amounts reported as current. See the "Notes to
Consolidated Financial Statements" for further information regarding these obligations.
The timing of cash outflows related to liabilities for uncertain tax positions, and the interest thereon, as established pursuant to ASC Topic 740, "Income Taxes," cannot be estimated and, therefore, has not been included in the table. See Note 11 of "Notes to Consolidated Financial Statements."
Environmental, Miscellaneous Litigation and Other Commitments and Contingencies
See Note 18 of "Notes to Consolidated Financial Statements" for discussion of these matters not included in the tables above due to their contingent nature.
EBITDA
EBITDA from continuing operations is defined as earnings from continuing operations before interest expense, interest income, income taxes, and depreciation and depletion expense. EBITDA is defined as earnings before interest expense, interest income, income taxes, and depreciation and depletion expense. Adjusted EBITDA is defined as EBITDA further adjusted to exclude goodwill impairment and asset impairment and restructuring charges. EBITDA is a financial measure which is not calculated in conformity with GAAP and should be considered supplemental to, and not as a substitute or superior to financial measures calculated in conformity with GAAP. We believe that these non-GAAP measures provide additional insights into the performance of the Company, and they reflect how management analyzes Company performance and compares that performance against other companies. In addition, we believe that EBITDA is a useful measure as some investors and analysts use EBITDA to compare us against other companies and to help analyze our ability to satisfy principal and interest obligations and capital expenditure needs. EBITDA may not be comparable to similarly titled measures used by other entities. There may be additional or differing adjustments to Adjusted EBITDA under our agreements governing our material debt obligations.
78
Reconciliation of Income (Loss) from Continuing Operations to EBITDA and Adjusted EBITDA (in thousands):
| |
For the years ended December 31, |
||||||
|---|---|---|---|---|---|---|---|
| |
2012 | 2011 | |||||
Income (loss) from continuing operations |
$ | (1,065,555 | ) | $ | 363,598 | ||
Add: Interest expense |
139,356 | 96,820 | |||||
Less: Interest income |
(804 | ) | (606 | ) | |||
Add: Income tax expense (benefit) |
(99,204 | ) | 131,225 | ||||
Add: Depreciation and depletion expense |
316,232 | 230,681 | |||||
Earnings from continuing operations before interest, income taxes, and depreciation and depletion (EBITDA from continuing operations) |
(709,975 | ) | 821,718 | ||||
Add: Pretax income from discontinued operations |
8,282 | — | |||||
Earnings before interest, income taxes, and depreciation and depletion (EBITDA) |
(701,693 | ) | 821,718 | ||||
Add: Goodwill impairment charges |
1,064,409 | — | |||||
Add: Asset impairment and restructuring charges |
49,070 | — | |||||
Adjusted EBITDA |
$ | 411,786 | $ | 821,718 | |||
CRITICAL ACCOUNTING POLICIES AND ESTIMATES
The consolidated financial statements are prepared in conformity with U.S. GAAP, which require the use of estimates, judgments and assumptions that affect the reported amounts of assets and liabilities, the disclosure of contingent assets and liabilities at the date of the financial statements, and the reported amounts of revenues and expenses in the period presented. Management evaluates these estimates and assumptions on an ongoing basis, using historical experience, consultation with experts and other methods considered reasonable in the particular circumstances. Nevertheless, actual results may differ significantly from management's estimates.
We believe the following discussion addresses our most critical accounting estimates, which are those that are most important to the presentation of our financial condition and results of operations and require management's most difficult, subjective and complex judgments, often as a result of the need to make estimates about the effect of matters that are inherently uncertain. These estimates are based upon management's historical experience and on various other assumptions that we believe reasonable under the circumstances. Changes in estimates used in these and other items could have a material impact on our financial statements. Our significant accounting policies are described in Note 2 of the "Notes to our Consolidated Financial Statements" included in this Form 10-K.
Coal Reserves
There are numerous uncertainties inherent in estimating quantities and values of economically recoverable coal reserves, many of which are beyond our control. As a result, estimates of economically recoverable coal reserves are by their nature uncertain. Information about our reserves consists of estimates based on engineering, economic and geological data assembled by our internal engineers and geologists or third party consultants. A number of sources of information are used to determine accurate recoverable reserve estimates including:
- •
- geological conditions;
- •
- historical production from the area compared with production from other producing areas;
- •
- the assumed effects of regulations and taxes by governmental agencies;
79
- •
- previously completed geological and reserve studies;
- •
- assumptions governing future prices; and
- •
- future operating costs.
Reserve estimates will change from time to time to reflect, among other factors:
- •
- mining activities;
- •
- new engineering and geological data;
- •
- acquisition or divestiture of reserve holdings; and
- •
- modification of mining plans or mining methods.
Each of these factors may vary considerably from the assumptions used in estimating reserves. For these reasons, estimates of economically recoverable quantities of coal attributable to a particular group of properties, and classifications of these reserves based on risk of recovery and estimates of future net cash flows, may vary substantially. Actual production, revenues and expenditures with respect to reserves will likely vary from estimates and these variances may be material. Variances could affect our projected future revenues and expenditures, as well as the valuation of coal reserves and depletion rates. At December 31, 2012, our current operations had 401.0 million metric tons of proven and probable coal reserves.
Business Combinations
At the date of acquisition, we allocate the cost of a business acquisition to the specific tangible and intangible assets acquired and liabilities assumed based upon their relative fair values. Significant judgments and estimates are often made to determine these allocated values and may include the use of appraisals, consideration of market quotes for similar transactions, employment of discounted cash flow techniques or consideration of other information we believe relevant. The finalization of the purchase price allocation will typically take a number of months to complete and if final values are materially different from initially recorded amounts, adjustments are recorded.
Subsequent to the finalization of the purchase price allocation, any adjustments to the recorded values of acquired assets and liabilities would be reflected in the consolidated statement of operations. Once final, it is not permitted to revise the allocation of the original purchase price, even if subsequent events or circumstances prove the original judgments and estimates to be incorrect. In addition, long-lived assets like mineral interests, property, plant and equipment and goodwill may be deemed to be impaired in the future resulting in the recognition of an impairment loss. The assumptions and judgments made when recording business combinations will have an impact on reported results of operations for many years into the future.
Asset Retirement Obligations
Our asset retirement obligations primarily consist of spending estimates to reclaim surface lands and supporting infrastructure at both surface and underground mines in accordance with applicable reclamation laws in the U.S., Canada and U.K. as defined by each mining permit. Significant reclamation activities include reclaiming refuse piles and slurry ponds, reclaiming the pit and support acreage at surface mines, and sealing portals at underground mines. Asset retirement obligations are determined for each mine using various estimates and assumptions, including estimates of disturbed acreage as determined from engineering data, estimates of future costs to reclaim the disturbed acreage and the timing of related cash flows, discounted using a credit-adjusted, risk-free rate. On at least an annual basis, we review our entire asset retirement obligation liability and make necessary adjustment for permit changes, the anticipated timing of mine closures, and revisions to cost estimates and
80
productivity assumptions to reflect current experience. As changes in estimates occur, the carrying amount of the obligation and asset are revised to reflect the new estimate after applying the appropriate credit-adjusted, risk-free discount rate. If our assumptions differ from actual experience, or if changes in the regulatory environment occur, our actual cash expenditures and costs that we incur could be materially different than currently estimated. At December 31, 2012, we had recorded asset retirement obligation liabilities of $89.5 million, including amounts reported as current.
Pension and Other Postretirement Benefits
The Company sponsors multiple defined benefit pension plans and other postretirement plans that cover certain U.S. salaried employees and eligible hourly employees. Several statistical and other factors, which attempt to anticipate future events, are used in calculating the expense and liability related to the plans. Key factors include assumptions about the expected rates of return on plan assets, discount rates, and health care cost trend rates, as determined by the Company, within certain guidelines. The Company considers market conditions, including changes in investment returns and interest rates, in making these assumptions.
The Company determines the expected long-term rate of return on plan assets at the beginning of each fiscal year based on a building block method, which consists of aggregating the expected rates of return for each component of the plan's asset mix. Plan assets are comprised primarily of domestic large- and mid-cap funds, international funds and fixed income investments. The Company uses historic plan asset returns combined with current market factors such as inflation rates and interest rate levels. The expected rate of return on plan assets is a long-term assumption and generally does not change frequently. The long-term rate of return assumption used to determine net periodic benefit cost was 7.75% for the year ended December 31, 2012. Any difference between the actual experience and the assumed experience is recorded in other comprehensive income and amortized into expense in future periods.
The discount rate represents our estimate of the interest rate at which pension benefits could be effectively settled. Assumed discount rates are used in the measurement of the projected, accumulated and vested benefit obligations and the service and interest costs components of the net periodic benefit cost. In estimating that rate, we use a yield-curve approach which matches the expected cash flows to high quality corporate bonds available at the measurement date. The discount rate used to determine pension expense was 5.02% for 2012 and 5.30% for 2011. For the measurement of our 2012 year-end pension obligation and pension expense for 2013, we used a discount rate of 4.29%.
Key assumptions used in determining the amount of the obligation and expense recorded for other postretirement benefits other than pensions include the assumed discount rate and the assumed rate of increases in future health care costs. The discount rate is calculated in the same manner as discussed above for the pension plan. The discount rate used to calculate the postretirement benefit expense was 5.14% and 5.35% for 2012 and 2011, respectively. For the measurement of our 2012 year-end other postretirement benefits obligation and postretirement expense for 2013, we used a discount rate of 4.44%. In estimating the health care cost trend rate, the Company considers its actual health care cost experience, future benefit structures, industry trends and advice from its third-party actuaries. At December 31, 2012, the expected rate of increase in future health care costs was 7.50% for 2013, declining to 5.0% in 2019 and thereafter.
Assumed healthcare cost trend rates, discount rates, expected return on plan assets and salary increases have a significant effect on the amounts reported for the pension and healthcare plans. A
81
one-percentage-point change in the rate for each of these assumptions would have had the following effects as of and for the year ended December 31, 2012 (in thousands):
| |
Increase (Decrease) | ||||||
|---|---|---|---|---|---|---|---|
| |
1-Percentage Point Increase |
1-Percentage Point Decrease |
|||||
Healthcare cost trend: |
|||||||
Effect on total of service and interest cost components |
$ | 6,555 | $ | (5,153 | ) | ||
Effect on postretirement benefit obligation |
$ | 97,315 | $ | (79,003 | ) | ||
Discount rate: |
|||||||
Effect on postretirement service and interest cost components |
$ | (339 | ) | $ | 356 | ||
Effect on postretirement benefit obligation |
$ | (82,384 | ) | $ | 103,727 | ||
Effect on current year postretirement expense |
$ | (5,085 | ) | $ | 6,258 | ||
Effect on pension service and interest cost components |
$ | 88 | $ | (179 | ) | ||
Effect on pension benefit obligation |
$ | (31,734 | ) | $ | 38,655 | ||
Effect on current year pension expense |
$ | (2,661 | ) | $ | 3,142 | ||
Expected return on plan assets: |
|||||||
Effect on current year pension expense |
$ | (2,081 | ) | $ | 2,081 | ||
Rate of compensation increase: |
|||||||
Effect on pension service and interest cost components |
$ | 520 | $ | (465 | ) | ||
Effect on pension benefit obligation |
$ | 4,092 | $ | (3,748 | ) | ||
Effect on current year pension expense |
$ | 893 | $ | (808 | ) | ||
We review our actuarial assumptions on an annual basis and make modifications to the assumptions based on current rates and trends when appropriate. As required by U.S. GAAP, the effects of modifications are amortized over future periods.
The actuarial assumptions used by the Company in determining its pension and other postretirement benefit plan liabilities and future expenses may differ materially from actual results because of changing market and economic conditions, higher or lower withdrawal rates or longer or shorter life spans of participants. While the Company believes that the assumptions used are appropriate, differences in actual experience or changes in assumptions might materially affect the Company's financial position or results of operations.
Workers' Compensation and Black Lung
We also have significant liabilities for uninsured or partially insured employee-related liabilities, including workers' compensation liabilities, miners' Black Lung benefit liabilities, and liabilities for various life and health benefits. The recorded amounts of these liabilities are based on estimates of loss from individual claims and on estimates determined on an actuarial basis from historical experience using assumptions regarding rates of successful claims, discount factors, benefit increases and mortality rates.
Workers' compensation and Black Lung benefit liabilities are also affected by discount rates used. Changes in the frequency or severity of losses from historical experience and changes in discount rates or actual losses on individual claims that differ materially from estimated amounts could affect the recorded amount of these liabilities. At December 31, 2012, a one-percentage-point increase in the discount rate on the discounted Black Lung liability would decrease the liability by $3.1 million, while a one-percentage-point decrease in the discount rate would increase the liability by $4.1 million.
For the workers' compensation liability, we apply a discount rate at a risk-free interest rate, generally a U.S. Treasury bill rate, for each policy year. The rate used is one with a duration that corresponds to the weighted average expected payout period for each policy year. Once a discount rate is applied to a policy year, it remains the discount rate for the year until all claims are paid. The use of
82
this method decreases the volatility of the liability as impacted by changes in the discount rate. At December 31, 2012, a one-percentage-point increase in the discount rate on the discounted workers' compensation liability would decrease the liability by $0.2 million, while a one-percentage-point decrease in the discount rate would increase the liability by $0.1 million.
Income Taxes
Accounting principles generally accepted in the U.S. require that deferred tax assets and liabilities be recognized using enacted tax rates for the effect of temporary differences between the book and tax bases of recorded assets and liabilities. Deferred tax assets are required to be reduced by a valuation allowance if it is "more likely than not" that some portion or the entire deferred tax asset will not be realized. As of December 31, 2012, we had valuation allowances totaling $20.9 million, primarily for capital and ordinary loss carry forwards not expected to provide future tax benefits. In our evaluation of the need for a valuation allowance, we considered various factors including the reversal of taxable temporary differences, expected level of future taxable income and available tax planning strategies. If actual results differ from the assumptions made in this evaluation, we may need to record a charge to earnings to reflect the change in our expected valuation of the deferred tax assets.
We are in dispute with the Internal Revenue Service (the "IRS") on a number of federal income tax issues, primarily related to the discontinued Homebuilding and Financing businesses. We believe that our tax filing positions have substantial merit and we intend to vigorously defend these positions. We have established accruals that we believe are sufficient to address claims related to our uncertain tax positions, including related interest and penalties. Since the issues involved are highly complex, are subject to the uncertainties of extensive litigation and/or administrative processes and may require an extended period of time to reach ultimate resolution, it is possible that management's estimate of this liability could change. See Note 11 of "Notes to Consolidated Financial Statements."
Accounting for the Impairment of Long-Lived Assets
Mineral interests, property, plant and equipment and other long-lived assets are reviewed for potential impairment annually or whenever events or changes in circumstances indicate that the book value of the asset may not be recoverable. We periodically evaluate whether events and circumstances have occurred that indicate possible impairment and, if so, assessing whether the asset net book values are recoverable from estimated future undiscounted cash flows. The actual amount of an impairment loss to be recorded, if any, is equal to the amount by which the asset's net book value exceeds its fair market value. Fair market value is generally based on the present values of estimated future cash flows in the absence of quoted market prices. Inherent in our development of cash flow projections are assumptions and estimates derived from a review of our operating results, operating budgets, expected growth rates, and cost of capital. We also make certain assumptions about future economic conditions, interest rates and other market data. Many of the factors used in assessing fair value are outside of management's control and these assumptions and estimates can change in future periods.
Accounting for Natural Gas Exploration Activities
We apply the successful efforts method of accounting for our natural gas exploration activities. The costs of drilling exploratory wells are initially capitalized, pending determination of a commercially sufficient quantity of proved reserves attributable to the area as a result of drilling. If a commercially sufficient quantity of proved reserves is not discovered, any associated previously capitalized exploration costs associated with the drilling area are expensed. In some circumstances, it may be uncertain whether sufficient proved reserves have been found when drilling of an individual exploratory well has been completed. Such exploratory drilling costs, as well as additional exploratory well costs for the area, may continue to be capitalized if the reserve quantity is sufficient to justify the area's completion as a producing well or field of production and sufficient progress in assessing the reserves and the economic
83
and operating viability of the project is being made. Costs to develop proved reserves, including the cost of all development wells and related equipment used in the production of natural gas, are capitalized. Due to challenges in the short-term market outlook and the weak backdrop in coal demand experienced in the latter half of the year, during the 2012 third quarter the Company reviewed its operating strategy and related capital investment projects. As a result of this review, management decided to indefinitely abandon a natural gas exploration project that was accounted for under the successful efforts method of accounting. Accordingly, the Company recorded a pre-tax charge of $40.0 million ($25.0 million after-tax) to write-off the capitalized exploratory costs associated with the natural gas exploration project. The Company had no capitalized exploratory drilling costs as of December 31, 2012 and had approximately $40.0 million of capitalized exploratory drilling costs as of December 31, 2011.
Goodwill
Goodwill represents the excess of the purchase price over the fair value assigned to the net tangible and identifiable intangible assets acquired in a business combination. Goodwill is not amortized but is to be tested for impairment annually or when circumstances indicate a possible impairment may exist. We typically perform our annual goodwill testing as of the beginning of the fourth quarter at the reporting unit level. In the third quarter of 2012, market and industry trends and a weakened worldwide economy drove prices for our products downward and also had a negative impact on our share price. We evaluated these events and determined that they represented a triggering event for potential goodwill impairment. As a result, we conducted our review of goodwill for potential impairments in the third quarter of 2012.
We test goodwill for impairment using a fair value approach at the reporting unit level. We perform our goodwill impairment test in two steps. Step one compares the fair value of each reporting unit to its carrying value, including goodwill. If the fair value of the reporting unit determined in step one is higher than its carrying value, we need not perform step two as the asset is deemed not to be impaired. If the fair value of the reporting unit determined in step one is lower than its carrying value, we proceed to step two, which compares the carrying value of goodwill to its implied fair value. Any excess of carrying value of goodwill over its implied fair value at a reporting unit is recorded as impairment.
The valuation methodology utilized to estimate the fair value of the reporting units in step one is typically performed using both a market and income approach. The market approach is typically based on a guideline public company methodology. Under the guideline public company method, certain operating metrics from a selected group of publicly traded guideline companies that have similar operations to the Company's reporting units are used to estimate the fair value of the reporting units. The income approach uses the net discounted future cash flows projected for the reporting unit through the expected life of the unit to estimate fair value. Management evaluates the results of these methodologies to determine which methodology or mix thereof best represents the reporting units' fair value.
The valuation methodology utilized to allocate the estimated fair value of the reporting units to the underlying assets and liabilities contained within the individual reporting units in step two of the goodwill impairment test is primarily based on an income approach. The income approach is dependent upon a number of significant management estimates about future performance including sales volumes and prices, costs to produce, income taxes, capital spending, working capital changes and the after-tax weighted average cost of capital. Changes in any of these assumptions could materially impact the estimated fair value of the underlying assets and liabilities contained within the individual reporting units. Our forecasts of coal prices generally reflect a long-term outlook of market prices expected to be received for our coal. If actual coal prices are less than our expectations, it could have a material impact on the fair value of the underlying assets and liabilities contained within the individual reporting
84
units. Our forecasts of costs to produce coal are based on our operating forecasts. If actual costs are higher, it could have a material impact on the fair value of the underlying assets and liabilities contained within the individual reporting units.
Due to the events previously described, the Company performed an interim goodwill impairment test as of July 31, 2012 and recorded impairment charges of $1.1 billion, eliminating the entire carrying value of goodwill for two reporting units in the U.S. Operations segment and two reporting units in the Canadian and U.K. Operations segment.
Item 7A. Quantitative and Qualitative Disclosures About Market Risk
We are exposed to certain market risks inherent in our operations. These risks generally arise from transactions entered into in the normal course of business. Our primary market risk exposures relate to interest rate risk, commodity price risk and foreign currency risks. We do not enter into derivatives or other financial instruments for trading or speculative purposes.
Interest Rate Risk
We have exposure to changes in interest rates under the 2011 Credit Agreement through our term loan A, term loan B and Revolver loans. The interest rates for the term loan A, term loan B and Revolver loans are tied to LIBOR or the Canadian Dealer Offered Rate ("CDOR"), plus a credit spread ranging from 350 to 450 basis points for the Revolver and term loan A and 475 basis points on the term loan B adjusted quarterly based on our total leverage ratio as defined by the 2011 Credit Agreement. As of December 31, 2012, our borrowings under the 2011 Credit Agreement totaled $1.9 billion. As of December 31, 2012 a 100 basis point increase in interest rates would increase our yearly expense by approximately $6.4 million while a 100 basis point decrease in interest rates would decrease our yearly interest expense by approximately $1.0 million due to the minimum LIBOR floor of 1.0% on our term loan B.
Our objective in managing exposure to interest rate changes is to protect against the variability in expected future cash flows attributable to changes in the benchmark interest rate related to interest payments required under the 2011 Credit Agreement. To achieve this objective, we manage a portion of our interest rate exposure through the use of interest rate swaps and an interest rate cap. To reduce our exposure to rising interest rates and the risk that changing interest rates could have on our operations, during June 2011 we entered into an interest rate swap agreement and an interest rate cap agreement as described in Note 19 of "Notes to Consolidated Financial Statements." The interest rate swap agreement has a notional value of $450.0 million and is based on a 1.17% fixed rate. The interest rate cap agreement has a notional value of $255.0 million and has a strike price of 2.00%.
Commodity Risks
We are exposed to commodity price risk on sales of natural gas. Our natural gas business sold 18.1 billion cubic feet of gas during the year ended December 31, 2012.
We occasionally utilize derivative commodity instruments to manage the exposure to changing natural gas prices. Such derivative instruments are structured as cash flow hedges and not for trading. These swap contracts effectively converted a portion of forecasted sales at floating-rate natural gas prices to a fixed-rate basis. As described in Note 19 of "Notes to Consolidated Financial Statements," in order to reduce the risk associated with natural gas price volatility, on June 7, 2011 we entered into a one year swap contract to hedge 4.2 million MMBTUs of natural gas sales at a price of $5.00 per MMBTU beginning in July 2011 and ending June 2012. The swap agreement hedged approximately 30% of natural gas sales from July 2011 until June 2012. At December 31, 2012, no swap contracts were outstanding.
85
Foreign Currency Risks
We are exposed to the effects of changes in exchange rates primarily from the Canadian dollar and the British pound. We historically have not entered into any foreign exchange contracts to mitigate this risk.
Item 8. Financial Statements and Supplementary Data
Financial Statements and Supplementary Data consist of the financial statements as indexed on page F-1 and unaudited financial information presented in Part II, Item 7, "Management's Discussion and Analysis of Financial Condition and Results of Operations."
Item 9. Changes in and Disagreements with Accountants on Accounting and Financial Disclosure
None
Item 9A. Controls and Procedures
Evaluation of Disclosure Controls and Procedures
An evaluation was performed under the supervision and with the participation of our management, including our Chief Executive Officer and Chief Financial Officer, of the effectiveness of our disclosure controls and procedures as such term is defined in Rule 13a-15(e) under the Securities Exchange Act of 1934 as amended ("Exchange Act") as of the end of the period covered by this Annual Report on Form 10-K. Based on that evaluation, our management, including our Chief Executive Officer and Chief Financial Officer, concluded that our disclosure controls and procedures were effective as of December 31, 2012 to ensure that information required to be disclosed by us in reports that we file or submit under the Exchange Act is (1) recorded, processed, summarized and reported within the time periods specified in the SEC's rules and forms, and (2) accumulated and communicated to our management, including our Chief Executive Officer and Chief Financial Officer, as appropriate to allow timely decisions regarding required disclosures.
Management's Annual Report on Internal Control over Financial Reporting
Management, under the supervision of our Chief Executive Officer and Chief Financial Officer, is responsible for establishing and maintaining adequate internal control over financial reporting (as defined in Exchange Act Rule 13a-15(f)). Internal control over financial reporting is a process designed to provide reasonable assurance regarding the reliability of financial reporting and the preparation of financial statements for external purposes in accordance with generally accepted accounting principles in the United States of America. A company's internal control over financial reporting includes those policies and procedures that (i) pertain to the maintenance of records that, in reasonable detail, accurately and fairly reflect the transactions and dispositions of the assets of the company; (ii) provide reasonable assurance that transactions are recorded as necessary to permit preparation of financial statements in accordance with generally accepted accounting principles, and that receipts and expenditures of the company are being made only in accordance with authorizations of management and directors of the company; and (iii) provide reasonable assurance regarding prevention or timely detection of unauthorized acquisition, use, or disposition of the company's assets that could have a material effect on the financial statements.
Because of its inherent limitations, internal control over financial reporting may not prevent or detect misstatements. Also, projections of any evaluation of effectiveness to future periods are subject to the risk that controls may become inadequate because of changes in conditions, or that the degree of compliance with the policies or procedures may deteriorate.
86
Management assessed the effectiveness of our internal control over financial reporting as of December 31, 2012. In making this assessment, management used the criteria set forth by the Committee of Sponsoring Organizations of the Treadway Commission ("COSO") in Internal Control-Integrated Framework. Based on this assessment, management concluded that, as of December 31, 2012, our internal control over financial reporting was effective.
Our independent registered public accounting firm, Ernst & Young, has audited the effectiveness of our internal control over financial reporting, as stated in their attestation report included in this Annual Report on Form 10-K.
Evaluation of Changes in Internal Control over Financial Reporting
There were no changes in our internal control over financial reporting (as defined in Rule 13a-15(f) under the Securities Exchange Act of 1934) during the year ended December 31, 2012 that have materially affected, or are reasonably likely to materially affect our internal control over financial reporting.
None
87
Item 10. Directors, Executive Officers and Corporate Governance
Directors
Ms. Mary R. Henderson was appointed to the Board effective February 19, 2013. In addition, one of our long-standing independent directors, Mr. Howard L. Clark, Jr. retired on February 18, 2013.
Executive Officers of the Registrant
Set forth below is a list showing the names, ages and positions of the executive officers of the Company.
Name
|
Age | Position | |||
|---|---|---|---|---|---|
Walter J. Scheller, III |
52 | Chief Executive Officer and Director | |||
William G. Harvey |
55 | Senior Vice President and Chief Financial Officer | |||
Daniel P. Cartwright |
60 | President, Canadian Operations | |||
Richard A. Donnelly |
58 | President, Jim Walter Resources, Inc. | |||
Earl H. Doppelt |
59 | Senior Vice President, General Counsel and Secretary | |||
Thomas J. Lynch |
57 | Senior Vice President, Human Resources | |||
Michael T. Madden |
61 | Senior Vice President and Chief Commercial Officer | |||
Charles C. Stewart |
57 | Senior Vice President, Project Development | |||
Walter J. Scheller, III was appointed Chief Executive Officer of Walter Energy in September 2011 after serving as President and Chief Operating Officer of the Company's primary subsidiary, Jim Walter Resources, beginning in June 2010. Prior to joining Walter Energy, Mr. Scheller served from June 2006 until June 2010 at Peabody Energy Corporation ("Peabody") as Group Executive, Colorado Operations and, before that, as Senior Vice President, Strategic Operations. Prior to his career at Peabody, Mr. Scheller worked for CNX Gas Corporation as Vice President, Northern Appalachia Gas Operations as well as Consol Energy Inc. where he held a number of executive and operational roles, the last of which was Vice President, Operations. Mr. Scheller holds an MBA from University of Pittsburgh—Joseph M. Katz Graduate School of Business, a Juris Doctor degree from Duquesne University and a bachelor's degree in mining engineering from West Virginia University.
William G. Harvey joined the Company as Senior Vice President and Chief Financial Officer in July 2012, succeeding Robert P. Kerley who then served as Interim Principal Financial Officer. Mr. Harvey previously worked at Resolute Forest Products Inc. ("Resolute"), a global producer of newsprint, coated and specialty papers, market pulp and wood products, where he held several senior positions, most recently from 2008 to 2011, as Senior Vice President and Chief Financial Officer. From 2004 to 2007, Mr. Harvey was the Executive Vice President and Chief Financial Officer of Bowater Inc. ("Bowater"), now a subsidiary of Resolute. From 1998 to 2004, Mr. Harvey served as Bowater's Vice President and Treasurer and from 1995 to 1998, as Vice President and Treasurer of Avenor Inc. ("Avenor") prior to Avenor's acquisition by Bowater. Mr. Harvey earned his bachelor of science degree in mechanical engineering from Queen's University in Kingston, Ontario and a Masters in Business Administration in finance from the University of Toronto.
Daniel P. Cartwright was appointed President, Canadian Operations in January 2012. Mr. Cartwright joined Walter Energy in July 2011 as Vice President, Underground Mining Operations. With more than 38 years of mining experience, he previously worked for Peabody from January 2011 to December 2011 as Vice President, Operations Support—Powder River Basin and Southwest where he supported six large mines across Wyoming, New Mexico and Arizona. Prior to that, from May 2004 to December 2010 Mr. Cartwright was Operations Director—North Antelope Rochelle Operations Unit, Peabody's flagship operation. He also served Shell Mining Company for more than 15 years in various
88
positions, the last of which was President, Shell/Marrowbone Development Company. Mr. Cartwright graduated summa cum laude from University of Missouri—Rolla with a Bachelor of Science degree in mining engineering.
Richard A. Donnelly was named President, Jim Walter Resources ("JWR") in January 2012 after most recently serving as Vice President, Engineering at JWR since March 2003. Beginning his career with the Company in 1977, Mr. Donnelly has extensive experience in all aspects of the mining business. He has held numerous positions within the engineering and operations areas of various Walter Energy properties, including Deputy Mine Manager and Mine Manager positions as well as Vice President, Operations. Mr. Donnelly holds a Bachelor of Science degree in mining engineering from the University of Missouri—Rolla.
Earl H. Doppelt joined the Company as Senior Vice President, General Counsel and Secretary in January 2012. With more than 30 years of legal experience, he joined the Company from Information Services Group, Inc. where he served as Executive Vice President, General Counsel and Secretary from December 2006 to May 2010. Mr. Doppelt has also served as the senior legal officer of other major global companies, including The Nielsen Corporation (formerly VNU), ACNielsen Corporation, The Dun & Bradstreet Corporation and Paramount Communications Inc. He is a summa cum laude graduate of Cornell Law School and the University of Rochester.
Thomas J. Lynch joined the Company as Senior Vice President, Human Resources in April 2012. Mr. Lynch has over 25 years of experience in Human Resources including labor and employee relations, performance management, recruitment and retention. Prior to joining us, Mr. Lynch was the Vice President, Human Resources for NRG Energy, Inc. He started his career as a labor attorney then moved to IBM for 18 years where he held a series of progressively responsible Human Resources positions. Mr. Lynch holds a Bachelor of Arts degree from the State University of New York at Oswego, and a Juris Doctor degree from New York Law School.
Michael T. Madden was appointed Senior Vice President and Chief Commercial Officer in May 2012 after serving as Senior Vice President, Sales and Marketing since February 2010 and Vice President, Marketing, Transportation, and Quality Control since 1997 for the Company's primary subsidiary, Jim Walter Resources. Prior to beginning his career with the Company in 1997, Mr. Madden held various management positions in the coal industry for both the domestic and export markets from 1974 through 1996. He is a member of the National Mining Association, the Alabama Coal Association, and the Coal Trade Association of New York, and he previously served as a director of the Coal Exporters Association. Mr. Madden holds a bachelor's degree in marketing from St. Bonaventure University.
Charles C. Stewart was appointed Senior Vice President, Project Development in April 2012 and in December 2012 assumed responsibility for the Company's West Virginia operations, Walter Minerals, Walter Coke, Black Warrior Methane and Walter Black Warrior Basin. Mr. Stewart previously was the President and Chief Operating Officer of Walter Coke, Inc. since May 2003, as well as President and Chief Operating Officer of Walter Minerals, Inc. since November 2010 after previously serving Walter Minerals as President since July 2007. In 2011, he also assumed responsibility for Walter Energy's operations in West Virginia and Wales. Beginning his career with the Company in 1978, Mr. Stewart has held a number of progressively responsible leadership roles in various mining, engineering and management capacities across the Company. Mr. Stewart holds an MBA from Samford University and a Bachelor of Science degree in mineral engineering from the University of Alabama.
Code of Conduct
The Board has adopted a Business Ethics and Code of Conduct ("Code of Conduct") which is applicable to all employees, directors and officers of the Company. If the Company amends or waives any provision of its Code of Conduct that applies to the Company's principal executive officer,
89
principal financial officer, principal accounting officer or any person performing similar functions, the Company intends to satisfy its disclosure obligations with respect to any such waiver or amendment by posting such information on its internet website set forth above rather than by filing a Current Report on Form 8-K. The Code of Conduct is posted on our website at www.walterenergy.com and is available in print to stockholders who request a copy. We have made available an Ethics Hotline, where employees can anonymously report a violation of the Code of Conduct.
Additional Information
Additional information, as required in Item 10 are incorporated by reference to the Proxy Statement for the 2013 Annual Meeting of Stockholders(the "2013 Proxy Statement") included in Schedule 14A to be filed by the Company with the Securities and Exchange Commission (the "Commission") under the Exchange Act.
Item 11. Executive Compensation
Incorporated by reference to the 2013 Proxy Statement.
Item 12. Security Ownership of Certain Beneficial Owners and Management and Related Stockholder Matters
The equity compensation plan information as required by Item 201(d) of Regulation S-K is included in Part II, Item 5 of this Form 10-K. All other information as required by Item 12 is incorporated by reference to the 2013 Proxy Statement.
Item 13. Certain Relationships and Related Transactions, and Director Independence
Incorporated by reference to the 2013 Proxy Statement.
Item 14. Principal Accounting Fees and Services
Incorporated by reference to the 2013 Proxy Statement.
Item 15. Exhibits, Financial Statement Schedules
- (a)
- For
Financial Statements—See Index to Financial Statements on page F-1. For Exhibits—See Item 15(b).
- (b)
- For Exhibits—See Index to Exhibits on pages E-1-E-4.
90
Pursuant to the requirements of Section 13 or 15(d) of the Securities Exchange Act of 1934, the registrant has duly caused this report to be signed on its behalf by the undersigned, thereunto duly authorized.
| WALTER ENERGY, INC. | ||
March 1, 2013 |
/s/ WALTER J. SCHELLER, III Walter J. Scheller, III, Chief Executive Officer (Principal Executive Officer) |
Pursuant to the requirements of the Securities Exchange Act of 1934, this report has been signed below by the following persons on behalf of the registrant and in the capacities and on the dates indicated.
| March 1, 2013 | /s/ WILLIAM G. HARVEY William G. Harvey, Chief Financial Officer, (Principal Financial Officer) |
|
March 1, 2013 |
/s/ ROBERT P. KERLEY Robert P. Kerley, Chief Accounting Officer, (Principal Accounting Officer) |
|
March 1, 2013 |
/s/ DAVID R. BEATTY David R. Beatty, O.B.E., Director* |
|
March 1, 2013 |
/s/ JERRY W. KOLB Jerry W. Kolb, Director* |
|
March 1, 2013 |
/s/ PATRICK A. KRIEGSHAUSER Patrick A. Kriegshauser, Director* |
|
March 1, 2013 |
/s/ JOSEPH B. LEONARD Joseph B. Leonard, Director* |
|
March 1, 2013 |
/s/ GRAHAM MASCALL Graham Mascall, Director* |
|
March 1, 2013 |
/s/ BERNARD G. RETHORE Bernard G. Rethore, Director* |
|
March 1, 2013 |
/s/ MICHAEL T. TOKARZ Michael T. Tokarz, Chairman* |
|
March 1, 2013 |
/s/ A.J. WAGNER A.J. Wagner, Director* |
*By: |
/s/ EARL H. DOPPELT Earl H. Doppelt Attorney-in-Fact |
91
INDEX TO CONSOLIDATED FINANCIAL STATEMENTS
F-1
Report of Independent Registered Public Accounting Firm
The Board of Directors and Stockholders of Walter Energy, Inc.
We have audited the accompanying consolidated balance sheets of Walter Energy, Inc and subsidiaries as of December 31, 2012 and 2011, and the related consolidated statements of operations, comprehensive income, changes in stockholders' equity and cash flows for each of the three years in the period ended December 31, 2012. These financial statements are the responsibility of the Company's management. Our responsibility is to express an opinion on these financial statements based on our audits.
We conducted our audits in accordance with the standards of the Public Company Accounting Oversight Board (United States). Those standards require that we plan and perform the audit to obtain reasonable assurance about whether the financial statements are free of material misstatement. An audit includes examining, on a test basis, evidence supporting the amounts and disclosures in the financial statements. An audit also includes assessing the accounting principles used and significant estimates made by management, as well as evaluating the overall financial statement presentation. We believe that our audits provide a reasonable basis for our opinion.
In our opinion, the financial statements referred to above present fairly, in all material respects, the consolidated financial position of Walter Energy, Inc. and subsidiaries at December 31, 2012 and 2011, and the consolidated results of their operations and their cash flows for each of the three years in the period ended December 31, 2012, in conformity with U.S. generally accepted accounting principles.
We also have audited, in accordance with the standards of the Public Company Accounting Oversight Board (United States), Walter Energy, Inc.'s internal control over financial reporting as of December 31, 2012, based on criteria established in Internal Control-Integrated Framework issued by the Committee of Sponsoring Organizations of the Treadway Commission and our report dated March 1, 2013 expressed an unqualified opinion thereon.
/s/
Ernst & Young, LLP
Birmingham,
Alabama
March 1, 2013
F-2
Report of Independent Registered Public Accounting Firm
The Board of Directors and Stockholders of Walter Energy, Inc.
We have audited Walter Energy, Inc. and subsidiaries' internal control over financial reporting as of December 31, 2012, based on criteria established in Internal Control—Integrated Framework issued by the Committee of Sponsoring Organizations of the Treadway Commission (the COSO criteria). Walter Energy, Inc. and subsidiaries' management is responsible for maintaining effective internal control over financial reporting, and for its assessment of the effectiveness of internal control over financial reporting included in the accompanying Management's Annual Report on Internal Control over Financial Reporting. Our responsibility is to express an opinion on the company's internal control over financial reporting based on our audit.
We conducted our audit in accordance with the standards of the Public Company Accounting Oversight Board (United States). Those standards require that we plan and perform the audit to obtain reasonable assurance about whether effective internal control over financial reporting was maintained in all material respects. Our audit included obtaining an understanding of internal control over financial reporting, assessing the risk that a material weakness exists, testing and evaluating the design and operating effectiveness of internal control based on the assessed risk, and performing such other procedures as we considered necessary in the circumstances. We believe that our audit provides a reasonable basis for our opinion.
A company's internal control over financial reporting is a process designed to provide reasonable assurance regarding the reliability of financial reporting and the preparation of financial statements for external purposes in accordance with generally accepted accounting principles. A company's internal control over financial reporting includes those policies and procedures that (1) pertain to the maintenance of records that, in reasonable detail, accurately and fairly reflect the transactions and dispositions of the assets of the company; (2) provide reasonable assurance that transactions are recorded as necessary to permit preparation of financial statements in accordance with generally accepted accounting principles, and that receipts and expenditures of the company are being made only in accordance with authorizations of management and directors of the company; and (3) provide reasonable assurance regarding prevention or timely detection of unauthorized acquisition, use or disposition of the company's assets that could have a material effect on the financial statements.
Because of its inherent limitations, internal control over financial reporting may not prevent or detect misstatements. Also, projections of any evaluation of effectiveness to future periods are subject to the risk that controls may become inadequate because of changes in conditions, or that the degree of compliance with the policies or procedures may deteriorate.
In our opinion, Walter Energy, Inc. and subsidiaries maintained, in all material respects, effective internal control over financial reporting as of December 31, 2012, based on the COSO criteria.
We have also audited, in accordance with the standards of the Public Company Accounting Oversight Board (United States), the consolidated balance sheets of Walter Energy, Inc. and subsidiaries as of December 31, 2012 and 2011, and the related consolidated statements of operations, comprehensive income, changes in stockholders' equity and cash flows for each of the three years in the period ended December 31, 2012 and our report dated March 1, 2013 expressed an unqualified opinion thereon.
/s/ Ernst & Young, LLP
Birmingham,
Alabama
March 1, 2013
F-3
WALTER ENERGY, INC. AND SUBSIDIARIES
CONSOLIDATED BALANCE SHEETS
(in thousands, except share and per share amounts)
| |
December 31, | ||||||
|---|---|---|---|---|---|---|---|
| |
2012 | Recast 2011(1) | |||||
ASSETS |
|||||||
Cash and cash equivalents |
$ | 116,601 | $ | 128,430 | |||
Receivables, net |
256,967 | 313,343 | |||||
Inventories |
306,018 | 240,437 | |||||
Deferred income taxes |
58,526 | 61,079 | |||||
Prepaid expenses |
53,776 | 49,974 | |||||
Other current assets |
23,928 | 45,649 | |||||
Total current assets |
815,816 | 838,912 | |||||
Mineral interests, net |
2,965,557 | 3,056,258 | |||||
Property, plant and equipment, net |
1,732,131 | 1,631,333 | |||||
Deferred income taxes |
160,422 | 109,300 | |||||
Goodwill |
— | 1,066,754 | |||||
Other long-term assets |
94,494 | 153,951 | |||||
|
$ | 5,768,420 | $ | 6,856,508 | |||
LIABILITIES AND STOCKHOLDERS' EQUITY |
|||||||
Current debt |
$ | 18,793 | $ | 56,695 | |||
Accounts payable |
114,913 | 112,661 | |||||
Accrued expenses |
184,875 | 229,067 | |||||
Accumulated postretirement benefits obligation |
29,200 | 27,247 | |||||
Other current liabilities |
206,473 | 63,757 | |||||
Total current liabilities |
554,254 | 489,427 | |||||
Long-term debt |
2,397,372 | 2,269,020 | |||||
Deferred income taxes |
921,687 | 1,029,336 | |||||
Accumulated postretirement benefits obligation |
633,264 | 550,671 | |||||
Other long-term liabilities |
251,272 | 381,537 | |||||
Total liabilities |
4,757,849 | 4,719,991 | |||||
Commitments and Contingencies (Note 18) |
|||||||
Stockholders' equity: |
|||||||
Common stock, $0.01 par value per share: |
|||||||
Authorized—200,000,000 shares; issued—62,521,300 and 62,444,905 shares, respectively |
625 | 624 | |||||
Preferred stock, $0.01 par value per share: |
|||||||
Authorized—20,000,000 shares; issued—0 shares |
— | — | |||||
Capital in excess of par value |
1,628,244 | 1,620,430 | |||||
Retained earnings (accumulated deficit) |
(347,448 | ) | 744,939 | ||||
Accumulated other comprehensive income (loss): |
|||||||
Pension and other post-retirement benefit plans, net of tax |
(266,042 | ) | (225,541 | ) | |||
Foreign currency translation adjustment |
(1,502 | ) | (3,276 | ) | |||
Unrealized loss on hedges, net of tax |
(4,203 | ) | (787 | ) | |||
Unrealized investment gain, net of tax |
897 | 128 | |||||
Total stockholders' equity |
1,010,571 | 2,136,517 | |||||
|
$ | 5,768,420 | $ | 6,856,508 | |||
- (1)
- Certain previously reported December 31, 2011 balances have been recast to reflect the effects of finalizing the allocation of the Western Coal purchase price during the 2012 first quarter. See Note 3 for further information.
The accompanying notes are an integral part of the consolidated financial statements.
F-4
WALTER ENERGY, INC. AND SUBSIDIARIES
CONSOLIDATED STATEMENTS OF OPERATIONS
(in thousands, except per share amounts)
| |
For the years ended December 31, | |||||||||
|---|---|---|---|---|---|---|---|---|---|---|
| |
2012 | Recast 2011(1) | 2010 | |||||||
Revenues: |
||||||||||
Sales |
$ | 2,381,760 | $ | 2,562,325 | $ | 1,570,845 | ||||
Miscellaneous income |
18,135 | 9,033 | 16,885 | |||||||
|
2,399,895 | 2,571,358 | 1,587,730 | |||||||
Costs and expenses: |
||||||||||
Cost of sales (exclusive of depreciation and depletion) |
1,796,991 | 1,561,112 | 766,516 | |||||||
Depreciation and depletion |
316,232 | 230,681 | 98,702 | |||||||
Selling, general and administrative |
133,467 | 165,749 | 86,972 | |||||||
Postretirement benefits |
52,852 | 40,385 | 41,478 | |||||||
Asset impairment and restructuring |
49,070 | — | — | |||||||
Goodwill impairment |
1,064,409 | — | — | |||||||
|
3,413,021 | 1,997,927 | 993,668 | |||||||
Operating income (loss) |
(1,013,126 | ) | 573,431 | 594,062 | ||||||
Interest expense |
(139,356 | ) | (96,820 | ) | (17,250 | ) | ||||
Interest income |
804 | 606 | 784 | |||||||
Other income (loss), net |
(13,081 | ) | 17,606 | — | ||||||
Income (loss) from continuing operations before income tax expense |
(1,164,759 | ) | 494,823 | 577,596 | ||||||
Income tax expense (benefit) |
(99,204 | ) | 131,225 | 188,171 | ||||||
Income (loss) from continuing operations |
(1,065,555 | ) | 363,598 | 389,425 | ||||||
Income (loss) from discontinued operations |
5,180 | — | (3,628 | ) | ||||||
Net income (loss) |
$ | (1,060,375 | ) | $ | 363,598 | $ | 385,797 | |||
Basic income (loss) per share: |
||||||||||
Income (loss) from continuing operations |
$ | (17.04 | ) | $ | 6.03 | $ | 7.32 | |||
Income (loss) from discontinued operations |
0.08 | — | (0.07 | ) | ||||||
Net income (loss) |
$ | (16.96 | ) | $ | 6.03 | $ | 7.25 | |||
Diluted income (loss) per share: |
||||||||||
Income (loss) from continuing operations |
$ | (17.04 | ) | $ | 6.00 | $ | 7.25 | |||
Income (loss) from discontinued operations |
0.08 | — | (0.07 | ) | ||||||
Net income (loss) |
$ | (16.96 | ) | $ | 6.00 | $ | 7.18 | |||
- (1)
- Certain previously reported year ended December 31, 2011 balances have been recast to reflect the effects of finalizing the allocation of the Western Coal purchase price during the 2012 first quarter. See Note 3 for further information.
The accompanying notes are an integral part of the consolidated financial statements.
F-5
WALTER ENERGY, INC. AND SUBSIDIARIES
CONSOLIDATED STATEMENTS OF COMPREHENSIVE INCOME
(in thousands)
| |
For the years ended December 31, | |||||||||
|---|---|---|---|---|---|---|---|---|---|---|
| |
2012 | Recast 2011(1) | 2010 | |||||||
Net income (loss) |
$ | (1,060,375 | ) | $ | 363,598 | $ | 385,797 | |||
Other comprehensive income (loss), net of tax: |
||||||||||
Change in pension and postretirement benefit plans, (net of tax benefits: $23,330, $33,179, and $2,154, respectively) |
(40,501 | ) | (53,224 | ) | (5,280 | ) | ||||
Change in unrealized loss on hedges, (net of tax benefits: $1,985, $367, and $185, respectively) |
(3,416 | ) | (716 | ) | (596 | ) | ||||
Change in foreign currency translation adjustment |
1,774 | (3,276 | ) | — | ||||||
Change in unrealized gain on investments |
769 | 128 | — | |||||||
Total other comprehensive income (loss), net of tax |
(41,374 | ) | (57,088 | ) | (5,876 | ) | ||||
Total comprehensive income (loss) |
$ | (1,101,749 | ) | $ | 306,510 | $ | 379,921 | |||
- (1)
- Certain previously reported year ended December 31, 2011 balances have been recast to reflect the effects of finalizing the allocation of the Western Coal purchase price during the 2012 first quarter. See Note 3 for further information.
The accompanying notes are an integral part of the consolidated financial statements.
F-6
WALTER ENERGY, INC. AND SUBSIDIARIES
CONSOLIDATED STATEMENTS OF CHANGES IN STOCKHOLDERS' EQUITY
(in thousands, except per share amounts)
| |
Total | Common Stock |
Capital in Excess of Par Value |
Retained Earnings (Accumulated Deficit) |
Accumulated Other Comprehensive Income (Loss) | |||||||||||
|---|---|---|---|---|---|---|---|---|---|---|---|---|---|---|---|---|
Balance at December 31, 2009 |
$ | 259,395 | $ | 533 | $ | 374,522 | $ | 50,852 | $ | (166,512 | ) | |||||
Net income |
385,797 | 385,797 | ||||||||||||||
Other comprehensive income (loss), net of tax |
(5,876 | ) | (5,876 | ) | ||||||||||||
Purchases of stock under stock repurchase program |
(65,438 | ) | (9 | ) | (65,429 | ) | ||||||||||
Stock issued upon exercise of stock options |
17,134 | 8 | 17,126 | |||||||||||||
Dividends paid, $0.475 per share |
(25,266 | ) | (25,266 | ) | ||||||||||||
Stock based compensation |
3,460 | 3,460 | ||||||||||||||
Excess tax benefits from stock-based compensation arrangements |
28,875 | 28,875 | ||||||||||||||
Other |
(3,015 | ) | (1 | ) | (3,014 | ) | ||||||||||
Balance at December 31, 2010 |
595,066 | 531 | 355,540 | 411,383 | (172,388 | ) | ||||||||||
Net income, recast(1) |
363,598 | 363,598 | ||||||||||||||
Other comprehensive income (loss), net of tax |
(57,088 | ) | (57,088 | ) | ||||||||||||
Stock issued upon the exercise of stock options |
8,920 | 3 | 8,917 | |||||||||||||
Dividends paid, $0.50 per share |
(30,042 | ) | (30,042 | ) | ||||||||||||
Stock based compensation |
9,384 | 9,384 | ||||||||||||||
Excess tax benefits from stock-based compensation arrangements |
8,929 | 8,929 | ||||||||||||||
Issuance of common stock in connection with the Western Coal Corp. acquisition |
1,224,126 | 90 | 1,224,036 | |||||||||||||
Fair value of replacement stock options and warrants issued in connection with the Western Coal Corp. acquisition |
18,844 | 18,844 | ||||||||||||||
Other |
(5,220 | ) | (5,220 | ) | ||||||||||||
Balance at December 31, 2011, recast(1) |
2,136,517 | 624 | 1,620,430 | 744,939 | (229,476 | ) | ||||||||||
Net loss |
(1,060,375 | ) | (1,060,375 | ) | ||||||||||||
Other comprehensive income (loss), net of tax |
(41,374 | ) | (41,374 | ) | ||||||||||||
Stock issued upon the exercise of stock options |
161 | 1 | 160 | |||||||||||||
Dividends paid, $0.50 per share |
(31,246 | ) | (31,246 | ) | ||||||||||||
Stock based compensation |
7,437 | 7,437 | ||||||||||||||
Excess tax benefits from stock-based compensation arrangements |
217 | 217 | ||||||||||||||
Other |
(766 | ) | (766 | ) | ||||||||||||
Balance at December 31, 2012 |
$ | 1,010,571 | $ | 625 | $ | 1,628,244 | $ | (347,448 | ) | $ | (270,850 | ) | ||||
- (1)
- Certain previously reported December 31, 2011 balances have been recast to reflect the effects of finalizing the allocation of the Western Coal purchase price during the 2012 first quarter. See Note 3 for further information.
The accompanying notes are an integral part of the consolidated financial statements.
F-7
WALTER ENERGY, INC. AND SUBSIDIARIES
CONSOLIDATED STATEMENTS OF CASH FLOWS
(in thousands)
| |
For the years ended December 31, | |||||||||
|---|---|---|---|---|---|---|---|---|---|---|
| |
2012 | Recast 2011(1) |
2010 | |||||||
OPERATING ACTIVITIES |
||||||||||
Net income (loss) |
$ | (1,060,375 | ) | $ | 363,598 | $ | 385,797 | |||
Less (income) loss from discontinued operations |
(5,180 | ) | — | 3,628 | ||||||
Income (loss) from continuing operations |
(1,065,555 | ) | 363,598 | 389,425 | ||||||
Adjustments to reconcile net income (loss) from continuing operations to net cash flows provided by (used in) operating activities: |
||||||||||
Depreciation and depletion |
316,232 | 230,681 | 98,702 | |||||||
Deferred income tax provision (benefit) |
(132,220 | ) | 66,803 | 83,174 | ||||||
Amortization of debt issuance costs |
22,606 | 21,154 | 2,975 | |||||||
Excess tax benefits from stock-based compensation arrangements |
(217 | ) | (8,929 | ) | (28,875 | ) | ||||
Gain on initial investment in Western Coal Corp |
— | (20,553 | ) | — | ||||||
Goodwill and other asset impairment charges |
1,107,512 | — | — | |||||||
Other |
(59,190 | ) | 18,764 | 14,433 | ||||||
Decrease (increase) in current assets, net of effect of business acquisitions: |
||||||||||
Receivables |
44,378 | (1,605 | ) | (65,935 | ) | |||||
Inventories |
(62,630 | ) | (1,885 | ) | 1,966 | |||||
Prepaid expenses and other current assets |
11,702 | 18,929 | 13,155 | |||||||
Increase (decrease) in current liabilities, net of effect of business acquisitions: |
||||||||||
Accounts payable |
34,594 | 13,676 | 23,717 | |||||||
Accrued expenses and other current liabilities |
112,695 | 6,233 | 41,413 | |||||||
Cash flows provided by operating activities |
329,907 | 706,866 | 574,150 | |||||||
INVESTING ACTIVITIES |
||||||||||
Additions to property, plant and equipment |
(391,512 | ) | (436,705 | ) | (157,476 | ) | ||||
Acquisition of Western Coal Corp., net of cash acquired |
— | (2,432,693 | ) | — | ||||||
Acquisition of HighMount Exploration & Production Alabama, LLC |
— | — | (209,964 | ) | ||||||
Proceeds from sales of investments |
13,239 | 27,325 | — | |||||||
Other |
898 | 1,413 | (3,414 | ) | ||||||
Cash flows used in investing activities |
(377,375 | ) | (2,840,660 | ) | (370,854 | ) | ||||
FINANCING ACTIVITIES |
||||||||||
Proceeds from issuance of debt |
496,510 | 2,350,000 | — | |||||||
Borrowings under revolving credit agreement |
510,650 | 71,259 | — | |||||||
Repayments on revolving credit agreement |
(519,453 | ) | (61,259 | ) | — | |||||
Retirements of debt |
(392,851 | ) | (290,630 | ) | (26,972 | ) | ||||
Dividends paid |
(31,246 | ) | (30,042 | ) | (25,266 | ) | ||||
Purchases of stock under stock repurchase program |
— | — | (65,438 | ) | ||||||
Excess tax benefits from stock-based compensation arrangements |
217 | 8,929 | 28,875 | |||||||
Proceeds from stock options exercised |
161 | 8,920 | 17,134 | |||||||
Cash paid upon exercise of warrants |
(11,535 | ) | — | — | ||||||
Debt issuance costs |
(24,532 | ) | (80,027 | ) | — | |||||
Other |
(766 | ) | (5,203 | ) | (3,015 | ) | ||||
Cash flows provided by (used in) financing activities |
27,155 | 1,971,947 | (74,682 | ) | ||||||
Cash flows provided by (used in) continuing operations |
(20,313 | ) | (161,847 | ) | 128,614 | |||||
CASH FLOWS FROM DISCONTINUED OPERATIONS |
||||||||||
Cash flows used in operating activities |
— | — | (6,268 | ) | ||||||
Cash flows provided by investing activities |
9,500 | — | 5,066 | |||||||
Cash flows provided by (used in) discontinued operations |
9,500 | — | (1,202 | ) | ||||||
Effect of foreign exchange rates on cash |
(1,016 | ) | (3,668 | ) | — | |||||
Net increase (decrease) in cash and cash equivalents |
$ | (11,829 | ) | $ | (165,515 | ) | $ | 127,412 | ||
F-8
| |
For the years ended December 31, | |||||||||
|---|---|---|---|---|---|---|---|---|---|---|
| |
2012 | Recast 2011(1) |
2010 | |||||||
Cash and cash equivalents at beginning of year |
$ | 128,430 | $ | 293,410 | $ | 165,279 | ||||
Add: Cash and cash equivalents of discontinued operations at beginning of year |
— | 535 | 1,254 | |||||||
Net increase (decrease) in cash and cash equivalents |
(11,829 | ) | (165,515 | ) | 127,412 | |||||
Less: Cash and cash equivalents of discontinued operations at end of year |
— | — | 535 | |||||||
Cash and cash equivalents at end of year |
$ | 116,601 | $ | 128,430 | $ | 293,410 | ||||
SUPPLEMENTAL DISCLOSURES: |
||||||||||
Interest paid, net of capitalized interest |
$ | 95,642 | $ | 63,828 | $ | 9,848 | ||||
Income taxes paid, net of refunds |
$ | 12,433 | $ | 69,101 | $ | 77,247 | ||||
Non-Cash Investing Activities: |
||||||||||
Acquisition of Western Coal in 2011 and HighMount in 2010: |
||||||||||
Fair value of assets acquired |
$ | — | $ | 5,164,842 | $ | 217,607 | ||||
Less: fair value of liabilities assumed |
— | (1,418,640 | ) | (7,643 | ) | |||||
fair value of shares of common stock issued |
— | (1,224,126 | ) | — | ||||||
fair value of stock options issued and warrants |
— | (34,765 | ) | — | ||||||
gain on initial investment |
— | (20,553 | ) | — | ||||||
cash acquired |
— | (34,065 | ) | — | ||||||
Net cash paid |
$ | — | $ | 2,432,693 | $ | 209,964 | ||||
Non-Cash Financing Activities: |
||||||||||
One-year property insurance policy financing agreement |
$ | — | $ | — | $ | 18,947 | ||||
- (1)
- Certain previously reported year ended December 31, 2011 balances have been recast to reflect the effects of finalizing the allocation of the Western Coal purchase price during the 2012 first quarter. See Note 3 for further information.
The accompanying notes are an integral part of the consolidated financial statements.
F-9
WALTER ENERGY, INC. AND SUBSIDIARIES
NOTES TO CONSOLIDATED FINANCIAL STATEMENTS
FOR THE YEAR ENDED DECEMBER 31, 2012
NOTE 1—Organization
Walter Energy, Inc. ("Walter"), together with its consolidated subsidiaries ("the Company"), is a leading producer and exporter of metallurgical coal for the global steel industry from underground and surface mines located in the United States, Canada and the United Kingdom. The Company also produces thermal coal, anthracite coal, metallurgical coke and coal bed methane gas.
As described in Note 3, on April 1, 2011, the Company completed the acquisition of all the outstanding common shares of Western Coal Corp. ("Western Coal"). The accompanying financial statements include the results of operations of Western Coal since April 1, 2011. The Company reports all of its operations located in the U.S. in the U.S. Operations segment. The Company reports its mining operations acquired through the Western Coal acquisition located in Northeast British Columbia (Canada) and South Wales (United Kingdom) in the Canadian and U.K. Operations segment. The Other segment primarily consists of Corporate activities and expenditures. See Note 21 for segment information.
The Company announced the closure of its Homebuilding segment and Kodiak Mining Co. in December 2008 and on April 17, 2009 the Company spun off its Financing segment. During the quarter ended June 30, 2012, the Company sold the Kodiak assets and liabilities for cash proceeds of $9.5 million, which resulted in an after-tax gain of $5.2 million. As a result of the closures and spin-off, those segments are presented as discontinued operations for the years ended December 31, 2012 and 2010. The Kodiak operations did not have a significant impact on either the Company's revenues or operating income for the year ended December 31, 2011 and was not reported as discontinued operations. See Note 6 for discontinued operations information.
NOTE 2—Summary of Significant Accounting Policies
Basis of Presentation
The consolidated financial statements include the accounts of all wholly and majority owned subsidiaries. Preparation of financial statements in accordance with accounting principles generally accepted in the U.S. requires management to make estimates and assumptions that affect the amounts reported in the consolidated financial statements. Actual results could differ from those estimates. All significant intercompany balances and transactions have been eliminated. The notes to consolidated financial statements, except where otherwise indicated, relate to continuing operations only.
Use of Estimates
The preparation of financial statements in conformity with U.S. generally accepted accounting principles ("GAAP") requires management to make estimates and assumptions that affect the reported amounts of assets and liabilities and disclosure of contingent assets and liabilities at the date of the financial statements and the reported amounts of revenues and expenses during the applicable reporting period. Due to the inherent uncertainty involved in making estimates, actual results could differ from those estimates.
Concentrations of Credit Risk and Major Customers
The Company's principal line of business is the mining and marketing of its metallurgical coal to foreign steel and coke producers. In 2012 and 2011, approximately 78% and 76%, respectively, of the
F-10
Company's revenues were derived from coal shipments to these customers, located primarily in Europe, South America, and Asia. At December 31, 2012 and 2011, approximately 50% and 63%, respectively, of the Company's net receivables related to these customers. During the years ended December 31, 2012 and 2011, no single customer accounted for 10% or more of consolidated revenues. In 2010, sales to a single customer represented 13.0% of consolidated revenues and sales to another single customer represented 10.3% of consolidated revenues. Credit is extended based on an evaluation of the customer's financial condition. In some instances, the Company requires letters of credit, cash collateral or prepayment for shipment from its customers to mitigate the risk of loss. These efforts have consistently led to minimal credit losses.
Revenue Recognition
Revenue is recognized when the following criteria have been met: persuasive evidence of an arrangement exists; the price to the buyer is fixed or determinable; delivery has occurred; and collectability is reasonably assured. Delivery is considered to have occurred at the time title and risk of loss transfers to the customer. For coal shipments via rail, delivery generally occurs when the railcar is loaded. For coal shipments via ocean vessel, delivery generally occurs when the vessel is loaded. For coke shipments via rail or truck, revenue is recognized when title and risk of loss transfer to the customer, generally at the point of shipment. For natural gas sales, delivery occurs when the gas has been transferred to the customer's pipeline.
Shipping and Handling
Costs to ship products to customers are included in cost of sales and amounts billed to customers, if any, to cover shipping and handling are included in sales.
Cash and Cash Equivalents
Cash and cash equivalents include short-term deposits and highly liquid investments that have original maturities of three months or less when purchased and are stated at cost, which approximates fair value.
Allowances for Losses
Allowances for losses on trade and other accounts receivables are based, in large part, upon judgments and estimates of expected losses and specific identification of problem trade accounts and other receivables. Significantly weaker than anticipated industry or economic conditions could impact customers' ability to pay such that actual losses may be greater than the amounts provided for in these allowances. The allowance for losses was $5.4 million and $6.7 million at December 31, 2012 and 2011, respectively.
Inventories
Inventories are valued at the lower of cost or market. For the years ended December 31, 2012, 2011 and 2010, the Company recognized lower of cost or market charges of $218.8 million, $20.1 million, and $4.7 million, respectively, which is included within cost of sales exclusive of depreciation and depletion in the accompanying Consolidated Statements of Operations. The Company recognized lower of cost or market charges of $17.4 million and $1 million within depreciation and depletion in the accompanying Consolidated Statements of Operations for the years ended December 31, 2012 and 2011. The Company's coal inventory costs include labor, supplies, equipment costs, operating overhead, freight, royalties and other related costs. As of December 31, 2012, all of the Company's coal inventories are determined using the first-in, first-out ("FIFO") inventory valuation method. The Company's supplies inventories are determined using the average cost method of
F-11
accounting. The valuation of coal inventories are subject to estimates due to possible gains and losses resulting from inventory movements from the mine site to storage facilities, inherent inaccuracies in belt scales and aerial surveys used to measure quantities and fluctuations in moisture content. Periodic adjustments to coal tonnages on hand are made for an estimate of coal shortages and overages due to these inherent gains and losses, primarily based on historical results from the results of aerial surveys and periodic coal pile clean-ups. Additionally, the Company evaluates its inventory in terms of excess and obsolete exposures. This evaluation includes such factors as anticipated usage, inventory turnover, inventory levels and ultimate market value.
Owned and Leased Mineral Interests
Costs to obtain coal reserves and lease mineral rights are capitalized based on the fair value at acquisition and depleted using the unit-of-production method over the life of proven and probable reserves. Lease agreements are generally long-term in nature (original terms range from 10 to 50 years) and substantially all of the leases contain provisions that allow for automatic extension of the lease term providing certain requirements are met. Depletion expense is included in depreciation and depletion in the accompanying Consolidated Statements of Operations and was $99.8 million, $59.3 million and $2.5 million for the years ended December 31, 2012, December 31, 2011, and 2010, respectively.
Property, Plant and Equipment
Property, Plant and Equipment
Property, plant and equipment are recorded at cost. Depreciation is recorded principally on the straight-line or units of production methods, whichever is deemed most appropriate over the estimated useful lives of the assets. Leasehold improvements are amortized on the straight-line method over the lesser of the useful life of the improvement or the remaining lease term. Estimated useful lives used in computing depreciation expense range from three to ten years for machinery and equipment, and from fifteen to thirty years for land improvements and buildings, well life for gas properties and related development, and mine life for mine development costs. Gains and losses upon disposition are reflected in the statement of operations in the period of disposition. Maintenance and repair expenditures are charged to expense as incurred.
Direct internal and external costs to implement computer systems and software are capitalized and are amortized over the estimated useful life of the system or software, generally three to five years, beginning when site installations or module development is complete and ready for its intended use.
Deferred Mine Development
Costs of developing new underground mines and certain underground expansion projects are capitalized. Underground development costs, which are costs incurred to make the coal physically accessible, may include construction permits and licenses, mine design, construction of access roads, main entries, airshafts, roof protection and other facilities. Costs of developing the first pit within a permitted area of a surface mine are capitalized up to the point of coal production attaining a level that would be more than de minimis. A surface mine is defined as the permitted mining area which includes various adjacent pits that share common infrastructure, processing equipment and a common coal reserve. Surface mine development costs include construction costs for entry roads, drilling, blasting and removal of overburden to access the first coal seam. Mine development costs are amortized primarily on a unit-of-production basis over the estimated reserve tons directly benefiting from the capital expenditures. Costs incurred during the production phase of a mine are capitalized into inventory and expensed to cost of sales as the coal is sold.
F-12
Capitalized Interest Costs
For the years ended December 31, 2012, 2011 and 2010, the Company capitalized interest costs in the amounts of $7.7 million, $5.4 million and $1.4 million, respectively.
Asset Retirement Obligations
The Company has certain asset retirement obligations, primarily related to reclamation efforts for its mining operations. These obligations are recognized at fair value in the period for which they are to be incurred and the carrying amount of the related long-lived asset is correspondingly increased. Over time, the liability is accreted to its future value. The corresponding asset cost capitalized at inception is amortized over the useful life of the asset. The present values of the Company's asset retirement obligations were $89.5 million and $75.0 million as of December 31, 2012 and 2011, respectively.
Natural Gas Exploration Activities
The Company accounts for its natural gas exploration activities under the successful efforts method of accounting. Costs of exploratory wells are capitalized pending determination of whether the wells found commercially sufficient quantities of proved reserves. If a commercially sufficient quantity of proved reserves is not discovered, any associated previously capitalized exploratory costs associated with the drilling area are expensed. Costs of producing properties and natural gas mineral interests are amortized using the unit-of-production method. Costs incurred to develop proved reserves, including the cost of all development wells and related equipment used in the production of natural gas, are capitalized and amortized using the unit-of-production method. Unit-of-production amortization rates are revised when events and circumstances indicate an adjustment is necessary, but at least once a year, and such revisions are accounted for prospectively as changes in accounting estimates.
Impairment of Long-Lived Assets
Property, plant and equipment and other long-lived assets are reviewed for impairment at least annually or whenever events or changes in circumstances indicate that the book value of the asset may not be recoverable. The Company periodically evaluates whether events and circumstances have occurred that indicate possible impairment. When impairment indicators exist, the Company uses an estimate of the future undiscounted net cash flows of the related asset or asset group over the remaining life in measuring whether or not the asset values are recoverable. If the carrying amount of an asset or asset groups exceeds its estimated future cash flows, impairment is recognized equal to the amount by which the carrying amount of the asset exceeds the fair value of the asset or asset groups. Fair value is generally determined using market quotes, if available, or a discounted cash flow approach. There were no significant impairments of long-lived assets during the years ended December 31, 2011 or 2010. However, during the year ended December 31, 2012 the Company recorded impairment charges relating to a natural gas exploration project in the U.S. Operations segment and asset impairment charges related to the impairment of property, plant and equipment at our Aberpergwm mine as certain carrying values of certain asset groups exceeded their fair value. See Note 5 for additional discussion on asset impairment matters.
Goodwill
Goodwill represents the excess of the purchase price over the fair value assigned to the net tangible and identifiable intangible assets acquired in a business combination. Goodwill is not amortized but instead is tested for impairment at a minimum annually unless circumstances indicate a possible impairment may exist. The Company performs its annual goodwill testing as of the beginning of the fourth quarter at the reporting unit level. An impairment loss generally would be recognized when the carrying amount of the reporting unit exceeds the fair value of the reporting unit. The fair
F-13
value of each reporting unit is determined using a market approach, an income approach or a combination of each. A number of significant assumptions and estimates are involved in determining fair value of the reporting unit including markets, sales volumes and prices, costs to produce, capital spending, working capital changes and the discount rate. Management considers historical experience and all available information at the time the fair values of its reporting units are estimated. During the year ended December 31, 2012, the Company performed an interim goodwill impairment test and, as a result, a goodwill impairment charge of $1.1 billion was recorded. See Note 4 for additional discussion on goodwill impairment matters.
Workers' Compensation and Pneumoconiosis ("Black Lung") Benefits
We are insured for workers' compensation benefits for work related injuries that occur within our U.S. operations. We retain the first $1 million to $2 million per accident for all of our U.S. subsidiaries and are fully insured above the deductible for statutory limits, with the exception of Jim Walter Resources located in Alabama, where we retain any amount in excess of $10 million per accident. Liabilities, including those related to claims incurred but not reported, are recorded principally using annual valuations based on discounted future expected payments and using historical data of the division or combined insurance industry data when historical data is limited. Workers' compensation liabilities were as follows (in thousands):
| |
December 31, | ||||||
|---|---|---|---|---|---|---|---|
| |
2012 | 2011 | |||||
Undiscounted aggregated estimated claims to be paid |
$ | 47,043 | $ | 43,501 | |||
Workers' compensation liability recorded on a discounted basis |
$ | 40,477 | $ | 36,987 | |||
The Company applies a discount rate at a risk-free interest rate, generally a U.S. Treasury bill rate, for each policy year. The rate used is one with a duration that corresponds to the weighted average expected payout period for each policy year. Once a discount rate is applied to a policy year, it remains the discount rate for that year until all claims are paid. The weighted average rate used for discounting the 2012 policy year liability at December 31, 2012 was 0.68%. A one-percentage-point increase in the discount rate on the discounted claims liability would decrease the liability by $0.2 million, while a one-percentage-point decrease in the discount rate would increase the liability by $0.1 million.
The Company is responsible for medical and disability benefits for black lung disease under the Federal Coal Mine Health and Safety Act of 1969, as amended, and is self-insured for certain amounts of black lung related claims. The Company performs an annual evaluation of the overall black lung liabilities at the December 31st balance sheet date. The calculation is performed using assumptions regarding rates of successful claims, discount factors, benefit increases and mortality rates, among others. The present value of the obligation recorded by the Company using a discount factor of 4.44% for 2012 and 5.14% for 2011 was $17.9 million and $12.0 million as of December 31, 2012 and 2011, respectively. A one-percentage-point increase in the discount rate on the discounted claims liability would decrease the liability by $3.1 million, while a one-percentage-point decrease in the discount rate would increase the liability by $4.1 million.
Derivative Instruments and Hedging Activities
The Company enters into interest rate hedge agreements in accordance with the Company's internal debt and interest rate risk management policy, which is designed to mitigate risks related to floating rate financing agreements that are subject to changes in the market rate of interest. Changes in the fair value of interest rate hedge agreements that are designated and effective as hedges are recorded in accumulated other comprehensive income (loss) ("OCI"). Deferred gains or losses are reclassified from OCI to the statement of operations in the same period as the underlying transactions are recorded and are recognized in the caption, interest expense. Changes in the fair value of interest
F-14
rate hedge agreements that are not effective as hedges would be recorded immediately in the statement of operations as interest expense.
To protect against the reduction in the value of forecasted cash flows resulting from sales of natural gas, the Company periodically engages in a natural gas hedging program. The Company periodically hedges portions of its forecasted revenues from sales of natural gas with natural gas derivative contracts, generally either "swaps" or "collars". The Company enters into natural gas derivatives that effectively convert a portion of its forecasted sales at floating-rate natural gas prices to a fixed-rate basis, thus reducing the impact of natural gas price changes on revenues. When natural gas prices fall, the decline in value of future natural gas sales is offset by gains in the value of swap contracts designated as hedges. Conversely, when natural gas prices rise, the increase in the value of future cash flows from natural gas sales is offset by losses in the value of the swap contracts. Changes in the fair value of natural gas derivative agreements that are designated and effective as hedges are recorded in OCI. Deferred gains or losses are reclassified from OCI and recognized as miscellaneous income in the statement of operations in the same period as the underlying transactions are recognized. Changes in the fair value of natural gas hedge agreements that are not effective as hedges or are not designated as hedges would be recorded immediately in the statement of operations as miscellaneous income.
During the three years ended December 31, 2012, the Company did not hold any non-derivative instruments designated as hedges or any derivatives designated as fair value hedges. In addition, the Company does not enter into derivative financial instruments for speculative or trading purposes. Derivative contracts are entered into only with counterparties that management considers creditworthy. Cash flows from hedging activities are reported in the statement of cash flows in the same classification as the hedged item, generally as a component of cash flows from operations.
Foreign Currency Translation
The functional currency of the Company's Canadian operations is the U.S. dollar, while the U.K. operation's functional currency is the British Pound. Our Canadian operations monetary assets and liabilities are remeasured at period end exchange rates while non-monetary items are remeasured at historical rates. Income and expense accounts are remeasured at the average rates in effect during the year, except for those expenses related to balance sheet amounts that are remeasured at historical exchange rates. Our U.K. operations assets and liabilities are translated using exchange rates in effect at the end of the period, and revenues and costs are translated using average exchange rates for the period. For the Company's Canadian operations, gains and losses from foreign currency remeasurement related to tax balances are included as a component of income tax expense while all other remeasurement gains and losses are included in miscellaneous income (expense). For the Company's U.K. operations, foreign currency translation adjustments are reported in OCI. The foreign currency remeasurement loss recognized in miscellaneous income for the year ended December 31, 2012 was $3.1 million compared to a gain of $3.8 million for the year ended December 31, 2011.
Stock-Based Compensation
The Company periodically grants stock-based awards to employees and its Board of Directors and records the related compensation expense during the period of vesting. This compensation expense results in a corresponding credit to capital in excess of par value and the expense is generally recognized in selling, general and administrative expenses and cost of sales, as appropriate, utilizing the graded vesting method for stock options and the straight-line method for restricted stock units. The Company uses the Black- Scholes option pricing model to value its stock option grants and estimates forfeitures in calculating the expense related to stock-based compensation. See Note 7 for additional information on stock-based compensation.
F-15
Environmental Expenditures
The Company capitalizes environmental expenditures that increase the life or efficiency of property or that reduce or prevent environmental contamination. The Company accrues for environmental expenses resulting from existing conditions that relate to past operations when the costs are probable and reasonably estimable. See Note 18 for additional discussion of environmental matters.
Deferred Financing Costs
The costs to obtain new debt financing or amend existing financing agreements are deferred and amortized to interest expense over the life of the related indebtedness or credit facility using the effective interest method. The unamortized balance of deferred financing costs was $70.0 million and $65.2 million at December 31, 2012 and 2011, respectively. Amounts classified as current were $17.5 million and $15.2 at December 31, 2012 and 2011, respectively. Current amounts are included in other current assets and non-current amounts are included in other long-term assets in the accompanying consolidated balance sheets.
Income (Loss) per Share
The Company calculates basic income (loss) per share based on the weighted average common shares outstanding during each period and diluted income (loss) per share based on weighted average common shares and dilutive common equivalent shares outstanding during each period. Dilutive common equivalent shares include the dilutive effect of stock awards, see Note 17.
NOTE 3—Acquisitions
Western Coal Corp. On November 18, 2010, the Company announced its intent to acquire all of the outstanding common shares of Western Coal. Through this acquisition, the Company acquired high quality metallurgical coal mines in Northeast British Columbia (Canada), high quality metallurgical coal and compliant thermal coal mines located in West Virginia (United States), and a high quality anthracite coal mine located in South Wales (United Kingdom). The acquisition of Western Coal substantially increased the Company's reserves available for future production, the majority of which is high-quality metallurgical coal, and created a diverse geographical footprint with strategic access to high-growth steel-producing countries in both the Atlantic and Pacific basins.
On November 17, 2010, the Company entered into a share purchase agreement with various funds advised by Audley Capital to purchase approximately 54.5 million common shares, or 19.8%, of the outstanding common shares of Western Coal for $11.50 Canadian dollars per share in two separate transactions. On December 2, 2010, the Company entered into an arrangement agreement with Western Coal to acquire all the remaining outstanding common shares of Western Coal for $11.50 Canadian dollars per share in cash or 0.114 of a Walter Energy share, or for a combination thereof at the holder's election, subject to proration.
In January 2011, the Company completed the first transaction to acquire 25,274,745 common shares of Western Coal, or 9.15% of the outstanding shares, from funds advised by Audley Capital. The shares were purchased for $293.7 million in cash and had a fair value of $314.2 million on April 1, 2011. The Company recognized a gain on April 1, 2011 of $20.5 million as a result of remeasuring to fair value the Western Coal shares acquired from Audley Capital which is included in other income in the Consolidated Statements of Operations for the year ended December 31, 2011. On April 1, 2011, the Company acquired the remaining outstanding common shares of Western Coal (including the second Audley Capital transaction) for a combination of $2.2 billion in cash and the issuance of 8,951,558 common shares of Walter Energy valued at $1.2 billion. The fair value of Walter Energy's common stock on April 1, 2011 was $136.75 per share based on the closing value on the New York Stock Exchange. The cash portion was funded with part of the proceeds from the $2.7 billion credit
F-16
facility discussed in Note 14. All of the outstanding options to purchase Western Coal common shares that were not exercised prior to the acquisition were exchanged for fully-vested and immediately exercisable options to purchase shares of Walter Energy common stock. The Company issued 193,498 stock options in exchange for the Western Coal stock options outstanding as of April 1, 2011. The stock options issued had a fair value of $15.5 million, which was estimated using the Black-Scholes option pricing model. The outstanding warrants of Western Coal were not directly affected by the acquisition. Instead, upon exercise each warrant entitled the holder to receive cash and shares of Walter Energy common stock that would have been issued if the warrants had been exercised immediately before closing the acquisition. During the year ended December 31, 2012, the warrants were exercised (or expired) resulting in a cash payment of $11.5 million and the issuance of 18,938 additional shares of common stock. As of December 31, 2012 no warrants of Western Coal were outstanding.
The purchase consideration has been allocated to the assets acquired and liabilities assumed based upon their estimated fair values at the date of acquisition. Fair values were determined using the income, cost and market price valuation methods as deemed appropriate. During the 2012 first quarter, the Company completed the valuation of the assets and liabilities with the assistance of an independent third party and recorded refinement adjustments to the preliminary purchase price allocation. These refinements were primarily around the areas of acquired mineral interests including estimates for future costs, production volumes and timing which resulted in a $94.0 million increase in fair value allocated to mineral interests as compared to the December 31, 2011 preliminary fair value. This also resulted in a decrease in goodwill of $57.8 million and the deferred tax liability was increased by $25.5 million reflecting an increase in future depletion expense not deductible for tax. Retrospective application of the changes made to the allocation of the purchase consideration in the 2012 first quarter increased retained earnings, a component of stockholders' equity, as of December 31, 2011 and net income for the year ended December 31, 2011 by $14.4 million. The increase to retained earnings resulting from the change in net income was primarily due to a decrease in mineral interests depletion related to 2011.
The following table summarizes the Company's recast and previously reported December 31, 2011 Consolidated Balance Sheet amounts (in thousands):
| |
Recast December 31, 2011(1) |
December 31, 2011(2) |
|||||
|---|---|---|---|---|---|---|---|
ASSETS |
|||||||
Inventories |
$ | 240,437 | $ | 242,607 | |||
Other current assets |
$ | 45,649 | $ | 45,627 | |||
Mineral interests, net |
$ | 3,056,258 | $ | 2,946,113 | |||
Property, plant and equipment, net |
$ | 1,631,333 | $ | 1,637,182 | |||
Goodwill |
$ | 1,066,754 | $ | 1,124,597 | |||
LIABILITIES AND STOCKHOLDERS' EQUITY |
|||||||
Other current liabilities |
$ | 63,757 | $ | 59,827 | |||
Deferred income taxes |
$ | 1,029,336 | $ | 1,003,383 | |||
Retained earnings |
$ | 744,939 | $ | 730,517 | |||
- (1)
- As
presented in the accompanying consolidated financial statements contained herein within this Form 10-K.
- (2)
- As previously presented in the 2011 consolidated financial statements in the Company's Annual Report on Form 10-K for the fiscal year ended December 31, 2011.
F-17
The following table summarizes the Company's recast and previously reported December 31, 2011 Consolidated Statement of Operations amounts (in thousands):
| |
Recast December 31, 2011(1) |
December 31, 2011(2) |
|||||
|---|---|---|---|---|---|---|---|
For the year ended: |
|||||||
Depreciation and depletion |
$ | 230,681 | $ | 245,509 | |||
Operating income |
573,431 | 558,603 | |||||
Income from continuing operations before income tax expense |
494,823 | 479,995 | |||||
Income tax expense |
131,225 | 130,819 | |||||
Income from continuing operations |
363,598 | 349,176 | |||||
Net income |
363,598 | 349,176 | |||||
Net income per share: |
|||||||
Basic |
$ | 6.03 | $ | 5.79 | |||
Diluted |
$ | 6.00 | $ | 5.76 | |||
- (1)
- As
presented in the accompanying consolidated financial statements contained herein within this Form 10-K.
- (2)
- As previously presented in the 2011 consolidated financial statements in the Company's Annual Report on Form 10-K for the fiscal year ended December 31, 2011.
The following table summarizes the Company's recast and previously reported December 31, 2011 Consolidated Statement of Cash Flows amounts (in thousands):
| |
For the year ended December 31, |
||||||
|---|---|---|---|---|---|---|---|
| |
Recast 2011(1) |
2011(2) | |||||
Net Income |
$ | 363,598 | $ | 349,176 | |||
Adjustments to reconcile net income to net cash flows provided by (used in) operating activities: |
|||||||
Depreciation and depletion |
$ | 230,681 | $ | 245,509 | |||
Deferred income tax credit |
$ | 66,803 | $ | 66,397 | |||
- (1)
- As
presented in the accompanying consolidated financial statements contained herein within this Form 10-K.
- (2)
- As previously presented in the 2011 consolidated financial statements in the Company's Annual Report on Form 10-K for the fiscal year ended December 31, 2011.
The following tables summarize the purchase consideration, the preliminary purchase price allocation reported in the Company's Annual Report on Form 10-K for the fiscal year ended December 31, 2011, the final purchase price allocation, and the applicable recast adjustments made upon finalization during the quarter ended March 31, 2012 (in thousands):
Purchase consideration: |
||||
Cash |
$ | 2,173,080 | ||
Fair value of shares of common stock issued |
1,224,126 | |||
Fair value of stock options issued and warrants |
34,765 | |||
Fair value of consideration transferred |
3,431,971 | |||
Fair value of equity interest in Western Coal held before the acquisition |
314,231 | |||
Total consideration |
$ | 3,746,202 | ||
F-18
| |
Preliminary December 31, 2011 |
Recast Adjustments |
Final | |||||||
|---|---|---|---|---|---|---|---|---|---|---|
Fair value of assets acquired and liabilities assumed: |
||||||||||
Cash and cash equivalents |
$ | 34,065 | $ | — | $ | 34,065 | ||||
Receivables |
163,668 | — | 163,668 | |||||||
Inventories |
121,229 | — | 121,229 | |||||||
Other current assets |
86,475 | 23 | 86,498 | |||||||
Mineral interests |
2,992,000 | 94,000 | 3,086,000 | |||||||
Property, plant and equipment |
560,894 | (6,702 | ) | 554,192 | ||||||
Goodwill |
1,122,884 | (57,844 | ) | 1,065,040 | ||||||
Other long-term assets |
54,150 | — | 54,150 | |||||||
Total assets |
5,135,365 | 29,477 | 5,164,842 | |||||||
Accounts payable and accrued liabilities |
184,983 | — | 184,983 | |||||||
Other current liabilities |
82,175 | 3,930 | 86,105 | |||||||
Deferred tax liability |
1,021,161 | 25,547 | 1,046,708 | |||||||
Other long-term liabilities |
100,844 | — | 100,844 | |||||||
Total liabilities |
1,389,163 | 29,477 | 1,418,640 | |||||||
Net assets acquired |
$ | 3,746,202 | $ | — | $ | 3,746,202 | ||||
Goodwill represents the excess of the purchase consideration transferred over the fair value of the identifiable assets acquired and liabilities assumed. The Company recognized goodwill of $1.1 billion. Goodwill was assigned to the Canadian and U.K. Operations segment and the U.S. Operations segment in the amounts of $992.4 million and $72.6 million, respectively. None of the goodwill is deductible for income tax purposes. The Company incurred acquisition costs related to the purchase of approximately $23.2 million during the year ended December 31, 2011, which is included in selling, general and administrative expenses in the Company's Consolidated Statements of Operations.
The unaudited supplemental pro forma information presented below includes the effects of the Western Coal acquisition as if it had been completed as of January 1, 2010. The pro forma results include (i) the impact of certain estimated fair value adjustments, including additional estimated depreciation and depletion expense associated with the acquired mineral interests and property, plant and equipment and (ii) interest expense associated with debt used to fund the acquisition. The pro forma results for the year ended December 31, 2010 include adjustments for the financial impact of certain acquisition related items incurred during the year ended December 31, 2011. Accordingly, the following unaudited pro forma financial information should not be considered indicative of either future results or results that might have occurred had the acquisition been consummated as of January 1, 2010 (in thousands):
| |
For the years ended December 31, |
||||||
|---|---|---|---|---|---|---|---|
| |
Recast 2011 |
2010 | |||||
Total revenues |
|||||||
As reported(1) |
$ | 2,571,358 | $ | 1,587,730 | |||
Pro forma |
$ | 2,795,566 | $ | 2,358,040 | |||
Income (loss) from continuing operations |
|||||||
As reported(1) |
$ | 363,598 | $ | 389,425 | |||
Pro forma |
$ | 418,419 | $ | 342,693 | |||
- (1)
- As presented in the accompanying consolidated financial statements contained herein within this Form 10-K.
North River Mine On May 6, 2011, the Company acquired the North River thermal coal mine in Fayette and Tuscaloosa Counties of Alabama from a subsidiary of Chevron Corporation for $1.1 million
F-19
in cash and the assumption of certain liabilities totaling approximately $90.9 million, including a $70.0 million below-market coal sales contract liability. The below-market contract has a remaining term of fourteen months as of December 31, 2012. Contracts acquired in this acquisition are recorded at fair value and are amortized into revenues over the tons of coal sold during the contract term. The Company recognized goodwill of $1.7 million. The purchase consideration has been allocated to the assets acquired and liabilities assumed based upon their estimated fair values at the date of acquisition. The results of this operation have been included in the consolidated financial statements of the Company since the acquisition date.
HighMount Exploration & Production Alabama, LLC On May 28, 2010, the Company acquired HighMount Exploration & Production Alabama, LLC's ("HighMount") coal bed methane business for a cash payment of $210.0 million and renamed the business Walter Black Warrior Basin, LLC ("WBWB"). The fair value of the assets acquired and liabilities assumed totaled $217.6 million and $7.6 million, respectively. The Company incurred acquisition costs related to the purchase of approximately $2.7 million, which is included in selling, general and administrative expenses in the Company's Consolidated Statement of Operations. The acquisition of the coal bed methane operations included approximately 1,300 existing conventional gas wells, pipeline infrastructure and related equipment located adjacent to the Company's existing underground mining and coal bed methane business in Alabama. Current proven reserves are approximately 47 bcf (billion cubic feet), with annual coal bed methane production of approximately 5.8 bcf expected. The acquisition of this natural gas business, included in the U.S. Operations segment, helps ensure that future coal production areas will be properly degasified, thereby improving safety and operating efficiency of the Company's existing underground metallurgical coal production.
WBWB's financial results have been included in the Company's financial statements since the date of acquisition. The inclusion of this business for did not have a material effect on either the Company's revenues or operating income and the Company does not expect the results of this business to have a material effect in the foreseeable future. Assets acquired and liabilities assumed were recorded at estimated fair value as of the acquisition date. Fair values were determined using the income, cost and market price valuation methods as deemed appropriate. The following table summarizes the fair value of the assets acquired and liabilities assumed at the acquisition date (in thousands):
Fair value of assets acquired and liabilities assumed: |
||||
Receivables |
$ | 5,439 | ||
Other current assets |
340 | |||
Property, plant and equipment |
210,323 | |||
Identifiable intangible asset |
1,505 | |||
Total assets |
217,607 | |||
Accounts payable & accrued liabilities |
(4,282 | ) | ||
Asset retirement obligations |
(3,361 | ) | ||
Total liabilities |
(7,643 | ) | ||
Net assets acquired |
$ | 209,964 | ||
NOTE 4—Goodwill Impairment
During 2012, domestic and international metallurgical coal markets deteriorated due to an oversupply of coal as a result of a decline in steelmaking activity due to weak economic activity in Europe and Asia and the increased production of metallurgical coal as a result of the settlement of labor unrest issues in Australia. The changes to the near-term market outlook resulted in the Company reviewing its operating strategy and related capital investment projects during the third quarter. Based on this review, the Company decided to reduce capital spending for the remainder of 2012 and 2013 and to temporarily curtail mining operations at certain mines in its Canadian and U.K. Operations
F-20
segment. In addition, there was a significant decrease in the market price of our common stock during this period.
The changes to the near-term market outlook combined with planned reductions in capital spending, plans to curtail mining operations at certain mines in our Canadian and U.K. Operations segment, and a significant decrease in our stock price indicated that the fair value of the Company's goodwill could be less than its carrying value. Accordingly, the Company performed an interim goodwill impairment test as of July 31, 2012 and recorded a goodwill impairment charge of $1.1 billion to reduce the carrying value of goodwill to its implied fair value for two reporting units in the U.S. Operations segment and two reporting units in the Canadian and U.K. Operations segment.
The market approach was utilized to estimate the fair value of three of our four reporting units and the income approach was used for one reporting unit where there were no market comparable data available. The market approach is based on a guideline public company methodology. Under the guideline public company method, certain operating metrics from a selected group of publicly traded guideline companies that have operations similar to the Company's reporting units were used to estimate the fair value of the reporting units. The income approach is based on a discounted cash flow methodology in which expected future net cash flows are discounted to present value, using an appropriate after-tax weighted average cost of capital. The valuation methodology utilized to allocate the estimated fair value of the reporting units to the underlying assets and liabilities contained within the individual reporting units for the goodwill impairment test was primarily based on an income approach. The income approach uses future discounted cash flow estimates in which future net cash flows projected to result from such assets were discounted to present value using an appropriate after-tax weighted average cost of capital. The table below summarizes the impact of the goodwill impairment for the impacted reporting segments.
| |
Recast December 31, 2011 |
Other—Primarily Currency Translation |
Impairments | Balance as of December 31, 2012 |
|||||||||
|---|---|---|---|---|---|---|---|---|---|---|---|---|---|
Goodwill, net: |
|||||||||||||
U.S. Operations |
$ | 74,320 | $ | — | $ | (74,320 | ) | $ | — | ||||
Canadian and U.K. Operations |
992,434 | (2,345 | ) | (990,089 | ) | — | |||||||
Total goodwill |
$ | 1,066,754 | $ | (2,345 | ) | $ | (1,064,409 | ) | $ | — | |||
NOTE 5—Asset Impairment and Restructuring
U.S. GAAP requires that a long-lived asset group that is held and used should be reviewed for impairment whenever events or changes in circumstances indicate that the carrying amount of the long-lived asset group might not be recoverable. Due to reduced metallurgical coal demand and a corresponding reduction in selling prices, we reduced production at two of our three Canadian mines and at our West Virginia Maple mine in the U.S., restrained spending in our Canadian and U.K. Operations segment and significantly lowered development spending at the Aberpergwm underground coal mine in the U.K.
In connection with the plans to reduce development spending at the Aberpergwm underground coal mine in the fourth quarter 2012, the Company recorded restructuring and asset impairment charges of $9.1 million, of which $6.0 million related to severance and other obligations and $3.1 million related to the impairment of property, plant and equipment as the carrying values of certain assets exceeded their fair value.
In connection with the evaluation of our operating projects, management reviewed a shale natural gas exploration project that has not yet proved capable of providing commercially sufficient quantities of proven reserves to be economical. As a result of this review, management decided to indefinitely abandon this natural gas exploration project. This project was accounted for under the successful efforts accounting method under U.S. GAAP which provides that if a commercially sufficient quantity
F-21
of proved reserves is not discovered, any previously capitalized exploratory costs associated with the drilling are expensed. Accordingly, the Company recorded a pre-tax charge of $40 million ($25 million after-tax) to write-off the capitalized exploratory costs associated with the natural gas exploration project in the third quarter of 2012.
NOTE 6—Discontinued Operations
Spin-off of Financing In 2009, the Company completed the spin-off of its Financing business and the merger of that business with Hanover Capital Mortgage Holdings, Inc. to create Walter Investment Management Corp. ("Walter Investment"), which operates as a publicly traded Company. The subsidiaries and assets that Walter Investment owned at the time of the spin-off included all assets of Financing except for those associated with the workers' compensation program and various other run-off insurance programs within Cardem Insurance Co., Ltd. As a result of the spin-off, the Company no longer has any ownership interest in Walter Investment. Amounts previously reported in the Financing segment are presented as discontinued operations for the year ended December 31, 2010.
Closure of Homebuilding In 2008, the Company made the decision to close the Homebuilding business. This decision was reached despite the efforts of management and employees, including a major restructuring during 2008 that closed nearly half of the sales centers. After the decision was made, the Company immediately took steps to liquidate the remaining assets and wind down the business. This wind down was substantially complete in 2009 and as a result, the Company has reported the results of operations and cash flows of the Homebuilding segment as discontinued operations for the year ended December 31, 2010.
Closure of Kodiak Mining Co. In 2008, the Company announced the permanent closure of the underground coal mine operations of Kodiak Mining Company, LLC ("Kodiak") due to high operational costs, difficult operating conditions and a challenging pricing environment for Kodiak's product. During the quarter ended June 30, 2012, the Company divested the Kodiak assets and liabilities for cash proceeds of $9.5 million. The sale resulted in an after-tax gain of $5.2 million. The Company has reported the results of operations and cash flows of Kodiak as discontinued operations for the years ended December 31, 2012 and 2010. The Kodiak operations did not have a material impact on either the Company's revenues or operating income for the year ended December 31, 2011 and as such was not reported as discontinued operations.
The table below presents the significant components of operating results included in income (loss) from discontinued operations (primarily Financing, Homebuilding and Kodiak) for the years ended December 31, 2012, and 2010 (in thousands):
| |
For the years ended December 31, |
||||||
|---|---|---|---|---|---|---|---|
| |
2012 | 2010 | |||||
Sales and revenues |
$ | — | $ | 4,293 | |||
Other income, net |
$ | 8,282 | $ | — | |||
Income (loss) from discontinued operations before income tax expense (benefit) |
$ | 8,282 | $ | (5,856 | ) | ||
Income tax expense (benefit) |
3,102 | (2,228 | ) | ||||
Income (loss) from discontinued operations |
$ | 5,180 | $ | (3,628 | ) | ||
Prior to discontinuing these operations, the Company allocated certain corporate expenses, limited to specifically identified costs and other corporate shared services which supported segment operations, to discontinued operations. These costs represented expenses that had historically been allocated to and recorded by the Company's operating segments as selling, general and administrative expenses. The Company did not elect to allocate corporate interest expense to discontinued operations.
F-22
NOTE 7—Equity Award Plans
The stockholders of the Company approved the 2002 Long-Term Incentive Award Plan (the "2002 Plan"), under which an aggregate of 4.3 million shares of the Company's common stock, as restated to reflect the modification for the Financing spin-off, have been reserved for grant and issuance of incentive and non-qualified stock options, stock appreciation rights and stock awards.
Under the 2002 Plan, an option becomes exercisable at such times and in such installments as set by the Compensation Committee of the Board of Directors (generally, vesting occurs over three years in equal annual increments), but no option will be exercisable after the tenth anniversary of the date on which it is granted. The Company may also issue nonvested share (restricted stock) awards. The Company has issued nonvested restricted stock awards which generally fully vest after three years of continuous employment or over three years in equal annual increments.
Upon completion of the Western Coal acquisition, all of the outstanding options to purchase Western Coal common shares that were not exercised prior to the acquisition were exchanged for fully-vested and immediately exercisable Walter Energy stock options. The Company issued 193,498 stock options in exchange for the Western Coal stock options outstanding as of April 1, 2011.
For the years ended December 31, 2012, 2011 and 2010, the Company recorded stock-based compensation expense for its continuing operations related to equity awards totaling approximately $7.3 million, $9.2 million, and $3.3 million, respectively. These amounts are included in selling, general and administrative expenses and have been allocated to the reportable segments. The total income tax benefits in the Company's continuing operations recognized in the statements of operations for share-based compensation arrangements were $2.7 million, $3.2 million, and $1.2 million during 2012, 2011 and 2010, respectively.
A summary of activity related to stock options during the year ended December 31, 2012, is presented below:
| |
Shares | Weighted Average Exercise Price |
Weighted Average Remaining Contractual Term (in years) |
Aggregate Intrinsic Value ($000) |
|||||||||
|---|---|---|---|---|---|---|---|---|---|---|---|---|---|
Outstanding at December 31, 2011 |
495,324 | $ | 43.13 | ||||||||||
Granted |
87,192 | $ | 62.88 | ||||||||||
Exercised |
(26,163 | ) | $ | 6.11 | |||||||||
Forfeited or expired |
(14,984 | ) | $ | 97.71 | |||||||||
Outstanding at December 31, 2012 |
541,369 | $ | 46.58 | 5.3 | $ | 3,808 | |||||||
Exercisable at December 31, 2012 |
418,879 | $ | 38.09 | 4.3 | $ | 3,811 | |||||||
Weighted average assumptions used to determine the grant-date fair value of options granted were:
| |
For the year ended December 31, |
|||||||||
|---|---|---|---|---|---|---|---|---|---|---|
| |
2012 | 2011(1) | 2010 | |||||||
Risk free interest rate |
0.85 | % | 0.88 | % | 2.22 | % | ||||
Dividend yield |
0.55 | % | 0.52 | % | 0.75 | % | ||||
Expected life (years) |
4.95 | 2.46 | 5.10 | |||||||
Volatility |
75.79 | % | 57.51 | % | 69.64 | % | ||||
- (1)
- Includes fully vested replacement stock options issued on April 1, 2011 in connection with the acquisition of Western Coal described in Note 3, which significantly reduced the expected life as compared to prior periods.
The risk-free interest rate is based on the U.S. Treasury yield in effect at the time of grant with a term equal to the expected life. The expected dividend yield is based on the Company's estimated
F-23
annual dividend payout at grant date. The expected term of the options represents the period of time the options are expected to be outstanding. Expected volatility is based on historical volatility of the Company's share price for the expected term of the options.
A summary of activity related to nonvested restricted stock units during the year ended December 31, 2012, is as follows:
| |
Shares | Aggregate Intrinsic Value ($000) |
Weighted Average Remaining Contractual Term in Years |
|||||||
|---|---|---|---|---|---|---|---|---|---|---|
Outstanding at December 31, 2011 |
163,247 | |||||||||
Granted |
65,312 | |||||||||
Vested |
(43,888 | ) | ||||||||
Forfeited or expired |
(35,400 | ) | ||||||||
Outstanding at December 31, 2012 |
149,271 | $ | 5,356 | 1.11 | ||||||
The weighted-average grant-date fair values of stock options granted during the years ended December 31, 2012, 2011 and 2010 were $36.97, $81.82 and $46.43, respectively. The weighted-average grant-date fair values of nonvested restricted stock units granted during the years ended December 31, 2012, 2011 and 2010 were $63.17, $133.15 and $82.30, respectively. The total amount of cash received from exercise of stock options was $0.2 million, $8.9 million and $17.1 million for the years ended December 31, 2012, 2011 and 2010, respectively. The total intrinsic value of stock options exercised and restricted stock vested during 2012 was $1.4 million and $1.6 million, respectively, and the total intrinsic value of stock options exercised and restricted stock vested during 2011 was $24.2 million and $7.7 million, respectively. The total intrinsic value of stock options exercised or restricted stock vested during 2010 was $43.1 million and $11.0 million, respectively. The total fair value of restricted stock units vested during the years 2012, 2011 and 2010 was $0.5 million, $4.9 million and $5.8 million respectively.
Unrecognized compensation costs related to nonvested share-based compensation arrangements granted were approximately $7.1 million, $12.6 million and $2.3 million as of December 31, 2012, 2011 and 2010, respectively. These costs are to be recognized over a weighted average period of 1.7 years.
Employee Stock Purchase Plan
All full-time employees of the Company who have attained the age of majority in the country in which they reside are eligible to participate in the employee stock purchase plan, which was adopted in January 1996 and amended in April 2004. The Company contributes a sum equal to 15% (20% after five years of continuous participation) of each participant's actual payroll deduction as authorized, and remits such funds to a designated brokerage firm that purchases, in the open market, shares of the Company's common stock for the accounts of the participants. The total number of shares that may be purchased under the plan is 3.5 million. Total shares purchased under the plan during the years ended December 31, 2012, 2011 and 2010 were approximately 86,200, 29,500 and 20,000, respectively, and the Company's contributions recognized as expense were approximately $0.5 million, $0.4 million and $0.2 million, respectively, during such years.
F-24
NOTE 8—Receivables
Receivables are summarized as follows (in thousands):
| |
December 31, | ||||||
|---|---|---|---|---|---|---|---|
| |
2012 | 2011 | |||||
Trade receivables |
$ | 154,081 | $ | 233,568 | |||
Other receivables |
108,253 | 86,493 | |||||
Less: Allowance for losses |
(5,367 | ) | (6,718 | ) | |||
Receivables, net |
$ | 256,967 | $ | 313,343 | |||
NOTE 9—Inventories
Inventories are summarized as follows (in thousands):
| |
December 31, | ||||||
|---|---|---|---|---|---|---|---|
| |
2012 | 2011 | |||||
Coal |
$ | 228,910 | $ | 180,537 | |||
Raw materials and supplies |
77,108 | 59,900 | |||||
Total inventories |
$ | 306,018 | $ | 240,437 | |||
NOTE 10—Mineral Interests and Property, Plant and Equipment
The book value of mineral interests totaled $3,145.2 million and $3,140.5 million as of December 31, 2012 and 2011, respectively. Accumulated amortization totaled $179.6 million and $84.2 million as of December 31, 2012 and 2011, respectively.
Property, plant and equipment are summarized as follows (in thousands):
| |
December 31, | ||||||
|---|---|---|---|---|---|---|---|
| |
2012 | 2011 | |||||
Land |
$ | 87,088 | $ | 85,439 | |||
Land improvements |
19,949 | 14,484 | |||||
Buildings and leasehold improvements |
362,296 | 562,263 | |||||
Mine development costs |
270,768 | 36,796 | |||||
Machinery and equipment |
1,402,417 | 991,794 | |||||
Gas properties and related development |
223,200 | 222,711 | |||||
Construction in progress |
163,096 | 332,474 | |||||
Total |
2,528,814 | 2,245,961 | |||||
Less: Accumulated depreciation and depletion |
(796,683 | ) | (614,628 | ) | |||
Net |
$ | 1,732,131 | $ | 1,631,333 | |||
NOTE 11—Income Taxes
Income tax expense (benefit) applicable to continuing operations consists of the following (in thousands):
| |
For the years ended December 31, | |||||||||||||||||||||||||||
|---|---|---|---|---|---|---|---|---|---|---|---|---|---|---|---|---|---|---|---|---|---|---|---|---|---|---|---|---|
| |
2012 | 2011 | 2010 | |||||||||||||||||||||||||
| |
Current | Deferred | Total | Current | Deferred | Total | Current | Deferred | Total | |||||||||||||||||||
Federal |
$ | 49,236 | $ | (45,330 | ) | $ | 3,906 | $ | 37,307 | $ | 80,701 | $ | 118,008 | $ | 77,400 | $ | 75,579 | $ | 152,979 | |||||||||
State |
3,860 | (1,747 | ) | 2,113 | 6,226 | 3,108 | 9,334 | 27,597 | 7,595 | 35,192 | ||||||||||||||||||
Foreign |
(20,080 | ) | (85,143 | ) | (105,223 | ) | 20,889 | (17,006 | ) | 3,883 | — | — | — | |||||||||||||||
Total |
$ | 33,016 | $ | (132,220 | ) | $ | (99,204 | ) | $ | 64,422 | $ | 66,803 | $ | 131,225 | $ | 104,997 | $ | 83,174 | $ | 188,171 | ||||||||
F-25
The foreign provision for income taxes is based on foreign pretax losses of $1.2 billion in 2012 as compared to foreign pretax earnings of $84.0 million in 2011. The Company did not have foreign operations in 2010. The Company's consolidated financial statements provide for any related tax liability on amounts that may be repatriated, aside from undistributed foreign earnings of the Company's foreign subsidiaries that are intended to be indefinitely reinvested in operations outside of the U.S. As of December 31, 2012, U.S. income taxes have not been provided on the cumulative earnings of foreign subsidiaries considered to be indefinitely reinvested in operations outside of the U.S.
Deferred tax assets and liabilities reflect the effects of tax losses, credits, and the future income tax effects of temporary differences between the consolidated financial statements carrying amounts of existing assets and liabilities and their respective tax bases and are measured using enacted tax rates that apply to taxable income in the years in which those temporary differences are expected to be recovered or settled.
As of December 31, 2012 and December 31, 2011, the significant components of the Company's deferred income tax assets and liabilities were (in thousands):
| |
December 31, | ||||||
|---|---|---|---|---|---|---|---|
| |
2012 | 2011 | |||||
Deferred income tax assets: |
|||||||
Net operating loss and credit carryforwards |
$ | 156,387 | $ | 62,336 | |||
Accrued expenses |
14,827 | 18,773 | |||||
Contingent interest |
39,581 | 36,441 | |||||
Postretirement benefits other than pensions |
247,578 | 219,399 | |||||
Pension obligations |
23,725 | 20,229 | |||||
Other |
34,214 | 26,394 | |||||
Total deferred tax assets |
516,312 | 383,572 | |||||
Less: valuation allowance for deferred tax assets |
(20,919 | ) | (1,729 | ) | |||
Net deferred income tax asset |
495,393 | 381,843 | |||||
Deferred income tax liabilities: |
|||||||
Prepaid expenses |
(12,465 | ) | (11,915 | ) | |||
British Columbia mineral tax |
(243,229 | ) | (263,422 | ) | |||
Property, plant and equipment |
(943,523 | ) | (965,463 | ) | |||
Total deferred income tax liabilities |
(1,199,217 | ) | (1,240,800 | ) | |||
Net deferred income tax liability |
$ | (703,824 | ) | $ | (858,957 | ) | |
Deferred income taxes are classified as follows: |
|||||||
Current deferred income tax asset |
$ | 58,526 | $ | 61,079 | |||
Noncurrent deferred income tax asset |
160,422 | 109,300 | |||||
Other current liabilities |
(1,085 | ) | — | ||||
Noncurrent deferred income tax liability |
(921,687 | ) | (1,029,336 | ) | |||
Net deferred tax liability |
$ | (703,824 | ) | $ | (858,957 | ) | |
As of each reporting date, the Company's management considers new evidence, both positive and negative, that could impact management's view with regard to future realization of deferred tax assets. As of December 31, 2012, management determined that sufficient negative evidence exists to conclude that it is more likely than not that deferred taxes of $20.9 million will not be realized. In recognition of this risk, the Company increased the valuation allowances by $19.2 million. The tax benefits related to any reversals of the valuation allowances on deferred tax assets as of December 31, 2012, will be accounted for as a reduction to income tax expense.
F-26
As of December 31, 2012, our U.S. net operating losses ("NOLs") consisted of $61.6 million of federal NOLs and $59.0 million of state NOLs available as offsets to future years' taxable income. The NOLs primarily expire between 2026 and 2032. Additionally, $10.6 million of federal and state capital losses were available as of December 31, 2012. The Company has alternative minimum tax credits of $23.4 million as of December 31, 2012 that may be carried forward indefinitely. We believe the U.S. operations will have sufficient income to utilize the domestic non-capital NOLs prior to expiration. We have valuation allowances on the capital losses of $10.6 million not expected to provide future tax benefits.
As of December 31, 2012, we also had $420.7 million of ordinary non-U.S. NOLs and $18.0 million of non-U.S. capital losses available. Canadian ordinary NOLs of $323.8 million will expire between 2031 and 2032 while Canadian capital losses of $10.8 million have an indefinite carryforward period. U.K. ordinary NOLs of $96.9 million have an indefinite carryforward period. We believe the Canadian and U.K operations will have sufficient income to utilize the non-capital NOLs and Canadian capital losses prior to expiration. Additionally, $13.2 million of our Canadian unrealized losses were incurred during 2012 for which we have a full valuation allowance. We have valuation allowances on U.K. capital losses equal to the capital loss carryforward of $7.2 million not expected to provide future tax benefits.
The income tax expense (benefit) at the Company's effective tax rate differed from the U.S. statutory rate of 35% as follows (in thousands):
| |
For the years ended December 31, | |||||||||
|---|---|---|---|---|---|---|---|---|---|---|
| |
2012 | 2011 | 2010 | |||||||
Income (loss) from continuing operations before income tax expense |
$ | (1,164,759 | ) | $ | 494,823 | $ | 577,596 | |||
Tax expense (benefit) at statutory tax rate of 35% |
$ | (407,665 | ) | $ | 173,188 | $ | 202,159 | |||
Effect of: |
||||||||||
Excess depletion benefit |
(26,107 | ) | (32,370 | ) | (31,572 | ) | ||||
Taxation of foreign operations |
(11,945 | ) | (36,545 | ) | — | |||||
British Columbia mineral tax |
(18,722 | ) | 11,954 | — | ||||||
Goodwill impairment |
372,543 | — | — | |||||||
State and local income tax, net of federal effect |
2,470 | 7,394 | 26,134 | |||||||
U.S. domestic production activities benefit |
(2,950 | ) | (5,583 | ) | (3,871 | ) | ||||
Acquisition costs |
— | 8,078 | — | |||||||
Other |
(6,828 | ) | 5,109 | (4,679 | ) | |||||
Tax expense (benefit) recognized |
$ | (99,204 | ) | $ | 131,225 | $ | 188,171 | |||
The Company recognized an income tax benefit of $99.2 million for the year ended December 31, 2012, compared to a tax provision of $131.2 million and $188.2 million for the years ended December 31, 2011 and 2010, respectively. The 2012 income tax benefit, as compared to expense in 2011 and 2010, is primarily due to the pretax operating loss for 2012 as compared to the pretax operating income for the same periods in 2011 and 2010. The level of ordinary income in 2012 decreased substantially from 2011 and 2010, leading to income tax benefits in excess of income tax expense. The 2012 and 2011 effective rates also reflect the benefit of our Canadian and U.K. operations which are taxed at statutory rates lower than the statutory U.S. rate, and the effects of tax losses in excess of losses from continuing operations related to foreign financing activities. Additionally, the Company recorded an impairment charge of $1.1 billion of nondeductible goodwill in 2012.
The Company has not provided U.S. income taxes and foreign withholding taxes on the undistributed earnings of foreign subsidiaries as of December 31, 2012 because it intends to indefinitely reinvest such earnings outside the U.S. If this intent changes, additional income tax expense would likely be recorded due to the differential in tax rates between the U.S. and the international
F-27
jurisdictions. If foreign earnings were to be repatriated in the future, the related U.S. tax liability on such repatriation may be partially reduced by foreign income taxes previously paid on these earnings. Determination of the amount of taxes that might be paid on these undistributed earnings if eventually remitted is not currently practicable.
The Company's income taxes payable have been reduced by the tax benefits from employee stock plan awards. For stock options, the Company receives an income tax benefit calculated on the difference between the fair market value of the non-qualified stock issued at the time of the exercise and the option price. For restricted stock units, the Company receives an income tax benefit upon the award's vesting equal to the tax effect of the underlying stock's fair market value. The Company had net excess tax benefits from equity awards of $0.8 million, $8.9 million, and $16.8 million in 2012, 2011, and 2010, respectively.
The Company files income tax returns in the U.S., Canada, U.K., Australia and in various state, provincial and local jurisdictions which are routinely examined by tax authorities in these jurisdictions. The statute of limitations related to the U.S. consolidated federal income tax returns is closed for the years prior to August 31, 1983 and for the years ended May 31, 1997, 1998 and 1999. The impact of any U.S. federal changes for these years on state income taxes remains subject to examination for a period up to five years after formal notification to the states. The Company generally remains subject to income tax in various states for prior periods ranging from three to eleven years depending on jurisdiction. In our major non-U.S. jurisdictions, tax years are typically subject to examination for three to six years.
On December 27, 1989, the Company and most of its U.S. subsidiaries each filed a voluntary petition for reorganization under Chapter 11 of Title 11 of the United States Code (the "Bankruptcy Proceedings") in the United States Bankruptcy Court for the Middle District of Florida, Tampa Division (the "Bankruptcy Court"). The Company emerged from bankruptcy on March 17, 1995 (the "Effective Date") pursuant to the Amended Joint Plan of Reorganization dated as of December 9, 1994, as modified on March 1, 1995 (as so modified the "Consensual Plan"). Despite the confirmation and effectiveness of the Consensual Plan, the Bankruptcy Court continues to have jurisdiction over, among other things, the resolution of disputed prepetition claims against the Company and other matters that may arise in connection with or related to the Consensual Plan, including claims related to federal income taxes.
In connection with the U.S. Bankruptcy Proceedings, the Internal Revenue Service ("IRS") filed a proof of claim in the Bankruptcy Court (the "Proof of Claim") for a substantial amount of taxes, interest and penalties with respect to fiscal years ended August 31, 1983 through May 31, 1994. The Company filed an adversary proceeding in the Bankruptcy Court disputing the Proof of Claim (the "Adversary Proceeding") and the various issues have been litigated in the Bankruptcy Court. An opinion was issued by the Bankruptcy Court in June 2010 as to the remaining disputed issues. The Bankruptcy Court instructed both parties to submit a final order addressing all issues that have been litigated for the tax years 1983 through 1995 in the Adversary Proceeding by late August 2010. At the request of both parties, the Bankruptcy Court granted an extension of time of 90 days from the initial submission date to submit the final order. Additional extensions of time to submit the proposed final order were granted in November 2010, February 2011, May 2011, September 2011, and January 2013. At the request of both parties, in January 2013 the Bankruptcy Court granted an additional extension of time until May 10, 2013 to submit the final order.
The amounts initially asserted by the Proof of Claim do not reflect the subsequent resolution of various issues through settlements or concessions by the parties. The Company believes that any financial exposure with respect to those issues that have not been resolved or settled in the Proof of Claim is limited to interest and possible penalties and the amount of tax assessed has been offset by tax reductions in future years. All of the issues in the Proof of Claim, which have not been settled or
F-28
conceded, have been litigated before the Bankruptcy Court and are subject to appeal but only at the conclusion of the entire Adversary Proceeding.
The IRS completed its audit of the Company's federal income tax returns for the years ended May 31, 2000 through December 31, 2005. The IRS issued 30-Day Letters to the Company in June 2010, proposing changes to tax for these tax years. The Company believed its tax filing positions had substantial merit and filed a formal protest with the IRS within the prescribed 30-day time limit for those issues which have not been previously settled or conceded. The IRS filed a rebuttal to the Company's formal protest and the case was assigned to the Appeals Division of the IRS. The Appeals Division convened a hearing on March 8, 2011 and heard arguments from both parties as to issues not settled or conceded for the 2000 through 2005 audit period. As of December 31, 2012, no final resolution has been reached with the Appeals Division pertaining to these matters. The disputed issues in this audit period are similar to the issues remaining in the Proof of Claim.
In the second quarter of 2012, the IRS completed its audit of the Company's federal income tax returns for the years 2006 through 2008 and has proposed adjustments to tax for these periods. The IRS issued a 30-Day Letter with proposed adjustments and the Company responded to the IRS within the prescribed 30-day time limit. The proposed adjustments are similar to issues in a prior Proof of Claim and include a proposed adjustment to a worthless stock deduction reported in the Company's 2008 federal income tax return. In the third quarter of 2012, the Company also received notification from the IRS that the audit of the 2006 through 2008 tax years had been reopened for further development. The Company received notice in January 2013 that the proposed adjustment to the worthless stock deduction had been conceded by the IRS. The Company has evaluated all of the remaining proposed adjustments and believes the Company's tax filing positions have substantial merit.
The IRS is conducting an audit of the Company's income tax returns filed for 2009 and 2010. Since the examination is ongoing, any resulting tax deficiency or overpayment cannot be estimated at this time. During 2013, the statute of limitations for assessing additional income tax deficiencies will expire for certain tax years in several state tax jurisdictions. The expiration of the statute of limitations for these years is expected to have an immaterial impact on the total uncertain income tax positions and net income.
It is reasonably possible that the amount of unrecognized tax benefits will change in the next twelve months. The Company anticipates a final order will be issued by the Bankruptcy Court in 2013 settling the issues in the Proof of Claim. The final order by the Bankruptcy Court would permit a resolution of similar issues for the tax years currently in Appeals (2000-2005) and Exams (2006-2010). In the opinion of management, the ultimate disposition of these unrecognized tax benefits will not have a material adverse effect on our consolidated financial position, liquidity or results of operations. As of December 31, 2012, the Company had $38 million of accruals for unrecognized tax benefits on the matters subject to disposition. Due to the uncertainty related to the potential outcome of these matters, we cannot estimate the range of reasonably possible changes in unrecognized tax benefits in the next twelve months.
The Company believes that all of its current and prior tax filing positions have substantial merit and intends to defend vigorously any tax claims asserted. The Company believes that it has sufficient accruals to address any claims, including interest and penalties, and as a result, believes that any potential difference between actual losses and costs incurred and the amounts accrued would be immaterial.
F-29
A reconciliation of the beginning and ending balances of the total amounts of gross unrecognized tax benefits excluding penalties and interest is as follows (in thousands):
| |
December 31, | |||||||||
|---|---|---|---|---|---|---|---|---|---|---|
| |
2012 | 2011 | 2010 | |||||||
Gross unrecognized tax benefits at beginning of year |
$ | 92,758 | $ | 39,191 | $ | 34,300 | ||||
Increases for tax positions taken in prior years |
10,019 | 31,704 | — | |||||||
Increases in tax positions for the current year |
8,058 | 23,169 | 5,216 | |||||||
Decreases for tax positions taken in prior years |
(18,440 | ) | — | — | ||||||
Decreases for lapse of statute of limitations |
(2,764 | ) | — | — | ||||||
Decreases for changes in temporary differences |
— | (1,306 | ) | (325 | ) | |||||
Gross unrecognized tax benefits at end of year |
$ | 89,631 | $ | 92,758 | $ | 39,191 | ||||
The total amount of net unrecognized tax benefits that, if recognized, would affect the effective tax rate totaled $87.6 million and $92.1 million at December 31, 2012 and 2011, respectively. The Company recognizes interest expense and penalties related to unrecognized tax benefits in interest expense and selling, general and administrative expenses, respectively.
For the years ended December 31, 2012, 2011 and 2010, interest expense includes $10.4 million, $7.2 million and $5.6 million, respectively, for interest accrued on the liability for unrecognized tax benefits and for issues identified in the Proof of Claim. As of December 31, 2012, the Company had accrued interest and penalties related to unrecognized tax benefits and the Adversary Proceeding of $105.4 million.
NOTE 12—Asset Retirement Obligations
As of December 31, 2012 and 2011, the Company had recorded asset retirement obligation accruals for mine reclamation and closure costs totaling $89.5 million and $75.0 million, respectively. The portion of the costs expected to be paid within a year of $12.3 million and $7.1 million as of December 31, 2012 and 2011, respectively, is included in other current liabilities. There were no assets that were legally restricted for purposes of settling asset retirement obligations at December 31, 2012 or 2011.
Changes in the asset retirement obligations are as follows:
| |
December 31, | ||||||
|---|---|---|---|---|---|---|---|
| |
2012 | 2011 | |||||
Balance at beginning of year |
$ | 74,963 | $ | 25,257 | |||
Accretion expense |
4,411 | 3,628 | |||||
Revisions in estimated cash flows |
14,353 | 3,722 | |||||
Asset retirement obligation assumed in Western Coal acquisition(1) |
— | 42,599 | |||||
Obligations settled |
(4,249 | ) | (243 | ) | |||
Balance at end of year |
$ | 89,478 | $ | 74,963 | |||
- (1)
- See Note 3.
F-30
NOTE 13—Accrued Expenses and Other Current Liabilities
Accrued expenses consisted of the following:
| |
December 31, | ||||||
|---|---|---|---|---|---|---|---|
| |
2012 | 2011 | |||||
Accrued professional fees |
$ | 54,205 | $ | 126,952 | |||
Wage and employee benefits |
37,981 | 61,363 | |||||
Other |
92,689 | 40,752 | |||||
Total accrued expenses |
$ | 184,875 | $ | 229,067 | |||
Other current liabilities consisted of the following:
| |
December 31, | ||||||
|---|---|---|---|---|---|---|---|
| |
2012 | 2011 | |||||
Accrual for tax interest and penalties |
$ | 103,181 | $ | — | |||
Accrual for uncertain tax positions |
37,960 | — | |||||
Other |
65,332 | 63,757 | |||||
Total other current liabilities |
$ | 206,473 | $ | 63,757 | |||
NOTE 14—Debt
Debt consisted of the following (in thousands):
| |
December 31, 2012 |
December 31, 2011 |
Weighted Average Stated Interest Rate At December 31, 2012 |
Estimated Final Maturity |
|||||||||
|---|---|---|---|---|---|---|---|---|---|---|---|---|---|
2011 term loan A |
$ | 756,974 | $ | 894,837 | 4.82 | % | 2016 | ||||||
2011 term loan B |
1,127,770 | 1,333,163 | 5.75 | % | 2018 | ||||||||
Revolving credit facility |
— | 10,000 | — | 2016 | |||||||||
9.875% senior notes ($500.0 million face value) |
496,510 | — | 9.88 | % | 2020 | ||||||||
Other(1) |
34,911 | 87,715 | Various | Various | |||||||||
Total debt |
2,416,165 | 2,325,715 | |||||||||||
Less current debt |
(18,793 | ) | (56,695 | ) | |||||||||
Total long-term debt |
$ | 2,397,372 | $ | 2,269,020 | |||||||||
- (1)
- This balance includes capital lease obligations (see Note 18) and an equipment financing agreement.
F-31
The Company's minimum debt repayment schedule, excluding interest, as of December 31, 2012 is as follows (in thousands):
| |
Payments Due | ||||||||||||||||||
|---|---|---|---|---|---|---|---|---|---|---|---|---|---|---|---|---|---|---|---|
| |
2013 | 2014 | 2015 | 2016 | 2017 | Thereafter | |||||||||||||
2011 term loan A |
$ | — | $ | 76,974 | $ | 517,500 | $ | 162,500 | $ | — | $ | — | |||||||
2011 term loan B |
— | — | — | — | — | 1,127,770 | |||||||||||||
9.875% senior notes |
— | — | — | — | — | 500,000 | |||||||||||||
Other debt |
18,793 | 10,090 | 5,948 | 80 | — | — | |||||||||||||
|
$ | 18,793 | $ | 87,064 | $ | 523,448 | $ | 162,580 | $ | — | $ | 1,627,770 | |||||||
Senior Notes On November 21, 2012, we issued $500.0 million in aggregate principal amount of 9.875% senior notes due December 15, 2020 (the "2020 Notes") at an initial price of 99.302% of their face amount. The 2020 Notes are unconditionally guaranteed, jointly and severally, on an unsecured basis, by each of our current and future wholly-owned domestic restricted subsidiaries. Interest on the 2020 Notes accrues at the rate of 9.875% per year and is payable semi-annually in arrears on June 15 and December 15, beginning on June 15, 2013. We may redeem the 2020 Notes, in whole or in part, at any time prior to December 15, 2016, at a price equal to 100.000% of the aggregate principal amount of the 2020 Notes plus a "make-whole" premium, plus accrued and unpaid interest. We may redeem the 2020 Notes, in whole or in part, at any time during the twelve months commencing December 15, 2016, at 104.938% of the aggregate principal amount of the 2020 Notes, at any time during the twelve months commencing December 15, 2017, at 102.469% of the aggregate principal amount of the 2020 Notes, and at any time after December 15, 2018, at 100.000% of the aggregate principal amount of the 2020 Notes, in each case plus accrued and unpaid interest. The unamortized balance of the debt issuance discount of $3.5 million at December 31, 2012, will be accreted to interest expense over the life of the 2020 Notes using the effective interest method.
2011 Credit Agreement On April 1, 2011, we entered into a $2.725 billion credit agreement (the "2011 Credit Agreement") to partially fund the acquisition of Western Coal and to pay off all outstanding loans under the 2005 Credit Agreement. The 2011 Credit Agreement consists of (1) a $950.0 million principal amortizing term loan A facility maturing in April 2016, at which time the remaining outstanding principal is due, (2) a $1.4 billion principal amortizing term loan B facility maturing in April 2018, at which time the remaining outstanding principal is due and (3) a $375.0 million multi-currency revolving credit facility ("Revolver") maturing in April 2016, at which time any remaining balance is due. The Revolver provides for operational needs and letters of credit. Our obligations under the 2011 Credit Agreement are secured by our domestic and foreign real, personal and intellectual property. The 2011 Credit Agreement contains customary events of default and covenants, including among other things, covenants that do not prevent but restrict us and our subsidiaries' ability to incur certain additional indebtedness, create or permit liens on assets, pay dividends and repurchase stock, engage in mergers or acquisitions, and make investments and loans. The 2011 Credit Agreement also includes certain financial covenants that must be maintained.
First Amendment
On January 20, 2012, the Company entered into an amendment (the "First Amendment") to the 2011 Credit Agreement among the Company, the various lenders, and Morgan Stanley Senior Funding, Inc. as administrative agent. The First Amendment provides for, among other things, an increase in the Revolver sublimit in Canada from $150 million to $275 million.
F-32
Second Amendment
On August 16, 2012, the Company entered into an amendment (the "Second Amendment") to the 2011 Credit Agreement among the Company, the various lenders, and Morgan Stanley Senior Funding, Inc. as administrative agent, and other agents named therein, which provided, among other things:
- •
- interest margins on the loans under the Credit Agreement increased by 0.25% once the total leverage ratio of the Company
is greater than 3.25:1;
- •
- the Company may subtract from total indebtedness, all unrestricted cash and cash equivalents in calculating its total
leverage ratio;
- •
- the Company may incur secured notes in lieu of secured credit facilities under the Company's incremental facility;
- •
- increased the general investment basket to $325 million; and
- •
- the total leverage ratio covenant was made less restrictive, beginning with the fiscal quarter ended September 30, 2012 and each fiscal quarter thereafter for the remaining term of the Credit Agreement.
Third Amendment
On October 29, 2012, the Company entered into another amendment (the "Third Amendment") to the 2011 Credit Agreement, as amended, among the Company, the various lenders, Morgan Stanley Senior Funding, Inc. as administrative agent, and other agents named therein, which provides, among other things:
- •
- interest margins on the loans under the Credit Agreement increased by 1.25-1.50% from their existing levels
and the leverage ratios at which the interest rate margins step down was increased;
- •
- permitted acquisitions and unlimited unsecured debt are subject to compliance with a 4.50:1.0 total leverage ratio;
- •
- additional flexibility to incur up to an additional $1 billion of senior unsecured notes (of which we have secured
$500 million in November 2012); provided that a minimum of 50% of the proceeds from any such offering are used to repay the term loans under the 2011 Credit Agreement, as amended; and
- •
- total leverage ratio covenant and the interest coverage covenant levels were modified.
The Revolver, term loan A and term loan B interest rates are tied to LIBOR or the Canadian Dealer Offered Rate ("CDOR"), plus a credit spread ranging from 350 to 450 basis points for the Revolver and term loan A, and 475 basis points on the term loan B adjusted quarterly based on the Company's total leverage ratio as defined by the as amended 2011 Credit Agreement. The term loan B has a minimum LIBOR floor of 1.0%. The Revolver loans can be denominated in either U.S. dollars or Canadian dollars at the Company's option. The commitment fee on the unused portion of the Revolver is 0.5% per year for all pricing levels. As of December 31, 2012, there were no borrowings outstanding under the Revolver, with $46.8 million outstanding stand-by letters of credit and $328.2 million of availability for future borrowings.
F-33
NOTE 15—Employee Benefit Plans
The Company has various defined benefit pension plans covering certain U.S. salaried employees and eligible hourly employees. In addition to its own pension plans, the Company contributes to a multi-employer defined benefit pension plan covering eligible employees who are represented by the United Mine Workers of America ("UMWA"). The Company funds its retirement and employee benefit plans in accordance with the requirements of the plans and, where applicable, in amounts sufficient to satisfy the "Minimum Funding Standards" of the Employee Retirement Income Security Act of 1974 ("ERISA"). The plans provide benefits based on years of service and compensation or at stated amounts for each year of service.
Defined Benefits Pension and Other Postretirement Benefit Plans
The Company also provides certain postretirement benefits other than pensions, primarily healthcare, to eligible retirees. The Company's postretirement benefit plans are not funded. New salaried employees have been ineligible to participate in postretirement healthcare benefits since May 2000. Effective January 1, 2003 the Company placed a monthly cap on Company contributions for postretirement healthcare coverage.
The Company is required to measure plan assets and liabilities as of the fiscal year-end reporting date. As of December 31, 2012 and 2011, respectively, all of our pension plans have obligations that
F-34
exceed plan assets. The amounts recognized for all of the Company's pension and postretirement benefit plans are as follows (in thousands):
| |
Pension Benefits | Other Postretirement Benefits | |||||||||||
|---|---|---|---|---|---|---|---|---|---|---|---|---|---|
| |
December 31, 2012 |
December 31, 2011 |
December 31, 2012 |
December 31, 2011 |
|||||||||
Accumulated benefit obligation |
$ | 278,357 | $ | 246,021 | $ | 662,464 | $ | 577,918 | |||||
Change in projected benefit obligation: |
|||||||||||||
Benefit obligation at beginning of year |
$ | 258,780 | $ | 250,005 | $ | 577,918 | $ | 476,101 | |||||
Service cost |
5,991 | 5,162 | 8,072 | 6,160 | |||||||||
Interest cost |
12,517 | 12,576 | 29,010 | 25,140 | |||||||||
Actuarial loss |
29,933 | 5,895 | 71,451 | 84,796 | |||||||||
Benefits paid |
(11,501 | ) | (11,026 | ) | (23,987 | ) | (21,813 | ) | |||||
Plan amendments |
224 | 375 | — | 104 | |||||||||
Plan settlements |
— | (4,207 | ) | — | — | ||||||||
Business combinations |
— | — | — | 7,430 | |||||||||
Benefit obligation at end of year |
$ | 295,944 | $ | 258,780 | $ | 662,464 | $ | 577,918 | |||||
Change in plan assets: |
|||||||||||||
Fair value of plan assets at beginning of year |
$ | 202,537 | $ | 191,736 | $ | — | $ | — | |||||
Actual return on plan assets |
28,499 | 1,163 | — | — | |||||||||
Employer contributions |
13,425 | 24,871 | 23,987 | 21,813 | |||||||||
Benefits paid |
(11,501 | ) | (11,026 | ) | (23,987 | ) | (21,813 | ) | |||||
Plan settlements |
— | (4,207 | ) | — | — | ||||||||
Fair value of plan assets at end of year |
$ | 232,960 | $ | 202,537 | — | — | |||||||
Unfunded status of the plan |
$ | (62,984 | ) | $ | (56,243 | ) | $ | (662,464 | ) | $ | (577,918 | ) | |
Amounts recognized in the balance sheet, pre-tax: |
|||||||||||||
Other current liabilities |
$ | (5,744 | ) | $ | (5,083 | ) | $ | — | $ | — | |||
Accumulated postretirement benefits obligation |
|||||||||||||
Current |
— | — | $ | (29,200 | ) | $ | (27,247 | ) | |||||
Long-term |
— | — | (633,264 | ) | (550,671 | ) | |||||||
Other long-term liabilities |
(57,240 | ) | (51,160 | ) | — | — | |||||||
Net amount recognized |
$ | (62,984 | ) | $ | (56,243 | ) | $ | (662,464 | ) | $ | (577,918 | ) | |
Amounts recognized in accumulated other comprehensive income, pre-tax |
|||||||||||||
Prior service cost |
$ | 1,257 | $ | 1,290 | $ | 8,871 | $ | 9,916 | |||||
Net actuarial loss |
114,787 | 106,479 | 331,775 | 275,049 | |||||||||
Net amount recognized |
$ | 116,044 | $ | 107,769 | $ | 340,646 | $ | 284,965 | |||||
F-35
The components of net periodic benefit cost are as follows (in thousands):
| |
Pension Benefits | Other Postretirement Benefits | |||||||||||||||||
|---|---|---|---|---|---|---|---|---|---|---|---|---|---|---|---|---|---|---|---|
| |
For the years ended December 31, | For the years ended December 31, | |||||||||||||||||
| |
2012 | 2011 | 2010 | 2012 | 2011 | 2010 | |||||||||||||
Components of net periodic benefit cost: |
|||||||||||||||||||
Service cost |
$ | 5,991 | $ | 5,163 | $ | 4,419 | $ | 8,072 | $ | 6,160 | $ | 3,014 | |||||||
Interest cost |
12,517 | 12,576 | 12,906 | 29,010 | 25,140 | 26,040 | |||||||||||||
Expected return on plan assets |
(16,125 | ) | (15,717 | ) | (13,076 | ) | — | — | — | ||||||||||
Amortization of prior service cost (credit) |
256 | 272 | 304 | 1,045 | (961 | ) | (2,098 | ) | |||||||||||
Amortization of net actuarial loss |
9,377 | 8,252 | 8,922 | 14,725 | 10,046 | 14,522 | |||||||||||||
Settlement loss |
— | 1,807 | — | — | — | — | |||||||||||||
Net periodic benefit cost for continuing operations |
$ | 12,016 | $ | 12,353 | $ | 13,475 | $ | 52,852 | $ | 40,385 | $ | 41,478 | |||||||
The estimated portions of net prior service cost and net actuarial loss remaining in accumulated other comprehensive income that is expected to be recognized as components of net periodic benefit costs in 2013 are as follows (in thousands):
| |
Pension Benefits | Other Postretirement Benefits |
|||||
|---|---|---|---|---|---|---|---|
Prior service cost |
$ | 263 | $ | 1,230 | |||
Net actuarial loss |
9,735 | 18,936 | |||||
Net amount to be recognized |
$ | 9,998 | $ | 20,166 | |||
Changes in plan assets and benefit obligations recognized in other comprehensive income as (income) loss in 2012 are as follows (in thousands):
| |
Pension Benefits | Other Postretirement Benefits |
Total | |||||||
|---|---|---|---|---|---|---|---|---|---|---|
Current year net actuarial loss |
$ | 17,559 | $ | 71,451 | $ | 88,885 | ||||
Current year prior service cost |
224 | — | 224 | |||||||
Amortization of actuarial loss |
(9,377 | ) | (14,725 | ) | (23,977 | ) | ||||
Amortization of prior service cost |
(256 | ) | (1,045 | ) | (1,301 | ) | ||||
Total |
8,150 | 55,681 | 63,831 | |||||||
Deferred income taxes |
(2,898 | ) | (20,432 | ) | (23,330 | ) | ||||
Total recognized in other comprehensive (income) loss, net of taxes |
$ | 5,252 | $ | 35,249 | $ | 40,501 | ||||
F-36
A summary of key assumptions used is as follows:
| |
Pension Benefits | Other Postretirement Benefits | |||||||||||||||||
|---|---|---|---|---|---|---|---|---|---|---|---|---|---|---|---|---|---|---|---|
| |
December 31, | December 31, | |||||||||||||||||
| |
2012 | 2011 | 2010 | 2012 | 2011 | 2010 | |||||||||||||
Weighted average assumptions used to determine benefit obligations: |
|||||||||||||||||||
Discount rate |
4.29 | % | 5.02 | % | 5.30 | % | 4.44 | % | 5.14 | % | 5.35 | % | |||||||
Rate of compensation increase |
3.70 | % | 3.70 | % | 3.70 | % | — | — | — | ||||||||||
Weighted average assumptions used to determine net periodic cost: |
|||||||||||||||||||
Discount rate |
5.02 | % | 5.30 | % | 5.90 | % | 5.14 | % | 5.35 | % | 5.90 | % | |||||||
Expected return on plan assets |
7.75 | % | 7.75 | % | 8.25 | % | — | — | — | ||||||||||
Rate of compensation increase |
3.70 | % | 3.70 | % | 3.70 | % | — | — | — | ||||||||||
| |
December 31, | ||||||||||||||||||
|---|---|---|---|---|---|---|---|---|---|---|---|---|---|---|---|---|---|---|---|
| |
2012 | 2011 | 2010 | ||||||||||||||||
| |
Pre-65 | Post-65 | Pre-65 | Post-65 | Pre-65 | Post-65 | |||||||||||||
Assumed health care cost trend rates at December 31: |
|||||||||||||||||||
Health care cost trend rate assumed for next year |
7.50 | % | 7.50 | % | 8.00 | % | 8.00 | % | 7.50 | % | 7.50 | % | |||||||
Rate to which the cost trend rate is assumed to decline (the ultimate trend rate) |
5.00 | % | 5.00 | % | 5.00 | % | 5.00 | % | 5.00 | % | 5.00 | % | |||||||
Year that the rate reaches the ultimate trend rate |
2019 | 2019 | 2018 | 2018 | 2016 | 2016 | |||||||||||||
The discount rate is based on a yield-curve approach which matches the expected cash flows to high quality corporate bonds available at the measurement date. The model constructs a hypothetical bond portfolio whose cash flows match the year-by-year, projected benefit cash flow from the benefit plan. The yield on this hypothetical portfolio is the maximum discount rate used. The yield curve is based on a universe of bonds available from the Bloomberg Finance bond database at the measurement date, with a quality rating of AA or better by Moody's or S&P.
The plan assets of the pension plans are held and invested by the Walter Energy, Inc. Subsidiaries Master Pension Trust ("Pension Trust"). The Pension Trust employs a total return investment approach whereby a mix of equity and fixed income investments are used to meet the long-term funding and near-term cash flow requirements of the pension plan. The asset mix strives to generate rates of return sufficient to fund plan liabilities and exceed the long-term rate of inflation, while maintaining an appropriate level of portfolio risk. Risk tolerance is established through consideration of plan liabilities, plan funded status and corporate financial condition. The investment portfolio is diversified across domestic and foreign equity holdings, and by investment styles and market capitalizations. Domestic equity holdings primarily consist of investments in funds invested in large-cap and mid-cap companies located in the United States managed to replicate the investment performance of industry standard investment indexes. Foreign equity holdings primarily consist of investments in domestically managed mutual funds located in the United States. Fixed income holdings are diversified by issuer, security type and principal and interest payment characteristics. Derivatives may be used to gain market exposure in an efficient and timely manner; however, derivatives may not be used to leverage the portfolio beyond the market value of the underlying investments. Fixed income and derivatives holdings primarily consist of investments in domestically managed mutual funds located in the United States. Investment risk is measured and monitored on an ongoing basis through quarterly investment portfolio reviews, annual benefits liability measurements, and periodic asset/liability studies. Management believes the only significant concentration of investment risk lies in exposure to the U.S. domestic markets as compared to total global investment opportunities.
F-37
The Pension Trust's strategic asset allocation targets for 2012 and the asset allocations as of December 31, 2012 and 2011were as follows:
| |
|
|
Actual Allocation | ||||||||||
|---|---|---|---|---|---|---|---|---|---|---|---|---|---|
| |
Strategic Allocation |
Tactical Range |
|||||||||||
| |
2012 | 2011 | |||||||||||
Equity investments: |
|||||||||||||
U.S. large-cap funds |
38.5 | % | 30–47 | % | 37.3 | % | 37.2 | % | |||||
International fund |
13.0 | % | 10–16 | % | 13.3 | % | 12.5 | % | |||||
U.S. mid-cap fund |
8.5 | % | 6–11 | % | 9.6 | % | 9.5 | % | |||||
Total equity investments |
60.0 | % | 50–70 | % | 60.2 | % | 59.2 | % | |||||
Fixed income investments |
40.0 | % | 30–50 | % | 39.2 | % | 39.0 | % | |||||
Cash |
0.0 | % | 0–5 | % | 0.6 | % | 1.8 | % | |||||
Total |
100.0 | % | 100.0 | % | 100.0 | % | |||||||
These ranges are targets and deviations may occur from time-to-time due to market fluctuations. Portfolio assets are typically rebalanced to the allocation targets at least annually.
As of December 31, 2012, the fair values of the Pension Trust's assets, all of which are valued based on quoted market prices in active markets for identified assets (Level 1) were as follows (in thousands):
Asset Class:
|
Total | Quoted Market Prices in Active Market for Identical assets (Level 1) |
Significant Observable Inputs (Level 2) |
Significant Unobservable Inputs (Level 3) |
|||||||||
|---|---|---|---|---|---|---|---|---|---|---|---|---|---|
Cash and cash equivalents |
$ | 1,397 | $ | 1,397 | $ | — | $ | — | |||||
Equity investments(a): |
|||||||||||||
U.S. large cap funds |
86,892 | 86,892 | — | — | |||||||||
International fund |
31,038 | 31,038 | — | — | |||||||||
U.S. mid-cap fund |
22,368 | 22,368 | — | — | |||||||||
Fixed income investments: |
|||||||||||||
Intermediate-term bond(b) |
85,814 | 85,814 | — | — | |||||||||
Long-term bond(c) |
5,451 | 5,451 | — | — | |||||||||
Total |
$ | 232,960 | $ | 232,960 | $ | — | $ | — | |||||
- (a)
- Equity
investments include investments in domestic and international mutual funds investing in large- and mid-capitalization companies.
Investments in mutual funds are valued at the net asset value per share multiplied by the number of shares held as of the measurement date and are traded on listed exchanges.
- (b)
- This
fund seeks maximum total return through a diversified portfolio of fixed income instruments of varying maturities, which may be represented by forward
or derivatives such as options, futures, contracts, or swap agreements. Fixed income instruments include bonds, debt securities and other similar instruments issued by various U.S. and
non-U.S. public or private-sector entities. This fund also invests in high yield securities, mortgage-related securities and securities denominated in foreign currencies. This fund is
valued at the net asset value per share multiplied by the number of shares held as of the measurement date and is traded on a listed exchange.
- (c)
- This
fund invests in U.S. investment-grade corporate and government bonds with maturities of more than ten years. This fund is valued at the net asset value
per share multiplied by the number of shares held as of the measurement date and is traded on a listed exchange.
F-38
As of December 31, 2011, the fair values of the Pension Trust's assets were as follows (in thousands):
Asset Class:
|
Total | Quoted Market Prices in Active Market for Identical assets (Level 1) |
Significant Observable Inputs (Level 2) |
Significant Unobservable Inputs (Level 3) |
|||||||||
|---|---|---|---|---|---|---|---|---|---|---|---|---|---|
Cash and cash equivalents |
$ | 3,568 | $ | 3,568 | $ | — | $ | — | |||||
Equity investments(a): |
|||||||||||||
U.S. large-cap funds |
75,333 | 75,333 | — | — | |||||||||
International fund |
25,332 | 25,332 | — | — | |||||||||
U.S. mid-cap fund |
19,350 | 19,350 | — | — | |||||||||
Fixed income investments: |
|||||||||||||
Intermediate-term bond(b) |
73,928 | 73,928 | — | — | |||||||||
Long-term bond(c) |
5,026 | 5,026 | — | — | |||||||||
Total |
$ | 202,537 | $ | 202,537 | $ | — | $ | — | |||||
- (a)
- Equity
investments include investments in domestic and international mutual funds investing in large- and mid-capitalization companies.
Investments in mutual funds are valued at the net asset value per share multiplied by the number of shares held as of the measurement date and are traded on listed exchanges.
- (b)
- This
fund seeks maximum total return through a diversified portfolio of fixed income instruments of varying maturities, which may be represented by forward
or derivatives such as options, futures, contracts, or swap agreements. Fixed income instruments include bonds, debt securities and other similar instruments issued by various U.S. and
non-U.S. public or private-sector entities. This fund also invests in high yield securities, mortgage-related securities and securities denominated in foreign currencies. This fund is
valued at the net asset value per share multiplied by the number of shares held as of the measurement date and is traded on a listed exchange.
- (c)
- This fund invests in U.S. investment-grade corporate and government bonds with maturities of more than ten years. This fund is valued at the net asset value per share multiplied by the number of shares held as of the measurement date and is traded on a listed exchange.
The expected long-term return on assets of the Pension Plan is established at the beginning of each year by the Company's Benefits Committee in consultation with the plans' actuaries and outside investment advisor. A building block approach is used in determining the long-term rate of return for plan assets. Historical market returns are studied and long-term risk/return relationships between equity and fixed income asset classes are analyzed. This analysis supports the widely accepted fundamental investment principle that assets with greater risk generate higher returns over long periods of time. The historical impact of returns in one asset class on returns of another asset class is reviewed to evaluate portfolio diversification benefits. Current market factors including inflation rates and interest rate levels are considered before assumptions are developed. The long-term portfolio return is established via the building block approach by adding interest rate risk and equity risk premiums to the anticipated long-term rate of inflation. Proper consideration is given to the importance of portfolio diversification and periodic rebalancing. Peer data and historical return assumptions are reviewed to check for reasonableness. For the determination of net periodic benefit cost in 2013, the Company will utilize an expected long-term return on plan assets of 7.50%.
Assumed healthcare cost trend rates, discount rates, expected return on plan assets and salary increases have a significant effect on the amounts reported for the pension and healthcare plans. A
F-39
one-percentage-point change in the rate for each of these assumptions would have had the following effects as of and for the year ended December 31, 2012 (in thousands):
| |
Increase (Decrease) | ||||||
|---|---|---|---|---|---|---|---|
| |
1-Percentage Point Increase |
1-Percentage Point Decrease |
|||||
Healthcare cost trend: |
|||||||
Effect on total of service and interest cost components |
$ | 6,555 | $ | (5,153 | ) | ||
Effect on postretirement benefit obligation |
$ | 97,315 | $ | (79,003 | ) | ||
Discount rate: |
|||||||
Effect on postretirement service and interest cost components |
$ | (339 | ) | $ | 356 | ||
Effect on postretirement benefit obligation |
$ | (82,384 | ) | $ | 103,727 | ||
Effect on current year postretirement expense |
$ | (5,085 | ) | $ | 6,258 | ||
Effect on pension service and interest cost components |
$ | 88 | $ | (179 | ) | ||
Effect on pension benefit obligation |
$ | (31,734 | ) | $ | 38,655 | ||
Effect on current year pension expense |
$ | (2,661 | ) | $ | 3,142 | ||
Expected return on plan assets: |
|||||||
Effect on current year pension expense |
$ | (2,081 | ) | $ | 2,081 | ||
Rate of compensation increase: |
|||||||
Effect on pension service and interest cost components |
$ | 520 | $ | (465 | ) | ||
Effect on pension benefit obligation |
$ | 4,092 | $ | (3,748 | ) | ||
Effect on current year pension expense |
$ | 893 | $ | (808 | ) | ||
The Company's minimum pension plan funding requirement for 2013 is approximately $1.0 million, which the Company expects to fully fund. The Company also expects to pay $29.2 million in 2013 for benefits related to its other postretirement benefit plans. The following estimated benefit payments from the plans, which reflect expected future service, as appropriate, are expected to be paid as follows (in thousands):
| |
Pension Benefits |
Other Postretirement Benefits Before Medicare Subsidy |
Medicare Part D Subsidy |
|||||||
|---|---|---|---|---|---|---|---|---|---|---|
2013 |
$ | 19,907 | $ | 31,073 | $ | 1,873 | ||||
2014 |
$ | 15,327 | $ | 33,056 | $ | 2,109 | ||||
2015 |
$ | 17,163 | $ | 34,819 | $ | 2,367 | ||||
2016 |
$ | 16,848 | $ | 36,486 | $ | 2,603 | ||||
2017 |
$ | 18,164 | $ | 37,973 | $ | 2,843 | ||||
Years 2018-2022 |
$ | 96,934 | $ | 205,060 | $ | 18,297 | ||||
UMWA Pension and Benefit Trusts
The Company is required under its agreement with the UMWA to contribute to multi-employer plans providing pension, healthcare and other postretirement benefits. The risks of participating in these multi-employer plans are different from single-employer plans in the following aspects:
- •
- Assets contributed to the multiemployer plan by one employer may be used to provide benefits to employees of other
participating employers.
- •
- If a participating employer stops contributing to the plan, the unfunded obligations of the plan may be borne by the remaining participating employers.
F-40
- •
- The Employee Retirement Income Security Act of 1974 ("ERISA"), as amended in 1980, imposes certain liabilities on contributors to multi-employer pension plans in the event of a contributor's withdrawal from the plan.
At December 31, 2012, approximately 39% of Walter Energy's workforce was represented by the UMWA and covered under our collective bargaining agreement which began July 11, 2012 and will expire December 31, 2016. During 2011 the number of UMWA represented employees increased by approximately 300 as a result of the acquisition of the North River mine described in Note 3.
UMWA 1974 Pension Plan
The Company is required under the agreement with the UMWA to pay amounts to the 1974 UMWA Pension Plan ("the 1974 Pension Plan") based principally on hours worked by UMWA represented employees. The required contribution called for by our current collective bargaining agreement is $5.50 per hour worked. This cost is recognized as an expense in the year the payments are assessed. The benefits provided by the 1974 Pension Plan to the participating employees are determined based on age and years of service at retirement. The Company was listed in the 1974 Pension Plan's Form 5500, filed April 13, 2012, as providing more than 5 percent of the total contributions for the 2010 plan year.
As of June 30, 2012, the most recent date for which information is available, the 1974 Pension Plan was underfunded. This determination was made in accordance with ERISA calculations. In October 2012, the Company received notice from the trustees of the 1974 Pension Plan stating that the plan is considered to be "seriously endangered" for the plan year beginning July 1, 2012. The Pension Protection Act ("Pensions Act") requires a funded percentage of 80% be maintained for this multi-employer pension plan. If the plan is determined to have a funded percentage of less than 80% it will be deemed to be "endangered." The plan will be considered "seriously endangered", if the number of years to reach a projected funding deficiency equals 7 or less in addition to having a funded percentage of less than 80%, and if less than 65%, it will be deemed to be in "critical" status. The funded percentage certified by the actuary for the 1974 Pension Plan was determined to be 72.60% under the Pension Act.
The Company faces risks and uncertainties by participating in the 1974 Pension Plan. All assets contributed to the plan are pooled and available to provide benefits for all participants and beneficiaries. As a result, contributions made by the Company benefit the employees of other employers. If the 1974 Pension Plan fails to meet ERISA's minimum funding requirements or fails to develop and adopt a rehabilitation plan, a nondeductible excise tax of five percent of the accumulated funding deficiency may be imposed on an employer's contribution to this multi-employer pension plan. As a result of the 1974 Pension Plan's "seriously endangered" status, steps must be taken to improve the funded status of the plan. In an effort to improve the Plan's funding situation, the Plan Settlors adopted a Funding Improvement Plan as of May 25, 2012. The Funding Improvement Plan states that the Plan must avoid a funding deficiency for any plan year during the funding improvement period and improve the Plan's funded status by at least 20% over a 15-year period ending June 30, 2029. The Funding Improvement Plan calls for increased contributions beginning January 1, 2017 and lasting throughout the improvement period so that the Plan can meet the applicable benchmarks and emerge from seriously endangered status by the end of the Funding Improvement Period.
Under current law governing multi-employer defined benefit plans, if the Company voluntarily withdrew from the 1974 Pension Plan, the Company would be required to make payments to the plan which would approximate the proportionate share of the multiemployer plan's unfunded vested benefit liabilities at the time of the withdrawal. The 1974 Pension Plan uses a modified "rolling five" allocation method for calculating an employer's share of the unfunded vested benefits, or the withdrawal liability, for a plan year. An employer would be obligated to pay its pro-rata share of the unfunded vested
F-41
benefits based on the ratio of hours worked by the employer's employees during the previous five plan years for which contributions were due compared to the number of hours worked by all the employees of the employers from which contributions were due. The 1974 Pension Plan's unfunded vested benefits at June 30, 2012, the end of the latest plan year, were $5.0 billion. The Company's percentage of hours worked during the previous five plan years to the total hours worked by all plan participants during the same period was estimated to be approximately 12%. The Company does not have any intention to withdraw from the plan; however, if we were to withdraw from the plan before July 1, 2013, the Company's estimated withdrawal liability would be approximately $627.6 million.
The following table provides additional information regarding the multiemployer plan in which the Company participates as of December 31, 2012 (in thousands):
| |
|
Pension Protection Act Zone Status |
|
Contributions of Walter Energy |
|
|
||||||||||||||||||
|---|---|---|---|---|---|---|---|---|---|---|---|---|---|---|---|---|---|---|---|---|---|---|---|---|
| |
EIN/Pension Plan Number |
FIP/RP Status Pending/Implemented |
Surcharge Imposed |
Expiration Date of Collective-Bargaining Agreement |
||||||||||||||||||||
Pension Fund
|
2012 | 2011 | 2012 | 2011 | 2010 | |||||||||||||||||||
United Mine Workers of America 1974 Pension Plan(1) |
52-1050282/002 | Yellow | Yellow | Yes | $ | 20,948 | $ | 19,520 | $ | 13,425 | No | 12/31/2016 | ||||||||||||
- (1)
- The enrolled actuary for the UMWA 1974 Pension Plan ("the Plan") certified to the U.S. Department of the Treasury and the plan sponsor that the Plan is in "Seriously Endangered Status" for the plan year beginning July 1, 2012 and ending June 30, 2013. The Plan adopted a funding improvement plan on May 25, 2012.
UMWA Benefit Trusts
The Coal Industry Retiree Health Benefit Act of 1992 ("Coal Act") created two multiemployer benefit plans: (1) the United Mine Workers of America Combined Benefit Fund ("Combined Fund") into which the former UMWA Benefit Trusts were merged, and (2) the 1992 Benefit Fund. The Combined Fund provides medical and death benefits for all beneficiaries of the former UMWA Benefit Trusts who were actually receiving benefits as of July 20, 1992. The 1992 Benefit Fund provides medical and death benefits to orphan UMWA-represented members eligible for retirement on February 1, 1993, and who actually retired between July 20, 1992 and September 30, 1994. The Coal Act provides for the assignment of beneficiaries to former employers and the allocation of unassigned beneficiaries (referred to as orphans) to companies using a formula set forth in the Coal Act. The Coal Act requires that responsibility for funding the benefits to be paid to beneficiaries, be assigned to their former signatory employers or related companies. This cost is recognized as an expense in the year the payments are assessed. The Company's contributions to these funds for the years ended December 31, 2012, 2011 and 2010 were insignificant.
The UMWA 1993 Benefit Plan is a defined contribution plan that was created as the result of negotiations for the National Bituminous Coal Wage Agreement (NBCWA) of 1993. This plan provides healthcare benefits to orphan UMWA retirees who are not eligible to participate in the Combined Fund, or the 1992 Benefit Fund or whose last employer signed the 1993, or a later, NBCWA and who subsequently goes out of business. Contributions to the trust under the 2011 labor agreement were $1.10 and $.50 per hour worked by UMWA represented employees for the year ended December 31, 2012 and 2011, respectively. Contributions to the trust under the 2007 agreement were $1.42 per hour worked by UMWA represented employees for the year ended December 31, 2010, comprised of a $0.50 per hour worked under the labor agreement and $0.92 per hour worked by UMWA represented employees under the Tax Relief and Health Care Act of 2006 (the 2006 Act). Total contributions to the UMWA 1993 Benefit Plan in 2012, 2011 and 2010 were $4.2 million, $1.8 million and $3.8 million, respectively.
F-42
NOTE 16—Stockholders' Equity
In September 2008 the Board of Directors approved a $50.0 million share repurchase program and in December 2008 the Board of Directors authorized a $50.0 million expansion of the program. The new program began in 2009 and purchases were based on liquidity and market conditions. The Company purchased a total of 2,747,659 shares for $79.4 million in 2009 and 270,159 shares for $20.5 million in 2010. In 2010, the Board of Directors authorized a $45.0 million share repurchase program, which was substantially completed that year with the purchase of 3,658,408 shares at a cost of approximately $144.8 million.
On February 27, 2009, the Company's Board of Directors authorized and declared a dividend of one preferred stock purchase right (a "Right") for each share of common stock to stockholders of record as of the close of business on April 23, 2009. The shareholders approved this action and the Company entered into a rights agreement on April 24, 2009. Initially the Right is not exercisable and will trade with our common stock. The Right may be exercisable under certain circumstances, including a person or group acquiring, or the commencement of a tender or exchange offer that would result in a person or group acquiring, beneficial ownership of more than 20% of the outstanding shares of common stock. Upon exercise of the Right, each Right holder, other than the person or group triggering the plan, will have the right to purchase from us 1/1000th of a share of junior preferred stock (subject to adjustment) or, at the Company's option, shares of common stock having a value equal to two times the exercise price of the Right. Each fractional share of the junior preferred stock has terms designed to make it substantially the economic equivalent of one share of common stock. This rights agreement expired on April 23, 2012.
On April 23, 2009, shareholders voted to grant the Company the authority to issue 20,000,000 shares of preferred stock, at a par value of $0.01 per share. The Board believes the ability to issue preferred stock is necessary in order to provide the Company with greater flexibility in structuring future capital raising transactions, acquisitions and/or joint ventures, including taking advantage of financing techniques that receive favorable treatment from credit rating agencies. No preferred shares have been issued.
On April 1, 2011, the Company issued 8,951,558 common shares valued at $1.2 billion in connection with the acquisition of Western Coal as described in Note 3.
In connection with the acquisition of Western Coal, the Company assumed all the outstanding warrants of Western Coal (see Note 3). Upon exercise the outstanding Western Coal warrants entitle the holder to receive cash and shares of Walter Energy common stock that would have been issued if the warrants had been exercised immediately before closing of the acquisition. During the year ended December 31, 2012, the warrants were exercised (or expired) resulting in a cash payment of $11.5 million and the issuance of 18,938 shares of common stock. As of December 31, 2012 no warrants of Western Coal were outstanding.
F-43
NOTE 17—Net Income (Loss) Per Share
A reconciliation of the basic and diluted net income (loss) per share computations for the years ended December 31, 2012, 2011 and 2010 is as follows (in thousands, except per share data):
| |
For the years ended December 31, | ||||||||||||||||||
|---|---|---|---|---|---|---|---|---|---|---|---|---|---|---|---|---|---|---|---|
| |
2012 | 2011 | 2010 | ||||||||||||||||
| |
Basic | Diluted | Basic | Diluted | Basic | Diluted | |||||||||||||
Numerator: |
|||||||||||||||||||
Income (loss) from continuing operations |
$ | (1,065,555 | ) | $ | (1,065,555 | ) | $ | 363,598 | $ | 363,598 | $ | 389,425 | $ | 389,425 | |||||
Income (loss) from discontinued operations |
$ | 5,180 | $ | 5,180 | $ | — | $ | — | $ | (3,628 | ) | $ | (3,628 | ) | |||||
Denominator: |
|||||||||||||||||||
Average number of common shares outstanding |
62,536 | 62,536 | 60,257 | 60,257 | 53,179 | 53,179 | |||||||||||||
Effect of dilutive securities |
|||||||||||||||||||
Stock awards and warrants(a) |
— | — | — | 354 | — | 521 | |||||||||||||
|
62,536 | 62,536 | 60,257 | 60,611 | 53,179 | 53,700 | |||||||||||||
Income (loss) from continuing operations |
$ | (17.04 | ) | $ | (17.04 | ) | $ | 6.03 | $ | 6.00 | $ | 7.32 | $ | 7.25 | |||||
Income (loss) from discontinued operations |
0.08 | 0.08 | — | — | (0.07 | ) | (0.07 | ) | |||||||||||
Net income (loss) per share |
$ | (16.96 | ) | $ | (16.96 | ) | $ | 6.03 | $ | 6.00 | $ | 7.25 | $ | 7.18 | |||||
- (a)
- Stock awards represent the weighted average number of shares of common stock issuable on the exercise of dilutive employee stock options and restricted stock units, less the number of shares of common stock which could have been purchased with the proceeds from the exercise of such stock awards. These purchases were assumed to have been made at the average market price of the common stock for the period. In periods of net loss, the number of shares used to calculate diluted earnings per share is the same as basic earnings per share; therefore, the effect of dilutive securities is zero for such periods. The weighted average number of stock options outstanding of 238,210, 31,511, and 25,177 for the years ended December 31, 2012, 2011 and 2010, respectively, were excluded because their effect would have been anti-dilutive. Warrants outstanding in 2011 entitle the holder to receive cash and shares of common stock upon exercise.
NOTE 18—Commitments and Contingencies
Income Tax Litigation
The Company is currently engaged in litigation with the IRS with regard to certain federal income tax issues; see Note 11 for a more complete explanation.
Environmental Matters
The Company is subject to a wide variety of laws and regulations concerning the protection of the environment, both with respect to the construction and operation of its plants, mines and other facilities and with respect to remediating environmental conditions that may exist at its own and other properties.
F-44
The Company believes that it is in substantial compliance with federal, state and local environmental laws and regulations. The Company accrues for environmental expenses resulting from existing conditions that relate to past operations when the costs are probable and can be reasonably estimated.
Walter Coke, Inc.
Walter Coke entered into a decree order in 1989 ("the Order") relative to a Resource Conservation Recovery Act ("RCRA") compliance program mandated by the Environmental Protection Agency ("EPA"). A RCRA Facility Investigation ("RFI") Work Plan was prepared which proposed investigative tasks to assess the presence of contamination at the Walter Coke facility. At the end of 2004, the EPA re-directed Walter Coke's RFI efforts toward completion of the Environmental Indicator ("EI") determinations for the Current Human Exposures, which were approved and finalized for Walter Coke's Birmingham facility in September 2005. In January 2008, as a follow-up to the EI determination, the EPA requested that Walter Coke perform additional soil sampling and testing in the neighborhoods surrounding its facility. The results of this sampling and testing were submitted to the EPA for review in December 2009. In conjunction with the plan, Walter Coke agreed to remediate portions of 23 properties based on the 2009 sampling and that process was completed in early 2012.
In December 2011, the EPA notified Walter Coke in the form of a General Notice Letter that it proposed that the offsite remediation project be classified and managed as a Superfund site under CERCLA, allowing other Potentially Responsible Parties (PRP's) to potentially be held responsible. Under CERCLA authority, EPA is proceeding directly with the offsite sampling work and deferring any further enforcement actions or decisions, including evaluating whether Walter Coke or any other company is in fact a PRP, to a subsequent time.
A RCRA Section 3008(h) Administrative Order on Consent (Order) with the effective date of September 24, 2012, was signed by Walter Coke and the EPA. The 2012 Order declared that all of the approved investigation tasks of the RFI Work Plans required by the 1989 Order had been completed by Walter Coke and that the 1989 Order was terminated and no longer in effect. The objectives of the 2012 Order are to perform Corrective Measure Studies, implement remedies if necessary, and implement and maintain institutional controls if required at the Walter Coke facility.
The Company has incurred costs to investigate the presence of contamination at the Walter Coke facility and to define remediation actions to address this environmental liability in accordance with the agreements reached with the EPA under the RFI and the residential soil sampling conducted by Walter Coke in the neighborhoods surrounding its facility. At December 31, 2012, the Company has an amount accrued that is probable and can be reasonably estimated for the costs to be incurred to identify and define remediation actions, as well as to perform certain remedial tasks which can be quantified. The amount of this accrual is not material to the financial statements. While it is probable that the Company will incur additional future costs to remediate environmental liabilities at the Walter Coke facility, the amount of such additional costs cannot be reasonably estimated at this time. Additionally, pending EPA's sampling activities in the neighborhoods and identification of PRP's, the Company at this time is unable to reasonably estimate the cost of offsite remediation activities that may be required. Although no assurances can be given that the Company will not be required in the future to make material expenditures relating to the Walter Coke site or other sites, management does not believe at this time that the cleanup costs, if any, associated with these sites will have a material adverse effect on the Company's consolidated financial statements, but such cleanup costs could be material to results of operations in a future reporting period.
The Company and Walter Coke were named in a suit filed by Louise Moore on April 26, 2011 (Louise Moore v. Walter Energy, Inc. and Walter Coke, Inc., Case No. 2:11-CV-01391) in the federal District Court for the Northern District of Alabama. This is a putative civil class action alleging state
F-45
law tort claims arising from the alleged presence on properties of substances, including arsenic, Bopp, and other hazardous substances, allegedly as a result of current and/or historic operations in the area conducted by the companies and/or their predecessors. On June 6, 2011, the plaintiff filed an amended complaint eliminating Walter Energy as a defendant and amending the claims alleged against Walter Coke to relate to Walter Coke's alleged conduct for the period commencing after March 2, 1995. On June 20, 2011, Walter Coke filed a Motion to Dismiss the amended complaint. On September 28, 2012, the Court issued a memorandum opinion and order granting in part and denying in part the motion. In partially granting Walter Coke's motion, the Court held that the plaintiff's claim for injunctive relief was not valid and that class action-related claims must be dismissed (with leave to re-plead) due to an improperly defined class. In partially ruling for the plaintiff, the Court held that at the pleading stage the plaintiff's claims could not be dismissed on rule of repose grounds or due to insufficient pleading. The plaintiff filed an amended complaint on October 29, 2012. On November 19, 2012, Walter Coke filed an answer and motion for partial dismissal of plaintiff's second amended complaint. The Court held a hearing on Walter Coke's motion for partial dismissal of the second amended complaint on January 10, 2013, and a ruling is pending.
The Company and Walter Coke believe that there is no merit to the claims alleged in this action and intend to vigorously defend this matter.
Maple Coal Company
Maple Coal Company ("Maple") was the subject of a compliance order issued against its water discharge permit in April 2007 by the West Virginia Department of Environmental Protection ("WVDEP"). This order provided that Maple would have until April 5, 2010 to comply with certain water quality-based effluent limitations for selenium concentrations in discharges from its mining operations.
Maple sought a permit modification to extend the selenium compliance date beyond April 5, 2010 which was denied by both the WVDEP and the West Virginia Environmental Quality Board ("EQB"). Maple filed an appeal of these rulings (consolidated into one case) with the Fayette County (West Virginia) Circuit Court. In connection with this administrative appeal, Maple also obtained a stay order from the Fayette County Circuit Court, suspending the effective date of the selenium limits in its NPDES permit pending the outcome of that appeal. The parties to that appeal agreed to defer briefing, pending negotiation of a comprehensive settlement of all such issues (discussed below).
In a related action, in June 2010 the WVDEP instituted a civil enforcement action against Maple seeking to enforce effluent limits for non-selenium parameters found in the Maple permit, asserting violations of various in-stream water quality standards, and alleging a violation of the April 5, 2007 selenium compliance order. Maple has entered into a comprehensive consent decree with the WVDEP with civil penalties of $229,350, resolving that case and the case mentioned above.
In a second related action, in January 2011 three environmental interest groups filed a Clean Water Act citizen's suit against Maple, seeking more than $14 million in civil penalties for selenium violations since April 2010 and injunctive relief in the form of mandatory treatment plant installations. On June 26, 2012, the Court entered a Consent Decree between the parties to this federal action ("Federal Consent Decree"), resolving all claims asserted against Maple. The Federal Consent Decree required the payment of approximately $103,000 in attorney's fees and expenses and that Maple complete additional documentation as part of its implementation of the WVDEP Consent Decree.
Jim Walter Resources
In July, 2011, Jim Walter Resources, Inc. ("JWR") reported a slurry spill at its North River mine to the Alabama Department of Environmental Management ("ADEM") and the Alabama Surface Mining Commission ("ASMC"). As a result, a penalty of $145,200 was assessed and paid to ASMC in
F-46
November, 2011. A penalty of $60,000 was assessed by ADEM in December, 2011. JWR has expended approximately $5.0 million in remediation costs which is substantially complete and is pursuing insurance claims.
Securities Class Actions and Shareholder Derivative Actions
On January 26, 2012 and March 15, 2012, putative class actions were filed against Walter Energy, Inc. and some of its current and former senior executive officers in the U.S. District Court for the Northern District of Alabama (Rush v. Walter Energy, Inc., et al.). The three executive officers named in the complaints are: Keith Calder, Walter's former CEO; Walter Scheller, the Company's current CEO and a director; and Neil Winkelmann, former President of Walter's Canadian and U.K. Operations (collectively the "Individual Defendants"). The complaints were filed by Peter Rush and Michael Carney, purported shareholders of Walter Energy who each seek to represent a class of Walter Energy shareholders who purchased common stock between April 20, 2011 and September 21, 2011.
These complaints allege that Walter Energy and the Individual Defendants made false and misleading statements regarding the Company's operations outlook for the second quarter of 2011. The complaints further allege that the Company and the Individual Defendants knew that these statements were misleading and failed to disclose material facts that were necessary in order to make the statements not misleading. Plaintiffs claim violations of Section 10(b) of the Securities Exchange Act of 1934, Rule 10b-5 promulgated thereunder, and Section 20(a) of the 1934 Act. On May 30, 2012, the two actions were consolidated into In re Walter Energy, Inc. Securities Litigation. The court also appointed the Government of Bermuda Contributory and Public Service Superannuation Pension Plans as well as the Stephen C. Beaulieu Revocable Trust to be lead plaintiffs and approved lead plaintiffs' selection of Robbins Geller Rudman & Dowd LLP and Kessler Topaz Meltzer & Check, LLP as lead plaintiffs' counsel for the consolidated action. On August 20, 2012, Lead Plaintiffs filed a consolidated amended class action complaint in this action. The consolidated amended complaint names as an additional defendant Joseph Leonard, a current director and former interim CEO of Walter, in addition to the previously named defendants. Defendants filed a Motion to Dismiss the amended complaint on October 4, 2012. On January 29, 2013, the court denied that motion without prejudice.
Walter Energy and the other named defendants believe that there is no merit to the claims alleged and intend to vigorously defend these actions.
On February 7, 2012, a shareholder derivative lawsuit was filed in the 10th Judicial Circuit of Alabama (Israni v. Clark et al.). On February 10, 2012, a second shareholder derivative suit was filed in the same court (Himmel v. Scheller et al.), and on February 16, 2012 a third derivative suit was filed (Walters v. Scheller et al.). All three complaints name as defendants the Company's current Board of Directors, Keith Calder and Neil Winkelmann. The Company is named as a nominal defendant in each complaint. The three complaints allege similar facts to those alleged in the Rush complaint. The complaints variously assert state law claims for breaches of fiduciary duties for alleged failures to maintain internal controls and to properly manage the Company, unjust enrichment, waste of corporate assets, gross mismanagement and abuse of control. The three derivative actions seek, among other things, recovery for the Company for damages that the Company suffered as a result of alleged wrongful conduct. On April 11, 2012, the Court consolidated these shareholder derivative suits. Walter Energy thereafter entered into a stipulation with the lead plaintiffs in the consolidated derivative suit, pursuant to which all proceedings in the derivative action were stayed pending the filing of the consolidated amended complaint in the class action. On September 19, 2012, lead plaintiffs filed a consolidated shareholder derivative complaint. This action was previously stayed pending resolution of Walter's motion to dismiss in the putative securities class action. The parties are currently in the process of negotiating a schedule going forward.
F-47
On March 1, 2012, a shareholder derivative lawsuit was filed in the U.S. District Court for the Northern District of Alabama (Makohin v. Clark, et al.). On September 27, 2012 a second shareholder derivative lawsuit was filed in the same court (Sinerius v. Beatty, et al.) Both complaints name as defendants the Company's current Board of Directors and Keith Calder. The Company is named as a nominal defendant in each complaint. These complaints, like the state court derivative claims, allege similar facts to those alleged in the Rush complaint. The Makohin complaint asserts state law claims for breaches of fiduciary duties and unjust enrichment, while the Sinerius complaint asserts these same claims as well as claims for abuse of control and gross mismanagement. Both actions seek, among other things, recovery for the Company for damages that the Company suffered as a result of alleged wrongful conduct and restitution from defendants of all profits, benefits and other compensation that they wrongfully obtained. Like the state court derivative action, both of these cases were previously stayed pending resolution of Walter's motion to dismiss in the putative securities class action.
Walter Energy and the other named defendants believe that there is no merit to the claims alleged in these shareholder derivative lawsuits and intend to vigorously defend these actions.
In November 2009, Western Coal was named as a defendant in a statement of claim issued by a plaintiff who sought leave of the Ontario Courts to proceed with a securities class action. This claim also named Western Coal's former President and director, John Hogg, and two of its non-executive directors, John Brodie and Robert Chase, as defendants.
The plaintiff subsequently delivered an amended claim that added new allegations that sought to have the amended claim certified as a class action separately from the proposed securities class action allegations. The new allegations focused on certain transactions the plaintiff claims were oppressive and unfair to the interests of shareholders. The amended claim included additional defendants of Western Coal's former Chairman, John Byrne, its remaining non-executive directors John Conlon and Charles Pitcher, Audley European Opportunities Master Fund Limited, Audley Capital Management Limited, and Audley Advisors LLP.
The proposed securities claims alleged that those persons who acquired or disposed of Western Coal shares between November 14, 2007 and December 10, 2007 should be entitled to recover $200 million for general damages and $20 million in punitive damages. The plaintiff alleges that Western Coal's consolidated financial statements for the second quarter of fiscal 2008 and the accompanying news release issued on November 14, 2007 misrepresented Western Coal's financial condition and that Western Coal failed to make full, plain and true disclosure of all material facts and changes.
The plaintiff's oppression claims were advanced in respect of Western Coal's security holders in the period between April 26, 2007 and July 13, 2009. The claims were that the defendants caused Western Coal to enter into transactions that had a dilutive effect on the interests of its shareholders. The damages associated with these alleged dilutive effects were not developed or quantified.
The plaintiff's motions to proceed with securities claims and also to certify the securities and oppression claims as class actions were argued in June 2012. The court dismissed each of these motions on September 14, 2012. The action has now been settled pursuant to a court order dismissing the action without cost. The appeal has been abandoned.
Miscellaneous Litigation
The Company and its subsidiaries are parties to a number of other lawsuits arising in the ordinary course of their businesses. The Company records costs relating to these matters when a loss is probable and the amount can be reasonably estimated. The effect of the outcome of these matters on the Company's future results of operations cannot be predicted with certainty as any such effect depends on future results of operations and the amount and timing of the resolution of such matters. While the
F-48
results of litigation cannot be predicted with certainty, the Company believes that the final outcome of such other litigation will not have a material adverse effect on the Company's consolidated financial statements.
Commitments and Contingencies—Other
In the opinion of management, accruals associated with contingencies incurred in the normal course of business are sufficient. Resolution of existing known contingencies is not expected to significantly affect the Company's financial position and results of operations.
Undistributed Foreign Earnings
The Company has not provided U.S. income taxes and foreign withholding taxes on the undistributed earnings of foreign subsidiaries as of December 31, 2012 because it intends to indefinitely reinvest such earnings outside the U.S. If this intent changes, additional income tax expense would likely be recorded due to the differential in tax rates between the U.S. and the international jurisdictions. If these foreign earnings were to be repatriated in the future, the related U.S. tax liability on such repatriation may be partially reduced by any foreign income taxes previously paid on these earnings. Determination of the amount of taxes that might be paid on these undistributed earnings if eventually remitted is not practicable as no plans to repatriate are in place.
Ridley Terminal Services Agreement
In connection with the acquisition of Western Coal, the Company assumed a terminal services agreement (the "Agreement") with Ridley Terminals Inc. located in British Columbia. The Agreement contains minimum throughput obligations each calendar year through December 31, 2020. If the Company does not meet its minimum throughput obligation, the Company shall pay Ridley Terminals a contractually specified amount per metric ton for the difference between the actual throughput and the minimum throughput requirement. At December 31, 2012, the Company has recorded a liability of $2.5 million as a result of not meeting the required minimum.
Port of Mobile, Alabama
We have various transportation and throughput agreements with its transportation providers and the Alabama State Port Authority. These agreements contain minimum tonnage guarantees with respect to coal transported from the mine sites to the Port of Mobile, Alabama, unloading of rail cars or barges, and the loading of vessels. If the Company does not meet its minimum throughput obligations, the Company shall pay the transportation providers and the Alabama State Port Authority a contractually specified amount per metric ton for the difference between the actual throughput and the minimum throughput requirement. At December 31, 2012, the Company has recorded a liability of $5.1 million as a result of not meeting the required minimums.
Lease Obligations
The Company's leases are primarily for mining equipment, automobiles and office space. The total cost of assets under capital leases was $45.4 million and $118.8 million at December 31, 2012 and 2011, respectively. Accumulated amortization on assets under capital leases was $14.5 million and $16.8 million at December 31, 2012 and 2011, respectively. Amortization expense for capital leases is included in depreciation and depletion expense. Rent expense was $18.1 million, $21.0 million and $13.7 million for the years ended December 31, 2012, 2011 and 2010, respectively. Future minimum
F-49
payments under non-cancellable capitalized and operating leases as of December 31, 2012 are as follows (in thousands):
| |
Capitalized Leases |
Operating Leases |
|||||
|---|---|---|---|---|---|---|---|
2013 |
$ | 12,333 | $ | 12,812 | |||
2014 |
8,815 | 9,051 | |||||
2015 |
6,133 | 3,068 | |||||
2016 |
64 | 2,647 | |||||
2017 |
— | 2,551 | |||||
Thereafter |
— | 1,766 | |||||
Total |
27,345 | $ | 31,895 | ||||
Less: amount representing interest and other executory costs |
(2,016 | ) | |||||
Present value of minimum lease payments |
$ | 25,329 | |||||
A substantial amount of the coal we mine is produced from mineral reserves leased from third-party land owners. These leases convey mining rights to the coal producer in exchange for royalties to be paid to the lessor either as a fixed amount per ton or as a percentage of the sales price. Although coal leases have varying renewal terms and conditions, they generally last for the economic life of the reserves. Coal royalty expense was $116.3 million, $111.5 million and $88.8 million for the years ended December 31, 2012, 2011 and 2010 respectively.
NOTE 19—Derivative Financial Instruments
Interest Rate Swaps
On June 27, 2011, the Company entered into an interest rate swap agreement with a notional value of $450.0 million. The objective of the swap is to protect against the variability in expected future cash flows attributable to changes in the benchmark interest rate related to interest payments required under the 2011 Credit Agreement. The interest rate on the debt is subject to change due to fluctuations in the benchmark interest rate of 3-month LIBOR. The structure of the hedge is a three year amortizing interest rate swap based on a 1.17% fixed rate with quarterly fixed rate and floating rate payment dates beginning on July 18, 2011. The hedge will be settled upon maturity and is being accounted for as a cash flow hedge. Changes in the fair value of the hedge that take place through the date of maturity are reported in accumulated other comprehensive income (loss) and reclassified into earnings in the same period or periods during which the hedged transactions affect earnings.
On December 30, 2008, the Company entered into an interest rate hedge agreement with a notional value of $31.5 million. The objective of the hedge is to protect against the variability in expected future cash flows attributable to changes in the benchmark interest rate related to 62 of the 64 monthly interest payments required under an equipment financing arrangement for a new longwall shield system entered into on October 21, 2008. The interest rate on the debt is subject to change due to fluctuations in the benchmark interest rate of 1-month LIBOR. The structure of the hedge is a 62 month amortizing interest rate swap based on a 1.84% fixed rate with monthly fixed rate and floating rate payment dates beginning on February 1, 2009. The hedge will be settled upon maturity and is being accounted for as a cash flow hedge. Changes in the fair value of the hedge that take place through the date of maturity are reported in accumulated other comprehensive income (loss) and reclassified into earnings in the same period or periods during which the hedged transactions affect earnings.
F-50
Interest Rate Cap
On June 27, 2011, the Company entered into an interest rate cap agreement related to interest payments required under the 2011 Credit Agreement with a notional value of $255.0 million. The objective of the cap is to protect against the variability in expected future cash flows attributable to changes in the benchmark interest rate above 2.00%. The interest rate on the debt is subject to change due to fluctuations in the benchmark interest rate of 3-month LIBOR. The structure of the hedge is a three year amortizing interest rate cap based on a strike price of 2.00% with quarterly fixed rate and floating rate payment dates beginning on July 7, 2011. The hedge will be settled upon maturity and is being accounted for as a cash flow hedge. Changes in the fair value of the hedge that take place through the date of maturity are reported in accumulated other comprehensive income (loss) and reclassified into earnings in the same period or periods during which the hedged transactions affect earnings.
Natural Gas Hedge
Revenues derived from the sale of natural gas are subject to volatility based on changes in market prices. In order to reduce the risk associated with natural gas price volatility, on June 7, 2011 the Company entered into a one year swap contract to hedge 4.2 million MMBTUs of natural gas sales beginning in July 2011 and ending June 2012, at a price of $5.00 per MMBTU. The swap agreement hedged approximately 30% of natural gas sales from July 2011 until June 2012. The hedge was settled upon maturity and was accounted for as a cash flow hedge. The Company did not have any commodity hedges outstanding at December 31, 2012.
The following table presents the fair values of the Company's derivative instruments as well as the classification in the Consolidated Balance Sheets (in thousands). See Note 20 for additional information related to the fair values of our derivative instruments.
| |
December 31, 2012 |
December 31, 2011 |
|||||
|---|---|---|---|---|---|---|---|
Asset derivatives designated as cash flow hedging instruments: |
|||||||
Natural gas hedge(1) |
$ | — | $ | 4,050 | |||
Interest rate cap(2) |
12 | 432 | |||||
Total asset derivatives |
$ | 12 | $ | 4,482 | |||
Liability derivatives designated as cash flow hedging instruments: |
|||||||
Interest rate swaps(3) |
$ | 6,615 | $ | 5,683 | |||
- (1)
- Included
within other current assets at December 31, 2011.
- (2)
- $8,000
and $143,000 is included within other current assets and $4,000 and $289,000 is included within other long-term assets in the
Consolidated Balance Sheets as of December 31, 2012 and 2011, respectively.
- (3)
- $4.1 million and $1.8 million is included within other current liabilities and $2.5 million and $3.9 million is included within other long-term liabilities in the Consolidated Balance Sheets as of December 31, 2012 and 2011, respectively.
F-51
The following tables present the gains and losses from derivative instruments for the years ended December 31, 2012 and 2011 and their location within the consolidated financial statements (in thousands). The Company utilizes only cash flow hedges that are considered highly effective.
| Derivatives designated as cash flow hedging instruments |
Gain (loss) recognized in accumulated other comprehensive income, net of tax |
Gain (loss) reclassified from accumulated other comprehensive income (loss) to earnings |
Gain (loss) recognized in earnings |
||||||||||||||||
|---|---|---|---|---|---|---|---|---|---|---|---|---|---|---|---|---|---|---|---|
| |
For the years ended December 31, |
For the years ended December 31, |
For the years ended December 31, |
||||||||||||||||
| |
2012 | 2011 | 2012 | 2011 | 2012 | 2011 | |||||||||||||
Natural gas hedges(1) |
$ | (5,812 | ) | $ | 837 | $ | 3,279 | $ | 1,472 | $ | — | $ | — | ||||||
Interest rate swaps(2) |
1,459 | (2,063 | ) | (2,079 | ) | (1,231 | ) | — | — | ||||||||||
Interest rate cap(2) |
(263 | ) | 269 | — | — | — | — | ||||||||||||
Total |
$ | (4,616 | ) | $ | (957 | ) | $ | 1,200 | $ | 241 | $ | — | $ | — | |||||
- (1)
- Natural
gas hedge amounts recorded in miscellaneous income in the Consolidated Statements of Operations.
- (2)
- Interest rate swap amounts recorded in interest expense in the Consolidated Statements of Operations.
NOTE 20—Fair Value of Financial Instruments
Fair value is defined as the price that would be received to sell an asset or paid to transfer a liability in an orderly transaction between market participants at the measurement date. A three level hierarchy has been established for valuing assets and liabilities based on how transparent (observable) the inputs are that are used to determine fair value, with the inputs considered most observable categorized as Level 1 and those that are the least observable categorized as Level 3. Hierarchy levels are defined as follows:
| Level 1: | Quoted prices in active markets for identical assets and liabilities; | |
Level 2: |
Quoted prices for similar assets and liabilities in active markets; quoted prices for identical or similar instruments in markets that are not active; and |
|
Level 3: |
Unobservable inputs that are supported by little or no market data which require the reporting entity to develop its own assumptions. |
The following table presents information about the Company's assets and liabilities that are measured at fair value on a recurring basis as of December 31, 2012 and December 31, 2011 and indicate the fair value hierarchy of the valuation techniques utilized to determine such values. For some assets, the inputs used to measure fair value may fall into different levels of the fair value hierarchy. When this is the case, the asset is categorized based on the level of the most significant input to the
F-52
fair value measurement. The Company's assessment of the significance of a particular input to the fair value measurement requires judgment and considers factors specific to the assets being valued.
| |
December 31, 2012 | ||||||||||||
|---|---|---|---|---|---|---|---|---|---|---|---|---|---|
| |
Fair Value Measurements Using |
|
|||||||||||
| |
Total Fair Value |
||||||||||||
(in thousands)
|
Level 1 | Level 2 | Level 3 | ||||||||||
Assets: |
|||||||||||||
Interest rate cap |
— | 12 | — | 12 | |||||||||
Total assets |
$ | — | $ | 12 | $ | — | $ | 12 | |||||
Liabilities: |
|||||||||||||
Interest rate swaps |
$ | — | $ | 6,615 | $ | — | $ | 6,615 | |||||
| |
December 31, 2011 | ||||||||||||
|---|---|---|---|---|---|---|---|---|---|---|---|---|---|
| |
Fair Value Measurements Using |
|
|||||||||||
| |
Total Fair Value |
||||||||||||
(in thousands)
|
Level 1 | Level 2 | Level 3 | ||||||||||
Assets: |
|||||||||||||
Equity securities, trading |
$ | 12,369 | $ | — | $ | — | $ | 12,369 | |||||
Equity securities, available-for-sale |
12,099 | — | — | 12,099 | |||||||||
Interest rate cap |
— | 432 | — | 432 | |||||||||
Natural gas hedge |
— | 4,050 | — | 4,050 | |||||||||
Total assets |
$ | 24,468 | $ | 4,482 | $ | — | $ | 28,950 | |||||
Liabilities: |
|||||||||||||
Interest rate swaps |
$ | — | $ | 5,683 | $ | — | $ | 5,683 | |||||
Below is a summary of the Company's valuation techniques for Level 1 and Level 2 financial assets and liabilities:
Equity securities—Changes in the fair value of trading securities are recorded in other income (loss) and determined using observable market prices. For the year ended December 31, 2012, a loss of $11.5 million was recorded related to trading securities held during the period. Realized losses of $1.6 million on the sale of available-for-sale securities were recorded in other income (loss) during the year ended December 31, 2012 and determined using the specific identification method.
Interest rate cap—The fair value of the interest rate cap was determined using quoted dealer prices for similar contracts in active over-the-counter markets.
Natural gas hedge—The fair value of the natural gas hedge was determined using quoted dealer prices for similar contracts in active over-the-counter markets.
Interest rate swaps—The fair value of interest rate swaps were determined using quoted dealer prices for similar contracts in active over-the-counter markets.
The following methods and assumptions were used to estimate the fair value for which the fair value option was not elected:
Cash and cash equivalents, receivables and accounts payable—The carrying amounts reported in the balance sheet approximate fair value.
Debt—Debt associated with the Company's 2011 term loan A and term loan B in the amount of $757.0 million and $1.128 billion, respectively, at December 31, 2012 and $894.8 million and
F-53
$1.333 billion, respectively, at December 31, 2011 is carried at cost. Debt associated with the Company's revolving credit facility in the amount of $10.0 million at December 31, 2011 is carried at cost. There were no borrowings outstanding under the Revolver at December 31, 2012. Debt associated with the Company's 2020 Notes in the amount of $496.5 million at December 31, 2012 is carried at cost. The estimated fair value of the Company's term loan A, term loan B, and 2020 Notes was $758.9 million, $1.135 billion and $500.0 million at December 31, 2012, respectively, based on similar transactions and yields in an active market for similarly rated debt (Level 2).
NOTE 21—Segment Information
The Company's reportable segments are strategic business units arranged geographically which have separate management teams. The business units have been aggregated into three reportable segments following the Western Coal acquisition as described in Note 1. These reportable segments are U.S. Operations, Canadian and U.K. Operations, and Other. Both the U.S. Operations and Canadian and U.K. Operations reportable segments primary business is that of mining and exporting metallurgical coal for the steel industry. The U.S. Operations segment includes Walter Energy's historical operating segments of Underground Mining, Surface Mining and Walter Coke as well as the results of the West Virginia mining operations acquired through the acquisition of Western Coal. The Canadian and U.K. Operations segment includes the results of the mining operations located in Northeast British Columbia (Canada) and South Wales (United Kingdom). The Other segment primarily includes corporate expenses.
The accounting policies of the segments are the same as those described in the summary of significant accounting policies. The Company evaluates performance primarily based on operating income of the respective business segments.
F-54
Summarized financial information concerning the Company's reportable segments is shown in the following tables (in thousands):
| |
For the years ended December 31, | |||||||||
|---|---|---|---|---|---|---|---|---|---|---|
| |
2012 | 2011 | 2010 | |||||||
Revenues: |
||||||||||
U.S. Operations |
$ | 1,728,363 | $ | 1,871,182 | $ | 1,584,734 | ||||
Canadian and U.K. Operations |
668,313 | 698,054 | — | |||||||
Other |
3,219 | 2,122 | 2,996 | |||||||
Total Revenues(a) |
$ | 2,399,895 | $ | 2,571,358 | $ | 1,587,730 | ||||
Segment operating income (loss):(b) |
||||||||||
U.S. Operations |
$ | 188,696 | $ | 561,370 | $ | 634,442 | ||||
Canadian and U.K. Operations |
(1,158,591 | ) | 86,538 | — | ||||||
Other |
(43,231 | ) | (74,477 | ) | (40,380 | ) | ||||
Total operating income (loss) |
(1,013,126 | ) | 573,431 | 594,062 | ||||||
Less interest expense, net |
(138,552 | ) | (96,214 | ) | (16,466 | ) | ||||
Other income (loss) |
(13,081 | ) | 17,606 | — | ||||||
Income (loss) from continuing operations before income tax expense |
(1,164,759 | ) | 494,823 | 577,596 | ||||||
Income tax (expense) benefit |
99,204 | (131,225 | ) | (188,171 | ) | |||||
Income (loss) from continuing operations |
$ | (1,065,555 | ) | $ | 363,598 | $ | 389,425 | |||
Impairment and restructuring charges: |
||||||||||
U.S. Operations |
$ | 114,281 | $ | — | $ | — | ||||
Canadian and U.K. Operations |
999,198 | — | — | |||||||
Other |
— | — | — | |||||||
Total |
$ | 1,113,479 | $ | — | $ | — | ||||
| |
For the years ended December 31 | |||||||||
|---|---|---|---|---|---|---|---|---|---|---|
| |
2012 | 2011 | 2010 | |||||||
Depreciation and depletion: |
||||||||||
U.S. Operations |
$ | 173,140 | $ | 155,702 | $ | 98,170 | ||||
Canadian and U.K. Operations |
141,713 | 74,203 | — | |||||||
Other |
1,379 | 776 | 532 | |||||||
Total |
$ | 316,232 | $ | 230,681 | $ | 98,702 | ||||
Capital expenditures: |
||||||||||
U.S. Operations |
$ | 162,535 | $ | 149,996 | $ | 152,299 | ||||
Canadian and U.K. Operations |
224,583 | 264,476 | — | |||||||
Other |
4,394 | 94 | 5,177 | |||||||
Total |
$ | 391,512 | $ | 414,566 | $ | 157,476 | ||||
F-55
| |
As of December 31, | |||||||||
|---|---|---|---|---|---|---|---|---|---|---|
| |
2012 | 2011 | 2010 | |||||||
Identifiable assets by segment: |
||||||||||
U.S. Operations |
$ | 1,603,745 | $ | 1,118,451 | $ | 1,021,534 | ||||
Canadian and U.K. Operations |
3,728,817 | 5,021,521 | — | |||||||
Other |
435,858 | 716,536 | 630,319 | |||||||
Assets of discontinued operations |
— | — | 5,912 | |||||||
Total |
$ | 5,768,420 | $ | 6,856,508 | $ | 1,657,765 | ||||
Long-lived assets by country: |
||||||||||
U.S. |
$ | 1,034,992 | $ | 1,096,763 | $ | 790,001 | ||||
Canada |
3,203,227 | 3,195,377 | — | |||||||
U.K. |
459,469 | 395,451 | — | |||||||
Total |
$ | 4,697,688 | $ | 4,687,591 | $ | 790,001 | ||||
- (a)
- Export sales were $1.9 billion, $2.0 billion and $1.2 billion for the years ended December 31, 2012, 2011 and 2010, respectively. Export sales to customers in foreign countries in excess of 10% of consolidated revenues for the years ended December 31, 2012, 2011 and 2010 were as follows:
| |
Percent of Consolidated Revenues For the years ended December 31, |
|||||||||
|---|---|---|---|---|---|---|---|---|---|---|
Country
|
2012 | 2011 | 2010 | |||||||
Japan |
11.5 | % | 9.4 | % | 5.2 | % | ||||
Brazil |
10.7 | % | 10.5 | % | 24.9 | % | ||||
Germany |
9.7 | % | 9.8 | % | 13.7 | % | ||||
U.K. |
5.4 | % | 6.2 | % | 10.3 | % | ||||
- (b)
- Segment operating income (loss) amounts include expenses for other postretirement benefits. A breakdown by segment of other postretirement benefits (income) expense is as follows (in thousands):
| |
For the years ended December 31, | |||||||||
|---|---|---|---|---|---|---|---|---|---|---|
| |
2012 | 2011 | 2010 | |||||||
U.S. Operations |
$ | 53,301 | $ | 41,745 | $ | 43,228 | ||||
Canadian and U.K. Operations |
— | — | — | |||||||
Other |
(449 | ) | (1,360 | ) | (1,750 | ) | ||||
|
$ | 52,852 | $ | 40,385 | $ | 41,478 | ||||
F-56
NOTE 22—Related Party Transactions
The Company owns a 50% interest in the joint venture Black Warrior Methane ("BWM"), which is accounted for under the proportionate consolidation method. The Company has granted the rights to produce and sell methane gas from its coal mines to BWM. The Company also supplies labor to BWM and incurs costs, including property and liability insurance, to support the joint venture. The Company charges the joint venture for such costs on a monthly basis. These charges for 2012, 2011 and 2010 were $2.4 million, $2.9 million and $2.5 million, respectively.
In connection with the acquisition of Western Coal on April 1, 2011, the Company acquired a 50% interest in the Belcourt Saxon Coal Limited Partnership ("Belcourt Saxon"). Belcourt Saxon owns two multi-deposit coal properties which are located approximately 40 to 80 miles south of the Wolverine surface mine in Northeast British Columbia. The joint venture was formed for the future exploration and development of surface coal mines. Belcourt Saxon is accounted for under the proportionate consolidation method. Costs associated with the joint venture were insignificant for 2012. No field work was conducted on the Belcourt Saxon properties during 2012, other than maintenance of environmental monitoring stations.
NOTE 23—Supplemental Guarantor and Non-Guarantor Financial Information
On November 21, 2012, the Company completed a private placement of $500.0 million in aggregate principal amount of 9.875% senior notes due December 15, 2020 ("2020 Notes"). The 2020 Notes are unconditionally guaranteed, jointly and severally, on an unsecured basis, by each of our current and future wholly-owned domestic restricted subsidiaries. In connection with the private placement, the guarantors entered into a registration rights agreement with the initial purchasers in which we agreed, among other things, to file a registration statement covering an offer to exchange the 2020 Notes for a new issue of exchange notes registered under the Securities Act of 1933 with substantially identical terms. The Company intends to file a registration statement on Form S-4 with the Securities and Exchange Commission and is providing the information below to provide supplemental guarantor financial information pursuant to Rule 3-10(f) of Regulation S-X. The following tables present unaudited condensed consolidating financial information for (i) the Company,
F-57
(ii) the issuer of the senior notes, (iii) the guarantors under the senior notes, and (iv) the entities which are not guarantors under the senior notes:
WALTER ENERGY, INC. AND SUBSIDIARIES
SUPPLEMENTAL CONDENSED CONSOLIDATING BALANCE SHEETS
DECEMBER 31, 2012
(in thousands)
| |
Parent (Issuer) |
Guarantor Subsidiaries |
Non-Guarantor Subsidiaries |
Eliminations | Total Consolidated |
|||||||||||
|---|---|---|---|---|---|---|---|---|---|---|---|---|---|---|---|---|
ASSETS |
||||||||||||||||
Cash and cash equivalents |
$ | 83,833 | $ | 61 | $ | 32,707 | $ | — | $ | 116,601 | ||||||
Receivables, net |
64,106 | 620,701 | 79,679 | (507,519 | ) | 256,967 | ||||||||||
Inventories |
— | 131,893 | 174,125 | — | 306,018 | |||||||||||
Deferred income taxes |
39,375 | 17,687 | 1,464 | — | 58,526 | |||||||||||
Prepaid expenses |
1,869 | 45,327 | 6,580 | — | 53,776 | |||||||||||
Other current assets |
17,559 | 1,109 | 5,260 | — | 23,928 | |||||||||||
Total current assets |
206,742 | 816,778 | 299,815 | (507,519 | ) | 815,816 | ||||||||||
Mineral interests, net |
— | 18,475 | 2,947,082 | — | 2,965,557 | |||||||||||
Property, plant and equipment, net |
8,448 | 790,900 | 932,783 | — | 1,732,131 | |||||||||||
Deferred income taxes |
52,363 | 112,560 | (4,501 | ) | — | 160,422 | ||||||||||
Goodwill |
— | — | — | — | — | |||||||||||
Other long-term assets |
3,601,716 | 9,375 | 13,497 | (3,530,094 | ) | 94,494 | ||||||||||
|
$ | 3,869,269 | $ | 1,748,088 | $ | 4,188,676 | $ | (4,037,613 | ) | $ | 5,768,420 | |||||
LIABILITIES AND STOCKHOLDERS' EQUITY |
||||||||||||||||
Current debt |
$ | — | $ | 10,196 | $ | 8,597 | $ | — | $ | 18,793 | ||||||
Accounts payable |
5,128 | 78,260 | 31,525 | — | 114,913 | |||||||||||
Accrued expenses |
262,704 | 83,155 | 346,535 | (507,519 | ) | 184,875 | ||||||||||
Accumulated postretirement benefits obligation |
131 | 29,069 | — | — | 29,200 | |||||||||||
Other current liabilities |
157,044 | 24,389 | 25,040 | — | 206,473 | |||||||||||
Total current liabilities |
425,007 | 225,069 | 411,697 | (507,519 | ) | 554,254 | ||||||||||
Long-term debt |
2,381,255 | 1,784 | 14,333 | — | 2,397,372 | |||||||||||
Deferred income taxes |
— | — | 921,687 | — | 921,687 | |||||||||||
Accumulated postretirement benefits obligation |
452 | 632,812 | — | — | 633,264 | |||||||||||
Other long-term liabilities |
51,984 | 128,593 | 70,695 | — | 251,272 | |||||||||||
Total liabilities |
2,858,698 | 988,258 | 1,418,412 | (507,519 | ) | 4,757,849 | ||||||||||
Stockholders' equity |
1,010,571 | 759,830 | 2,770,264 | (3,530,094 | ) | 1,010,571 | ||||||||||
Total liabilities and stockholders' equity |
$ | 3,869,269 | $ | 1,748,088 | $ | 4,188,676 | $ | (4,037,613 | ) | $ | 5,768,420 | |||||
F-58
WALTER ENERGY, INC. AND SUBSIDIARIES
SUPPLEMENTAL CONDENSED CONSOLIDATING BALANCE SHEETS
DECEMBER 31, 2011
(in thousands)
| |
Parent (Issuer) | Guarantor Subsidiaries | Non-Guarantor Subsidiaries | Eliminations | Total Consolidated | |||||||||||
|---|---|---|---|---|---|---|---|---|---|---|---|---|---|---|---|---|
ASSETS |
||||||||||||||||
Cash and cash equivalents |
$ | 99,086 | $ | 79 | $ | 29,265 | $ | — | $ | 128,430 | ||||||
Receivables, net |
45,244 | 344,460 | 167,462 | (243,823 | ) | 313,343 | ||||||||||
Inventories |
— | 129,015 | 111,422 | — | 240,437 | |||||||||||
Deferred income taxes |
11,698 | 38,834 | 10,547 | — | 61,079 | |||||||||||
Prepaid expenses |
1,187 | 39,317 | 9,470 | — | 49,974 | |||||||||||
Other current assets |
15,184 | 4,225 | 26,240 | — | 45,649 | |||||||||||
Total current assets |
172,399 | 555,930 | 354,406 | (243,823 | ) | 838,912 | ||||||||||
Mineral interests, net |
— | 29,461 | 3,026,797 | — | 3,056,258 | |||||||||||
Property, plant and equipment, net |
5,459 | 777,882 | 847,992 | — | 1,631,333 | |||||||||||
Deferred income taxes |
59,705 | 67,145 | (17,550 | ) | — | 109,300 | ||||||||||
Goodwill |
— | 1,713 | 1,065,041 | — | 1,066,754 | |||||||||||
Other long-term assets |
4,603,800 | 13,730 | 20,976 | (4,484,555 | ) | 153,951 | ||||||||||
|
$ | 4,841,363 | $ | 1,445,861 | $ | 5,297,662 | $ | (4,728,378 | ) | $ | 6,856,508 | |||||
LIABILITIES AND STOCKHOLDERS' EQUITY |
||||||||||||||||
Current debt |
$ | — | $ | 29,063 | $ | 27,632 | $ | — | $ | 56,695 | ||||||
Accounts payable |
245,790 | 72,018 | 38,676 | (243,823 | ) | 112,661 | ||||||||||
Accrued expenses |
34,027 | 72,687 | 122,353 | — | 229,067 | |||||||||||
Accumulated postretirement benefits obligation |
192 | 27,055 | — | — | 27,247 | |||||||||||
Other current liabilities |
20,809 | 7,398 | 35,550 | — | 63,757 | |||||||||||
Total current liabilities |
300,818 | 208,221 | 224,211 | (243,823 | ) | 489,427 | ||||||||||
Long-term debt |
2,208,163 | 10,885 | 49,972 | — | 2,269,020 | |||||||||||
Deferred income taxes |
— | — | 1,029,336 | — | 1,029,336 | |||||||||||
Accumulated postretirement benefits obligation |
355 | 550,316 | — | — | 550,671 | |||||||||||
Other long-term liabilities |
195,510 | 133,295 | 52,732 | — | 381,537 | |||||||||||
Total liabilities |
2,704,846 | 902,717 | 1,356,251 | (243,823 | ) | 4,719,991 | ||||||||||
Stockholders' equity |
2,136,517 | 543,144 | 3,941,411 | (4,484,555 | ) | 2,136,517 | ||||||||||
Total liabilities and stockholders' equity |
$ | 4,841,363 | $ | 1,445,861 | $ | 5,297,662 | $ | (4,728,378 | ) | $ | 6,856,508 | |||||
F-59
WALTER ENERGY, INC. AND SUBSIDIARIES
SUPPLEMENTAL CONDENSED CONSOLIDATING STATEMENTS OF OPERATIONS
YEAR ENDED DECEMBER 31, 2012
(in thousands)
| |
Parent (Issuer) |
Guarantor Subsidiaries |
Non-Guarantor Subsidiaries |
Eliminations | Total Consolidated |
|||||||||||
|---|---|---|---|---|---|---|---|---|---|---|---|---|---|---|---|---|
Revenues: |
||||||||||||||||
Sales |
$ | — | $ | 1,592,680 | $ | 789,080 | $ | — | $ | 2,381,760 | ||||||
Miscellaneous income (loss) |
2,233 | 20,518 | (4,616 | ) | — | 18,135 | ||||||||||
|
2,233 | 1,613,198 | 784,464 | — | 2,399,895 | |||||||||||
Cost and expenses: |
||||||||||||||||
Cost of sales (exclusive of depreciation and depletion) |
— | 1,039,547 | 757,444 | — | 1,796,991 | |||||||||||
Depreciation and depletion |
1,379 | 141,463 | 173,390 | — | 316,232 | |||||||||||
Selling, general and administrative |
11,716 | 71,299 | 50,452 | — | 133,467 | |||||||||||
Postretirement benefits |
(449 | ) | 53,301 | — | — | 52,852 | ||||||||||
Asset impairment and restructuring |
— | — | 49,070 | — | 49,070 | |||||||||||
Goodwill impairment |
— | 1,713 | 1,062,696 | — | 1,064,409 | |||||||||||
|
12,646 | 1,307,323 | 2,093,052 | — | 3,413,021 | |||||||||||
Operating income (loss) |
(10,413 | ) | 305,875 | (1,308,588 | ) | — | (1,013,126 | ) | ||||||||
Interest expense |
(92,397 | ) | (30,446 | ) | (16,513 | ) | — | (139,356 | ) | |||||||
Interest income |
158 | 2 | 644 | — | 804 | |||||||||||
Other loss |
— | — | (13,081 | ) | — | (13,081 | ) | |||||||||
Income (loss) from continuing operations before income tax expense |
(102,652 | ) | 275,431 | (1,337,538 | ) | — | (1,164,759 | ) | ||||||||
Income tax expense (benefit) |
(68,615 | ) | 85,935 | (116,524 | ) | — | (99,204 | ) | ||||||||
Income (loss) from continuing operations |
(34,037 | ) | 189,496 | (1,221,014 | ) | — | (1,065,555 | ) | ||||||||
Income from discontinued operations |
— | 5,180 | — | — | 5,180 | |||||||||||
Equity in earnings of investments of Issuer |
(1,026,338 | ) | — | — | 1,026,338 | — | ||||||||||
Net income (loss) |
$ | (1,060,375 | ) | $ | 194,676 | $ | (1,221,014 | ) | $ | 1,026,338 | $ | (1,060,375 | ) | |||
F-60
WALTER ENERGY, INC. AND SUBSIDIARIES
SUPPLEMENTAL CONDENSED CONSOLIDATING STATEMENTS OF OPERATIONS
YEAR ENDED DECEMBER 31, 2011
(in thousands)
| |
Parent (Issuer) |
Guarantor Subsidiaries |
Non-Guarantor Subsidiaries |
Eliminations | Total Consolidated |
|||||||||||
|---|---|---|---|---|---|---|---|---|---|---|---|---|---|---|---|---|
Revenues: |
||||||||||||||||
Sales |
$ | — | $ | 1,694,235 | $ | 868,090 | $ | — | $ | 2,562,325 | ||||||
Miscellaneous income (loss) |
21,486 | 8,973 | (21,426 | ) | — | 9,033 | ||||||||||
|
21,486 | 1,703,208 | 846,664 | — | 2,571,358 | |||||||||||
Cost and expenses: |
||||||||||||||||
Cost of sales (exclusive of depreciation and depletion) |
— | 927,465 | 633,647 | — | 1,561,112 | |||||||||||
Depreciation and depletion |
776 | 120,086 | 109,819 | — | 230,681 | |||||||||||
Selling, general and administrative |
79,411 | 43,025 | 43,313 | — | 165,749 | |||||||||||
Postretirement benefits |
(1,360 | ) | 41,745 | — | — | 40,385 | ||||||||||
|
78,827 | 1,132,321 | 786,779 | — | 1,997,927 | |||||||||||
Operating income (loss) |
(57,341 | ) | 570,887 | 59,885 | — | 573,431 | ||||||||||
Interest expense |
(90,274 | ) | (1,629 | ) | (4,917 | ) | — | (96,820 | ) | |||||||
Interest income |
226 | 15 | 365 | — | 606 | |||||||||||
Other income |
— | — | 17,606 | — | 17,606 | |||||||||||
Income (loss) from continuing operations before income tax expense |
(147,389 | ) | 569,273 | 72,939 | — | 494,823 | ||||||||||
Income tax expense (benefit) |
(71,566 | ) | 199,886 | 2,905 | — | 131,225 | ||||||||||
Income (loss) from continuing operations |
(75,823 | ) | 369,387 | 70,034 | — | 363,598 | ||||||||||
Equity in earnings (losses) of subsidiaries |
439,421 | — | — | (439,421 | ) | — | ||||||||||
Net income (loss) |
$ | 363,598 | $ | 369,387 | $ | 70,034 | $ | (439,421 | ) | $ | 363,598 | |||||
F-61
WALTER ENERGY, INC. AND SUBSIDIARIES
SUPPLEMENTAL CONDENSED CONSOLIDATING STATEMENTS OF OPERATIONS
YEAR ENDED DECEMBER 31, 2010
(in thousands)
| |
Parent (Issuer) | Guarantor Subsidiaries | Non-Guarantor Subsidiaries | Eliminations | Total Consolidated | |||||||||||
|---|---|---|---|---|---|---|---|---|---|---|---|---|---|---|---|---|
Revenues: |
||||||||||||||||
Sales |
$ | — | $ | 1,544,033 | $ | 26,812 | $ | — | $ | 1,570,845 | ||||||
Miscellaneous income |
2,000 | 11,976 | 2,909 | — | 16,885 | |||||||||||
|
2,000 | 1,556,009 | 29,721 | — | 1,587,730 | |||||||||||
Cost and expenses: |
||||||||||||||||
Cost of sales (exclusive of depreciation and depletion) |
— | 751,810 | 14,706 | — | 766,516 | |||||||||||
Depreciation and depletion |
532 | 83,202 | 14,968 | — | 98,702 | |||||||||||
Selling, general and administrative |
8,214 | 78,758 | — | — | 86,972 | |||||||||||
Postretirement benefits |
(1,750 | ) | 43,228 | — | — | 41,478 | ||||||||||
|
6,996 | 956,998 | 29,674 | — | 993,668 | |||||||||||
Operating income (loss) |
(4,996 | ) | 599,011 | 47 | — | 594,062 | ||||||||||
Interest expense |
(15,024 | ) | (2,226 | ) | — | — | (17,250 | ) | ||||||||
Interest income |
784 | — | — | — | 784 | |||||||||||
Income (loss) from continuing operations before income tax expense |
(19,236 | ) | 596,785 | 47 | — | 577,596 | ||||||||||
Income tax expense (benefit) |
(23,693 | ) | 210,648 | 1,216 | — | 188,171 | ||||||||||
Income (loss) from continuing operations |
4,457 | 386,137 | (1,169 | ) | — | 389,425 | ||||||||||
Loss from discontinued operations |
— | (3,628 | ) | — | — | (3,628 | ) | |||||||||
Equity in earnings (losses) of subsidiaries |
381,340 | — | — | (381,340 | ) | — | ||||||||||
Net income (loss) |
$ | 385,797 | $ | 382,509 | $ | (1,169 | ) | ($ | 381,340 | ) | $ | 385,797 | ||||
F-62
WALTER ENERGY, INC. AND SUBSIDIARIES
SUPPLEMENTAL CONDENSED CONSOLIDATING
STATEMENTS OF COMPREHENSIVE INCOME
YEAR ENDED DECEMBER 31, 2012
(in thousands)
| |
Parent (Issuer) |
Guarantor Subsidiaries |
Non-Guarantor Subsidiaries |
Eliminations | Total Consolidated |
|||||||||||
|---|---|---|---|---|---|---|---|---|---|---|---|---|---|---|---|---|
Net income (loss) |
$ | (1,060,375 | ) | $ | 194,676 | $ | (1,221,014 | ) | $ | 1,026,338 | $ | (1,060,375 | ) | |||
Other comprehensive income (loss), net of tax: |
||||||||||||||||
Change in pension and postretirement benefit plans, net of tax |
(40,501 | ) | (90,876 | ) | — | 90,876 | (40,501 | ) | ||||||||
Change in unrealized loss on hedges, net of tax |
(3,416 | ) | 95 | (2,533 | ) | 2,438 | (3,416 | ) | ||||||||
Change in foreign currency translation adjustment |
1,774 | — | 1,774 | (1,774 | ) | 1,774 | ||||||||||
Change in unrealized gain on investments |
769 | — | 769 | (769 | ) | 769 | ||||||||||
Total other comprehensive income (loss), net of tax |
(41,374 | ) | (90,781 | ) | 10 | 90,771 | (41,374 | ) | ||||||||
Total comprehensive income (loss) |
$ | (1,101,749 | ) | $ | 103,895 | $ | (1,221,004 | ) | $ | 1,117,109 | $ | (1,101,749 | ) | |||
F-63
WALTER ENERGY, INC. AND SUBSIDIARIES
SUPPLEMENTAL CONDENSED CONSOLIDATING
STATEMENTS OF COMPREHENSIVE INCOME
YEAR ENDED DECEMBER 31, 2011
(in thousands)
| |
Parent (Issuer) | Guarantor Subsidiaries | Non-Guarantor Subsidiaries | Eliminations | Total Consolidated | |||||||||||
|---|---|---|---|---|---|---|---|---|---|---|---|---|---|---|---|---|
Net income (loss) |
$ | 363,598 | $ | 369,387 | $ | 70,034 | $ | (439,421 | ) | $ | 363,598 | |||||
Other comprehensive income (loss), net of tax: |
||||||||||||||||
Change in pension and postretirement benefit plans, net of tax |
(53,224 | ) | (9,437 | ) | — | 9,437 | (53,224 | ) | ||||||||
Change in unrealized loss on hedges, net of tax |
(716 | ) | 85 | 2,309 | (2,394 | ) | (716 | ) | ||||||||
Change in foreign currency translation adjustment |
(3,276 | ) | — | (3,276 | ) | 3,276 | (3,276 | ) | ||||||||
Change in unrealized gain on investments |
128 | — | 128 | (128 | ) | 128 | ||||||||||
Total other comprehensive income (loss), net of tax |
(57,088 | ) | (9,352 | ) | (839 | ) | 10,191 | (57,088 | ) | |||||||
Total comprehensive income (loss) |
$ | 306,510 | $ | 360,035 | $ | 69,195 | $ | (429,230 | ) | $ | 306,510 | |||||
F-64
WALTER ENERGY, INC. AND SUBSIDIARIES
SUPPLEMENTAL CONDENSED CONSOLIDATING
STATEMENTS OF COMPREHENSIVE INCOME
YEAR ENDED DECEMBER 31, 2010
(in thousands)
| |
Parent (Issuer) |
Guarantor Subsidiaries |
Non-Guarantor Subsidiaries |
Eliminations | Total Consolidated |
|||||||||||
|---|---|---|---|---|---|---|---|---|---|---|---|---|---|---|---|---|
Net income (loss) |
$ | 385,797 | $ | 382,509 | $ | (1,169 | ) | $ | (381,340 | ) | $ | 385,797 | ||||
Other comprehensive income (loss), net of tax: |
||||||||||||||||
Change in pension and postretirement benefit plans, net of tax |
(5,280 | ) | (35,677 | ) | (7,631 | ) | 43,308 | (5,280 | ) | |||||||
Change in unrealized loss on hedges, net of tax |
(596 | ) | (210 | ) | (386 | ) | 596 | (596 | ) | |||||||
Change in foreign currency translation adjustment |
— | — | — | — | — | |||||||||||
Change in unrealized gain on investments |
— | — | — | — | — | |||||||||||
Total other comprehensive income (loss), net of tax |
(5,876 | ) | (35,887 | ) | (8,017 | ) | 43,904 | (5,876 | ) | |||||||
Total comprehensive income (loss) |
$ | 379,921 | $ | 346,622 | $ | (9,186 | ) | $ | (337,436 | ) | $ | 379,921 | ||||
F-65
WALTER ENERGY, INC. AND SUBSIDIARIES
SUPPLEMENTAL CONDENSED CONSOLIDATING STATEMENT OF CASH FLOWS
YEAR ENDED DECEMBER 31, 2012
(in thousands)
| |
Parent (Issuer) |
Guarantor Subsidiaries |
Non-Guarantor Subsidiaries |
Eliminations | Total Consolidated |
|||||||||||
|---|---|---|---|---|---|---|---|---|---|---|---|---|---|---|---|---|
Cash flows provided by (used in) operating activities |
$ | (193,700 | ) | $ | 548,678 | $ | (25,071 | ) | $ | — | $ | 329,907 | ||||
INVESTING ACTIVITIES |
||||||||||||||||
Additions to property, plant and equipment |
(4,395 | ) | (143,206 | ) | (243,911 | ) | — | (391,512 | ) | |||||||
Proceeds from sales of investments |
— | — | 13,239 | — | 13,239 | |||||||||||
Intercompany notes issued |
(293,170 | ) | — | — | 293,170 | — | ||||||||||
Intercompany notes proceeds |
16,513 | — | — | (16,513 | ) | — | ||||||||||
Investments in equity affiliates |
(238,083 | ) | — | — | 238,083 | — | ||||||||||
Distributions from equity affiliates |
271,847 | — | — | (271,847 | ) | — | ||||||||||
Other |
— | 855 | 43 | — | 898 | |||||||||||
Cash flows used in investing activities |
(247,288 | ) | (142,351 | ) | (230,629 | ) | 242,893 | (377,375 | ) | |||||||
FINANCING ACTIVITIES |
||||||||||||||||
Proceeds from issuance of debt |
496,510 | — | — | — | 496,510 | |||||||||||
Borrowings under revolving credit agreement |
— | — | 510,650 | — | 510,650 | |||||||||||
Repayments on revolving credit agreement |
— | — | (519,453 | ) | — | (519,453 | ) | |||||||||
Retirements of debt |
(343,255 | ) | (8,131 | ) | (41,465 | ) | — | (392,851 | ) | |||||||
Dividends paid |
(31,246 | ) | — | — | — | (31,246 | ) | |||||||||
Excess tax benefits from stock-based compensation arrangements |
217 | — | — | — | 217 | |||||||||||
Proceeds from stock options exercised |
161 | — | — | — | 161 | |||||||||||
Net consideration paid upon exercise of warrants |
(11,535 | ) | — | — | — | (11,535 | ) | |||||||||
Debt issuance costs |
(24,532 | ) | — | — | — | (24,532 | ) | |||||||||
Advances from (to) consolidated entities |
340,181 | (384,695 | ) | 44,514 | — | — | ||||||||||
Intercompany notes borrowings |
— | — | 293,170 | (293,170 | ) | — | ||||||||||
Intercompany notes payments |
— | — | (16,513 | ) | 16,513 | — | ||||||||||
Investment from Parent |
— | 238,083 | — | (238,083 | ) | — | ||||||||||
Intercompany dividends |
— | (261,102 | ) | (10,745 | ) | 271,847 | — | |||||||||
Other |
(766 | ) | — | — | — | (766 | ) | |||||||||
Cash flows provided by (used in) financing activities |
425,735 | (415,845 | ) | 260,158 | (242,893 | ) | 27,155 | |||||||||
Cash flows provided by (used in) continuing operations |
(15,253 | ) | (9,518 | ) | 4,458 | — | (20,313 | ) | ||||||||
CASH FLOWS FROM DISCONTINUED OPERATIONS |
||||||||||||||||
Cash flows provided by investing activities |
— | 9,500 | — | — | 9,500 | |||||||||||
Cash flows provided by discontinued operations |
— | 9,500 | — | — | 9,500 | |||||||||||
Effect of foreign exchange rates on cash |
— | — | (1,016 | ) | — | (1,016 | ) | |||||||||
Net increase (decrease) in cash and cash equivalents |
$ | (15,253 | ) | $ | (18 | ) | $ | 3,442 | $ | — | $ | (11,829 | ) | |||
Cash and cash equivalents at beginning of period |
99,086 | 79 | 29,265 | — | 128,430 | |||||||||||
Cash and cash equivalents at end of period |
$ | 83,833 | $ | 61 | $ | 32,707 | $ | — | $ | 116,601 | ||||||
F-66
WALTER ENERGY, INC. AND SUBSIDIARIES
SUPPLEMENTAL CONDENSED CONSOLIDATING STATEMENT OF CASH FLOWS
YEAR ENDED DECEMBER 31, 2011
(in thousands)
| |
Parent (Issuer) |
Guarantor Subsidiaries |
Non-Guarantor Subsidiaries |
Eliminations | Total Consolidated |
|||||||||||
|---|---|---|---|---|---|---|---|---|---|---|---|---|---|---|---|---|
Cash flows provided by (used in) operating activities |
$ | (208,650 | ) | $ | 687,791 | $ | 227,725 | $ | — | $ | 706,866 | |||||
INVESTING ACTIVITIES |
||||||||||||||||
Additions to property, plant and equipment |
(93 | ) | (143,529 | ) | (293,083 | ) | — | (436,705 | ) | |||||||
Acquisition of Western Coal Corp., net of cash acquired |
(2,466,758 | ) | — | 34,065 | — | (2,432,693 | ) | |||||||||
Proceeds from sales of investments |
— | — | 27,325 | — | 27,325 | |||||||||||
Intercompany notes issued |
(50,738 | ) | — | — | 50,738 | — | ||||||||||
Distributions from equity investments |
516,407 | — | — | (516,407 | ) | — | ||||||||||
Other |
23 | 273 | 1,117 | — | 1,413 | |||||||||||
Cash flows used in investing activities |
(2,001,159 | ) | (143,256 | ) | (230,576 | ) | (465,669 | ) | (2,840,660 | ) | ||||||
FINANCING ACTIVITIES |
||||||||||||||||
Proceeds from issuance of debt |
2,350,000 | — | — | — | 2,350,000 | |||||||||||
Borrowings under revolving credit agreement |
— | — | 71,259 | — | 71,259 | |||||||||||
Repayments on revolving credit agreement |
— | — | (61,259 | ) | — | (61,259 | ) | |||||||||
Retirements of debt |
(258,062 | ) | (12,300 | ) | (20,268 | ) | — | (290,630 | ) | |||||||
Dividends paid |
(30,042 | ) | — | — | — | (30,042 | ) | |||||||||
Excess tax benefits from stock-based compensation arrangements |
8,929 | — | — | — | 8,929 | |||||||||||
Proceeds from stock options exercised |
8,920 | — | — | — | 8,920 | |||||||||||
Debt issuance costs |
(80,027 | ) | — | — | — | (80,027 | ) | |||||||||
Advances from (to) consolidated entities |
19,967 | (14,461 | ) | (5,506 | ) | — | — | |||||||||
Intercompany borrowings |
— | — | 50,738 | (50,738 | ) | — | ||||||||||
Intercompany dividends |
— | (516,407 | ) | — | 516,407 | — | ||||||||||
Other |
(5,203 | ) | — | — | — | (5,203 | ) | |||||||||
Cash flows provided by (used in) financing activities |
2,014,482 | (543,168 | ) | 34,964 | 465,669 | 1,971,947 | ||||||||||
Effect of foreign exchange rates on cash |
— | — | (3,668 | ) | — | (3,668 | ) | |||||||||
Net increase (decrease) in cash and cash equivalents |
$ | (195,327 | ) | $ | 1,367 | $ | 28,445 | $ | — | $ | (165,515 | ) | ||||
Cash and cash equivalents at beginning of period |
294,413 | (1,823 | ) | 820 | — | 293,410 | ||||||||||
Add: Cash and cash equivalents of discontinued operations at beginning of year |
— | 535 | — | — | 535 | |||||||||||
Cash and cash equivalents at end of period |
$ | 99,086 | $ | 79 | $ | 29,265 | $ | — | $ | 128,430 | ||||||
F-67
WALTER ENERGY, INC. AND SUBSIDIARIES
SUPPLEMENTAL CONDENSED CONSOLIDATING STATEMENT OF CASH FLOWS
YEAR ENDED DECEMBER 31, 2010
(in thousands)
| |
Parent (Issuer) |
Guarantor Subsidiaries |
Non-Guarantor Subsidiaries |
Eliminations | Total Consolidated |
|||||||||||
|---|---|---|---|---|---|---|---|---|---|---|---|---|---|---|---|---|
Cash flows provided by (used in) operating activities |
$ | (246,744 | ) | $ | 806,528 | $ | 14,366 | $ | — | $ | 574,150 | |||||
INVESTING ACTIVITIES |
||||||||||||||||
Additions to property, plant and equipment |
(5,177 | ) | (146,636 | ) | (5,663 | ) | — | (157,476 | ) | |||||||
Acquisition of HighMount Exploration & Production Alabama, LLC |
— | (209,964 | ) | — | — | (209,964 | ) | |||||||||
Distributions from equity investments |
618,942 | — | — | (618,942 | ) | — | ||||||||||
Other |
— | (3,414 | ) | — | — | (3,414 | ) | |||||||||
Cash flows provided by (used in) investing activities |
613,765 | (360,014 | ) | (5,663 | ) | (618,942 | ) | (370,854 | ) | |||||||
FINANCING ACTIVITIES |
||||||||||||||||
Retirements of debt |
(1,436 | ) | (25,536 | ) | — | — | (26,972 | ) | ||||||||
Dividends paid |
(25,266 | ) | — | — | — | (25,266 | ) | |||||||||
Purchases of stock under stock repurchase program |
(65,438 | ) | — | — | — | (65,438 | ) | |||||||||
Excess tax benefits from stock-based compensation arrangements |
28,875 | — | — | — | 28,875 | |||||||||||
Proceeds from stock options exercised |
17,134 | — | — | — | 17,134 | |||||||||||
Advances from (to) consolidated entities |
(187,811 | ) | 196,886 | (9,075 | ) | — | — | |||||||||
Intercompany dividends |
— | (618,942 | ) | — | 618,942 | — | ||||||||||
Other |
(3,332 | ) | 317 | — | — | (3,015 | ) | |||||||||
Cash flows provided by (used in) financing activities |
(237,274 | ) | (447,275 | ) | (9,075 | ) | 618,942 | (74,682 | ) | |||||||
Cash flows provided by (used in) continuing operations |
129,747 | (761 | ) | (372 | ) | — | 128,614 | |||||||||
CASH FLOWS FROM DISCONTINUED OPERATIONS |
||||||||||||||||
Cash flows used in operating activities |
— | (6,268 | ) | — | — | (6,268 | ) | |||||||||
Cash flows provided by investing activities |
— | 5,066 | — | — | 5,066 | |||||||||||
Cash flows used in discontinued operations |
— | (1,202 | ) | — | — | (1,202 | ) | |||||||||
Net increase (decrease) in cash and cash equivalents |
$ | 129,747 | $ | (1,963 | ) | $ | (372 | ) | $ | — | $ | 127,412 | ||||
Cash and cash equivalents at beginning of period |
164,666 | (579 | ) | 1,192 | — | 165,279 | ||||||||||
Add: Cash and cash equivalents of discontinued operations at beginning of year |
— | 1,254 | — | — | 1,254 | |||||||||||
Less: Cash and cash equivalents of discontinued operations at end of year |
— | 535 | — | — | 535 | |||||||||||
Cash and cash equivalents at end of period |
$ | 294,413 | $ | (1,823 | ) | $ | 820 | $ | — | $ | 293,410 | |||||
F-68
SUPPLEMENTAL SUMMARY QUARTERLY FINANCIAL INFORMATION (UNAUDITED)
(in thousands, except per share amounts)
| |
Quarter ended | ||||||||||||
|---|---|---|---|---|---|---|---|---|---|---|---|---|---|
Fiscal Year 2012
|
March 31 | June 30 | September 30 | December 31 | |||||||||
Revenues |
$ | 631,563 | $ | 677,574 | $ | 611,974 | $ | 478,784 | |||||
Operating income (loss) |
$ | 84,076 | $ | 67,973 | $ | (1,071,765 | ) | $ | (93,410 | ) | |||
Income (loss) from continuing operations |
$ | 40,616 | $ | 26,756 | $ | (1,061,956 | ) | $ | (70,971 | ) | |||
Income from discontinued operations |
$ | — | $ | 5,180 | $ | — | $ | — | |||||
Net income (loss) |
$ | 40,616 | $ | 31,936 | $ | (1,061,956 | ) | $ | (70,971 | ) | |||
Diluted income (loss) per share:(2) |
|||||||||||||
Income (loss) from continuing operations |
$ | 0.65 | $ | 0.43 | $ | (16.97 | ) | $ | (1.13 | ) | |||
Income from discontinued operations |
— | 0.08 | — | — | |||||||||
Net income (loss) |
$ | 0.65 | $ | 0.51 | $ | (16.97 | ) | $ | (1.13 | ) | |||
| |
Quarter ended | ||||||||||||
|---|---|---|---|---|---|---|---|---|---|---|---|---|---|
Fiscal Year 2011(1)
|
March 31 | June 30 | September 30 | December 31 | |||||||||
Revenues |
$ | 408,734 | $ | 770,871 | $ | 688,747 | $ | 703,006 | |||||
Operating income |
$ | 119,767 | $ | 164,463 | $ | 158,027 | $ | 131,174 | |||||
Net income |
$ | 81,813 | $ | 114,453 | $ | 87,080 | $ | 80,252 | |||||
Diluted income per share:(2) |
|||||||||||||
Net income |
$ | 1.53 | $ | 1.83 | $ | 1.39 | $ | 1.28 | |||||
- (1)
- Results
include the Western Coal operations since the date of acquisition on April 1, 2011.
- (2)
- The sum of quarterly EPS amounts may be different than annual amounts as a result of the impact of variations in shares outstanding.
F-69
Exhibit Number
|
|
Description of Exhibit
|
||
|---|---|---|---|---|
2 |
— | Amended Joint Plan of Reorganization of Registrant and certain of its subsidiaries, dated as of December 9, 1994 (Incorporated by reference to Exhibit T3E2 to Registrant's Applications for Qualification of Indentures on Form T-3 (File No. 022-22199), filed on February 6, 1995). | ||
2.1 |
— |
Modification to the Amended Joint Plan of Reorganization of Registrant and certain of its subsidiaries, as filed in the Bankruptcy Court on March 1, 1995 (Incorporated by reference to Exhibit T3E24 to Registrant's Amendment No. 2 to the Applications for Qualification of Indentures on Form T-3 (File No. 022-22199), filed on March 7, 1995). |
||
2.2 |
— |
Findings of Fact, Conclusions of Law and Order Confirming Amended Joint Plan of Reorganization of Walter Energy, Inc. and certain of its subsidiaries, as modified (Incorporated by reference to Exhibit 2(a)(iii) to the Registration Statement on Form S-1 (File No. 33-59013), filed on May 2, 1995). |
||
2.3 |
— |
Arrangement Agreement, dated as of December 2, 2010, between Registrant and Western Coal Corp. (Incorporated by reference to Exhibit 2.1 of the Registrant's Current Report on Form 8-K (File No. 011-13711), filed on December 3, 2010). |
||
3.1 |
— |
Amended and Restated Certificate of Incorporation (Incorporated by reference to Exhibit 3.1 of the Registrant's Current Report on Form 8-K (File No. 011-13711), filed on April 28, 2009). |
||
3.2 |
— |
Amended and Restated By-Laws (Incorporated by reference to Exhibit 3.1 of the Registrant's Current Report on Form 8-K (File No. 011-13711), filed on February 23, 2012). |
||
4 |
— |
Form of Specimen Certificate for Registrant's Common Stock (Incorporated by reference to Exhibit 4(b) to Registration Statement on Form S-1 (No. 033-59013), filed on May 2, 1995). |
||
4.1 |
— |
Indenture, dated as of November 21, 2012, by and among Walter Energy, Inc., the subsidiary guarantors named therein and Union Bank, N.A., as trustee (Incorporated by reference to Exhibit 4.2 of the Registrant's Current Report on Form 8-K (File No. 011-13711), filed on November 21, 2012). |
||
4.2 |
— |
Form of 9.875% senior note due 2020 (Incorporated by reference to Exhibit 4.3 of the Registrant's Current Report on Form 8-K (File No. 011-13711), filed on November 21, 2012). |
||
10.1* |
— |
Form of Indemnification Agreement for Directors and Executive Officers (Incorporated by reference to Exhibit 10.2 1 of the Registrant's Annual Report on Form 10-K (File No. 011-13711) for the year ended December 31, 2011). |
||
10.2* |
— |
Form of Amended and Restated Executive Change-in-Control Severance Agreement (for executives executing agreements on or prior to January 1, 2010) (Incorporated by reference to Exhibit 10.2 of the Registrant's Annual Report on Form 10-K (File No. 011-13711) for the year ended December 31, 2008). |
E-1
Exhibit Number
|
|
Description of Exhibit
|
||
|---|---|---|---|---|
10.3* |
— |
Form of Executive Change-in-Control Severance Agreement (for executives executing agreements after January 1, 2010 and prior to April 1, 2011) (Incorporated by reference to Exhibit 10.4 of the Registrant's Annual Report on Form 10-K (File No. 011-13711) for the year ended December 31, 2011). |
||
10.3.1* |
— |
Form of Executive Change-in-Control Severance Agreement (for executives executing agreements after April 1, 2011) (Incorporated by reference to Exhibit 10.4 1 of the Registrant's Annual Report on Form 10-K (File No. 011-13711) for the year ended December 31, 2011). |
||
10.4* |
— |
Registrant's Executive Deferred Compensation and Supplemental Retirement Plan (Incorporated by reference to Exhibit 10.5 of the Registrant's Annual Report on Form 10-K (File No. 011-13711) for the year ended December 31, 2011). |
||
10.5* |
— |
Registrant's Amended and Restated Directors' Deferred Fee Plan (Incorporated by reference to Exhibit 10.6 of the Registrant's Annual Report on Form 10-K (File No. 011-13711) for the year ended December 31, 2011). |
||
10.6* |
— |
Registrant's Amended and Restated Supplemental Pension Plan (Incorporated by reference to Exhibit 10.5 of the Registrant's Annual Report on Form 10-K (File No. 011-13711) for the year ended December 31, 2008). |
||
10.7* |
— |
Executive Incentive Plan (Incorporated by reference to Appendix A to the Registrant's Proxy Statement (File No. 011-13711) for the 2006 Annual Meeting of Stockholders, filed on March 31, 2006). |
||
10.7.1* |
— |
First Amendment to the Registrant's Executive Incentive Plan (Incorporated by reference to Exhibit 10.6.1 of the Registrant's Annual Report on Form 10-K (File No. 011-13711) for the year ended December 31, 2008). |
||
10.8* |
— |
Amended 1995 Long-Term Incentive Stock Plan (Incorporated by reference to Exhibit B to the Registrant's Proxy Statement (File No. 011-13711) for the 1997 Annual Meeting of Stockholders, filed on August 12, 1997). |
||
10.8.1* |
— |
Amendment to Amended 1995 Long-Term Incentive Stock Plan (Incorporated by reference to Exhibit 10.7.1 of the Registrant's Annual Report on Form 10-K (File No. 011-13711) for the year ended December 31, 2008). |
||
10.8.2* |
Western Coal Corporation Amended and Restated Stock Option Plan, effective August 3, 2010 (Incorporated by reference to Exhibit 4.5 to the Registrant's Registration Statement on Form S-8 (File No. 333-173336). |
|||
10.9*† |
— |
2012 Executive Incentive Plan. |
||
10.10* |
— |
Amended and Restated 2002 Long-Term Incentive Award Plan (Incorporated by reference to Appendix C to the Registrant's Proxy Statement (File No. 011-13711) for the 2009 Annual Meeting of Stockholders, filed on March 31, 2009). |
||
10.11* |
— |
Form of Restricted Stock Unit Award Agreement (for executives executing agreements prior to February 23, 2012) (Incorporated by reference to Exhibit 10.9 of the Registrant's Annual Report on Form 10-K (File No. 011-13711) for the year ended December 31, 2008). |
E-2
Exhibit Number
|
|
Description of Exhibit
|
||
|---|---|---|---|---|
10.11.1* |
— |
Form of Restricted Stock Unit Award Agreement (for executives executing agreements after February 23, 2012 and prior to February 18, 2013) (Incorporated by reference to Exhibit 10.13.1 of the Registrant's Annual Report on Form 10-K (File No. 011-13711) for the year ended December 31, 2011). |
||
10.11.2* |
— |
Form of Retention Restricted Stock Unit Agreement (Incorporated by reference to Exhibit 10.14 of the Registrant's Annual Report on Form 10-K (File No. 011-13711) for the year ended December 31, 2011). |
||
10.11.3* |
— |
Form of Retention Restricted Stock Unit Agreement (Incorporated by reference to Exhibit 10.14.1 of the Registrant's Annual Report on Form 10-K (File No. 011-13711) for the year ended December 31, 2011). |
||
10.11.4* |
— |
Form of Director Restricted Stock Unit Award Agreement (Incorporated by reference to Exhibit 10.15 of the Registrant's Annual Report on Form 10-K (File No. 011-13711) for the year ended December 31, 2011). |
||
10.11.5* |
— |
Form of Non-Qualified Stock Option Agreement (for executives executing agreements prior to February 23, 2012) (Incorporated by reference to Exhibit 10.10 of the Registrant's Annual Report on Form 10-K (File No. 011-13711) for the year ended December 31, 2008). |
||
10.11.6* |
— |
Form of Non-Qualified Stock Option Agreement (for executives executing agreements after February 23, 2012 and prior to February 18, 2013) (Incorporated by reference to Exhibit 10.16.1 of the Registrant's Annual Report on Form 10-K (File No. 011-13711) for the year ended December 31, 2011). |
||
10.11.7* |
— |
Form of Director Stock Option Award Agreement (Incorporated by reference to Exhibit 10.17 of the Registrant's Annual Report on Form 10-K (File No. 011-13711) for the year ended December 31, 2011). |
||
10.11.8*† |
Form of Amended and Restated Restricted Stock Unit Award Agreement dated August 11, 2011 for Charles C. Stewart. |
|||
10.11.9*† |
— |
Form of Restricted Stock Unit Award Agreement—Performance Vesting Award—2 Year Performance Period. |
||
10.11.10*† |
— |
Form of Restricted Stock Unit Award Agreement—Performance Vesting Award—3 Year Performance Period. |
||
10.11.11*† |
— |
Form of Restricted Stock Unit Award Agreement (for executives executing agreements after February 18, 2013). |
||
10.11.12*† |
— |
Form of Non-Qualified Stock Option Agreement (for executives executing agreements after February 18, 2013). |
||
10.12* |
— |
Amended and Restated Employee Stock Purchase Plan (Incorporated by reference to Appendix B to the Registrant's Proxy Statement (File No. 011-13711) for the 2004 Annual Meeting of Stockholders, filed on March 19, 2004). |
||
10.13* |
— |
Registrant's Involuntary Severance Benefit Plan (Incorporated by reference to Exhibit 10.23.1 of the Registrant's Annual Report on Form 10-K (File No. 011-13711) for the year ended December 31, 2008). |
E-3
Exhibit Number
|
|
Description of Exhibit
|
||
|---|---|---|---|---|
10.13.1* |
— |
First Amendment to the Walter Energy, Inc. Involuntary Severance Benefit Plan (Incorporated by reference to Exhibit 10.23.1 of the Registrant's Annual Report on Form 10-K (File No. 011-13711) for the year ended December 31, 2008). |
||
10.14* |
— |
Agreement dated September 12, 2011 between the Company and Walter J. Scheller, III (Incorporated by reference to Exhibit 10.1 of the Registrant's Quarterly Report on Form 10-Q (File No. 011-13711), filed on November 7, 2011). |
||
10.15* |
— |
Agreement dated May 29, 2012 between the Company and William G. Harvey (Incorporated by reference to Exhibit 10.1 of the Registrant's Current Report on Form 8-K, filed on June 1, 2012). |
||
10.16* |
— |
Agreement dated July 15, 2011 between the Company and Robert P. Kerley (Incorporated by reference to Exhibit 10.1 of the Registrant's Quarterly Report on Form 10-Q (File No. 011-13711), filed on August 9, 2011). |
||
10.16.1* |
— |
Agreement dated February 28, 2012 between the Company and Robert P. Kerley (Incorporated by reference to Exhibit 10.22 1 of the Registrant's Annual Report on Form 10-K (File No. 011-13711) for the year ended December 31, 2011). |
||
10.16.2*† |
— |
Management Change-in-Control Severance Agreement dated June 2012 between the Company and Robert P. Kerley. |
||
10.17* |
— |
Agreement dated April 1, 2011 between the Company and Michael T. Madden (Incorporated by reference to Exhibit 10.25 of the Registrant's Annual Report on Form 10-K (File No. 011-13711) for the year ended December 31, 2011). |
||
10.17.1* |
— |
Amended and Restated Change-in-Control Agreement dated as of December 18, 2008 between the Company and Michael T. Madden (Incorporated by reference to Exhibit 10.5 of the Registrant's Quarterly Report on Form 10-Q (File No. 011-13711), filed on May 7, 2010). |
||
10.18*† |
— |
Agreement dated June 10, 2011, between the Company and Charles C. Stewart. |
||
10.18.1*† |
Agreement dated March 30, 2012 between the Company and Charles C. Stewart. |
|||
10.19*† |
— |
Agreement dated December 15, 2011 between the Company and Earl H. Doppelt. |
||
10.20 |
— |
Income Tax Allocation Agreement, dated as of May 26, 2006, between Registrant and Mueller Water Products, Inc. (Incorporated by reference to Exhibit 10.2 of the Registrant's Current Report on Form 8-K (File No. 011-13711), filed on May 30, 2006). |
||
10.21 |
— |
Joint Litigation Agreement, effective as of December 14, 2006, between Registrant and Mueller Water Products, Inc. (Incorporated by reference to Exhibit 10.1 of the Registrant's Current Report on Form 8-K (File No. 011-13711), filed on December 20, 2006). |
E-4
Exhibit Number
|
|
Description of Exhibit
|
||
|---|---|---|---|---|
10.22 |
— |
Tax Separation Agreement, dated as of April 17, 2009, between Registrant and Walter Investment Management, LLC (Incorporated by reference to Exhibit 10.3 of the Registrant's Current Report on Form 8-K (File No. 011-13711), filed on April 23, 2009). |
||
10.23 |
— |
Joint Litigation Agreement, dated as of April 17, 2009, between Registrant and Walter Investment Management, LLC (Incorporated by reference to Exhibit 10.4 of the Registrant's Current Report on Form 8-K (File No. 011-13711), filed on April 23, 2009). |
||
10.24 |
— |
Share Purchase Agreement, dated as of November 17, 2010, between Registrant and Audley Capital Management Limited, Audley European Opportunities Master Fund Limited, Audley Investment I and Audley Investment II (Incorporated by reference to Exhibit 10.1 of the Registrant's Current Report on Form 8-K (File No. 011-13711), filed on November 18, 2010). |
||
10.25 |
— |
Credit Agreement, dated as of April 1, 2011, between the Registrant and Walter Energy Canada Holdings, Inc. and the various lenders, including Morgan Stanley Senior Funding, Inc., as administrative agent and collateral agent and the other agents named therein. (Incorporated by reference to Exhibit 10.1 of the Registrant's Current Report on Form 8-K (File No. 011-13711), filed on April 6, 2011). |
||
10.25.1 |
— |
First Amendment to the Credit Agreement, dated as of January 20, 2012, by and among the Registrant, Western Coal Corp., Walter Energy Canada Holdings, Inc., the various lenders thereunder, Morgan Stanley Senior Funding, Inc., as Administrative Agent and the other agents named therein. (Incorporated by reference to Exhibit 10.1 of the Registrant's Current Report on Form 8-K (File No. 011-13711), filed on January 25, 2012). |
||
10.25.2 |
— |
Second Amendment to the Credit Agreement, dated as of August 16, 2012, by and among the Registrant, Western Coal Corp., Walter Energy Canada Holdings, Inc., the various lenders thereunder, Morgan Stanley Senior Funding, Inc., as Administrative Agent and the other agents named therein. (Incorporated by reference to Exhibit 10.1 of the Registrant's Current Report on Form 8-K (File No. 011-13711), filed on August 17, 2012). |
||
10.25.3 |
— |
Third Amendment to the Credit Agreement, dated as of October 29, 2012, by and among the Registrant, Western Coal Corp., Walter Energy Canada Holdings, Inc., the various lenders thereunder, Morgan Stanley Senior Funding, Inc., as Administrative Agent and the other agents named therein. (Incorporated by reference to Exhibit 10.1 of the Registrant's Current Report on Form 8-K (File No. 011-13711), filed on October 30, 2012). |
||
21† |
— |
Subsidiaries of the Company |
||
23.1† |
— |
Consent of Ernst & Young LLP |
||
24† |
— |
Power of Attorney |
||
31.1† |
— |
Certification Pursuant to Section 302 of the Sarbanes-Oxley Act of 2002—Chief Executive Officer |
E-5
Exhibit Number
|
|
Description of Exhibit
|
||
|---|---|---|---|---|
31.2† |
— |
Certification Pursuant to Section 302 of the Sarbanes-Oxley Act of 2002—Chief Financial Officer |
||
32.1† |
— |
Certification Pursuant to Section 906 of the Sarbanes-Oxley Act of 2002, 18 U.S.C. Section 1350—Chief Executive Officer |
||
32.2† |
— |
Certification Pursuant to Section 906 of the Sarbanes-Oxley Act of 2002, 18 U.S.C. Section 1350—Chief Financial Officer |
||
95† |
— |
Mine Safety Disclosures Pursuant to Section 1503(a) of the Dodd-Frank Wall Street Reform and Consumer Protection Act and Item 104 of Regulation S-K (17 CFR 299.104) |
||
101† |
— |
XBRL (Extensible Business Reporting Language)—The following materials from Walter Energy, Inc.'s Annual Report on Form 10-K for the year ended December 31, 2012, formatted in XBRL (eXtensible Business Reporting Language): (i) the Consolidated Balance Sheets, (ii) the Consolidated Statements of Income, (iii) the Consolidated Statement of Changes in Stockholders' Equity and Comprehensive Income, (iv) the Consolidated Statements of Cash Flows, (v) Notes to Consolidated Financial Statements. |
- †
- Filed
herewith.
- *
- Denote management contracts or compensatory plans or arrangements.
E-6