 Electronic Arts Inc.
Acquisition Announcement
July 12
th
, 2011
Exhibit 99.2 |
 Some
statements
set
forth
in
this
presentation
regarding
EA’s
acquisition
of
PopCap
and
the
expected
impact
of
the
acquisition
on
EA’s
strategic
and
operational
plans,
contain
forward-looking
statements
that
are
subject
to
change.
These
forward-looking
statements
are
subject
to
risks
and
uncertainties
that
could
cause
actual
events
or
actual
future
results
to
differ
materially
from
the
expectations
set
forth
in
the
forward-looking
statements.
Some
of
the
factors
which
could
cause
results
to
differ
materially
from
the
expectations
expressed
in
these
forward-looking
statements
include
the
following:
the
effect
of
the
announcement
of
the
acquisition
on
EA’s
and
PopCap’s
strategic
relationships,
operating
results
and
business
generally,
including
the
ability
to
retain
key
employees;
EA’s
ability
to
successfully
integrate
PopCap’s
operations
and
employees;
the
timing
of
the
completions
of
the
acquisition;
general
economic
conditions;
and
other
factors
described
in
EA’s
SEC
filings
(including
EA’s
Annual
Report
on
Form
10-K
for
the
year
ended
March
31,
2011).
If
any
of
these
risks
or
uncertainties
materializes,
the
potential
benefits
of
the
acquisition
may
not
be
realized,
EA’s
and/or
PopCap’s
operating
results
and
financial
performance
could
suffer,
and
actual
results
could
differ
materially
from
the
expectations
described
in
these
forward-looking
statements.
These
forward-looking
statements
speak
only
as
of
the
date
of
this
presentation.
EA
assumes
no
obligation
to
update
these
forward-looking
statements.
The
preliminary
financial
results
set
forth
in
this
presentation,
including
EA’s
preliminary
results
for
the
first
quarter
of
fiscal
2012
and
business
outlook
for
future
periods
are
estimates
based
on
information
currently
available
to
Electronic
Arts.
While
Electronic
Arts
believes
these
estimates
are
meaningful,
they
could
differ
from
the
actual
amounts
that
Electronic
Arts
ultimately
reports
in
its
Annual
Report
on
Form
10-Q
for
the
fiscal
quarter
ended
June
30,
2011
and
in
subsequent
filings.
Furthermore,
the
financial
information
included
in
this
presentation
regarding
PopCap
is
based
on
information
currently
available
to
Electronic
Arts
as
of
the
date
of
this
presentation
and
is
subject
to
change.
In
addition,
following
the
acquisition,
the
accounting
policies
of
PopCap
will
be
reconciled
with
those
of
Electronic
Arts,
which
may
cause
reported
revenue
and
profits
of
PopCap
to
be
lower
than
currently
presented.
These
forward-looking
statements
are
valid
as
of
July
12,
2011
only.
Electronic
Arts
assumes
no
obligation
and
does
not
intend
to
update
these
forward-looking
statements.
In
addition,
this
presentation
includes
various
third
party
estimates
regarding
the
total
available
segment
and
other
measures,
which
have
not
been
independently
verified
by
us.
Further,
Electronic
Arts
does
not
guarantee
the
accuracy
or
reliability
of
any
such
information
or
forecast.
Safe Harbor Statement
1 |
 Summary
2
PopCap accelerates EA’s winning digital strategy
PopCap strengthens EA’s position as a leader in casual gaming and
accelerates EA toward a $1 billion digital business
Casual gaming is the industry’s fastest growing segment
PopCap is a leader on the fastest growing digital gaming platforms,
with five very strong casual IPs
Acquisition price is $650 M cash, plus $100 M EA stock and a non-
GAAP EBIT-based earn-out, resulting in a CY12 EBIT multiple range
of 10X to 20X
This transaction is expected to be at least $0.10 non-GAAP EPS
accretive in fiscal 2013
EA intends to drive further EPS accretion through ongoing share
repurchase program |
 PopCap
At A Glance 3
IP
has
been
strong
for
many
years
Franchise
revenue
has
continued
to
grow
over
time
Franchise
Years in
Release
# of
Titles
Major Platforms
Bejeweled
11
5
Facebook, iOS, Android,
XBLA, DS, PSN, Wii, WP7,
PC
PvZ
2
1
iOS, Android, XBLA, DS,
PSN, Mac, PC
Zuma
7
3
Facebook, XBLA, DS, PSN,
Mac, PC
Bookworm
7
3
iOS, XBLA, DS, Mac, PC
Peggle
4
2
iOS, XBLA, DS, PSN, Mac,
PC
Games
Well
Suited
to
Emerging
Platforms
Ideal for touch / simple controls
Strong characters
Mass appeal
Flexible monetization
Success across mobile devices
Fun & approachable gameplay
Overview of PopCap
Founded in 2000. Headquartered in
Seattle, WA
~475 employees
Award-winning and durable IP
80% of PopCap revenue is digital
PopCap has strong IP and a proven ability to create new hits
|
 PopCap
Strategic Overview PopCap accelerates EA’s ongoing digital
transformation 4
Long-term game sector growth
is led by digital
Smartphones, smartpads/tablet,
social, PC, IPTV are key platforms
Casual gaming is driving growth with
new consumer demographic
Asia is an important opportunity in
digital
80% of revenue in CY2010 was
digital; > 40% revenue growth rate in
March 2011 quarter
IP expected to gain more distribution
on the highest growth platforms
Well positioned for social games in
Asia
Owns five strong evergreen
franchises with the unique ability to
create compelling future casual IP
across all platforms
PopCap maps well to the digital
opportunity |
  Financial
Summary of Transaction Deal is expected to be non-GAAP EPS neutral in FY12
and highly accretive in FY13:
Up-front $650 M cash, $100 M EA stock, with potential of up to $550
M
earn-out
Up to $50 M in long-term equity retention awards
Effective PopCap purchase price multiples will decline to the degree the
earn-out amount increases:
10x PopCap CY12 non-GAAP EBIT in Upper-End Earn-out Scenario
20x PopCap CY12 non-GAAP EBIT in Low-End/No Earn-out Scenario
5
EPS Impact
FY2012
FY2013
Non-GAAP
~$0.00
~$0.10
GAAP
~$0.00
~ ($0.10)
Note:
These forward-looking statements are valid as of July 12, 2011 only and are
subject to change. |
 -
5
10
15
20
25
-10%
0%
10%
20%
30%
40%
50%
60%
70%
80%
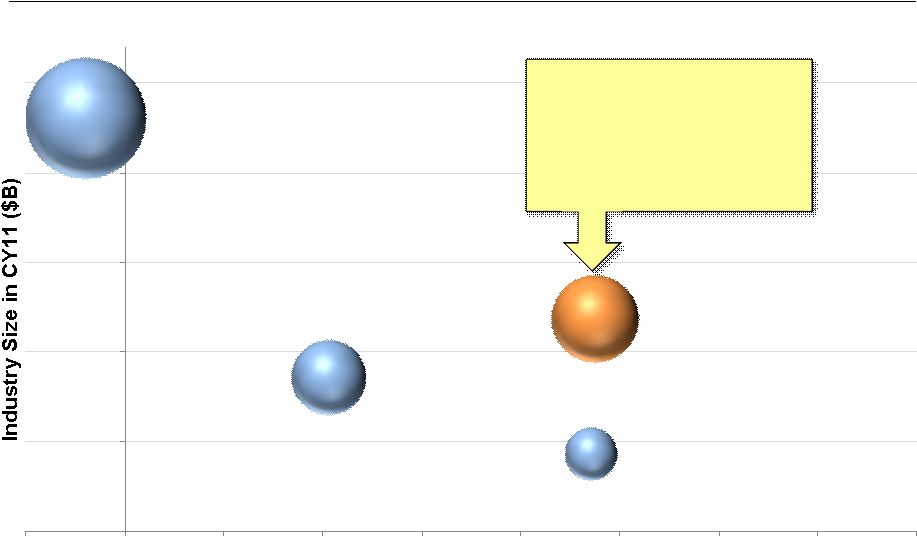
Worldwide Industry Growth Segments
Casual/Social/
Mobile/Tablet/
Browser/Free-to-Play
MMO
Subs + Full Game Downloads
Core Packaged -
Related Digital
Core
Packaged
CY09 –
CY11 CAGR
Source: EA estimates
6
PopCap enhances
EA’s position in one
of gaming’s most
important segments |
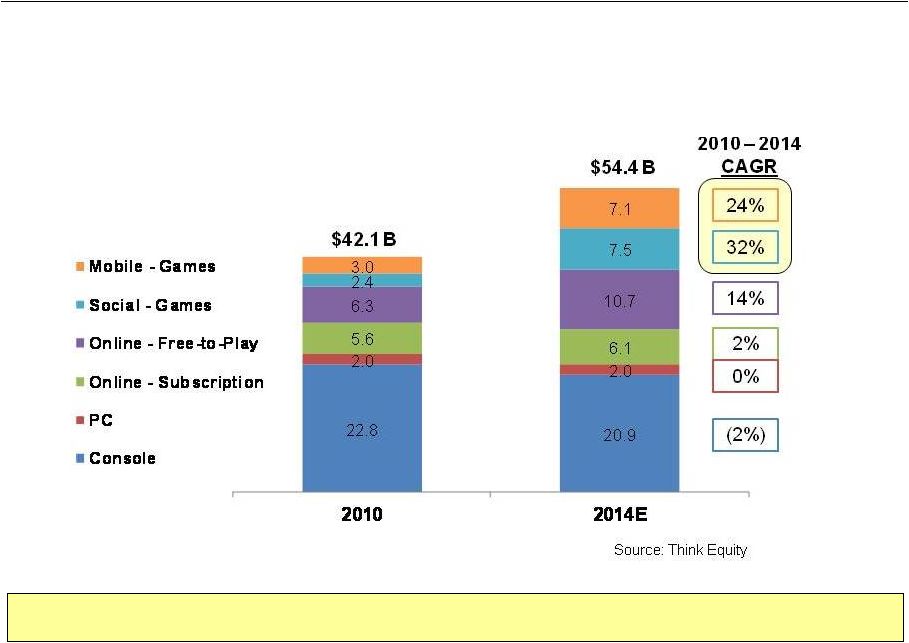 Sector
Analysis – Game Market
Mobile & Social growth outpacing other video game sectors
7
Worldwide Video Game Market Size Estimates by Platform
(in $ billions) |
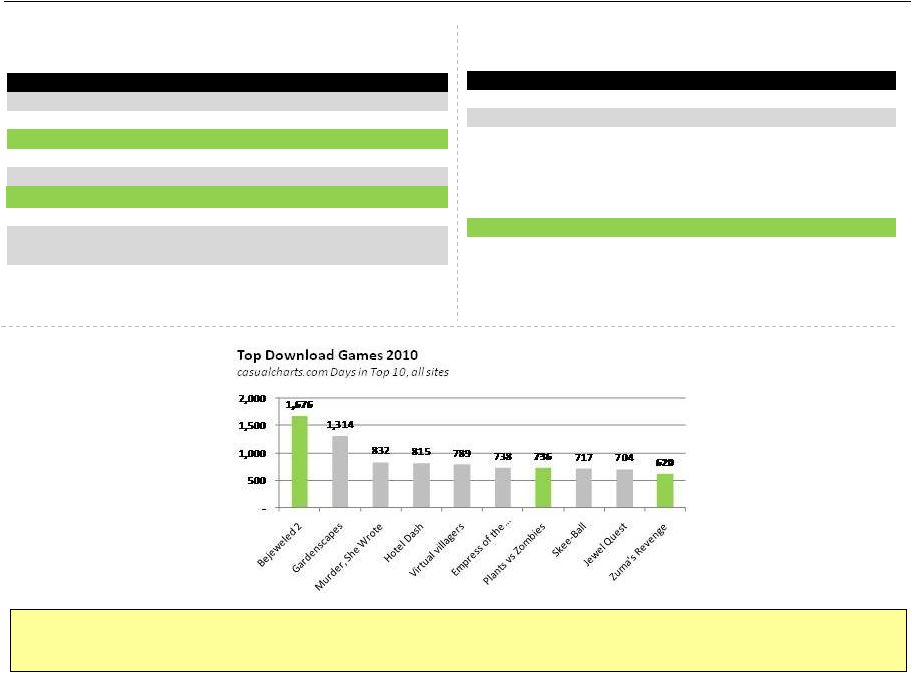
 Sector
Analysis – Mobile/Social
Casual games are driving platform growth on smart phones and social network sites
8 |
 PopCap
Maps Well to New Platform Opportunities PopCap delivers proven best sellers
on multiple platforms with recent breakout success on iOS
9
Top Grossing iOS Games for 2010
iTunes Rewind 2010
#
iPhone Game
Publisher
1
Angry Birds
Electronic Arts
2
Call of Duty: Zombies
Activision
3
Bejeweled 2+Blitz
PopCap Games
4
Zombie Farm
PlayForge
5
Tetris
Electronic Arts
6
Plants vs Zombies
PopCap Games
7
Doodle Jump
Lima Sky
8
Monopoly
Electronic Arts
9
The Sims 3
Electronic Arts
10
Words With Friends
Zynga
EA & PopCap Games in Top 10:
6
Top PC Retail Game Publishers for 2010
NPD PC Games $000s
#
Publisher
2008
2009
2010
1
Activision Blizzard
$165,467
$118,905
$279,616
2
Electronic Arts
194,288
210,510
139,706
3
Take 2 Interactive
29,568
28,903
38,223
4
THQ
41,895
40,733
20,003
5
Square Enix
21,025
6,600
18,013
6
Encore
14,862
16,170
17,193
7
Atari
16,528
17,268
14,859
8
PopCap Games
5,899
10,528
13,838
9
Bethesda SoftWorks
13,077
12,117
13,760
10
Microsoft
32,586
25,242
13,371
Total
$704,982
$682,046
$701,252
EA & PopCap Share
28%
32%
22% |
 1.
PopCap has the highest player
engagement of any Top 5
Facebook Game Publisher at 25%
(DAU/MAU)
2.
PopCap has achieved Top 5
success through only two
evergreen franchises: Bejeweled
and Zuma
3.
After 18+ months in the market,
Bejeweled Blitz is #6 in terms of
DAUs and #1 in player
engagement (out of the Top 10)
Success on Facebook –
Winning Combination
10
EA + PopCap = Solid #2 Games Publisher with Big Brands Coming Soon
4. Future outlook is strong with top
IP from both EA and PopCap to
come
DAUs in MMs (Q2 CY11)
Rank
Developer
DAUs
1
Zynga
53.6
2
EA + PopCap
10.0
3
Wooga
4.5
4
Playdom
3.7
5
Digital Chocolate
3.0
Source: Appdata.com as of July 8th, 2011 |
 Full Year
Pro Forma
Annualized
Pro Forma
Q4 FY11
Q4 FY11
Pro Forma
PopCap - Console
PopCap - PC
PopCap - Mobile
EA - Total Digital
PopCap Further Accelerates EA’s Digital Growth
11
Pro Forma Non-GAAP Digital Net Revenue
* Note: EA’s Digital non-GAAP net revenue excludes one-time
events Preliminary PopCap estimates as of July 12, 2011, subject to change
$267 M
$1,068 M
EA & PopCap deliver a >$1 billion digital non-GAAP revenue run rate
*
* |
   EA
Financial Update 1
12
Revenue Guidance Update:
Share Repurchase Program Update:
2
Repurchase program remains intact
As of July 1, 2011, EA has repurchased a total of 7.1 million shares
for $149 million
Notes:
1. Preliminary estimates as of July 12, 2011, subject to change
2. Repurchase data shown on a shares settled basis. EA is not obligated to
repurchase any specific number of shares under the program and the
repurchase program may be modified, suspended or discontinued at any time FY12
Non-GAAP Revenue Guidance ($ Millions)
Low End
High End
FY12 GAAP Revenue
Guidance ($ Millions)
Low End
High End
Reaffirmed EA Standalone
$3,750
$3,950
Reaffirmed EA Standalone
$3,700
$3,900
PopCap Partial Year
Contribution
$50
$75
PopCap Partial Year
Contribution
$25
$50
Revised Combined Guidance
$3,800
$4,025
Revised Combined Guidance
$3,725
$3,950 |
 GAAP
to Non-GAAP Reconciliation In
its
press
release
dated
July
12,
2011
announcing
the
PopCap
acquisition,
Electronic
Arts
has
provided
its
preliminary
estimates
for
the
first
quarter
of
fiscal
2012
and
business
outlook
for
the
second
quarter
of
fiscal
2012
and
the
full
fiscal
year
2012.
The
following
table
provides
a
reconciliation
of
the
non-GAAP
financial
measures
for
the
periods
presented
to
the
nearest
comparable
GAAP
financial
measures.
These
are
preliminary
estimates
and
expectations
based
on
current
information
as
of
July
12,
2011
and
are
subject
to
business
and
economic
risks
and
uncertainties
that
could
cause
actual
events
or
actual
future
results
to
differ
materially
from
the
expectations
set
forth
herein.
The
reconciliation
provided
below
reflects
rounding
and
other
approximations.
(in millions except for EPS)
Low
High
Low
High
Low
High
GAAP Net Income (Loss)
212
$
222
$
(364)
$
(320)
$
(14)
$
88
$
Acquisition-related expenses
18
18
30
25
95
85
Change in deferred net revenue
(packaged goods and digital content
(475)
(475)
275
275
75
75
Restructuring and other
18
18
5
5
23
23
Stock-based compensation
38
38
50
50
175
175
Income tax adjustments
57
57
(46)
(52)
(120)
(145)
Non-GAAP Net Income (Loss)
(132)
$
(122)
$
(50)
$
(17)
$
234
$
301
$
GAAP EPS
0.63
$
0.66
$
(1.10)
$
(0.97)
$
(0.04)
$
0.26
$
Shares used for GAAP EPS
337
337
331
331
330
334
Non-GAAP EPS
(0.40)
$
(0.37)
$
(0.15)
$
(0.05)
$
0.70
$
0.90
$
Shares used for non-GAAP EPS
331
331
331
331
334
334
GAAP Revenue
975
$
1,000
$
3,725
$
3,950
$
Change in deferred net revenue
(packaged goods and digital content
(475)
(475)
75
75
Non-GAAP Revenue
500
$
525
$
3,800
$
4,025
$
Q1 FY12
Q2 FY12
FY12
13 |
 To
supplement the Company’s unaudited condensed consolidated financial statements presented in
accordance with GAAP, Electronic Arts uses certain non-GAAP measures of
financial performance. The presentation of these non-GAAP financial
measures is not intended to be considered in isolation from, as a substitute
for, or superior to, the financial information prepared and presented in
accordance with GAAP, and may be different from non-GAAP financial measures
used by other companies. In addition, these non-GAAP measures have
limitations in that they do not reflect all of the amounts associated with
the Company’s results of operations as determined in accordance with
GAAP. The non-GAAP financial measures used by Electronic Arts include:
non-GAAP net revenue and non-GAAP diluted earnings (loss) per share.
These non-GAAP financial measures exclude the following items, as
applicable in a given reporting period, from the Company’s unaudited
condensed consolidated statements of operations:
Acquisition-related expenses
Change in deferred net revenue (packaged goods and digital content)
Gain (loss) on strategic investments
Loss on lease obligation and facilities acquisition
Loss on licensed intellectual property commitment
Restructuring charges
Stock-based compensation
Income tax adjustments
Electronic Arts may consider whether other significant non-recurring items that
arise in the future should also be excluded in calculating the non-GAAP
financial measures it uses. Electronic Arts believes that these non-GAAP
financial measures, when taken together with the corresponding GAAP
financial measures, provide meaningful supplemental information regarding the Company’s
performance by excluding certain items that may not be indicative of the
Company’s core business, operating results or future outlook.
Non-GAAP Financial Measures
14 |