UNITED STATES
SECURITIES AND EXCHANGE COMMISSION
WASHINGTON, DC 20549
FORM 10-Q
(Mark One)
| x | QUARTERLY REPORT PURSUANT TO SECTION 13 OR 15(d) OF THE SECURITIES EXCHANGE ACT OF 1934 |
For the quarterly period ended June 30, 2013
OR
| ¨ | TRANSACTION REPORT PURSUANT TO SECTION 13 OR 15(d) OF THE SECURITIES EXCHANGE ACT OF 1934 |
For the transition period from ___________________________ to ___________________________
Commission file number: 000-54191
| SINO AGRO FOOD, INC. |
(Exact Name of Registrant as Specified in Its Charter)
| Nevada | | 33-1219070 |
| (State of Other Jurisdiction of Incorporation or | | (I.R.S. Employer Identification Number) |
| Organization) | | |
| | | |
| Room 3801, Block A, China Shine Plaza | | |
| No. 9 Lin He Xi Road | | |
| Tianhe District, Guangzhou City, P.R.C. | | 510610 |
| (Address of Principal Executive Offices) | | (Zip Code) |
(860) 20 22057860
(Registrant’s Telephone Number, Including Area Code)
Copies to:
Sichenzia Ross Friedman Ference LLP
61 Broadway, 32ndFloor
New York, NY10006
Attn: Marc Ross, Esq.
Indicate by check mark whether the registrant (1) has filed all reports required to be filed by Section 13 or 15(d) of the Securities Exchange Act of 1934 during the preceding 12 months (or for such shorter period that the registrant was required to file such reports), and (2) has been subject to such filing requirements for the past 90 days. Yes x No ¨
Indicate by check mark whether the registrant has submitted electronically and posted on its corporate Web site, if any, every Interactive Data File required to be submitted and posted pursuant to Rule 405 of Regulation S-T (§232.405 of this chapter) during the preceding 12 months (or for such shorter period that the registrant was required to submit and post such files). Yes ¨ No ¨
Indicate by check mark whether the registrant is a large accelerated filer, an accelerated filer, a non-accelerated filer, or a smaller reporting company. See the definitions of “large accelerated filer,” “accelerated filer,” "non-accelerated filer" and “smaller reporting company” in Rule 12b-2 of the Exchange Act. (Check one):
| Large accelerated filer | ¨ | Accelerated filer | ¨ |
| Non-accelerated filer | ¨ | Smaller reporting company | x |
Indicate by check mark whether the registrant is a shell company (as defined in Rule 12b-2 of the Exchange Act). Yes ¨ No x
As of August 13, 2013, there were 124,521,036 shares of our common stock issued and outstanding.
TABLE OF CONTENTS
| | | Page |
| PART I – FINANCIAL INFORMATION | | |
| Item 1. | Financial Statements | 3 |
| Item 2. | Management’s Discussion and Analysis of Financial Condition and Plan of Operations | 4 |
| Item 3. | Quantitative and Qualitative Disclosures About Market Risk | 55 |
| Item 4. | Controls and Procedures | 55 |
| | | |
| PART II – OTHER INFORMATION | | |
| Item 1. | Legal Proceedings | 55 |
| Item 1A. | Risk Factors | 55 |
| Item 2. | Unregistered Sale of Equity Securities and Use of Proceeds | 55 |
| Item 3. | Defaults Upon Senior Securities | 56 |
| Item 4. | Mine Safety Disclosures | 56 |
| Item 5. | Other Information | 56 |
| Item 6. | Exhibits | 56 |
| SIGNATURES | | 57 |
2
PART I - FINANCIAL INFORMATION
ITEM 1. FINANCIAL STATEMENTS
SINO AGRO FOOD, INC. AND SUBSIDIARIES
QUARTERLY FINANCIAL REPORT
FOR THE SIX MONTHS ENDED JUNE 30, 2013
INDEX TO QUARTERLY FINANCIAL REPORT
| | | PAGE |
| | | |
| CONSOLIDATED BALANCE SHEETS | | F - 1 |
| | | |
| CONSOLIDATED STATEMENTS OF INCOME AND OTHER COMPREHENSIVE INCOME | | F - 2 |
| | | |
| CONSOLIDATED STATEMENTS OF CASH FLOWS | | F - 3 |
| | | |
| NOTES TO CONSOLIDATED FINANCIAL STATEMENTS | | F - 4 - F - 38 |
3
SINO AGRO FOOD, INC.
CONSOLIDATED BALANCE SHEETS
| | | June 30, 2013 | | December 31, 2012 | | ||
| | | (Unaudited) | | (Audited) | | ||
| ASSETS | | | | | | | |
| Current assets | | | | | | | |
| Cash and cash equivalents | | $ | 9,391,449 | | $ | 8,424,265 | |
| Inventories | | | 18,887,433 | | | 17,114,755 | |
| Cost and estimated earnings in excess of billings on uncompleted contracts | | | 1,286,775 | | | 2,336,880 | |
| Deposits and prepaid expenses | | | 52,091,997 | | | 47,308,857 | |
| Accounts receivable, net of allowance for doubtful accounts | | | 82,373,870 | | | 52,948,350 | |
| Other receivables | | | 6,374,272 | | | 5,954,248 | |
| Total current assets | | | 170,405,796 | | | 134,087,355 | |
| Property and equipment | | | | | | | |
| Property and equipment, net of accumulated depreciation | | | 21,019,253 | | | 19,946,302 | |
| Construction in progress | | | 38,089,142 | | | 24,492,510 | |
| Land use rights, net of accumulated amortization | | | 56,379,855 | | | 55,733,246 | |
| Total property and equipment | | | 115,488,250 | | | 100,172,058 | |
| Other assets | | | | | | | |
| Goodwill | | | 724,940 | | | 724,940 | |
| Proprietary technologies, net of accumulated amortization | | | 7,906,667 | | | 8,114,624 | |
| License rights | | | 1 | | | 1 | |
| Total other assets | | | 8,631,608 | | | 8,839,565 | |
| | | | | | | | |
| Total assets | | $ | 294,525,654 | | $ | 243,098,978 | |
| | | | | | | | |
| LIABILITIES AND STOCKHOLDERS' EQUITY | | | | | | | |
| Current liabilities | | | | | | | |
| Accounts payable and accrued expenses | | $ | 8,368,834 | | $ | 5,762,643 | |
| Billings in excess of costs and estimated earnings on uncompleted contracts | | | 922,375 | | | 2,790,084 | |
| Due to a director | | | 3,257,085 | | | 3,345,803 | |
| Dividends payable | | | - | | | 951,308 | |
| Other payables | | | 10,259,178 | | | 6,654,478 | |
| Short term bank loan | | | 2,265,849 | | | 3,181,927 | |
| | | | 25,073,321 | | | 22,686,243 | |
| Non-current liabilities | | | | | | | |
| Deferred dividends payable | | | 3,146,987 | | | 3,146,987 | |
| Long term debts | | | 178,031 | | | 175,006 | |
| | | | 3,325,018 | | | 3,321,993 | |
| Commitments and contingencies | | | - | | | - | |
| | | | | | | | |
| Stockholders' equity | | | | | | | |
| Preferred stock: $0.001 par value | | | | | | | |
| (10,000,000 shares authorized, 0 share issued and outstanding as of June 30, 2013 and December 31, 2012, respectively) | | | | | | | |
| Series A preferred stock: $0.001 par value | | | - | | | - | |
| (100 shares designated, 100 shares issued and outstanding as of June 30, 2013 and December 31, 2012, respectively) | | | | | | | |
| Series B convertible preferred stock: $0.001 par value) | | | 7,000 | | | 10,000 | |
| (10,000,000 shares designated, 7,000,000 and 10,000,000 shares issued and outstanding) as of June 30, 2013 and December 31, 2012, respectively) | | | | | | | |
| Series F Non-convertible preferred stock: $0.001 par value) | | | | | | | |
| (1,000,000 shares designated, 0 shares issued and outstanding) as of June 30, 2013 and December 31, 2012, respectively) | | | | | | | |
| Common stock: $0.001 par value | | | 120,174 | | | 100,005 | |
| (130,000,000 shares authorized, 120,173,827 and 100,004,850 shares issued and oustanding as of June 30, 2013 and December 31, 2012, respectively) | | | | | | | |
| Additional paid - in capital | | | 100,615,051 | | | 91,216,428 | |
| Retained earnings | | | 134,574,019 | | | 103,864,308 | |
| Accumulated other comprehensive income | | | 5,139,044 | | | 3,868,274 | |
| Treasury stock | | | (1,250,000) | | | (1,250,000) | |
| Total Sino Agro Food, Inc. and subsidiaries stockholders' equity | | | 239,205,288 | | | 197,809,015 | |
| Non - controlling interest | | | 26,922,027 | | | 19,281,727 | |
| Total stockholders' equity | | | 266,127,315 | | | 217,090,742 | |
| Total liabilities and stockholders' equity | | $ | 294,525,654 | | $ | 243,098,978 | |
The accompanying notes are an integral part of these consolidated financial statements.
F - 1
SINO AGRO FOOD, INC.
CONSOLIDATED STATEMENTS OF INCOME AND OTHER COMPREHENSIVE INCOME
| | | Three | | Three | | Six | | Six | | ||||
| | | months ended | | months ended | | months ended | | months ended | | ||||
| | | June 30, 2013 | | June 30, 2012 | | June 30, 2013 | | June 30, 2012 | | ||||
| | | (Unaudited) | | (Unaudited) | | (Unaudited) | | (Unaudited) | | ||||
| | | | | | | | | | | | | | |
| Revenue | | $ | 54,400,329 | | $ | 25,348,287 | | $ | 109,508,080 | | $ | 41,328,303 | |
| Cost of goods sold | | | 35,009,882 | | | 11,790,039 | | | 68,594,816 | | | 19,756,463 | |
| Gross profit | | | 19,390,447 | | | 13,558,248 | | | 40,913,264 | | | 21,571,840 | |
| General and administrative expenses | | | (1,608,304) | | | (2,735,677) | | | (3,813,692) | | | (4,957,999) | |
| Net income from operations | | | 17,782,143 | | | 10,822,571 | | | 37,099,572 | | | 16,613,841 | |
| Other income | | | | | | | | | | | | | |
| Government grant | | | - | | | - | | | 79,759 | | | 79,401 | |
| Other income | | | 47,718 | | | 20,797 | | | 65,907 | | | 436,649 | |
| Gain on extinguishment of debts | | | 498,025 | | | 562,361 | | | 1,051,013 | | | 817,513 | |
| Interest expense | | | (54,958) | | | - | | | (112,010) | | | - | |
| Net income | | | 490,785 | | | 583,158 | | | 1,084,669 | | | 1,333,563 | |
| Net income before income taxes | | | 18,272,928 | | | 11,405,729 | | | 38,184,241 | | | 17,947,404 | |
| Provision for income taxes | | | - | | | - | | | - | | | - | |
| Net income | | | 18,272,928 | | | 11,405,729 | | | 38,184,241 | | | 17,947,404 | |
| Less: Net (income) loss attributable to the non - controlling interest | | | (3,941,988) | | | (1,115,707) | | | (7,474,529) | | | (1,985,920) | |
| Net income from continuing operations attributable to Sino Agro Food, Inc. and subsidiaries | | | 14,330,940 | | | 10,290,022 | | | 30,709,712 | | | 15,961,484 | |
| Other comprehensive income | | | | | | | | | | | | | |
| Foreign currency translation gain | | | 1,728,409 | | | (73,645) | | | 1,436,541 | | | 546,712 | |
| Comprehensive income | | | 16,059,349 | | | 10,216,377 | | | 32,146,253 | | | 16,508,196 | |
| Less: other comprehensive (income) loss attributable to the non - controlling interest | | | (217,553) | | | 23,878 | | | (165,771) | | | (131,211) | |
| Comprehensive income attributable to | | | | | | | | | | | | | |
| Sino Agro Food, Inc. and subsidiaries | | $ | 15,841,796 | | $ | 10,240,255 | | $ | 31,980,482 | | $ | 16,376,985 | |
| Earnings per share attributable to Sino Agro Food, Inc. | | | | | | | | | | | | | |
| and subsidiaries common stockholders: | | | | | | | | | | | | | |
| Basic | | $ | 0.13 | | $ | 0.14 | | $ | 0.28 | | $ | 0.22 | |
| Diluted | | $ | 0.12 | | $ | 0.13 | | $ | 0.27 | | $ | 0.20 | |
| Weighted average number of shares outstanding: | | | | | | | | | | | | | |
| Basic | | | 115,366,595 | | | 73,836,392 | | | 110,403,819 | | | 71,312,129 | |
| Diluted | | | 122,366,595 | | | 80,836,392 | | | 117,403,819 | | | 78,312,129 | |
F - 2
SINO AGRO FOOD, INC.
CONSOLIDATED STATEMENTS OF CASH FLOWS
| | | Six months ended | | Six months ended | | ||
| | | June 30, 2013 | | June 30, 2012 | | ||
| | | (Unaudited) | | (Unaudited) | | ||
| | | | | | (Restated) | | |
| Cash flows from operating activities | | | | | | | |
| Net income | | $ | 38,184,241 | | $ | 17,947,404 | |
| Adjustments to reconcile net income to net cash from operations: | | | | | | | |
| Depreciation | | | 638,671 | | | 183,154 | |
| Amortization | | | 976,294 | | | 1,138,176 | |
| Common stock issued for services | | | 181,200 | | | 2,139,057 | |
| Gain on extinguishment of debts | | | (1,051,013) | | | (817,513) | |
| Changes in operating assets and liabilities: | | | | | | | |
| Increase in inventories | | | (1,842,406) | | | (4,618,431) | |
| (Increase) decrease in cost and estimated earnings in excess of billings on uncompleted contacts | | | 1,050,105 | | | (1,966,711) | |
| Increase in deposits and prepaid expenses | | | (4,783,140) | | | (10,893,566) | |
| Increase in due to a director | | | 8,264,907 | | | 346,076 | |
| Increase (decrease) in accounts payable and accrued expenses | | | 2,606,191 | | | (509,997) | |
| (Decrease) increase in other payables | | | 3,608,856 | | | 9,426,533 | |
| (Increase) decrease in accounts receivable | | | (29,425,520) | | | (5,173,526) | |
| (Decrease) increase in billings in excess of costs and estimated earnings on uncompleted contracts | | | (1,867,709) | | | 578,889 | |
| Decrease in amount due to related parties | | | - | | | (52,321) | |
| Increase in other receivables | | | (420,024) | | | (839,683) | |
| Net cash provided by operating activities | | | 16,120,653 | | | 9,887,541 | |
| Cash flows from investing activities | | | | | | | |
| Purchases of property and equipment | | | (490,323) | | | (20,423) | |
| Acquisition of proprietary technologies | | | - | | | (1,500,000) | |
| Acquisition of land use rights | | | (490,323) | | | - | |
| Investment in unconsolidated equity investee | | | - | | | (1,076,489) | |
| Business combination of a subsidiary | | | | | | (2,499,184) | |
| Payment for construction in progress | | | (13,596,632) | | | (6,626,688) | |
| Net cash used in investing activities | | | (14,086,955) | | | (11,722,784) | |
| Cash flows from financing activities | | | | | | | |
| Non - controlling interest contribution | | | - | | | 1,806,664 | |
| Dividends paid | | | (951,308) | | | (134,631) | |
| Net cash (used in) provided by financing activities | | | (951,308) | | | 1,672,033 | |
| Effects on exchange rate changes on cash | | | (115,206) | | | 1,467,667 | |
| Increase in cash and cash equivalents | | | 967,184 | | | 1,304,457 | |
| Cash and cash equivalents, beginning of period | | | 8,424,265 | | | 1,387,908 | |
| Cash and cash equivalents, end of period | | $ | 9,391,449 | | $ | 2,692,365 | |
| Supplementary disclosures of cash flow information: | | | | | | | |
| Cash paid for interest | | $ | 112,010 | | | - | |
| Cash paid for income taxes | | | - | | | - | |
| Non - cash transactions | | | | | | | |
| Common stock issued for settlement of debts | | $ | 9,404,638 | | $ | 2,373,992 | |
| Series B Convertible preferred shares cancelled | | $ | (3,000) | | $ | - | |
F - 3
SINO AGRO FOOD, INC.
NOTES TO CONSOLIDATED FINANCIAL STATEMENTS
| 1. | CORPORATE INFORMATION |
| | |
| | Sino Agro Food, Inc. (the “Company” or “SIAF”) (formerly known as Volcanic Gold, Inc. and A Power Agro Agriculture Development, Inc.) was incorporated on October 1, 1974 in the State of Nevada. |
| | |
| | The Company was engaged in the mining and exploration business but ceased its mining and exploring business on October 14, 2005. On August 24, 2007, the Company entered into a Merger and Acquisition Agreement with Capital Award Inc., a Belize corporation (“CA”) and its subsidiaries Capital Stage Inc. (“CS”) and Capital Hero Inc. (“CH”). Effective the same date, CA completed a reverse merger transaction with SIAF. SIAF acquired all the outstanding common stock of CA from Capital Adventure, a shareholder of CA, for 32,000,000 shares of the Company’s common stock. |
| | |
| | On August 24, 2007 the Company changed its name from Volcanic Gold, Inc. to A Power Agro Agriculture Development, Inc. On December 8, 2007, the Company changed its name to Sino Agro Food, Inc. |
| | |
| | On September 5, 2007, the Company acquired three existing businesses in the People’s Republic of China (the “PRC”): |
| | (a) | Hang Yu Tai Investment Limited (“HYT”), a company incorporated in Macau, the owner of a 78% equity interest in ZhongXingNongMu Ltd (“ZX”), a company incorporated in the PRC; |
| | | |
| | (b) | Tri-way Industries Limited (“TRW”), a company incorporated in Hong Kong; |
| | | |
| | (c) | Macau Eiji Company Limited (“MEIJI”), a company incorporated in Macau, the owner of 75% equity interest in Enping City Juntang Town Hang Sing Tai Agriculture Co. Ltd. (“HST”), a PRC corporate Sino-Foreign joint venture. HST was dissolved in 2010. |
| | On November 27, 2007, MEIJI and HST established a corporate Sino - Foreign joint venture, Jiang Men City Heng Sheng Tai Agriculture Development Co. Ltd. (“JHST”), a company incorporated in the PRC with MEIJI owning a 75% interest and HST owning a 25% interest. |
| | |
| | On November 26, 2008, SIAF established Pretty Mountain Holdings Limited (“PMH”), a company incorporated in Hong Kong with an 80% equity interest. On May 25, 2009, PMH formed a corporate Sino-Foreign joint venture, Qinghai Sanjiang A Power Agriculture Co. Ltd. (“SJAP”), incorporated in the PRC, of which PMH owns a 45% equity interest. At the time, the remaining 55% equity interest in SJAP was owned by the following entities: |
| | • | Qinghai Province Sanjiang Group Company Limited (English translation) (“Qinghai Sanjiang”), a company owned by the PRC with major business activities in the agriculture industry; and |
| | | |
| | • | Guangzhou City Garwor Company Limited (English translation) (“Garwor”), a private limited company incorporated in the PRC, specializing in sales and marketing. |
| | SJAP is engaged in the business of manufacturing bio-organic fertilizer, livestock feed and development of other agriculture projects in the County of Huangyuan, in the vicinity of the Xining City, Qinghai Province, PRC. |
| | |
| | In September 2009, the Company carried out an internal reorganization of its corporate structure and business, and formed a 100% owned subsidiary, A Power Agro Agriculture Development (Macau) Limited (“APWAM”), which was formed in Macau. APWAM then acquired PMH’s 45% equity interest in SJAP. By virtue of the acquisition, APWAM assumed all obligations and liabilities of PMH under the Sino Foreign Joint Venture Agreement. On May 7, 2010, Qinghai Sanjiang sold and transferred its equity interest in SJAP to Garwor. The State Administration for Industry and Commerce of Xining City Government of the PRC approved the sale and transfer. As a result, APWAM owned 45% of SJAP and Garwor owned the remaining 55%. This remains the case as of the date of this quarterly report (the “Report”). |
| | |
| | On September 9, 2010, an application was submitted by the Company to the Companies Registry of Hong Kong for deregistration of PMH under Section 291AA of the Hong Kong Companies Ordinance. On January 28, 2011, PMH was dissolved. |
F - 4
SINO AGRO FOOD, INC.
NOTES TO CONSOLIDATED FINANCIAL STATEMENTS
| 1. | CORPORATE INFORMATION (CONTINUED) |
| | |
| | The Company applied to form Enping City Bi Tao A Power Prawn Culture Development Co. Limited (“EBAPCD”), in which the Company would indirectly own a 25% equity interest on February 28, 2011. |
| | |
| | On February 28, 2011, TRW applied to form a corporate joint venture, Enping City Bi Tao A Power Fishery Development Co., Limited (“EBAPFD”), incorporated in the PRC. TRW owned a 25% equity interest in EBAPFD. On November 17, 2011, TRW formed Jiang Men City A Power Fishery Development Co., Limited (“JFD”) in which it acquired a 25% equity interest, while withdrawing its 25% equity interest in EBAPFD. As of December 31, 2011, the Company had invested $1,258,607 in JFD. JFD operates an indoor fish farm. On January 1, 2012, the Company acquired an additional 25% equity interest in JFD for total cash consideration of $1,662,365. On April 1, 2012, the Company acquired an additional 25% equity interest in JFD for the amount of $1,702,580. The Company presently owns a 75% equity interest in JFD, representing majority of voting rights and controls its board of directors. As of January 1, 2012, the Company had consolidated the assets and operations of JFD. |
| | |
| | On April 15, 2011, MEIJI applied to form Enping City A Power Cattle Farm Co., Limited (“ECF”), all of which the Company would indirectly own a 25% equity interest in on November 17, 2011. On January 1, 2012, the Company had invested $1,076,489 in ECF. On September 17, 2012 MEIJI formed Jiang Men City Hang Mei Cattle Farm Development Co., Limited (“JHMC”) and acquired additional 50% equity interest for $2,944,176 on September 30, 2012 while withdrawing its 25% equity interest in ECF. The Company presently owns 75% equity interest in JHMC, representing majority of voting right and controls its board of directors. As of September 30, 2012, the Company had consolidated the assets and operations of JHMC. During the quarter ended June 30, 2013, MEIJI further invested $400,000 in JHMC, respectively. |
| | |
| | On July 18, 2011, the Company formed Hunan Shenghua A Power Agriculture Co., Limited (“HSA”), in which the Company owns a 26% equity interest, and SJAP owns a 50% equity interest with the Chinese partner owning the remaining 24%. During the quarter ended June 30, 2013, MEIJI and SJAP further invested $280,000 and $719,100 in HSA, respectively. |
| | |
| | The Company’s principal executive office is located at Room 3801, Block A, China Shine Plaza, No. 9 Lin He Xi Road, Tianhe District, Guangzhou City, Guangdong Province, PRC, 510610. |
| | |
| | The nature of the operations and principal activities of the Company and its subsidiaries are described in Note 2.2. |
| 2. | SUMMARY OF SIGNIFICANT ACCOUNTING POLICIES |
| | 2.1 | FISCAL YEAR |
| | | |
| | | The Company has adopted December 31 as its fiscal year end. |
F - 5
SINO AGRO FOOD, INC.
NOTES TO CONSOLIDATED FINANCIAL STATEMENTS
| 2. | SUMMARY OF SIGNIFICANT ACCOUNTING POLICIES (CONTINUED) |
| | 2.2 | REPORTING ENTITY |
| | | |
| | | The accompanying consolidated financial statements include the following entities: |
| | Name of subsidiaries | | Place of incorporation | | Percentage of interest | | Principal activities | |
| | | | | | | | | |
| | Capital Award Inc. ("CA") | | Belize | | 100% (12.31.2012: 100%) directly | | Fishery development and holder of A-Power Technology master license. | |
| | | | | | | | | |
| | Capital Stage Inc. ("CS") | | Belize | | 100% (12.31.2012:100%) indirectly | | Dormant | |
| | | | | | | | | |
| | Capital Hero Inc. ("CH") | | Belize | | 100% (12.31.2012:100%) indirectly | | Dormant | |
| | | | | | | | | |
| | Tri-way Industries Limited ("TRW") | | Hong Kong, PRC | | 100% (12.31.2012: 100%) directly | | Investment holding, holder of enzyme technology master license for manufacturing of livestock feed and bio-organic fertilizer and has not commenced its planned business of fish farm operations. | |
| | | | | | | | | |
| | Macau Meiji Limited ("MEIJI") | | Macau, PRC | | 100% (12.31.2012: 100%) directly | | Investment holding, cattle farm development, beef cattle and beef trading | |
| | ||||||||
| | A Power Agro Agriculture Development (Macau) Limited ("APWAM") | | Macau, PRC | | 100% (12.31.2012: 100%) directly | | Investment holding | |
| | ||||||||
| | Jiang Men City Heng Sheng Tai Agriculture Development Co. Ltd ("JHST") | | PRC | | 75% (12.31.2012: 75%) directly | | Hylocereus Undatus Plantation ("HU Plantation"). | |
| | | | | | | | | |
| | Jiang Men City A Power Fishery Development Co., Limited ("JFD") | | PRC | | 75% (12.31.2012: 75%) indirectly | | Fish cultivation | |
| | | | | | ||||
| | Jiang Men City Hang Mei Cattle Farm Development Co., Limited ("JHMC") | | PRC | | 75% (12.31.2012: 75%) indirectly | | Beef cattle cultivation | |
| | | | | | | | | |
| | Hunan Shenghua A Power Agriculture Co., Limited ("HSA") | | PRC | | 26% directly and 50% indirectly (12.31.2012: 26% directly and 50% indirectly) | | Manufacturing of organic fertilizer,livestock feed, and beef cattle and sheep cultivation, and plantation of crops and pastures | |
| | | | | | | | | |
| | Name of variable interest entity | | Place of incorporation | | Percentage of interest | | Principal activities | |
| | | | | |||||
| | Qinghai Sanjiang A Power Agriculture Co., Ltd ("SJAP") | | PRC | | 45% (12.31.2012: 45%) indirectly | | Manufacturing of organic fertilizer,livestock feed, and beef cattle and plantation of crops and pastures | |
| | | | | | | | | |
| | Name of unconsolidated equity investee | | Place of incorporation | | Percentage of interest | | Principal activities | |
| | | | | | | | | |
| | Enping City Bi Tao A Power Prawn Culture Development Co., Limited ("EBAPCD") (pending approval) | | PRC | | 25% (12.31.2012: 25% indirectly) | | Prawn cultivation | |
F - 6
SINO AGRO FOOD, INC.
NOTES TO CONSOLIDATED FINANCIAL STATEMENTS
| 2. | SUMMARY OF SIGNIFICANT ACCOUNTING POLICIES (CONTINUED) |
| | 2.3 | BASIS OF PRESENTATION |
| | | |
| | | The consolidated financial statements are prepared in accordance with generally accepted accounting principles in the United States of America (“US GAAP”). |
| | | |
| | | Interim results are not necessarily indicative of results for a full year. The information included in this interim report should be read in conjunction with the information included in the Company’s annual report on Form 10-K for the fiscal year ended December 31, 2012. |
| | | |
| | 2.4 | BASIS OF CONSOLIDATION |
| | | |
| | | The consolidated financial statements include the financial statements of the Company, its subsidiaries CA, CS, CH, TRW, MEIJI, JHST, JFD, JHMC, HSA and APWAM and its variable interest entity SJAP. All material inter-company transactions and balances have been eliminated in consolidation. |
| | | |
| | | SIAF, CA, CS, CH, TRW, MEIJI, JHST, JFD, JHMC, HSA, APWAM and SJAP are hereafter referred to as (“the Company”). |
| | | |
| | 2.5 | BUSINESS COMBINATION |
| | | |
| | | The Company adopted the accounting pronouncements relating to business combination (primarily contained in ASC Topic 805 “Business Combinations”), including assets acquired and liabilities assumed on arising from contingencies. These pronouncements established principles and requirement for how the acquirer of a business recognizes and measures in its financial statements he identifiable assets acquired, the liabilities assumed, and any non-controlling interest in the acquisition as well as provides guidance for recognizing and measuring the goodwill acquired in the business combination and determines what information to disclose to enable users of the financial statements to evaluate the nature and financial effects of the business combination. In addition, these pronouncements eliminate the distinction between contractual and non-contractual contingencies, including the initial recognition and measurement criteria and require an acquirer to develop a systematic and rational basis for subsequently measuring and accounting for acquired contingencies depending on their nature. The Company’s adoption of these pronouncements will have an impact on the manner in which it accounts for any future acquisitions. |
| | | |
| | 2.6 | NON - CONTROLLING INTEREST IN CONSOLIDATED FINANCIAL STATEMENTS |
| | | |
| | | The Company adopted the accounting pronouncement on non-controlling interests in consolidated financial statements, which establishes accounting and reporting standards for the non-controlling interest in a subsidiary and for the deconsolidation of a subsidiary. This guidance is primarily contained in ASC Topic “Consolidation.” It clarifies that a non-controlling interest in a subsidiary is an ownership interest in the consolidated financial statements. The adoption of this standard has not had material impact on the Company’s consolidated financial statements. |
| | | |
| | 2.7 | USE OF ESTIMATES |
| | | |
| | | The preparation of consolidated financial statements in conformity with US GAAP requires management to make assumptions and estimates that affect the reported amounts of assets and liabilities and disclosure of contingent assets and liabilities at the dates of the consolidated financial statements and the reported amounts of revenues and expenses during the reporting periods covered thereby. Actual results could differ from these estimates. Judgments and estimates of uncertainties are required in applying the Company’s accounting policies in certain areas. The following are some of the areas requiring significant judgments and estimates: determinations of the useful lives of assets, estimates of allowances for doubtful accounts, cash flow and valuation assumptions in performing asset impairment tests of long-lived assets, estimates of the realization of deferred tax assets and inventory reserves. |
F - 7
SINO AGRO FOOD, INC.
NOTES TO CONSOLIDATED FINANCIAL STATEMENTS
| 2. | SUMMARY OF SIGNIFICANT ACCOUNTING POLICIES (CONTINUED) |
| | 2.8 | REVENUE RECOGNITION |
| | | |
| | | The Company’s revenue recognition policies are in compliance with ASC 605. Sales revenue is recognized when all of the following have occurred: (i) persuasive evidence of an arrangement exists, (ii) delivery has occurred or services have been rendered, (iii) the price is fixed or determinable, and (iv) the ability to collect is reasonably assured. These criteria are generally satisfied at the time of shipment when risk of loss and title passes to the customer. |
| | | |
| | | License fee income is recognized on the accrual basis in accordance with the agreements. |
| | | |
| | | Government grants are recognized when (i) the Company has substantially accomplished what must be done pursuant to the terms of the grant that are established by the local government; and (ii) the Company receives notification from the local government that the Company has satisfied all of the requirements to receive the government grants; and (iii) the amounts are received. |
| | | |
| | | Revenues from the Company's fishery development services contracts are performed under fixed-price contracts. Revenues under long-term contracts are accounted for under the percentage-of-completion method of accounting in accordance with the Financial Accounting Standards Board (“FASB”) Accounting Standards Codification (“ASC”) Topic 605, Revenue Recognition (“ASC 605”). Under the percentage-of-completion method, the Company estimates profit as the difference between total estimated revenue and total estimated cost of a contract and recognizes that profit over the contract term. The percentage of costs incurred determines the amount of revenue to be recognized. Payment terms are generally defined by the installation contract and as a result may not match the timing of the costs incurred by the Company and the related recognition of revenue. Such differences are recorded as either costs or estimated earnings in excess of billings on uncompleted contracts or billings in excess of costs and estimated earnings on uncompleted contracts. The Company determines a customer’s credit worthiness at the time an order is accepted. Sudden and unexpected changes in a customer’s financial condition could put recoverability at risk. |
| | | |
| | | The percentage of completion method requires the ability to estimate several factors, including the ability of the customer to meet its obligations under the contract, including the payment of amounts when due. If the Company determines that collectability is not assured, the Company will defer revenue recognition and use methods of accounting for the contract such as the completed contract method until such time as the Company determines that collectability is reasonably assured or through the completion of the project. |
| | | |
| | | For fixed-price contracts, the Company uses the ratio of costs incurred to date on the contract to management's estimate of the contract's total costs, to determine the percentage of completion on each contract. This method is used as management considers expended costs to be the best available measure of progression of these contracts. Contract costs include all direct material, subcontract and labor costs and those indirect costs related to contract performance, such as supplies, tool repairs and depreciation. The Company accounts for maintenance and repair services under the guidance of ASC 605 as the services provided relate to construction work. Contract costs incurred to date and expected total contract costs are continuously monitored during the term of the contract. Changes in job performance, job conditions, and estimated profitability arising from contract penalty, change orders and final contract settlements may result in revisions to the estimated profit ability during the contract. These changes, which include contracts with estimated costs in excess of estimated revenues, are recognized as contract costs in the period in which the revisions are determined. Profit incentives are included in revenues when their realization is reasonably assured. At the point the Company anticipates a loss on a contract, the Company estimates the ultimate loss through completion and recognizes that loss in the period in which the loss was identified. |
| | | |
| | | The Company’s fishery development consultancy services revenues are recognized when the relevant services are rendered to a buyer. |
| | | |
| | | The Company does not provide warranties to customers on a basis customary to the industry, however, customers can claim warranty directly from product manufacturers for defects in equipment or products. Historically, the Company has experienced no warranty claims. |
F - 8
SINO AGRO FOOD, INC.
NOTES TO CONSOLIDATED FINANCIAL STATEMENTS
| 2. | SUMMARY OF SIGNIFICANT ACCOUNTING POLICIES (CONTINUED) |
| | 2.9 | COST OF GOODS SOLD |
| | | |
| | | Cost of goods sold consists primarily of direct purchase cost of merchandise goods, and related levies. |
| | | |
| | 2.10 | SHIPPING AND HANDLING |
| | | |
| | | Shipping and handling costs related to cost of goods sold are included in general and administrative expenses, which totaled $6,429, $1,113, $2,151 and $0 for the three months and the six months ended June 30, 2013 and 2012, respectively. |
| | | |
| | 2.11 | ADVERTISING |
| | | |
| | | Advertising costs are included in general and administrative expenses, which totaled $542, $2,849, $542 and $3,167 for the three months and the six months ended June 30, 2013 and 2012, respectively. |
| | | |
| | 2.12 | FOREIGN CURRENCY TRANSLATION AND OTHER COMPREHENSIVE INCOME |
| | | |
| | | The reporting currency of the Company is the U.S. dollar. The functional currency of the Company is the Chinese Renminbi (RMB). |
| | | |
| | | For those entities whose functional currency is other than the U.S. dollar, all assets and liabilities are translated into U.S. dollars at the exchange rate on the balance sheet date; shareholders’ equity is translated at historical rates and items in the statements of income and of cash flows are translated at the average rate for the period. Because cash flows are translated based on the average translation rate, amounts related to assets and liabilities reported in the statements of cash flows will not necessarily agree with changes in the corresponding balances in the balance sheets. Translation adjustments resulting from this process are included in accumulated other comprehensive income in the statements of shareholders’ equity. Transaction gains and losses that arise from exchange rate fluctuations on transactions denominated in a currency other than the functional currency are included in the statements of income and comprehensive income, as incurred. |
| | | |
| | | Accumulated other comprehensive income in the consolidated statement of shareholders’ equity amounted to $5,139,044 as of June 30, 2013 and $ 3,875,101 as of December 31, 2012. The balance sheet amounts with the exception of equity as of June 30, 2013 and December 31, 2012 were translated using an exchange rate of RMB 6.18 to $1.00 and RMB 6.29 to $1.00, respectively. The average translation rates applied to the statements of income and other comprehensive income and of cash flows for the three months ended June 30, 2013 and 2012 were RMB 6.24 to $1.00 and RMB 6.31 to $1.00, respectively. |
| | | |
| | 2.13 | CASH AND CASH EQUIVALENTS |
| | | |
| | | The Company considers all highly liquid securities with original maturities of three months or less when acquired to be cash equivalents. Cash and cash equivalents kept with financial institutions in the PRC are not insured or otherwise protected. Should any of those institutions holding the Company’s cash become insolvent, or should the Company become unable to withdraw funds for any reason, the Company could lose the cash on deposit with that institution. |
| | | |
| | 2.14 | ACCOUNTS RECEIVABLE |
| | | |
| | | The Company maintains reserves for potential credit losses on accounts receivable. Management reviews the composition of accounts receivable and analyzes historical bad debts, customer concentrations, customer credit worthiness, current economic trends and changes in customer payment patterns to evaluate the adequacy of these reserves. Reserves are recorded primarily on a specific identification basis. |
| | | |
| | | The standard credit period for most of the Company’s clients is three months. The collection period over 1 year is classified as long-term accounts receivable. Management evaluates the collectability of the receivables at least quarterly. Provision for doubtful accounts as of June 30, 2013 and December 31, 2012 is $0. |
F - 9
SINO AGRO FOOD, INC.
NOTES TO CONSOLIDATED FINANCIAL STATEMENTS
| 2. | SUMMARY OF SIGNIFICANT ACCOUNTING POLICIES (CONTINUED) |
| | 2.15 | INVENTORIES |
| | | |
| | | Inventories are valued at the lower of cost (determined on a weighted average basis) and net realizable value. |
| | | |
| | | Costs incurred in bringing each product to its location and conditions are accounted for as follows: |
| | (a) | raw materials – purchase cost on a weighted average basis; |
| | | |
| | (b) | manufactured finished goods and work-in-progress – cost of direct materials and labor and a proportion of manufacturing overhead based on normal operation capacity but excluding borrowing costs; and |
| | | |
| | (c) | retail and wholesale merchandise finished goods – purchase cost on a weighted average basis. |
| | | Net realizable value is the estimated selling price in the ordinary course of business, less estimated costs for completion and the estimated costs necessary to make the sale. |
| | | |
| | 2.16 | PROPERTY AND EQUIPMENT |
| | | |
| | | Property and equipment are stated at cost less accumulated depreciation and any accumulated impairment losses. Such costs include the cost of replacing parts that are eligible for capitalization when the cost of replacing the parts is incurred. Similarly, when each major inspection is performed, its cost is recognized in the carrying amount of the property and equipment as a replacement only if it is eligible for capitalization. The assets’ residual values, useful lives and depreciation methods are reviewed, and adjusted if appropriate, at each financial year end. |
| | | |
| | | Depreciation is calculated on a straight-line basis over the estimated useful lives of the assets. |
| | Plant and machinery | 5 - 10 years |
| | Structure and leasehold improvements | 10 - 20 years |
| | Mature seeds | 20 years |
| | Furniture and equipment | 2.5 - 10 years |
| | Motor vehicles | 5 -10 years |
| | | An item of property and equipment is removed from the accounts upon disposal or when no future economic benefits are expected to arise from the continued use of the asset. Any gain or loss arising on disposal of the asset (calculated as the difference between the net disposal proceeds and the carrying amount of the item) is included in the consolidated statements of income in the period the item is disposed. |
| | | |
| | 2.17 | GOODWILL |
| | | |
| | | Goodwill is an asset representing the fair economic benefits arising from other assets acquired in a business combination that are not individually identified or separately recognized. Goodwill is tested for impairment on an annual basis at the end of the Company’s fiscal year, or when impairment indicators arise. The Company uses a fair-value-based approach to test for impairment at the level of each reporting unit. The Company directly acquired MEIJI, which is the holding company of JHST that operates the Hu Plantation. As a result of this acquisition, the Company recorded goodwill in the amount of $724,940. This goodwill represents the fair value of the assets acquired in these acquisitions over the cost of the assets acquired. |
F - 10
SINO AGRO FOOD, INC.
NOTES TO CONSOLIDATED FINANCIAL STATEMENTS
| 2. | SUMMARY OF SIGNIFICANT ACCOUNTING POLICIES (CONTINUED) | |
| | | |
| | 2.18 | PROPRIETARY TECHNOLOGIES |
| | | |
| | | A master license of stock feed manufacturing technology was acquired and the costs of acquisition are capitalized as proprietary technologies when technological feasibility has been established. Stock feed manufacturing technology is amortized using the straight-line method over its estimated life of 20 years. |
| | | |
| | | An aromatic cattle-feeding formula was acquired and the costs of acquisition are capitalized as proprietary technologies when technological feasibility has been established. Stock feed manufacturing technology is amortized using the straight-line method over its estimated life of 25 years. |
| | | |
| | | The Company has determined that technological feasibility is established at the time a working model of products is completed. Proprietary technologies are intangible assets of finite lives. Management evaluates the recoverability of proprietary technologies on an annual basis at the end of the Company’s fiscal year, or when impairment indicators arise. As required by ASC Topic 350 “Intangible – Goodwill and Other”, the Company uses a fair-value-based approach to test for impairment. |
| | | |
| | 2.19 | CONSTRUCTION IN PROGRESS |
| | | |
| | | Construction in progress represents direct costs of construction as well as acquisition and design fees incurred. Capitalization of these costs ceases and the construction in progress is transferred to property and equipment when substantially all the activities necessary to prepare the assets for their intended use are completed. No depreciation is provided until construction is completed and the asset is ready for its intended use. |
| | | |
| | 2.20 | LAND USE RIGHTS |
| | | |
| | | Land use rights represent acquisition of rights to agricultural land from farmers and are amortized on the straight-line basis over their respective lease periods. The lease period of agricultural land is in the range from 30 to 60 years. Land use rights purchase prices were determined in accordance with the 2007 PRC Government’s minimum lease payments on agricultural land and mutually agreed to terms between the Company and the vendors. |
| | | |
| | 2.21 | CORPORATE JOINT VENTURE |
| | | |
| | | A corporation formed, owned, and operated by two or more businesses as a separate and discrete business or project (venture) for their mutual benefit is considered to be a corporate joint venture. Investee entities, in which the Company can exercise significant influence, but not control, are accounted for under the equity method of accounting. Under the equity method of accounting, the Company’s share of the earnings or losses of these companies is included in net income. |
| | | |
| | | A loss in value of an investment that is other than a temporary decline is recognized as a charge to operations. Evidence of a loss in value might include, but would not necessarily be limited to, the absence of an ability to recover the carrying amount of the investment or inability of the investee to sustain an earnings capacity that would justify the carrying amount of the investment. |
F - 11
SINO AGRO FOOD, INC.
NOTES TO CONSOLIDATED FINANCIAL STATEMENTS
| 2. | SUMMARY OF SIGNIFICANT ACCOUNTING POLICIES (CONTINUED) | |
| | | |
| | 2.22 | VARIABLE INTEREST ENTITY |
| | | |
| | | A variable interest entity (“VIE”) is an entity (investee) in which the investor has obtained less than a majority interest, according to the Financial Accounting Standards Board (FASB). A VIE is subject to consolidation if a VIE meets one of the following three criteria as elaborated in ASC Topic 810-10, Consolidation: |
| | (a) | equity-at-risk is not sufficient to support the entity's activities; |
| | | |
| | (b) | as a group, the equity-at-risk holders cannot control the entity; or |
| | | |
| | (c) | the economics do not coincide with the voting interest |
| | | If a firm is the primary beneficiary of a VIE, the holdings must be disclosed on the balance sheet. The primary beneficiary is defined as the person or company with the majority of variable interests. A corporation formed, owned, and operated by two or more businesses (ventures) as a separate and discrete business or project (venture) for their mutual benefit is defined as a joint venture. |
| | | |
| | 2.23 | TREASURY STOCK |
| | | |
| | | Treasury stock means shares of a corporation’s own stock that have been issued and subsequently reacquired by the corporation. Converting outstanding shares to treasury shares does not reduce the number of shares issued but does reduce the number of shares outstanding. These shares are not eligible to receive dividends. Accounting for excesses and deficiencies on treasury stock transactions is governed by ASC 505-30-30. |
| | | |
| | | State laws and federal agencies closely regulate transactions involving a company’s own capital stock, so the purchase of outstanding shares must have a legitimate purpose. Some of the most common reasons for purchasing outstanding shares are as follows: |
| | (a) | to meet additional stock needs for various reasons, including newly implemented stock option plans, stock for convertible bonds or convertible preferred stock, or a stock dividend. |
| | | |
| | (b) | to make more shares available for acquisitions of other entities. |
| | | The cost method of accounting for treasury shares has been adopted by the Company. The purchase of outstanding shares and thus converting them into treasury shares is treated as a temporary reduction in shareholders’ equity in view of the expectation to reissue the shares instead of retiring them. When the Company reissues the treasury shares, the temporary account is eliminated. The cost of acquiring outstanding shares for converting into treasury shares is charged to a contra account, in this case a contra equity account that reduces the stockholder equity balance. |
| | | |
| | 2.24 | INCOME TAXES |
| | | |
| | | The Company accounts for income taxes under the provisions of ASC Topic 740 “Accounting for Income Taxes.” Under ASC Topic 740, deferred tax assets and liabilities are determined based on the difference between the financial statement carrying amounts and the tax bases of assets and liabilities using enacted tax rates in effect in the years in which the differences are expected to reverse. |
| | | |
| | | The provision for income tax is based on the results for the year as adjusted for items, which are non-assessable or disallowed. It is calculated using tax rates that have been enacted or substantively enacted at the balance sheet date. Deferred tax is accounted for using the balance sheet liability method in respect of temporary differences arising from differences between the carrying amount of assets and liabilities in the financial statements and the corresponding tax basis used in the computation of assessable tax profit. In principle, deferred tax liabilities are recognized for all taxable temporary differences, and deferred tax assets are recognized to the extent that it is probable that taxable profit will be available against which deductible temporary differences can be utilized. |
F - 12
SINO AGRO FOOD, INC.
NOTES TO CONSOLIDATED FINANCIAL STATEMENTS
| 2. | SUMMARY OF SIGNIFICANT ACCOUNTING POLICIES (CONTINUED) | |
| | | |
| | 2.24 | INCOME TAXES (CONTINUED) |
| | | |
| | | Deferred income taxes are calculated at the tax rates that are expected to apply to the period when the asset is realized or the liability is settled. Deferred tax is charged or credited in the income statement, except when it related to items credited or charged directly to equity, in which case the deferred tax is also dealt with in equity. Deferred tax assets and liabilities are offset when they relate to income taxes levied by the same taxation authority and the Company intends to settle its current tax assets and liabilities on a net basis. |
| | | |
| | | ASC Topic 740 also prescribes a more-likely-than-not threshold for financial statement recognition and measurement of a tax position taken, or for one expected to be taken, in a tax return. ASC Topic 740 also provides guidance related to, among other things, classification, accounting for interest and penalties associated with tax positions, and disclosure requirements. Any interest and penalties accrued related to unrecognized tax benefits will be recorded as tax expense. |
| | | |
| | 2.25 | POLITICAL AND BUSINESS RISK |
| | | |
| | | The Company's operations are carried out in the PRC. Accordingly, the political, economic and legal environment in the PRC may influence the Company’s business, financial condition and results of operations by the general state of the PRC's economy. The Company's operations in the PRC are subject to specific considerations and significant risks not typically associated with companies in North America and Western Europe. The Company's results may be adversely affected by changes in governmental policies with respect to laws and regulations, anti-inflationary measures, currency conversion and remittance abroad, and rates and methods of taxation, among other things. |
F - 13
SINO AGRO FOOD, INC.
NOTES TO CONSOLIDATED FINANCIAL STATEMENTS
| 2. | SUMMARY OF SIGNIFICANT ACCOUNTING POLICIES (CONTINUED) | |
| | | |
| | 2.26 | CONCENTRATION OF CREDIT RISK |
| | | |
| | | Cash includes cash at banks and demand deposits in accounts maintained with banks within the PRC. Total cash in these banks as of June 30, 2013 and December 31, 2012 amounted to $9,274,048 and $8,403,458, respectively, none of which is covered by insurance. The Company has not experienced any losses in such accounts and believes it is not exposed to any risks to its cash in bank accounts. Accounts receivable are derived from revenue earned from customers located primarily in the PRC. The Company performs ongoing credit evaluations of customers and has not experienced any material losses to date. |
| | | |
| | | The Company had 5 major customers whose revenue individually represented the following percentages of the Company’s total revenue: |
| | | Three months | | | Three months | | | Six months | | | Six months | | |
| | | ended | | | ended | | | ended | | | ended | | |
| | | June 30, | | | June 30, | | | June 30, | | | June 30, | | |
| | | 2013 | | | 2012 | | | 2013 | | | 2012 | | |
| | | | | | | | | | | | | | |
| Customer A | | 26.94 | % | | 12.76 | % | | 18.57 | % | | 7.82 | % | |
| Customer B | | - | | | 25.65 | % | | 16.71 | % | | 21.85 | % | |
| Customer C | | 12.51 | % | | 14.44 | % | | 12.32 | % | | 12.21 | % | |
| Customer D | | 8.90 | % | | - | | | 10.09 | % | | 11.87 | % | |
| Customer E | | - | | | - | | | 8.20 | % | | - | | |
| Customer F | | - | | | 18.99 | % | | - | | | 20.63 | % | |
| Customer G | | - | | | 8.21 | % | | - | | | - | | |
| Customer H | | 7.98 | % | | | | | | | | | | |
| Customer I | | 7.86 | % | | | | | | | | | | |
| | | 64.19 | % | | 80.05 | % | | 65.89 | % | | 74.38 | % | |
| | | | Segment | | Amount | | |
| Customer A | | | Fishery Development Division | | $ | 20,338,677 | |
| Customer B | | | Fishery Development Division | | $ | 18,293,639 | |
| Customer C | | | Organic Fertilizer and Bread Grass Division | | $ | 13,494,997 | |
| Customer D | | | Fishery Development Division | | $ | 11,051,367 | |
F - 14
SINO AGRO FOOD, INC.
NOTES TO CONSOLIDATED FINANCIAL STATEMENTS
| 2. | SUMMARY OF SIGNIFICANT ACCOUNTING POLICIES (CONTINUED) | |
| | | |
| | 2.26 | CONCENTRATION OF CREDIT RISK (CONTINUED) |
| | | |
| | | The Company had 5 major customers whose accounts receivable balance individually represented the following percentages of the Company’s total accounts receivable: |
| | | June 30, 2013 | | | December 31, 2012 | |
| | | | | | | |
| Customer A | | 15.21 | % | | 11.14 | % |
| Customer B | | 15.01 | % | | 14.32 | % |
| Customer C | | 12.03 | % | | 9.94 | % |
| Customer D | | 11.69 | % | | 18.18 | % |
| Customer E | | 8.26 | % | | 8.23 | % |
| | | 62.20 | % | | 61.81 | % |
| | As of June 30, 2013, amounts due from customers A, B, C and D are $12,529258, $12,365,914, $9,908,296 and $9,628.321, respectively. The Company has not experienced any significant difficulty in collecting its accounts receivable in the past and is not aware of any financial difficulties of its major customers. |
| | 2.27 | IMPAIRMENT OF LONG-LIVED ASSETS AND INTANGIBLE ASSETS |
| | | |
| | | In accordance with ASC Topic 360, “Property, Plant and Equipment,” long-lived assets to be held and used are analyzed for impairment whenever events or changes in circumstances indicate that the related carrying amounts may not be recoverable. The Company reviews the carrying amount of its long-lived assets, including intangibles, for impairment, each reporting period. An asset is considered impaired when estimated future cash flows are less than the carrying amount of the asset. In the event the carrying amount of such asset is considered not recoverable, the asset is adjusted to its fair value. Fair value is generally determined based on discounted future cash flow. As of June 30, 2013 and December 31, 2012, the Company determined no impairment charges were necessary. |
F - 15
SINO AGRO FOOD, INC.
NOTES TO CONSOLIDATED FINANCIAL STATEMENTS
| 2. | SUMMARY OF SIGNIFICANT ACCOUNTING POLICIES (CONTINUED) | |
| | | |
| | 2.28 | EARNINGS PER SHARE |
| | | |
| | | As prescribed in ASC Topic 260 “Earnings per Share,” Basic Earnings per Share (“EPS”) is computed by dividing net income available to common stockholders by the weighted average number of common stock shares outstanding during the year. Diluted EPS is computed by dividing net income available to common stockholders by the weighted-average number of common stock shares outstanding during the year plus potential dilutive instruments such as stock options and warrants. The effect of stock options on diluted EPS is determined through the application of the treasury stock method, whereby proceeds received by the Company based on assumed exercises are hypothetically used to repurchase the Company’s common stock at the average market price during the period. |
| | | |
| | | For the three months ended June 30, 2013 and 2012, basic earnings per share attributable to Sino Agro Food, Inc. and subsidiaries common stockholders amount to $0.13 and $0.14, respectively. For the three months ended June 30, 2013 and 2012, diluted earnings per share attributable to Sino Agro Food, Inc. and its subsidiaries’ common stockholders amounted to $0.12 and $0.13, respectively |
| | | |
| | | For the six months ended June 30, 2013 and 2012, basic earnings per share attributable to Sino Agro Food, Inc. and subsidiaries common stockholders amount to $0.28 and $0.22, respectively. For the six months ended June 30, 2013 and 2012, diluted earnings per share attributable to Sino Agro Food, Inc. and its subsidiaries’ common stockholders amounted to $0.27 and $0.20, respectively |
| | | |
| | 2.29 | ACCUMULATED OTHER COMPREHENSIVE INCOME |
| | | |
| | | ASC Topic 220 “Comprehensive Income” establishes standards for reporting and displaying comprehensive income and its components in financial statements. Comprehensive income is defined as the change in stockholders’ equity of a business enterprise during a period from transactions and other events and circumstances from non-owner sources. The comprehensive income for all periods presented includes both the reported net income and net change in cumulative translation adjustments. |
| | | |
| | 2.30 | RETIREMENT BENEFIT COSTS |
| | | |
| | | PRC state managed retirement benefit programs are defined contribution plans and the payments to the plans are charged as expenses when employees have rendered service entitling them to the contribution made by the employer. |
| | | |
| | 2.31 | STOCK-BASED COMPENSATION |
| | | |
| | | The Company has adopted both ASC Topic 718, “Compensation - Stock Compensation” and ASC Topic 505-50, “Equity-Based Payments to Non- Employees” using the fair value method in which an entity issues its equity instruments to acquire goods and services from employees and non-employees. Stock compensation for stock granted to non-employees has been determined in accordance with this accounting standard and the accounting standard regarding accounting for equity instruments that are issued to other than employees for acquiring, or in conjunction with selling goods or services, as the fair value of the consideration received or the fair value of equity instruments issued, whichever is more reliably measured. This accounting standard allows the “simplified” method to determine the term of employee options when other information is not available. Under ASC Topic 718 and ASC Topic 505-50, stock compensation expenses is measured at the grant date on the value of the option or restricted stock and is recognized as expenses, less expected forfeitures, over the requisite service period, which is generally the vesting period. |
F - 16
SINO AGRO FOOD, INC.
NOTES TO CONSOLIDATED FINANCIAL STATEMENTS
| 2. | SUMMARY OF SIGNIFICANT ACCOUNTING POLICIES (CONTINUED) | |
| | | |
| | 2.32 | FAIR value of financial INSTRUMENTS |
| | | |
| | | The Company follows paragraph 825-10-50-10 of the FASB Accounting Standards Codification for disclosures about fair value of its financial instruments and paragraph 820-10-35-37 of the FASB Accounting Standards Codification (“Paragraph 820-10-35-37”) to measure the fair value of its financial instruments. Paragraph 820-10-35-37 establishes a framework for measuring fair value under U.S. GAAP, and expands disclosures about fair value measurements. To increase consistency and comparability in fair value measurements and related disclosures, Paragraph 820-10-35-37 establishes a fair value hierarchy, which prioritizes the inputs to valuation techniques used to measure fair value into three (3) broad levels. The fair value hierarchy gives the highest priority to quoted prices (unadjusted) in active markets for identical assets or liabilities and the lowest priority to unobservable inputs. The three (3) levels of fair value hierarchy defined by Paragraph 820-10-35-37 are described below: |
| | Level 1 | Quoted market prices available in active markets for identical assets or liabilities as of the reporting date. |
| | | |
| | Level 2 | Pricing inputs other than quoted prices in active markets included in Level 1, which are either directly or indirectly observable as of the reporting date. |
| | | |
| | Level 3 | Pricing inputs that are generally observable inputs and not corroborated by market data. |
| | | The carrying amounts of the Company’s financial assets and liabilities, such as cash and accrued expenses, approximate their fair values because of the short maturity of these instruments. The Company does not have any assets or liabilities measured at fair value on a recurring or a non-recurring basis, consequently, the Company did not have any fair value adjustments for assets and liabilities measured at fair value as of June 30, 2013 or December 31, 2012, nor gains or losses are reported in the statements of income and comprehensive income that are attributable to the change in unrealized gains or losses relating to those assets and liabilities still held at the reporting date for the fiscal period ended June 30, 2013 or June 31, 2012. |
| | | |
| | 2.33 | NEW ACCOUNTING PRONOUNCEMENTS |
| | | |
| | | The Company does not expect any recent accounting pronouncements to have a material effect on the Company’s financial position, results of operations, or cash flows. |
| | | |
| | | In July 2012, the FASB issued Accounting Standards Update ASU 2012-02, the amendments to ASC 350, Intangibles—Goodwill and Other: Testing Indefinite-Lived Intangible Assets for Impairment (“ASU 2012-02”). The amendments apply to all entities, both public and nonpublic, that have indefinite-lived intangible assets, other than goodwill, reported in their financial statements. In accordance with the amendments an entity has the option first to assess qualitative factors to determine whether the existence of events and circumstances indicates that it is more likely than not that the indefinite-lived intangible asset is impaired. If, after assessing the totality of events and circumstances, an entity concludes that it is not more likely than not that the indefinite-lived intangible asset is impaired, then the entity is not required to take further action. However, if an entity concludes otherwise, then it is required to determine the fair value of the indefinite-lived intangible asset and perform the quantitative impairment test by comparing the fair value with the carrying amount in accordance with Subtopic 350-30. An entity also has the option to bypass the qualitative assessment for any indefinite-lived intangible asset in any period and proceed directly to performing the quantitative impairment test. An entity will be able to resume performing the qualitative assessment in any subsequent period. The amendments are effective for annual and interim impairment tests performed for fiscal years beginning after September 15, 2012, and early adoption is permitted. The Company will apply these amendments for reporting periods beginning after December 31, 2012. The Company does not expect the adoption of the amendments to have a material impact on the consolidated financial statements. |
F - 17
SINO AGRO FOOD, INC.
NOTES TO CONSOLIDATED FINANCIAL STATEMENTS
| 3. | SEGMENT INFORMATION |
| | |
| | The Company establishes standards for reporting information about operating segments on a basis consistent with the Company’s internal organization structure as well as business segments and major customers in consolidated financial statements. The Company operates in four principal reportable segments: Fishery Development Division, and HU Plantation Division and Organic Fertilizer and Bread Grass Division, and Cattle Development Division. No geographic information is required as all revenue and assets are located in PRC. |
| For the three months ended June 30, 2013 | | ||||||||||||||||||
| | | Fishery Development Division (1) | | HU Plantation Division (2) | | Organic Fertilizer and Bread Grass Division (3) | | Cattle Farm Development Division (4) | | Corporate and others (5) | | Total | | ||||||
| | | | | | | | | | | | | | | | | | | | |
| Revenue | | $ | 17,904,106 | | $ | 3,554,986 | | $ | 16,946,378 | | $ | 6,421,161 | | | 9,573,698 | | $ | 54,400,329 | |
| | | | | | | | | | | | | | | | | | | | |
| Net income (loss) | | $ | 2,898,600 | | $ | 2,452,706 | | $ | 5,679,317 | | $ | 929,277 | | $ | 2,371,040 | | $ | 14,330,940 | |
| | | | | | | | | | | | | | | | | | | | |
| Total assets | | $ | 67,526,143 | | $ | 38,726,053 | | $ | 120,479,483 | | $ | 41,542,654 | | $ | 26,251,321 | | $ | 294,525,654 | |
| For the three months ended June 30, 2012 | | ||||||||||||||||||
| | | | Fishery Development Division (1) | | | HU Plantation Division (2) | | | Organic Fertilizer and Bread Grass Division (3) | | | Cattle Farm Development Division (4) | | | Corporate and others (5) | | | Total | |
| | | | | | | | | | | | | | | | | | | | |
| Revenue | | $ | 15,799,765 | | $ | 2,081,863 | | $ | 3,684,693 | | $ | 1,781,966 | | $ | - | | $ | 25,348,287 | |
| | | | | | | | | | | | | | | | | | | | |
| Net income (loss) | | $ | 8,321,886 | | $ | 1,117,450 | | $ | 469,629 | | $ | 461,438 | | $ | (80,381) | | $ | 10,290,022 | |
| | | | | | | | | | | | | | | | | | | | |
| Total assets | | $ | 59,793,491 | | $ | 27,151,644 | | $ | 71,872,466 | | $ | 9,791,026 | | $ | 14,721,073 | | $ | 183,329,700 | |
F - 18
SINO AGRO FOOD, INC.
NOTES TO CONSOLIDATED FINANCIAL STATEMENTS
| 3. | SEGMENT INFORMATION |
| | | Fishery Development Division (1) | | HU Plantation Division (2) | | Organic Fertilizer and Bread Grass Division (3) | | Cattle Farm Development Division (4) | | Corporate and others (5) | | Total | | ||||||
| | | | | | | | | | | | | | | | | | | | |
| Revenue | | $ | 42,122,633 | | $ | 3,554,986 | | $ | 31,824,277 | | $ | 14,783,718 | | | 17,222,466 | | $ | 109,508,080 | |
| | | | | | | | | | | | | | | | | | | | |
| Net income (loss) | | $ | 11,053,353 | | $ | 2,211,567 | | $ | 9,342,579 | | $ | 3,369,881 | | $ | 4,732,332 | | $ | 30,709,712 | |
| | | | | | | | | | | | | | | | | | | | |
| Total assets | | $ | 67,526,143 | | $ | 38,726,053 | | $ | 120,479,483 | | $ | 41,542,654 | | $ | 26,251,321 | | $ | 294,525,654 | |
For the six months ended June 30, 2012
| | | Fishery Development Division (1) | | HU Plantation Division (2) | | Organic Fertilizer and Bread Grass Division (3) | | Cattle Farm Development Division (4) | | Corporate and others (5) | | Total | | ||||||
| | | | | | | | | | | | | | | | | | | | |
| Revenue | | $ | 26,894,373 | | $ | 2,081,863 | | $ | 9,628,641 | | $ | 2,723,426 | | $ | - | | $ | 41,328,303 | |
| | | | | | | | | | | | | | | | | | | | |
| Net income (loss) | | $ | 13,592,472 | | $ | 1,090,577 | | $ | 1,035,018 | | $ | 1,186,596 | | $ | (943,177) | | $ | 15,961,484 | |
| | | | | | | | | | | | | | | | | | | | |
| Total assets | | $ | 59,793,491 | | $ | 27,151,644 | | $ | 71,872,466 | | $ | 9,791,026 | | $ | 14,721,073 | | $ | 183,329,700 | |
| | Note | |
| | (1) | Operated by Capital Award, Inc. and Jiangmen City A Power Fishery Development Co. Ltd. |
| | (2) | Operated by Jiangmen City Heng Sheng Tai Agriculture Development Co. Ltd. |
| | (3) | Operated by Qinghai Sanjiang A Power Agriculture Co. Ltd, A Power Agro Agriculture Development (Macau)Limited and Hunan Shenghua A Power Agriculture Co., Limited. |
| | (4) | Operated by Jiangmen City Hang Mei Cattle Farm Development Co. Ltd and Macau Meiji Limited. |
| | (5) | Operated by Sino Agro Food, Inc. |
F - 19
SINO AGRO FOOD, INC.
NOTES TO CONSOLIDATED FINANCIAL STATEMENTS
| 4. | INCOME TAXES |
| | United States of America |
| | |
| | The Company was incorporated in the State of Nevada, in the United States of America. The Company has no trading operations in United States of America and no US corporate tax has been provided for in the consolidated financial statements of the Company |
| | |
| | Undistributed Earnings of Foreign Subsidiaries |
| | |
| | The Company intends to use the remaining accumulated and future earnings of foreign subsidiaries to expand operations outside the United States and accordingly, undistributed earnings of foreign subsidiaries are considered to be indefinitely reinvested outside the United States and no provision for U.S. Federal and State income tax or applicable dividend distribution tax has been provided thereon. |
| | |
| | China |
| | |
| | Beginning January 1, 2008, the new Enterprise Income Tax (“EIT”) law replaced the existing laws for Domestic Enterprises (“DE’s”) and Foreign Invested Enterprises (“FIE’s”). The new standard EIT rate of 25% replaced the 33% rate currently applicable to both DE’s and FIE’s. The Company is currently evaluating the impact that the new EIT will have on its financial condition. Beginning January 1, 2008, China unified the corporate income tax rule on foreign invested enterprises and domestic enterprises. The unified corporate income tax rate is 25%. |
| | |
| | Under new tax legislation in China beginning in January 2008, the agriculture, dairy and fishery sectors are exempt from enterprise income taxes. |
| | |
| | No EIT has been provided in the financial statements of CA, ZX, JHST, JHMC, HSA and SJAP since they are exempt from EIT for the six months ended June 30, 2013 and 2012 as they are within the agriculture, dairy and fishery sectors. |
| | |
| | On December 31, 2012, Tax authority agreed that HSA and JFD were exempt from EIT since January 1, 2011 as both companies are within the agriculture, dairy and fishery sectors. |
| | |
| | Belize and Malaysia |
| | |
| | CA, CS and CH are international business companies incorporated in Belize, and are exempt from corporate tax in Belize. |
| | |
| | All sales invoices of CA were issued by its representative office in Malaysia and its trading and service activities are conducted in China. As the Malaysia tax law is imposed on a territorial basis and not on a worldwide basis, CA’s income is not subject to Malaysian corporate tax. |
| | |
| | As a result, neither Belize nor Malaysia corporate tax is provided for in the consolidated financial statements of CA for the six months ended June 30, 2013 and 2012. |
| | |
| | Hong Kong |
| | No Hong Kong profits tax has been provided in the consolidated financial statements of TRW, since these entities did not earn any assessable profits for the six months ended June 30, 2013 and 2012. |
| | |
| | Macau |
| | No Macau Corporation tax has been provided in the consolidated financial statements of HYT, APWAM and MEIJI since these entities did not earn any assessable profits for the six months ended June 30, 2013 and 2012. |
| | |
| | No deferred tax assets and liabilities are of June 30, 2013 and December 31, 2012 since there was no difference between the financial statements carrying amounts and the tax bases of assets and liabilities using enacted tax rates in effect in the period in which the differences are expected to reverse. |
F - 20
SINO AGRO FOOD, INC.
NOTES TO CONSOLIDATED FINANCIAL STATEMENTS
| 4. | INCOME TAXES (CONTINUED) |
| | Provision for income taxes is as follows: |
| | | Three | | Three | | Six | | Six | | ||||
| | | months ended | | months ended | | months ended | | months ended | | ||||
| | | June 30, 2013 | | June 30, 2012 | | June 30, 2013 | | June 30, 2012 | | ||||
| | | | | | | | | | | | | | |
| Income tax provision | | | | | | | | | | | | | |
| - SIAF | | $ | - | | $ | - | | $ | - | | $ | - | |
| - CA, CS and CH | | | - | | | - | | | - | | | - | |
| - TRW | | | - | | | - | | | - | | | - | |
| - MEIJI and APWAM | | | - | | | - | | | - | | | - | |
| - JHST, JHMC, JFD, HSA and SJAP | | | - | | | - | | | - | | | - | |
| Deferred tax provision | | | - | | | - | | | - | | | - | |
| | | $ | - | | $ | - | | $ | - | | $ | - | |
| | The Company did not recognize any interest or penalties related to unrecognized tax benefits in the six months ended June 30, 2013 and 2012.The Company had no uncertain positions that would necessitate recording of tax related liability. The Company is subject to examination by the respective tax authorities. |
| 5. | CASH AND CASH EQUIVALENTS |
| | | June 30, 2013 | | December 31, 2012 | | ||
| | | | | | | | |
| Cash and bank balances | | $ | 9,391,449 | | $ | 8,424,265 | |
| 6. | INVENTORIES |
| | As of June 30, 2013, inventories are as follows: |
| | | June 30, 2013 | | December 31, 2012 | | ||
| | | | | | | | |
| Sleepy cods and eels | | $ | 5,432,990 | | $ | 4,612,090 | |
| Bread grass | | | 709,366 | | | 1,473,653 | |
| Beef cattle | | | 2,985,965 | | | 2,569,659 | |
| Organic fertilizer | | | 702,836 | | | 737,166 | |
| Forage for cattle and consumable | | | 3,144,896 | | | 278,900 | |
| Raw materials for bread grass and organic fertilizer | | | 5,237,102 | | | 6,765,536 | |
| Unharvested HU plantation | | | 674,278 | | | - | |
| Immature seeds | | | - | | | 677,751 | |
| | | $ | 18,887,433 | | $ | 17,114,755 | |
F - 21
SINO AGRO FOOD, INC.
NOTES TO CONSOLIDATED FINANCIAL STATEMENTS
| 7. | DEPOSITS AND PREPAID EXPENSES |
| | The Company made temporary deposit payments for equity investments in the future development of a prawn farm hatchery and a prawn farm nursery. |
| | | June 30, 2013 | | December 31, 2012 | | ||
| | | | | | | | |
| Deposits for | | | | | | | |
| - purchases of equipment | | $ | 2,059,776 | | $ | 318,192 | |
| - acquisition of land use rights | | | 7,826,508 | | | 7,826,508 | |
| - inventories purchases | | | 4,940,767 | | | 2,228,854 | |
| - aquaculture contract | | | 6,022,708 | | | 7,062,600 | |
| - building materials | | | 1,281,935 | | | 2,000,000 | |
| - proprietary technologies | | | 2,254,839 | | | 2,254,839 | |
| - construction in progress | | | 19,658,537 | | | 14,423,021 | |
| Miscellaneous | | | 251,657 | | | 4,892,258 | |
| Shares issued for employee compensation and overseas professional | | | 90,600 | | | 271,800 | |
| Temporary deposits paid to entities for investments in future Sino Foreign Joint Venture companies | | | 7,704,670 | | | 6,030,785 | |
| | | | 52,091,997 | | | 47,308,857 | |
| 8. | ACCOUNTS RECEIVABLE |
| | The Company has performed an analysis on all of its accounts receivable and determined that all amounts are collectible by the Company. As such, all accounts receivable are reflected as a current asset and no allowance for bad debt has been recorded as of June 30, 2013 and December 31, 2012. Bad debts written off for the three months ended and six months ended June 30, 2013 and 2012 are $0. |
| | |
| | Aging analysis of accounts receivable is as follows: |
| | | June 30, 2013 | | December 31, 2012 | | ||
| | | | | | | | |
| 0 - 30 days past due | | $ | 25,564,050 | | $ | 10,813,981 | |
| 31 - 90 days past due | | | 40,853,659 | | | 27,784,784 | |
| 91 - 120 days past due | | | 15,251,513 | | | 6,866,842 | |
| over 120 days and less than 1 year past due | | | 704,648 | | | 7,482,743 | |
| over 1 year past due | | | - | | | - | |
| | | | 82,373,870 | | | 52,948,350 | |
| 9. | OTHER RECEIVABLES |
| | | June 30,2013 | | December 31, 2012 | | ||
| | | | | | | | |
| Cash advances paid as consideration to acquire investments. | | $ | 4,657,728 | | $ | 4,657,728 | |
| Advanced to employees | | | 206,046 | | | 166,722 | |
| Advanced to suppliers | | | 573,001 | | | 205,088 | |
| Miscellaneous | | | 937,497 | | | 924,710 | |
| | | $ | 6,374,272 | | $ | 5,954,248 | |
F - 22
SINO AGRO FOOD, INC.
NOTES TO CONSOLIDATED FINANCIAL STATEMENTS
| 10. | PLANT AND EQUIPMENT |
| | | June 30, 2013 | | December 31, 2012 | | ||
| | | | | | | | |
| Plant and machinery | | $ | 3,681,644 | | $ | 3,681,644 | |
| Structure and leasehold improvements | | | 15,446,062 | | | 15,446,062 | |
| Mature seeds | | | 2,660,357 | | | 1,369,626 | |
| Furniture and equipment | | | 633,370 | | | 212,479 | |
| Motor vehicles | | | 277,513 | | | 277,513 | |
| | | | 22,698,946 | | | 20,987,324 | |
| | | | | | | | |
| Less: Accumulated depreciation | | | (1,679,693) | | | (1,041,022) | |
| Net booking value | | | 21,019,253 | | | 19,946,302 | |
| | Depreciation expense was $331,596 and $125,530 for the three months ended June 30, 2013 and 2012, respectively. |
| | Depreciation expense was $638,671 and $183,154 for the six months ended June 30, 2013 and 2012, respectively. |
| 11. | CONSTRUCTION IN PROGRESS |
| | | June 30, 2013 | | December 31, 2012 | | ||
| | | | | | | | |
| Construction in progress | | | | | | | |
| - Oven room for production of dried flowers | | $ | 828,905 | | $ | 828,905 | |
| - Office, warehouse and organic fertilizer plant in H S A | | | 10,450,518 | | | 10,450,518 | |
| - Organic fertilizer and bread grass production plant and office buildingin SJAP | | | 13,228,105 | | | 7,921,105 | |
| - Rangeland for beef cattle and office building in Enping | | | 5,291,982 | | | 5,291,982 | |
| - Cattle houses, office building and staff quarter in SJAP | | | 8,289,632 | | | - | |
| | | $ | 38,089,142 | | $ | 24,492,510 | |
F - 23
SINO AGRO FOOD, INC.
NOTES TO CONSOLIDATED FINANCIAL STATEMENTS
| 12. | LAND USE RIGHTS |
| | |
| | Private ownership of agricultural land is not permitted in the PRC. Instead, the Company has leased five lots of land. The cost of the first lot of land use rights acquired in 2007 in Guangdong Province was $6,408,289 and consists of 180.23 acres with the lease expiring in 2067. The cost of the second lot of land use rights acquired in 2008 in Guangdong Province was $764,128, which consists of31.84 acres with the lease expiring in 2068. The cost of the third lot of land use rights acquired in 2011 was $7,042,831, which consists of 52.46 acres in Guangdong Province, with the lease expiring in 2037. The cost of the fourth lot of land use rights acquired in 2011 was $35,405,750 which consisted of 287.21 acres in the Hunan Province, PRC and the leases expire in 2051, 2054 and 2071. The cost of the fifth lot of land use rights acquired in 2012 was $528,240 which consisted of 21.09 acres in Qinghai Province, PRC and the leases expire in 2051. The cost of the sixth lot of land use rights acquired in 2013 was $528,240 which consisted of 41.80 acres in Guangdong Province, PRC and the leases expire in 2051. |
| | | June 30, 2013 | | December 31,2012 | | ||
| | | | | | | | |
| Cost | | $ | 60,045,896 | | $ | 58,630,950 | |
| Less: Accumulated amortisation | | | (3,666,041) | | | (2,897,704) | |
| Net carrying amount | | $ | 56,379,855 | | $ | 55,733,246 | |
| | Land use rights are amortized on the straight-line basis over their respective lease periods. The lease period of agriculture land is 30 to 60 years. |
| | |
| | Amortization of land use rights was $539,677 and $642,905 for the three months ended June 30, 2013 and 2012, respectively. Amortization of land use rights was $768,337 and $944,176 for the three months ended June 30, 2013 and 2012, respectively. |
| 13. | PROPRIETARY TECHNOLOGIES |
| | By an agreement dated November 12, 2008, TRW acquired an enzyme technology master license, registered under a Chinese patent, for the manufacturing of livestock feed and bioorganic fertilizer and its related labels for $8,000,000. On March 6, 2012 MEIJI acquired an aromatic-feed formula technology for the production of aromatic cattle for $1,500,000. |
| | | June 30, 2013 | | December 31, 2012 | | ||
| | | $ | | $ | | ||
| | | | | | | | |
| Cost | | | 9,512,258 | | | 9,512,258 | |
| Less: Accumulated amortization | | | (1,605,591) | | | (1,397,634) | |
| Net carrying amount | | | 7,906,667 | | | 8,114,624 | |
| | Amortization of proprietary technologies was $98,750 and $145,500 for the three months ended June 30, 2013 and 2012, respectively. Amortization of proprietary technologies was $207,957 and $194,000 for the six months ended June 30, 2013 and 2012, respectively. No impairments of proprietary technologies have been identified for the three months ended and the six months ended June 30, 2013 and 2012. |
F - 24
SINO AGRO FOOD, INC.
NOTES TO CONSOLIDATED FINANCIAL STATEMENTS
| 14. | GOODWILL |
| | Goodwill represents the fair value of the assets acquired the acquisitions over the cost of the assets acquired. It is stated at cost less accumulated impairment losses. Management tests goodwill for impairment on an annual basis or when impairment indicators arise. In these instances, the Company recognizes an impairment loss when it is probable that the estimated cash flows are less than the carrying value of the assets. To date, no such impairment loss has been recorded. |
| | | June 30, 2013 | | December 31, 2012 | | ||
| | | | | | | | |
| Goodwill from acquisition | | $ | 724,940 | | $ | 724,940 | |
| Less: Accumulated impairment losses | | | - | | | - | |
| Net carrying amount | | $ | 724,940 | | $ | 724,940 | |
| 15. | VARIABLE INTEREST ENTITY |
| | On September 28, 2009, APWAM acquired the PMH’s 45% equity interest in the Sino-Foreign joint venture company, Qinghai Sanjiang A Power Agriculture Co. Limited (“SJAP”), which was incorporated in the People’s Republic of China. As of June 30, 2013, the Company has invested $2,251,359 in this joint venture. SJAP is engaged in its business of the manufacturing of organic fertilizer, livestock feed, and beef cattle and plantation of crops and pastures. |
| | |
| | Continuous assessment of the VIE relationship with SJAP |
| | |
| | The Company may also have a controlling financial interest in an entity through an arrangement that does not involve voting interests, such as a VIE. The Company evaluates entities deemed to be VIE’s using a risk and reward model to determine whether to consolidate. A VIE is an entity (1) that has total equity at risk that is not sufficient to finance its activities without additional subordinated financial support from other entities, (2) where the group of equity holders does not have the power to direct the activities of the entity that most significantly impact the entity’s economic performance, or the obligation to absorb the entity’s expected losses or the right to receive the entity’s expected residual returns, or both, or (3) where the voting rights of some investors are not proportional to their obligations to absorb the expected losses of the entity, their rights to receive the expected residual returns of the entity, or both, and substantially all of the entity’s activities either involve or are conducted on behalf of an investor that has disproportionately few voting rights. |
| | |
| | The Company also quantitatively and qualitatively examined if SJAP is considered a VIE. Qualitative analyses considered the extent to which the nature of its variable interest exposed the Company to losses. For quantitative analyses, the Company also used internal cash flow models to determine if SJAP was a VIE and, if so, whether the Company was the primary beneficiary. The projection of these cash flows and probabilities thereof requires significant managerial judgment because of the inherent limitations that relate to the use of historical data for the projection of future events. On June 30, 2013, the Company evaluated the above VIE testing results and concluded that the Company is the primary beneficiary of SJAP’s expected losses or residual returns and that SJAP qualifies as a VIE of the Company. As result, the Company has consolidated SJAP as a VIE. |
| | |
| | The reasons for the changes are as follows: |
| | |
| | •Originally, the board of directors of SJAP consisted of 7 members; 3 appointees from Qinghai Sanjiang (one stockholder), 1 from Garwor (one stockholder), and 3 from the Company, such that the Company did not have majority interest represented on the board of directors of SJAP. |
| | |
| | •On May 7, 2010, Qinghai Sanjiang sold and transferred its equity interest in SJAP to Garwor. The State Administration for Industry and Commerce of Xining City Government of the People’s Republic of China approved the sale and transfer. |
| | |
| | Consequently Garwor and the Company agreed that the new board of directors of SJAP would consist of 3 members; 1 appointee from Garwor and 2 appointees from the Company, such that the Company now had a majority interest in the board of directors of SJAP. Also, and in accordance with the Company’s Sino Joint Venture Agreement, the Company’s management appointed the chief financial officer of SJAP. As a result, the financial statements of SJAP were included in the consolidated financial statements of the Company. |
F - 25
SINO AGRO FOOD, INC.
NOTES TO CONSOLIDATED FINANCIAL STATEMENTS
| 16. | LICENSE RIGHTS |
| | Pursuant to an agreement dated August 1, 2006 between Infinity Environmental Group Limited (“Infinity”) and the Company, the Company was granted an A Power Technology License with the condition that the Company was required to pay the license fee covering 500 units of APM as performance payment to Infinity on or before July 31, 2008. This license allows the Company to develop service, manage and supply A Power Technology Farms in the PRC using the A Power Technology, but subject to a condition that the Company is required to pay a license fee to Infinity once the Company has sold the license to its customer. Under the said license, the Company has the right to authorize developers and/or joint venture partners to develop A Power Technology Farms in the PRC. Infinity is a company incorporated in Australia. |
| 17. | OTHER PAYABLES |
| | | June 30, 2013 | | December 31, 2012 | | ||
| | | | | | | | |
| Due to third parties | | $ | 664,865 | | $ | 877,259 | |
| Promissory notes issued to third parties | | | 4,477,414 | | | 3,352,394 | |
| Convertible notes payable | | | - | | | 232,000 | |
| Due to local government | | | 2,192,825 | | | 2,192,825 | |
| Miscellaneous | | | 2,924,074 | | | - | |
| | | $ | 10,259,178 | | $ | 6,654,478 | |
| | Due to third parties are unsecured, interest free and have no fixed terms of repayment. |
| 18. | CONSTRUCTION CONTRACT |
| | (i) | Cost and estimated earnings in excess of billings on uncompleted contracts |
| | | June 30, 2013 | | December 31, 2012 | | ||
| | | | | | | | |
| Cost | | $ | 2,505,402 | | $ | 3,755,046 | |
| Estimated earnings | | | 4,746,626 | | | 8,307,452 | |
| Less: Billings | | | (5,965,253) | | | (9,725,618) | |
| Costs and estimated earnings in excess of billings on uncompleted contract | | $ | 1,286,775 | | $ | 2,336,880 | |
F - 26
SINO AGRO FOOD, INC.
NOTES TO CONSOLIDATED FINANCIAL STATEMENTS
| 18. | CONSTRUCTION CONTRACT (CONTINUED) |
| | (ii) | Cost and estimated earnings in excess of billings on uncompleted contracts |
| | | June 30, 2013 | | December 31, 2012 | | ||
| | | | | | | | |
| Billings | | $ | 14,916,618 | | $ | 9,810,427 | |
| Less: Cost | | | (4,302,086) | | | (1,886,705) | |
| Estimated earnings | | | (9,692,157) | | | (5,133,638) | |
| Billing in excess of costs and estimated earnings on uncompleted contract | | $ | 922,375 | | $ | 2,790,084 | |
| | (iii) | Overall |
| | | June 30, 2013 | | December 31, 2012 | | ||
| Cost | | $ | 6,807,488 | | $ | 5,641,751 | |
| Estimated earnings | | | 14,438,783 | | | 13,441,090 | |
| Less: Billings | | | (20,881,871) | | | (19,536,045) | |
| Cost and estimated earnings in excess of billings on uncompleted contract/(Billing in excess of Costs and estimated earnings on uncompleted contract) | | $ | 364,400 | | $ | (453,204) | |
| 19. | BORROWINGS |
| | |
| | There are no provisions in the Company’s bank borrowings and long term debts that would accelerate repayment of debt as a result of a change in credit ratings or a material adverse change in the Company’s business. Under certain agreements, the Company has the option to retire debt prior to maturity, either at par or at a premium over par. |
| | |
| | Short term bank loan |
| Name of bank | | Interest rate | | | Term | | June 30, 2013 | | | December 31, 2012 | | ||
| Agricultural Bank of China | | 6 | % | | August 8, 2012 - August 29, 2013 | | | | | | | | |
| Huangyuan County Branch, | | | | | | | | | | | | | |
| Xining , Qinghai Province, | | | | | | | | | | | | | |
| P.R.C. | | | | | | | $ | 2,265,849 | ^* | | $ | 3,181,927 | |
| | ^ | personal and corporate guaranteed by third parties. |
| | * | secured by land use rights with net carrying amount of $515,186. |
F - 27
SINO AGRO FOOD, INC.
NOTES TO CONSOLIDATED FINANCIAL STATEMENTS
| 19. | BORROWINGS (CONTINUED) |
| | Long term debts |
| Name of lender | | Interest rate | | | Term | | June 30, 2013 | | December 31, 2012 | | ||
| | | | | | | | | | | | | |
| Gan Guo Village Committee | | 12.22 | % | | June 2012 - June 2017 | | | | | | | |
| Bo Huang Town | | | | | | | | | | | | |
| Huangyuan County, | | | | | | | | | | | | |
| Xining City, | | | | | | | | | | | | |
| Qinghai Province, P.R.C. | | | | | | | $ | 178,031 | | $ | 175,006 | |
| 20. | SHAREHOLDERS’ EQUITY |
| | The Group’s share capital as of June 30, 2013 and December 31, 2012 shown on the consolidated balance sheet represents the aggregate nominal value of the share capital of the Company as at that date. |
| | |
| | On March 22, 2010, the Company designated 100 shares of Series A preferred stock at a par value per share of $0.001. As of the same date, 100 shares of Series A preferred stock were issued at $1 per share for cash in the amount of $100. |
| | |
| | The Series A preferred stock: |
| | (i) | does not pay a dividend; |
| | (ii) | votes together with the shares of Common Stock of the Corporation as a single class and, regardless of the number of shares of Series A Preferred Stock outstanding and as long as at least one of such shares of Series A Preferred Stock is outstanding, shall represent eighty percent (80%) of all votes entitled to be voted at any annual or special meeting of shareholders of the Corporation or action by written consent of shareholders. Each outstanding share of the Series A Preferred Stock shall represent its proportionate share of the 80%, which is allocated to the outstanding shares of Series A Preferred Stock; and |
| | (iii) | ranks senior to common stockholders, holders of Series B convertible preferred stockholders and any other stockholders on liquidation. |
| | The Company has designated 100 shares of Series A preferred stock with 100 shares issued and outstanding as of March 31, 2013 and December 31, 2012, respectively. |
| | |
| | The Series B convertible preferred stock: |
| | |
| | On March 22, 2010, the Company designated 7,000,000 shares of Series B convertible preferred stock at a par value per share of $0.001. The Series B convertible preferred stock is redeemable, the stockholders are not entitled to receive any dividend and voting rights but rank senior over common stockholders on liquidation, and can convert to common stock on a one for one basis at any time. On June 26, 2010, 7,000,000 shares of common stock were surrendered for cancellation and the Company issued 7,000,000 shares of Series B convertible preferred stock at $1.00 per share. Pursuant to share exchange agreement made as of December 22, 2012, between the Company and a stockholder, Capital Adventure Inc., a holder of 3,000,000 shares of common shares, with the consent of Board of Directors, to exchange for 3,000,000 shares of Series B convertible preferred stock on one-for-one basis. As of December 23, 2012, 3,000,000 shares of Series B convertible preferred stock were issued to Capital Adventure Inc., for the exchange of its holding of 3,000,000 shares of common stocks. As of December 31, 2012, 3,000,000 shares of common stocks were still not returned to the Company. |
| | |
| | On March 27, 2013, 3,000,000 Series B convertible preferred stock were cancelled. As a result, total issued and outstanding preferred stock as of that date is 7,000,100 shares. |
F - 28
SINO AGRO FOOD, INC.
NOTES TO CONSOLIDATED FINANCIAL STATEMENTS
| 20. | SHAREHOLDERS’ EQUITY (CONTINUED) |
| | There were 7,000,000 shares and 10,000,000 shares of Series B convertible preferred stock issued and outstanding as of June 30, 2013 and December 31, 2012, respectively. |
| | |
| | The Series F Non-Convertible preferred stock: |
| | |
| | On August 13, 2012, the Company designated 1,000,000 shares of preferred stock with a par value per share of $0.001 as Series F Non-Convertible Preferred Stock with a face value of $1.00 per share with 0 shares issued and outstanding as of June 30, 2013 and December 31, 2012. |
| | |
| | The Series F Non-Convertible Preferred Stock: |
| | (i) | is not redeemable; |
| | (ii) | except for (iv), with respect to dividend rights, rights on liquidation, winding up and dissolution, rank junior and subordinate to (a) all classes of Common Stock,(b) all other classes of Preferred Stock and (c) any class or series of capital securities of the Company. |
| | (iii) | except for (iv), shall not entitled to receive any dividend; and |
| | (iv) | on May 30, 2014, the holders of record of shares of Series F Non-Convertible Preferred Stock shall be entitled to a coupon payment directly from the Company at the redemption rate of $3.40 per share. Upon redemption, the Record Holder shall no longer own any shares of Series F that have been redeemed, and all such redeemed shares shall disappear and no longer exist on the books and records of the Company; redeemed shares of Series F which no longer exist upon redemption shall thereafter be counted toward the authorized but unissued “blank check” preferred stock of the Company. |
| | Common Stock: |
| | |
| | On December 5, 2012, the Company obtained stockholder consent for the approval of an amendment to our articles of incorporation to increase our authorized shares of common stock, no par value (the “Common Stock”), from 100,000,000 to 130,000,000. The board of directors believes that the increase in our authorized Common Stock will provide is with greater flexibility with respect to our capital structure for purposes including additional equity financings and stock based acquisitions. The certificate of amendment effectuating the vote by the shareholders was filed with the State of Nevada on January 24, 2013. |
| | |
| | During the year ended December 31, 2012, the Company issued (i) 32,064,588 shares of common stock for 18,193,714 at values ranging from $0.40 to $0.71 per share to settle debts due to third parties. The Company executed several agreements with third parties to settle debts by issuance of the Company’s common stock. The shares issued by the Company were valued at the trading price of the stock on the date the shares were issued. Any excess of the fair value of the shares over the carrying cost of the debt has been reported as a gain on the extinguishment of debts under other income of $552,988 have been credited to consolidated statements of income as other income for the year ended December 31, 2012; and (ii) 906,000 shares of common stock valued to employees at fair value of $0.40 per share for $362,400 for employee compensation. The fair value of the common stock issued was determined by using the trading price of the Company’s common stock on the date of issuance of $0.40 per share. |
| | |
| | During the three months ended June 30, 2013, the Company issued 9,824,239 shares of common stock for $4,777,277 at values ranging from $0.37 to $0.49 per share to settle debts due to third parties. The Company executed several agreements with third parties to settle debts by issuance of the Company’s common stock. The shares issued by the Company were valued at the trading price of the stock on the date the shares were issued. Any excess of the fair value of the shares over the carrying cost of the debt has been reported as a gain on the extinguishment of debts of $498,025 and $562,361 has been credited to consolidated statements of income as other income for the three months ended June 30, 2013 and 2012, respectively. |
F - 29
SINO AGRO FOOD, INC.
NOTES TO CONSOLIDATED FINANCIAL STATEMENTS
| 20. | SHAREHOLDERS’ EQUITY (CONTINUED) |
| | During the six months ended June 30, 2013, the Company issued 20,168.977 shares of common stock for $10,793,415 at values ranging from $0.37 to $0.527 per share to settle debts due to third parties. The Company executed several agreements with third parties to settle debts by issuance of the Company’s common stock. The shares issued by the Company were valued at the trading price of the stock on the date the shares were issued. Any excess of the fair value of the shares over the carrying cost of the debt has been reported as a gain on the extinguishment of debts of $1,051,013 and $817,513 has been credited to consolidated statements of income as other income for the six months ended June 30, 2013 and 2012, respectively. On March 28, 2013, the Company filed a prospectus related to a public offering of Common Stock of the Company for maximum aggregate gross proceeds of $26,250,000 within a period not to exceed 180 days from the date of this prospectus. |
| | |
| | During the six months ended June 30, 2012, the Company issued 20,168,977 shares of common stock for $6,946,250 at values ranging from $0.37 to $0.527 per share to settle debts due to third parties. |
| | |
| | The Company has common stock of 120,173,827 and 100,004,850 shares issued and outstanding as of June 30, 2013 and December 31, 2012, respectively. |
| 21. | CONVERTIBLE NOTES PAYABLE |
| | In December of 2011, the Board of Directors passed a resolution authorizing the Company to enter into an agreement to borrow funds from a third party to assist in providing a method for certain Chinese shareholders to sell their shares in the Company. The Company entered into a series of convertible promissory notes along with common stock purchase warrants whereby this third party could exercise the conversion option and settles the amount due by receiving shares of stock from these certain Chinese shareholders. The monies borrowed from this third party were deposited into a custodial account that was not controlled by the Company. The Chinese shareholders also deposited their shares with this custodian. The shares transferred to the custodian were at all times, in the opinion of management, sufficient to satisfy the obligations of the convertible promissory notes and the outstanding common stock purchase warrants. All amounts owed this financing arrangement were to be repaid through the conversion options exercised by the third party and by the deliverance of the common shares of these certain Chinese investors. |
| | |
| | During the year 2012, the Company borrowed a total of $ 460,000 from this third party under five separate promissory notes. Each note carried an interest rate of 12% per annum with a maturity date of six months from the date of issuance. Under the terms of the notes, the holder of the note has the option to convert the note to common shares at a discount of 15% from the average market price of the lowest three trading prices for the common stock during the ten trading days prior to the conversion date. The Company also issued a total of 842,500 common stock purchase warrants with an exercise price of $0.50 per share with an expiration date six months from the date of issuance. |
| | |
| | The Company calculated the fair value of the warrants and the beneficial conversion feature utilizing the Black Scholes model at the date of the issuance of each promissory note. The relative fair values were allocated to the warrants and the debt. Accordingly, a discount was created on the debt and this discount will be amortized to interest expense of the life of the debt. Debt discount amortization as of December 31, 2012 was $ 178,867. |
| | |
| | As of December 31, 2012, there was $ 232,000 principal outstanding and accrued interest in the amount of $ 9,764 that was owed under the terms of the promissory notes. The Company has recorded these amounts as payable by the Company with a corresponding asset represented by the value of the shares of the Company held by the custodian at December 31, 2012. |
| | |
| | As of June 30, 2013, there was $0 principal outstanding and accrued interest in the amount of $0 that was owed under the terms of the promissory notes. The Company has recorded these amounts as payable by the Company with a corresponding asset represented by the value of the shares of the Company held by the custodian as of June 30, 2013. |
F - 30
SINO AGRO FOOD, INC.
NOTES TO CONSOLIDATED FINANCIAL STATEMENTS
| 22. | WARRANTS |
| | As indicated in the convertible promissory note footnote, during the year 2012, the Company borrowed a total of $460,000 from a third party under five separate promissory notes secured by personal guarantee of a director. Each note carried an interest rate of 12% per annum with a maturity date of six months from the date of issuance. Under the terms of the notes, the holder of the note has the option to convert the note to common shares at a discount of 15% from the average market price of the lowest three trading prices for the common stock during the ten trading days prior to the conversion date. The Company also issued a total of 842,500 common stock purchase warrants with an exercise price of $0.50 per share with an expiration date six months from the date of issuance. The Company fair valued the warrants on the date of issuances and recorded amounts based on their relative fair values to the debt and to the warrants. The fair value of the warrants was determined using the Black-Scholes pricing model and included the following assumptions |
| Expected annual dividend rate | | | 0.00 | % | |
| Weighted average exercise price | | $ | 0.50 | | |
| Risk-free interest rate | | | 2.00 | % | |
| Average expected life | | | 6 months | | |
| Expected volatility of common stock | | | 80.00 | % | |
| Forfeiture rate | | | 0.00 | % | |
| | The warrants have an exercise price of $0.50 and have a contractual life of 6 months from the date of issuance. The value of the discounts created by the warrants and beneficial conversion feature were $36,113 and $52,118, respectively. The discount related to the beneficial conversion feature will be amortized to interest expense over the life of the debt and the discount for the warrants will be amortized to interest expense over the contractual life of the warrants. The relative fair values were allocated to the warrants and the debt. Accordingly, a discount was created on the debt and this discount will be amortized to interest expense of the life of the debt. |
| | |
| | As of June 30, 2013, the following share purchase warrants were outstanding and exercisable: |
| Expiry date | | Exercise date | | June 30, 2013 | | ||
| | | | | | | | |
| April 9, 2013 | | $ | 0.50 | | | 0 | |
| | Share purchase warrant transactions and the number of share purchase warrants outstanding and exercisable are summarized as follows: |
| | | June 30, 2013 | | Exercise price | | ||
| Number of warrants outstanding as of January 1, 2013 | | | - | | | - | |
| Issued | | | 385,000 | | $ | 0.50 | |
| Exercised | | | - | | | - | |
| Expired | | | (385,000) | | | - | |
| Number of warrants outstanding as of June 30, 2013 | | | - | | | | |
F - 31
SINO AGRO FOOD, INC.
NOTES TO CONSOLIDATED FINANCIAL STATEMENTS
| 23. | OBLIGATION UNDER OPERATING LEASES |
| | The Company leases (i) 2,178 square feet of agriculture space used for offices for a monthly rent of $512 in Enping City, Guangdong Province, PRC, its lease expiring on March 31, 2014; (ii)5,081 square feet of office space in Guangzhou City, Guangdong Province, PRC for a monthly rent of $11,838, its lease expiring on July 8, 2014; and (iii) 1,555 square feet each for two staff quarter in Linli District, Hunan Province, PRC for a monthly rent of $159, its lease expiring on January 23, 2013 and May 1, 2014. |
| | |
| | Lease expense was $38,002 and $14,150 for the three months ended June 30, 2013 and 2012, respectively. |
| | Lease expense was $75,052 and $28,300 for the six months ended June 30, 2013 and 2012, respectively. |
| | |
| | The future minimum lease payments as of June 30, 2013, are as follows: |
| | | June 30, 2013 | | |
| | | | | |
| Year ended December 31,2013 | | $ | 76,004 | |
| Year ended December 31,2014 | | | 85,038 | |
| Thereafter | | | - | |
| | | $ | 161,042 | |
| 24. | BUSINESS COMBINATION |
| | Business combination of JFD |
| | |
| | On February 28, 2011, TRW applied to form a corporate joint venture, Enping City Bi Tao A Power Fishery Development Co., Limited (“EBAPFD”), incorporated in the PRC. TRW owned a 25% equity interest in EBAPFD. On November 17, 2011, TRW formed Jiang Men City A Power Fishery Development Co., Limited (“JFD”) in which it acquired a 25% equity interest, while withdrawing its 25% equity interest in EBAPFD. As of December 31, 2011, the Company had invested $1,258,607 in JFD. JFD is engaged as an operator of an indoor fish farm. Prior to December 31, 2011, JFD has not commenced its principal business activity. Management did not retain a specialist or valuation expert to value the purchase of this additional 25% interest. As of January 1, 2012, JFD had not commenced its principal operations and was in the process of finalizing the construction of the indoor fish farm facilities. Management determined that the fair value of the assets approximated the historical cost carried on the books of JFD. On January 1, 2012, the Company acquired an additional 25% equity interest in JFD for total cash consideration of $1,662,365. On April 1, 2012, the Company acquired an additional 25% equity interest in JFD for the amount of $1,702,580.The Company presently owns a 75% equity interest in JFD and controls its board of directors. As of January 1, 2012, the Company had consolidated the assets and operations of JFD. |
F - 32
SINO AGRO FOOD, INC.
NOTES TO CONSOLIDATED FINANCIAL STATEMENTS
| 24. | BUSINESS COMBINATION (CONTINUED) |
| | Business combination of JFD(Continued) |
| | |
| | Second acquisition on January 1, 2012 – 25% additional equity interest in JFD. |
| | |
| | The Company allocated the purchase price on the fair value of the assets acquired as of January 1, 2012. |
| Net assets at fair value acquired: | | | | |
| Property, plant and equipment | | $ | 34,919 | |
| Construction in progress | | | 4,495,306 | |
| Inventory | | | 1,838,337 | |
| | | | 6,368,562 | |
| Less: Other payables | | | (92,603) | |
| Non-controlling interest | | | (3,324,729) | |
| 25% held by the Company | | | (1,662,365) | |
| | | $ | 1,288,865 | |
| | | | | |
| Satisfied by | | | | |
| Purchase consideration | | $ | 1,662,365 | |
| Less: Cash acquired | | | (373,500) | |
| | | $ | 1,288,865 | |
F - 33
SINO AGRO FOOD, INC.
NOTES TO CONSOLIDATED FINANCIAL STATEMENTS
| 24. | BUSINESS COMBINATION (CONTINUED) |
| | Business combination of JFD (Continued) |
| | |
| | Third acquisition on April 1, 2012 – 25% additional equity interest in JFD. |
| | The Company allocated the purchase price based on the fair value of the assets acquired as of April 1, 2012. |
| Net assets at fair value acquired: | | | | |
| Property, plant and equipment | | $ | 33,535 | |
| Construction in progress | | | 4,499,376 | |
| Inventory | | | 1,970,387 | |
| Accounts receivable | | | 1,337,519 | |
| | | | 7,840,817 | |
| Less: Other payables | | | (292,663) | |
| Accounts payable | | | (1,230,096) | |
| Non-controlling interest | | | (1,702,580) | |
| 50% held by the Company | | | (3,405,159) | |
| | | $ | 1,210,319 | |
| Satisfied by | | | | |
| Purchase consideration | | $ | 1,702,580 | |
| Less: Cash acquired | | | (492,261) | |
| | | $ | 1,210,319 | |
| | Business combination of JHMC |
| | |
| | Second acquisition on September 30, 2012 - 50% additional equity interest in JHMC |
| | |
| | On April 15, 2011, MEIJI applied to form Enping City A Power Cattle Farm Co., Limited (“ECF”), all of which the Company would indirectly own a 25% equity interest in on November 17, 2011. On September 17, 2012 MEIJI formed Jiang Men City Hang Mei Cattle Farm Development Co., Limited (“JHMC”) in which it owns 75% equity interest with investment $4,020,665 while withdrawing its 25% equity interest in ECF. As of September 30, 2012, the Company had consolidated the assets and operations of JHMC. |
| | |
| | The Company allocated the purchase price based on the fair value of the assets acquired as of September 30, 2012. |
F - 34
SINO AGRO FOOD, INC.
NOTES TO CONSOLIDATED FINANCIAL STATEMENTS
| 24. | BUSINESS COMBINATION (CONTINUED) |
| Net assets at fair value acquired: | | | | |
| Property, plant and equipment | | $ | 512,450 | |
| Construction in progress | | | 4,177,007 | |
| Inventory | | | 671,429 | |
| | | | 5,360,886 | |
| Less: Non - controlling interest | | | (1,340,221) | |
| | | $ | 4,020,665 | |
| Satisfied by | | | | |
| Purchase consideration | | $ | 4,020,665 | |
F - 35
SINO AGRO FOOD, INC.
NOTES TO CONSOLIDATED FINANCIAL STATEMENTS
| 25. | STOCK BASED COMPENSATION |
| | On August 16, 2012, the Company issued employees a total of 100,000 shares of common stock valued at fair value of range from $0.40 per share for services rendered to the Company. On the same date, the Company issued 806,000 shares of common stock to a company to provide consulting services for the benefit of the Company. The fair value of the common stock issued was determined by using the trading price of the Company’s common stock on the date of issuance of $0.40 per share. |
| | |
| | The Company calculated stock based compensation of $2,501,457 and $4,278,114, and recognized $90,600 and $1,069,529, $181,200 and $2,139,058 for the three months and six months ended June 30, 2013 and 2012, respectively. As of June 30, 2013, the deferred compensation balance was $90,600 and the deferred compensation balance of $90,600 was to be amortized over 3 months beginning on July 1, 2013. |
| 26. | CONTINGENCIES |
| | As of June 30, 2013 and December 31, 2012, the Company did not have any pending claims, charges, or litigation that it expects would have a material adverse effect on its consolidated balance sheets, consolidated statements of incomes and other comprehensive income or cash flows. |
| 27. | GAIN ON EXTINGUISHMENT OF DEBTS |
| | The Company executed several agreements with third parties to settle debts by issuance of the Company’s common stock. The shares issued by the Company were valued at the trading price of the stock on the date the shares were issued. Any excess of the fair value of the shares over the carrying cost of the debt has been reported as a gain on the extinguishment of debts of $498,025 and $562,361 has been credited to consolidated statements of income as other income for the three months ended June 30, 2013 and 2012, respectively. Any excess of the fair value of the shares over the carrying cost of the debt has been reported as a gain on the extinguishment of debts of $1,051,013 and $817,513 has been credited to consolidated statements of income as other income for the six months ended June 30, 2013 and 2012, respectively. |
| 28. | RELATED PARTY TRANSACTIONS |
| | In addition to the transactions and balances as disclosed elsewhere in these consolidated financial statements, during the six months ended June 30, 2013 and 2012, the Company had the following significant related party transactions:- |
| Name of related party | | Nature of transactions |
| | | |
| Mr. Solomon Yip Kun Lee, Chairman | | Included in due to a director, due to Mr. Solomon Yip Kun Lee is $3,257,085 and $3,345,803 as of June 30, 2013 and December 31, 2012, respectively. The amounts are unsecured, interest free and have no fixed term of repayment. |
F - 36
SINO AGRO FOOD, INC.
NOTES TO CONSOLIDATED FINANCIAL STATEMENTS
| 29. | EARNINGS PER SHARE |
| | Basic earnings per share is computed by dividing net income attributable to common shareholders by the weighted average number of common shares outstanding during the period. Diluted earnings per share reflects the potential dilution of securities by including other potential common stock, including convertible preferred stock, stock options and warrants, in the weighted average number of common shares outstanding for the period, if dilutive. The numerators and denominators used in the computations of basic and dilutive earnings per share are presented in the following table: |
| | | Three months ended | | Three months ended | | ||
| | | June 30, 2013 | | June 30, 2012 | | ||
| BASIC | | | | | | | |
| Numerator for basic earnings per share attributable to the Company’s common stockholders: | | | | | | | |
| Net income used in computing basic earnings per share | | $ | 14,330,940 | | $ | 10,290,022 | |
| Basic earnings per share | | $ | 0.12 | | $ | 0.14 | |
| | | | | | | | |
| Basic weighted average shares outstanding | | | 115,366,595 | | | 73,836,392 | |
| | | Three months ended June 30, 2013 | | Three months ended June 30, 2012 | | ||
| DILUTED | | | | | | | |
| Numerator for basic earnings per share attributable to the Company’s common stockholders: | | | | | | | |
| Net income used in computing basic earnings per share | | $ | 14,330,940 | | $ | 10,290,022 | |
| Basic earnings per share | | $ | 0.12 | | $ | 0.13 | |
| | | | | | | | |
| Basic weighted average shares outstanding | | | 115,366,595 | | | 73,836,392 | |
| Add: weight average Series B Convertible preferred shares outstanding | | | 7,000,000 | | | 7,000,000 | |
| Diluted weighted average shares outstanding | | | 122,366,595 | | | 80,836,392 | |
F - 37
| 29. | EARNINGS PER SHARE (CONTINUED) |
| | | Six months ended | | Six months ended | | ||
| | | June 30, 2013 | | June 30, 2012 | | ||
| BASIC | | | | | | | |
| Numerator for basic earnings per share attributable to the Company’s common stockholders: | | | | | | | |
| Net income used in computing basic earnings per share | | $ | 30,709,712 | | $ | 15,961,484 | |
| Basic earnings per share | | $ | 0.28 | | $ | 0.22 | |
| | | | | | | | |
| Basic weighted average shares outstanding | | | 110,403,819 | | | 71,312,129 | |
| | | Six months ended June 30, 2013 | | Six months ended June 30, 2012 | | ||
| | | | | | | | |
| DILUTED | | | | | | | |
| Numerator for basic earnings per share attributable to the Company’s common stockholders: | | | | | | | |
| Net income used in computing basic earnings per share | | $ | 30,709,712 | | $ | 15,961,484 | |
| Basic earnings per share | | $ | 0.26 | | $ | 0.20 | |
| | | | | | | | |
| Basic weighted average shares outstanding | | | 110,403,819 | | | 71,312,129 | |
| Add: weight average Series B Convertible preferred shares outstanding | | | 8,607,734 | | | 7,000,000 | |
| Diluted weighted average shares outstanding | | | 119,011,553 | | | 78,312,129 | |
| For the three months and six months ended June 30, 2013 and 2012, 0 and 457,000 warrants, respectively were not included in include the number of potentially dilutive securities excluded from the calculation of diluted EPS due to anti- because shares issued in respect of the share warrants exercised was from Chinese shareholders as mentioned in note 21. |
F - 38
| ITEM 2. | MANAGEMENT’S DISCUSSION AND ANALYSIS OF FINANCIAL CONDITION AND RESULTS OF OPERATIONS |
This Quarterly Report on Form 10–Q (the “Quarterly Report”) contains “forward-looking statements,” within the meaning of the Private Securities Litigation Reform Act of 1995 and Section 21E of the Securities Exchange Act of 1934, as amended (the “Exchange Act”).The Company intends such forward-looking statements to be covered by the safe harbor provisions for forward-looking statements contained in Section 21E of the Exchange Act. Forward-looking statements can be identified by the use of forward-looking terminology, such as “estimates,” “projects,” “plans,” “believes,” “expects,” “anticipates,” “intends,” or the negative thereof or other variations thereon, or by discussions of strategy that involve risks and uncertainties These statements reflect management’s current beliefs and are based on information now available to it. Accordingly, these statements are subject to certain risks, uncertainties and contingencies that could cause the Company’s actual results, performance or achievements in 2012 and beyond to differ materially from those expressed in, or implied by, such statements. Such statements, include, but are not limited to, statements contained in this Quarterly Report relating to the Company’s business, financial performance, business strategy, recently announced transactions and capital outlook. Important factors that could cause actual results to differ materially from those in the forward-looking statements include: a continued decline in general economic conditions nationally and internationally; decreased demand for our products and services; market acceptance of our products; the impact of any litigation or infringement actions brought against us; competition from other providers and products; the inability to raise capital to fund continuing operations; changes in government regulation; the ability to complete customer transactions, and other factors relating to our industry, our operations and results of operations and any businesses that may be acquired by us. Should one or more of these risks or uncertainties materialize, or should the underlying assumptions prove incorrect, actual results may differ significantly from those anticipated, believed, estimated, expected, intended or planned. Readers of this Quarterly Report should not place undue reliance on any forward-looking statements. Except as required by federal securities laws, the Company undertakes no obligation to update or revise these forward-looking statements to reflect new events or uncertainties.
You should read the following discussion and analysis of the financial condition and results of operations of the Company together with the financial statements and the related notes presented in Item 1 of this Quarterly Report.
Business Overview, Business Divisions and Progress reports
We introduced our business activity in China in 2006 as an engineering consulting company aiming to and specializing in building agriculture and aquaculture farms and the developments of related business operation using our expertise and knowhow in specific agriculture and aquaculture technologies (e.g., our A Power Re-circulating aquaculture system and technology and our cattle growing feeding and caring technology), engineering designs of, and, management systems for, in-door and outdoor fishery and cattle farms and vegetable farms (based on hydroponic technologies) adaptable to various climate and growing conditions, production of organic, green and natural agriculture produces after having developed many aquaculture fishery farms and cattle farms and related business developments including sales and marketing of produces and products in Australia and Malaysia since 1998.
In all these developments we were the master engineers pioneered the construction and building of farms from bear land into fully operational facilities covering the construction and building of infrastructures, staff quarters, offices, processing facilities, storages, and all related production facilities and their related managements responsible in developing all business activities into effective and efficient operation including all training of personnel.
During the past few years, our Company has matured into a company dedicated to the agriculture and aquaculture industry. We are currently maintaining our operation of the HU Plantation as well as our services in engineering consulting and specializing in the developments of two major products, namely meat derived from the rearing of beef cattle and seafood derived from the growth of fish, prawns (or shrimp) and other marine species having niche markets with revenues generated from activities that we divide into five standalone business divisions or units: (1) Fishery, (2) Cattle, (3) Organic Fertilizer, (4) HU Plantation and (5) Marketing and Trading.
4
Tables of information: The tables below show:
| (1) | Table1Group Corporate Structure as of June 30, 2013, where the boxes marked “Unincorporated project companies” mean that their respective Sino Foreign Joint Venture Company (“SJVC”) has not been formed officially, and that the Company has paida25% deposit as consideration toward their respective acquisitions pending the official formation of their corresponding SJVC scheduled to occur between December 31, 2013 and June 30, 2014, respectively. |
| | |
| (2) | Table (2) shows the abbreviation of the names of the companies. |
| | |
| (3) | Table (3) shows the location of the Company’s businesses |
| | |
| (4) | Table (4) shows the business activities of the Company’s businesses. |
5
| SINO AGRO FOOD, INC. |
| TABLE 1: GROUP CORPORATE STRUCTURE | As of June 30, 2013 |
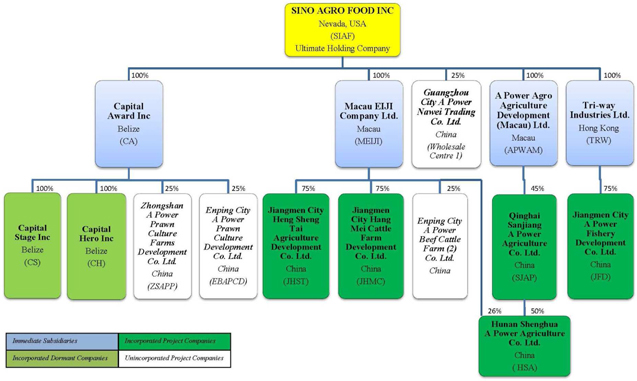
6
TABLE 2: ABBREVIATED NAMES OF THE ENTITIES
| # | Abbreviation | Names of entities | Date of formation |
| | | Incorporated Companies | |
| 1 | SIAF | Sino Agro Food, Inc. | 1974 |
| 2 | CA | Capital Award Inc. | 2003 |
| 3 | MEIJI | Macau EIJI Company Ltd. | 2005 |
| 4 | APWAM | A Power Agro Agriculture Development (Macau) Ltd. | 2007 |
| 5 | TRW | Tri-way Industries Ltd. (Hong Kong) | 2009 |
| 6 | CS | Capital Stage Inc. | 2003 |
| 7 | CH | Capital Hero Inc. | 2003 |
| 8 | JHST or HU Plantation | Jiangmen City Heng Sheng Tai Agriculture Development Co. Ltd. | 2009 |
| 9 | JHMC or Cattle Farm 1 | Jiangman City Hang Mei Cattle Farm Development Co. Ltd. | 2012 |
| 10 | SJAP | Qinghai Sanjiang A Power Agriculture Co. Ltd. | 2009 |
| 11 | JFD or Fish Farm 1 | Jiangmen City A Power Fishery Development Co. Ltd. | 2011 |
| 12 | HSA | Hunan Shenghua A Power Agriculture Co. Ltd. | 2011 |
| | | Unincorporated Project Companies | |
| 13 | Wholesale Center 1 or APNW | Guangzhou City A Power Nawei Trading Co. Ltd. China | 2012 |
| 14 | ZSAPP or Prawn Farm 2 | Zhongshan A Power Prawn Culture Farms Development Co. Ltd. China | 2012 |
| 15 | EBAPCD or Prawn Farm 1 | Enping City A Power Prawn Culture Development Co. Ltd. China | 2011 |
| 16 | Cattle Farm 2 | Enping City A Power Beef Cattle Farm 2 Co. Ltd. China | 2011 |
| All “Unincorporated Project Companies” are private companies formed in China with Chinese Citizen acting as their legal representatives as required by company law of China. These companies’ names will be changed in accordance with the names granted by the relevant authorities once their corresponding Sino Foreign Joint Venture company will officially have been formed. | |||
7
TABLE 3:MAP OF THE COMPANY’S ENTITIES
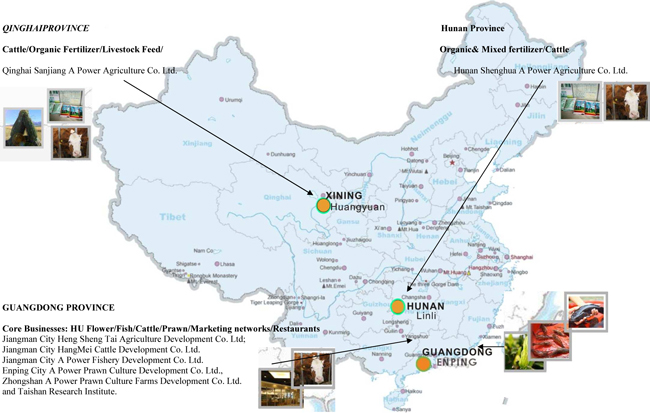
8
TABLE 4: BUSINESS ACTIVITIES OF THE COMPANY’S ENTITIES
| ABBREVIATION | Business activities |
| SIAF | Engineering consulting (in general types of developments), business management, trading, sales and marketing |
| CA | Engineering consulting (mainly in development of fishery), management of fishery operation, marketing and sales of fishery produces and products. |
| MEIJI | Engineering consulting (mainly in cattle farming and vegetable farming), management service and marketing and sales of cattle and related products. |
| APWAM | Holding Company |
| TRW | Holding Company and holders of Technology Licenses. |
| CS | Dormant |
| CH | Dormant |
| JHST or HU Plantation | H U Plantation, Immortal Vegetable farming, processing and sales of produces and products. |
| JHMC or Cattle Farm 1 | Growing of cattle at Cattle Farm 1 which is a demonstration farm |
| SJAP | Existing activities: Manufacturing of organic fertilizer, bulk and concentrated livestock feed, and rearing of cattle and corporative farming Expected added activities by 2014 Slaughter and de-boning of cattle and value added processing of beef products Manufacturing of Enzyme Electricity generation via Mash Gas Station |
| JFD or Fish Farm 1 | Growing of fish (sleepy cod species), eels (Flower Pattern species) and prawns (or shrimp) at Fish Farm 1 |
| HSA | Existing Activities Manufacturing of organic fertilizer, 100% pure organic mixed fertilizer and lake fish farming organic fertilizer. Expected added activities by 2014 Cattle farming |
| Wholesale Center 1 | Marketing, sales and distribution of seafood and meats and related products. |
| ZSAPP or Prawn Farm 2 | Hatchery and Nursery operation of prawns (or shrimp) Growing of prawns (or shrimp) using open-dams applying re-circulating filtration systems. |
| EBAPCD or Prawn Farm 1 | Growing of prawns (or shrimp) |
| Cattle Farm 2 | By year 2014 — Cattle Growing |
9
SUMMARY OF OUR BUSINESS ACTIVITIES CARRIED OUT BY OUR EXISTING OR NEWLY FORMED SUBSIDIARIES.
1. Fishery Division operated by Capital Award Inc. (“CA”)
CA generates revenues from two main activities: “Engineering and Consulting Services” and “Marketing and Sales of Aquatic seafood” described below:
Engineering and Technology Services via Consulting and Service Contracts (“CSC’s”) for the development, construction, supplies of plants and equipment and management of fishery (and prawn or shrimp) farms and related business operation.
CA has entered into numerous CSC’s; their information and status are shown in the table below:
Notes to the developments in progress:
| Name of the developments | | Location of development | | Land area or Built up area | | Current Phase & Stage | | Commencement date of development | | (Estimated) development’s completion date on or before | | Contractual amount | | % of completion as at 30.06.2013 |
| | | | | | | | | | | | | $ | | |
| Fish Farm (1) | | Enping City | | 9,900 m2 | | fully operational | | July. 2010 | | Jun-11 | | $5.3 million | | Fully operational |
| | | | | | | | | | | | | | | |
| Prawn Farm (1) | | Enping City | | 23,100 m2 | | 2 phases | | Phase 1 on June 2011 | | Phase (1) on December 2012 | | $11.6 million | | Phase (1) in operation |
| | | | | | | | | | | | | | | |
| Fish Farm (2) “The Fish & Eel Farm | | Xin Hui District, Jiang Men. | | 33,000 m2 | | 3 Phases | | Phase 1 January 15, 2013 | | Phase 1 June 2014 | | 14.9 million | | 35% |
| | | | | | | | | | | | | | | |
| Prawn Farm (2) The Hatchery & Nusery & Grow-out prawn farm | | San Jiao Town, Zhong San City, | | 120,000 m2 | | 2 phases | | Phase (1) and Phase (2) May 2012 | | Phase (1) Dec. 2012 and Phase (2) December 2013. | | Phase (1) $8.5 m and Phase (2) 8.67 Million | | Phase (1) fully operational and Phase (2) 65% |
| | | | | | | | | | | | | | | |
| Prawn Farm (3) | | Xining City, Qinghai | | Expanded to 10,560 m2 | | Phase (1) | | 41,122 | | Dec-14 | | Pending approval | | 10% |
| | | | | | | | | | | | | | | |
| Wholesale Center (1) | | Guangzhou City | | 5,000 m2 | | One Phase | | 41,030 | | March 2013 | | $3.2 million | | in operation |
| | (a) | Phase 1 development work on a prawn hatchery and nursery farm (Prawn Farm 2) with Zhongshan A Power Prawn Culture Development Co. Ltd. (“ZSAPP”) (a proposed name of this future SJVC), where the Company owns a direct 25% equity interest, was completed in May 2012. Prawn Farm 2 has generated income since May 2012. Phase 2 development works involves development of facilities for the production of prawns, brood stock, and associated expansion activities that were commenced in May 2012 and are expected to be completed during 2013. The work that has occurred during the second quarter of 2013 includes the development of: (i) an additional indoor prawn nurturing apartment, (ii) three brood stock open dams with all under-ground in built filtration systems that is capable to hold up to 3,000 mother prawns at a time, (iii) all external fences of the farm, and (iv) two open dams with all in built filtration systems that has the capacity to grow out up to 12 MT of fish per year and all associated infrastructure. |
| | (b) | The development work on the fish and eel farm (Fish Farm 2) with an unrelated entity, Gao A Power Fishery Development Co. Ltd., is still in progress. The project is delayed because the property is situated on an inlet and drainage is extremely difficult to resolve and costly to fix. We are engineering a solution that should resolve this problem. As of the date of this Quarterly Report, our engineering solution involves a semi-open dam and semi-enclosed farm concept built with groups of independent filtration and water recirculation systems that are suitable for the growing of prawns, fishes and/or eels in this farm. We are dividing work flow into phases and stages of work to yield the optimal financial efficiency and benefits. As of June 30, 2013 the revised development plan was finalized; as such the associated infrastructural work is anticipated to commence during the third quarter of 2013. |
10
| | (c) | The development work on a prawn farm at Huanyuan County, Xining City (Prawn Farm 3) is for an unrelated third party Chinese investor, Wu Aquaculture A Power Development Co. Ltd. (a proposed name for this future SJVC) originally planned to be on SJAP property. All engineering design and related pre-development work has been completed, with original plans to begin construction and infrastructure work in May 2013, after the winter season. However, management decided in February 2013 to relocate Prawn farm 3 to another block of land adjacent to SJAP’s existing property consisting of a much bigger area to accommodate future expansion whenever necessary. This relocation will require the approval of local authorities, resulting in a delay and a new time schedule dependent on the approval by authorities and the said approval is still in progress as of June 30, 2013. |
11
Pictures showing Fish Farm 1
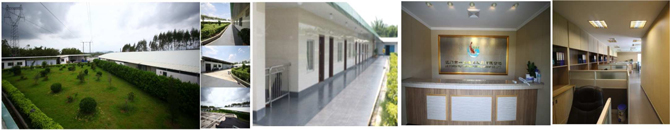
Views of the Fish Farm 1 complex situated on 9,900 m2 of land in district of Enping City. It is a fully self-contained complex showing as one of typical development models being developed in China.
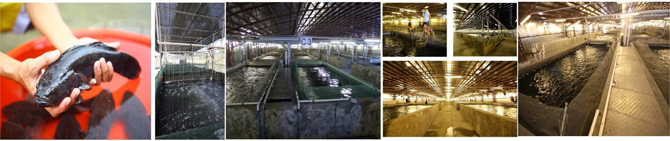
The farm has 16 grow-out APM tanks growing fish in-door and on land with the capacity to grow out over 1,000 MT of fish/year
12
Pictures showing Prawn Farm 1
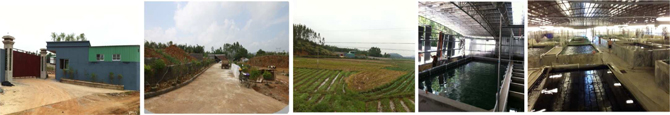
Situated in the district of Enping City on 26,100 m2 of land is our Prawn Farm 1 with a capacity to grow-out 250/300 MT of prawns/year and again is contained in a fully self-serviced complex with office, staff quarters, laboratory, dried and cold storages, stand-by generators’ room, heating rooms, water storage and tanks, landscaping gardens etc.
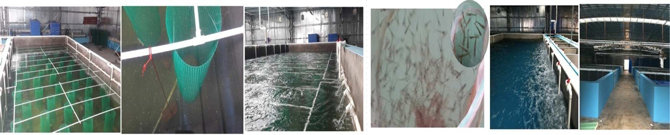
The plastic netting rolls are designed to provide shelter for the prawns and thus to increase the grow out capacity of the tanks.
13
Pictures showing Prawn Farm 2

Prawn Farm 2 has much bigger land bank of 120,000 m2 because apart from its core function of being the hatchery and nursery operation to supply quality prawn fingerling, the farm is now developing open grow-out dams that have in built RAS filtration systems to save on water consumption as well as to provide cleaner water aimed at reducing the impact of pollution.
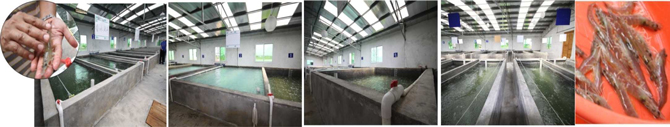
The tanks in the picture are nursery tanks. Each tank has the capacity to nurture up to 10 million prawns every 5 days per 30 cubic liters (or 30 MT) of water. Prawn Farm 2 is also built as a fully self-contained complex with all associated facilities.
14
Marketing and Sales of aquatic seafood:
CA is the sole marketing, sales and distribution agent of the Re-circulating Aquaculture System (“RAS”) fishery and prawn (or shrimp) farms, such that it purchases all marketable sized fish and prawns (or shrimp) from the farms and in term sells them to the wholesale markets and at the same time supplies the farms with fingerling, baby or adult fish or prawns and stock feed.
Our RAS farms do not produce enough fish or prawns (or shrimp) to warrant the establishment and sales of value added processing products or facilities given that the Chinese markets pay the best prices for live fish and prawns (or shrimp). Therefore, currently CA sells only live fish and prawns (or shrimp).
In this respect, CA generates revenues from the sales of seafood brought from farms that are either a subsidiary of the Company or an incorporated project company and contracted growers in the manner described below:
Fish Farm 1: JFD is the owner and operator of Fish Farm 1; the Company presently owns a 75% equity interest in JFD.
Fish Farm 1 complex represents our typical model of developments and is built on a block of land measuring 9,900 m2 containing staff quarters providing accommodation for up to 15 workers, a self-contained office, a laboratory, external live bait holding tanks, all season red worms nurturing tanks, dry and cold storages, workshops, processing facilities, a heating room, 500 MT of water holding tanks, landscape gardens, standby generator and rooms, all related underground and on land infrastructure and a fish grow-out farm of 4,000 m2 that has all associated facilities to support 16 RAS tanks with each tank measuring 10 meter (m) x 10 m x 3 m in depth holding up to 240,000 liters (or 240 Metric Tons (MT) of water and has the production capacity to grow up to 80 MT of aquatic animals per year depending on its stocking cycles (or frequency of stocking of fish) and the initial size of the fish being stocked at each cycle. In other words, if the initial stocked fingerling is around 30/40 mm per fish, then it will take over 12 months to grow the fish into a marketable fish (averaging over 500 gram/fish) such that its annual production is only up to 30/35 MT/tank; however if the initial fish being stocked are at an average of 200 to 300 grams each then its stocking and harvesting cycle is 4 times per year, enhancing annual production capacity at up to 80 MT/tank. Initially, Fish Farm 1 was designed to grow sleepy cod, which had a niche market with most attractive prices in Chinese markets.
However, sleepy cod does not have a large market share in China compared to the carp species. Our market research of the sleepy cod market size in 2012 shows that total annual domestic production is about 25,000/28,000 MT distributed to more than 100 wholesale markets throughout many provinces, with the markets at Guangzhou City, Southern Coastal towns of Guangdong and markets in Shanghai City comprising the dominant markets. From the time we started stocking sleepy cod in 2011 until the end of year 2012, live sleepy cod constituted a niche market in China and sold at wholesale for an average price of US$27/Kg until the cheaper imports from other Asian countries were permitted to be imported to China at low import tax starting in January 2013, such that the wholesale prices fell sharply to an average of US$15/Kg. We mainly had fed live bait fish to our baby sleepy cod (250 to 300 gram each) that we bought from our contracted suppliers at around US$5/fish grown at average feed to weight gain conversion rate of 2.5 Kg of live bait to 1 kg of weight gained. As such, when we purchased our supplies of live bait at an average of US$1.65/Kg, and low mortality rate at the average below 8% coupled with our recorded 3.5 stocking and harvesting cycles per year, Fish Farm 1 consistently achieved good sales revenues with gross profit margin of 50/55 % in 2011 and 2012. However its gross profit margin fell in 2013 to between 35/40 % while the cost of supplies of baby sleepy cod and live bait fell correspondingly by an average of only 10%.
In this respect and in mitigating such situation, during the first quarter of 2013 we stepped up the modification of our RAS tanks to adapt to the growing of eels with 4 tanks and prawns (or shrimp) with 8 tanks and the expansion program in the Research and Development Station to accommodate the nurturing of Flower Pattern Eels’ fingerlings to grow into adult eels (of 500 gram/eel and upward) that would be supplied to Fish Farm 1 to grow the adult eels into marketable sized eels (around 1.5 kg/eel and larger) which at present are selling at high prices between US$27/28 per Kg. Fish Farm 1 is now stocked with and growing Flower Pattern eels, prawns and sleepy cod.
Prawn Farm 1 (or EBAPCD): EBAPCD is the proposed name of the future SJVC (subject to approval by relevant Chinese authorities under our application for SJVC status), established to own and operate Prawn Farm 1. EBAPCD will generate revenue starting during the third quarter of 2013. Capital Award will recognize income from purchases of prawns from Prawn Farm 1 and selling them to the wholesale markets.
15
On April 22, 2013, we placed our first 500,000 (Mexican White) prawn fingerling in Prawn Farm 1, and as of the date of this Quarterly Report management reported that prawns are meeting growth benchmarks with low mortality reaching around 15 cm/prawn in size. The Company believes that its Prawn Farm 1 represents the first indoor RAS prawn farm in Asia. Going forward, Prawn Farm 1 will carry out its rotational stocking and harvesting program targeting to produce between 250/ 300 MT of live prawns in 2013.
We have seen a rapid increase in live prawn prices in the first quarter of this year (averaging 100% increases in prices compared to the corresponding period last year) with current wholesale price averaging US$15/Kg for size of 80s (equivalent to 80 to 90 pieces of prawn/Kg), and prices going up proportionately to sizes of Mexican White prawns, and at a premium rate for popular, but rarer species (e.g., our big giant prawns, Green Prawn, Banana Prawns and Tiger Prawns). The average time required to grow prawns (of Mexican White Species or Big Giant Prawns) from 14-day old fingerlings to marketable sizes in commercial scale at the Prawn Farm 1 under our RAS system is estimated conservatively between 60/70 days, 90/100 days and 120/130 days for sizes of 80s, 60s and 40s, respectively. We believe, but cannot assure you, that we should be able to reduce this estimated grow-out period under our RAS system since the said grow-out period was calculated from and based on information of open-dam prawn farms as we do not have any conclusive commercial grow-out statistic being recorded at Prawn Farm 1 yet. However, we are confident that we shall be able to experience a much lower mortality rate, between 10/20 %, compared to the 50/60% at the open-dam farms.
Prawn Farm 2(or ZSAPP): ZSAPP is also an intended name of the future SJVC (subject to approval by relevant Chinese authorities under our application for SJVC status), established to own and operate Prawn Farm 2. ZSAPP has been generating revenues since May 2012. However, ZSAPP’s financial statements will not be consolidated with ours until approval of this SJVC is formalized, and one of our subsidiaries acquires a majority equity interest therein. However, Capital Award recognizes income from commissions earned from ZSAPP’s sales of prawn fingerling to regional growers who constitute its sole marketing and sales agent.
ZSAPP has been successful during the first quarters of 2013, producing LawZi Prawn (or the Big Giant Prawns) fingerling from the 5,000 pieces breeding stock that were imported from South-East Asian countries. By the second quarter of 2013, the reproduction of the Big Giant Prawns fingerling had become consistent; consequently, we intend to market the Big Giant Prawn flies beginning during the third quarter of 2013 together with the Mexican White fingerling which constituted our main sales in 2012. During the past two years, our research confirmed that the demand and prices of the Big Giant Prawns in the local domestic markets were high (at between RMB450 to 550/10,000 flies in 2012) because supplies of quality Big Giant Prawn fingerling is competitively low compared to Mexican White (at averaged price between RMB150 to 170/10,000 flies in 2012), due to problems of inbreeding. As such, we expect high demand for our Big Giant Prawn flies by the regional prawn growers as they will be the offspring from our 2nd generation breeding stock free from inbreeding problems.
Fish sales generated from purchases with other open-dam growers contracted by Capital Award. Capital Award has been contracting with local aquaculture farms to grow sleepy cod since 2012to present based on a fixed production cost, with recently added eel growing contracts commenced in the first quarter of 2013. There are existing contracts that will provide up to 800,000 pieces of sleepy cod and 600,000 pieces of eels to be sold by Capital Award between 2013 through the early part of 2014. However, Capital Award is exploring similar new contracts consistent with local reliable growers who meet our quality standards targeting to increase its fish sales revenue whenever the opportunity presents itself.
2. The Beef Cattle business of MEIJI:
Similarly to CA, MEIJI has two sources of revenues, its Engineering and Services revenues and its marketing and sales of cattle;
2.1. Engineering and services revenues. These revenues are generated from the Construction and development of Cattle Farm 1 and Cattle Farm 2.
The MEIJI table below shows the latest status of their developments:
16
| Name of the developments | | Location of development | | Land area or Built up area | | Current Phase & Stage | | Commencement date | | Estimated completion date on or before | | Contractual amount | | % of completion as at 30.06.2013 | |
| Cattle Farm (1) | | LiangXi Town, Enping City | | 165,013 m2 | | 2 phases | | Apr-11 | | Dec. 2011 | | $4.17 million | | Fully Operational | |
| Cattle Fram (2) | | LiangXi Town, Enping City | | 230,300 m2 | | 2 Phases | | Feb. 2012 | | March. 2014 | | $10.6 million | | 65% | |
| Cattle Farm (1) external road work | | LiangXi Town, Enping City | | 4.5 Km road | | One Phase | | Sept. 2012 | | March. 2013 | | $4.32 million | | Completed | |
| Cattle Farm (2) External Road work. | | LiangXi Town, Enping City | | 5.5 Km Road | | One Phase | | Sept. 2012 | | March. 2013 | | $5.28 Million | | Completed | |
Enping is situated in the Southern part of China with a semi-tropical climate, and the cattle farm is operated based on our semi-free ranged growing and management system that allows the cattle to roam around and feed in our pasture fields during the mornings and be kept and fed with our formulated aromatic feed in our semi-opened cattle houses during the hot days and nights. This is an entirely different agricultural environment than that of SJAP in Huangyuan, Xining, which has bitterly cold and long winter seasons and where all cattle are being grown in fully insulated cattle houses. The 2012 experience of the JHMC farm showed that the growth rate of the cattle in this environment is faster than in SJAP (averaging 1.78 Kg/day/head in weight gain compares to SJAP’s 1.5 kg/day/head). However Cattle Farm 1 showed higher mortality rates than SJAP (recording 5% in Cattle Farm 1 compared to 0.25% in SJAP). The reason for the higher mortality is due mainly to the change of climate, as Cattle Farm 1 has to buy young cattle from farms situated in the cold Northern part of China where they have ample supply of young cattle at lesser costs, but requiring over 3 days of transportation, such that some of the weaker young cattle could not adapt to the hot climate of Enping and thus could not recover from the journey. To avoid the repetition of this high mortality rate, Cattle Farm 1 is building additional semi-open cattle houses that are equipped with cooling systems as temporary depots to receive the young cattle and to nurture them back to health before they are grown in our normal cattle houses. The other differential aspect between Cattle Farm 1 and SJAP is in the management of environmental impact; SJAP is going to build a mash gas station (estimated by the year end of 2013) to manage all of its cattle waste into electricity with its residue recycled as raw material used in its manufacturing of organic fertilizer, whereas in Cattle Farm 1, the cattle waste is being kept in septic wells that is treated with our enzyme under fermentation process, and then is channeled to fertilize our pasture fields at the farm. JHMC’s waste treatment program is sufficient for the time being as it has enough pasture fields to absorb the waste yielded from limited number of cattle (up to 500 head) being grown on the farm, however as the cattle number increases to exceeding the fields’ fertilizer absorption capacity, an alternative environment treatment plan must be implemented in order that this JHMC farm can grow more cattle.
Cattle Farm 2 will be complementary to Cattle Farm 1 having an additional 76 acres of land suitable for growing our type of pasture (a cross between Elephant and Yellow grass) that has a very high yield rate of over 35 MT/1/6 acre/year, and containing an average of over 9% protein that is very suitable for consumption by cattle. Between the two farms, under normal seasons, they have a capacity to produce up to 30,000 MT of pasture/year collectively that is capable to feed up to 5,000 head of cattle/year based on the consumption rate of average of 6 MT/head/year if the environmental issue mentioned above is resolved properly.
By the end of February 2013, the Company had completed the external road works of about 10 Km leading from the outer-boundary access road to and surrounding the two farms. The development cost of this road was shared at the ratio of 2/3 by Cattle Farm 1 and 1/3 by Cattle Farm 2. This all season road was constructed at the request of the district village committee of Enping City, enhancing corporate social responsibility in our development of the two cattle farms.
17
Pictures showing Cattle Farm 1
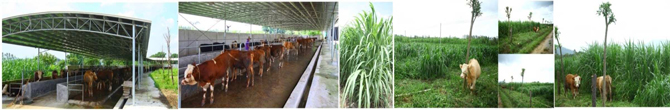
This is our Cattle Farm 1 which was built as a demonstration farm to show that cattle can be raised in a semi-tropical climate using our Semi-grazing and housing method that we call “Semi-free growing” management system” where the cattle are allowed to graze in the field during the early morning and kept indoors and hence away from the hot sun during the hot summer afternoon. So far this method has been proven applicable with the growth rate of the cattle measured slightly better than the cattle at SJAP (i.e., averaging some 0.28 kg/day/cattle better).
2.2. Marketing and sales of live Cattle by MEIJI: Similar to CA in its model of operation, MEIJI purchases fully grown cattle from Cattle Farm 1 and sold them to the cattle wholesalers and brought young cattle from other farmers and sold the young stocks to Cattle Farm 1.
All cattle farms developed by MEIJI will be using its “Semi-free growing” management systems and aromatic-feed programs and systems to raise beef cattle.
Beef is traditionally a niche market in China, as it is sold mainly by expensive restaurants of up market hotels rather than in the homes of China’s consumers. This situation is rapidly changing owing to urbanization and rising incomes, the rising demand for a high protein diet, and the rise in restaurant dining due to work demands.
Our free range cattle grown in the Enping farms are fed with natural pastures, concentrated livestock feed and our Aromatic Feed that contains Chinese herbal plants specially designed to improve animal health such that these Enping farms produce healthy cattle and in turn quality meat. Although we cannot have them certified as pure organic meat yet because we cannot get certification from suppliers of the raw materials used to make our concentrated feed purely organic, we believe that we are not far away from being qualified to obtain 100% pure organic meat certification.
The Enping cattle farms are situated in Guangdong Province, which is not a traditional cattle growing country due to its tropical climate. Most cattle and beef supplies are imported from the Western and Northern Provinces at higher costs entailing higher wholesale and retail prices in Guangzhou City and in its urban cities, which provides marketing advantages for our cattle sales within the region.
Moreover, our 2012 sampled meat trials carried out with a number of reputable restaurants and hotels in Beijing City were well received with constant requests for us to supply them on a long-term basis. Our strategy is to ensure we can supply the quantity to maintain consistently sustainable supplies as required by our customers. At Enping cattle farms we will grow at least 1,000 heads of mature cattle in 2013, which is the minimum number required to sustain the supplies to just a couple of restaurant chains.
According to the China Federal Agriculture Quarterly Report of 2011 the consumption of beef was over 6.48 million MT, 10% of which were premium cuts. Our planned 1,000 head of mature cattle in 2013 will yield approximately 375 MT of meat, which is a tiny fraction of the total market share indicating significant potential for growth in the future.
18
Cattle Farm 1 is doing well and on target having sold, during first half of this year, over 630 heads of mature cattle grown collectively from the stocked six months old calves and the 12 months yearling cattle brought in January and May of 2012, respectively. Out of the total sales of cattle during the first six months of this year, on April 22, 2013, 180 heads of matured beef cattle had been transported to Beijing City to be sold to one of the wholesalers specializing in supplying quality beef meat to top hotel and restaurant chains.
Under a joint venture with a group of businessmen (the “Joint Venture”), we started the setting up of a Cattle Station and related facilities on a block of leased land measuring about 130,000 m2 within the Central Cattle Market and Facility of Beijing City (that we call “The Beijing Cattle Farm”) to act as an intermediate house aiming to house and to grow our Aromatic beef cattle and to sell together with our Aromatic Cattle from Cattle Farm 1 through regional distributors and in turn to some of the top hotels and restaurants chains in Beijing City and also through wholesale shops that the Joint Venture intends to develop. In this respect, the development of wholesale shops fits in well as part of our interstate wholesale and distribution development plan that we mapped for some of the big cities in China, and this one in Beijing City will see the beginning of such plan being put into motion. By July 31, 2013, the Joint Venture established one small wholesale shop within close proximity to the Beijing Cattle Farm and started sales of our beef meats regionally. The Joint Venture Agreement has not been finalized; consequently, the Joint Venture is currently based on a verbal understanding only.
Pictures Taken in July 2013 showing the Beijing Cattle Farm and the Small Wholesale Shop.
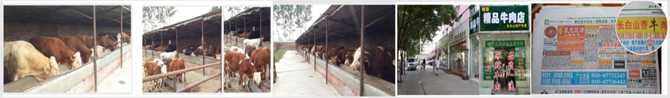
3. SJAP and HSA Division in fertilizer, livestock feed and cattle:
We have two operations in this division spread over two provinces in China, consisting of the following:
3.1 Operation 1. Operation 1 is operated from Huangyuan County of Xining City; Qinghai Province by SJAP, a majority owned subsidiary of the Company incorporated in China in 2009. As of the date of this Quarterly Report, SJAP’S principal activities that are generating revenues comprise: (i) manufacturing and sales of organic fertilizer, (ii) manufacturing and sales of livestock feed, and (iii) rearing and sales of beef cattle. On February 28, 2013, SJAP completed its development of the Concentrated Livestock Feed Manufacturing Factory and started the production and sales of Concentrated Livestock Feed (“CLF”). This CLF couples and complements SJAP’s bulk livestock feed to provide the local cattle and sheep farming industry with a unique and completed feed formula that can cater to the rearing of cattle and sheep at various growing cycles (e.g., specially formulated mixes with efficient nutrients for dairy cows and sheep, weaning, fattening and mature cattle and sheep). The advantage of the formulated feed combination is that the cattle and sheep growers will realize cost savings in production knowing precisely the amount of concentrated feed that will be needed by their livestock, thus avoiding excess concentrated feed being wasted on over feeding, resulting in worthless excess fat in mature animals. In this respect, the Chinese central government has placed an order with SJAP to reserve annually up to 5000 MT of CLF as part of the country’s annual reserve emergency livestock feed inventory. Thus, from March 2013 onward, SJAP expects to have additional revenue generated from the sales of CLF.
The fertilizer, bulk livestock feed and cattle divisions under SJAP contributed 3%, 2% and 10% of the Company’s total revenue and 3%, 2% and 5% of the Company’s total consolidated gross profit, respectively, in 2012 derived from the production of about 4,500 head of mature cattle (between 15 months to 18 months old) from its own cattle houses and the co-operative growers, collectively, 25,000 MT of organic fertilizer, and 22,000 MT of bulk stock feed.
19
Our strategy is to increase the number of co-operative growers and obtain more internal cattle houses and thus to attempt to double the volume of production of mature cattle during 2013, which would in turn increase the demand for the production of fertilizer and bulk stock feed to grow in tandem. The cost of rearing cattle is expected to be lower as a result of concentrating efforts on manufacturing and/or selling livestock feed. The regional farmers are contracted to grow crops and pasture for us using our land that has been provided lease-free by the local Government or by using their own land, use our equipment for their planting and harvesting, are provided supervision and associated services from us, as well as seeds and organic fertilizer. These items are provided to them on credit, which are then charged against their account when the Company purchases the crops and pasture grass from them in return. Regional farmers also raise cattle for us using our bulk livestock feed under the same credit terms and conditions described above. That is, when the Company purchases the mature cattle from them, their accounts are charged for the feed against the amount paid.
The cattle we grow are primarily Simmental (a common breed introduced to China in the early 20thcentury), Charolais, and some Angus cattle. In general, six month old cattle are sold to local farmers, and we commit to repurchasing the cattle between 15 months to 18 months old.
We also rent cattle housing to farmers, and will provide slaughter and deboning services to them once our abattoir and deboning facilities are completed in 2014.
Beef is distributed through wholesalers and through our own or developed restaurants as described elsewhere in this Quarterly Report. SJAP will add sheep farming during 2013 and value added product processing (including abattoir and de-boning facilities in 2013 and value added processing facility in 2014), and aims to expand its steakhouse restaurant “BULL” into a franchisee style chain of 50 outlets over time, whereas currently the one and only “Bull restaurant is to act as SJAP’s first demonstration model converted from one of our old cattle houses situated next to our newly renovated cattle houses at SJAP’s complex. This one Bull has over 130 seating capacity and since its commencement of business operations it is now becoming a popular dining of the locals, having achieved sales of just over $420,000 in year 2012 with net profit of just over $50,000 (or netting about 12%) which is a very small contribute on to the Company’s consolidated revenues and profits. However as SJAP’s first demonstration model it has served the purpose.
Overall, SJAP expects that revenues from operations will increase as a result of the addition of further herds, and of comprehensive value added processing and marketing facilities. SJAP sells its organic fertilizer and bulk livestock feed mainly to its corporative and regional farmers in addition to using it to rear its own grown cattle, but because its geographic location is so far away from other major provinces there are high costs associated with selling its fertilizer, bulk livestock feed and live cattle other than to local purchasers; conversely, equivalent imports from other provinces must be made at a higher cost, which provides SJAP with a competitive edge. Further, Qinghai Province is a region rearing a million head of cattle and sheep per year, providing an ample market for SJAP’s fertilizer and livestock feed.
Our strategy includes building and owning our own abattoir and boning room in 2013 and the value added processing facilities in 2014, meaning that the distribution of our value added beef products to other provinces and main cities will become feasible as we improve our economies of scale to mitigate cost of transportation being charged on net meat weight instead of live cattle weight, and also exploit the lower production cost and leverage of our fully integrated operation and benefit from high sale prices due to its higher meat quality.
SJAP is making progress with the required merit credentials in China to become a certified China Dragon Head Business, which is a prestigious certification granted by the Government to businesses demonstrating corporate social responsibility (“CSR”) by 2014, frequently leading to additional governmental grants and other forms of assistance. Qinghai Province has bigger numbers of ethnic minorities receiving proportionately higher grants, incentives, assistances and subsidies from the Government, and SJAP has been well supported by the Government due to our CSR. In line with the focus on food security and managing the imbalance between rural (i.e., agrarian) and urban communities, this development will only enhance SIAF’s niche market position.
In the longer term, we believe that wholesale prices of SJAP’s fertilizer and bulk livestock feed will maintain a steady growth rate of 5% to 10% per annum influenced mainly by rising labor cost of the country. Further, we expect a trend of continuous increases in beef and cattle prices given the increase in demand for quality beef and beef products (including value-added products) in tandem with the rise of living standards in China, the short supply of quality breeding stock that will be required to produce enough cattle to satisfy the increased demand and the Government’s stringent restrictions placed on imported cattle and beef meat from many developed nations due to disease and quarantine control measures, all of which will influence the price rise in cattle and beef meats in China.
20
In 2012, we have seen the wholesale prices ramp up from an average of RMB 16/Kg for live cattle and RMB 36/Kg for beef meat in January 2012 to an average of RMB 32/Kg of live cattle and RMB 55/Kg of beef meat at the end of February 2013, representing a rise of 100% in live cattle and 53% in beef meat prices. We do not expect prices to rise continuously at such a rate, but it is reasonable to assume rate increases to be between 10% to 15% per year for the next three years.
Progress reports:
Additional revenues are being generated from our newly built Concentrated Livestock Feed (“CLF”) factory. This factory is designed with an annual production capacity up to 60,000 MT, and it had produced and sold over 10,000 MT of CLF at an average price of RMB 2,600/MT (or US$419/MT) for the period of six months ended June 30, 2013.
Work on the construction of all 29 cattle houses and related facilities is progressing and targeted for completion during 2013 (from our present 12 cattle houses) that will have the capacity to house up to 2,500/3,000 heads of cattle at any one time. Collectively, these cattle houses will be able to rear up to 6,000 heads of marketable sized cattle annually (estimated at average weight of about 750/800 Kg per head) based on a six months rotational stocking and sales program growing from cattle averaged at 350/400 Kg per head. SJAP’s intention is to lease part of the cattle houses to the corporative growers to grow their own cattle, with SJAP supplying them with feed and associated services in veterinary, management and marketing of their grown cattle. Apart from this cattle house operation, SJAP will continue to promote its concept of the corporative growers in tandem with the increase of productivity of its livestock feed.
We cultivate an additional 1,500 acres of land, for a total over 6,500 acres of land that will be harvested in 2013. All of this land was granted rent-free to SJAP by the local government.
We saw an increase in demand for our organic fertilizer this year resulting in doubling shift work at SJAP’s fertilizer factory since mid-February to meet the sales of 30,000 MT for 2013.
SJAP received a business permit from the Chinese authorities on April 17, 2013, and construction commenced on April 21, 2013 on the abattoir, de-boning factory, and related packaging facility. Since it is rare and difficult to obtain a permit for an abattoir facility in China, having this facility is expected to become a very valuable asset.
The construction of our Enzymes factory is targeted to start during the third quarter of 2013 and the construction of a Mash Gas station is targeted to start during the fourth quarter of 2013.These are essential supporting activities to recycle our cattle wastes to be applied as raw materials for the manufacturing of our organic fertilizer and to further extend our Corporate Social Responsibility to provide free electricity to the regional district within close proximity to our existing complex. In this respect, the Government agreed to provide a grant of up to US$2 million to cover part of the development cost of the Mash Gas Station.
21
Pictures showing SJAP’s operation and complex
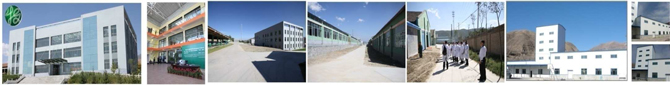
The Corporate office building, the Cattle Station and the concentrated livestock feed manufacturing factory
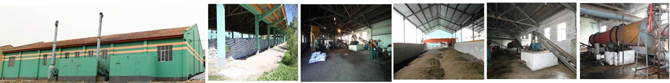
The organic fertilizer factory
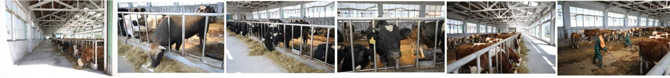
The cattle houses -we now have over 12 cattle houses with each to house over 150 heads with more cattle houses being built
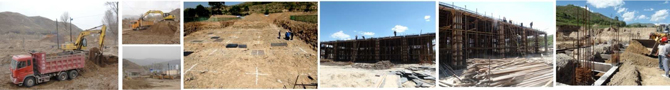
Construction site and construction in progress of the slaughter house and deboning factory as at July 30, 2013
22
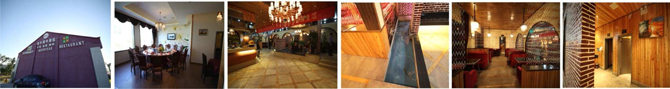
The “Bull” restaurant next to our Cattle Station.
3.2 Operation 2. Operation 2 is operated in Linli District, Hunan Province, by Hunan Shenghua A Power Agriculture Co. Ltd. China (“HSA”), a 76% owned subsidiary. As of the date of this Quarterly Report, HSA conducts the following business activities, both of which are in the development stage: (i) manufacturing and sales of organic and mixed fertilizer, and (ii) cultivation of pastures and crops in preparation for the establishment of beef cattle farm. By January 2013, its first organic fertilizer production plant was established and started its production of organic fertilizer. On March 5, 2013, HSA secured the rights to use an enzyme developed by a Hong Kong Company some twenty years ago that has been utilized by global manufacturers of organic fertilizer. The advantage of this particular enzyme is that when it is applied to our organic fertilizer it has the ability to convert part of the organic raw materials into potash and phosphate without having to add in chemically formulated potash and phosphate, such that our end fertilizer can be qualified as pure organic fertilizer made with 100% natural organic raw materials. With this pure organic fertilizer HSA is in a position to fully explore the potential market for fish in farm lakes and thereby to attempt to align itself with the Government’s policy of encouraging Lake Fish Farmers to use pure organic fertilizer instead of chemical fertilizers. In addition, cost savings from avoiding the use of chemical potash and phosphate will in management’s belief result in a better profit margin for the Company. Sales of pure organic fertilizer commenced during the fourth week of March, 2013.
Currently, chemical fertilizers in the region are wholesale between RMB 3,000 to 3,600/MT depending upon their chemical composition and our old organic fertilizer from SJAP was sold at an average of RMB1,200 to RMB1,300/MT. Our new 100% pure organic fertilizer with up to 8% potash is currently being marketed between RMB 2,000 to RMB 2,200/MT targeting to reach an average up to RMB2,600/MT such that its prices will be at the mid-range of organic and chemical fertilizer.
HSA is targeting to produce up to 30,000 MT of 100% pure organic fertilizer in 2013 under its newly completed production plant and facilities aiming to increase its capacity to about 90,000 MT/year in stages by 2015 subject to its sales performance within the period. The main hardship related to selling fertilizer is the requirement to provide longer credit terms (sometimes up to 180 days) to our end buyers because these end users normally can afford to pay for them only after they sell their products; however only farmers who are assessed as creditworthy by us and who plant their fields and follow our requirement to harvest crops each year are considered.
Development of HSA in Linli District, Hunan Province is modeled like SJAP but it has a much better environment, being situated in a farming rich province that is next to the Guangdong Province and benefits from cheaper logistic costs, being closer to markets, having a more favorable climate (milder winters and longer summers compared to SJAP’s long bitterly cold winters and short summers), and being closer to large markets. However financial support from the Government is more difficult to obtain due to there being more entities sharing the Government’s support provisions.
HSA had to endure both higher development costs and longer time to construct its facilities when compared to SJAP, whose property had 40 older (yet salvageable) buildings, which it has renovated to meet its needs.
Hunan Province is one of the biggest primary producing provinces of China with over 4 million primary producers producing rice, tea, tobacco, grapes, citrus, cotton, seedlings, sunflowers, herb plants and many varieties of cash crops and it has a long standing history in lake aquaculture producing millions of tons of fish and other seafood annually (e.g., total primary production is over RMB450 Billion, or about US$75 Billion) recorded in 2011 (as announced by Hunan Province Agriculture Department).
23
Progress report:
At our newly built fertilizer factory, the 100% pure organic mixed fertilizer (“POMF”) is generating Stable income and revenues aiming to reach its 2013 target of 30,000 MT. By the end of June 2013, HSA produced and sold more than 9,000 MT of POMF at an average price above RMB 2,500/MT (or US$403/MT) collectively during the first six months of 2013.
Work on the construction and development of a cattle station commenced in March 2012 with preparation work in progress being carried out on its general layout, cultivation and planting of crops and pasture on 75 acres situated below the hill of the fertilizer factory, and hill leveling and cutting within the hill next to the fertilizer factory where the cattle houses will be built, which work is presently in progress.
Pictures showing HSA’s complex and operation
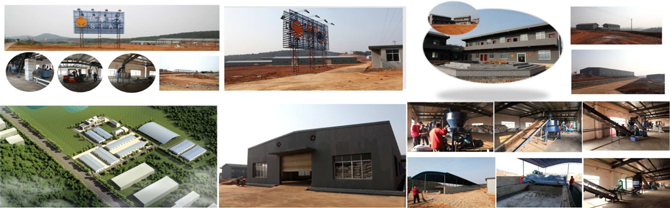
4. Hylocereus Undatus (“HU”) Plantation
JHST, an SJVC that is 75% owned by MEIJI, is consolidated as a subsidiary, and is the owner and operator of the Hylocereus Undatus Plantation (the “HU Plantation”), which is situated at Enping City, Guangdong Province. In 2012, JHST contributed 9% and 10% of the Company’s revenue and gross profit, respectively. The plantation was developed in 2008 with revenues being generated since year 2009. As of the date of this Quarterly Report, JHST has two types of operations; (i) growth and sales of flowers, and (ii) drying and value added processing and sales of HU flower products. Hylocereus Undatus is commonly referred to as Dragon Fruit plants.
The HU Plantation has been suffering from plant disease over the past two years, which resulted in a reduced yield of HU flowers. The Company tried to overcome this problem with various preventive trials in 2012 (such as green housing, re-planting, change of fertilization program and anti-disease spraying from Malaysia, etc.) with few positive results. Although the overall harvest of 2012 was better than in 2011, it was still far below the harvest of 2010. In fact, the HU Plantation’s 2012 revenue and earnings were mainly supported by the sales of additional dried HU flowers processed from fresh HU flowers that were bought from regional growers. Since October 2012 after the harvesting a season of HU flowers, the Company has dedicated its effort to finding a viable solution to this disease problem, and by the end of February 2013, the Company believes that a solution was found. We started to implement the developments accordingly from March 2013 on the HU Plantation with the aim to rectify the situation before the start of the new harvest season beginning in June 2013.
24
JHST cultivates 187 acres of Hylocereus Undatus, or Dragon Fruit (cacti) flowers in Guangdong Province. Dragon Fruit flower for a very short period, sometimes only one night, and must be picked before they turn from green to white 20 to 25 cm long flowers, so they are by definition a fairly delicate crop. The harvesting season is from July through October.
Dragon Fruit cacti take three years to reach maturity, though they will flower a little even in their first year, and can produce for as long as twenty years. JHST began planting in late 2007, and by 2013 all of the plants are matured plants (averaging over 4 years old). To date, the product has been sold in the form of dried flowers, which are used in health-related soups and teas, and fresh flowers, consumed as vegetables in China.
Currently, fresh flowers are sold to regional wholesale and retail markets due to their short shelf life, whereas dried flowers are sold after they are dried and packed to a few major wholesalers who in turn distribute them to other wholesale and retail markets and export traders right through the winter and spring months (from October to June each year) in Guangdong Province. In this respect, it is a distinctly seasonal revenue product, as more than half of the division’s revenues are recognized in the third quarter, and no sales are made in the first quarter.
It was originally forecasted that by 2014, dried and pickled flowers would make up 96% of the division’s flower income as produce is diverted away from delicate fresh flowers. However, the planting of a special Chinese herb (called XueYingZi and commonly referred to as “Immortal Vegetable” in China), which is rich in selenium, among the HU Plants is expected to help to prolong the shelf life of the fresh flowers from 2-3 days up to 12-14 days, which will increase the sales of fresh flowers that are delicious to eat as fresh vegetables and commonly accepted as quality gourmet vegetables.
We expect this improvement of shelf life of the HU flowers to gradually even out our sales of dried flowers and fresh flowers through the harvest season starting in late June to October of each year and leave our drying and processing facilities extra time to process more flowers that we intend to buy from other regional growers so as to increase our overall revenue from 2013 onwards. Beginning in June 2013, JHST will also add the sales of the Immortal Vegetables planted now, which we expect to harvest within two and half months followed by the replanting of two more crops in 2013 and thereafter 4 crops/year in subsequent years.
Given this progress of improvements, JHST is attempting to eliminate the factor of seasonality in revenue. The overall market situation for HU flowers is that demand is greater than supply due to the following reasons; (i) in Guangdong Province, HU Plants can only be grown commercially along certain districts where there were over 40,000 acres of HU Plantation back in 2005, but due to the growth of industrialization and modernization acreage is now less than 4,000 acres, and (ii) farm laborers are getting harder to find, coupled with the increase of cost of wages and salaries, the rapid rise of the land cost and the increase cost of farm developments, making it extremely difficult to start a large HU plantation. For these reasons we are anticipating prices of dried HU flowers to enjoy a steady rise at an average rate of 8 to 12% per year, which has been the trend since 2009.
Progress report
We expect a much improved performance in 2013.
Our field revitalization program has been carried out on the HU plantation since early March 2013 with certain work still in progress; on April 22, 2013, management reported seeing marked improvement in the field with healthy green everywhere as compared to last year’s concentration of yellow colors.
25
Coupling this improvement to the HU plants and the extra revenues that will be generated from the “Immortal vegetables” being planted now, we are optimistic and targeting an increase of at least 25% in revenue on the plantation itself in 2013 (excluding flowers that will be brought from regional growers for drying and sales of dried flowers).
Construction of the expansion of the drying and packaging factory of the HU Plant division will commence at sometime in June or early July this year after we have completed the field revitalization work. As of the date of this Quarterly Report, we had built and started to use three new driers and basic infrastructural works around the site of the packaging factory are in progress expecting completion by the end of 2013.
Pictures showing the HU Plantation and Immortal vegetable farm

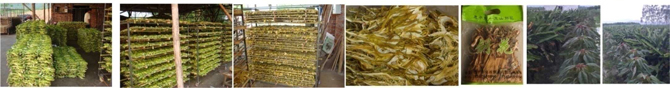
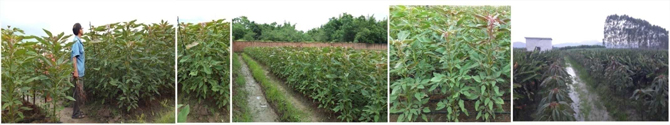
26
By the fourth week of July, 2013, Immortal Vegetables (the Japanese name for Immortal Vegetables is “Snowsakurako”) are almost 1.6 meter tall and look good. We are now trying to pack these into small gift packs – selling them as Organic vegetables. Latest laboratory test results showing each Kg of fresh Immortal vegetables contains 0.58 gram of selenium should also add value to their sales. Upon close inspection, one can see there are Immortal vegetables grown in between the HU Plants acting as a protector for the HU plants because the Immortal Vegetables have the ability to repel the diseases that live in the HU Plants. As such, the HU Plants are healthy looking and flowering nicely despite the fact that the region experienced more rain this year than last year, yet the HU Plants are still holding up well.
| 5. | The Corporate (or SIAF) Division |
From the last quarter of 2012 the Company decided to generate the following business income to fund its shared services operations’ working capital annual budget:
The Wholesale and Distribution Facilities development project including design, construction and project management of its business operation of a specialist modern beef wholesale and distribution center (Wholesale Center 2) for Guangzhou City NaWei trading Co. Ltd (“NWT”), an unrelated Chinese third party owned company situated at the Guangzhou City, LiWan District, New Wholesale Market. Work started in November 2012, and as of the date of this Quarterly Report, we have completed a freezing room facility that has the capacity to store up to 150 MT of frozen food at -25 degrees Celsius with renovation and alteration work progressing on other facilities (e.g., wholesale shop, packaging and processing facility, office, dry good storage and function room).
| (1) | The Central Kitchen and related facilities development project including design, construct, project management of development and management of business operation for Guangzhou City Wangxiangcheng (“WXC”), an unrelated Chinese company, of a Central Kitchen, a Central Bakery, a fast food restaurant and 3 mobile food stores (Central Facility 1) situated adjacent to Wholesale Center 2. Work started in November 2012, and as of the date of this Quarterly Report, about 80% of the construction work was completed. |
| | |
| (2) | The Restaurant development project including design, construct, project management of development and management of its business operation for WXC. As of July 30, 2013, Restaurant 1 at River South District has been operating for over 18 months, Restaurant 2 (at the UU Park Complex, Tianhe District) has been in operation for 10 months, Restaurant 3 (at the Sporting Complex, Tianhe District) has commenced operation since March 2013, the work at Restaurant 4, which is located at Harbor City Shopping Center, Guangzhou City, is almost completed and is targeted to open for business by end of August 2013, design and construction plans for Restaurant 5 (located at the center of Zhungzhen City, about a 35 minute drive from the Guangzhou City) have been submitted to the authorities for approval targeting construction work to start in August 2013, and Restaurant 6 (at the Li Wan District, next to Wholesale Center 1) will start renovation work by September 2013. Collectively, these 6 restaurants cover a total gross area of 5,800 m2 (about 63,800 ft2) with seating capacity for 1,370 persons. |
Pictures below show the restaurants that we developed
| Restaurant (1) | Restaurant (2) | Restaurant (3) | Restaurant (4) |
27
| (3) | We are constructing a trading complex for the Import and Export trades of the Company itself at another building adjacent to the Wholesale Center 1 and 2 (the “Trading Center”). As of the date of this Quarterly Report, the Trading Center is importing frozen and fresh chilled and live seafood (i.e. cuttlefish, squid, prawns, salmon, crabs and eels) from Malaysia, Thailand, Russia and Madagascar and other local coastal fishing towns, that were sold to Wholesale Center 1 for Wholesale Center 1’s distribution and sales into various reputable food chain outlets, wholesale market stores and super market chains in the Guangzhou City, Shanghai City as well as in the southern coastal towns of the Guangdong Province. |
We expect to be appointed the turnkey solution provider given our current success on existing projects with our Chinese investor who owns the WXC’s development plan to develop over 50 gourmet restaurants and fast food outlets collectively within 2 years (2013 to 2014) and (via NWT) is planning on the development of a number of modern health food department chains in the Guangzhou City during2014 and 2015with SIAF as its engineering consultant, management service provider, and marketer. As such, we expect SIAF’s business and engineering development division to be kept busy for the next 3 years. At the same time we are aiming to develop our import and export trades and the seafood value added trades in harmony with WXC’s and NWT’s developments to maintain our growth rates in the sales of fish, seafood and beef products to gain momentum in materializing our business vision of vertically integrated operations.
Progress reports:
The import and export trading of SIAF:
During the first half year of 2013, we made good progress in the marketing and distribution channels having sold collectively over 50 x 40 ft. sea containers (approximately 1,000 MT) of imported frozen seafood including prawns (or shrimp), squids, octopus, and varieties of fish from Malaysia, Thailand, Norway and Vietnam and from local brokers and agents that were sold to Wholesale Center 1 for it to sell and distribute to various reputable clients in Super Market Chains, Central Kitchen of Restaurant Chains and multiple number of seafood wholesale markets at some of the populated centers.
We also discovered, during the first quarter of 2013, the potential of sourcing and importing good quality frozen seafood (mainly in fish) as well as in live seafood (including live Flower Pattern eels, Mud-crabs and lobsters) from Madagascar that would provide good profit margins. We had trailed a number of sample shipments (by air cargoes) with good success rates; as such we have sent personnel over to Madagascar to liaise with local suppliers and to investigate the situation a number of times already with the intention to send a permanent team of workers over there to set up packaging and related facilities to explore its potential fully from May 2013.
As of the date of this Quarterly Report, we have established 4 collection centers in 3 major coastal villages (North, West and south coast) and at the city center of Madagascar and managed to import over 37 MT each of Live Crabs and Flower Pattern eels from Madagascar for the quarter ended June 30, 2013.
The Engineering and Consulting services
| ⋅ | Work is in progress with the developments of Wholesale Center (1 and 2). Operations at Wholesale Center 1 (“WSC 1”) commenced during the first quarter of 2013 and is moving along nicely developing varieties of regional clients in the Guangzhou City. During the second quarter 2013, we sold over 200 MT of sleepy cod to WSC 1 for it to sell to wholesalers at the Shanghai Wholesale Market and in this respect the corresponding sales were well received by the Shanghai Market such that our sleepy cod was consistently sold at a premium of about RMB6 to RMB10/Kg above its daily market prices. By July 30, 2013, we rectified WSC 1’s water treatment that it had during the first quarter; as such all of its live fish holding tanks are now functioning and stocked with fish from Fish Farm 1. |
| | |
| ⋅ | Although development work is still in progress on Wholesale Center 2 (“WSC 2”), having completed of its refrigeration facilities, but in the meantime, and during the first quarter 2013, WSC 2 has started to import Simmental variety of beef cuts from Hubei Province to start selling into local food catering chains with the intention to introduce our beef cuts from SJAP at a later date. However, selling frozen meats required special quality certificates and retailing permits that WSC 2 is in the process of applying for, but we discovered that the related certification and permits are extremely difficult to obtain and are not confident that they will be obtained before the end of 2013 or beyond. |
28
As at the date of this Quarterly Report, we believe that all development work carried out within the first half year of 2013 demonstrated good progress including our own Trading Center (which is now operating although part of its finishing work is still in progress), Leonie Chain’s Central Kitchen (as reported above, 80% has been completed) and Central Bakery has been in operation since May 2013, and we have 4 restaurants being completed with work in progress on 2 others. SJAP has completed more than 50% of its construction work on its slaughter house and deboning facilities, HST has completed its revitalization program of its HU Plantation (i.e., new irrigation systems with automatic sprinkle, replacing with organic soil, planting with immortal vegetables in between each roll of the HU plants, extension of staff quarters such that it has accommodation now for more than 40 workers at one time), planned 13 acres of Immortal Vegetable and built associated nursery, commencement of production from Prawn Farm 1, started operation of the Beijing Cattle Farm and wholesale shop, Prawn Farm 2 completed 3 prawn grow-out open dams with RAS systems and the successful breeding of fingerling of Big Giant Prawns from our 2nd generation brood stocks, the establishment of facilities in Madagascar and the successful production of the Lake Fish organic fertilizer. We view the foregoing developments as a giant step forward building strong fundamentals for the Company’s future growth.
Consequently, we are seeing the 5-year plan play out as envisioned. Particularly at the wholesale level in the fishery and beef divisions, economies of scale are being realized. And the benefits of vertical integration are being achieved gradually, most in evidence between the wholesale and distribution levels. These are enhancing the Company’s competitive position. We are beginning to see a multiplier effect generating core sustainable value and adding a layer of corporate maturity and operational reliability, reinforced by all financial metrics continuing to move positively.
Summary of Our Land Assets
| Item | | Owner | | Location | | Project | | Area (acre) | | Nature of Ownership | | Tenure | | Date Acquired | | Expiry Date | |
| Hunan Lot 1 | | Hunan Shenghua A Power Agriculture Co. Ltd. | | Ouchi Village, Fenghuo Town, Linli County | | Fertilizer production | | 31.92 | | Lease | | 43 | | 5-Apr-2011 | | 4-Apr-2054 | |
| Hunan Lot 2 | | Hunan Shenghua A Power Agriculture Co. Ltd. | | Ouchi Village, Fenghuo Town, Linli County | | Pasture growing | | 247.05 | | Management Rights | | 60 | | 18-Jul-2011 | | — | |
| Hunan Lot 3 | | Hunan Shenghua A Power Agriculture Co. Ltd. | | Ouchi Village, Fenghuo Town, Linli County | | Fertilizer production | | 8.24 | | Land Usage Rights | | 40 | | 24-May-2011 | | 23-May-2051 | |
| Guangdong Lot 1 | | Jiangmen City Heng Sheng Tai Agriculture Development Co. Ltd. | | Yane Village, Liangxi Town, Enping City | | HU Plantation | | 8.23 | | Management Rights | | 60 | | 10-Aug-2007 | | — | |
| Guangdong Lot 2 | | Jiangmen City Heng Sheng Tai Agriculture Development Co. Ltd. | | Nandu Village of Yane Village, Liangxi Town, Enping City | | HU Plantation | | 27.78 | | Management Rights | | 60 | | 14-Mar-2007 | | 13-Mar-2067 | |
| Guangdong Lot 3 | | Jiangmen City Heng Sheng Tai Agriculture Development Co. Ltd. | | Nandu Village of Yane Village, Liangxi Town, Enping City | | HU Plantation | | 60.72 | | Management Rights | | 60 | | 18-Apr-2007 | | — | |
29
| Guangdong Lot 4 | | Jiangmen City Heng Sheng Tai Agriculture Development Co. Ltd. | | Nandu Village of Yane Village, Liangxi Town, Enping City | | HU Plantation | | 54.68 | | Management Rights | | 60 | | 12-Sep-2007 | | — | |
| Guangdong Lot 5 | | Jiangmen City Heng Sheng Tai Agriculture Development Co. Ltd. | | Jishilu Village of Dawan Village, Juntang Town, Enping City | | HU Plantation | | 28.82 | | Management Rights | | 60 | | 12-Sep-2007 | | — | |
| Guangdong Lot 6 | | Jiangmen City Heng Sheng Tai Agriculture Development Co. Ltd. | | Liankai Village of Niujiang Town, Enping City | | Fish Farm, HU Plantation | | 31.84 | | Management Rights | | 60 | | 1-Jan-2008 | | 31-Dec-2068 | |
| GuangdongLot 7 | | Jiangmen City Heng Sheng Tai Agriculture Development Co. Ltd. | | Nandu Village of Yane Village, Liangxi Town, Enping City | | HU Plantation | | 41.18 | | Management Rights | | 26 | | 1-Jan-2011 | | 31-Dec-2037 | |
| Guangdong Lot 8 | | Jiangmen City Heng Sheng Tai Agriculture Development Co. Ltd. | | Shangchong Village of Yane Village, Liangxi Town, Enping City | | HU Plantation | | 11.28 | | Management Rights | | 26 | | 1-Jan-2011 | | 31-Dec-2037 | |
| Guangdong Lot 9 | | Jiangmen City Hang Mei Cattle Farm Development Co. Ltd. | | Xiaoban Village of Yane Village, Liangxi Town, Enping City | | Cattle Farm | | 41.18 | | Management Rights | | 20 | | 1-Apr-2011 | | 31-Mar-2031 | |
| Qinghai Lot 1 | | Qinghai Sanjiang A Power Agriculture Co. Ltd. | | No. 498, Bei Da Road, Chengguan Town of Huangyuan County, Xining City, Qinghai Province | | Cattle farm, fertilizer & livestock feed production | | 21.09 | | Land Usage Rights & Building ownership | | 40 | | 1-Nov-2011 | | 30-Oct-2051 | |
| Guangdong Lot 10 | | Jiangmen City Heng Sheng Tai Agriculture Development Co. Ltd. | | Niu Jiang Town Enping City, | | HU Plantation Processing factory | | 6.27 | | Management Right Lease | | 10 | | 1-April-2013 | | 1-April-2023 | |
| Total | | | | | | | | 620.28 | | | | | | | | | |
30
As far as “ownership” of land is concerned, in general all land is owned by the Government. Whereas in urban areas, the land is owned directly by the central Government in rural and suburban areas, the land (agricultural land) is owned by the local village collectives, usually through the villagers’ collective economic organization or the village committees. Uncultivated land in mountain and other remote areas is also Government-owned. Corporate entities and individuals may own the property (building) erected on Government land.
As such, any transferrable rights to the land are in the form of usufructuary rights (i.e., the right to use and enjoy the benefits derived there from for a period of time).
There are several types of usufructuary rights. These include the right to land contractual management (granted by local village collectives for agriculture land), the right to use of construction land (state land in urban areas), etc. The right to land contractual management allows a party the right to possess, utilize, and obtain profits from agricultural land. This right is transferrable, but this land use right is based on agricultural household contracts and cannot be changed arbitrarily for non-agricultural purposes.
A usufructuary right properly granted in accordance with the laws may be transferred, leased, or mortgaged in accordance with the laws and the terms of the land-grant contract.
1. A lease confers on the recipient the same right to use and enjoy the benefits except for the right to own the building erected by the recipient and the right to transfer. In case of government acquisition of the land, the compensation paid by the government for the building will go to the less or, unless the Lease Agreement states otherwise.
The Agreement for the 109.79MU land of HSA is stated to be a lease agreement but the terms therein seem to suggest that HSA is being granted a Management Right.
2 & 3. Land Use Rights and Management Rights confer the same right to use and enjoy the benefits. “Land Use Right” is one granted by the State and usually used in the context of urban land, whereas “Management Right” is granted by local village collectives and the term is usually used in respect of rural land.
4. The term Land Use Right relates to the right to use the land and enjoy the benefits derived there from, whereas Building Ownership Right relates to the right to ownership of the building erected on the land concerned.
SJAP was granted a Land Use Right by the State for the land (state-owned land), and a Building Ownership Right for the buildings erected thereon.
31
SIAF’s Group of Companies - Rented Premises Profiles
| | | Company | | Location | | Usage | | Landlord | | Tenure |
| | | | | | | | | | | |
| 1 | | Sino Agro Food, Inc. Guangzhou Representative Office | | Room 3801, Block A, China Shine Plaza, No. 9, Linhexi Rd., Tianhe district, Guangzhou City | | Head office | | Guangzhou Shine Real Property Development limited Company | | 9 July 2012 to 8 July 2014 |
| | | | | | | | | | | |
| 2 | | Jiangmen City Heng Sheng Tai Agriculture Development Co. Ltd. | | Unit 1-3, Jiangzhou Shuizha Building, No. 19 Jiangjun Rd., Juntang Town, Enping City | | Office | | Enping City Jiangzhou Water Engineering Management Department | | 1 April 2013 to 31 March 2018 |
| | | | | | | | | | | |
| 3 | | Jiangmen City A Power Fishery Development Co. Ltd. | | Room 202, Finance Building Chang’an Street, Niujiang Town, Enping City | | Office | | The Economic Development Office of Enping Government | | 15 July 2011 to 14 July 2016 |
| | | | | | | | | | | |
| 4 | | Jiangmen City Hang Mei Cattle Farm Development Co. Ltd. | | Unit 4-5, Jiangzhou Shuizha Building No. 19 Jiangjun Rd., Juntang Town, Enping City | | Office | | Enping City Jiangzhou Water Engineering Management Department | | 1 June 2012 to 30 June 2017 |
Consolidated Results of Operations
Part A. Consolidated Results of Operations for the three months ended June 30, 2013 compared to the three months ended June 30, 2012
Revenue
Revenue including increased by $29,052,042 or 114.61% to $54,400,329 for the three months ended June 30, 2013 from $25,348,287 for the three months ended June 30, 2012. The increase was primarily due to the natural growth of revenue generated from our fishery, plantation, beef, organic fertilizer, cattle farm, beef and corporate and others operations and the maturity of on-going divisional businesses improving their revenues.
The following chart illustrates the changes by category from the three months ended June 30, 2013 to the three months ended June 30, 2012.
| Revenue | | | | | | | | |||
| | | 2013 | | 2012 | | | | |||
| Category | | Q2 | | Q2 | | Difference | | |||
| | | $ | | $ | | $ | | |||
| Fishery | | | 17,904,106 | | | 15,799,765 | | | 2,104,341 | |
| | | | | | | | | | | |
| Plantation | | | 3,554,986 | | | 2,081,863 | | | 1,473,123 | |
| | | | | | | | | | | |
| Beef | | | 7,328,071 | | | 2,170,154 | | | 5,157,917 | |
| | | | | | | | | | | |
| Organic fertilizer | | | 9,618,307 | | | 1,781,966 | | | 7,836,341 | |
| | | | | | | | | | | |
| Cattle farm | | | 6,421,161 | | | 3,514,539 | | | 2,906,622 | |
| | | | | | | | | | | |
| Corporate and others | | | 9,573,698 | | | - | | | 9,573,698 | |
| | | | | | | | | | | |
| Total | | | 54,400,329 | | | 25,348,287 | | | 29,052,042 | |
32
Fishery: Revenue from fishery increased by $2,104,341 or 13.32% to $17,904,106 for the three months ended June 30, 2013 from $15,799,765 for the three months ended June 30, 2012. The increase was primarily due to our increased contract service income from fishery, WSC 1 and prawn development contracts and sale of fish for the three months ended June 30, 2013 versus consulting income and sale of fish for the three months ended June 30, 2012.
Plantation: Revenue from plantation of flowers increased by $1,473,123 or 70.76% to $3,554,986 for the three months ended June 30, 2013 from $2,081,863 for the three months ended June 30, 2012. The increase was primarily due to the increase of wholesales prices in both of the fresh and dried flowers and the increase of production of flowers this season.
Beef: Revenue from beef increased by $5,157,917 or 237.68% to $7,328,071 for the three months ended June 30, 2013 from $2,170,154 for the three months ended June 30, 2012. The increase was primarily due to our increase of cattle grown in the farms.
Organic fertilizer: Revenue from organic fertilizer increased by $7,836,341 or 439.76% to $9,618,307 for the three months ended June 30, 2013 from $1,781,966 for the three months ended June 30, 2012. The increase was primarily due to the new production plants at HSA increasing its sales and production of fertilizer.
Cattle farm: Revenue from the cattle farm increased by $2,906,622 or 82.70% to $6,421,161 for the three months ended June 30, 2013 from $3,514,539 for the three months ended June 30, 2012. The increase was primarily to the increase of sales due to the increase of cattle being grown in the Cattle Farm 1.
Corporate and others: Revenues from corporate and others for the three months ended June 30, 2013 increased by $9,537,638 from $0 for the three months ended June 30, 2012, the increase is due primarily to the increase of consulting and services being contracted and the increase of sales through trading of the imported frozen and fresh seafood for the three months ended June 30, 2013.
Cost of Goods Sold
Cost of Goods Sold increased by $23,219,843 or 196.94% to $35,009,882 for the three months ended June 30, 2013 from $11,790,039 for the three months ended June 30, 2012. The increase was primarily due to the Company increasing its scale of operation from continuing operations in terms of our fishery, plantation, beef, organic fertilizer, cattle farm, beef and corporate and others operation for three months ended June 30, 2013 as compared for the three months ended June 30, 2012.
The following chart illustrates the changes by category from the three months ended June 30, 2013 to three months ended June 30, 2012.
33
| Cost of Goods Sold | | | | | | | |
| | | 2013 | | 2012 | | | |
| Category | | Q2 | | Q2 | | Difference | |
| | | $ | | $ | | $ | |
| Fishery | | 13,773,395 | | 6,592,310 | | 7,181,085 | |
| Plantation | | 1,260,957 | | 558,348 | | 702,609 | |
| Beef | | 5,852,877 | | 2,667,740 | | 3,185,137 | |
| Organic Fertilizer | | 5,040,172 | | 1,063,207 | | 3,976,965 | |
| Cattle farm | | 3,315,692 | | 908,434 | | 2,407,258 | |
| Corporate and others | | 5,766,789 | | - | | 5,766,789 | |
| | | | | | | | |
| Total | | 35,009,882 | | 11,790,039 | | 23,219,843 | |
Fishery: Cost of goods sold from fishery increased by $7,181,085 or 108.93% to $13,776,395 for the three months ended June 30, 2013 from $6,592,310 for the three months ended June 30, 2012. The increase was primarily due to an increase in the sales relating to the increase volume of fish production of our fish farms for the three months ended June 30, 2013 comparing to the three months ended June 30, 2012.
Plantation: Cost of goods sold from plantation of flowers increased by $702,609 or 125.84% to $1,260,957 for the three months ended June 30, 2013 from $558,348 for the three months ended June 30, 2012. The increase was primarily due to cost increase in farm labor, logistic and associated general overhead of operation due to the related increase of sale.
Beef: Cost of goods sold from beef increased by $3,185,137 or 119.39% to $5,852,877 for the three months ended June 30, 2013 from $2,667,740 for the three months ended June 30, 2012. The increase was primarily due to the increase sales volume of cattle, which led to a corresponding increase in the cost of sales.
Organic fertilizer: Cost of goods sold from organic fertilizer increased by $3,976,965 or 374.05% to $5,040,172 for the three months ended June 30, 2013 from $1,063,207 for the three months ended June 30, 2012. The increase was primarily due to the related increase of sales.
Cattle farm: Cost of goods sold from cattle farm increased by $2,407,258 or 264.99% to $3,315,692 for the three months ended June 30, 2013 from $908,434 for the three months ended June 30, 2012. The increase primarily was due to the increase of cattle being grown and sold by the Cattle Farm 1 for the three months ended June 30, 2013.
Corporate and others: Cost of sales for the three months ended June 30, 2013 increased by $5,766,789 from $0 for the three months ended June 30, 2012. The increase is due primarily to the corresponding increase of sales and trades and consulting services for the three months ended June 30, 2013.
Gross Profit
Gross profit increased by $5,832,199 or 43.02% to $19,390,447 for the three months ended June 30, 2013 from $13,558,248 for the three months ended June 30,2012.The increase was primarily due to the corresponding increases in revenues from our plantation, beef, organic fertilizer, cattle farm and beef and corporate and others operations.
The following chart illustrates the changes by category from the three months ended June 30, 2013 to the three months ended June 30, 2012.
34
The following chart illustrates the change from the three months ended June 30, 2013 to the three months ended June 30, 2012.
| Gross profit | | | | | | | |
| | | 2013 | | 2012 | | | |
| Category | | Q2 | | Q2 | | Difference | |
| | | $ | | $ | | $ | |
| Fishery | | 4,130,711 | | 9,207,455 | | (5,076,744) | |
| Plantation | | 2,294,029 | | 1,523,515 | | 770,514 | |
| Beef | | 1,475,194 | | 846,799 | | 628,395 | |
| Organic fertilizer | | 4,578,135 | | 1,106,947 | | 3,471,188 | |
| Cattle farm | | 3,105,469 | | 873,532 | | 2,231,937 | |
| Corporate and others | | 3,806,909 | | - | | 3,806,909 | |
| Total | | 19,390,447 | | 13,558,248 | | 5,832,199 | |
Fishery: Gross profit of the fishery decreased by $4,130,711 or (55.13%) to $4,130,711 for the three months ended June 30, 2013 from $9,207,455 for the three months ended June 30, 2012.The decrease was primarily due to (i) part of the sales from fishery segment was reallocated to a new segment marked “Corporate and others” amounting to $3,806,909 and (ii) the decrease of the Gross Profit by $1,269,835 for the three months ended June 30,2013 was due primarily to the decrease in the sales prices of sleepy cod fish dropping from $27/kg during the three months ended June 30, 2012 to $15.3/Kg during the three months ended June 30,2013.
Plantation: Gross profit from the plantation increased by $770,514 or 50.57% to $2,294,029 for the three months ended June 30, 2013 from $1,523,515 for the three months ended June 30,2012. The increase was due mainly to the increase of wholesales prices both on dried and fresh flowers and the increase of production of flowers.
Beef: Gross profit from beef increased by $628,395 or 74.21% to $1,475,194 or for the three months ended June 30, 2013 from $846,799 for the three months ended June 30, 2012 which is due primarily to the natural growth of operation.
Organic fertilizer: Gross profit from organic fertilizer increased by $3,471,188 or 313.58% to $4,578,135 for the three months ended June 30, 2013 from $1,106,947 for the three months ended June 30, 2012. The increase was primarily due to the increase of fertilizer sales by HSA’s new production factory.
Cattle farm: Gross profit from cattle farm development increased by $2,231,937 or 255.51% to $3,105,469 for the three months ended June 30, 2013 from $873,532 for the three months ended June 30, 2012. The increase was primarily due to the increase of cattle being grown and sold by Cattle Farm 1for the three months ended June 30, 2013.
Corporate and others: Gross profit from the corporate and others increased by $3,806,909 for the three months ended June 30, 2013 from $0 for the three months ended June 30, 2012, and the increase is due primarily to part of the Fishery segment’s sales in consulting service and trading of fish sales were reallocated to this segment for the three months ended June 30, 2013.
General and Administrative Expenses and Interest Expenses
General and administrative expenses (including depreciation and amortization)decreased by $1,127,374 to $1,663,262 for the three months ended June 30, 2013 from $2,735,677 for the three months ended June 30,2012. The decrease was primarily due to the decrease in wages and salaries payments paid as incentive compensation to our staff by the issuance of shares amounting to $666,778 for the three months ended June 30,2012 compared to $90,600 for the three months ended June 30, 2013 and included in the miscellaneous were payments for overseas professional services of $781,684 for the three months ended June 30,2012 whereas payments for overseas professional services were billed under Office and corporate expenses instead of miscellaneous for the three months ended June 30,2013.
35
The following chart illustrates the changes by category from the three months ended June 30, 2013 compared to the three months ended June 30, 2012.
| Category | | 2013 Q2 | | 2012 Q2 | | Difference | |
| | | $ | | $ | | $ | |
| Office and corporate expenses | | 590,182 | | 309,685 | | 280,497 | |
| | | | | | | | |
| Wages and salaries | | 375,374 | | 918,205 | | (542,831) | |
| | | | | | | | |
| Traveling and related lodging | | 20,513 | | 8,119 | | 12,394 | |
| | | | | | | | |
| Motor vehicles expenses and local transportation | | 44,257 | | 16,750 | | 27,507 | |
| | | | | | | | |
| Entertainments and meals | | 36,832 | | 35,519 | | 1,313 | |
| | | | | | | | |
| Others and miscellaneous | | 77,827 | | 897,586 | | (819,759) | |
| | | | | | | | |
| Depreciation and amortization | | 463,319 | | 549,814 | | (86,495) | |
| | | | | | | | |
| Sub-total | | 1,608,304 | | 2,735,677 | | (1,127,374) | |
| | | | | | | | |
| Interest expenses | | 54,958 | | - | | 54,958 | |
| | | | | | | | |
| Total | | 1,663,262 | | 2,735,677 | | (1,072,416) | |
Depreciation and Amortization
Depreciation and Amortization increased by $56,088 or 6.13% to $970,023 for the three months ended June 30,2013 from $913,935 for the three months ended June 30,2013. The increase was primarily due to the increase of depreciation by $206,066 to $331,596 for the six months ended June 30, 2013 from depreciation of $125,530 for the three months ended June 30, 2012, and the decrease of amortization by $149,978 to $638,427 for three months ended June 30, 2013 from amortization of $788,405 for the three months ended June 30, 2012.
In this respect, total depreciation and amortization amounted to $970,023 for the three months ended June 30, 2013, out of which amount, $463,319 was booked under General and administration expenses and $506,704 was booked under cost of goods sold; whereas total depreciation and amortization was at $913,935 for the three months ended June 30, 2012 and out of which amount, $549,814 was booked under General and Administration expenses and $364,121 was booked under cost of goods sold.
36
Gain on extinguishment of debts
The Company entered into several agreements with third parties to settle debts by issuance of the Company’s common stock. The shares issued by the Company were valued at the trading price of the stock on the date the shares were issued. The Company has reported $498,025 and $562,361 as gain on the extinguishment of debts for the three months ended June 30, 2013 and 2012, respectively.
Part B. Six Months Ended June 30, 20131 Compared to Six Months Ended June 30, 2012
Revenues
Revenues increased by $68,179,777 or 164.97% to $109,508,080 for the six months ended June 30, 2013 from $41,328,303 for the six months ended June 30, 2012. The increase was primarily due to the increase of revenue generated from our fishery, plantation, beef, organic fertilizer, cattle farm and corporate and others operations and the maturity of on-going divisional businesses improving their revenues.
The following chart illustrates the changes by category from the six months ended June 30, 2013 to June 30, 2012.
| Revenue | | | | | | | |
| | | 2013 | | 2012 | | | |
| Category | | Q1- Q2 | | Q1-Q2 | | Difference | |
| | | $ | | $ | | $ | |
| Fishery | | 42,122,633 | | 26,894,374 | | 15,228,259 | |
| | | | | | | | |
| Plantation | | 3,554,986 | | 2,081,863 | | 1,473,123 | |
| | | | | | | | |
| Beef | | 14,123,908 | | 7,445,425 | | 6,678,483 | |
| | | | | | | | |
| Organic fertilizer | | 17,700,369 | | 2,183,215 | | 15,517,154 | |
| | | | | | | | |
| Cattle farm | | 14,783,718 | | 2,723,426 | | 12,060,292 | |
| | | | | | | | |
| Corporate and others | | 17,222,466 | | - | | 17,222,466 | |
| | | | | | | | |
| Total | | 109,508,080 | | 41,328,303 | | 68,179,777 | |
Fishery: Revenues from fishery increased by $15,228,259 or 56.62% from $26,894,373 for the six months ended June 30, 2012 to $42,122,633 for the six months ended June 30, 2013. The increase in fishery was primarily due to our increased contract service income from fishery and prawn development contract for the six months ended June 30, 2013.
Plantation: Revenues from plantation increased by $1,473,123 or 70.76% to $3,554,986 for the six months ended June 30, 2013 from $2,081,863 for the six months ended June 30, 2012. The increase in plantation was primarily due to the increase of sale of products derived from the increase of field production of flowers.
37
Beef: Revenues from beef increased by $6,678,483 or 89.70% to $14,123,908 for the six months ended June 30, 2013 from $7,445,425 for the six months ended June 30, 2012. The increase in beef sales was primarily due to the increase of cattle being grown in the farms during the six months ended June 30, 2013.
Organic fertilizer: Revenue from organic fertilizer increased by $15,517,154 or (710.75%) to $17,700,369 for the six months ended June 30, 2013 from $2,183,215 for the six months ended June 30, 2012. The increase was due to the increase of production and sales by the new fertilizer factory of HSA.
Cattle farm: Revenues from cattle farm increased by $12,060,292 or 442.84% to $14,783,718 for the six months ended June 30, 2013 from $2,723,426 for the six months ended June 30, 2012. The increase in cattle farm was primarily due to the increase of cattle being grown at Cattle Farm 1 during the six months ended June 30, 2013.
Corporate and others: Revenues increased by $17,222,466 for the six months ended June 30, 2013 from $0 for the six months ended June 30, 2012. The increase is due primarily that part of the Fishery segment’s sale deriving from consulting service, and seafood trading were reallocated to the segment of “Corporate and others” during the corresponding period.
Cost of Goods Sold
Cost of goods sold increased by $48,838,353 or 247.20% to $68,594,816 for the six months ended June 30, 2013 from $19,756,463 for the six months ended June 30, 2012. The increase was primarily due to the Company increased our fishery, plantation, beef, organic fertilizer, cattle farm and corporate and others operations for six months ended June 30, 2013 as compared for the six months ended June 30, 2012.
The following chart illustrates the changes by category from the six months ended June 30, 2013 to June 30, 2012.
| Cost of goods sold | | | | | | | |
| | | 2013 | | 2012 | | | |
| Category | | Q1- Q2 | | Q1-Q2 | | Difference | |
| | | $ | | $ | | $ | |
| Fishery | | 28,354,892 | | 12,090,750 | | 16,264,142 | |
| | | | | | | | |
| Plantation | | 1,260,957 | | 558,348 | | 702,609 | |
| | | | | | | | |
| Beef | | 9,633,534 | | 4,970,923 | | 4,662,611 | |
| | | | | | | | |
| Organic fertilizer | | 9,132,048 | | 1,075,329 | | 8,056,719 | |
| | | | | | | | |
| Cattle farm | | 8,913,731 | | 1,061,113 | | 7,852,618 | |
| | | | | | | | |
| Corporate and others | | 11,299,654 | | | | 11,299,654 | |
| | | | | | | | |
| Total | | 68,594,816 | | 19,756,463 | | 48,838,353 | |
38
Fishery: Cost of goods sold from fishery increased by $16,264,142 or 134.52% to $28,354,892 for the six months ended June 30, 2013 from $12,090,750 for the six months ended June 30, 2012. The increase of cost of sales of fishery was primarily due to the related increase of fish production during the the six months ended June 30, 2012.
Plantation: Cost of goods sold from plantation increased by $702,609 or 125.84% to $1,260,957 for the six months ended June 30, 2013 from $558,348 for the six months ended 30 June 2012. The increase in cost of sales of the plantation was primarily due to the increase of corresponding production of flowers.
Beef: Revenues from beef increased by $4,662,611 or 93.80% to $9,633,534 for the six months ended June 30, 2013 from $4,970,923 for the six months ended June 30, 2012. The increase in cost of sales of the beef was primarily due to the increase of the corresponding increase of sale derived from more cattle being grown in the farm during the six months ended June 30, 2013.
Organic fertilizer: Cost of goods sold from organic fertilizer increased by $8,056,719 or 749.23% to $9,132,048 for the six months ended June 30, 2013 from $1,075,329 for the six months ended June 30, 2012. The increase was due to the increase of fertilizer production from the new fertilizer factory of HSA during the six months ended June 30, 2013.
Cattle farm: Cost of goods sold from cattle farm increased by $7,852,618 or 740.04% or to $8,913,731 for the six months ended 30 June 2013 from $1,061,113 for the six months ended 30 June 2012. The increase in cattle farm was primarily due to the increase of production having more being grown in Cattle Farm 1 during the six months ended June 30, 2013.
Corporate and others: Cost of goods sold increased by $11,299,654 for the six months ended June 30, 2013 from $0 for the six months ended June 30, 2012. The increase is due primarily that part of the Fishery segment’s sale deriving from consulting service, and seafood trading were reallocated to the segment of “Corporate and others” during the six months ended June 30, 2013 as such enhancing corresponding increase in cost of sales accordingly.
Gross Profit
Gross profit increased by $19,341,424 or 89.66% to $40,913,264 for the six months ended June 30, 2013 from $21,571,840 for the six months ended June 30, 2012. The increase was primarily due to the corresponding increase in operation revenues. The increase was primarily due to the corresponding increase in scale of operation of revenues from plantation, beef, organic fertilizer, cattle farm, corporate and others.
The following chart illustrates the changes by category from the six months ended June 30, 2013 to June 30, 2012.
39
The gross profit by category is as follows:
| Gross profit | | | | | | | |
| | | 2013 | | 2012 | | | |
| Category | | Q1- Q2 | | Q1- Q2 | | Difference | |
| | | $ | | $ | | $ | |
| Fishery | | 13,767,741 | | 14,803,623 | | (1,035,882) | |
| | | | | | | | |
| Plantation | | 2,294,029 | | 1,523,515 | | 770,514 | |
| | | | | | | | |
| Beef | | 4,490,374 | | 2,474,502 | | 2,015,872 | |
| | | | | | | | |
| Organic fertilizer | | 8,568,321 | | 1,107,887 | | 7,460,434 | |
| | | | | | | | |
| Cattle farm | | 5,869,987 | | 1,662,313 | | 4,207,674 | |
| | | | | | | | |
| Corporate and others | | 5,922,812 | | - | | 5,922,812 | |
| | | | | | | | |
| Total | | 40,913,264 | | 21,571,840 | | 19,341,424 | |
Fishery: Gross profit from fishery decreased by $1,035,882 or (7.00)% from $13,767,741 for the six months ended June 30, 2013 from $14,803,623 for the six months ended June 30, 2012 . The decrease in fishery was primarily due to the decrease of sales prices of sleepy cod fish falling from the average of $27/Kg for the six months ended June 30, 2012 to its current average of $15.3/Kg for the six months ended June 30, 2013.
Plantation: Gross profit from plantation increased by $770,514 or 50.57% to $2,294,029 for the six months ended June 30, 2013 from $1,523,515 for the six months ended June 30, 2012. The increase in plantation was primarily due to the increase of sale due to increase of production of flowers at the farm during the six months ended June 30, 2013.
Beef: Gross profit from beef increased by $2,015,872 or 81.46% to $4,490,374 for the six months ended June 30, 2013 from $2,474,502 for the six months ended June 30, 2012. The increase in beef was primarily due to increased sale of cattle having more cattle being grown in the farms.
Organic fertilizer: Gross profit from organic fertilizer increased by $7,460,434 or 673.39% to $8,568,321 for the six months ended June 30, 2013 from $1,107,887 for the six months ended June 30, 2012. The increase was due to the increase of sales of fertilizer produced by the new fertilizer of HSA during the six months ended June 30, 2013.
40
Cattle farm: Gross profit from cattle farm increased by $4,207,674 or 253.12% to $5,869,987 for the six months ended 30 June 2013 from $1,662,313 for the six months ended June 30, 2012. The increase of gross profit in cattle farm was primarily due to the increase of sales in cattle having more cattle being grown in Cattle Farm 1 in the six months ended June 30, 2013.
Corporate and others: Gross profit increased by $5,922,812 for the six months ended June 30, 2013 from $0 for the six months ended June 30, 2012. The reason for the increase is due primarily to part of the fishery segment’s sales in consulting services and trading of imported seafood being reallocated to this segment deriving profit accordingly.
General and Administrative Expenses and Interest Expenses
General and administrative expenses and interest expenses (including depreciation and amortization) decreased by $1,032,298 or 23.08% to $3,925,702 for the six months ended June 30, 2013 from $4,957,999 for the six months ended June 30, 2012. The decrease was primarily due to decrease in wages and salaries payments paid for incentives compensation to our staffs by the issuance of shares amounting to $1,333,556 for the six months ended June 30, 2012 compares to $181,200 for the six months ended June 30, 2013 and including in the miscellaneous were payments for overseas professional services of $781,684 for the six months ended June 30, 2012 whereas payments for overseas professional services were billed under Office and corporate expenses instead of miscellaneous for the six months ended June 30, 2013.
| Category | | 2013 Q1-Q2 | | 2012 Q1-Q2 | | Difference | |
| | | $ | | $ | | $ | |
| Office and corporate expenses | | 1,328,662 | | 1,151,439 | | 177,223 | |
| Wages and salaries | | 962,101 | | 1,863,290 | | (901,189) | |
| Traveling and related lodging | | 34,998 | | 20,276 | | 14,722 | |
| Motor vehicles expenses and local transportation | | 73,893 | | 37,200 | | 36,693 | |
| Entertainments and meals | | 64,850 | | 52,395 | | 12,455 | |
| Others and miscellaneous | | 300,881 | | 929,902 | | (629,021) | |
| Depreciation and amortization | | 1,048,307 | | 903,498 | | 144,809 | |
| Sub-total | | 3,813,692 | | 4,957,999 | | (1,144,308) | |
| Interest expenses | | 112,010 | | - | | 112,010 | |
| | | | | | | | |
| Total | | 3,925,702 | | 4,957,999 | | (1,032,298) | |
Depreciation and Amortization
Depreciation and amortization increase by $293,635 or 22.22% to $1,614,965 for the six months ended June 30, 2013 from $1,321,330 for the six months ended June 30, 2012. The decrease was primarily due to the increase of depreciation by $455,517 to $638,671 for the six months ended June 30, 2013 from depreciation of $183,154 for the six months ended June 30, 2012, and the decrease of amortization by $161,882 to $976,294 for six months ended June 30, 2013 from amortization of $1,138,176 for the six months ended June 30, 2012.
In this respect, total depreciation and amortization amounted to $1,614,965 for the six months ended June 30, 2013, out of which amount, $1,048,307 was booked under General and administration expenses and $566,658 was booked under cost of goods sold; whereas total depreciation and amortization was at $1,321,330 for the six months ended June 30, 2012 and out of which amount, $903,498 was booked under General and Administration expenses and $417,832 was booked under cost of goods sold.
41
Gain (loss) of extinguishment of debts
Any deficit (excess) of the fair value of the shares over the carrying cost of the debt has been reported as a gain (loss) on the extinguishment of debts of $1,051,013 and $817,513 has been credited (charged) to operations for the six months ended June 30, 2013 and 2012, respectively.
Part C. More detailed segment information and analysis of the financial statements for the six months ended June 30, 2013
This Part C discusses and analyzes certain items that we believe would assist our shareholders in obtaining a better understanding on the Company’s results of operations and financial condition:
(A) Breakdown of Balance Sheet items (1) on total current assets:
(A) Balance Sheet items (1) on total current assets:
| | | As of June 30, 2013 | | Note | |
| | | $ | | | |
| Cash and cash equivalents | | 9,391,449 | | | |
| Inventories | | 18,887,433 | | 1 | |
| Cost and estimated earnings in excess of billings on uncompleted contracts | | 1,286,775 | | | |
| Deposits and prepaid expenses | | 52,091,997 | | 2 | |
| Accounts receivable, net of allowance for doubtful debts | | 82,373,870 | | 3 | |
| Other receivables | | 6,374,272 | | 4 | |
| | | 170,405,796 | | | |
Note (1): Breakdown of Inventories
| | | As of June 30, 2013 | |
| | | $ | |
| Sleepy cod and eels | | 5,432,990 | |
| Bread grass | | 709,366 | |
| Beef cattle | | 2,985,965 | |
| Organic fertilizer | | 702,836 | |
| Forage for cattle and consumable | | 3,144,896 | |
| Raw materials for bread grass and organic fertilizer | | 5,237,102 | |
| Unharvested HU plantation | | 674,278 | |
| | | 18,887,433 | |
42
Note (2) Breakdown of Deposits and Prepaid Expenses
| | | As of June 30, 2013 | | Note | |
| | | $ | | | |
| Deposits for | | | | | |
| Deposits for Prepayments for purchases of equipment | | | 2,059,776 | | |
| Deposits for- acquisition of land use right | | | 7,826,508 | | 2A |
| Deposits for- inventory purchases | | | 4,940,767 | | |
| Deposits for- aquaculture contract | | | 1,303,607 | | |
| Deposits for- building materials | | | 1,281,935 | | |
| Deposits for- proprietary technology | | | 2,254,839 | | |
| Prepayments for construction in progress | | | 19,658,537 | | |
| Shares issued for employee compensation and oversea professional fee | | | 90,600 | | |
| Temporary deposits paid to entities for investments in future Sino Foreign Joint Venture companies | | | 7,704,670 | | |
| Miscellaneous | | | 4,970,758 | | |
| | | | 52,091,997 | | |
Note (2A) Breakdown of Deposit for- acquisition of Land Use Right:
As of June 30, 2013, we have $7,826,508 for a deposit paid for the acquisition of a Land Use Right derived from the following transactions:
| ⋅ | $3,182,180 (or RMB20,000,000) was for the full payment on June 6, 2012 for the Land Use Right by HAS of a block of land measuring 150 Mu (approximately 25 acres of prime agriculture land) located at Linli District of Hunan Province within 10 Km of HSA’s complex. The process of application to register the said “Land Use Right” is in progress and is expected to be finalized officially on or before the end of year 2013 as such and in the interim prior to the Land Use Right being officially registered, this payment is recorded as Deposit and Prepaid Expenses. |
| | |
| ⋅ | $190,930 (or RMB1,200,000) was paid by SJAP as deposit for the acquisition of “Land Use Right” on a block of land measuring 15 Mu (or 2.475 acres) located at Huangyuan district next to SJAP’s complex on October 15, 2012. This piece of land will be rezoned into Residential from its present status of agriculture and transferred from the Local Government (Huangyuan County) to SJAP to build new staff quarters; as such SJAP is waiting on the completion of such processes to finalize the said purchase of Land Use Right. |
| | |
| ⋅ | $4,453,398 (or RMB 27,989,606) was the full payment Capital Award made for the purchase of the Land Use Right on a block of prime agriculture land measuring 235 Mu (approximately 38.5 acres) located at the Cong Hua District Guangzhou City in late October 2010. This block of land is part of a larger block of land (of some 500 acres) that was applying to become a subdivision; however in 2011 the Land Law was changed such that the said sub-division would require the approval of the central government instead of the approval by the local government alone prior to 2011, entailing a much longer approval process. Cong Hua District was rezoned as a suburb of the Guangzhou City in 2010 and is within close proximity of the Guangzhou City; as such management evaluates it as a valuable piece of land very suitable for the development of one of our agriculture projects. |
43
| ⋅ | The new block of land namely “Guangdong Lot 10 (referred to in our “Summary of Land Assets” of this report) is land zoned as “Industrial Land” that will be used by HST to expand its processing operation of the HU Plants and Immortal Vegetables and it has a tenure period of 10 years secured under a Management Right at the cost of RMB3,040,000 (equivalent to $490,322) that was paid fully; as such as at the period ended June 30, 2013 no additional deposit and prepayment was recorded. |
Note (3) Breakdown of Accounts Receivable:
| | | As of June 30, 2013 | | |||||||||||||
| | | Accounts receivable | | 0-30 days past due | | 31-90 days past due | | 91-120 days past due | | over 120 days and less than 1 year past due | | |||||
| | | $ | | $ | | $ | | $ | | $ | | |||||
| Consulting and Service (from 6 contracts) totaling | | | 49,195,415 | | | 12,564,089 | | | 27,954,719 | | | 8,003,832 | | | 672,775 | |
| | | | | | | | | | | | | | | | | |
| Sales of Fish (from Farms and from imports) | | | 10,962,674 | | | 4,363,031 | | | 3,399,821 | | | 3,199,821 | | | - | |
| | | | | | | | | | | | | | | | | |
| Sales of Cattle and Beef Meats (from Enping Farm) | | | 1,558,096 | | | 16,390 | | | 1,541,706 | | | - | | | - | |
| | | | | | | | | | | | | | | | | |
| Sales of HU Flowers (Dried) | | | 3,364,099 | | | 2,912,015 | | | 452,084 | | | - | | | - | |
| | | | | | | | | | | | | | | | | |
| Sales Fertilizer, Bulk Stock feed and Cattle by SJYL | | | 14,180,446 | | | 4,861,406 | | | 5,759,543 | | | 3,542,171 | | | 17,326 | |
| | | | | | | | | | | | | | | | | |
| Sales Fertilizer from H.S.A.. | | | 3,113,140 | | | 847,118 | | | 1,745,787 | | | 505,689 | | | 14,547 | |
| | | | | | | | | | | | | | | | | |
| Total Accounts Receivable | | | 82,373,870 | | | 25,564,049 | | | 40,853,660 | | | 15,251,513 | | | 704,648 | |
| | | | | | | | | | | | | | | | | |
| Percentage of total population | | | 100% | | | 31% | | | 50% | | | 19% | | | 1% | |
Information on trading terms and provision for diminution in value of accounts receivable:
None of our accounts receivable is more than 12 months old. Receivables from revenue derived from consulting and services billed for work completed are within our normal trading terms capped within 180 days with our principal investor and therefore no diminution in value is required, as the quality of the receivable is not in doubt.
Fish Sales: Most farmed fish are sold to wholesalers at prevailing daily market prices capped within 90 days trading terms with a small portion at 180 days (for oversized fish, as the sale of oversized fish takes time to sell). We sold over US$10.9 million in fish to the wholesalers during the 2nd quarter 2013, and as of June 30, 2013, accounts receivable of $0 was over 180 days. These debtors are wholesalers who are profitable and viable businesses with a good track record and therefore provision of diminution in value is not required as collection is not in doubt.
44
Sales of dried HU flowers: The dried flowers were sold to wholesalers in line with our longer trading terms (e.g., up to 180 days) so as to offset their holding cost so that they could sell the dried flowers through the winter months (from December 2013 to June 2014 when the new season starts). We agreed with the wholesalers that they would buy our dried flowers as soon as we produce them. Therefore, we consider the receivables from the sales of dried HU flowers to be from wholesalers with a good track record and therefore provision for diminution in value is not required as collection is not in doubt. As shown in the table above, $3,364,099 sales revenues are derived from new season sales whereas all 2012 season’s sale was paid and collected.
Sales of fertilizer and bulk Livestock Feed: These were sales made to regional farmers who are contracting to grow crops and pastures for us using and purchasing our fertilizer and we in turn are to buy their cattle that are fed with bulk cattle feed purchased from us, such that we are ultimately to repurchase the cattle. Under this term of arrangements our accounts receivable are normally carried forward until such time they can be offset against our account payables (that is, the amount owed for the amount of crops and pastures is offset against the amount of cattle that we have brought from them respectively). Therefore there is no need to provide any diminution in value as these debtors are on-going and profitable and viable businesses with a good track record with us and collection from them is not in doubt.
Information on Concentration of credit risk of account receivables:
We had 4 major customers (referring to Customer A, B, C and D mentioned in the Financial Statement of this report under Note 2.26) who accounted for ten percent or more of our consolidated revenues during the six months ended June 30, 2013 shown in table below:
| | | Six months ended June 30 2013 | | ||||||
| | | % of total Revenue | | $ | | Total Revenue | | ||
| Customer A | | 18.57 | % | | 20,338,677 | | | | |
| Customer B | | 16.71 | % | | 19,293,639 | | | | |
| Customer C | | 12.32 | % | | 13,494,997 | | | | |
| Customer D | | 10.09 | % | | 11,051,367 | | | | |
| | | | | | | | | | |
| | | 57.69 | % | | 64,178,680 | | | 109,508,080 | |
Customer A is WSC 1, which is owned and operated by Guangzhou City A Power NaWei Trading Co. Ltd (“APNW”).CA was the consulting engineer responsible for the construction of WSC 1and development of its business operation via a Consulting and Service Contract granted by APNW. APNW is now one of our main wholesalers which we bill our sales of seafood (including live and frozen seafood) to. APNW then distributes the seafood to other wholesalers in various cities in China. WSC 1 is situated ideally at the center of all interprovincial logistic services. At the same time, APNW has obtained all relevant Import Quotas and Permits during the six months ended June 30, 2013. As such, SIAF uses APNW’s permits for its import and export trades to be carried out in China. WSC 1 had 18.57% of our total consolidated revenue (equivalent to $20,338,677 out of our total revenue of $109,508,080) derived collectively from the following segments of activities:
45
| | | | | | | | | Six months ended June 30, 2013 | | ||
| Name of company | | Segments | | Operation Division | | Abbreviation name | | % of total consolidated | | Amount in | |
| | | | | | | | | Revenue | | $ | |
| | | | | | | | | | | | |
| CA | | Fishery | | Consulting and Services | | Wholesale Center (1) | | 1.61 | % | 1,760,135 | |
| | | | | Sales of fish (from Fish Farm 1) | | | | 2.79 | % | 3,058,089 | |
| | | | | Sales of fish / eels from Contract Growers | | | | 2.89 | % | 3,166,528 | |
| | | | | | | | | | | | |
| SIAF | | Corporate | | Trading sales of seafood | | | | 11.28 | % | 12,353,925 | |
| | | | | | | | | 18.57 | % | 20,338,677 | |
Customer B is Guangzhou Wholesale market (Store 8) represented by Mr. Han Zhiqiang who distributes our live fish (or other live aquatic animals, e.g., prawns and eels) to other wholesalers at the Guangzhou Wholesale Fish Markets. While there are over 300 live seafood wholesalers at the Guangzhou wholesale markets, there are only about30 of them are in Mr. Han’s group of wholesalers handling the sales of our aquatic seafood. Furthermore, although we billed our live aquatic seafood sales to one wholesaler (in Mr. Han) that did not mean that our live aquatic seafood was sold by one wholesaler. During the six months period ended June 30, 2013, Mr. Han had 16.71% of our total consolidated revenue (equivalent to $18,293,639 out of our total revenue of $109,508,080) derived from the sales of CA’s live aquatic seafood under the segment of Fishery.
Customer C is one of our main agents, namely Mr. Li Changfa, who distributes SJAP’s organic fertilizer, bulk livestock feed and concentrated livestock feed to our corporative farmers and other regional farmers. During the six months period ended June 30, 2013, Mr. Li had 12.32% of our total consolidated revenue (equivalent to $13,494,997 out of our total revenue of $109,508,080)derived from the sales of SJAP’s organic fertile, bulk livestock feed and concentrated livestock feed under the segment of Organic Fertilizer and Bread Grass.
Customer D is Mr. Liu Guang, the Chinese legal representative of the group of businessmen with whom CA contracts under a Consulting and Service Contract to construct and develop Prawn Farm 2 and to develop its related business operation. During the six months period ended June 30, 2013, Mr. Liu had 10.09% of our total consolidated revenue (equivalent to $11,051,367 out of our total revenue of $109,508,080) derived from CA’s Consulting and Service Contract under the segment of Fishery.
The Company had 4 major customers whose accounts receivable balance individually represented the following percentages of the Company’s total accounts receivable during the six months ended June 30, 2013:
46
| | | As of June 30, 2013 | | | Total | | ||
| | | % of total Accounts receivables | | amount in $ | | | Accounts receivables | |
| Customer A | | 15.21 | % | 12,593,302 | | | | |
| Customer B | | 15.01 | % | 12,427,710 | | | | |
| Customer C | | 12.03 | % | 9,960,383 | | | | |
| Customer D | | 11.69 | % | 9,678,876 | | | | |
| | | 53.94 | % | 44,660,271 | | | 82,796,201 | |
Note4 Breakdown of Other Receivables:
| | | As of June 30, 2013 | | Note |
| | | $ | | |
| Cash advances paid as consideration to secure investments | | 4,657,728 | | |
| Miscellaneous | | 937,497 | | |
| Advances to employees | | 206,046 | | |
| Advances to Suppliers (at SJAP’s operations) | | 573,001 | | 4A |
| | | | | |
| | | 6,374,272 | | |
Note 4A: Breakdown of Advances to Suppliers at SJAP’s operations:
At SJAP it is a common practice to make cash advances to our corporative growers (presently standing at 100 members) who are our suppliers, to carry them through respective growing periods (for cropping or pasturing or cattle growing purposes) before final harvests of produces or sales of their cattle. On average, it works out at less than US$63,742 per member that in the management’s opinion is a normal ongoing season on season process deemed fair and equitable. In this respect, as the said average increases it means that the average corporative farmer is increasing his productivity (whether in the growing of crops or cattle), and in simple terms, it represents good progress indicating that SJAP’s revenue is also increasing.
47
(B). Breakdown of Balance Sheet Item (2) on Current Liabilities:
| | | As at June 30, 2013 | | Note |
| Current liabilities | | | | |
| Accounts payable and accruals | | 8,368,834 | | 7 |
| Billings in excess of cost and estimated earnings on uncompleted contracts | | 922,375 | | |
| Due to a director | | 3,257,085 | | |
| Other payables | | 10,259,178 | | 8 |
| Short term bank loan | | 2,265,849 | | |
| Total current liabilities | | 25,073,321 | | |
Note 7. Accounts payables and accrued expenses clarification:
Our current trading environment to limited number of suppliers who will offer prolonged credit terms means that most purchases are paid for in cash or short credit terms (7 to 10 days), and in a way this allows us better bargaining ability to obtain cash discounts resulting in the low trade account payables balance of $8,368,834 representing about 7.65% of total sales of $109.5 million for the reasons stated below:
Our main Account Payables during the six months ended June 30, 2013 were generated from the following activities:
| | 1. | We supply the following cost elements: our own staff, engineering and technology that enhanced our profit margins and reduced the overall cost of sales. Consulting and services(“C&S”) since inception account is the major contributor of income to date and cost of sales averaging52% and 31% for CA and SIAF, respectively derived from its respective C&S during the quarter. |
| | | |
| | 2. | Implementation, supervision, training and associated management work and most of the building sub-contractors worked on sub-contract at cost fixed by us; consequently, no big profit margin is accepted that did not provide room for prolonged credit term. For contracts related to the construction of farms we use plants, equipment, parts and components that were specially manufactured and made as per our own designs and engineering by local manufacturers and suppliers (who carry a high amount of initial development costs and inventories for us based on the understanding that we would pay for the deliveries of goods sold within shorter trading terms such that they could afford to carry such costs). We pay promptly in this respect and believe that, as time has passed, our track record has earned us excellent credibility with all of our suppliers and sub-contractors. |
| | | |
| | 3. | Fish sales started gradually in late 2011, and the cost of sales averaged 47% and 63% in the three months ended March 31 and June 30, of 2013, respectively (the bulk of the cost came from the supplies of baby fingerlings and the live-bait as the main fish feed), and customary trading terms of Chinese suppliers is on a cash on delivery basis, and suppliers who provide short credit terms presently is limited to no more than a select few. |
| | | |
| | 4. | Cattle sales at SJAP’s own cattle stations and from its corporative farmers started in 2011 at lower profit margins compared to the sales of fish and the cost of sales was averaging 77% and 80% for the three months ended March 31 and June 30, of 2013, respectively; it is also customary in China to pay for the young live cattle by cash on deliveries. The Enping cattle farm started to buy young cattle in 2011 and started sales of mature cattle in 2012; cost of sales is averaging 72%and 90% in the three months ended March 31 and June 30, of 2013, respectively. Most of the young cattle supplies were from small primary producers (local small farmers) who did not have great financial resources; as such we paid for these supplies of young cattle in cash on delivery or short credit term after delivery. |
| | | |
| | 5. | In SJAP, the bulk of our fertilizers were sold to farmers who are growing pastures and crops for us such that their fertilizer sales were kept as book entries that would be offset with the pastures and crops that we would buy back from them. In the case of JHMC which is a very early stage company especially so in the manufacturing of fertilizer such that prolonged credit term facilities have not been established for its purchases of raw materials. |
48
| | 6. | Bulk livestock feed are produced by regional corporative growers under contract to us and they use our supply of fertilizer and seeds that represented the main cost components enhancing cost of sales, which average 48% and 40% in the three months ended March 31 and June 30, of 2013. Again, sale of fertilizer is held on credit against crops and pasture grass purchased from them, as well as bulk livestock feed sold to them for cattle rearing, and reconciled once cattle are purchased from them. |
Note 8.Analysis of Other Payables:
As of June 30, 2013, we have other payables totaling $10,259,178, composed of the following:
Promissory notes amounting to $4,477,414 were issued to third parties for advances granted by third parties collectively to the Company (and/or to its subsidiaries) that are personally guaranteed by a director, repayable within two years at interest free term. Promissory notes could be repaid either by cash or shares of the Company or a combination thereof. If debt amounts are settled by shares, their respective share conversion rates will be determined by both parties at the time of settlement.
A grant of $2,192,825 paid by the Chinese Government to SJAP for the development of a certain project, however it is the law of China such that if SJAP will not be able to complete the said project, SJAP will have to repay the said grant to the Government. As of June 30, 2013, although work is in progress on the said project but it is not yet completed, the grant is recorded as other payables.
Other advances that were given by third parties collectively to our subsidiaries with no fixed term of repayment at interest free terms that do not have any promissory note or agreement but verbal understanding amounting to $3,593,095.
49
C. Breakdown of Income Statements (1) Segment Item – Revenue, Cost of Sales and Gross Profit (for the three months ended June 30, 2013):
| Segments | | Sales Revenue | | % of total | | Cost of sales | | % of sales | | Gross Profit | | % of sales | | Note | |
| | | Q22013 | | Revenue | | Q22013 | | Revenue | | Q22013 | | Revenue | | | |
| | | $ | | | | $ | | | | $ | | | | | |
| Fishery Sector | | | | | | | | | | | | | | | |
| CA | | | | | | | | | | | | | | | |
| Consulting and Service | | 6,338,929 | | 12 | % | 3,286,211 | | 52 | % | 3,052,718 | | 38 | % | a | |
| Others in sales of Fish, Prawns and commissions etc. | | 11,565,177 | | 21 | % | 9,371,504 | | 81 | % | 2,193,673 | | 19 | % | b | |
| | | | | | | | | | | | | | | | |
| Cattle Farm Sector | | | | | | | | | | | | | | | |
| MEIJI | | | | | | | | | | | | | | | |
| Consulting and Service | | 2,480,443 | | 5 | % | 1,652,711 | | 67 | % | 827,732 | | 10 | % | d | |
| Others in sales of cattle, meat and commission etc. | | 3,940,718 | | 7 | % | 2,755,886 | | 70 | % | 1,184,832 | | 30 | % | e | |
| | | | | | | | | | | | | | | | |
| Beef Organic fertilizer Sector | | | | | | | | | | | | | | | |
| Qinghai Sanjiang A Power, HuangYuan, Xining (45% subsidiary) | | | | | | | | | | | | | | | |
| Fertilizer | | 2,118,342 | | 4 | % | 920,411 | | 43 | % | 1,197,931 | | 57 | % | f | |
| Bulk Live Stock Feed | | 2,193,056 | | 4 | % | 886,014 | | 40 | % | 1,307,042 | | 60 | % | g | |
| Concentrated Live-stock Feed and related products | | 2,700,277 | | 5 | % | 1,640,523 | | 61 | % | 1,059,754 | | 39 | % | h | |
| Cattle | | 7,359,619 | | 14 | % | 5,878,075 | | 80 | % | 1,481,544 | | 20 | % | i | |
| Hunan Shanghua A Power (75% Subsidiary) | | | | | | | | | | | | | | | |
| Organic Fertilizer (ex-stocks supplied by SJAP) | | 550,054 | | 1 | % | 441,821 | | 80 | % | 108,233 | | 20 | % | j | |
| 100% pure organic mixed fertilizer | | 2,025,030 | | 4 | % | 1,148,980 | | 57 | % | 876,050 | | 44 | % | k | |
| HU Plant Sector | | | | | | | | | | | | | | | |
| Jiang Men HST (75% subsidiary) | | 3,554,986 | | 7 | % | 1,260,957 | | 35 | % | 2,294,029 | | 65 | % | l | |
| Corporate Sector (SIAF) | | | | | | | | | | | | | | | |
| SIAF | | | | | | | | | | - | | | | | |
| Consulting and Service | | 4,272,119 | | 8 | % | 1,322,097 | | 31 | % | 2,950,022 | | 69 | % | m | |
| Import and export sales | | 5,301,579 | | 10 | % | 4,444,692 | | 84 | % | 856,886 | | 16 | % | n | |
| others | | | | | | | | | | | | | | o | |
| Total | | 54,400,329 | | 100 | % | 35,009,882 | | 64 | % | 19,390,447 | | 36 | % | | |
50
Note (a), (d) and (m) Consulting and Service
The table below highlights on general information of ongoing Consulting and Services of the quarter provided by Capital Award, MEIJI and SIAF respectively:
| Name of the developments | Location of development | Land area or Built up area | Current Phase & Stage | Commencement date | Estimated completion date on or before | Contractual amount | % of work done as at 30.06.2013 |
| | | | | | | $ | |
| CA’s Consulting and Services | | | | | | | |
| Fish Farm (2) “The Fish & Eel Farm | Xin Hui District, Jiang Men. | 33,000 m2 | Phase (2) | 15.Jan. 2013 | June. 2014 | 14.9 million | 28% |
| Prawn Farm (2) The Hatchery & Nusery & Grow-out prawn farm | San Jiao Town, Zhong San City, | 120,000 m2 | Phase 2 Stage 1 | 12. Oct. 2012 | 31. Dec. 2013 | 8.67 Million | 50% |
| MEIJI’s Consulting and Services | | | | | | | |
| Cattle Farm (2) External Road work. | LiangXi Town, Enping City | 10 Km Road | One Phase | 15. Sept. 2012 | 31. March. 2013 | 5.28 Million | 100% |
| SIAF’s Consulting and Services: | | | | | | | |
| Wang Xiangcheng Restaurant projects | Hai Zhu District, Guangzhou City | Pending | Phase 1 | 01. Oct. 2012 | 30. Sept. 2015 | 17.5 Million | 25% |
| Whole Sale Center (2) (Beef) | Li Wan District, Guangzhou City | 5,000 m2 | Phase 1 Stage 1&2 | 15. Aug. 2012 | 30. Sept. 2013 | 3.7 Million | 100% |
Whereas CA’s revenues (Note a) generated from its Consulting and Service Contracts (“C&S”) are normal resulting Gross Profit (“GP”) margin around its general standard of (38 to 45%), MEIJI’s GP margin (Note b) (at only 10%) is much lower than its general standard (of about 30 to 35%) due primarily to its work done during the quarter mainly consisting of the finishing work of the external roads that involved many sub-contractors who are registered in the panels of the Government that did not allow MEIJI to gain higher margins and at the same time, the heavy rainy weather of the quarter interrupted many working schedules arranged for the development of Cattle Farm 2 that involved extra costs and SIAF’s work (Note m) performed during the quarter on the development and construction of restaurants and wholesale centers involved much work that was carried out by our own departments resulting in much higher GP margins (69%) for the quarter than our normal standard (recorded at average of 45 to 55%), as such we are expecting that the GP margins will be adjusted and vary from quarter to quarter as the work progresses.
Note (b) and (d): Analysis of Fish sales of Capital Award
During the three month period ended June 30, 2013, Capital Award’s fish sales were derived from following divisional activities:
| ⋅ | Capital Award brought from external growers over 318,000 pieces of sleepy cod (at an average weight of 350 gram/piece), around 300,000 pieces of baby eels and 350 MT of fish feed which were sold to Fish Farm 1 as inventory at an average cost of $5.00/piece, $2.06/piece and $1,660/MT respectively. |
| | |
| ⋅ | Capital Award brought from Fish Farm 1 and sold to wholesale markets 478,603 pieces of sleepy cod(at an average weight of 739 gram/fish) for an average price of $15.8/Kg thus earned commissions based on US$3.20/Kg as its marketing and sales agent. Due to the decline in wholesale prices of sleepy cod (from 2012’s average of US$25.5/Kg), Fish Farm 1’s cost of sales increased to 89% during the first quarter of 2013 but, assisted by the proportionate decrease in cost of the inventory stocks during the last quarter, Fish Farm 1 reduced its cost of sales to 66% during this quarter. In this respect Capital Award’s commission charge (based on RMB20/Kg or equivalent to US$3.2/Kg) has not been readjusted downward during the period. |
| | |
| ⋅ | Capital Award has been contracting with external growers to grow sleepy cod since January 2012 at fixed cost from US$13.3/Kg in its early days to its recent cost of $15.30/Kg and when these sleepy would grow to market sizes of 500 gram and above/fish, CA would sell them to the wholesale markets. In this respect during this second quarter, CA sold, from its contracted grown sleepy cod inventory, to the Guangzhou City wholesale markets 244,118 pieces of marketable size sleepy cod at the average price of $7.38/fish and to WSC 1 for distribution to the Shanghai wholesale markets as well as to the Southern coastal town’s wholesale markets 391,854 pieces of bigger sized sleep cod at the average of $10.10/fish. CA also brought from external growers 44,385 pieces of “Dark Ring Circle” eels that weigh between (3.2 to 3.7 Kg/eel) at cost average of US$6.5/Kg and sold them to WSC 1 and to various wholesale markets in the regional cities (e.g., Shanghai, Guangzhou and Beijing) at relatively low margin (of breakeven prices) to get familiar with the eel markets. |
51
As such, CA’s overall GP margin is averaging 27% during this quarter derived from the sales of its live aquatic seafood.
Note (e) and (i): referring to Analysis of Cattle sales of MEIJI and SJAP
Note (e) referring to MEIJI’s cattle sales (during the three month period ended June 30, 2013):
| ⋅ | MEIJI brought from Cattle Farm 1 cattle aged between 15 months to 19 months old at live weight (from 579 kg/head to 815 kg/head for 775 heads of cattle or at the average of 715.8 Kg/head) and sold them to Beijing wholesale markets at the average of $5.16/Kg of live weight or $3,693/head (equivalent to RMB22,162/head) that their growing and sales cost (or cost of sales) is at the average of $3,232/head representing around 12.4% GP margin. In this respect, we believe that our Cattle Farm 1 cattle must have good consistent quality being fed with our Aromatic Feed and grown in our semi-free growing conditions that they were getting good responses from the Beijing markets to allow a premium of $0.65/Kg (live weight) above the general wholesale prices of $4.52/Kg that was recorded during this quarter and is lower than the wholesale prices of $5.2/Kg (average) recorded during the first quarter of 2013. MEIJI’s total revenues shown in the table above includes the sales of 550 heads of young cattle (aged between 7 to 12 months old) brought from external growers and sold to Cattle Farm 1 as its inventory at cost for value of $1,095,290. |
| | |
| | However, among MEIJI’s sales, there were 350 heads sold to the “Beijing Cattle Farm” joint venture (described above) that will be distributed by and in the “small wholesale shop” to the regional distributors and public of Beijing, a portion of the additional profits generated from which sales will be shared by MEIJI. Taking into consideration that MEIJI’s cattle production is increasing gradually and slowly in comparison to SJAP, it is possible that our Joint Ventured Beijing Cattle Farm will sell all what MEIJI will produce within the next few years and increase MEIJI’s cattle sales GP margins by an additional 10% or more starting from the next quarter (Q3 of 2013). |
Note (i) referring to the sales of cattle at SJAP (during the three month period ended June 30, 2013):
| ⋅ | SJAP sold over 2,345 heads of cattle from its own cattle station and corporative growers collectively at an average of $3,150/head at cost of sales of ($2,417/head from its own cattle station and $2,659/head from the corporative growers) generating revenue of $7.36 million with GP margin averaging 20%. The reasons SJAP enjoys greater profit margins include; (1) SJAP’s batch of cattle sales this quarter were from young cattle SJAP brought through the winter months of last year when the region was short of livestock feed at lower cost, (2) SJAP’s concentrated livestock feed is manufactured in house starting from early of the quarter saving in logistic transportation cost and the benefit of feeding the cattle with our own concentrated livestock feed, (3) the cattle were grown during the warmer months reducing the associated cost of energy under better growing climates. The average sales prices per head of cattle is lower than MEIJI’s cattle sales due mainly to the fact that SJAP’s cattle are lighter in weight due to the shorter fattening period influenced by its regional market demands of smaller cattle compared to the requirement of cattle grown in our Cattle Farm 1and sold at the Beijing markets. |
Note (f, g, h, i and k) referring to Analysis of Fertilizer and Livestock feed of SJAP and HSA:
During the second quarter of 2013;
HSA sold 2,273 MT of organic fertilizer from inventory that was supplied by SJAP in 2012 at the average of US$242/MT and at cost of US$182.4/MT, and also sold 4,895 MT of 100% Pure Organic mixed fertilizer (“POMF”) from production of its own fertilizer factory at average prices of US$420/MT that cost US$216/MT.
52
SJAP sold 12,015 MT, 14,315 MT and 6,440 MT of organic fertilizer, bulk livestock feed and concentrated livestock feed for US$176.3/MT, US$153.2 and US$419.3 and at cost of sales of US$74.2/MT, US$60.50/MT and US$252.25/MT respectively.
Note (m and n) referring to Analysis of SIAF’s import and export seafood sales:
During the quarter, we imported seafood and sold to WSC 1 under and using its import quotas and licenses deriving revenues based on 16% marked up (inclusive servicing fees of 3.5%) detailed as follows:
6 x 40’ (Sea-containers) of frozen Cuttlefish and Squids from Malaysia, 3 x 40” (Sea-containers) of frozen Salmons from Russia, 74 MT of king sized Live Prawns (or shrimp) from Thailand via its local agent, 37.2 MT of Live Mud Crabs and 35.34 MT of Live Flower Pattern eels for total sales of $5,301,579 with GP margin at 16%.
Income Taxes
There was no income tax payable in six months ended June 30, 2013 or 2012.
Off Balance Sheet Arrangements:
None.
Other Significant Factors That May Affect Cash/Liquidity:
Inflation factors affecting operations:
On the surface the Government’s anti-inflationary measures seemed to be working during the six months ended June 30, 2013. However, management remains concerned since most of the building materials, cost of labor and essential consumer goods are still rising at a higher rate than GDP. Its impact on consumer spending has not seemed to materialize, though, with growth in spending maintaining an upward trajectory.
As of June 30, 2013, the Company had no other significant transactions that may affect our cash/liquidity other than those mentioned in this Quarterly Report.
The Company considers all highly liquid securities with original maturities of three months or less when acquired to be cash equivalents. Cash and cash equivalents kept with financial institutions in People’s Republic of China (“PRC”) are not insured or otherwise protected. Should any of those institutions holding the Company’s cash become insolvent, or the Company is unable to withdraw funds for any reason, the Company could lose the cash on deposit at that institution.
Liquidity and Capital Resources
As of June 30, 2013, we had unrestricted cash and cash equivalents of $9,391,449, (see notes to the consolidated account), and our working capital as of June 30, 2013 was $145,332,475.
53
As of June 30, 2013, our total long term debts are as follows:
| Contractual Obligations | | Less than 1 year | | 1-3 years | | 3-5 years | | More than 5 years | | Total | | |||||
| Short Term Bank Loan | | | | | $ | 2,265,849 | | | | | | | | | | |
| Long Term Debts | | $ | 0 | | $ | 0 | | $ | 178,031 | | $ | 0 | | $ | 0 | |
| Promissory Notes | | | | | | | | | | | | | | | | |
| Issued to third parties | | $ | 5,915,423 | | | | | | | | | | | | | |
Cash provided by operating activities totaled $16,120,653 for the six months ended June 30, 2013. This compares with cash provided by operating activities $9,887,541 for the six months ended June 30, 2012. The increase in cash flows from operations primarily resulted from net cash provided by net income for the period after adjustments of non- cash items.
Cash used in investing activities totaled $14,086,955 for the six months ended June 30; 2013.This compares with cash used in investing activities totaled $11,722,784 for the six months ended June 30, 2012. The increase in cash flows used in investing activities primarily resulted from payment for construction of $12,596,632 for the six months ended June 30, 2013 as compared with payment for construction of $6,626,688 for the six months ended June 30, 2012.
Cash used in financing activities totaled $951,308 for the six months ended June 30, 2013. This compares with cash from financing activities totaled $1,672,033 for the six months ended June 30, 2012. The decrease in cash flows provided by investing activities primarily resulted from non-controlling interests contribution of $1,806,644 for the six months ended June 30, 2012 as compared with no non-controlling interests for the six months ended June 30, 2013.
54
ITEM 3. QUANTITATIVE AND QUALITATIVE DISCLOSURES ABOUT MARKET RISK.
Not Applicable
ITEM 4. CONTROLS AND PROCEDURES
Evaluation of Disclosure Controls and Procedures
We maintain “disclosure controls and procedures,” as such term is defined in Rule 13a-15(e) under the Securities Exchange Act of 1934 (the “Exchange Act”), that are designed to ensure that information required to be disclosed in our Exchange Act reports is recorded, processed, summarized and reported within the time periods specified in the Securities and Exchange Commission rules and forms, and that such information is accumulated and communicated to our management, including our Chief Executive Officer and Chief Financial Officer, as appropriate, to allow timely decisions regarding required disclosure. We conducted an evaluation (the “Evaluation”), under the supervision and with the participation of our Chief Executive Officer (“CEO”) and Chief Financial Officer (“CFO”), of the effectiveness of the design and operation of our disclosure controls and procedures (“Disclosure Controls”) as of the end of the period covered by this report pursuant to Rule 13a-15 of the Exchange Act. Based on this Evaluation, our CEO and CFO concluded that our Disclosure Controls were effective as of the end of the period covered by this report.
Changes in Internal Control over Financial Reporting
We have also evaluated our internal controls for financial reporting, and there has been no change in our internal control over financial reporting that occurred during the three months ended June 30, 2013 that has materially affected, or is reasonably likely to materially affect our internal control over financial reporting
Limitations on the Effectiveness of Controls
Our management, including our CEO and CFO, does not expect that our Disclosure Controls and internal controls will prevent all errors and all fraud. A control system, no matter how well conceived and operated, can provide only reasonable, not absolute, assurance that the objectives of the control system are met. Further, the design of a control system must reflect the fact that there are resource constraints, and the benefits of controls must be considered relative to their costs. Because of the inherent limitations in all control systems, no evaluation of controls can provide absolute assurance that all control issues and instances of fraud, if any, within the Company have been detected. These inherent limitations include the realities that judgments in decision-making can be faulty, and that breakdowns can occur because of a simple error or mistake. Additionally, controls can be circumvented by the individual acts of some persons, by collusion of two or more people, or by management or board override of the control.
The design of any system of controls also is based in part upon certain assumptions about the likelihood of future events, and there can be no assurance that any design will succeed in achieving its stated goals under all potential future conditions; over time, controls may become inadequate because of changes in conditions, or the degree of compliance with the policies or procedures may deteriorate. Because of the inherent limitations in a cost-effective control system, misstatements due to error or fraud may occur and not be detected.
PART II - OTHER INFORMATION
| ITEM 1. | LEGAL PROCEEDINGS |
None
| ITEM 1A. | RISK FACTORS |
Not applicable
| ITEM 2. | UNREGISTERED SALES OF EQUITY SECURITIES AND USE OF PROCEEDS |
During the period covered by this quarterly report, we issued an aggregate of 9,824,239 shares of our common stock. The shares were issued pursuant to the exemption from registration under the Securities Act provided by its Section 4(2). The shares were issued in consideration for extinguishment of debt in the aggregate amount of $4,777,277 based on a price of the common stock at values ranging from $0.37 to $0.49 per share.
55
| ITEM 3. | DEFAULTS UPON SENIOR SECURITIES |
None
| ITEM 4. | MINE SAFETY DISCLOSURES |
Not applicable.
| ITEM 5. | OTHER INFORMATION |
None
| ITEM 6. | EXHIBITS |
| Exhibit No . | | Description of Exhibits |
| | | |
| 31.1 | | Section 302 Certification of Principal Executive Officer+ |
| 31.2 | | Section 302 Certification of Principal Financial Officer+ |
| 32.1 | | Section 906 Certification of Principal Executive Officer and Principal Financial Officer + |
| 101.INS | | XBRL Instance Document * |
| 101.SCH | | XBRL Taxonomy Extension Schema Document * |
| 101.CAL | | XBRL Taxonomy Calculation Linkbase Document * |
| 101.LAB | | XBRL Taxonomy Labels Linkbase Document * |
| 101.PRE | | XBRL Taxonomy Presentation Linkbase Document * |
| 101.DEF | | XBRL Definition Linkbase Document * |
+filed herewith
* submitted herewith
56
SIGNATURES
Pursuant to the requirements of Section 13 or 15(d) of the Securities Exchange Act of 1934, the registrant has duly caused this Report to be signed on its behalf by the undersigned, thereunto duly authorized.
| | | SINO AGRO FOOD, INC. |
| | | |
| August 19, 2013 | By: | /s/ LEE YIP KUN SOLOMON |
| | | Lee Yip Kun Solomon |
| | | Chief Executive Officer |
| | | (Principal Executive Officer |
| | | Principal Financial Officer |
| | | Principal Accounting Officer) |
Pursuant to the requirements of the Securities Exchange Act of 1934, this Report has been signed below by the following persons on behalf of the registrant and in the capacities and on the dates indicated.
| August 19, 2013 | By: | /s/ LEE YIP KUN SOLOMON |
| | | Lee Yip Kun Solomon |
| | | Chief Executive Officer, Director |
| | | (Principal Executive Officer |
| | | Principal Financial Officer |
| | | Principal Accounting Officer) |
| August 19, 2013 | By: | /s/ TAN POAY TEIK |
| | | Tan Poay Teik |
| | | Chief Marketing Officer and Director |
| | | |
| August 19, 2013 | By: | /s/ CHEN BORHANN |
| | | Chen BorHann |
| | | Corporate Secretary and Director |
| August 19, 2013 | By: | /s/ YAP KOI MING |
| | | Yap Koi Ming |
| | | Director |
| August 19, 2013 | By: | /s/ NILS ERIK SANDBERG |
| | | Nils Erik Sandberg |
| | | Director |
57