Table of Contents
As filed with the Securities and Exchange Commission on June 23, 2011
Registration No. 333-173898
UNITED STATES
SECURITIES AND EXCHANGE COMMISSION
Washington, D.C. 20549
AMENDMENT NO. 2
TO
FORM S-1
REGISTRATION STATEMENT
UNDER
THE SECURITIES ACT OF 1933
DUNKIN’ BRANDS GROUP, INC.
(Exact name of registrant as specified in its charter)
| Delaware | 5810 | 20-4145825 | ||
| (State or other jurisdiction of incorporation or organization) |
(Primary standard industrial classification code number) |
(I.R.S. employer identification number) |
130 Royall Street
Canton, Massachusetts 02021
(781) 737-3000
(Address, including zip code, and telephone number, including area code, of registrant’s principal executive offices)
Nigel Travis
Chief Executive Officer
Dunkin’ Brands Group, Inc.
130 Royall Street
Canton, Massachusetts 02021
(781) 737-3000
(Name, address, including zip code, and telephone number, including area code, of agent for service)
Copies to:
| Craig E. Marcus | Richard Emmett | D. Rhett Brandon | ||
| Ropes & Gray LLP | Senior Vice President and General Counsel | Simpson Thacher & Bartlett LLP | ||
| Prudential Tower | Dunkin’ Brands Group, Inc. | 425 Lexington Avenue | ||
| 800 Boylston Street | 130 Royall Street | New York, New York 10017 | ||
| Boston, Massachusetts 02199-3600 | Canton, Massachusetts 02021 | Telephone: (212) 455-2000 | ||
| Telephone: (617) 951-7000 | Telephone: (781) 737-3360 | Facsimile: (212) 455-2502 | ||
| Facsimile: (617) 951-7050 | Facsimile: (781) 737-4360 |
Approximate date of commencement of proposed sale to the public: As soon as practicable after this registration statement becomes effective.
If any of the securities being registered on this form are to be offered on a delayed or continuous basis pursuant to Rule 415 under the Securities Act of 1933, check the following box. ¨
If this form is filed to register additional securities for an offering pursuant to Rule 462(b) under the Securities Act, check the following box and list the Securities Act registration statement number of the earlier effective registration statement for the same offering. ¨
If this form is a post-effective amendment filed pursuant to Rule 462(c) under the Securities Act, check the following box and list the Securities Act registration statement number of the earlier effective registration statement for the same offering. ¨
If this form is a post-effective amendment filed pursuant to Rule 462(d) under the Securities Act, check the following box and list the Securities Act registration statement number of the earlier effective registration statement for the same offering. ¨
Indicate by check mark whether the registrant is a large accelerated filer, an accelerated filer, a non-accelerated filer, or a smaller reporting company. See the definitions of “large accelerated filer,” “accelerated filer” and “smaller reporting company” in Rule 12b-2 of the Exchange Act. (Check one).
| Large accelerated Filer | ¨ | Accelerated filer | ¨ | Non-accelerated filer x | Smaller reporting company | ¨ | ||||||||
| (Do not check if a smaller reporting company) | ||||||||||||||
CALCULATION OF REGISTRATION FEE
| Title of Each Class of Securities to be Registered |
Proposed Maximum Aggregate |
Amount of Registration Fee(2) | ||
| Common Stock, $0.001 par value per share |
$400,000,000 | $46,440 | ||
(1) Estimated solely for the purpose of calculating the registration fee in accordance with Rule 457(o) of the Securities Act of 1933, as amended.
(2) Previously paid.
The registrant hereby amends this registration statement on such date or dates as may be necessary to delay its effective date until the registrant shall file a further amendment which specifically states that this registration statement shall thereafter become effective in accordance with Section 8(a) of the Securities Act of 1933 or until the registration statement shall become effective on such date as the Commission acting pursuant to said Section 8(a), may determine.
Table of Contents
The information in this prospectus is not complete and may be changed. We may not sell these securities until the registration statement filed with the Securities and Exchange Commission is effective. This prospectus is not an offer to sell these securities, and we are not soliciting an offer to buy these securities in any state where the offer or sale is not permitted.
Subject to completion, dated June 23, 2011
Prospectus
Shares

Dunkin’ Brands Group, Inc.
Common stock
This is an initial public offering of common stock of Dunkin’ Brands Group, Inc. Dunkin’ Brands Group, Inc. is selling shares of common stock.
Prior to this offering, there has been no public market for our common stock. The estimated initial public offering price is between $ and $ per share. We have applied to have our shares of common stock listed on the The NASDAQ Global Select Market, subject to notice of issuance, under the symbol “DNKN.”
| Per share | Total | |||||||
| Initial public offering price |
$ | $ | ||||||
| Underwriting discounts and commissions |
$ | $ | ||||||
| Proceeds to us before expenses |
$ | $ | ||||||
Delivery of the shares of common stock is expected to be made on or about , 2011. We have granted the underwriters an option for a period of 30 days to purchase, on the same terms and conditions as set forth above, up to an additional shares of our common stock to cover over-allotments.
Investing in our common stock involves substantial risk. Please read “Risk factors” beginning on page 12.
Neither the Securities and Exchange Commission nor any other regulatory body has approved or disapproved of these securities or passed upon the accuracy or adequacy of this prospectus. Any representation to the contrary is a criminal offense.
| J.P. Morgan | Barclays Capital | Morgan Stanley | ||
| BofA Merrill Lynch | Goldman, Sachs & Co. | |||
| Baird | William Blair & Company | Raymond James | ||
| Stifel Nicolaus Weisel | Wells Fargo Securities | Moelis & Company | ||
| SMBC Nikko | Ramirez & Co. | The Williams Capital Group, L.P. |
, 2011
Table of Contents

Table of Contents
| 1 | ||||
| 12 | ||||
| 32 | ||||
| 34 | ||||
| 35 | ||||
| 36 | ||||
| 37 | ||||
| 39 | ||||
| 41 | ||||
| Unaudited pro forma condensed consolidated financial statements |
45 | |||
| Management’s discussion and analysis of financial condition and results of operations |
56 | |||
| 81 | ||||
| 103 | ||||
| 140 | ||||
| 142 | ||||
| 146 | ||||
| 149 | ||||
| 153 | ||||
| Material U.S. federal tax considerations for Non-U.S. Holders of common stock |
155 | |||
| 159 | ||||
| 168 | ||||
| 168 | ||||
| 169 | ||||
| F-1 |
You should rely only on the information contained in this prospectus or in any free writing prospectus that we authorize be distributed to you. We have not, and the underwriters have not, authorized anyone to provide you with additional or different information. This document may only be used where it is legal to sell these securities. You should assume that the information contained in this prospectus is accurate only as of the date of this prospectus.
i
Table of Contents
Market and other industry data
In this prospectus, we rely on and refer to information regarding the restaurant industry, the quick service restaurant (“QSR”) segment of the restaurant industry and the QSR segment categories and subcategories that include coffee, donuts, muffins, bagels, breakfast sandwiches, hard serve ice cream, soft serve ice cream, frozen yogurt, shakes, malts and floats, all of which has been sourced from the industry research firms The NPD Group, Inc. (which prepares and disseminates Consumer Reported Eating Share Trends (“CREST® data”)), Nielsen, Euromonitor International, or Technomic Information Services or compiled from market research reports, analyst reports and other publicly available information. Unless otherwise indicated in this prospectus, market data relating to the United States QSR segment and QSR segment categories and subcategories listed above, including Dunkin’ Donuts’ and Baskin-Robbins’ market positions in the QSR segment or such categories and subcategories, was prepared by, or was derived by us from, CREST® data. CREST® data with respect to each of Dunkin’ Donuts and Baskin-Robbins and the QSR segment and the categories and subcategories in which each of them competes, unless otherwise indicated, is for the 12 months ended February 28, 2011, as reported by The NPD Group, Inc. as of such date. In addition, we refer to the Customer Loyalty Engagement IndexSM prepared by Brand Keys, Inc. (“Brand Keys”), a customer loyalty research and strategic planning consultancy. Brand Keys’ Customer Loyalty Engagement IndexSM is an annual syndicated study that currently examines customers’ relationships with 528 brands in 79 categories. Other industry and market data included in this prospectus are from internal analyses based upon data available from known sources or other proprietary research and analysis. We believe these data to be accurate as of the date of this prospectus. However, this information may prove to be inaccurate because this information cannot always be verified with complete certainty due to the limitations on the availability and reliability of raw data, the voluntary nature of the data gathering process and other limitations and uncertainties. As a result, you should be aware that market and other similar industry data included in this prospectus, and estimates and beliefs based on that data, may not be reliable.
Trademarks, service marks and copyrights
We own or have rights to trademarks, service marks or trade names that we use in connection with the operation of our business, including our corporate names, logos and website names. Other trademarks, service marks and trade names appearing in this prospectus are the property of their respective owners. Some of the trademarks we own include Dunkin’ Donuts® and Baskin-Robbins®. We also sell products under several licensed brands, including, but not limited to, Oreo® and Reese’s®. In addition, we own or have the rights to copyrights, patents, trade secrets and other proprietary rights that protect the content of our products and the formulations for such products. Solely for convenience, some of the trademarks, service marks, trade names and copyrights referred to in this prospectus are listed without the ©, ® and ™ symbols, but we will assert, to the fullest extent under applicable law, our rights to our copyrights, trademarks, service marks and trade names.
The reclassification
In connection with this offering, on , 2011, we effected a -for- reverse split of our Class A common stock and then reclassified our Class A common stock into common stock. Immediately prior to this offering, we will convert each outstanding share of Class L common stock into of a share of common stock plus an additional number of shares determined by dividing the per share Class L preference amount, currently estimated to be $ , by the initial public offering price of a share of our common stock in this offering net of the estimated underwriting discount and a pro rata portion, based upon the number of shares being sold in this offering, of the estimated offering related expenses incurred by us. All share data assumes a conversion of all shares of our Class L common stock into shares of our common stock based upon such estimated Class L preference amount and the estimated offering-related expenses disclosed in this prospectus. See “The reclassification.”
ii
Table of Contents
This summary highlights information appearing elsewhere in this prospectus. This summary is not complete and does not contain all of the information that you should consider before investing in our common stock. You should carefully read the entire prospectus, including the financial data and related notes and the section entitled “Risk factors” before deciding whether to invest in our common stock. Unless otherwise indicated or the context otherwise requires, references in this prospectus to the “Company,” “Dunkin’ Brands,” “we,” “us” and “our” refer to Dunkin’ Brands Group, Inc. and its consolidated subsidiaries. References in this prospectus to our franchisees include our international licensees. References in this prospectus to years are to our fiscal years, which end on the last Saturday in December. Data regarding number of restaurants or points of distribution are calculated as of March 26, 2011, unless otherwise indicated. All information in this prospectus assumes no exercise of the underwriters’ over-allotment option, unless otherwise noted.
Our company
We are one of the world’s leading franchisors of quick service restaurants (“QSRs”) serving hot and cold coffee and baked goods, as well as hard serve ice cream. We franchise restaurants under our Dunkin’ Donuts and Baskin-Robbins brands. With over 16,000 points of distribution in 57 countries, we believe that our portfolio has strong brand awareness in our key markets. Dunkin’ Donuts holds the #1 position in the U.S. by servings in each of the QSR subcategories of “Hot regular coffee,” “Iced coffee,” “Donuts,” “Bagels” and “Muffins” and holds the #2 position in the U.S. by servings in each of the QSR subcategories of “Total coffee” and “Breakfast sandwiches.” Baskin-Robbins is the #1 QSR chain in the U.S. for servings of hard serve ice cream and has established leading market positions in Japan and South Korea. QSR is a restaurant format characterized by counter or drive-thru ordering and limited or no table service.
We believe that our nearly 100% franchised business model offers strategic and financial benefits. For example, because we do not own or operate a significant number of stores, our company is able to focus on menu innovation, marketing, franchisee coaching and support, and other initiatives to drive the overall success of our brand. Financially, our franchised model allows us to grow our points of distribution and brand recognition with limited capital investment by us.
We operate our business in four segments: Dunkin’ Donuts U.S., Dunkin’ Donuts International, Baskin-Robbins International and Baskin-Robbins U.S. In 2010, our Dunkin’ Donuts segments generated revenues of $416.5 million, or 76% of our total segment revenues, of which $402.4 million was in the U.S. segment, and $14.1 million was in the international segment. In 2010, our Baskin-Robbins segments generated revenues of $134.2 million, of which $91.3 million was in the international segment and $42.9 million was in the U.S. segment. As of March 26, 2011, there were 9,805 Dunkin’ Donuts points of distribution, of which 6,799 were in the U.S. and 3,006 were international, and 6,482 Baskin-Robbins points of distribution, of which 3,959 were international and 2,523 were in the U.S. Our points of distribution consist of traditional end-cap, in-line and stand-alone restaurants, many with drive thrus, and gas and convenience locations, as well as alternative points of distribution (“APODs”), such as full- or self-service kiosks in grocery stores, hospitals, airports, offices, colleges and other smaller-footprint properties.
For fiscal years 2008, 2009 and 2010, we generated total revenues of $544.9 million, $538.1 million and $577.1 million, respectively, operating income (loss) of $(140.9) million, $184.5 million and $193.5 million, respectively and net income (loss) of $(269.9) million, $35.0 million and $26.9 million, respectively. Our net loss in 2008 included a pre-tax impairment charge of $328.5 million related to goodwill and trade name intangible assets, and our net income for fiscal year 2010 included a $62.0 million pre-tax loss on debt extinguishment primarily associated with our November 2010 refinancing transaction.
- 1 -
Table of Contents
Our history and recent accomplishments
Both of our brands have a rich heritage dating back to the 1940s. For many years, we operated as a subsidiary of Allied Domecq PLC, which was acquired in July 2005 by Pernod Ricard S.A. Pernod Ricard made the decision to divest Dunkin’ Brands in order to remain a focused global spirits company. As a result, in March of 2006, we were acquired by investment funds affiliated with Bain Capital Partners, LLC, The Carlyle Group and Thomas H. Lee Partners, L.P. (collectively, the “Sponsors”).
We have experienced positive growth globally for both our Dunkin’ Donuts and Baskin-Robbins brands in systemwide sales in each of the last ten years. In addition, other than in 2007 with respect to Baskin-Robbins, we have experienced positive year over year growth globally for both of our Dunkin’ Donuts and Baskin-Robbins brands in points of distribution in each of the last 10 years. During this ten-year period we have grown our global Dunkin’ Donuts points of distribution and systemwide sales by compound annual growth rates of 6.9% and 8.7%, respectively. During the same period, we have also grown our global Baskin-Robbins total points of distribution and systemwide sales by compound annual growth rates of 4.0% and 6.8%, respectively. In 2008, 2009 and 2010, our Dunkin’ Donuts global points of distribution at year end totaled 8,835, 9,186 and 9,760, respectively. Dunkin’ Donuts systemwide sales for the same three years grew 5.0%, 2.7%, and 5.6%, respectively. In 2008, 2009, 2010, our Baskin-Robbins global points of distribution at year end totaled 6,013, 6,207 and 6,433, respectively. Baskin-Robbins systemwide sales for the same three years grew 5.1%, 9.8%, and 10.6%, respectively.
Our largest operating segment, Dunkin’ Donuts U.S. had experienced 45 consecutive quarters of positive comparable store sales growth until the first quarter of 2008. During fiscal 2008, 2009 and 2010, we believe we demonstrated comparable store sales resilience during the recession, and invested for future growth. These investments were in three key areas—expanding menu and marketing initiatives to drive comparable store sales growth, expanding our store development team and investing in proprietary tools to assess new store opportunities and increasing management resources for our international business. During fiscal 2010, Dunkin’ Donuts U.S. experienced sequential improvement in comparable store sales growth with comparable store sales growth of (0.6)%, 1.9%, 2.7% and 4.7% in the first through the fourth quarters, respectively. Positive comparable store sales growth has continued in the first quarter of fiscal 2011 despite adverse weather conditions in the Northeast region during the quarter.
Dunkin’ Donuts U.S. comparable store sales growth(1)
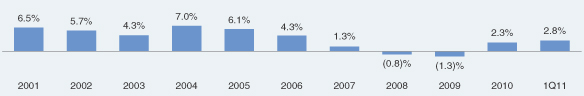
| (1) | Data for fiscal year 2001 through fiscal year 2005 represent results for the fiscal years ended August. All other fiscal years represent results for the fiscal years ended the last Saturday in December. |
Our Baskin-Robbins U.S. operating segment, which represented approximately 7.4% of our total revenues in 2010, experienced decreased comparable stores sales in 2008, 2009 and 2010 of (2.2)%, (6.0)% and (5.2)%, respectively.
- 2 -
Table of Contents
Our competitive business strengths
We attribute our success in the QSR segment to the following strengths:
Strong and established brands with leading market positions
We believe our Dunkin’ Donuts and Baskin-Robbins brands have well-established reputations for delivering high-quality beverage and food products at a good value through convenient locations with fast and friendly service. Today both brands are leaders in their respective QSR categories, with aided brand awareness (where respondents are provided with brand names and asked if they have heard of them) of approximately 95% in the U.S., and a growing presence overseas. For the fifth consecutive year, Dunkin’ Donuts was recognized in 2011 by Brand Keys, a customer satisfaction research company, as #1 in the U.S. on its Customer Loyalty Engagement IndexSM in the coffee category. Our customer loyalty is particularly evident in New England, where we have our highest penetration per capita in the U.S. and where, according to CREST® data, we hold a 52% market share of breakfast daypart visits and a market share of 57% of total QSR coffee based on servings. Further demonstrating the strength of our brand, in 2010, the Dunkin’ Donuts 12 oz. original blend bagged coffee was the #1 grocery stock-keeping unit nationally in the premium coffee category, with double the sales of our closest competitor, according to Nielsen.
Similarly, Baskin-Robbins is the #1 QSR chain in the U.S. for servings of hard serve ice cream and has established leading market positions in Japan and South Korea.
Franchised business model provides a platform for growth
Nearly 100% of our locations are franchised, allowing us to focus on our brand differentiation and menu innovation, while our franchisees expand our points of distribution with operational guidance from us. This expansion requires limited financial investment by us, given that new store development and substantially all of our store advertising costs are funded by franchisees. Consequently, we achieved an operating income margin of approximately 34% in fiscal 2010. For our domestic businesses, our revenues are largely derived from royalties based on a percentage of franchisee revenues rather than their net income, as well as contractual lease payments and other franchise fees.
Store-level economics generate franchisee demand for new Dunkin’ Donuts restaurants in the U.S.
In the U.S., new traditional format Dunkin’ Donuts stores opened during fiscal 2010, excluding gas and convenience locations, generated annualized unit volumes of approximately $855,000, while the average capital expenditure required to open a new traditional restaurant site in the U.S., excluding gas and convenience locations, was approximately $474,000 in 2010. While we do not directly benefit from improvements in store-level profitability, we believe that strong store level economics is important to our ability to attract and retain successful franchisees and grow our business. Of our fiscal 2010 openings and existing commitments, approximately 90% have been made by existing franchisees.
Highly experienced management team
Our senior management team has significant QSR, foodservice and franchise company experience. Prior to joining Dunkin’ Donuts, our CEO Nigel Travis served as the CEO of Papa John’s International Inc. and previously held numerous senior positions at Blockbuster Inc. and Burger King Corporation. Other key members of the
- 3 -
Table of Contents
management team have previously held senior positions at various leading QSR and public consumer and retail companies, including Starbucks Corporation, The Home Depot, McDonald’s, Procter & Gamble, Panera Bread Company and Au Bon Pain.
Our growth strategy
We believe there are significant opportunities to grow our brands globally, further support the profitability of our franchisees, expand our leadership in the coffee, baked goods and ice cream categories of the QSR segment of the restaurant industry and deliver shareholder value by executing on the following strategies:
Increase comparable store sales and profitability in Dunkin’ Donuts U.S.
We intend to continue building on our comparable store sales growth momentum and improve profitability through the following initiatives:
Further increase coffee and beverage sales. Since the late 1980s, we have transformed Dunkin’ Donuts into a brand focused on coffee and other beverages, which products now represent approximately 60% of U.S. systemwide sales for fiscal 2010, and, we believe generate increased customer visits to our stores and higher unit volumes. We plan to increase our coffee and beverage revenue through continued new product innovations and related marketing, including advertising campaigns such as “America Runs on Dunkin’” and “What are you Drinkin’?” Beginning in the summer of 2011, Dunkin’ Donuts will offer Dunkin’ Donuts coffee in Keurig® K-Cups, the leading single-serve brewing system in the U.S., exclusively at participating Dunkin’ Donuts restaurants across the U.S.
Extend leadership in breakfast daypart while growing afternoon daypart. As we maintain and expand our current leading market position in the breakfast daypart through innovative products like the Big ‘N Toasty and the Wake-Up Wrap®, we believe that our extensive coffee- and beverage-based menu, coupled with new “hearty snack” introductions, such as Bagel Twists, position us to grow share in the afternoon daypart (between 2:00 p.m. and 5:00 p.m.).
Continue to develop enhancements in restaurant operations. We will continue to maintain a highly operations-focused culture to help our franchisees maximize the quality and consistency of their customers’ in-store experience, as well as to increase franchisee profitability, particularly through training programs and new technology. As evidence of our recent success in these areas, over 162,000 respondents, representing approximately 93% of all respondents, to our Guest Satisfaction Survey program in March 2011 rated their overall experience as “Satisfied” or “Highly Satisfied,” representing an all-time high.
- 4 -
Table of Contents
Continue Dunkin’ Donuts U.S. contiguous store expansion
We believe there is a significant opportunity to grow our points of distribution for Dunkin’ Donuts in the U.S. given the strong potential outside of the Northeast region to increase our per-capita penetration to levels closer to those in our core markets. In fiscal 2010, we had 206 net new U.S. store openings. During fiscal 2011 and fiscal 2012, we expect our franchisees to open approximately 200 to 250 net new points of distribution per year in the U.S., principally in existing developed markets. We believe that our strategy of focusing on contiguous growth has the potential, over the next 15 to 20 years, to more than double our current U.S. footprint and reach a total of 15,000 points of distribution in the U.S. The following table details our per-capita penetration levels in our U.S. regions.
| Region | Population (in millions) |
Stores1 | Penetration | |||||||||
| New England and New York |
36.0 | 3,720 | 1:9,700 | |||||||||
| Other Eastern U.S. |
142.5 | 2,943 | 1:48,400 | |||||||||
| Western U.S. |
130.0 | 109 | 1:1,193,000 | |||||||||
| 1 | As of December 25, 2010 |
The key elements of our future domestic development strategy are:
Increase penetration in existing markets. In the near term, we intend to focus our development on other existing markets east of the Mississippi River. In certain Eastern U.S. markets outside of our core markets, such as Philadelphia, Chicago and South Florida, we have already achieved per-capita penetration of greater than one Dunkin’ Donuts store for every 25,000 people.
Expand into new markets using a disciplined approach. We believe that the Western part of the U.S. represents a significant growth opportunity for Dunkin’ Donuts. Specifically, in the near-term, we intend to maintain a focus on development in contiguous markets that are adjacent to our existing base, and generally move outward to less penetrated markets in progression, providing for marketing and supply chain efficiencies within each new market.
Focus on store-level economics. In recent years, we have undertaken significant initiatives to further enhance store-level economics for our franchisees that we believe have further increased franchisee profitability. For example, we reduced the upfront capital expenditure costs to open an end-cap restaurant with a drive-thru by approximately 23% between fiscal 2008 and fiscal 2010. Additionally, between fiscal 2008 and the first quarter of fiscal 2011, we believe we have facilitated approximately $220 million in franchisee cost reductions primarily through strategic sourcing, as well as through other initiatives, such as rationalizing the number of product offerings to reduce waste and reducing costs on branded packaging by reducing the color mix in graphics. We believe that the majority of these cost savings represent sustainable improvements to our franchisees’ supply costs, with the remainder dependent upon the outcome of future supply contract re-negotiations, which typically occur every two to four years. However, there can be no assurance that these cost reductions will be sustainable in the future.
Drive accelerated international growth of both brands
We believe there is a significant opportunity to grow our points of distribution for both brands in international markets. Our international expansion strategy has resulted in more than 3,100 net new openings in the last 10 years. During fiscal 2011 and fiscal 2012, we expect our franchisees to open approximately 450 to 500 net new points of distribution per year internationally, principally in our existing markets.
- 5 -
Table of Contents
The key elements of our future international development strategy are:
Grow in our existing core markets. For the Dunkin’ Donuts brand, we intend to focus on growth in South Korea and the Middle East. For Baskin-Robbins, we intend to focus on Japan, South Korea, and key markets in the Middle East. In 2010, we had the #1 market share positions in the Fast Food Ice Cream category in Japan and South Korea.
Capitalize on other markets with significant growth potential. We intend to expand in certain international focus markets where our brands do not have a significant store presence, but where we believe there is consumer demand for our products as well as strong franchisee partners with knowledge of local business practices and consumer preferences. We recently announced an agreement with an experienced QSR franchisee to enter the Indian market with our Dunkin’ Donuts brand with the development of at least 500 Dunkin’ Donuts restaurants throughout India, the first of which are expected to open by early 2012.
Further develop our franchisee support infrastructure. We plan to increase our focus on providing our international franchisees with operational tools and services such as native-language restaurant training programs and new international retail restaurant designs that can help them to efficiently operate in their markets and become more profitable.
Increase comparable store sales growth of Baskin-Robbins U.S.
In the U.S., Baskin-Robbins’ core strengths are its national brand recognition, 65 years of heritage and #1 position in the QSR industry for servings of hard serve ice cream. While the Baskin-Robbins U.S. segment has experienced decreasing comparable store sales in each of the last three years due primarily to increased competition and decreased consumer spending, and the number of Baskin-Robbins U.S. stores has decreased in each year since 2008, we believe that we can capitalize on the brand’s strengths and generate renewed excitement for the brand, including through our recently introduced “More Flavors, More FunTM” marketing campaign. In addition, at the restaurant level, we seek to improve sales by focusing on operational and service improvements as well as through product innovation, marketing and technology.
In August 2010, we hired Bill Mitchell to lead our Baskin-Robbins U.S. operations. Mr. Mitchell currently serves as our Senior Vice President and Brand Officer of Baskin-Robbins U.S., and prior to joining us he served in a variety of senior industry roles. Under Mr. Mitchell’s leadership, early Baskin-Robbins U.S. results include comparable store sales growth in the first quarter of fiscal 2011 of 0.5%. Further, over 6,700 respondents, representing approximately 87% of all respondents, to our Guest Satisfaction Survey program in March 2011 rated their overall experience as “Satisfied” or “Extremely Satisfied,” representing an all-time high.
Risk factors
An investment in our common stock involves a high degree of risk. Any of the factors set forth under “Risk Factors” may limit our ability to successfully execute our business strategy. You should carefully consider all of the information set forth in this prospectus and, in particular, should evaluate the specific factors set forth under “Risk Factors” in deciding whether to invest in our common stock. Among these important risks are the following:
| • | As of March 26, 2011, on an as-adjusted basis after giving effect to this offering and the application of the net proceeds therefrom, we would have had total indebtedness of approximately $1.5 billion and our substantial debt could limit our ability to pursue our growth strategy; |
- 6 -
Table of Contents
| • | our plans depend on initiatives designed to increase sales and improve the efficiencies, costs and effectiveness of our operations, and failure to achieve or sustain these plans could affect our performance adversely; |
| • | general economic factors and changes in consumer preference may adversely affect our performance; |
| • | we face competition that could limit our growth opportunities; and |
| • | our planned future growth will be impeded, which would adversely affect revenues, if our franchisees cannot open new domestic and international restaurants as anticipated. |
The Sponsors
Bain Capital Partners, LLC
Bain Capital, LLC is a global private investment firm headquartered in Boston whose affiliates, including Bain Capital Partners, manage several pools of capital including private equity, venture capital, public equity, high-yield assets and mezzanine capital with approximately $67 billion in assets under management. Since its inception in 1984, funds sponsored by Bain Capital have made private equity investments and add-on acquisitions in over 300 companies in a variety of industries around the world.
The Carlyle Group
Established in 1987, The Carlyle Group is a global alternative asset manager with $106.7 billion of assets under management committed to 84 funds as of December 31, 2010. Carlyle invests across three asset classes — corporate private equity, real assets and global market strategies — in Africa, Asia, Australia, Europe, North America and South America. Since its inception through December 31, 2010, Carlyle has invested $68.7 billion of equity in 1,035 transactions.
Thomas H. Lee Partners
Thomas H. Lee Partners is one of the world’s oldest and most experienced private equity firms. THL invests in growth-oriented companies, and focuses on global businesses headquartered primarily in North America. Since the firm’s founding in 1974, Thomas H. Lee Partners has acquired more than 100 portfolio companies and have completed over 200 add-on acquisitions, representing a combined value of more than $150 billion. The firm’s two most recent private equity funds comprise more than $14 billion of aggregate committed capital.
Upon completion of this offering, the Sponsors will continue to hold a controlling interest in us and will continue to have significant influence over us and decisions made by stockholders and may have interests that differ from yours. See “Risk factors—Risks related to this offering and our common stock.”
Company information
Our principal executive offices are located at 130 Royall Street, Canton, Massachusetts 02021, our telephone number at that address is (781) 737-3000 and our internet address is www.dunkinbrands.com. Our website, and the information contained on our website, is not part of this prospectus.
- 7 -
Table of Contents
The offering
| Common stock offered by us |
shares (or shares if the underwriters exercise their option to purchase additional shares in full) |
| Common stock to be outstanding immediately after completion of this offering |
shares (or shares if the underwriters exercise their option to purchase additional shares in full) |
| Over-allotment option |
We have granted the underwriters a 30-day option to purchase up to an additional shares to cover over-allotments. |
| Use of proceeds |
We expect to receive net proceeds, after deducting estimated offering expenses and underwriting discounts and commissions, of approximately $ million (or $ million if the underwriters exercise their option to purchase additional shares in full), based on an assumed offering price of $ per share (the mid-point of the price range set forth on the cover of this prospectus). We intend to use the net proceeds from this offering, together with the net proceeds from our additional $100 million of term loan borrowings, as described under “Description of indebtedness—Senior credit facility,” to repay all amounts outstanding under the Dunkin’ Brands, Inc. 9 5/8% senior notes due 2018, and to use any remaining net proceeds for working capital and for general corporate purposes. As of April 30, 2011, there was approximately $475.0 million in aggregate principal amount of the Dunkin’ Brands, Inc. 9 5/8% senior notes outstanding. See “Use of proceeds.” |
| Principal stockholders |
Upon completion of this offering, investment funds affiliated with the Sponsors will indirectly beneficially own a controlling interest in us. As a result, we currently intend to avail ourselves of the controlled company exemption under the NASDAQ Marketplace Rules. For more information, see “Management—Board structure and committee composition.” |
| Risk factors |
You should read carefully the “Risk factors” section of this prospectus for a discussion of factors that you should consider before deciding to invest in shares of our common stock. |
| Proposed NASDAQ Global Select Market symbol |
“DNKN” |
The number of shares of our common stock to be outstanding after this offering is based on the number of shares outstanding after giving effect to the reclassification (assuming an offering price of $ per share (the mid-point of the price range set forth on the cover of this prospectus)) and excludes shares of our common stock issuable upon the exercise of outstanding options at a weighted average exercise price equal to $ per share, of which options to purchase shares were exercisable as of , 2011, and an additional shares of our common stock issuable under our 2011 Omnibus Long-Term Incentive Plan.
- 8 -
Table of Contents
Summary consolidated financial and other data
The following table sets forth our summary historical and unaudited pro forma consolidated financial and other data as of the dates and for the periods indicated. The summary historical financial data as of December 26, 2009 and December 25, 2010 and for each of the three years in the period ended December 25, 2010 presented in this table have been derived from the audited consolidated financial statements included elsewhere in this prospectus. The summary historical financial data as of March 26, 2011 and for the three-month periods ended March 27, 2010 and March 26, 2011 have been derived from the unaudited consolidated financial statements included elsewhere in this prospectus. The summary consolidated balance sheet data as of December 27, 2008 have been derived from our historical audited financial statements for such year, which are not included in this prospectus. The summary consolidated balance sheet data as of March 27, 2010 has been derived from our unaudited consolidated financial statements for such period, which are not included in this prospectus. Historical results are not necessarily indicative of the results to be expected for future periods and operating results for the three-month period ended March 26, 2011 are not necessarily indicative of the results that may be expected for the fiscal year ending December 31, 2011. The unaudited pro forma consolidated financial data for the year ended December 25, 2010 and for the three-month period ended March 26, 2011 have been derived from our historical financial statements for such year and period, which are included elsewhere in this prospectus, after giving effect to the transactions specified under “Unaudited pro forma condensed consolidated financial statements.” The data in the following table related to points of distribution, comparable store sales growth, franchisee-reported sales and systemwide sales growth are unaudited for all periods presented.
This summary historical and unaudited pro forma consolidated financial and other data should be read in conjunction with the disclosures set forth under “Capitalization,” “Unaudited pro forma condensed consolidated financial statements,” “Management’s discussion and analysis of financial condition and results of operations” and the consolidated financial statements and the related notes therto appearing elsewhere in this prospectus.
- 9 -
Table of Contents
| Fiscal year ended | Three months ended | |||||||||||||||||||
| December 27, 2008 |
December 26, 2009 |
December 25, 2010 |
March 27, 2010 |
March 26, 2011 |
||||||||||||||||
| ($ in thousands, except per share data or as otherwise indicated) | ||||||||||||||||||||
| Consolidated Statements of Operations Data: |
||||||||||||||||||||
| Franchise fees and royalty income |
$ | 349,047 | $ | 344,020 | $ | 359,927 | $ | 80,165 | $ | 85,959 | ||||||||||
| Rental income |
97,886 | 93,651 | 91,102 | 22,116 | 22,131 | |||||||||||||||
| Sales of ice cream products |
71,445 | 75,256 | 84,989 | 17,793 | 22,716 | |||||||||||||||
| Other revenues |
26,551 | 25,146 | 41,117 | 7,338 | 8,407 | |||||||||||||||
| Total revenues |
544,929 | 538,073 | 577,135 | 127,412 | 139,213 | |||||||||||||||
| Amortization of intangible assets |
37,848 | 35,994 | 32,467 | 8,823 | 7,082 | |||||||||||||||
| Impairment charges(1) |
331,862 | 8,517 | 7,075 | 1,414 | 653 | |||||||||||||||
| Other operating costs and expenses(2)(3) |
330,281 | 323,318 | 361,893 | 84,132 | 87,424 | |||||||||||||||
| Total operating costs and expenses |
699,991 | 367,829 | 401,435 | 94,369 | 95,159 | |||||||||||||||
| Equity in net income of joint ventures(4) |
14,169 | 14,301 | 17,825 | 3,642 | 782 | |||||||||||||||
| Operating income (loss) |
(140,893 | ) | 184,545 | 193,525 | 36,685 | 44,836 | ||||||||||||||
| Interest expense, net(5) |
(115,944 | ) | (115,019 | ) | (112,532 | ) | (27,520 | ) | (33,767 | ) | ||||||||||
| Gain (loss) on debt extinguishment and refinancing transactions |
— | 3,684 | (61,955 | ) | — | (11,007 | ) | |||||||||||||
| Other gains (losses), net |
(3,929 | ) | 1,066 | 408 | 245 | 476 | ||||||||||||||
| Income (loss) before income taxes |
(260,766 | ) | 74,276 | 19,446 | 9,410 | 538 | ||||||||||||||
| Net income (loss) |
$ | (269,898 | ) | $ | 35,008 | $ | 26,861 | $ | 5,938 | $ | (1,723 | ) | ||||||||
| Earnings (loss) per share: |
||||||||||||||||||||
| Class L—basic and diluted |
$ | 4.17 | $ | 4.57 | $ | 4.87 | $ | 1.21 | $ | 0.85 | ||||||||||
| Class A—basic and diluted |
$ | (1.96 | ) | $ | (0.37 | ) | $ | (0.45 | ) | $ | (0.12 | ) | $ | (0.11 | ) | |||||
| Pro Forma Consolidated Statements of Operations Data(6): |
||||||||||||||||||||
| Pro forma net income |
$ | 90,427 | $ | 14,856 | ||||||||||||||||
| Pro forma earnings per share: |
||||||||||||||||||||
| Basic |
$ | $ | ||||||||||||||||||
| Diluted |
$ | $ | ||||||||||||||||||
| Pro forma weighted average shares outstanding: |
||||||||||||||||||||
| Basic |
||||||||||||||||||||
| Diluted |
||||||||||||||||||||
| Consolidated Balance Sheet Data: |
||||||||||||||||||||
| Total cash, cash equivalents, and restricted cash(7) |
$ | 251,368 | $ | 171,403 | $ | 134,504 | $ | 201,452 | $ | 120,850 | ||||||||||
| Total assets |
3,341,649 | 3,224,717 | 3,147,288 | 3,216,352 | 3,115,177 | |||||||||||||||
| Total debt(8) |
1,668,410 | 1,451,757 | 1,864,881 | 1,486,267 | 1,867,534 | |||||||||||||||
| Total liabilities |
2,614,327 | 2,454,109 | 2,841,047 | 2,439,924 | 2,802,360 | |||||||||||||||
| Common stock, Class L |
1,127,863 | 1,232,001 | 840,582 | 1,257,068 | 862,184 | |||||||||||||||
| Total stockholders’ equity (deficit) |
(400,541 | ) | (461,393 | ) | (534,341 | ) | (480,640 | ) | (549,367 | ) | ||||||||||
| Other Financial Data: |
||||||||||||||||||||
| Capital expenditures |
27,518 | 18,012 | 15,358 | 3,465 | 3,734 | |||||||||||||||
| Points of Distribution(9): |
||||||||||||||||||||
| Dunkin’ Donuts U.S. |
6,395 | 6,566 | 6,772 | 6,599 | 6,799 | |||||||||||||||
| Dunkin’ Donuts International |
2,440 | 2,620 | 2,988 | 2,685 | 3,006 | |||||||||||||||
| Baskin-Robbins U.S. |
2,692 | 2,597 | 2,547 | 2,572 | 2,523 | |||||||||||||||
| Baskin-Robbins International |
3,321 | 3,610 | 3,886 | 3,650 | 3,959 | |||||||||||||||
| Total distribution points |
14,848 | 15,393 | 16,193 | 15,506 | 16,287 | |||||||||||||||
| Comparable Store Sales Growth (U.S. Only)(10): |
||||||||||||||||||||
| Dunkin’ Donuts |
(0.8)% | (1.3)% | 2.3% | (0.6)% | 2.8% | |||||||||||||||
| Baskin-Robbins |
(2.2)% | (6.0)% | (5.2)% | (7.9)% | 0.5% | |||||||||||||||
| Franchisee-Reported Sales ($ in millions)(11): |
||||||||||||||||||||
| Dunkin’ Donuts U.S. |
$ | 5,004 | $ | 5,174 | $ | 5,403 | $ | 1,233 | $ | 1,299 | ||||||||||
| Dunkin’ Donuts International |
529 | 508 | 584 | 139 | 153 | |||||||||||||||
| Baskin-Robbins U.S. |
560 | 524 | 494 | 102 | 102 | |||||||||||||||
| Baskin-Robbins International |
800 | 970 | 1,158 | 225 | 237 | |||||||||||||||
| Total Franchisee-Reported Sales |
$ | 6,893 | $ | 7,176 | $ | 7,639 | $ | 1,699 | $ | 1,791 | ||||||||||
| Company-Owned Store Sales ($ in millions)(12): |
||||||||||||||||||||
| Dunkin’ Donuts U.S. |
$ | — | $ | 2 | $ | 17 | $ | 2 | $ | 2 | ||||||||||
| Systemwide Sales Growth(13): |
||||||||||||||||||||
| Dunkin’ Donuts U.S. |
4.4% | 3.4% | 4.7% | 2.0% | 5.3% | |||||||||||||||
| Dunkin’ Donuts International |
11.1% | (4.0)% | 15.0% | 19.0% | 10.0% | |||||||||||||||
| Baskin-Robbins U.S. |
(2.1)% | (6.4)% | (5.5)% | (8.8)% | 0.2% | |||||||||||||||
| Baskin-Robbins International |
10.7% | 21.3% | 19.4% | 28.3% | 5.2% | |||||||||||||||
| Total Systemwide Sales Growth |
5.0% | 4.1% | 6.7% | 5.4% | 5.4% | |||||||||||||||
- 10 -
Table of Contents
| (1) | Fiscal year 2008 includes $294.5 million of goodwill impairment charges related to Dunkin’ Donuts U.S. and Baskin-Robbins International, as well as a $34.0 million trade name impairment related to Baskin-Robbins U.S. |
| (2) | Includes fees paid to the Sponsors of $3.0 million for each of the fiscal years 2008, 2009 and 2010 and $750,000 for each of the three months ended March 27, 2010 and March 26, 2011 under a management agreement, which will be terminated upon the consummation of this offering. See “Related party transactions—Arrangements with our investors.” |
| (3) | Includes the following amounts: |
| Fiscal year ended | Three months ended | |||||||||||||||||||
| December 27, | December 26, | December 25, | March 27, | March 26, | ||||||||||||||||
| 2008 | 2009 | 2010 | 2010 | 2011 | ||||||||||||||||
| (Unaudited, $ in thousands) | ||||||||||||||||||||
| Stock compensation expense |
$ | 1,749 | $ | 1,745 | $ | 1,461 | $ | 612 | $ | 241 | ||||||||||
| Transaction costs (a) |
— | — | 1,083 | — | 37 | |||||||||||||||
| Senior executive transition and severance (b) |
1,340 | 3,889 | 4,306 | 323 | 273 | |||||||||||||||
| Franchisee-related restructuring (c) |
— | 12,180 | 2,748 | 474 | — | |||||||||||||||
| Legal reserves and related costs |
— | — | 4,813 | — | 475 | |||||||||||||||
| Breakage income on historical gift certificates |
— | (3,166 | ) | — | — | — | ||||||||||||||
| New market entry (d) |
7,239 | 1,735 | — | — | 275 | |||||||||||||||
| Technology and market related initiatives (e) |
— | 134 | 2,066 | 430 | 1,509 | |||||||||||||||
| (a) | Represents costs and expenses related to our 2010 refinancing and dividend transactions. |
| (b) | Represents severance and related benefit costs associated with non-recurring reorganizations (fiscal 2010 includes the accrual of costs associated with our executive Chairman transition). |
| (c) | Represents one-time costs of franchisee-related restructuring programs. |
| (d) | Represents one-time costs and fees associated with entry into new markets. |
| (e) | Represents costs associated with various franchisee information technology and one-time market research programs. |
| (4) | Includes amortization expense, net of tax, related to intangible franchise rights established in purchase accounting of $907,000, $899,000, and $897,000 for fiscal years 2008, 2009 and 2010, respectively, and $219,000 for each of the three months ended March 27, 2010 and March 26, 2011, respectively. |
| (5) | Interest expense, net, for fiscal year 2010 and the three months ended March 26, 2011 on a pro forma basis would have been approximately $71.5 million and $17.9 million, respectively. See “Unaudited pro forma condensed consolidated financial statements.” |
| (6) | See “Unaudited pro forma condensed consolidated financial statements.” |
| (7) | Amounts as of December 27, 2008 and December 26, 2009 include cash held in restricted accounts pursuant to the terms of the securitization indebtedness. Following the redemption and discharge of the securitization indebtedness in fiscal year 2010, such amounts are no longer restricted. The amounts also include cash held as advertising funds or reserved for gift card/certificate programs. Our cash, cash equivalents and restricted cash balance at December 27, 2008 increased primarily as a result of short-term borrowings. |
| (8) | Includes capital lease obligations of $4.2 million, $5.4 million, $5.4 million, $5.4 million and $5.3 million as of December 27, 2008, December 26, 2009, December 25, 2010, March 27, 2010 and March 26, 2011, respectively. |
| (9) | Represents period end points of distribution. |
| (10) | Represents the growth in average weekly sales for franchisee- and company-owned restaurants that have been open at least 54 weeks that have reported sales in the current and comparable prior year week. |
| (11) | Franchisee-reported sales include sales at franchisee restaurants, including joint ventures. |
| (12) | Company-owned store sales include sales at restaurants owned and operated by Dunkin’ Brands. During all periods presented, Baskin-Robbins U.S. company-owned store sales were less than $500,000. |
| (13) | Systemwide sales growth represents the percentage change in sales at both franchisee- and company-owned restaurants from the comparable period of the prior year. Changes in systemwide sales are driven by changes in average comparable store sales and changes in the number of restaurants. |
- 11 -
Table of Contents
An investment in our common stock involves various risks. You should carefully consider the following risks and all of the other information contained in this prospectus before investing in our common stock. The risks described below are those which we believe are the material risks that we face. The trading price of our common stock could decline due to any of these risks, and you may lose all or part of your investment in our common stock.
Risks related to our business and industry
Our financial results are affected by the operating results of our franchisees.
We receive a substantial majority of our revenues in the form of royalties, which are generally based on a percentage of gross sales at franchised restaurants, rent and other fees from franchisees. Accordingly, our financial results are to a large extent dependent upon the operational and financial success of our franchisees. If sales trends or economic conditions worsen for franchisees, their financial results may deteriorate and our royalty, rent and other revenues may decline and our accounts receivable and related allowance for doubtful accounts may increase. In addition, if our franchisees fail to renew their franchise agreements, our royalty revenues may decrease which in turn could materially and adversely affect our business and operating results.
Our franchisees could take actions that could harm our business.
Our franchisees are contractually obligated to operate their restaurants in accordance with the operations, safety and health standards set forth in our agreements with them. However, franchisees are independent third parties whom we do not control. The franchisees own, operate and oversee the daily operations of their restaurants. As a result, the ultimate success and quality of any franchised restaurant rests with the franchisee. If franchisees do not successfully operate restaurants in a manner consistent with required standards, franchise fees paid to us and royalty income will be adversely affected and brand image and reputation could be harmed, which in turn could materially and adversely affect our business and operating results.
Although we believe we generally enjoy a positive working relationship with the vast majority of our franchisees, active and/or potential disputes with franchisees could damage our brand reputation and/or our relationships with the broader franchisee group.
Sub-franchisees could take actions that could harm our business and that of our master franchisees.
In certain of our international markets, we enter into agreements with master franchisees that permit the master franchisee to develop and operate restaurants in defined geographic areas. As permitted by our master franchisee agreements, certain master franchisees elect to sub-franchise rights to develop and operate restaurants in the geographic area covered by the master franchisee agreement. Our master franchisee agreements contractually obligate our master franchisees to operate their restaurants in accordance with specified operations, safety and health standards and also require that any sub-franchise agreement contain similar requirements. However, we are not party to the agreements with the sub-franchisees and, as a result, are dependent upon our master franchisees to enforce these standards with respect to sub-franchised restaurants. As a result, the ultimate success and quality of any sub-franchised restaurant rests with the master
- 12 -
Table of Contents
franchisee. If sub-franchisees do not successfully operate their restaurants in a manner consistent with required standards, franchise fees and royalty income paid to the applicable master franchisee and, ultimately, to us could be adversely affected and our brand image and reputation may be harmed, which could materially and adversely affect our business and operating results.
Our success depends substantially on the value of our brands.
Our success is dependent in large part upon our ability to maintain and enhance the value of our brands, our customers’ connection to our brands and a positive relationship with our franchisees. Brand value can be severely damaged even by isolated incidents, particularly if the incidents receive considerable negative publicity or result in litigation. Some of these incidents may relate to the way we manage our relationship with our franchisees, our growth strategies, our development efforts in domestic and foreign markets, or the ordinary course of our, or our franchisees’, business. Other incidents may arise from events that are or may be beyond our ability to control and may damage our brands, such as actions taken (or not taken) by one or more franchisees or their employees relating to health, safety, welfare or otherwise; litigation and claims; security breaches or other fraudulent activities associated with our electronic payment systems; and illegal activity targeted at us or others. Consumer demand for our products and our brands’ value could diminish significantly if any such incidents or other matters erode consumer confidence in us or our products, which would likely result in lower sales and, ultimately, lower royalty income, which in turn could materially and adversely affect our business and operating results.
The quick service restaurant segment is highly competitive, and competition could lower our revenues.
The QSR segment of the restaurant industry is intensely competitive. The beverage and food products sold by our franchisees compete directly against products sold at other QSRs, local and regional beverage and food operations, specialty beverage and food retailers, supermarkets and wholesale suppliers, many bearing recognized brand names and having significant customer loyalty. In addition to the prevailing baseline level of competition, major market players in noncompeting industries may choose to enter the restaurant industry. Key competitive factors include the number and location of restaurants, quality and speed of service, attractiveness of facilities, effectiveness of advertising, marketing and operational programs, price, demographic patterns and trends, consumer preferences and spending patterns, menu diversification, health or dietary preferences and perceptions and new product development. Some of our competitors have substantially greater financial and other resources than us, which may provide them with a competitive advantage. In addition, we compete within the restaurant industry and the QSR segment not only for customers but also for qualified franchisees. We cannot guarantee the retention of any, including the top-performing, franchisees in the future, or that we will maintain the ability to attract, retain, and motivate sufficient numbers of franchisees of the same caliber, which could materially and adversely affect our business and operating results. If we are unable to maintain our competitive position, we could experience lower demand for products, downward pressure on prices, the loss of market share and the inability to attract, or loss of, qualified franchisees, which could result in lower franchise fees and royalty income, and materially and adversely affect our business and operating results.
We cannot predict the impact that the following may have on our business: (i) new or improved technologies, (ii) alternative methods of delivery or (iii) changes in consumer behavior facilitated by these technologies and alternative methods of delivery.
Advances in technologies or alternative methods of delivery, including advances in vending machine technology and home coffee makers, or certain changes in consumer behavior driven by these or other technologies and methods of delivery could have a negative effect on our business. Moreover, technology and consumer offerings
- 13 -
Table of Contents
continue to develop, and we expect that new or enhanced technologies and consumer offerings will be available in the future. We may pursue certain of those technologies and consumer offerings if we believe they offer a sustainable customer proposition and can be successfully integrated into our business model. However, we cannot predict consumer acceptance of these delivery channels or their impact on our business. In addition, our competitors, some of whom have greater resources than us, may be able to benefit from changes in technologies or consumer acceptance of alternative methods of delivery, which could harm our competitive position. There can be no assurance that we will be able to successfully respond to changing consumer preferences, including with respect to new technologies and alternative methods of delivery, or to effectively adjust our product mix, service offerings and marketing and merchandising initiatives for products and services that address, and anticipate advances in, technology and market trends. If we are not able to successfully respond to these challenges, our business, financial condition and operating results could be harmed.
Economic conditions adversely affecting consumer discretionary spending may negatively impact our business and operating results.
We believe that our franchisees’ sales, customer traffic and profitability are strongly correlated to consumer discretionary spending, which is influenced by general economic conditions, unemployment levels and the availability of discretionary income. Recent economic developments have weakened consumer confidence and impacted spending of discretionary income. Our franchisees’ sales are dependent upon discretionary spending by consumers; any reduction in sales at franchised restaurants will result in lower royalty payments from franchisees to us and adversely impact our profitability. If the economic downturn continues for a prolonged period of time or becomes more pervasive, our business and results of operations could be materially and adversely affected. In addition, the pace of new restaurant openings may be slowed and restaurants may be forced to close, reducing the restaurant base from which we derive royalty income. As long as the weak economic environment continues, our franchisees’ sales and profitability and our overall business and operating results could be adversely affected.
Our substantial indebtedness could adversely affect our financial condition.
We have, and after this offering and the application of the net proceeds therefrom, will continue to have, a significant amount of indebtedness. As of March 26, 2011, on an as adjusted basis after giving effect to the May 2011 $100 million increase in our term loan and the corresponding repayment of senior notes, this offering and the application of the net proceeds therefrom, we would have had total indebtedness of approximately $1.5 billion, excluding $11.2 million of undrawn letters of credit and $88.8 million of unused commitments under our senior credit facility.
Subject to the limits contained in the credit agreement governing our senior credit facility and our other debt instruments, we may be able to incur substantial additional debt from time to time to finance working capital, capital expenditures, investments or acquisitions, or for other purposes. If we do so, the risks related to our high level of debt could intensify. Specifically, our high level of debt could have important consequences, including:
| • | limiting our ability to obtain additional financing to fund future working capital, capital expenditures, acquisitions or other general corporate requirements; |
| • | requiring a substantial portion of our cash flow to be dedicated to debt service payments instead of other purposes, thereby reducing the amount of cash flow available for working capital, capital expenditures, acquisitions and other general corporate purposes; |
| • | increasing our vulnerability to adverse changes in general economic, industry and competitive conditions; |
- 14 -
Table of Contents
| • | exposing us to the risk of increased interest rates as certain of our borrowings, including borrowings under the senior credit facility, are at variable rates of interest; |
| • | limiting our flexibility in planning for and reacting to changes in the industry in which we compete; |
| • | placing us at a disadvantage compared to other, less leveraged competitors or competitors with comparable debt at more favorable interest rates; and |
| • | increasing our cost of borrowing. |
Our variable rate debt exposes us to interest rate risk which could adversely affect our cash flow.
The borrowings under our senior credit facility bear interest at variable rates. Other debt we incur also could be variable rate debt. If market interest rates increase, variable rate debt will create higher debt service requirements, which could adversely affect our cash flow. While we may in the future enter into agreements limiting our exposure to higher interest rates, any such agreements may not offer complete protection from this risk.
The terms of our indebtedness restrict our current and future operations, particularly our ability to respond to changes or to take certain actions.
The credit agreement governing our senior credit facility contains a number of restrictive covenants that impose significant operating and financial restrictions on us and may limit our ability to engage in acts that may be in our long-term best interest, including restrictions on our ability to:
| • | incur certain liens; |
| • | incur additional indebtedness and guarantee indebtedness; |
| • | pay dividends or make other distributions in respect of, or repurchase or redeem, capital stock; |
| • | prepay, redeem or repurchase certain debt; |
| • | make investments, loans, advances and acquisitions; |
| • | sell or otherwise dispose of assets, including capital stock of our subsidiaries; |
| • | enter into transactions with affiliates; |
| • | alter the businesses we conduct; |
| • | enter into agreements restricting our subsidiaries’ ability to pay dividends; and |
| • | consolidate, merge or sell all or substantially all of our assets. |
In addition, the restrictive covenants in the credit agreement governing our senior credit facility require us to maintain specified financial ratios and satisfy other financial condition tests. Our ability to meet those financial ratios and tests can be affected by events beyond our control.
A breach of the covenants under the credit agreement governing our senior credit facility could result in an event of default under the applicable indebtedness. Such a default may allow the creditors to accelerate the related debt and may result in the acceleration of any other debt to which a cross-acceleration or cross-default provision applies. In addition, an event of default under the credit agreement governing our senior credit facility would permit the lenders under our senior credit facility to terminate all commitments to extend further
- 15 -
Table of Contents
credit under that facility. Furthermore, if we were unable to repay the amounts due and payable under our senior credit facility, those lenders could proceed against the collateral granted to them to secure that indebtedness, which could force us into bankruptcy or liquidation. In the event our lenders accelerate the repayment of our borrowings, we and our subsidiaries may not have sufficient assets to repay that indebtedness.
If our operating performance declines, we may in the future need to obtain waivers from the required lenders under our senior credit facility to avoid being in default. If we breach our covenants under our senior credit facility and seek a waiver, we may not be able to obtain a waiver from the required lenders. If this occurs we would be in default under our senior credit facility, the lenders could exercise their rights, as described above, and we could be forced into bankruptcy or liquidation. See “Management’s discussion and analysis of financial condition and results of operations—Liquidity and capital resources,” and “Description of indebtedness.”
Infringement, misappropriation or dilution of our intellectual property could harm our business.
We regard our Dunkin’ Donuts® and Baskin-Robbins® trademarks as having significant value and as being important factors in the marketing of our brands. We have also obtained trademark protection for several of our product offerings and advertising slogans, including “America Runs on Dunkin’®” and “What are you Drinkin’?®”. We believe that these and other intellectual property are valuable assets that are critical to our success. We rely on a combination of protections provided by contracts, as well as copyright, patent, trademark, and other laws, such as trade secret and unfair competition laws, to protect our intellectual property from infringement, misappropriation or dilution. We have registered certain trademarks and service marks and have other trademark and service mark registration applications pending in the U.S. and foreign jurisdictions. However, not all of the trademarks or service marks that we currently use have been registered in all of the countries in which we do business, and they may never be registered in all of those countries. Although we monitor trademark portfolios both internally and through external search agents and impose an obligation on franchisees to notify us upon learning of potential infringement, there can be no assurance that we will be able to adequately maintain, enforce and protect our trademarks or other intellectual property rights. We are aware of names and marks similar to our service marks being used by other persons in certain geographic areas in which we have restaurants. Although we believe such uses will not adversely affect us, further or currently unknown unauthorized uses or other infringement of our trademarks or service marks could diminish the value of our brands and may adversely affect our business. Effective intellectual property protection may not be available in every country in which we have or intend to open or franchise a restaurant. Failure to adequately protect our intellectual property rights could damage our brands and impair our ability to compete effectively. Even where we have effectively secured statutory protection for our trade secrets and other intellectual property, our competitors may misappropriate our intellectual property and our employees, consultants and suppliers may breach their contractual obligations not to reveal our confidential information including trade secrets. Although we have taken measures to protect our intellectual property, there can be no assurance that these protections will be adequate or that third parties will not independently develop products or concepts that are substantially similar to ours. Despite our efforts, it may be possible for third-parties to reverse-engineer, otherwise obtain, copy, and use information that we regard as proprietary. Furthermore, defending or enforcing our trademark rights, branding practices and other intellectual property, and seeking an injunction and/or compensation for misappropriation of confidential information, could result in the expenditure of significant resources and divert the attention of management, which in turn may materially and adversely affect our business and operating results.
Although we monitor and restrict franchisee activities through our franchise and license agreements, franchisees may refer to our brands improperly in writings or conversation, resulting in the dilution of our intellectual property. Franchisee noncompliance with the terms and conditions of our franchise or license
- 16 -
Table of Contents
agreements may reduce the overall goodwill of our brands, whether through the failure to meet health and safety standards, engage in quality control or maintain product consistency, or through the participation in improper or objectionable business practices. Moreover, unauthorized third parties may use our intellectual property to trade on the goodwill of our brands, resulting in consumer confusion or dilution. Any reduction of our brands’ goodwill, consumer confusion, or dilution is likely to impact sales, and could materially and adversely impact our business and operating results.
Under certain license agreements, our subsidiaries have licensed to Dunkin’ Brands the right to use certain trademarks, and in connection with those licenses, Dunkin’ Brands monitors the use of trademarks and the quality of the licensed products. While courts have generally approved the delegation of quality-control obligations by a trademark licensor to a licensee under appropriate circumstances, there can be no guarantee that these arrangements will not be deemed invalid on the ground that the trademark owner is not controlling the nature and quality of goods and services sold under the licensed trademarks.
The restaurant industry is affected by consumer preferences and perceptions. Changes in these preferences and perceptions may lessen the demand for our products, which could reduce sales by our franchisees and reduce our royalty revenues.
The restaurant industry is affected by changes in consumer tastes, national, regional and local economic conditions and demographic trends. For instance, if prevailing health or dietary preferences cause consumers to avoid donuts and other products we offer in favor of foods that are perceived as more healthy, our franchisees’ sales would suffer, resulting in lower royalty payments to us, and our business and operating results would be harmed.
If we fail to successfully implement our growth strategy, which includes opening new domestic and international restaurants, our ability to increase our revenues and operating profits could be adversely affected.
Our growth strategy relies in part upon new restaurant development by existing and new franchisees. We and our franchisees face many challenges in opening new restaurants, including:
| • | availability of financing; |
| • | selection and availability of suitable restaurant locations; |
| • | competition for restaurant sites; |
| • | negotiation of acceptable lease and financing terms; |
| • | securing required domestic or foreign governmental permits and approvals; |
| • | consumer tastes in new geographic regions and acceptance of our products; |
| • | employment and training of qualified personnel; |
| • | impact of inclement weather, natural disasters and other acts of nature; and |
| • | general economic and business conditions. |
In particular, because the majority of our new restaurant development is funded by franchisee investment, our growth strategy is dependent on our franchisees’ (or prospective franchisees’) ability to access funds to finance such development. We do not provide our franchisees with direct financing and therefore their ability to access borrowed funds generally depends on their independent relationships with various financial institutions. If our
- 17 -
Table of Contents
franchisees (or prospective franchisees) are not able to obtain financing at commercially reasonable rates, or at all, they may be unwilling or unable to invest in the development of new restaurants, and our future growth could be adversely affected.
To the extent our franchisees are unable to open new stores as we anticipate, our revenue growth would come primarily from growth in comparable store sales. Our failure to add a significant number of new restaurants or grow comparable store sales would adversely affect our ability to increase our revenues and operating income and could materially and adversely harm our business and operating results.
Increases in commodity prices may negatively affect payments from our franchisees and licensees.
Coffee and other commodity prices are subject to substantial price fluctuations, stemming from variations in weather patterns, shifting political or economic conditions in coffee-producing countries and delays in the supply chain. In particular, the cost of commodity inputs for a number of goods, including ice cream and coffee, rose in fiscal 2010. If commodity prices rise, franchisees may experience reduced sales, due to decreased consumer demand at retail prices that have been raised to offset increased commodity prices, which may reduce franchisee profitability. Any such decline in franchisee sales will reduce our royalty income, which in turn may materially and adversely affect our business and operating results.
Through our wholly-owned subsidiary Dunkin’ Brands Canada Ltd. (“DBCL”), we manufacture ice cream at a facility located in Peterborough, Ontario, Canada (the “Peterborough Facility”). We sell such ice cream to certain international franchisees for their resale. As a result, we are subject to risks associated with dairy products and sugar, the primary ingredients used in the production of ice cream at the Peterborough Facility, including price fluctuations and interruptions in the supply chain of these commodities. If the prices of these commodities rise, we may increase the cost of ice cream sold to such international franchisees, but only after a thirty day notice period, during which our margin on such sales would decline.
Our joint ventures in Japan and South Korea (the “International JVs”), as well as our licensees in Russia and India, do not rely on the Peterborough Facility and instead manufacture ice cream products independently. Each of the International JVs owns a manufacturing facility in its country of operation. The revenues derived from the International JVs differ fundamentally from those of other types of franchise arrangements in the system because the income that we receive from the International JVs are based in part on the profitability, rather than the gross sales, of the restaurants operated by the International JVs. Accordingly, in the event that the International JVs experience staple ingredient price increases that adversely affect the profitability of the restaurants operated by the International JVs, that decrease in profitability would reduce distributions by the International JVs to us, which in turn could materially and adversely impact our business and operating results.
Shortages of coffee could adversely affect our revenues.
If coffee consumption continues to increase worldwide or there is a disruption in the supply of coffee due to natural disasters, political unrest or other calamities, the global coffee supply may fail to meet demand. If coffee demand is not met, franchisees may experience reduced sales which, in turn, would reduce our royalty income. Such a reduction in our royalty income may materially and adversely affect our business and operating results.
We and our franchisees rely on computer systems to process transactions and manage our business, and a disruption or a failure of such systems or technology could harm our ability to effectively manage our business.
Network and information technology systems are integral to our business. We utilize various computer systems, including our FAST System and our EFTPay System, which are customized, web-based systems. The FAST System is the system by which our U.S. and Canadian franchisees report their weekly sales and pay their
- 18 -
Table of Contents
corresponding royalty fees and required advertising fund contributions. When sales are reported by a U.S. or Canadian franchisee, a withdrawal for the authorized amount is initiated from the franchisee’s bank after 12 days (from the week ending or month ending date). The FAST System is critical to our ability to accurately track sales and compute royalties due from our U.S. and Canadian franchisees. The EFTPay System is used by our U.S. and Canadian franchisees to make payments against open, non-fee invoices (i.e., all invoices except royalty and advertising funds). When a franchisee selects an invoice and submits the payment, on the following day a withdrawal for the selected amount is initiated from the franchisee’s bank. Our systems, including the FAST System and the EFTPay System, are subject to damage and/or interruption as a result of power outages, computer and network failures, computer viruses and other disruptive software, security breaches, catastrophic events and improper usage by employees. Such events could have an adverse impact on us, including a disruption in operations, a need for a costly repair, upgrade or replacement of systems, or a decrease in, or in the collection of, royalties paid to us by our franchisees.
Interruptions in the supply of product to franchisees and licensees could adversely affect our revenues.
In order to maintain quality-control standards and consistency among restaurants, we require through our franchise agreements that our franchisees obtain food and other supplies from preferred suppliers approved in advance. In this regard, we and our franchisees depend on a group of suppliers for ingredients, foodstuffs, beverages and disposable serving instruments including, but not limited to, Rich Products Corp., Dean Foods Co., PepsiCo, Inc. and Silver Pail Dairy, Ltd. as well as four primary coffee roasters and two primary donut mix suppliers. In 2010, we and our franchisees purchased products from over 450 approved domestic suppliers, with approximately 15 of such suppliers providing half, based on dollar volume, of all products purchased domestically. We look to approve multiple suppliers for most products, and require any single sourced supplier, such as PepsiCo, Inc., to have audited contingency plans in place to ensure continuity of supply. In addition we believe that, if necessary, we could obtain readily available alternative sources of supply for each product that we currently source through a single supplier. To facilitate the efficiency of our franchisees’ supply chain, we have historically entered into several preferred-supplier arrangements for particular food or beverage items.
The Dunkin’ Donuts system is supported domestically by the franchisee-owned purchasing and distribution cooperative known as the National Distributor Commitment Program. We have a long-term agreement with the National DCP, LLC (the “NDCP”) for the NDCP to provide substantially all of the goods needed to operate a Dunkin’ Donuts restaurant in the U.S. The NDCP also supplies some international markets. The NDCP aggregates the franchisee demand, sends requests for proposals to approved suppliers and negotiates contracts for approved items. The NDCP also inventories the items in its four regional distribution centers and ships products to franchisees at least one time per week. We do not control the NDCP and have only limited contractual rights under our agreement with the NDCP associated with supplier certification and quality assurance and protection of our intellectual property. While the NDCP maintains contingency plans with its approved suppliers and has a contingency plan for its own distribution function to restaurants, our franchisees bear risks associated with the timeliness, solvency, reputation, labor relations, freight costs, price of raw materials and compliance with health and safety standards of each supplier (including DBCL and those of the International JVs) including, but not limited to, risks associated with contamination to food and beverage products. We have little control over such suppliers other than DBCL, which produces ice cream for resale by us. Disruptions in these relationships may reduce franchisee sales and, in turn, our royalty income.
Overall difficulty of suppliers (including DBCL and those of the International JVs) meeting franchisee product demand, interruptions in the supply chain, obstacles or delays in the process of renegotiating or renewing agreements with preferred suppliers, financial difficulties experienced by suppliers, or the deficiency, lack, or poor quality of alternative suppliers could adversely impact franchisee sales which, in turn, would reduce our royalty income and could materially and adversely affect our business and operating results.
- 19 -
Table of Contents
We may not be able to recoup our expenditures on properties we sublease to franchisees.
Pursuant to the terms of certain prime leases we have entered into with third-party landlords, we may be required to construct or improve a property, pay taxes, maintain insurance and comply with building codes and other applicable laws. The subleases we enter into with franchisees related to such properties typically pass through such obligations, but if a franchisee fails to perform the obligations passed through to them, we will be required to perform those obligations, resulting in an increase in our leasing and operational costs and expenses. Additionally, in some locations, we may pay more rent and other amounts to third-party landlords under a prime lease than we receive from the franchisee who subleases such property. Typically, our franchisees’ rent is based in part on a percentage of gross sales at the restaurant, so a downturn in gross sales would negatively affect the level of the payments we receive.
If the international markets in which we compete are affected by changes in political, social, legal, economic or other factors, our business and operating results may be materially and adversely affected.
As of March 26, 2011, we had 6,965 restaurants located in 56 foreign countries. The international operations of our franchisees may subject us to additional risks, which differ in each country in which our franchisees operate, and such risks may negatively affect our result in a delay in or loss of royalty income to us.
The factors impacting the international markets in which restaurants are located may include:
| • | recessionary or expansive trends in international markets; |
| • | changes in foreign currency exchange rates and hyperinflation or deflation in the foreign countries in which we or the International JVs operate; |
| • | the imposition of restrictions on currency conversion or the transfer of funds; |
| • | increases in the taxes paid and other changes in applicable tax laws; |
| • | legal and regulatory changes and the burdens and costs of local operators’ compliance with a variety of laws, including trade restrictions and tariffs; |
| • | interruptions in the supply of product; |
| • | increases in anti-American sentiment and the identification of the Dunkin’ Donuts brand and Baskin-Robbins brand as American brands; |
| • | political and economic instability; and |
| • | natural disasters and other calamities. |
Any or all of these factors may reduce distributions from our International JVs or other international partners and/or royalty income, which in turn may materially and adversely impact our business and operating results.
Termination of an arrangement with a master franchisee could adversely impact our revenues.
Internationally, and in limited cases domestically, we enter into relationships with “master franchisees” to develop and operate restaurants in defined geographic areas. Master franchisees are granted exclusivity rights with respect to larger territories than the typical franchisee, and in particular cases, expansion after minimum requirements are met is subject to the discretion of the master franchisee. In fiscal 2008, 2009 and 2010, we derived approximately 12.9%, 14. 1% and 14.6%, respectively, of our total revenues from master franchisee arrangements. The termination of an arrangement with a master franchisee or a lack of expansion by certain
- 20 -
Table of Contents
master franchisees could result in the delay of the development of franchised restaurants, or an interruption in the operation of one of our brands in a particular market or markets. Any such delay or interruption would result in a delay in, or loss of, royalty income to us whether by way of delayed royalty income or delayed revenues from the sale of ice cream products by us to franchisees internationally, or reduced sales. Any interruption in operations due to the termination of an arrangement with a master franchisee similarly could result in lower revenues for us, particularly if we were to determine to close restaurants following the termination of an arrangement with a master franchisee.
Our contracts with the U.S. military are non-exclusive and may be terminated with little notice.
We have contracts with the U.S. military, including with the Army & Air Force Exchange Service and the Navy Exchange Service Command. These military contracts are predominantly between the U.S. military and Baskin-Robbins. We derive revenue from the arrangements provided for under these contracts mainly through the sale of ice cream to the U.S. military (rather than through royalties) for resale on base locations and in field operations. While revenues derived from arrangements with the U.S. military represented less than 2% of our total revenues and less than 6% of our international revenues for 2010, because these contracts are non-exclusive and cancellable with minimal notice and have no minimum purchase requirements, revenues attributable to these contracts may vary significantly year to year. Any changes in the U.S. military’s domestic or international needs, or a decision by the U.S. military to use a different supplier, could result in lower revenues for us.
Fluctuations in exchange rates affect our revenues.
We are subject to inherent risks attributed to operating in a global economy. Most of our revenues, costs and debts are denominated in U.S. dollars. However, sales made by franchisees outside of the U.S. are denominated in the currency of the country in which the point of distribution is located, and this currency could become less valuable prior to calculation of our royalty payments in U.S. dollars as a result of exchange rate fluctuations. As a result, currency fluctuations could reduce our royalty income. Unfavorable currency fluctuations could result in a reduction in our revenues. Cost of ice cream produced in the Peterborough Facility in Canada as well as income we earn from our joint ventures are also subject to currency fluctuations. These currency fluctuations affecting our revenues and costs could adversely affect our business and operating results.
Adverse public or medical opinions about the health effects of consuming our products, as well as reports of incidents involving food-borne illnesses or food tampering, whether or not accurate, could harm our brands and our business.
Some of our products contain caffeine, dairy products, sugar and other active compounds, the health effects of which are the subject of increasing public scrutiny, including the suggestion that excessive consumption of caffeine, dairy products, sugar and other active compounds can lead to a variety of adverse health effects. There has also been greater public awareness that sedentary lifestyles, combined with excessive consumption of high-calorie foods, have led to a rapidly rising rate of obesity. In the U.S. and certain other countries, there is increasing consumer awareness of health risks, including obesity, as well as increased consumer litigation based on alleged adverse health impacts of consumption of various food products. While we offer some healthier beverage and food items, including reduced fat items, an unfavorable report on the health effects of caffeine or other compounds present in our products, or negative publicity or litigation arising from other health risks such as obesity, could significantly reduce the demand for our beverages and food products.
Similarly, instances or reports, whether true or not, of unclean water supply, food-borne illnesses and food tampering have in the past severely injured the reputations of companies in the food processing, grocery and
- 21 -
Table of Contents
QSR segments and could in the future affect us as well. Any report linking us or our franchisees to the use of unclean water, food-borne illnesses or food tampering could damage our brands’ value, immediately and severely hurt sales of beverages and food products and possibly lead to product liability claims. In addition, instances of food-borne illnesses or food tampering, even those occurring solely at the restaurants of competitors, could, by resulting in negative publicity about the foodservice or restaurant industry, adversely affect our sales on a regional or global basis. A decrease in customer traffic as a result of these health concerns or negative publicity could materially and adversely affect our brands and our business.
We may not be able to enforce payment of fees under certain of our franchise arrangements.
In certain limited instances, a franchisee may be operating a restaurant pursuant to an unwritten franchise arrangement. Such circumstances may arise where a franchisee arrangement has expired and new or renewal agreements have yet to be executed or where the franchisee has developed and opened a restaurant but has failed to memorialize the franchisor-franchisee relationship in an executed agreement as of the opening date of such restaurant. In certain other limited instances, we may allow a franchisee in good standing to operate domestically pursuant to franchise arrangements which have expired in their normal course and have not yet been renewed. As of March 26, 2011, less than 2% of our stores were operating without a written agreement. There is a risk that either category of these franchise arrangements may not be enforceable under federal, state and local laws and regulations prior to correction or if left uncorrected. In these instances, the franchise arrangements may be enforceable on the basis of custom and assent of performance. If the franchisee, however, were to neglect to remit royalty payments in a timely fashion, we may be unable to enforce the payment of such fees which, in turn, may materially and adversely affect our business and operating results. While we generally require franchise arrangements in foreign jurisdictions to be entered into pursuant to written franchise arrangements, subject to certain exceptions, some expired contracts, letters of intent or oral agreements in existence may not be enforceable under local laws, which could impair our ability to collect royalty income, which in turn may materially and adversely impact our business and operating results.
Our business activities subject us to litigation risk that could affect us adversely by subjecting us to significant money damages and other remedies or by increasing our litigation expense.
In the ordinary course of business, we are the subject of complaints or litigation from franchisees, usually related to alleged breaches of contract or wrongful termination under the franchise arrangements. In addition, we are, from time to time, the subject of complaints or litigation from customers alleging illness, injury or other food-quality, health or operational concerns and from suppliers alleging breach of contract. We may also be subject to employee claims based on, among other things, discrimination, harassment or wrongful termination. Finally, litigation against a franchisee or its affiliates by third parties, whether in the ordinary course of business or otherwise, may include claims against us by virtue of our relationship with the defendant-franchisee. In addition to decreasing the ability of a defendant-franchisee to make royalty payments and diverting our management resources, adverse publicity resulting from such allegations may materially and adversely affect us and our brands, regardless of whether such allegations are valid or whether we are liable. Our international operations may be subject to additional risks related to litigation, including difficulties in enforcement of contractual obligations governed by foreign law due to differing interpretations of rights and obligations, compliance with multiple and potentially conflicting laws, new and potentially untested laws and judicial systems and reduced or diminished protection of intellectual property. A substantial unsatisfied judgment against us or one of our subsidiaries could result in bankruptcy, which would materially and adversely affect our business and operating results.
- 22 -
Table of Contents
Our business is subject to various laws and regulations and changes in such laws and regulations, and/or failure to comply with existing or future laws and regulations, could adversely affect us.
We are subject to state franchise registration requirements, the rules and regulations of the Federal Trade Commission (the “FTC”), various state laws regulating the offer and sale of franchises in the U.S. through the provision of franchise disclosure documents containing certain mandatory disclosures and certain rules and requirements regulating franchising arrangements in foreign countries. Although we believe that the Franchisors’ Franchise Disclosure Documents, together with any applicable state-specific versions or supplements, and franchising procedures that we use comply in all material respects with both the FTC guidelines and all applicable state laws regulating franchising in those states in which we offer new franchise arrangements, noncompliance could reduce anticipated royalty income, which in turn may materially and adversely affect our business and operating results.
Our franchisees are subject to various existing U.S. federal, state, local and foreign laws affecting the operation of the restaurants including various health, sanitation, fire and safety standards. Franchisees may in the future become subject to regulation (or further regulation) seeking to tax or regulate high-fat foods or requiring the display of detailed nutrition information, which would be costly to comply with and could result in reduced demand for our products. In connection with the continued operation or remodeling of certain restaurants, the franchisees may be required to expend funds to meet U.S. federal, state and local and foreign regulations. Difficulties in obtaining, or the failure to obtain, required licenses or approvals could delay or prevent the opening of a new restaurant in a particular area or cause an existing restaurant to cease operations. All of these situations would decrease sales of an affected restaurant and reduce royalty payments to us with respect to such restaurant.
The franchisees are also subject to the Fair Labor Standards Act of 1938, as amended, and various other laws in the U.S. and in foreign countries governing such matters as minimum-wage requirements, overtime and other working conditions and citizenship requirements. A significant number of our franchisees’ food-service employees are paid at rates related to the U.S. federal minimum wage, and past increases in the U.S. federal minimum wage have increased labor costs, as would future increases. Any increases in labor costs might result in franchisees inadequately staffing restaurants. Understaffed restaurants could reduce sales at such restaurants, decrease royalty payments and adversely affect our brands.
Our and our franchisees’ operations and properties are subject to extensive U.S. federal, state and local laws and regulations, including those relating to environmental, building and zoning requirements. Our development of properties for leasing or subleasing to franchisees depends to a significant extent on the selection and acquisition of suitable sites, which are subject to zoning, land use, environmental, traffic and other regulations and requirements. Failure to comply with legal requirements could result in, among other things, revocation of required licenses, administrative enforcement actions, fines and civil and criminal liability. We may incur investigation, remediation or other costs related to releases of hazardous materials or other environmental conditions at our properties, regardless of whether such environmental conditions were created by us or a third party, such as a prior owner or tenant. We have incurred costs to address soil and groundwater contamination at some sites, and continue to incur nominal remediation costs at some of our other locations. If such issues become more expensive to address, or if new issues arise, they could increase our expenses, generate negative publicity, or otherwise adversely affect us.
- 23 -
Table of Contents
Our tax returns and positions are subject to review and audit by federal, state and local taxing authorities and adverse outcomes resulting from examination of our income or other tax returns could adversely affect our operating results and financial condition.
The federal income tax returns of the Company for fiscal years 2006, 2007 and 2008 are currently under audit by the Internal Revenue Service (“IRS”), and the IRS has proposed adjustments for fiscal years 2006 and 2007 to increase our taxable income as it relates to our gift card program, specifically to record taxable income upon the activation of gift cards. We have filed a protest to the IRS’ proposed adjustments, and we believe we have alternative grounds to appeal or settle on should this position be denied (see Note 14 of the notes to our audited consolidated financial statements included elsewhere in this prospectus). As described in Note 14 of the notes to our audited consolidated financial statements included in this prospectus, if the IRS were to prevail in this matter the proposed adjustments would result in additional taxable income of approximately $58.9 million for fiscal years 2006 and 2007 and approximately $26.0 million of additional federal and state taxes and interest owed, net of federal and state benefits. If the IRS prevails, a cash payment would be required and the additional taxable income would represent temporary differences that will be deductible in future years. Therefore, the potential tax expense attributable to the IRS adjustments for 2006 and 2007 would be limited to $2.1 million, consisting of federal and state interest, net of federal and state benefits. In addition, if the IRS were to prevail in respect of fiscal years 2006 and 2007 it is likely to make similar claims for years subsequent to fiscal 2007 and the potential additional federal and state taxes and interest owed, net of federal and state benefits, for fiscal years 2008, 2009 and 2010, computed on a similar basis to the IRS method used for fiscal years 2006 and 2007, and factoring in for the timing of our gift card uses and activations, would be approximately $19.2 million. The corresponding potential tax expense impact attributable to these later fiscal years, 2008 through 2010, would be approximately $0.3 million. While we believe that the Company has properly reported taxable income and paid taxes in accordance with applicable laws and that the proposed adjustments are inconsistent with our franchisor model and the structure of our gift card program, no assurance can be made that we will prevail in the final resolution of this matter. An unfavorable outcome from any tax audit could result in higher tax costs, penalties and interest, thereby negatively and adversely impacting our financial condition, results of operations or cash flows.
We are subject to a variety of additional risks associated with our franchisees.
Our franchise system subjects us to a number of risks, any one of which may impact our ability to collect royalty payments from our franchisees, may harm the goodwill associated with our brands, and/or may materially and adversely impact our business and results of operations.
Bankruptcy of U.S. Franchisees. A franchisee bankruptcy could have a substantial negative impact on our ability to collect payments due under such franchisee’s franchise arrangements and, to the extent such franchisee is a lessee pursuant to a franchisee lease/sublease with us, payments due under such franchisee lease/sublease. In a franchisee bankruptcy, the bankruptcy trustee may reject its franchise arrangements and/or franchisee lease/sublease pursuant to Section 365 under the United States bankruptcy code, in which case there would be no further royalty payments and/or franchisee lease/sublease payments from such franchisee, and there can be no assurance as to the proceeds, if any, that may ultimately be recovered in a bankruptcy proceeding of such franchisee in connection with a damage claim resulting from such rejection.
Franchisee Changes in Control. The franchise arrangements prohibit “changes in control” of a franchisee without our consent as the franchisor, except in the event of the death or disability of a franchisee (if a natural person) or a principal of a franchisee entity. In such event, the executors and representatives of the franchisee are required by to transfer the relevant franchise arrangements to a successor franchisee approved by the franchisor. There is, however, no assurance that any such successor would be found or, if found, would be able
- 24 -
Table of Contents
to perform the former franchisee’s obligations under such franchise arrangements or successfully operate the restaurant. If a successor franchisee is not found, or if the successor franchisee that is found is not as successful in operating the restaurant as the then-deceased franchisee or franchisee principal, the sales of the restaurant could be adversely affected.
Franchisee Insurance. The franchise arrangements require each franchisee to maintain certain insurance types and levels. Certain extraordinary hazards, however, may not be covered, and insurance may not be available (or may be available only at prohibitively expensive rates) with respect to many other risks. Moreover, any loss incurred could exceed policy limits and policy payments made to franchisees may not be made on a timely basis. Any such loss or delay in payment could have a material and adverse effect on a franchisee’s ability to satisfy its obligations under its franchise arrangement, including its ability to make royalty payments.
Some of our Franchisees are Operating Entities. Franchisees may be natural persons or legal entities. Our franchisees that are operating companies (as opposed to limited purpose entities) are subject to business, credit, financial and other risks, which may be unrelated to the operations of the restaurants. These unrelated risks could materially and adversely affect a franchisee that is an operating company and its ability to make its royalty payments in full or on a timely basis, which in turn may materially and adversely affect our business and operating results.
Franchise Arrangement Termination; Nonrenewal. Each franchise arrangement is subject to termination by us as the franchisor in the event of a default, generally after expiration of applicable cure periods, although under certain circumstances a franchise arrangement may be terminated by us upon notice without an opportunity to cure. The default provisions under the franchise arrangements are drafted broadly and include, among other things, any failure to meet operating standards and actions that may threaten the licensed intellectual property.
In addition, each franchise agreement has an expiration date. Upon the expiration of the franchise arrangement, we or the franchisee may, or may not, elect to renew the franchise arrangements. If the franchisee arrangement is renewed, the franchisee will receive a “successor” franchise arrangement for an additional term. Such option, however, is contingent on the franchisee’s execution of the then-current form of franchise arrangements (which may include increased royalty payments, advertising fees and other costs), the satisfaction of certain conditions (including modernization of the restaurant and related operations) and the payment of a renewal fee. If a franchisee is unable or unwilling to satisfy any of the foregoing conditions, the expiring franchise arrangements will terminate upon expiration of the term of the franchise arrangements.
Product Liability Exposure. We require franchisees to maintain general liability insurance coverage to protect against the risk of product liability and other risks and demand strict franchisee compliance with health and safety regulations. However, franchisees may receive through the supply chain (from central manufacturing locations (CMLs), NDCP or otherwise), or produce defective food or beverage products, which may adversely impact our brands’ goodwill.
Americans with Disabilities Act. Restaurants located in the U.S. must comply with Title III of the Americans with Disabilities Act of 1990, as amended (the “ADA”). Although we believe newer restaurants meet the ADA construction standards and, further, that franchisees have historically been diligent in the remodeling of older restaurants, a finding of noncompliance with the ADA could result in the imposition of injunctive relief, fines, an award of damages to private litigants or additional capital expenditures to remedy such noncompliance. Any imposition of injunctive relief, fines, damage awards or capital expenditures could adversely affect the ability of a franchisee to make royalty payments, or could generate negative publicity, or otherwise adversely affect us.
Franchisee Litigation. Franchisees are subject to a variety of litigation risks, including, but not limited to, customer claims, personal-injury claims, environmental claims, employee allegations of improper termination
- 25 -
Table of Contents
and discrimination, claims related to violations of the ADA, religious freedom, the Fair Labor Standards Act, the Employee Retirement Income Security Act of 1974, as amended (“ERISA”) and intellectual-property claims. Each of these claims may increase costs and limit the funds available to make royalty payments and reduce the execution of new franchise arrangements.
Potential conflicts with franchisee organizations. Although we believe our relationship with our franchisees is open and strong, the nature of the franchisor-franchisee relationship can give rise to conflict. In the U.S., our approach is collaborative in that we have established district advisory councils, regional advisory councils and a national brand advisory council for each of the Dunkin’ Donuts brand and the Baskin-Robbins brand. The councils are comprised of franchisees and brand employees and executives, and they meet to discuss the strengths, weaknesses, challenges and opportunities facing the brands as well as the rollout of new products and projects. Internationally, our operations are primarily conducted through joint ventures with local licensees, so our relationships are conducted directly with our licensees rather than separate advisory committees. No material disputes exist in the U.S. or internationally at this time.
Failure to retain our existing senior management team or the inability to attract and retain new qualified personnel could hurt our business and inhibit our ability to operate and grow successfully.
Our success will continue to depend to a significant extent on our executive management team and the ability of other key management personnel to replace executives who retire or resign. We may not be able to retain our executive officers and key personnel or attract additional qualified management personnel to replace executives who retire or resign. Failure to retain our leadership team and attract and retain other important personnel could lead to ineffective management and operations, which could materially and adversely affect our business and operating results.
If we or our franchisees or licensees are unable to protect our customers’ credit card data, we or our franchisees could be exposed to data loss, litigation, and liability, and our reputation could be significantly harmed.
Privacy protection is increasingly demanding and the introduction of electronic payment methods exposes us and our franchisees to increased risk of privacy and/or security breaches as well as other risks. In connection with credit card sales, our franchisees (and we from our company-operated restaurants) transmit confidential credit card information by way of secure private retail networks. Although we use private networks, third parties may have the technology or know-how to breach the security of the customer information transmitted in connection with credit card sales, and our franchisees’ and our security measures and those of our technology vendors may not effectively prohibit others from obtaining improper access to this information. If a person is able to circumvent these security measures, he or she could destroy or steal valuable information or disrupt our operations. Any security breach could expose us to risks of data loss, litigation, and liability, and could seriously disrupt our operations. Any resulting negative publicity could significantly harm our reputation and could materially and adversely affect our business and operating results.
Catastrophic events may disrupt our business.
Unforeseen events, including war, terrorism and other international, regional or local instability or conflicts (including labor issues), embargos, public health issues (including tainted food, food-borne illnesses, food tampering, or water supply or widespread/pandemic illness such as the avian or H1N1 flu), and natural disasters such as earthquakes, tsunamis, hurricanes, or other adverse weather and climate conditions, whether occurring in the U.S. or abroad, could disrupt our operations or that of our franchisees, or suppliers; or result in political or economic instability. For example, the recent earthquake and tsunami in Japan resulted in the temporary
- 26 -
Table of Contents
closing of a number of Baskin-Robbins restaurants, seven of which remain closed. These events could reduce traffic in our restaurants and demand for our products; make it difficult or impossible for our franchisees to receive products from their suppliers; disrupt or prevent our ability to perform functions at the corporate level; and/or otherwise impede our or our franchisees’ ability to continue business operations in a continuous manner consistent with the level and extent of business activities prior to the occurrence of the unexpected event or events, which in turn may materially and adversely impact our business and operating results.
Risks related to this offering and our common stock
We are a “controlled company” within the meaning of the NASDAQ Marketplace Rules and, as a result, we will qualify for, and intend to rely on, exemptions from certain corporate governance requirements. You will not have the same protections afforded to stockholders of companies that are subject to such requirements.
After completion of this offering, the Sponsors will continue to control a majority of the voting power of our outstanding common stock. As a result, we are a “controlled company” within the meaning of the corporate governance standards of The NASDAQ Global Select Market. Under these rules, a company of which more than 50% of the voting power is held by an individual, group or another company is a “controlled company” and may elect not to comply with certain corporate governance requirements, including:
| • | the requirement that a majority of the board of directors consist of independent directors; |
| • | the requirement that we have a nominating/corporate governance committee that is composed entirely of independent directors with a written charter addressing the committee’s purpose and responsibilities, or otherwise have director nominees selected by vote of a majority of the independent directors; |
| • | the requirement that we have a compensation committee that is composed entirely of independent directors with a written charter addressing the committee’s purpose and responsibilities; and |
| • | the requirement for an annual performance evaluation of the nominating/corporate governance and compensation committees. |
Following this offering, we intend to utilize these exemptions. As a result, we will not have a majority of independent directors, our compensation committee will not consist entirely of independent directors and the board committees will not be subject to annual performance evaluations. In addition, we will not have a nominating and corporate governance committee. Accordingly, you will not have the same protections afforded to stockholders of companies that are subject to all of the corporate governance requirements of The NASDAQ Global Select Market.
The Sponsors, however, are not subject to any contractual obligation to retain their controlling interest, except that they have agreed, subject to certain exceptions, not to sell or otherwise dispose of any shares of our common stock or other capital stock or other securities exercisable or convertible therefor for a period of at least 180 days after the date of this prospectus without the prior written consent of J.P. Morgan Securities LLC, Barclays Capital Inc. and Morgan Stanley & Co. LLC. Except for this brief period, there can be no assurance as to the period of time during which any of the Sponsors will maintain their ownership of our common stock following the offering.
Our stock price could be extremely volatile and, as a result, you may not be able to resell your shares at or above the price you paid for them.
Since the time that we were acquired by Allied Domecq PLC in 1989, there has not been a public market for our common stock, and an active public market for our common stock may not develop or be sustained after this offering. In addition, the stock market in general has been highly volatile. As a result, the market price of our
- 27 -
Table of Contents
common stock is likely to be similarly volatile, and investors in our common stock may experience a decrease, which could be substantial, in the value of their stock, including decreases unrelated to our operating performance or prospects, and could lose part or all of their investment. The price of our common stock could be subject to wide fluctuations in response to a number of factors, including those described elsewhere in this prospectus and others such as:
| • | variations in our operating performance and the performance of our competitors; |
| • | actual or anticipated fluctuations in our quarterly or annual operating results; |
| • | publication of research reports by securities analysts about us or our competitors or our industry; |
| • | our failure or the failure of our competitors to meet analysts’ projections or guidance that we or our competitors may give to the market; |
| • | additions and departures of key personnel; |
| • | strategic decisions by us or our competitors, such as acquisitions, divestitures, spin-offs, joint ventures, strategic investments or changes in business strategy; |
| • | the passage of legislation or other regulatory developments affecting us or our industry; |
| • | speculation in the press or investment community; |
| • | changes in accounting principles; |
| • | terrorist acts, acts of war or periods of widespread civil unrest; |
| • | natural disasters and other calamities; and |
| • | changes in general market and economic conditions. |
As we operate in a single industry, we are especially vulnerable to these factors to the extent that they affect our industry or our products, or to a lesser extent our markets. In the past, securities class action litigation has often been initiated against companies following periods of volatility in their stock price. This type of litigation could result in substantial costs and divert our management’s attention and resources, and could also require us to make substantial payments to satisfy judgments or to settle litigation.
Your percentage ownership in us may be diluted by future issuances of capital stock, which could reduce your influence over matters on which stockholders vote.
Following the closing of this offering, our board of directors has the authority, without action or vote of our stockholders, to issue all or any part of our authorized but unissued shares of common stock, including shares issuable upon the exercise of options, or shares of our authorized but unissued preferred stock. Issuances of common stock or voting preferred stock would reduce your influence over matters on which our stockholders vote, and, in the case of issuances of preferred stock, would likely result in your interest in us being subject to the prior rights of holders of that preferred stock.
There may be sales of a substantial amount of our common stock after this offering by our current stockholders, and these sales could cause the price of our common stock to fall.
After this offering, there will be shares of common stock outstanding. There will be shares issued and outstanding if the underwriters exercise in full their option to purchase additional shares. Of our issued and outstanding shares, all the common stock sold in this offering will be freely transferable, except for any shares
- 28 -
Table of Contents
held by our “affiliates,” as that term is defined in Rule 144 under the Securities Act of 1933, as amended (the “Securities Act”). Following completion of this offering, approximately % of our outstanding common stock (or % if the underwriters exercise in full their option to purchase additional shares from us) will be held by investment funds affiliated with the Sponsors and members of our management and employees.
Each of our directors, executive officers and significant equity holders (including affiliates of the Sponsors) have entered into a lock-up agreement with J.P. Morgan Securities LLC, Barclays Capital Inc. and Morgan Stanley & Co. LLC on behalf of the underwriters which regulates their sales of our common stock for a period of 180 days after the date of this prospectus, subject to certain exceptions and automatic extensions in certain circumstances. See “Shares eligible for future sale– Lock-up agreements.”
Sales of substantial amounts of our common stock in the public market after this offering, or the perception that such sales will occur, could adversely affect the market price of our common stock and make it difficult for us to raise funds through securities offerings in the future. Of the shares to be outstanding after the offering, the shares offered by this prospectus will be eligible for immediate sale in the public market without restriction by persons other than our affiliates. Our remaining outstanding shares will become available for resale in the public market as shown in the chart below.
| Number of Shares | Date Available for Resale | |
| 180 days after this offering ( , ), subject to certain exceptions and automatic extensions in certain circumstances. | ||
Beginning 180 days after this offering, subject to certain exceptions and automatic extensions in certain circumstances, holders of shares of our common stock may require us to register their shares for resale under the federal securities laws, and holders of additional shares of our common stock would be entitled to have their shares included in any such registration statement, all subject to reduction upon the request of the underwriter of the offering, if any. See “Related party transactions—Arrangements with our investors.” Registration of those shares would allow the holders to immediately resell their shares in the public market. Any such sales or anticipation thereof could cause the market price of our common stock to decline.
In addition, after this offering, we intend to register shares of common stock that are reserved for issuance under our 2011 Omnibus Long-Term Incentive Plan. For more information, see “Shares eligible for future sale—Registration statements on form S-8.”
Certain participants in our directed share program must hold their shares for a minimum of 180 days following the date of the final prospectus related to this offering and accordingly will be subject to market risks not imposed on other investors in the offering.
At our request, the underwriters have reserved up to shares of the common stock offered hereby for sale to our employees and franchisees. Purchasers of these shares who have entered into a lockup agreement with the underwriters in connection with this offering, which generally includes our officers, directors and significant stockholders, will be required to agree that they will not, subject to exceptions, offer, sell, contract to sell or otherwise dispose of or hedge any such shares for a period of 180 days after the date of the final prospectus relating to this offering, subject to certain specified extensions. As a result of such restriction, such purchasers may face risks not faced by other investors who have the right to sell their shares at any time following the offering. These risks include the market risk of holding our shares during the period that such restrictions are in effect. In addition, the price of our common stock may be adversely affected following expiration of the lockup period if there is an increase in the number of shares for sale in the market.
- 29 -
Table of Contents
Provisions in our charter documents and Delaware law may deter takeover efforts that you feel would be beneficial to stockholder value.
In addition to the Sponsors’ beneficial ownership of a controlling percentage of our common stock, our certificate of incorporation and bylaws and Delaware law contain provisions which could make it harder for a third party to acquire us, even if doing so might be beneficial to our stockholders. These provisions include a classified board of directors and limitations on actions by our stockholders. In addition, our board of directors has the right to issue preferred stock without stockholder approval that could be used to dilute a potential hostile acquiror. Our certificate of incorporation also imposes some restrictions on mergers and other business combinations between us and any holder of 15% or more of our outstanding common stock other than the Sponsors. As a result, you may lose your ability to sell your stock for a price in excess of the prevailing market price due to these protective measures and efforts by stockholders to change the direction or management of the company may be unsuccessful. See “Description of capital stock.”
If you purchase shares in this offering, you will suffer immediate and substantial dilution.
If you purchase shares of our common stock in this offering, you will incur immediate and substantial dilution in the pro forma book value of your stock, which would have been $ per share as of March 26, 2011 based on an assumed initial public offering price of $ per share (the mid-point of the offering range shown on the cover of this prospectus), because the price that you pay will be substantially greater than the net tangible book value per share of the shares you acquire. You will experience additional dilution upon the exercise of options and warrants to purchase our common stock, including those options currently outstanding and those granted in the future, and the issuance of restricted stock or other equity awards under our stock incentive plans. To the extent we raise additional capital by issuing equity securities, our stockholders will experience substantial additional dilution. See “Dilution.”
Because certain of our officers hold restricted stock or option awards that will vest upon a change of control if the Sponsors achieve certain minimum rates of return on their initial investment in us, these officers may have interests in us that conflict with yours.
Certain of our officers hold, in the aggregate, shares of restricted stock and options to purchase shares that are subject to vesting upon a change of control if the Sponsors achieve certain minimum rates of return on their initial investment in us. See “Management—Potential payments upon termination or change in control—change in control” for additional information regarding the required minimum rate of return. As a result, these officers may view certain change of control transactions more favorably than an investor in this offering due to the vesting opportunities available to them and, as a result, may have an economic incentive to support a transaction that you may not believe to be favorable to stockholders who purchased shares in this offering.
The Sponsors will continue to have significant influence over us after this offering, including control over decisions that require the approval of stockholders, which could limit your ability to influence the outcome of key transactions, including a change of control.
We are currently controlled, and after this offering is completed will continue to be controlled, by the Sponsors. Upon completion of this offering, investment funds affiliated with the Sponsors will beneficially own % of our outstanding common stock ( % if the underwriters exercise in full the option to purchase additional shares from us). For as long as the Sponsors continue to beneficially own shares of common stock representing more than 50% of the voting power of our common stock, they will be able to direct the election of all of the members of our board of directors and could exercise a controlling influence over our business and affairs,
- 30 -
Table of Contents
including any determinations with respect to mergers or other business combinations, the acquisition or disposition of assets, the incurrence of indebtedness, the issuance of any additional common stock or other equity securities, the repurchase or redemption of common stock and the payment of dividends. Similarly, these entities will have the power to determine matters submitted to a vote of our stockholders without the consent of our other stockholders, will have the power to prevent a change in our control and could take other actions that might be favorable to them. Even if their ownership falls below 50%, the Sponsors will continue to be able to strongly influence or effectively control our decisions. In addition, each of the Sponsors will have a contractual right to nominate two directors to our board for as long as such Sponsor owns at least 10% of our outstanding common stock (and one director for so long as such Sponsor owns at least 3% of our outstanding common stock) and the Sponsors will have certain contractual rights to have their nominees serve on our compensation committee. See “Related party transactions–Arrangements with our investors.”
Additionally, the Sponsors are in the business of making investments in companies and may acquire and hold interests in businesses that compete directly or indirectly with us. One or more of the Sponsors may also pursue acquisition opportunities that may be complementary to our business and, as a result, those acquisition opportunities may not be available to us.
Because we have no current plans to pay cash dividends on our common stock for the foreseeable future, you may not receive any return on investment unless you sell your common stock for a price greater than that which you paid for it.
We may retain future earnings, if any, for future operation, expansion and debt repayment and have no current plans to pay any cash dividends for the foreseeable future. Any decision to declare and pay dividends in the future will be made at the discretion of our board of directors and will depend on, among other things, our results of operations, financial condition, cash requirements, contractual restrictions and other factors that our board of directors may deem relevant. In addition, our ability to pay dividends may be limited by covenants of any existing and future outstanding indebtedness we or our subsidiaries incur, including our senior credit facility. As a result, you may not receive any return on an investment in our common stock unless you sell our common stock for a price greater than that which you paid for it.
- 31 -
Table of Contents
Cautionary note regarding forward-looking statements
This prospectus includes statements that express our opinions, expectations, beliefs, plans, objectives, assumptions or projections regarding future events or future results and therefore are, or may be deemed to be, “forward-looking statements.” These forward-looking statements can generally be identified by the use of forward-looking terminology, including the terms “believes,” “estimates,” “anticipates,” “expects,” “seeks,” “projects,” “intends,” “plans,” “may,” “will” or “should” or, in each case, their negative or other variations or comparable terminology. These forward-looking statements include all matters that are not historical facts. They appear in a number of places throughout this prospectus and include statements regarding our intentions, beliefs or current expectations concerning, among other things, our results of operations, financial condition, liquidity, prospects, growth, strategies and the industry in which we operate.
By their nature, forward-looking statements involve risks and uncertainties because they relate to events and depend on circumstances that may or may not occur in the future. We believe that these risks and uncertainties include, but are not limited to, those described in the “Risk factors” section of this prospectus, which include, but are not limited to, the following:
| • | the ongoing level of profitability of our franchisees and licensees; |
| • | changes in working relationships with our franchisees and licensees and the actions of our franchisees and licensees; |
| • | our master franchisees’ relationships with sub-franchisees; |
| • | the strength of our brand in the markets in which we compete; |
| • | changes in competition within the quick service restaurant segment of the food service industry; |
| • | changes in consumer behavior resulting from changes in technologies or alternative methods of delivery; |
| • | economic and political conditions in the countries where we operate; |
| • | our substantial indebtedness; |
| • | our ability to protect our intellectual property rights; |
| • | consumer preferences, spending patterns and demographic trends; |
| • | the success of our growth strategy and international development; |
| • | changes in commodity and food prices, particularly coffee, dairy products and sugar, and other operating costs; |
| • | shortages of coffee; |
| • | failure of our network and information technology systems; |
| • | interruptions or shortages in the supply of products to our franchisees and licensees; |
| • | inability to recover our capital costs; |
| • | changes in political, legal, economic or other factors in international markets; |
| • | termination of master franchisee agreement or contracts with the U.S. military; |
| • | currency exchange rates; |
- 32 -
Table of Contents
| • | the impact of food borne-illness or food safety issues or adverse public or medical opinions regarding the health effects of consuming our products; |
| • | our ability to collect royalty payments from our franchisees and licensees; |
| • | uncertainties relating to litigation; |
| • | changes in regulatory requirements or our and our franchisees and licensees ability to comply with current or future regulatory requirements; |
| • | review and audit of certain of our tax returns; |
| • | the ability of our franchisees and licensees to open new restaurants and keep existing restaurants in operation; |
| • | our ability to retain key personnel; |
| • | our inability to protect customer credit card data; and |
| • | catastrophic events. |
Those factors should not be construed as exhaustive and should be read with the other cautionary statements in this prospectus.
Although we base these forward-looking statements on assumptions that we believe are reasonable when made, we caution you that forward-looking statements are not guarantees of future performance and that our actual results of operations, financial condition and liquidity, and the development of the industry in which we operate may differ materially from those made in or suggested by the forward-looking statements contained in this prospectus. In addition, even if our results of operations, financial condition and liquidity, and the development of the industry in which we operate, are consistent with the forward-looking statements contained in this prospectus, those results or developments may not be indicative of results or developments in subsequent periods.
Given these risks and uncertainties, you are cautioned not to place undue reliance on these forward-looking statements. Any forward-looking statement that we make in this prospectus speaks only as of the date of such statement, and we undertake no obligation to update any forward-looking statements or to publicly announce the results of any revisions to any of those statements to reflect future events or developments. Comparisons of results for current and any prior periods are not intended to express any future trends or indications of future performance, unless specifically expressed as such, and should only be viewed as historical data.
- 33 -
Table of Contents
In connection with this offering, on , 2011, we effected a -for- reverse split of our Class A common stock and then reclassified our Class A common stock into common stock. Immediately prior to this offering, we had two classes of common stock outstanding, common stock and Class L common stock. The Class L common stock was identical to the common stock, except that the Class L common stock was convertible into shares of our common stock as described below, and each share of Class L common stock was entitled to a preferential payment upon any distribution by us to holders of our capital stock, whether by dividend, liquidating distribution or otherwise, equal to the base amount for such share ($41.7516) plus an amount that accrued from March 1, 2006, the date that we were acquired by investment funds affiliated with the Sponsors, on the outstanding preference amount at a rate of 9% per annum, compounded quarterly. After payment of this preference amount, each share of common stock and Class L common stock shared equally in all distributions by us to holders of our common stock.
Immediately prior to this offering, we will convert each outstanding share of Class L common stock into of a share of common stock plus an additional number of shares of common stock determined by dividing the Class L preference amount, currently estimated to be $ , by the initial public offering price of a share of our common stock in this offering net of the estimated underwriting discount and a pro rata portion, based upon the number of shares being sold in this offering, of the estimated offering-related expenses incurred by us. The estimated Class L preference amount is based upon an assumed pricing date for this offering of , 2011. To the extent that the pricing date for this offering occurs before or after such date, the Class L preference amount per share will be less or more, as applicable, than such estimated amount by approximately $0.01 per day.
References to the “reclassification” throughout this prospectus refer to the -for- reverse stock split of our Class A common stock, the reclassification of our Class A common stock into our common stock and the conversion of our Class L common stock into our common stock.
Assuming an initial public offering price of $ per share, which is the midpoint of the range set forth on the front cover of this prospectus, offering-related expenses incurred by us as specified under “Underwriting” of , and the Class L preference amount specified above, shares of common stock will be outstanding immediately after the reclassification but before this offering. The actual number of shares of common stock that will be issued as a result of the reclassification is subject to change based on the actual initial public offering price, the offering-related expenses incurred by us and the closing date of this offering. See “Description of capital stock.”
Because the number of shares of Class A common stock into which a share of Class L common stock is convertible will be determined by reference to the initial public offering price in this offering, a change in the assumed initial public offering price would have a corresponding impact on the number of outstanding shares of common stock presented in this prospectus after giving effect to this offering. The following number of shares of our common stock would be outstanding immediately after the reclassification but before this offering, assuming the initial public offering prices for our common stock shown below and assuming the offering related-expenses and the Class L preference amount specified above:
| $ | $ | $ | $ | $ | ||||
|
shares |
shares |
shares |
shares |
shares |
- 34 -
Table of Contents
We estimate that the net proceeds we will receive from the sale of shares of our common stock in this offering, after deducting underwriter discounts and commissions and estimated expenses payable by us, will be approximately $ million (or $ million, if the underwriters exercise their option to purchase additional shares in full). This estimate assumes an initial public offering price of $ per share, the midpoint of the range set forth on the cover page of this prospectus.
A $1.00 increase (decrease) in the assumed initial public offering price of $ per share would increase (decrease) the net proceeds to us from this offering by $ million, assuming the number of shares offered by us, as set forth on the cover page of this prospectus, remains the same and after deducting the estimated underwriting discounts and commissions and estimated expenses payable by us.
We intend to use the net proceeds from this offering, together with the net proceeds from our additional $100 million of term loan borrowings, as described under “Description of indebtedness—Senior credit facility,” to repay all amounts outstanding under the Dunkin’ Brands, Inc. 9 5/8% senior notes due December 1, 2018, and to use any remaining net proceeds for working capital and for general corporate purposes. As of April 30, 2011, there was approximately $475.0 million in aggregate principal amount of the Dunkin’ Brands, Inc. 9 5/8% senior notes outstanding. The senior notes were issued on November 23, 2010, and the proceeds of the senior notes (together with borrowings under Dunkin’ Brands, Inc.’s senior credit facility and cash on hand) were used to repay indebtedness of certain of our indirect subsidiaries, to pay a cash dividend of $500.0 million on the outstanding shares of our Class L common stock and to pay related fees and expenses.
- 35 -
Table of Contents
On December 3, 2010, we paid a cash dividend of $500.0 million on the outstanding shares of our Class L common stock. Our board of directors does not currently intend to pay regular dividends on our common stock. However, we expect to reevaluate our dividend policy on a regular basis following this offering and may, subject to compliance with the covenants contained in our senior credit facility and other considerations, determine to pay dividends in the future.
- 36 -
Table of Contents
The following table sets forth our cash and cash equivalents and our consolidated capitalization as of March 26, 2011 on (1) an actual basis and (2) an as adjusted basis to give effect to (w) the reclassification that will be effectuated prior to the closing of this offering as if it had occurred on March 26, 2011, (x) the issuance of common stock in this offering and the application of the net proceeds there from as described in “Use of proceeds” (y) our additional $100 million in term loan borrowings and corresponding repayment of senior notes, and (z) the payment of approximately $14 million out of general funds in fees under our management agreement with the Sponsors in connection with this offering and the termination of the management agreement. See “Description of indebtedness—Senior credit facility” and “Related party transactions.”
This table should be read in conjunction with “Use of Proceeds,” “Selected consolidated financial and other data,” “Unaudited pro forma condensed consolidated financial statements,” “Management’s discussion and analysis of financial condition and results of operations” and our consolidated financial statements and related notes appearing elsewhere in this prospectus.
| As of March 26, 2011 |
||||||||
| Actual | As adjusted |
|||||||
| (Dollars in thousands) | ||||||||
| Cash and cash equivalents(1)(2) |
$ | 120,508 | $ | |||||
| Long-term debt, including current portion; |
||||||||
| Revolving credit facility(3) |
$ | — | $ | |||||
| Term loan facility |
1,394,146 | |||||||
| Capital leases |
5,316 | |||||||
| Total secured debt |
1,399,462 | |||||||
| 9 5/8% senior notes |
468,072 | |||||||
| Total long-term debt |
1,867,534 | |||||||
| Class L common stock $0.001 par value; 100,000,000 shares authorized and 23,060,006 shares issued and outstanding on an actual basis; no shares authorized, issued and outstanding on an as adjusted basis |
862,184 | |||||||
| Stockholders’ equity (deficit) : |
||||||||
| Preferred stock, $0.001 par value; no shares authorized, issued and outstanding on an actual basis; shares authorized and no shares issued and outstanding on an as adjusted basis |
||||||||
| Common stock, $0.001 par value; 400,000,000 shares authorized and 192,219,311 shares issued and outstanding on an actual basis; shares authorized and shares issued and outstanding on an as adjusted basis |
192 | |||||||
| Additional paid-in capital |
196,245 | |||||||
| Treasury stock, at cost |
(1,919 | ) | ||||||
| Accumulated deficit(4) |
(762,469 | ) | ||||||
| Accumulated other comprehensive income |
18,584 | |||||||
| Total stockholders’ equity (deficit) |
(549,367 | ) | ||||||
| Total capitalization |
$ | 2,180,351 | $ | |||||
- 37 -
Table of Contents
| (1) | Amount includes an aggregate of $69.3 million of cash held for advertising funds or reserved for gift card/certificate programs. |
| (2) | A $1.00 increase (decrease) in the assumed initial public offering price of $ per share of our common stock would increase (decrease) our as adjusted cash and cash equivalents by $ million, after deducting the estimated underwriters’ discounts and commissions and estimated expenses payable by us. |
| (3) | Excludes $11.2 million of undrawn letters of credit. |
| (4) | The as adjusted amount reflects the loss on debt extinguishment to be recorded in connection with the repayment of the senior notes, fees expensed in connection with the additional $100.0 million term loan borrowings, and the termination fee related to the management agreement with the Sponsors, all of which are net of tax benefits. See “Unaudited pro forma condensed consolidated financial statements.” |
- 38 -
Table of Contents
If you invest in our common stock, your ownership interest will be immediately diluted to the extent of the difference between the initial public offering price per share of our common stock and the net tangible book value per share of our common stock after this offering. Dilution results from the fact the initial public offering price per share of the common stock is substantially in excess of the book value per share of common stock attributable to the existing stockholders for the presently outstanding shares of common stock. We calculate net tangible book value per share of our common stock by dividing the net tangible book value by the number of outstanding shares of our common stock.
Our net tangible book value deficiency at March 26, 2011 was approximately $ , or $ per share of our common stock pro forma for the reclassification but before giving effect to this offering. Pro forma net tangible book value deficiency per share before the offering has been determined by dividing net tangible book value (total book value of tangible assets, which excludes goodwill, net intangible assets and deferred financing costs, less total liabilities, which excludes unfavorable operating leases acquired) by the number of shares of common stock outstanding at March 26, 2011, assuming that the reclassification had taken place on March 26, 2011. Dilution in net tangible book value deficiency per share represents the difference between the amount per share that you pay in this offering and the net tangible book value deficiency per share immediately after this offering.
After giving effect to the receipt of the estimated net proceeds from our sale of shares in this offering, assuming an initial public offering price of $ per share (the mid-point of the offering range shown on the cover of this prospectus), and the application of the estimated net proceeds therefrom as described under “Use of proceeds,” our pro forma as adjusted net tangible book value deficiency at March 26, 2011 would have been approximately $ , or $ per share of common stock. This represents an immediate decrease in net tangible book value deficiency per share of $ to existing stockholders and an immediate increase in net tangible book value deficiency per share of $ to you. The following table illustrates this dilution per share.
| Assumed initial public offering price per share of common stock |
$ | |||||||
| Pro forma net tangible book value per share at March 26, 2011 |
$ | |||||||
| Increase per share attributable to new investors in this offering |
||||||||
| Pro forma net tangible book value per share of common stock after this offering |
$ | |||||||
| Dilution per share to new investors |
$ | |||||||
If the underwriters exercise their over-allotment option in full to purchase additional shares, the pro forma as adjusted net tangible book value deficiency per share of our common stock after giving effect to this offering would be $ per share of our common stock. This represents a decrease in pro forma as adjusted net tangible book value deficiency of $ per share of our common stock to existing stockholders and dilution in pro forma as adjusted net tangible book value deficiency of $ per share of our common stock to you.
A $1.00 increase (decrease) in the assumed initial public offering price of $ per share of our common stock would decrease (increase) our pro forma net tangible book value deficiency after giving effect to the offering by $ million, or by $ per share of our common stock, assuming no change to the number of shares of our common stock offered by us as set forth on the cover page of this prospectus, and after deducting the estimated underwriting discounts and estimated expenses payable by us.
- 39 -
Table of Contents
The following table sets forth, as of March 26, 2011, the number of shares of common stock purchased from us, the total consideration paid to us and the average price per share paid by existing stockholders and to be paid by new investors purchasing shares of common stock in this offering, before deducting underwriting discounts and commissions and estimated offering expenses payable by us.
| Shares purchased | Total consideration | Average price per |
||||||||||||||||||
| Number | Percent | Amount | Percent | |||||||||||||||||
| Existing stockholders (1) |
% | $ | % | $ | ||||||||||||||||
| New investors |
||||||||||||||||||||
| Total |
100% | $ | 100% | |||||||||||||||||
| (1) | Total consideration excludes cumulative dividends paid to existing stockholders of $590.0 million. |
If the underwriters were to fully exercise their over-allotment option to purchase additional shares of our common stock from us, the percentage of shares of our common stock held by existing stockholders would be %, and the percentage of shares of our common stock held by new investors would be %.
To the extent any outstanding options or other equity awards are exercised or become vested or any additional options or other equity awards are granted and exercised or become vested or other issuances of shares of our common stock are made, there may be further economic dilution to new investors.
- 40 -
Table of Contents
Selected consolidated financial and other data
The following table sets forth our selected historical and unaudited pro forma consolidated financial and other data as of the dates and for the periods indicated. The selected historical financial data as of December 26, 2009 and December 25, 2010 and for each of the three years in the period ended December 25, 2010 presented in this table have been derived from our audited consolidated financial statements included elsewhere in this prospectus. The selected historical financial data as of March 26, 2011 and for the three-month periods ended March 27, 2010 and March 26, 2011 have been derived from our unaudited consolidated financial statements included elsewhere in this prospectus. The selected consolidated balance sheet data as of March 27, 2010 has been derived from our unaudited consolidated financial statements as of such date, which are not included in this prospectus. The selected historical financial data as of December 30, 2006, December 29, 2007 and December 27, 2008 and for the ten month period ended December 30, 2006 and the year ended December 29, 2007 have been derived from our audited consolidated financial statements for such years and periods, which are not included in this prospectus. Historical results are not necessarily indicative of the results to be expected for future periods and operating results for the three-month period ended March 26, 2011 are not necessarily indicative of the results that may be expected for the fiscal year ending December 31, 2011. The unaudited pro forma consolidated financial data for the year ended December 25, 2010 and for the three-month period ended March 26, 2011 have been derived from our historical financial statements for such year and period, which are included elsewhere in this prospectus, after giving effect to the transactions specified under “Unaudited pro forma condensed consolidated financial statements.” The data in the following table related to points of distribution, comparable store sales growth, franchisee-reported sales, and systemwide sales growth are unaudited for all periods presented.
This selected historical and unaudited pro forma consolidated financial and other data should be read in conjunction with the disclosure set forth under “Capitalization,” “Unaudited pro forma condensed consolidated financial statements,” “Management’s discussion and analysis of financial condition and results of operations” and the consolidated financial statements and the related notes thereto appearing elsewhere in this prospectus.
- 41 -
Table of Contents
| Ten months ended December 30, 2006(1) |
Fiscal year ended | Three months ended | ||||||||||||||||||||||||||
| December 29, 2007 |
December 27, 2008 |
December 26, 2009 |
December 25, 2010 |
March 27, 2010 |
March 26, 2011 |
|||||||||||||||||||||||
| ($ in thousands, except per share data or as otherwise noted) | ||||||||||||||||||||||||||||
| Consolidated Statements of Operations Data: |
||||||||||||||||||||||||||||
| Franchise fees and royalty income |
$ | 255,654 | $ | 325,441 | $ | 349,047 | $ | 344,020 | $ | 359,927 | $ | 80,165 | $ | 85,959 | ||||||||||||||
| Rental income |
80,016 | 98,860 | 97,886 | 93,651 | 91,102 | 22,116 | 22,131 | |||||||||||||||||||||
| Sales of ice cream products |
49,064 | 63,777 | 71,445 | 75,256 | 84,989 | 17,793 | 22,716 | |||||||||||||||||||||
| Other revenues |
26,612 | 28,857 | 26,551 | 25,146 | 41,117 | 7,338 | 8,407 | |||||||||||||||||||||
| Total revenues |
411,346 | 516,935 | 544,929 | 538,073 | 577,135 | 127,412 | 139,213 | |||||||||||||||||||||
| Amortization of intangible assets |
33,050 | 39,387 | 37,848 | 35,994 | 32,467 | 8,823 | 7,082 | |||||||||||||||||||||
| Impairment charges(2) |
1,525 | 4,483 | 331,862 | 8,517 | 7,075 | 1,414 | 653 | |||||||||||||||||||||
| Other operating costs and expenses(3)(4) |
281,428 | 311,005 | 330,281 | 323,318 | 361,893 | 84,132 | 87,424 | |||||||||||||||||||||
| Total operating costs and expenses |
316,003 | 354,875 | 699,991 | 367,829 | 401,435 | 94,369 | 95,159 | |||||||||||||||||||||
| Equity in net income of joint ventures(5) |
11,219 | 12,439 | 14,169 | 14,301 | 17,825 | 3,642 | 782 | |||||||||||||||||||||
| Operating income (loss) |
106,562 | 174,499 | (140,893 | ) | 184,545 | 193,525 | 36,685 | 44,836 | ||||||||||||||||||||
| Interest expense, net(6) |
(131,827 | ) | (111,677 | ) | (115,944 | ) | (115,019 | ) | (112,532 | ) | (27,520 | ) | (33,767 | ) | ||||||||||||||
| Gain (loss) on debt extinguishment and refinancing transactions |
— | — | — | 3,684 | (61,955 | ) | — | (11,007 | ) | |||||||||||||||||||
| Other gains (losses), net |
162 | 3,462 | (3,929 | ) | 1,066 | 408 | 245 | 476 | ||||||||||||||||||||
| Income (loss) from continuing operations before income taxes |
(25,103 | ) | 66,284 | (260,766 | ) | 74,276 | 19,446 | 9,410 | 538 | |||||||||||||||||||
| Income (loss) from continuing operations |
(14,354 | ) | 39,331 | (269,898 | ) | 35,008 | 26,861 | 5,938 | (1,723 | ) | ||||||||||||||||||
| Net income (loss)(7) |
$ | (13,400 | ) | $ | 34,699 | $ | (269,898 | ) | $ | 35,008 | $ | 26,861 | $ | 5,938 | $ | (1,723 | ) | |||||||||||
| Earnings (loss) per share: |
||||||||||||||||||||||||||||
| Class L—basic and diluted |
$ | 6.50 | $ | 4.12 | $ | 4.17 | $ | 4.57 | $ | 4.87 | $ | 1.21 | $ | 0.85 | ||||||||||||||
| Class A—basic and diluted |
$ | (0.89 | ) | $ | (0.32 | ) | $ | (1.96 | ) | $ | (0.37 | ) | $ | (0.45 | ) | $ | (0.12 | ) | $ | (0.11 | ) | |||||||
| Pro Forma Consolidated Statements of Operations Data(8): |
||||||||||||||||||||||||||||
| Pro forma net income |
$ | 90,427 | $ | 14,856 | ||||||||||||||||||||||||
| Pro forma earnings per share: |
||||||||||||||||||||||||||||
| Basic |
$ | $ | ||||||||||||||||||||||||||
| Diluted |
$ | $ | ||||||||||||||||||||||||||
| Pro forma weighted average shares outstanding: |
||||||||||||||||||||||||||||
| Basic |
||||||||||||||||||||||||||||
| Diluted |
||||||||||||||||||||||||||||
| Consolidated Balance Sheet Data: |
||||||||||||||||||||||||||||
| Total cash, cash equivalents, and restricted cash(9) |
$ | 127,558 | $ | 147,968 | $ | 251,368 | $ | 171,403 | $ | 134,504 | $ | 201,452 | $ | 120,850 | ||||||||||||||
| Total assets |
3,622,084 | 3,608,753 | 3,341,649 | 3,224,717 | 3,147,288 | 3,216,352 | 3,115,177 | |||||||||||||||||||||
| Total debt(10) |
1,603,636 | 1,603,561 | 1,668,410 | 1,451,757 | 1,864,881 | 1,486,267 | 1,867,534 | |||||||||||||||||||||
| Total liabilities |
2,569,294 | 2,606,011 | 2,614,327 | 2,454,109 | 2,841,047 | 2,439,924 | 2,802,360 | |||||||||||||||||||||
| Common stock, Class L |
1,029,488 | 1,033,450 | 1,127,863 | 1,232,001 | 840,582 | 1,257,068 | 862,184 | |||||||||||||||||||||
| Total stockholders’ equity (deficit) |
23,302 | (30,708 | ) | (400,541 | ) | (461,393 | ) | (534,341 | ) | (480,640 | ) | (549,367 | ) | |||||||||||||||
| Other Financial Data: |
||||||||||||||||||||||||||||
| Capital expenditures |
29,706 | 37,542 | 27,518 | 18,012 | 15,358 | 3,465 | 3,734 | |||||||||||||||||||||
| Points of Distribution(11): |
||||||||||||||||||||||||||||
| Dunkin’ Donuts U.S. |
5,368 | 5,769 | 6,395 | 6,566 | 6,772 | 6,599 | 6,799 | |||||||||||||||||||||
| Dunkin’ Donuts International |
1,925 | 2,219 | 2,440 | 2,620 | 2,988 | 2,685 | 3,006 | |||||||||||||||||||||
| Baskin-Robbins U.S. |
2,872 | 2,763 | 2,692 | 2,597 | 2,547 | 2,572 | 2,523 | |||||||||||||||||||||
| Baskin-Robbins International |
3,021 | 3,111 | 3,321 | 3,610 | 3,886 | 3,650 | 3,959 | |||||||||||||||||||||
| Total distribution points |
13,186 | 13,862 | 14,848 | 15,393 | 16,193 | 15,506 | 16,287 | |||||||||||||||||||||
- 42 -
Table of Contents
| Ten months |
Fiscal year ended | Three months ended | ||||||||||||||||||||||||||
| December 29, 2007 |
December 27, 2008 |
December 26, 2009 |
December 25, 2010 |
March 27, 2010 |
March 26, 2011 |
|||||||||||||||||||||||
| ($ in thousands, except as otherwise noted) | ||||||||||||||||||||||||||||
| Comparable Store Sales Growth (U.S. Only)(12): |
||||||||||||||||||||||||||||
| Dunkin’ Donuts |
4.1% | 1.3% | (0.8)% | (1.3)% | 2.3% | (0.6)% | 2.8% | |||||||||||||||||||||
| Baskin-Robbins |
(2.2)% | 0.3% | (2.2)% | (6.0)% | (5.2)% | (7.9)% | 0.5% | |||||||||||||||||||||
| Franchisee-Reported Sales ($ in millions)(13): |
||||||||||||||||||||||||||||
| Dunkin’ Donuts U.S. |
$ | 3,842 | $ | 4,792 | $ | 5,004 | $ | 5,174 | $ | 5,403 | $ | 1,233 | $ | 1,299 | ||||||||||||||
| Dunkin’ Donuts International |
364 | 476 | 529 | 508 | 584 | 139 | 153 | |||||||||||||||||||||
| Baskin-Robbins U.S. |
503 | 572 | 560 | 524 | 494 | 102 | 102 | |||||||||||||||||||||
| Baskin-Robbins International |
575 | 723 | 800 | 970 | 1,158 | 225 | 237 | |||||||||||||||||||||
| Total Franchisee-Reported Sales |
$ | 5,284 | $ | 6,563 | $ | 6,893 | $ | 7,176 | $ | 7,639 | $ | 1,699 | $ | 1,791 | ||||||||||||||
| Company-Owned Store Sales ($ in millions)(14): |
||||||||||||||||||||||||||||
| Dunkin’ Donuts U.S. |
$ | — | $ | — | $ | — | $ | 2 | $ | 17 | $ | 2 | $ | 2 | ||||||||||||||
| Systemwide Sales Growth(15): |
||||||||||||||||||||||||||||
| Dunkin’ Donuts U.S. |
5.7% | 4.4% | 3.4% | 4.7% | 2.0% | 5.3% | ||||||||||||||||||||||
| Dunkin’ Donuts International |
8.5% | 11.1% | (4.0)% | 15.0% | 19.0% | 10.0% | ||||||||||||||||||||||
| Baskin-Robbins U.S. |
(1.3)% | (2.1)% | (6.4)% | (5.5)% | (8.8)% | 0.2% | ||||||||||||||||||||||
| Baskin-Robbins International |
9.7% | 10.7% | 21.3% | 19.4% | 28.3% | 5.2% | ||||||||||||||||||||||
| Total Systemwide Sales Growth |
5.6% | 5.0% | 4.1% | 6.7% | 5.4% | 5.4% | ||||||||||||||||||||||
| (1) | Results relate to the ten months ended December 30, 2006 and do not represent a full fiscal year. We were acquired on March 1, 2006. The results reflect the period from March 1, 2006 through December 30, 2006. |
| (2) | Fiscal year 2008 includes $294.5 million of goodwill impairment charges related to Dunkin’ Donuts U.S. and Baskin-Robbins International, as well as a $34.0 million trade name impairment charge related to Baskin-Robbins U.S. |
| (3) | Includes fees paid to the Sponsors of $2.5 million for the ten months ended December 30, 2006, $3.0 million for each of fiscal 2007, 2008, 2009 and 2010 and $750,000 for each of the three months ended March 27, 2010 and March 26, 2011, under a management agreement, which will be terminated upon the consummation of this offering. See “Related party transactions—Arrangements with our investors.” |
| (4) | Includes the following amounts: |
| Ten months ended December 30, 2006 |
Fiscal year ended | Three months ended | ||||||||||||||||||||||||||
| December 29, | December 27, | December 26, | December 25, | March 27, | March 26, | |||||||||||||||||||||||
| 2007 | 2008 | 2009 | 2010 | 2010 | 2011 | |||||||||||||||||||||||
| (Unaudited, $ in thousands) | ||||||||||||||||||||||||||||
| Stock compensation expense |
$ | 3,086 | $ | 2,782 | $ | 1,749 | $ | 1,745 | $ | 1,461 | $ | 612 | $ | 241 | ||||||||||||||
| Transaction costs (a) |
18,466 | 1,323 | — | — | 1,083 | — | 37 | |||||||||||||||||||||
| Senior executive transition and severance (b) |
740 | — | 1,340 | 3,889 | 4,306 | 323 | 273 | |||||||||||||||||||||
| Franchisee-related restructuring (c) |
— | — | — | 12,180 | 2,748 | 474 | — | |||||||||||||||||||||
| Legal reserves and related costs |
— | — | — | — | 4,813 | — | 475 | |||||||||||||||||||||
| Breakage income on historical gift certificates |
— | — | — | (3,166 | ) | — | — | — | ||||||||||||||||||||
| New market entry (d) |
— | — | 7,239 | 1,735 | — | — | 275 | |||||||||||||||||||||
| Technology and market related initiatives (e) |
— | — | — | 134 | 2,066 | 430 | 1,509 | |||||||||||||||||||||
| (a) | Represents costs and expenses related to our fiscal year end change, the securitization and other debt transactions, and our 2010 refinancing and dividend transactions. |
| (b) | Represents severance and related benefit costs associated with non-recurring reorganizations (fiscal 2010 includes the accrual of costs associated with our executive Chairman transition). |
| (c) | Represents one-time costs of franchisee-related restructuring programs. |
| (d) | Represents one-time costs and fees associated with entry into new markets. |
| (e) | Represents costs associated with various franchisee information technology and one-time market research programs. |
- 43 -
Table of Contents
| (5) | Includes amortization expense, net of tax, related to intangible franchise rights established in purchase accounting of $1.8 million, $907 thousand, $899,000, and $897,000 for fiscal years 2007, 2008, 2009, and 2010, respectively, and $219,000 for each of the three months ended March 27, 2010 and March 26, 2011, respectively. |
| (6) | Interest expense, net, for fiscal year 2010 and the three months ended March 26, 2011 on a pro forma basis would have been approximately $71.5 million and $17.9 million, respectively. See “Unaudited pro forma condensed consolidated financial statements.” |
| (7) | We completed the sale of our Togo’s brand on November 30, 2007. Net income for the ten months ended December 30, 2006 and the fiscal year ended December 29, 2007 includes income from discontinued operations of $1.0 million and a loss from discontinued operations of $4.6 million, respectively, related to the Togo’s operations and sale. |
| (8) | See “Unaudited pro forma condensed consolidated financial statements.” |
| (9) | Amounts as of December 30, 2006, December 29, 2007, December 27, 2008, and December 26, 2009 include cash held in restricted accounts pursuant to the terms of the securitization indebtedness. Following the redemption and discharge of the securitization indebtedness in fiscal year 2010, such amounts are no longer restricted. The amounts also include cash held for advertising funds or reserved for gift card/certificate programs. Our cash and cash equivalents and restricted cash balances at December 27, 2008 increased primarily as a result of short-term borrowings. |
| (10) | Includes capital lease obligations of $3.7 million, $3.6 million, $4.2 million, $5.4 million, $5.4 million, $5.4 million and $5.3 million as of December 30, 2006, December 29, 2007, December 27, 2008, December 26, 2009, December 25, 2010, March 27, 2010 and March 26, 2011, respectively. |
| (11) | Represents period end distribution points. |
| (12) | Represents the growth in average weekly sales for franchisee- and company-owned restaurants that have been open at least 54 weeks that have reported sales in the current and comparable prior year week. |
| (13) | Franchisee-reported sales include sales at franchisee restaurants, including joint ventures. |
| (14) | Company-owned store sales include sales at restaurants owned and operated by Dunkin’ Brands. During all periods presented, Baskin-Robbins U.S. company-owned store sales were less than $500,000. |
| (15) | Systemwide sales growth represents the percentage change in sales at both franchisee- and company-owned restaurants from the comparable period of the prior year. Changes in systemwide sales are driven by changes in average comparable store sales and changes in the number of restaurants. |
- 44 -
Table of Contents
Unaudited pro forma condensed consolidated financial statements
The following unaudited pro forma condensed consolidated financial statements of Dunkin’ Brands Group, Inc. at March 26, 2011, for the fiscal year ended December 25, 2010, and for the three months ended March 26, 2011, are based on historical consolidated financial statements of Dunkin’ Brands Group, Inc., which are included elsewhere in this prospectus.
The unaudited pro forma condensed consolidated balance sheet at March 26, 2011 gives effect to (a) the issuance of common stock in this offering and the application of the net proceeds therefrom as described in “Use of proceeds,” (b) the reclassification of our Class A common stock and the conversion of our Class L common stock, both into our common stock, as described in “The reclassification,” (c) the termination of our management agreement with the Sponsors in connection with this offering, and (d) the additional $100.0 million in term loan borrowings received by us in May 2011 and the corresponding anticipated repayment of an equal amount of senior notes, as if each had occurred on March 26, 2011.
The unaudited pro forma consolidated statement of operations for the fiscal year ended December 25, 2010 gives effect to (a) adjustments to interest expense as a result of the November 2010 refinancing, the February 2011 re-pricing transaction, a $100.0 million increase in term loans outstanding and the corresponding repayment of an equal amount of senior notes, and the repayment of the remaining outstanding amount of senior notes from the proceeds of this offering and (b) the termination of our management agreement with the Sponsors in connection with this offering, as if each had occurred on the first day of fiscal year 2010.
The unaudited pro forma consolidated statement of operations for the three months ended March 26, 2011 gives effect to (a) adjustments to interest expense as a result of the February 2011 re-pricing transaction, a $100.0 million increase in term loans outstanding and the corresponding repayment of an equal amount of senior notes, and the repayment of the remaining outstanding amount of senior notes from the proceeds of this offering and (b) the termination of our management agreement with the Sponsors in connection with this offering, as if each had occurred on the first day of the first fiscal quarter of 2011.
The unaudited pro forma condensed consolidated financial statements are presented for informational purposes only and do not purport to represent what the actual financial condition or results of operations of Dunkin’ Brands Group, Inc. would have been if such transactions had been completed as of the dates or for the periods indicated above or that may be achieved as of any future date or for any future period. The unaudited pro forma condensed consolidated financial statements should be read in conjunction with the accompanying notes, “Management’s discussion and analysis of financial condition and results of operations,” and the historical consolidated financial statements and accompanying notes of Dunkin’ Brands Group, Inc., included elsewhere in this prospectus.
- 45 -
Table of Contents
Unaudited Pro Forma Condensed Consolidated Balance Sheet
March 26, 2011
(In thousands)
| Adjustments for Other Transactions | ||||||||||||||||||||||||||||
| Historical As Reported March 26, 2011 |
Adjustments Related to the Offering |
Pro Forma for March 26, 2011 |
Reclassification of Common Stock |
Termination of Sponsor Management Agreement |
$100M Term Loan Borrowing |
Pro Forma for the Offering and Other Transactions March 26, 2011 |
||||||||||||||||||||||
| Assets |
||||||||||||||||||||||||||||
| Current assets: |
||||||||||||||||||||||||||||
| Cash and cash equivalents |
$ | 120,508 | (1) | (10) | (14) | |||||||||||||||||||||||
| Prepaid income taxes |
11,767 | (2) | (11) | (15) | ||||||||||||||||||||||||
| Other current assets |
115,905 | (12) | ||||||||||||||||||||||||||
| Total current assets |
248,180 | |||||||||||||||||||||||||||
| Goodwill |
888,675 | |||||||||||||||||||||||||||
| Other intangible assets, net |
1,528,752 | |||||||||||||||||||||||||||
| Other assets |
449,570 | (3) | (16) | |||||||||||||||||||||||||
| Total assets |
$ | 3,115,177 | ||||||||||||||||||||||||||
| Liabilities, Common Stock, and Stockholders’ Equity (Deficit) |
||||||||||||||||||||||||||||
| Current liabilities: |
||||||||||||||||||||||||||||
| Current portion of long-term debt |
$ | 14,000 | (17) | |||||||||||||||||||||||||
| Other current liabilities |
225,394 | (4) | (18) | |||||||||||||||||||||||||
| Total current liabilities |
239,394 | |||||||||||||||||||||||||||
| Long-term debt, net |
1,848,218 | (5) | (19) | |||||||||||||||||||||||||
| Deferred income taxes, net |
587,124 | (6) | ||||||||||||||||||||||||||
| Other long-term liabilities |
127,624 | |||||||||||||||||||||||||||
| Total long-term liabilities |
2,562,966 | |||||||||||||||||||||||||||
| Common stock, Class L |
862,184 | (9) | ||||||||||||||||||||||||||
| Stockholders’ equity (deficit): |
||||||||||||||||||||||||||||
| Common stock, Class A |
192 | (9) | ||||||||||||||||||||||||||
| Common stock |
— | (7) | (9) | |||||||||||||||||||||||||
| Additional paid-in capital |
196,245 | (7) | (9) | |||||||||||||||||||||||||
| Treasury stock, at cost |
(1,919 | ) | (9) | |||||||||||||||||||||||||
| Accumulated deficit |
(762,469 | ) | (8) | (13) | (20) | |||||||||||||||||||||||
| Accumulated other comprehensive income |
18,584 | |||||||||||||||||||||||||||
| Total stockholders’ equity (deficit) |
(549,367 | ) | ||||||||||||||||||||||||||
| Total liabilities, common stock, and stockholders’ equity (deficit) |
$ | 3,115,177 | ||||||||||||||||||||||||||
- 46 -
Table of Contents
Adjustments Related to the Offering
| (1) | To reflect adjustments made to cash for the following: |
| Proceeds from this offering |
$ | |||
| Less: estimated fees and expenses related to this offering |
||||
| Less: repayment of Senior Notes |
||||
| Less: payment of accrued interest on $375.0 million of Senior Notes as of March 26, 2011 |
||||
| Less: prepayment premium due upon repayment of $375.0 million of Senior Notes |
||||
| $ | ||||
| (2) | To adjust prepaid income taxes to reflect the recording of a tax benefit related to the loss on debt extinguishment, as calculated in note 8 below, calculated at an estimated statutory tax rate of 40.0%. |
| (3) | To reflect the write-off of deferred financing costs in connection with the repayment of the Senior Notes. |
| (4) | To reflect the payment of accrued interest of $12.3 million related to $375.0 million of Senior Notes as of March 26, 2011. |
| (5) | To reflect the repayment of Senior Notes with a face amount of $375.0 million, net of unamortized original issue discount of $5.5 million. |
| (6) | To reflect the reduction of deferred tax liability, net, at an estimated statutory tax rate of 40.0% related to share-based compensation expense calculated in note 7(c) below. |
| (7) | The adjustments to additional paid-in capital are summarized as follows: |
| Proceeds from this offering (a) |
||
| Less: estimated fees and expenses related to this offering |
||
| Net proceeds from this offering |
||
| Less: Par value of common stock issued in this offering (b) |
||
| Additional paid-in capital on shares issued in this offering |
||
| Incremental share-based compensation expense (c) |
||
| Total adjustment to additional paid-in capital |
||
| (a) | To reflect the issuance of shares of the Company’s common stock offered hereby at an assumed initial public offering price of $ per share (the midpoint of the range set forth on the cover of this prospectus). |
| (b) | To reflect the reclassification to common stock of the par value of $ per share for the shares issued in this offering. |
| (c) | To reflect approximately $4 million of additional share-based compensation expense expected to be recorded upon completion of this offering related to approximately 4.2 million restricted shares granted to employees that were not eligible to vest until completion of an initial public offering or change of control. See “Management-Compensation discussion and analysis-Change in control.” This estimated amount of share-based compensation expense was determined utilizing Monte Carlo simulations and the value of the underlying common stock on the dates of grant. |
| (8) | To reflect a $9.9 million after-tax loss on debt extinguishment and $2.4 million after-tax share-based compensation expense, as shown below: |
| (a) | The $9.9 million after-tax loss on debt extinguishment to be recorded in connection with the repayment of $375.0 million of Senior Notes consists of the following: |
| Write-off of deferred financing costs related to the Senior Notes |
$ | (9,110 | ) | |
| Write-off of original issue discount related to the Senior Notes |
(5,469 | ) | ||
| Prepayment premium due upon repayment of the Senior Notes |
(1,875 | ) | ||
| Loss on debt extinguishment before income taxes |
(16,454 | ) | ||
| Tax benefit at an estimated statutory tax rate of 40.0% |
6,582 | |||
| Loss on debt extinguishment after income taxes |
$ | (9,872 | ) | |
| (b) | The $2.4 million after-tax share-based compensation expense consists of $4.0 million pre-tax share-based compensation expense as discussed in note 7(c), net of a deferred tax benefit of $1.6 million calculated at an estimated statutory tax rate of 40.0%. |
Reclassification of Common Stock
| (9) | To reflect the reclassification of Class A common stock into common stock, the conversion of Class L common stock to common stock based on its preferential distribution amount, and an approximate -to- reverse stock split. See “The reclassification.” The conversion of Class L common stock to common stock includes the conversion of Class L common treasury stock into common treasury stock of $ million representing historical Class L common stock held in treasury at the shares’ reacquisition cost. The adjustment to common stock is calculated as follows: |
| Class L shares outstanding as of March 26, 2011 |
||||
| Class L conversion factor(a) |
||||
| Converted Class L shares as of March 26, 2011 |
||||
| Class A shares outstanding, pre-split, as of March 26, 2011 |
||||
| Reverse split factor |
||||
| Class A shares outstanding, post-split, as of March 26, 2011 |
||||
| Common shares outstanding as of March 26, 2011 (Converted Class L shares plus Class A shares, post-split) |
||||
| Par value per share |
$ | |||
| Common stock, par value (in thousands) |
$ | |||
| (a) | See note 6 to the unaudited pro forma consolidated statement of operations for the fiscal year ended December 25, 2010 for computation of the Class L conversion factor and related assumptions. |
- 47 -
Table of Contents
| The adjustment to additional paid-in capital is calculated as follows (in thousands): |
| Conversion of Class L common stock at redemption value as of March 26, 2011 |
$ | |||
| Plus: Class L treasury stock ( shares) at reacquisition cost, reclassified to common treasury stock |
||||
| Value of converted Class L common stock |
||||
| Less: Par value of converted Class L common stock ( shares at $ par value per share) |
||||
| Adjustment to additional paid-in capital related to Class L common stock |
||||
| Class A common stock par value, pre-split ( shares at $ par value per share) |
||||
| Less: Class A common stock par value, post-split ( shares at $ par value per share) |
||||
| Adjustment to additional paid-in capital related to Class A common stock |
||||
| Total adjustment to additional paid-in capital |
$ | |||
Termination of Sponsor Management Agreement
| (10) | To reflect cash that will be paid to terminate the management agreement with the Sponsors in connection with this offering of approximately $14.0 million, which is equal to the net present value of the aggregate amount of the $3.0 million annual management fee that would have been payable in each of the five years following such termination less amounts prepaid at March 26, 2011. |
| (11) | To adjust prepaid income taxes to reflect a tax benefit of $5.8 million related to the recognition of the termination fee for the management agreement with the Sponsors, calculated at an estimated statutory tax rate of 40.0%. See note 13. |
| (12) | To reflect a reduction in prepaid expenses of $500,000 for prepaid Sponsor management fees as of March 26, 2011. |
| (13) | To reflect the expense for the $14.5 million termination fee related to the management agreement with the Sponsors, net of a tax benefit of $5.8 million calculated using an estimated statutory tax rate of 40.0%. |
$100 Million Term Loan Borrowing
| (14) | To reflect the net decrease in cash as a result of the repayment of $100.0 million of Senior Notes, offset by an increase in cash as a result of the additional term loan borrowing. The adjustments made to cash are as follows: |
| Proceeds from the additional term loan borrowing |
$ | 100,000 | ||
| Less: payment of accrued interest on the term loan as of March 26, 2011 |
(1,487 | ) | ||
| Less: estimated fees associated with the additional term loan borrowing |
(3,814 | ) | ||
| Less: repayment of Senior Notes |
(100,000 | ) | ||
| Less: payment of accrued interest on $100.0 million of Senior Notes as of March 26, 2011 |
(3,280 | ) | ||
| Less: prepayment premium due upon repayment of $100.0 million of Senior Notes |
(500 | ) | ||
| $ | (9,081 | ) | ||
| (15) | To adjust prepaid income taxes to reflect the recording of a tax benefit related to the loss on debt extinguishment, as calculated in note 20 below, calculated at an estimated statutory tax rate of 40.0%. |
| (16) | To reflect the write-off of deferred financing costs in connection with the repayment of the Senior Notes. |
| (17) | To reflect the current portion of long-term debt related to the additional term loan borrowing as the term loan requires the Company to make annual principal payments of 1% of the original principal amount. |
| (18) | To reflect the payment of accrued interest related to the term loan and accrued interest related to $100.0 million of the Senior Notes as of March 26, 2011. |
| (19) | To reflect the $100.0 million of additional term loan borrowings, net of $1.0 million classified within the current portion of long-term debt, offset by the repayment of Senior Notes with a face amount of $100.0 million, net of original issue discount of $1.5 million. |
| (20) | To reflect the loss on debt extinguishment to be recorded in connection with the repayment of the Senior Notes and the fees expensed in connection with the additional term loan borrowings. The adjustments consist of the following: |
| Write-off of deferred financing costs related to the Senior Notes |
$ | (2,430 | ) | |
| Write-off of original issue discount related to $100.0 million of Senior Notes |
(1,458 | ) | ||
| Prepayment premium due upon repayment of $100.0 million of Senior Notes |
(500 | ) | ||
| Estimated fees associated with the additional term loan borrowings |
(3,814 | ) | ||
| Loss on debt extinguishment and refinancing transaction before income taxes |
(8,202 | ) | ||
| Tax benefit at an estimated statutory tax rate of 40.0% |
3,281 | |||
| Loss on debt extinguishment and refinancing transaction after income taxes |
$ | (4,921 | ) | |
- 48 -
Table of Contents
Unaudited Pro Forma Consolidated Statement of Operations
Fiscal Year Ended December 25, 2010
(In thousands, except share and per share amounts)
| Adjustments for Other Transactions |
||||||||||||||||||||||||
| Historical As Reported Fiscal Year Ended December 25, 2010 |
Adjustments Related to the Offering |
Pro Forma for the Offering December 25, 2010 |
Termination of Sponsor Management Agreement |
Refinancing and Debt- Related Transactions |
Pro Forma Fiscal Year Ended December 25, 2010 |
|||||||||||||||||||
| Revenues: |
||||||||||||||||||||||||
| Franchise fees and royalty income |
$ | 359,927 | — | 359,927 | — | — | 359,927 | |||||||||||||||||
| Rental income |
91,102 | — | 91,102 | — | — | 91,102 | ||||||||||||||||||
| Sales of ice cream products |
84,989 | — | 84,989 | — | — | 84,989 | ||||||||||||||||||
| Other revenues |
41,117 | — | 41,117 | — | — | 41,117 | ||||||||||||||||||
| Total revenues |
577,135 | — | 577,135 | — | — | 577,135 | ||||||||||||||||||
| Operating costs and expenses: |
||||||||||||||||||||||||
| Occupancy expenses – franchised restaurants |
53,739 | — | 53,739 | — | — | 53,739 | ||||||||||||||||||
| Cost of ice cream products |
59,175 | — | 59,175 | — | — | 59,175 | ||||||||||||||||||
| General and administrative expenses, net |
223,620 | — | 223,620 | (3,000 | )(3) | — | 220,620 | |||||||||||||||||
| Depreciation and amortization |
57,826 | — | 57,826 | — | — | 57,826 | ||||||||||||||||||
| Other impairment charges |
7,075 | — | 7,075 | — | — | 7,075 | ||||||||||||||||||
| Total operating costs and expenses |
401,435 | — | 401,435 | (3,000 | ) | — | 398,435 | |||||||||||||||||
| Equity in net income of joint ventures |
17,825 | — | 17,825 | — | — | 17,825 | ||||||||||||||||||
| Operating income |
193,525 | — | 193,525 | 3,000 | — | 196,525 | ||||||||||||||||||
| Other income (expense): |
||||||||||||||||||||||||
| Interest income |
305 | — | 305 | — | — | 305 | ||||||||||||||||||
| Interest expense |
(112,837 | ) | 29,783 | (1) | (83,054 | ) | — | 11,206 | (4) | (71,848 | ) | |||||||||||||
| Loss on debt extinguishment |
(61,955 | ) | — | (61,955 | ) | — | 61,955 | (5) | — | |||||||||||||||
| Other income, net |
408 | — | 408 | — | — | 408 | ||||||||||||||||||
| Total other expense |
(174,079 | ) | 29,783 | (144,296 | ) | — | 73,161 | (71,135 | ) | |||||||||||||||
| Income before income taxes |
19,446 | 29,783 | 49,229 | 3,000 | 73,161 | 125,390 | ||||||||||||||||||
| Provision (benefit) for income taxes |
(7,415 | ) | 11,913 | (2) | 4,498 | 1,200 | (2) | 29,265 | (2) | 34,963 | ||||||||||||||
| Net income |
$ | 26,861 | 17,870 | 44,731 | 1,800 | 43,896 | 90,427 | |||||||||||||||||
| Pro forma earnings per share: |
||||||||||||||||||||||||
| Basic |
$ | (6) | ||||||||||||||||||||||
| Diluted |
$ | (6) | ||||||||||||||||||||||
| Pro forma weighted average common shares outstanding: |
||||||||||||||||||||||||
| Basic |
(6) | |||||||||||||||||||||||
| Diluted |
(6) | |||||||||||||||||||||||
| (1) | As of the beginning of fiscal year 2010, the Company’s outstanding debt consisted of $1.35 billion of A-2 Notes at a fixed rate of 5.779% and $100.0 million of M-1 Notes at a fixed rate of 8.285%, all of which related to a securitized borrowing consummated in 2006. Had the Offering occurred on the first day of fiscal year 2010, the Company would have used the proceeds to repay $375.0 million of A-2 Notes. Subsequently, when the Company refinanced the securitization debt in November 2010, the outstanding securitization debt balance would have been $375.0 million lower. As the securitization debt would have been $375.0 million lower at the time of the refinancing, the pro forma adjustments assume |
- 49 -
Table of Contents
| that the Company would have issued $375.0 million less in Senior Notes, resulting in the issuance of $250.0 million of Senior Notes rather than the $625.0 million that was actually issued in November 2010. The adjustments related to the Offering reflect the reduction of interest expense resulting from the pro forma repayment of $375.0 million of A-2 Notes, as well as the reduction in interest expense due to the issuance of $250.0 million of Senior Notes rather than $625.0 million. The pro forma adjustments to historical interest expense related to the offering are as follows: |
| Interest Expense: | Historical As Reported Fiscal Year Ended December 25, 2010 |
Adjustments Related to the Offering |
Pro Forma for the Offering December 25, 2010 |
|||||||||
| Securitization indebtedness |
$ | 92,988 | (24,755 | )(a) | 68,233 | |||||||
| Senior Notes |
5,456 | (3,309 | )(b) | 2,147 | ||||||||
| Term loan borrowings |
6,589 | — | 6,589 | |||||||||
| Revolving credit facility |
74 | — | 74 | |||||||||
| Deferred financing fees and original issue discount |
6,523 | (1,719 | )(c) | 4,804 | ||||||||
| Capital leases |
505 | — | 505 | |||||||||
| Other |
702 | — | 702 | |||||||||
| $ | 112,837 | (29,783 | ) | 83,054 | ||||||||
| (a) | Reduction of historical interest expense related to $375.0 million of securitization debt that was incurred from the beginning of fiscal year 2010 through the date of repayment of the securitization debt as part of the debt refinancing in November 2010. The pro forma adjustment reflects the use of proceeds of the Offering to repay $375.0 million of A-2 Notes as if the Offering occurred on the first day of fiscal year 2010. The adjustment to interest expense is calculated at an annual rate of 5.779% plus premium payments to Ambac, who unconditionally and irrevocably guaranteed the A-2 Notes, at an annual rate of 1.0% through April 15, 2010 and an annual rate of 1.25% thereafter. |
| (b) | Elimination of historical interest expense related to $375.0 million of Senior Notes that was incurred from the date of issuance in November 2010 through the end of fiscal year 2010. The adjustment assumes the elimination of $375.0 million of Senior Notes outstanding for approximately 33 days during fiscal year 2010 at an annual rate of 9.625%. |
| (c) | Reduce amortization of deferred financing costs and original issue discount in connection with the transactions discussed in (a) and (b) above, which resulted in the elimination of $1.6 million of amortization related to the securitization debt, and the elimination of $0.1 million of amortization related to the Senior Notes. |
| (2) | To reflect the tax effect of the pro forma adjustments at an estimated statutory tax rate of 40.0%. |
| (3) | To reflect a reduction of $3.0 million annually as a result of the termination of the management agreement with the Sponsors. Upon completion of this offering, we expect to incur an expense of approximately $14.5 million within general and administrative expenses and a corresponding tax benefit of $5.8 million related to the termination of the Sponsor management agreement, which have been excluded from the pro forma statement of operations. Additionally, the Company expects to record additional share-based compensation expense of approximately $4.0 million and a corresponding tax benefit of $1.6 million upon completion of this offering, related to restricted shares granted to employees that were not eligible to vest until completion of an initial public offering or change of control, which were excluded from the pro forma statement of operations,. See “Management-Compensation discussion and analysis-Change in control.” |
| (4) | The adjustments related to the refinancing and debt-related transactions reflect the impact on interest expense as if the November 2010 refinancing and additional term loan borrowings in February 2011 and May 2011 were used to fully repay the securitization indebtedness of $971.3 million and outstanding $250.0 million of Senior Notes, after giving effect to the offering, on the first day of fiscal year 2010, which would have resulted in $1.5 billion of term loan borrowings outstanding during all of fiscal year 2010. Pro forma adjustments were as follows: |
| Interest Expense: | Pro Forma for the Offering December 25, 2010 |
Refinancing and Debt- Related Transactions |
Pro Forma Fiscal Year Ended December 25, 2010 |
|||||||||
| Securitization indebtedness |
$ | 68,233 | (68,233 | )(a) | — | |||||||
| Senior Notes |
2,147 | (2,147 | )(b) | — | ||||||||
| Term loan borrowings |
6,589 | 57,628 | (c) | 64,217 | ||||||||
| Revolving credit facility |
74 | 720 | (d) | 794 | ||||||||
| Deferred financing fees and original issue discount |
4,804 | 826 | (e) | 5,630 | ||||||||
| Capital leases |
505 | — | 505 | |||||||||
| Other |
702 | — | 702 | |||||||||
| $ | 83,054 | (11,206 | ) | 71,848 | ||||||||
| (a) | Elimination of historical interest expense on the securitization debt that was incurred from the beginning of fiscal year 2010 through the date of repayment of the securitization debt as part of the debt refinancing in November 2010, after reflecting the pro forma repayment of $375.0 million of A-2 Notes discussed in note 1 above. The pro forma adjustment is based on (i) weighted average A-2 Notes outstanding of $916.8 million at an annual rate of 5.779%, (ii) Ambac premiums at annual rate of 1.0% through April 15, 2010 and an annual rate of 1.25% thereafter, and (iii) M-1 Notes outstanding of $100.0 million at an annual rate of 8.285%. |
| (b) | Elimination of historical interest expense on $250.0 million of Senior Notes that was incurred from the date of issuance in November 2010 through the end of fiscal year 2010 after reflecting the pro forma reduction in the issuance of Senior Notes by $375.0 million discussed in note 1. The remaining $250.0 million Senior Notes balance would be repaid as part of the additional term loan borrowings in February and May 2011, if those transactions had occurred at the beginning of fiscal year 2010. The Senior Notes accrue interest at an annual rate of 9.625% and were outstanding for 33 days during fiscal year 2010. |
- 50 -
Table of Contents
| (c) | Increase in interest expense on the term loan borrowings to reflect the term loans outstanding for the entire year. Interest expense on the term loan is calculated based on an initial term loan outstanding of $1.5 billion at an annual rate of 4.25%, reduced by principal payments of $3.75 million paid at the end of each calendar quarter. The annual rate of 4.25% is based on a 360-day year, resulting in a daily rate of 0.012%. Interest expense is calculated as follows: |
| Period | Principal Outstanding During Quarter |
Daily Rate |
Days in Fiscal Quarter |
Pro Forma Interest Expense |
||||||||||||
| Q1 2010 |
1,500,000 | 0.012% | 91 | 16,115 | ||||||||||||
| Q2 2010 |
1,496,250 | 0.012% | 91 | 16,074 | ||||||||||||
| Q3 2010 |
1,492,500 | 0.012% | 91 | 16,034 | ||||||||||||
| Q4 2010 |
1,488,750 | 0.012% | 91 | 15,994 | ||||||||||||
| 64,217 | ||||||||||||||||
| (d) | Increase in interest expense on the revolving credit facility to reflect the revolving credit facility being outstanding for the entire year. Interest expense on the revolving credit facility is calculated based on $11.2 million utilized under the revolving credit facility for letters of credit at an annual rate of 3.125%, and a rate of 0.5% on the $88.8 million unused portion of the revolving credit facility. |
| (e) | Increase amortization of deferred financing costs and original issue discount due to additional amortization related to the term loan borrowings and revolving credit facility of $5.3 million, offset by the elimination of $4.4 million of amortization related to the securitization debt and the elimination of $0.1 million of amortization related to the Senior Notes. |
| (5) | To eliminate the loss on debt extinguishment as the refinancing transaction that occurred during the year ended December 25, 2010 would not have occurred if this offering and related transactions had been consummated at the beginning of fiscal year 2010. We expect to incur losses on debt extinguishment related to the repayment of the Senior Notes and fees related to the additional term loan borrowings in the periods in which these events occur, which have been excluded from the pro forma statement of operations. |
| (6) | This adjustment gives effect to the assumed conversion of all outstanding shares of Class L common stock, and the assumed reclassification of all outstanding Class A common stock at a factor of one share of common stock for each Class A share, as if the initial public offering was completed at the beginning of fiscal year 2010. Class L common stock converts into one share of common stock, adjusted for any stock splits. Additionally, Class L common stockholders receive an additional number of shares of common stock determined by dividing the Class L preference amount by the initial public offering price of a share of our common stock in this offering net of the estimated underwriting discount and a pro rata portion of the estimated offering-related expenses incurred by us. The Class L preference amount is calculated based on the base amount ($41.7516) plus 9% accretion per annum, compounded quarterly, less dividends paid since March 1, 2006. See “The reclassification.” The following table sets forth the computation of the conversion factor for the Class L common stock, based on an offering price of $ per share, the midpoint of the preliminary offering range of $ to $ per share, and the Class L preference amount as of an estimated initial public offering date of : |
| Class L preference amount per share |
$ | |||
| Initial public offering price per share |
||||
| Offering expenses per share (a) |
||||
| Initial public offering price per share, net of expenses |
||||
| Conversion factor for Class L preference amount |
||||
| Class L base share (b) |
||||
| Class L conversion factor |
||||
| (a) | Calculated based on total estimated offering expenses, including underwriting discount and other offering-related expenses incurred by us, of $ million and shares issued in the offering of . |
| (b) | Conversion of Class L common stock into one share of common stock, adjusted for the -for- reverse stock split attributable to the common stock. |
| Basic earnings per share is computed on the basis of the weighted average number of Class L and Class A shares that were outstanding during the period, as adjusted for the Class A reverse stock split. Diluted earnings per share includes the dilutive effect of Class A restricted shares and stock options, using the treasury stock method. There were no Class L common stock equivalents outstanding during fiscal year 2010. Shares to be sold in the offering are included in the pro forma basic and diluted earnings per share calculations. The following table sets forth the computation of pro forma basic and diluted earnings per share: |
| Basic | Diluted | |||||||
| Pro forma net income (in thousands) |
$ | $ | ||||||
| Pro forma weighted average number of common shares: |
||||||||
| Weighted average number of Class L shares |
||||||||
| Class L conversion factor |
||||||||
| Weighted average number of converted Class L shares |
||||||||
| Weighted average number of Class A shares |
||||||||
| Shares issued in this offering |
||||||||
| Pro forma weighted average number of common shares |
||||||||
| Pro forma earnings per common share |
$ | $ | ||||||
- 51 -
Table of Contents
| As the Class L conversion factor is determined based on the initial public offering price, the pro forma weighted average number of common shares, and therefore pro forma basic and diluted earnings per common share, would change if the offering price is not $ per share. The following table sets forth the impact of a change in the offering price on the Class L conversion factor, pro forma weighted average number of common shares, and pro forma earnings per common share: |
| Offering price per share | ||||||||||||||||||||
| $ | $ | $ | $ | $ | ||||||||||||||||
| Class L conversion factor |
||||||||||||||||||||
| Pro forma weighted average number of common shares – basic |
||||||||||||||||||||
| Pro forma weighted average number of common shares – diluted |
||||||||||||||||||||
| Pro forma earnings per common share – basic |
$ | $ | $ | $ | $ | |||||||||||||||
| Pro forma earnings per common share – diluted |
$ | $ | $ | $ | $ | |||||||||||||||
- 52 -
Table of Contents
Unaudited Pro Forma Consolidated Statement of Operations
Three Months Ended March 26, 2011
(In thousands, except share and per share amounts)
| Historical As Reported Three Months Ended March 26, 2011 |
Adjustments Related to the Offering |
Pro Forma for the Offering March 26, 2011 |
Adjustments for Other Transactions | Pro Forma Three Months Ended March 26, 2011 |
||||||||||||||||||||
| Termination of Sponsor Management Agreement |
Refinancing and Debt-Related Transactions |
|||||||||||||||||||||||
| Revenues: |
||||||||||||||||||||||||
| Franchise fees and royalty income |
$ | 85,959 | 85,959 | — | — | 85,959 | ||||||||||||||||||
| Rental income |
22,131 | 22,131 | — | — | 22,131 | |||||||||||||||||||
| Sales of ice cream products |
22,716 | 22,716 | — | — | 22,716 | |||||||||||||||||||
| Other revenues |
8,407 | 8,407 | — | — | 8,407 | |||||||||||||||||||
| Total revenues |
139,213 | — | 139,213 | — | — | 139,213 | ||||||||||||||||||
| Operating costs and expenses: |
||||||||||||||||||||||||
| Occupancy expenses—franchised restaurants |
12,288 | 12,288 | — | — | 12,288 | |||||||||||||||||||
| Cost of ice cream products |
15,124 | 15,124 | — | — | 15,124 | |||||||||||||||||||
| General and administrative expenses, net |
53,886 | 53,886 | (750 | )(3) | — | 53,136 | ||||||||||||||||||
| Depreciation and amortization |
13,208 | 13,208 | — | — | 13,208 | |||||||||||||||||||
| Impairment charges |
653 | 653 | — | — | 653 | |||||||||||||||||||
| Total operating costs and expenses |
95,159 | — | 95,159 | (750 | ) | — | 94,409 | |||||||||||||||||
| Equity in net income of joint ventures |
782 | 782 | — | — | 782 | |||||||||||||||||||
| Operating income |
44,836 | — | 44,836 | 750 | — | 45,586 | ||||||||||||||||||
| Other income (expense): |
||||||||||||||||||||||||
| Interest income |
115 | 115 | — | — | 115 | |||||||||||||||||||
| Interest expense |
(33,882 | ) | 9,426 | (1) | (24,456 | ) | — | 6,448 | (4) | (18,008 | ) | |||||||||||||
| Loss on debt extinguishment and refinancing transaction |
(11,007 | ) | (11,007 | ) | — | 11,007 | (5) | — | ||||||||||||||||
| Other income, net |
476 | 476 | — | — | 476 | |||||||||||||||||||
| Total other expense |
(44,298 | ) | 9,426 | (34,872 | ) | — | 17,455 | (17,417 | ) | |||||||||||||||
| Income before income taxes |
538 | 9,426 | 9,964 | 750 | 17,455 | 28,169 | ||||||||||||||||||
| Provision for income taxes |
2,261 | 3,770 | (2) | 6,031 | 300 | (2) | 6,982 | (2) | 13,313 | |||||||||||||||
| Net income (loss) |
$ | (1,723 | ) | 5,656 | 3,933 | 450 | 10,473 | 14,856 | ||||||||||||||||
| Pro forma earnings per share: |
||||||||||||||||||||||||
| Basic |
$ | (6) | ||||||||||||||||||||||
| Diluted |
$ | (6) | ||||||||||||||||||||||
| Pro forma weighted average common shares outstanding: |
||||||||||||||||||||||||
| Basic |
(6) | |||||||||||||||||||||||
| Diluted |
(6) | |||||||||||||||||||||||
- 53 -
Table of Contents
| (1) | To adjust interest expense to reflect the use of proceeds from the offering to repay $375.0 million of Senior Notes as of the first day of the first quarter of fiscal year 2011. The pro forma adjustments to historical interest expense are as follows: |
| Interest Expense: | Historical As Reported Three Months Ended March 26, 2011 |
Adjustments Related to the Offering |
Pro Forma for the Offering March 26, 2011 |
|||||||||
| Senior Notes |
$ | 14,858 | (9,124 | )(a) | 5,734 | |||||||
| Term loan borrowings |
16,897 | — | 16,897 | |||||||||
| Revolving credit facility |
236 | — | 236 | |||||||||
| Deferred financing fees and original issue discount |
1,582 | (302 | )(b) | 1,280 | ||||||||
| Capital leases |
122 | — | 122 | |||||||||
| Other |
187 | — | 187 | |||||||||
| $ | 33,882 | (9,426 | ) | 24,456 | ||||||||
| (a) | Elimination of historical interest expense related to $375.0 million of Senior Notes that was incurred during the three months ended March 26, 2011, as the proceeds from the offering would be used to repay $375.0 million of Senior Notes which accrued interest at an annual rate of 9.625%. |
| (b) | Reduce amortization of deferred financing costs and original issue discount to reflect the repayment of $375.0 million of Senior Notes. |
| (2) | To reflect the tax effect of the pro forma adjustments at an estimated statutory tax rate of 40.0%. |
| (3) | To reflect a reduction of $750,000 quarterly as a result of the termination of the management agreement with the Sponsors. Upon completion of this offering, we expect to incur an expense of approximately $14.5 million within general and administrative expenses and a corresponding tax benefit of $5.8 million related to the termination of the Sponsor management agreement, which have been excluded from the pro forma statement of operations. Additionally, the Company expects to record additional share-based compensation expense of approximately $4.0 million and a corresponding tax benefit of $1.6 million upon completion of this offering, related to restricted shares granted to employees that were not eligible to vest until completion of an initial public offering or change of control, which have been excluded from the pro forma statement of operations. See “Management-Compensation discussion and analysis-Change in control.” |
| (4) | The adjustments related to the refinancing and debt-related transactions reflect the impact on interest expense as if the additional term loan borrowings in February 2011 and May 2011 were used to fully repay the outstanding $250.0 million of Senior Notes, after giving effect to the offering, on the first day of the first quarter of fiscal year 2011, which would have resulted in $1.5 billion of term loan borrowings outstanding during all of the first quarter of fiscal year 2011. Pro forma adjustments were as follows: |
| Interest Expense: | Pro Forma for the Offering March 26, 2011 |
Refinancing and Debt-Related Transactions |
Pro Forma Three Months Ended March 26, 2011 |
|||||||||
| Senior Notes |
$ | 5,734 | (5,734 | )(a) | — | |||||||
| Term loan borrowings |
16,897 | (782 | )(b) | 16,115 | ||||||||
| Revolving credit facility |
236 | (37 | )(c) | 199 | ||||||||
| Deferred financing fees and original issue discount |
1,280 | 105 | (d) | 1,385 | ||||||||
| Capital leases |
122 | — | 122 | |||||||||
| Other |
187 | — | 187 | |||||||||
| $ | 24,456 | (6,448 | ) | 18,008 | ||||||||
| (a) | Elimination of historical interest expense on $250.0 million of Senior Notes that was incurred during the three months ended March 26, 2011 after reflecting the pro forma reduction in the Senior Notes of $375.0 million discussed in note 1. The remaining $250.0 million Senior Notes balance would be repaid as part of the additional term loan borrowings in February and May 2011, if those transactions had occurred at the beginning of fiscal year 2011. The Senior Notes accrue interest at an annual rate of 9.625% and were outstanding for the entire first quarter of fiscal year 2011. |
| (b) | Decrease in interest expense on the term loan borrowings which was driven by the February 2011 repricing of the term loan, resulting in a decrease in the annual interest rate from 5.75% to 4.25%. Interest expense on the term loan is calculated based on an initial term loan outstanding of $1.5 billion at an annual rate of 4.25%, which based on a 360-day year, results in a daily rate of 0.012%. With 91 days in the fiscal quarter, applying the daily rate to the principal balance of $1.5 billion results in pro forma interest expense of $16.1 million. |
| (c) | Decrease in interest expense on the revolving credit facility which was driven by a decrease in the annual interest rate in May 2011 from 4.375% to 3.125%. Interest expense on the revolving credit facility is calculated based on $11.2 million utilized under the revolving credit facility for letters of credit at an annual rate of 3.125%, and a rate of 0.5% on the $88.8 million unused portion of the revolving credit facility. |
| (d) | Increase amortization of deferred financing costs and original issue discount due to additional amortization related to the term loan borrowings and revolving credit facility of $0.3 million, offset by the elimination of $0.2 million of amortization related to the Senior Notes. |
| (5) | To eliminate the loss on debt extinguishment as the February 2011 repricing transaction that occurred during the quarter ended March 26, 2011 would not have occurred if this offering and related transactions had been consummated at the beginning of the first fiscal quarter of 2011. We expect to incur losses on debt extinguishment related to the repayment of the Senior Notes and fees related to the additional term loan borrowings in the periods in which these events occur, which have been excluded from the pro forma statement of operations. |
- 54 -
Table of Contents
| (6) | This adjustment gives effect to the assumed conversion of all outstanding shares of Class L common stock, and the assumed reclassification of all outstanding Class A common stock at a factor of one share of common stock for each Class A share, as if the initial public offering was completed at the beginning of the fiscal quarter. Class L common stock converts into one share of common stock, adjusted for any stock splits. Additionally, Class L common stockholders receive an additional number of shares of common stock determined by dividing the Class L preference amount by the initial public offering price of a share of our common stock in this offering net of the estimated underwriting discount and a pro rata portion of the estimated offering-related expenses incurred by us. The Class L preference amount is calculated based on the base amount ($41.7516) plus 9% accretion per annum, compounded quarterly, less dividends paid since March 1, 2006. See “The reclassification.” The following table sets forth the computation of the conversion factor for the Class L common stock, based on an offering price of $ per share, the midpoint of the preliminary offering range of $ to $ per share, and the Class L preference amount as of an estimated initial public offering date of : |
| Class L preference amount per share |
$ | |||
| Initial public offering price per share |
||||
| Offering expenses per share(a) |
||||
| Initial public offering price per share, net of expenses |
||||
| Conversion factor for Class L preference amount |
||||
| Class L base share (b) |
||||
| Class L conversion factor |
||||
| (a) | Calculated based on total estimated offering expenses, including underwriting discount and other offering-related expenses incurred by us, of $ million and shares issued in the offering of . |
| (b) | Conversion of Class L common stock into one share of common stock, adjusted for the -for- reverse stock split attributable to the common stock. |
| Basic earnings per share is computed on the basis of the weighted average number of Class L and Class A shares that were outstanding during the period, as adjusted for the Class A reverse stock split. Diluted earnings per share includes the dilutive effect of Class A restricted shares and stock options, using the treasury stock method. There were no Class L common stock equivalents outstanding during the three months ended March 26, 2011. Shares to be sold in the offering are included in the pro forma basic and diluted earnings per share calculations. The following table sets forth the computation of pro forma basic and diluted earnings per share: |
| Basic | Diluted | |||||||
| Pro forma net income (in thousands) |
$ | $ | ||||||
| Pro forma weighted average number of common shares: |
||||||||
| Weighted average number of Class L shares |
||||||||
| Class L conversion factor |
||||||||
| Weighted average number of converted Class L shares |
||||||||
| Weighted average number of Class A shares |
||||||||
| Shares issued in this offering |
||||||||
| Pro forma weighted average number of common shares |
||||||||
| Pro forma earnings per common share |
$ | $ | ||||||
| As the Class L conversion factor is determined based on the initial public offering price, the pro forma weighted average number of common shares, and therefore pro forma basic and diluted earnings per common share, would change if the offering price is not $ per share. The following table sets forth the impact of a change in the offering price on the Class L conversion factor, pro forma weighted average number of common shares, and pro forma earnings per common share: |
| Offering price per share | ||||||||||||||||||||
| $ | $ | $ | $ | $ | ||||||||||||||||
| Class L conversion factor |
||||||||||||||||||||
| Pro forma weighted average number of common shares – basic |
||||||||||||||||||||
| Pro forma weighted average number of common shares – diluted |
||||||||||||||||||||
| Pro forma earnings per common share – basic and diluted |
$ | $ | $ | $ | $ | |||||||||||||||
- 55 -
Table of Contents
Management’s discussion and analysis of
financial condition and results of operations
The following discussion of our financial condition and results of operations should be read in conjunction with the “Selected historical consolidated financial data” and the audited and unaudited historical consolidated financial statements and related notes. This discussion contains forward-looking statements about our markets, the demand for our products and services and our future results and involves numerous risks and uncertainties. Forward-looking statements can be identified by the fact that they do not relate strictly to historical or current facts and generally contain words such as “believes,” expects,” “may,” “will,” “should,” “seeks,” “approximately,” “intends,” “plans,” “estimates,” or “anticipates” or similar expressions. Our forward-looking statements are subject to risks and uncertainties, which may cause actual results to differ materially from those projected or implied by the forward-looking statement. Forward-looking statements are based on current expectations and assumptions and currently available data and are neither predictions nor guarantees of future events or performance. You should not place undue reliance on forward-looking statements, which speak only as of the date hereof. See “Risk factors” and “Cautionary note regarding forward-looking statements” for a discussion of factors that could cause our actual results to differ from those expressed or implied by forward-looking statements.
Introduction and overview
We are one of the world’s leading franchisors of quick service restaurants (“QSRs”) serving hot and cold coffee and baked goods, as well as hard serve ice cream. We franchise restaurants under our Dunkin’ Donuts and Baskin-Robbins brands. With over 16,000 points of distribution in 57 countries, we believe that our portfolio has strong brand awareness in our key markets. QSR is a restaurant format characterized by counter or drive-thru ordering and limited or no table service. As of March 26, 2011, Dunkin’ Donuts had 9,805 global points of distribution with restaurants in 36 U.S. states and the District of Columbia and in 31 foreign countries. Baskin-Robbins had 6,482 global points of distribution as of the same date, with restaurants in 45 U.S. states and the District of Columbia and in 46 foreign countries.
We are organized into four reporting segments: Dunkin’ Donuts U.S., Dunkin’ Donuts International, Baskin-Robbins U.S., and Baskin-Robbins International. We generate revenue from four primary sources: (i) royalty income and franchise fees associated with franchised restaurants, (ii) rental income from restaurant properties that we lease or sublease to franchisees, (iii) sales of ice cream products to franchisees in certain international markets, and (iv) other income including fees for the licensing of our brands for products sold in non-franchised outlets, the licensing of the right to manufacture Baskin-Robbins ice cream sold to U.S. franchisees, refranchising gains, transfer fees from franchisees, revenue from our company-owned restaurants, and online training fees.
Approximately 62% of our revenue for fiscal year 2010 was derived from royalty income and franchise fees. An additional 16% of our revenue for fiscal year 2010 was generated from rental income from franchisees that lease or sublease their properties from us. The balance of our revenue for fiscal year 2010 consisted of sales of ice cream products to Baskin-Robbins franchisees in certain international markets, license fees on sales of ice cream products to Baskin-Robbins franchisees in the U.S., refranchising gains, transfer fees from franchisees, revenue from our company-owned restaurants, and online training fees.
Franchisees fund the vast majority of the cost of new restaurant development. As a result, we are able to grow our system with lower capital requirements than many of our competitors. With only 17 company-owned restaurants as of March 26, 2011, we are less affected by store-level costs and profitability and fluctuations in commodity costs than other QSR operators.
- 56 -
Table of Contents
Our franchisees fund substantially all of the advertising that supports both brands. Those advertising funds also fund the cost of our marketing personnel. Royalty payments and advertising fund contributions typically are made on a weekly basis for restaurants in the U.S., which limits our working capital needs. For fiscal year 2010, franchisee contributions to the U.S. advertising funds were $290.0 million.
We operate and report financial information on a 52- or 53-week year on a 13-week quarter (or 14-week fourth quarter, when applicable) basis with the fiscal year ending on the last Saturday in December and fiscal quarters ending on the 13th Saturday of each quarter (or 14th Saturday of the fourth quarter, when applicable). The data periods contained within fiscal years 2010, 2009, and 2008 reflect the results of operations for the 52-week periods ending on December 25, 2010, December 26, 2009, and December 27, 2008, respectively. The data periods contained within the three months ended March 26, 2011 and March 27, 2010 reflect the results of operations for the 13-week periods ending on those dates. Operating results for the three months ended March 26, 2011 are not necessarily indicative of the results that may be expected for the fiscal year ending December 31, 2011.
Critical accounting policies
Our significant accounting policies are more fully described under the heading “Summary of significant accounting policies” in Note 2 of the notes to the consolidated financial statements. However, we believe the accounting policies described below are particularly important to the portrayal and understanding of our financial position and results of operations and require application of significant judgment by our management. In applying these policies, management uses its judgment in making certain assumptions and estimates. These judgments involve estimations of the effect of matters that are inherently uncertain and may have a significant impact on our quarterly and annual results of operations or financial condition. Changes in estimates and judgments could significantly affect our result of operations, financial condition, and cash flow in future years. The following is a description of what we consider to be our most significant critical accounting policies.
Revenue recognition
Initial franchise fee revenue is recognized upon substantial completion of the services required of us as stated in the franchise agreement, which is generally upon opening of the respective restaurant. Fees collected in advance are deferred until earned. Royalty income is based on a percentage of franchisee gross sales and is recognized when earned, which occurs at the franchisees’ point of sale. Renewal fees are recognized when a renewal agreement with a franchisee becomes effective. Rental income for base rentals is recorded on a straight-line basis over the lease term. Contingent rent is recognized as earned, and any amounts received from lessees in advance of achieving stipulated thresholds are deferred until such threshold is actually achieved. Revenue from the sale of ice cream is recognized when title and risk of loss transfers to the buyer, which is generally upon shipment. Licensing fees are recognized when earned, which is generally upon sale of the underlying products by the licensees. Retail store revenues at company-owned restaurants are recognized when payment is tendered at the point of sale, net of sales tax and other sales-related taxes. Gains on the refranchise or sale of a restaurant are recognized when the sale transaction closes, the franchisee has a minimum amount of the purchase price in at risk equity, and we are satisfied that the buyer can meet its financial obligations to us.
Allowances for franchise, license and lease receivables / guaranteed financing
We reserve all or a portion of a franchisee’s receivable balance when deemed necessary based upon detailed review of such balances, and apply a pre-defined reserve percentage based on an aging criteria to other
- 57 -
Table of Contents
balances. We perform our reserve analysis during each fiscal quarter or when events or circumstances indicate that we may not collect the balance due. While we use the best information available in making our determination, the ultimate recovery of recorded receivables is also dependent upon future economic events and other conditions that may be beyond our control.
In limited instances, we issue guarantees to financial institutions so that our franchisees can obtain financing with terms of approximately five to ten years for various business purposes. We recognize a liability and offsetting asset for the fair value of such guarantees. The fair value of a guarantee is based on historical default rates of our total guaranteed loan pool. We monitor the financial condition of our franchisees and record provisions for estimated losses on guaranteed liabilities of our franchisees if we believe that our franchisees are unable to make their required payments. As of March 26, 2011, if all of our outstanding guarantees of franchisee financing obligations came due simultaneously, we would be liable for approximately $7.7 million. As of March 26, 2011, there were no amounts under such guarantees that were contingently due. We generally have cross-default provisions with these franchisees that would put the franchisee in default of its franchise agreement in the event of non-payment under such loans. We believe these cross-default provisions significantly reduce the risk that we would not be able to recover the amount of required payments under these guarantees and, historically, we have not incurred significant losses under these guarantees due to defaults by our franchisees.
Impairment of goodwill and other intangible assets
Goodwill and trade names (indefinite lived intangibles) have been assigned to our reporting units, which are also our operating segments, for purposes of impairment testing. Our reporting units, which have indefinite lived intangible assets associated with them, are Dunkin’ Donuts U.S., Dunkin’ Donuts International, Baskin-Robbins U.S., and Baskin-Robbins International.
We evaluate the remaining useful life of our trade names to determine whether current events and circumstances continue to support an indefinite useful life. In addition, all of our indefinite lived intangible assets are tested for impairment annually. The trade name intangible asset impairment test consists of a comparison of the fair value of each trade name with its carrying value, with any excess of carrying value over fair value being recognized as an impairment loss. The fair value of trade names is estimated using the relief from royalty method, an income approach to valuation, which includes projecting future systemwide sales and other estimates. The goodwill impairment test consists of a comparison of each reporting unit’s fair value to its carrying value. The fair value of a reporting unit is an estimate of the amount for which the unit as a whole could be sold in a current transaction between willing parties. If the carrying value of a reporting unit exceeds its fair value, goodwill is written down to its implied fair value. Fair value of a reporting unit is estimated based on a combination of comparative market multiples and discounted cash flow valuation approaches. Currently, we have selected the first day of our fiscal third quarter as the date on which to perform our annual impairment tests for all indefinite lived intangible assets. We also test for impairment whenever events or circumstances indicate that the fair value of such indefinite lived intangibles has been impaired. We recorded a $294.5 million goodwill impairment charge related to Dunkin’ Donuts U.S. and Baskin-Robbins International, as well as a $34.0 million trade name impairment related to Baskin-Robbins U.S., during fiscal 2008. No impairment of indefinite lived intangible assets was recorded during fiscal 2009, fiscal 2010, or the three months ended March 26, 2011.
We have intangible assets other than goodwill and trade names that are amortized on a straight-line basis over their estimated useful lives or terms of their related agreements. Other intangible assets consist primarily of franchise and international license rights (franchise rights), ice cream manufacturing and territorial franchise agreement license rights (license rights) and operating lease interests acquired related to our prime leases and
- 58 -
Table of Contents
subleases (operating leases acquired). Franchise rights recorded in the consolidated balance sheets were valued using an excess earnings approach. The valuation of franchise rights was calculated using an estimation of future royalty income and related expenses associated with existing franchise contracts at the acquisition date. Our valuation included assumptions related to the projected attrition and renewal rates on those existing franchise arrangements being valued. License rights recorded in the consolidated balance sheets were valued based on an estimate of future revenues and costs related to the ongoing management of the contracts over the remaining useful lives. Favorable and unfavorable operating leases acquired were recorded on purchased leases based on differences between contractual rents under the respective lease agreements and prevailing market rents at the lease acquisition date. Favorable operating leases acquired are included as a component of other intangible assets in the consolidated balance sheets. Due to the high level of lease renewals made by our Dunkin’ Donuts franchisees, all lease renewal options for the Dunkin’ Donuts leases were included in the valuation of the favorable operating leases acquired. Amortization of franchise rights, license rights, and favorable operating leases acquired is recorded as amortization expense in the consolidated statements of operations and amortized over the respective franchise, license, and lease terms using the straight-line method. Unfavorable operating leases acquired related to our prime leases and subleases are recorded in the liability section of the consolidated balance sheets and are amortized into rental expense and rental income, respectively, over the base lease term of the respective leases using the straight-line method. Our amortizable intangible assets are evaluated for impairment whenever events or changes in circumstances indicate that the carrying amount of the intangible asset may not be recoverable. An intangible asset that is deemed impaired is written down to its estimated fair value, which is based on discounted cash flow.
Common stock valuation
For all stock-based awards, we measure compensation cost at fair value on the date of grant and recognize compensation expense over the service period that the awards are expected to vest. The key assumption in determining the fair value of stock-based awards on the date of grant is the fair value of the underlying Class A common stock. From fiscal year 2008 through the three-month period ended March 26, 2011, we granted restricted shares and stock options to employees with a fair value of the underlying common stock as follows:
| Grant date | Number of restricted shares |
Number of executive options |
Number of nonexecutive |
Fair value per Class A share |
||||||||||||
| 6/24/2008 |
– | – | 318,000 | $ | 1.19 | |||||||||||
| 7/1/2008 |
735,000 | – | – | $ | 1.19 | |||||||||||
| 5/15/2009 |
– | – | 68,100 | $ | 0.42 | |||||||||||
| 2/23/2010 |
– | 20,900,000 | – | $ | 0.66 | |||||||||||
| 7/26/2010 |
– | 775,000 | 90,000 | $ | 1.10 | |||||||||||
| 8/6/2010 |
– | 25,000 | 925,000 | $ | 1.10 | |||||||||||
| 3/9/2011 |
– | 2,910,000 | 100,000 | $ | 1.60 | |||||||||||
The fair value of Class A common stock underlying the Company’s restricted shares and options was determined based on contemporaneous valuations performed by an independent third-party valuation specialist in accordance with the guidelines outlined in the American Institute of Certified Public Accountants Practice Aid, Valuation of Privately-Held-Company Equity Securities Issued as Compensation. The valuation methodology utilized by the independent third-party valuation specialist was consistent for all valuations completed from 2006 through the first quarter of fiscal year 2011. Financial projections underlying the valuation were determined by management based on long-range projections that were prepared on at least an annual basis and reviewed with the board of directors. Due to the Company’s two classes of common stock, Class A and Class L, the valuation approach was a two-step process in which the overall equity value of the Company was determined, and then allocated between the two classes of common stock.
- 59 -
Table of Contents
Overall enterprise and equity values were estimated using a combination of both market and income approaches in order to corroborate the values derived under the different methods. The market-based approach was based on multiples of historical and projected earnings before interest, taxes, depreciation, and amortization (EBITDA) utilizing trading multiples of a selected peer group of quick service restaurant companies. The selected peer group was generally consistent in each valuation and included a consistent focus on three core peer comparables. The selected multiples from the peer group were then applied to the Company’s historical and projected EBITDA to derive indicated values of the total enterprise. The income approach utilized the discounted cash flow method, which determined enterprise value based on the present value of estimated future net cash flows the business is expected to generate over a forecasted five-year period plus the present value of estimated cash flows beyond that period based on a level of growth in perpetuity. These cash flows were discounted to present value using a weighted average cost of capital (“WACC”), which reflects the time value of money and the appropriate degree of risks inherent in the business. Net debt as of the valuation date was then deducted from the total enterprise values determined under both the market and income approaches to determine the equity values. Once calculated, the market and income valuation approaches were then weighted to determine a single total equity value, with 60% of the weighting allocated to the market approach and 40% of the weighting allocated to the income approach. The weighting was consistent for all periods.
The total equity value at each valuation date was then allocated to Class A and Class L common stock based on the probability weighted expected return method (the “PWERM methodology”), which involved a forward-looking analysis of possible future exit valuations based on a range of EBITDA multiples at various future exit dates, the estimation of future and present value under each outcome, and the application of a probability factor to each outcome. Returns to each class of common stock as of each possible future exit date and under each EBITDA multiple scenario were calculated by (i) first allocating equity value to the Class L common stock up to the amount of its preferential distribution amount at the assumed exit date and (ii) allocating any residual equity value to the Class A common stock and the Class L common stock on a participating basis. The position of the Class A common stock as the lowest security in the capital structure and only participating in returns after the Class L preferential distribution amount is satisfied results in greater volatility in the Class A common stock fair value.
The significant assumptions underlying the common stock valuations at each grant date were as follows:
| Discounted cash flow | PWERM | |||||||||||||||||||||||||||||||
| Grant Date(s) | Fair value per Class A share |
Market approach EBITDA multiples |
Perpetuity growth rate |
Discount rate (WACC) |
Core EBITDA multiple |
Weighted average years to exit |
Class A discount rate |
Class L discount rate |
||||||||||||||||||||||||
| 6/24/2008, 7/1/2008 |
$ | 1.19 | 10.0x-11.0x | 3.5% | 9.5% | 10.5x | 2.0 | 40.0% | 12.0% | |||||||||||||||||||||||
| 5/15/2009 |
$ | 0.42 | 10.0x | 3.5% | 10.4% | 10.0x | 2.5 | 45.0% | 13.0% | |||||||||||||||||||||||
| 2/23/2010 |
$ | 0.66 | 10.0x-10.5x | 3.5% | 9.8% | 10.5x | 2.3 | 42.5% | 12.5% | |||||||||||||||||||||||
| 7/26/2010, 8/6/2010 |
$ | 1.10 | 10.5x-11.0x | 3.0% | 10.2% | 10.5x | 2.0 | 42.5% | 12.5% | |||||||||||||||||||||||
| 3/9/2011 |
$ | 1.60 | 10.0x-11.0x | 3.0% | 10.6% | 10.5x | 1.6 | 32.5% | 11.5% | |||||||||||||||||||||||
A 0.5x change in the EBITDA multiples used under the market approach for the three most recent valuation dates listed in the table above would have resulted in a 5% to 9% change in the Class A value per share, while a 1.0x change in the EBITDA multiples would have resulted in a 10% to 16% change in the Class A value per share. A 50 basis point change in the perpetuity growth rate used in the discounted cash flow calculation under the income approach for the three most recent valuation dates listed in the table above would have resulted in a 3% to 7% change in the Class A value per share. A 100 basis point change in the discount rate used in the discounted cash flow calculation under the income approach for the three most recent valuation dates listed in the table above would have resulted in a 9% to 16% change in the Class A value per share.
- 60 -
Table of Contents
From 2008 through the first fiscal quarter of 2011, the overall equity value of the Company has trended consistent with overall stock market indices and companies within the restaurant industry. The Company’s equity value declined towards the end of 2008 and into early 2009 driven by broad economic trends that impacted both internal financial results and projections, as well as overall market multiples and values. Since that time period, the overall equity markets have partially recovered, and the Company’s total equity value has tracked along with that recovery. The Company’s Class A common stock has realized greater volatility over this period than the Company’s overall equity value due to its placement within the capital structure, where the Class L common stock is entitled to receive a 9% preferred return.
Income tax valuation and tax reserves
Our major tax jurisdictions are the U.S. and Canada. The majority of our legal entities were converted to limited liability companies (“LLCs”) on March 1, 2006 and a number of new LLCs were created on or about March 15, 2006. All of these LLCs are single member entities which are treated as disregarded entities and included as part of us in the consolidated federal income tax return. Dunkin’ Brands Canada Ltd. (DBCL) files separate Canadian and provincial tax returns and Dunkin Brands (UK) Limited files separate tax returns in the United Kingdom. The current income tax liability for DBCL and Dunkin Brands (UK) Limited is calculated on a stand-alone basis. The current federal tax liability for each entity included in our consolidated federal income tax return is calculated on a stand-alone basis, including foreign taxes, for which a separate company foreign tax credit is calculated in lieu of a deduction for foreign withholding taxes paid. As a matter of course, we are regularly audited by federal, state, and foreign tax authorities.
Deferred tax assets and liabilities are recorded for the expected future tax consequences of items that have been included in our consolidated financial statements or tax returns. Deferred tax assets and liabilities are determined based on the differences between the financial statement carrying amounts of assets and liabilities and the respective tax bases of assets and liabilities using enacted tax rates that are expected to apply in years in which the temporary differences are expected to reverse. The effects of changes in tax rates on deferred tax assets and liabilities are recognized in the consolidated statements of operations in the year in which the law is enacted. Valuation allowances are provided when we do not believe it is more likely than not that we will realize the benefit of identified tax assets.
A tax position taken or expected to be taken in a tax return is recognized in the financial statements when it is more likely than not that the position would be sustained upon examination by tax authorities. A recognized tax position is then measured at the largest amount of benefit that is greater than 50% likely of being realized upon ultimate settlement. Estimates of interest and penalties on unrecognized tax benefits are recorded in the provision for income taxes.
In assessing the realizability of deferred tax assets, management considers whether it is more likely than not that some portion or all of the deferred tax assets will not be realized. The ultimate realization of deferred tax assets is dependent upon the generation of future taxable income during the periods in which those temporary differences become deductible. Management considers the scheduled reversal of deferred tax liabilities, projected future taxable income, and tax planning strategies in making this assessment.
- 61 -
Table of Contents
Selected operating and financial highlights
| Three months ended | Fiscal year | |||||||||||||||||||
| March 27, 2010 |
March 26, 2011 |
|||||||||||||||||||
| 2008 | 2009 | 2010 | ||||||||||||||||||
| (In thousands, except percentages) | ||||||||||||||||||||
| Systemwide sales growth: |
5.4% | 5.4% | 5.0% | 4.1% | 6.7% | |||||||||||||||
| Comparable store sales growth (U.S. only): |
||||||||||||||||||||
| Dunkin’ Donuts U.S. |
(0.6)% | 2.8% | (0.8)% | (1.3)% | 2.3% | |||||||||||||||
| Baskin-Robbins U.S. |
(7.9)% | 0.5% | (2.2)% | (6.0)% | (5.2)% | |||||||||||||||
| Total revenues |
$ | 127,412 | $ | 139,213 | $ | 544,929 | $ | 538,073 | $ | 577,135 | ||||||||||
| Operating income (loss) |
36,685 | 44,836 | (140,893 | ) | 184,545 | 193,525 | ||||||||||||||
| Net income (loss) |
5,938 | (1,723 | ) | (269,898 | ) | 35,008 | 26,861 | |||||||||||||
Three months ended March 26, 2011 compared to the three months ended March 27, 2010
Our financial results are largely driven by changes in systemwide sales, which include sales by all points of distribution, whether owned by Dunkin’ Brands or by its franchisees and licensees. While we do not record sales by franchisees or licensees as revenue, we believe that this information is important in obtaining an understanding of our financial performance. We believe systemwide sales information aids in understanding how we derive royalty revenue, assists readers in evaluating our performance relative to competitors, and indicates the strength of our franchised brands. Comparable store sales growth represents the growth in average weekly sales for restaurants that have been open at least 54 weeks that have reported sales in the current and comparable prior year week.
Overall growth in systemwide sales of 5.4% for the three months ended March 26, 2011 resulted from the following:
| • | Dunkin’ Donuts U.S. systemwide sales growth of 5.3%, as the result of 200 net new restaurants opened since March 27, 2010 and comparable store sales growth of 2.8% driven by increased average ticket; |
| • | Baskin-Robbins International systemwide sales growth of 5.2% as a result of increased sales in South Korea and Japan, which resulted primarily from favorable foreign exchange, as well as Australia; |
| • | Dunkin’ Donuts International systemwide sales growth of 10.0%, which was driven by results in South Korea and Southeast Asia, as well as Russia and the Middle East; and |
| • | Baskin-Robbins U.S. systemwide sales growth of 0.2% resulting from comparable store sales growth of 0.5%, offset by a slightly reduced restaurant base. |
The increase in total revenues of $11.8 million, or 9.3%, for the three months ended March 26, 2011 primarily resulted from increased franchise fees and royalty income of $5.8 million and sales of ice cream products of $4.9 million, both of which were driven by the overall increase in systemwide sales.
Operating income increased $8.2 million, or 22.2%, for the three months ended March 26, 2011, driven by the revenue increases noted above, offset by a $2.9 million decline in equity in net income of joint ventures. Increases in costs of ice cream and general and administrative expenses were offset by reduced occupancy expenses for franchised restaurants and depreciation and amortization, resulting in relatively flat total operating costs and expenses as compared to the prior year comparable period.
The net loss for the three months ended March 26, 2011 was driven by an $11.0 million pre-tax loss related to the debt re-pricing transaction completed in the first quarter of 2011, as well as $6.2 million of additional net interest expense resulting from additional long-term debt obtained since the prior year. Offsetting these additional costs was an increase in operating income of $8.2 million.
- 62 -
Table of Contents
Fiscal year 2010 compared to fiscal year 2009
Overall growth in systemwide sales of 6.7% for fiscal 2010 resulted from the following:
| • | Dunkin’ Donuts U.S. systemwide sales growth of 4.7%, which was the result of net restaurant development of 206 restaurants in 2010 and comparable store sales growth of 2.3% driven by both increased transaction counts and average ticket; |
| • | Baskin-Robbins International systemwide sales growth of 19.4% as a result of increased sales in South Korea and Japan, which resulted from both strong sales growth and favorable foreign exchange, as well as the Middle East; |
| • | Dunkin’ Donuts International systemwide sales growth of 15.0%, which resulted from results in South Korea and Southeast Asia driven by a combination of new restaurant development and comparable store sales growth; and |
| • | Baskin-Robbins U.S. systemwide sales decline of 5.5% resulting from a comparable store sales decline of 5.2% in addition to a slightly reduced restaurant base. |
The increase in total revenues of $39.1 million, or 7.3%, for fiscal 2010 primarily resulted from increased franchise fees and royalty income of $15.9 million, driven primarily by the increase in Dunkin’ Donuts U.S. systemwide sales, as well as a $16.0 million increase in other revenues resulting from additional company-owned restaurants held during the year.
Operating income increased $9.0 million, or 4.9%, for fiscal 2010 driven by the increase in franchise fees and royalty income noted above, as well as a $3.5 million increase in equity in net income of joint ventures. Increases in general and administrative expenses, excluding cost of sales for company-owned restaurants, offset the additional revenues and joint venture income.
Net income decreased $8.1 million for fiscal 2010 driven by a $62.0 million pre-tax loss on debt extinguishment, offset by a $46.7 million decrease in tax expense due to reduced profit before tax, as well as a $9.0 million increase in operating income.
Fiscal year 2009 compared to fiscal year 2008
Overall growth in systemwide sales of 4.1% for fiscal year 2009 resulted from the following:
| • | Dunkin’ Donuts U.S. systemwide sales growth of 3.4%, which was the result of net restaurant development of 171 restaurants in 2009, offset by a decrease in comparable store sales of 1.3% driven by increased discounting, which we believe was successful in driving traffic to our restaurants during the difficult economic climate; |
| • | Baskin-Robbins International systemwide sales growth of 21.3% as a result of a combination of strong sales in South Korea, Japan, and the Middle East, partially offset by negative foreign exchange impact; |
| • | Dunkin’ Donuts International systemwide sales decline of 4.0% driven by negative foreign exchange related to the Korean won and lower sales in Colombia and the Philippines, partially offset by higher sales in the Middle East; and |
| • | Baskin-Robbins U.S. systemwide sales decline of 6.4% resulting from a comparable store sales decline of 6.0% in addition to a slightly reduced restaurant base. |
The decline in total revenues of $6.9 million, or 1.3%, for fiscal 2009 primarily resulted from reduced franchise fees of $14.0 million due to fewer restaurant openings domestically as compared to the prior year. The decline in franchise fees was offset by an increase in royalty income of $9.0 million driven by the increase in Dunkin’ Donuts U.S. systemwide sales.
- 63 -
Table of Contents
Operating income increased $325.4 million for fiscal 2009 primarily as a result of fiscal 2008 including $328.5 million of impairment charges related to goodwill and trade name intangible asset. The $6.9 million reduction in revenues was offset by a $3.6 million reduction in occupancy expenses for franchised restaurants and a $3.4 million reduction in depreciation and amortization.
Net income increased $304.9 million for fiscal 2009 driven by the $325.4 million increase in operating income resulting from the goodwill and trade name impairment charges recorded in fiscal 2008. Offsetting the operating income decline was a $30.1 million increase in tax expense primarily resulting from 2008 including tax benefits related to the trade name impairment charge and changes in future state tax rates.
Results of operations
Three months ended March 26, 2011 compared to the three months ended March 27, 2010
Consolidated results of operations
| Three months ended | ||||||||||||||||
| March 27, 2010 |
March 26, 2011 |
Increase (Decrease) |
||||||||||||||
| $ | % | |||||||||||||||
| (In thousands, except percentages) | ||||||||||||||||
| Franchise fees and royalty income |
$ | 80,165 | 85,959 | 5,794 | 7.2% | |||||||||||
| Rental income |
22,116 | 22,131 | 15 | 0.1% | ||||||||||||
| Sales of ice cream products |
17,793 | 22,716 | 4,923 | 27.7% | ||||||||||||
| Other revenues |
7,338 | 8,407 | 1,069 | 14.6% | ||||||||||||
| Total revenues |
$ | 127,412 | 139,213 | 11,801 | 9.3% | |||||||||||
Total revenues for the three months ended March 26, 2011 as compared to the corresponding period in the prior year increased by $11.8 million, or 9.3%. Royalty income increased $4.2 million, or 5.6%, mainly as the result of Dunkin’ Donuts U.S. systemwide sales growth. Sales of ice cream products also contributed to the increase in total revenues, which were primarily driven by strong sales in the Middle East and Australia, as well as a December 2010 price increase that was implemented to offset higher commodity costs. Other revenues also increased $1.1 million primarily as a result of increases in licensing income and refranchising gains, as well as a decline in subsidies paid to franchisees that are recorded as reductions in revenue.
| Three months ended | ||||||||||||||||
| March 27, 2010 |
March 26, 2011 |
Increase (Decrease) |
||||||||||||||
| $ | % | |||||||||||||||
| (In thousands, except percentages) | ||||||||||||||||
| Occupancy expenses—franchised restaurants |
$ | 14,156 | 12,288 | (1,868 | ) | (13.2)% | ||||||||||
| Cost of ice cream products |
12,222 | 15,124 | 2,902 | 23.7% | ||||||||||||
| General and administrative expenses, net |
51,245 | 53,886 | 2,641 | 5.2% | ||||||||||||
| Depreciation and amortization |
15,332 | 13,208 | (2,124 | ) | (13.9)% | |||||||||||
| Impairment charges |
1,414 | 653 | (761 | ) | (53.8)% | |||||||||||
| Total operating costs and expenses |
$ | 94,369 | 95,159 | 790 | 0.8% | |||||||||||
| Equity in net income of joint ventures |
$ | 3,642 | 782 | (2,860 | ) | (78.5)% | ||||||||||
| Operating income |
36,685 | 44,836 | 8,151 | 22.2% | ||||||||||||
Occupancy expenses for franchised restaurants for the three months ended March 26, 2011 decreased $1.9 million from the prior year comparable period primarily as a result of lease reserves recorded in the prior year, as well as a decline in the number of leased properties.
- 64 -
Table of Contents
Cost of ice cream products increased 23.7% from the corresponding period in the prior year, as compared to a 27.7% increase in sales of ice cream products. The higher percentage increase in sales of ice cream products was primarily the result of increases in selling prices.
The increase in general and administrative expenses of $2.6 million from the corresponding period in the prior year was driven by an increase in payroll and related benefit costs of $2.3 million, or 7.9%, as a result of merit increases, increased headcount, and higher projected incentive compensation payouts. General and administrative expenses for the three months ended March 26, 2011 also included $1.0 million related to the roll-out of a new point-of-sale system for Baskin-Robbins franchisees. Offsetting these increases was a $0.9 million decline in bad debt and other reserves. Upon completion of this offering, we expect to incur an expense of approximately $14 million within general and administrative expenses related to the termination of the Sponsor management agreement. Additionally, the Company expects to record additional share-based compensation expense within general and administrative expenses of approximately $4 million upon completion of this offering, related to restricted shares granted to employees that were not eligible to vest until completion of an initial public offering or change of control (performance condition). See “Management—Compensation discussion and analysis—Change in control.” This estimated amount of share-based compensation expense was determined utilizing Monte Carlo simulations and the value of the underlying common stock on the dates of grant.
Depreciation and amortization declined a total of $2.1 million from the corresponding period in the prior year, primarily as a result of a license right intangible asset becoming fully amortized, as well as terminations of lease agreements in the normal course of business resulting in the write-off of favorable lease intangible assets, which thereby reduced future amortization. Additionally, depreciation declined from the prior year due to assets becoming fully depreciated and the write-off of leasehold improvements upon terminations of lease agreements.
The decrease in impairment charges resulted primarily from a $0.7 million impairment charge recorded in the corresponding period in the prior year related to corporate assets.
Equity in net income of joint ventures decreased as a result of decreases in income from both our Japan and South Korea joint ventures. Joint venture income from Japan was negatively impacted by the March 2011 earthquake and tsunami. Additionally, South Korea joint venture income declined as a result of increased operating expenses.
| Three months ended | ||||||||||||||||
| March 27, 2010 |
March 26, 2011 |
Increase (Decrease) |
||||||||||||||
| $ | % | |||||||||||||||
| (In thousands, except percentages) | ||||||||||||||||
| Interest expense, net |
$ | (27,520 | ) | (33,767 | ) | (6,247 | ) | 22.7% | ||||||||
| Loss on debt extinguishment and refinancing transaction |
— | (11,007 | ) | (11,007 | ) | n/m | ||||||||||
| Other gains, net |
245 | 476 | 231 | 94.3% | ||||||||||||
| Total other expense |
$ | (27,275 | ) | (44,298 | ) | (17,023 | ) | 62.4% | ||||||||
Net interest expense increased from the corresponding period in the prior year due to incremental interest expense related to net additional long-term debt of $429 million obtained since the corresponding period in the prior year, offset by a reduction in the average cost of borrowing.
The loss on debt extinguishment and refinancing for the three months ended March 26, 2011 resulted from the term loan re-pricing transaction completed in the first quarter of 2011. As the re-pricing transaction included the repayment of $150.0 million of senior notes utilizing the proceeds from the corresponding increase in the term loan, a $6.6 million loss on debt extinguishment was recorded related to the senior notes, which included the write-off of unamortized debt issuance costs and original issue discount of $5.8 million and transaction
- 65 -
Table of Contents
related fees of $0.8 million. Additionally, a $4.4 million loss was recorded related to the re-pricing of the term loan, which consisted of $3.7 million of third-party fees incurred, the write-off of $0.5 million of unamortized debt issuance costs and original issue discount, and $0.2 million of call premiums paid to lenders that exited the term loan syndicate.
The increase in other gains resulted from $0.1 million of additional gains on investments sold, as well as $0.1 million of additional foreign exchange gains primarily as a result of additional weakening of the U.S. dollar against the Canadian dollar as compared to the corresponding period in the prior year.
| Three months ended | ||||||||
| March 27, 2010 | March 26, 2011 | |||||||
| (In thousands, except percentages) | ||||||||
| Income before income taxes |
$ | 9,410 | 538 | |||||
| Provision for income taxes |
3,472 | 2,261 | ||||||
| Effective tax rate |
36.9% | 420.3% | ||||||
The increased effective tax rate of 420.3% for the three months ended March 26, 2011 was primarily attributable to enacted increases in state tax rates, which resulted in additional deferred tax expense of approximately $1.9 million in the three months ended March 26, 2011. The effective tax rate for the three months ended March 26, 2011 was also impacted by a reduced income before income taxes, driven by the loss on debt extinguishment and refinancing transaction, which magnified the impact of permanent and other tax differences.
Operating segments
We operate four reportable operating segments: Dunkin’ Donuts U.S., Dunkin’ Donuts International, Baskin-Robbins U.S., and Baskin-Robbins International. We evaluate the performance of our segments and allocate resources to them based on earnings before interest, taxes, depreciation, amortization, impairment charges, foreign currency gains and losses, other gains and losses, and unallocated corporate charges, referred to as segment profit. Segment profit for the Dunkin’ Donuts International and Baskin-Robbins International segments include equity in net income from joint ventures. For a reconciliation to total revenues and net income, see the notes to our consolidated financial statements. Revenues for Dunkin’ Donuts U.S. include royalties and rental income earned from company-owned restaurants. For purposes of evaluating segment profit, Dunkin’ Donuts U.S. includes the net operating income earned from company-owned restaurants. Revenues for all other segments include only transactions with unaffiliated customers and include no intersegment revenues. Revenues not included in segment revenues include retail sales from company-owned restaurants, as well as revenue earned through arrangements with third parties in which our brand names are used and revenue generated from online training programs for franchisees that are not allocated to a specific segment.
Dunkin’ Donuts U.S.
| Three Months Ended | Increase (Decrease) | |||||||||||||||
| March 27, 2010 |
March 26, 2011 |
|||||||||||||||
| $ | % | |||||||||||||||
| (In thousands, except percentages) | ||||||||||||||||
| Revenues |
$ | 91,403 | 96,512 | 5,109 | 5.6% | |||||||||||
| Segment profit |
63,563 | 70,707 | 7,144 | 11.2% | ||||||||||||
The increase in Dunkin’ Donuts U.S. revenue for the three months ended March 26, 2011 was primarily driven by an increase in royalty income of $3.3 million as a result of an increase in systemwide sales, as well as an increase in franchise fees of $1.1 million. Other revenues also increased $0.6 million due to an increase in refranchising gains and a decline in subsidies paid to franchisees that are recorded as reductions in revenue.
The increase in Dunkin’ Donuts U.S. segment profit for the three months ended March 26, 2011 was primarily driven by the $5.1 million increase in total revenues. The increase in segment profit also resulted from a decline
- 66 -
Table of Contents
in total occupancy expenses of $1.8 million driven by additional lease reserves recorded in the prior year and a decline in the number of leased locations. The remaining increase in segment profit resulted from a $0.4 million decline in general and administrative expenses due to declines in bad debt provisions and legal settlements, offset by an increase in payroll-related costs due to merit increases, increased headcount, and higher projected incentive compensation.
Dunkin’ Donuts International
| Three months ended | ||||||||||||||||
| March 27, 2010 |
March 26, 2011 |
Increase (Decrease) | ||||||||||||||
| $ | % | |||||||||||||||
| (In thousands, except percentages) | ||||||||||||||||
| Revenues |
$ | 3,321 | 3,869 | 548 | 16.5% | |||||||||||
| Segment profit |
3,712 | 3,181 | (531 | ) | (14.3)% | |||||||||||
The increase in Dunkin’ Donuts International revenue for the three months ended March 26, 2011 resulted primarily from an increase in royalty income of $0.3 million driven by the increase in systemwide sales. Also contributing to the increased revenue from the prior year was an increase of $0.3 million in franchise fees driven by a deposit retained from a former licensee in Mexico.
The decrease in Dunkin’ Donuts International segment profit for the three months ended March 26, 2011 was primarily driven by a decline in income from the South Korea joint venture of $0.7 million. The decrease in segment profit also resulted from a $0.3 million increase in general and administrative expenses primarily as a result of an increase in payroll-related costs due to increased headcount and merit increases. These declines in segment profit were offset by the $0.5 million increase in revenues.
Baskin-Robbins U.S.
| Three months ended | ||||||||||||||||
| March 27, 2010 |
March 26, 2011 |
Increase (Decrease) | ||||||||||||||
| $ | % | |||||||||||||||
| (In thousands, except percentages) | ||||||||||||||||
| Revenues |
$ | 9,032 | 9,045 | 13 | 0.1% | |||||||||||
| Segment profit |
5,224 | 4,300 | (924 | ) | (17.7)% | |||||||||||
Baskin-Robbins U.S. revenue for the three months ended March 26, 2011 remained flat to the prior year comparable period, which is consistent with the change in systemwide sales.
Baskin-Robbins U.S. segment profit declined as a result of increased general and administrative expenses for the three months ended March 26, 2011 including $1.0 million related to the roll-out of a new point-of-sale system for Baskin-Robbins franchisees.
Baskin-Robbins International
| Three months ended | ||||||||||||||||
| March 27, 2010 |
March 26, 2011 |
Increase (Decrease) | ||||||||||||||
| $ | % | |||||||||||||||
| (In thousands, except percentages) | ||||||||||||||||
| Revenues |
$ | 19,043 | 24,662 | 5,619 | 29.5% | |||||||||||
| Segment profit |
8,527 | 8,164 | (363 | ) | (4.3)% | |||||||||||
The growth in Baskin-Robbins International revenue for the three months ended March 26, 2011 resulted from an increase in sales of ice cream products of $5.0 million, which was primarily driven by strong sales in the Middle East and Australia. Royalty income also increased $0.6 million mainly as a result of higher sales and additional royalties earned in Australia due to the termination of a master license agreement.
- 67 -
Table of Contents
The decline in Baskin-Robbins International segment profit resulted primarily from a decrease in joint venture income of $2.1 million for the Baskin-Robbins businesses in South Korea and Japan. The decline in joint venture income for Japan primarily resulted from the March 2011 earthquake and tsunami, while South Korea joint venture income declined as a result of increased operating expenses. Additionally, general and administrative expenses increased $0.9 million as a result of an increase in payroll-related costs due to additional headcount and merit increases, additional travel costs, and increased professional fees. Offsetting these declines in segment profit was a $2.1 million increase in net margin on ice cream sales driven by strong sales and price increases, as well as the increase in royalty income of $0.6 million.
Fiscal year 2010 compared to fiscal year 2009
Consolidated results of operations
| Fiscal year 2009 |
Fiscal year 2010 |
Increase (Decrease) | ||||||||||||||
| $ | % | |||||||||||||||
| (In thousands, except percentages) | ||||||||||||||||
| Franchise fees and royalty income |
$ | 344,020 | 359,927 | 15,907 | 4.6% | |||||||||||
| Rental income |
93,651 | 91,102 | (2,549 | ) | (2.7)% | |||||||||||
| Sales of ice cream products |
75,256 | 84,989 | 9,733 | 12.9% | ||||||||||||
| Other revenues |
25,146 | 41,117 | 15,971 | 63.5% | ||||||||||||
| Total revenues |
$ | 538,073 | 577,135 | 39,062 | 7.3% | |||||||||||
The increase in total revenues from fiscal 2009 to fiscal 2010 was primarily driven by an increase in royalty income of $15.1 million, or 4.7%, from the prior year as the result of Dunkin’ Donuts U.S. systemwide sales growth. Other revenues also increased $16.0 million primarily as a result of the acquisition of company-owned restaurants, which contributed an additional $15.2 million of revenue in fiscal 2010. Sales of ice cream products also contributed to the increase in total revenues from fiscal 2009 to fiscal 2010, which were primarily driven by strong sales in the Middle East. These increases in revenue were offset by a decline in rental income of $2.5 million primarily as a result of a decline in the number of leased properties.
| Fiscal year 2009 |
Fiscal year 2010 |
Increase (Decrease) | ||||||||||||||
| $ | % | |||||||||||||||
| (In thousands, except percentages) | ||||||||||||||||
| Occupancy expenses—franchised restaurants |
$ | 51,964 | 53,739 | 1,775 | 3.4% | |||||||||||
| Cost of ice cream products |
47,432 | 59,175 | 11,743 | 24.8% | ||||||||||||
| General and administrative expenses, net |
197,005 | 223,620 | 26,615 | 13.5% | ||||||||||||
| Depreciation and amortization |
62,911 | 57,826 | (5,085 | ) | (8.1)% | |||||||||||
| Impairment charges |
8,517 | 7,075 | (1,442 | ) | (16.9)% | |||||||||||
| Total operating costs and expenses |
$ | 367,829 | 401,435 | 33,606 | 9.1% | |||||||||||
| Equity in net income of joint ventures |
14,301 | 17,825 | 3,524 | 24.6% | ||||||||||||
| Operating income |
$ | 184,545 | 193,525 | 8,980 | 4.9% | |||||||||||
Occupancy expenses for franchised restaurants increased $1.8 million from fiscal 2009 to fiscal 2010 resulting primarily from the impact of lease reserves, offset by a decline in the number of leased properties. Cost of ice cream products increased 24.8% from the prior year, as compared to a 12.9% increase in sales of ice cream products, primarily as the result of unfavorable commodity prices and foreign exchange.
The increase in other general and administrative expenses from fiscal 2009 to fiscal 2010 was driven by increased cost of sales for company-owned restaurants acquired during 2010 of $15.0 million. Also contributing
- 68 -
Table of Contents
to the increase in general and administrative expenses was an increase in payroll and related benefit costs of $6.8 million, or 6.0%, as a result of higher incentive compensation payouts and 401(k) matching contributions. Increased professional fees and legal costs driven by information technology enhancements and legal settlement reserves also contributed approximately $10.6 million to the increase in general administrative expenses. These increased expenses were offset by a decrease in bad debt and other reserves of $6.7 million.
Depreciation and amortization declined a total of $5.1 million from fiscal 2009 to fiscal 2010. The decrease is due primarily to a license right intangible asset becoming fully amortized, as well as terminations of lease agreements in the normal course of business resulting in the write-off of favorable lease intangible assets, which thereby reduced future amortization. Additionally, depreciation declined from the prior year due to assets becoming fully depreciated, sales of corporate assets, and the write-off of leasehold improvements upon terminations of lease agreements.
The decrease in impairment charges from fiscal 2009 to fiscal 2010 resulted from an impairment charge recorded in 2009 related to corporate assets, offset by additional impairment charges recorded in 2010 on favorable operating leases due to terminations of lease agreements.
Equity in net income of joint ventures increased from fiscal 2009 to fiscal 2010 as a result of increases in income from both our Japan and South Korea joint ventures. The increases in Japan and South Korea joint venture income from 2009 were primarily driven by sales growth, as well as favorable impact of foreign exchange.
| Fiscal year 2009 |
Fiscal year 2010 |
Increase (Decrease) | ||||||||||||||
| $ | % | |||||||||||||||
| (In thousands, except percentages) | ||||||||||||||||
| Interest expense, net |
$ | (115,019 | ) | (112,532 | ) | 2,487 | (2.2)% | |||||||||
| Gain (loss) on debt extinguishment |
3,684 | (61,955 | ) | (65,639 | ) | (1,781.7)% | ||||||||||
| Other gains, net |
1,066 | 408 | (658 | ) | (61.7)% | |||||||||||
| Total other expense (loss) |
$ | (110,269 | ) | (174,079 | ) | (63,810 | ) | 57.9% | ||||||||
Net interest expense declined from fiscal 2009 to fiscal 2010 due to the voluntary retirement of long-term debt with a face value of $99.8 million in the second quarter of 2010, reducing interest paid, insurer premiums, and the amortization of deferred financing costs. These decreases were slightly offset by incremental interest expense on approximately $528 million of additional long-term debt obtained in the fourth quarter of 2010.
The fluctuation in gains and losses on debt extinguishment resulted from the refinancing of existing long-term debt in the fourth quarter of 2010, which yielded a $58.3 million loss, as well as the voluntary retirement of long-term debt in the second quarter of 2010, which resulted in a $3.7 million loss. The gain on debt extinguishment of $3.7 million recorded in 2009 resulted from the voluntary retirement of long-term debt in the third quarter of 2009.
The decline in other gains from fiscal 2009 to fiscal 2010 resulted from reduced net foreign exchange gains, primarily as a result of significant weakening of the U.S. dollar against the Canadian dollar in 2009.
| Fiscal year 2009 |
Fiscal year 2010 |
|||||||
| (In thousands, except percentages) | ||||||||
| Income before income taxes |
$ | 74,276 | 19,446 | |||||
| Provision for income taxes |
39,268 | (7,415 | ) | |||||
| Effective tax rate |
52.9% | (38.1)% | ||||||
The negative effective tax rate of 38.1% in fiscal 2010 was primarily attributable to changes in state tax rates, which resulted in a deferred tax benefit of approximately $5.7 million in fiscal 2010. The effective tax rate for
- 69 -
Table of Contents
both years was also impacted by changes in reserves for uncertain tax positions, which are not driven by changes in income before income taxes. Reserves for uncertain tax positions were $9.1 million in fiscal 2009, as compared to a benefit of $3.1 million in fiscal 2010. The effective tax rate for fiscal 2010 was also impacted by a reduced income before income taxes, driven by the loss on debt extinguishment, which magnified the impact of permanent and other tax differences. Additionally, the higher effective tax rate in fiscal 2009 resulted from a $5.8 million additional valuation allowance recorded on capital loss carryforwards.
Operating segments
Dunkin’ Donuts U.S.
| Fiscal year 2009 |
Fiscal year 2010 |
Increase (Decrease) | ||||||||||||||
| $ | % | |||||||||||||||
| (In thousands, except percentages) | ||||||||||||||||
| Revenues |
$ | 387,595 | 402,394 | 14,799 | 3.8% | |||||||||||
| Segment profit |
275,961 | 293,132 | 17,171 | 6.2% | ||||||||||||
The increase in Dunkin’ Donuts U.S. revenue from fiscal 2009 to fiscal 2010 was driven by an increase in royalty income of $14.9 million as a result of an increase in systemwide sales.
The increase in Dunkin’ Donuts U.S. segment profit from fiscal 2009 to fiscal 2010 was primarily driven by the $14.9 million increase in royalty income. The increase in segment profit from fiscal 2009 to fiscal 2010 also resulted from a decline in general and administrative expenses of $5.1 million primarily attributable to decreases in both bad debt provisions and franchisee-related restructuring activities, offset by an increase in legal settlements and payroll-related costs due primarily to increased incentive compensation. Additionally, higher total occupancy expenses of $2.9 million from fiscal 2009 to fiscal 2010 resulted primarily from lease reserves recorded.
Dunkin’ Donuts International
| Fiscal year 2009 |
Fiscal year 2010 |
Increase (Decrease) | ||||||||||||||
| $ | % | |||||||||||||||
| (In thousands, except percentages) | ||||||||||||||||
| Revenues |
$ | 12,326 | 14,128 | 1,802 | 14.6% | |||||||||||
| Segment profit |
12,628 | 14,573 | 1,945 | 15.4% | ||||||||||||
The increase in Dunkin’ Donuts International revenue from fiscal 2009 to fiscal 2010 resulted primarily from an increase in royalty income of $1.2 million driven by the increase in systemwide sales. Also contributing to the increased revenue from the prior year was an increase of $0.9 million in franchise fees driven by development in China and Russia.
The increase in Dunkin’ Donuts International segment profit from fiscal 2009 to fiscal 2010 was primarily driven by the increases in revenues of $1.8 million, as noted above.
Baskin-Robbins U.S.
| Fiscal year 2009 |
Fiscal year 2010 |
Increase (Decrease) | ||||||||||||||
| $ | % | |||||||||||||||
| (In thousands, except percentages) | ||||||||||||||||
| Revenues |
$ | 46,293 | 42,920 | (3,373) | (7.3)% | |||||||||||
| Segment profit |
33,459 | 27,607 | (5,852) | (17.5)% | ||||||||||||
The decline in Baskin-Robbins U.S. revenue from fiscal 2009 to fiscal 2010 was driven by the decline in systemwide sales, which impacted both royalty income, which declined $1.7 million, and licensing income earned through the sale of ice cream to franchisees by a third-party, which declined $0.6 million. Rental income
- 70 -
Table of Contents
also decreased $0.6 million in fiscal 2010 driven by a decline in the number of subleases, as well as revised sublease terms which resulted in adjustments of straight-line rental income.
Baskin-Robbins U.S. segment profit declined from fiscal 2009 to fiscal 2010 primarily as a result of the declines in royalty, licensing, and rental income. Also contributing to the decline in segment profit from 2009 was additional gift certificate breakage income recorded in 2009 of $2.6 million, as the Company determined during fiscal year 2009 that sufficient historical patterns existed to estimate breakage and therefore recognized a cumulative adjustment for all gift certificates outstanding.
Baskin-Robbins International
| Fiscal year 2009 |
Fiscal year 2010 |
Increase (Decrease) | ||||||||||||||
| $ | % | |||||||||||||||
| (In thousands, except percentages) | ||||||||||||||||
| Revenues |
$ | 80,764 | 91,285 | 10,521 | 13.0% | |||||||||||
| Segment profit |
41,212 | 41,596 | 384 | 0.9% | ||||||||||||
The growth in Baskin-Robbins International revenue from fiscal 2009 to fiscal 2010 resulted primarily from an increase in ice cream sales of $9.8 million, which was driven by higher sales in the Middle East. Royalty income also increased $1.2 million in fiscal 2010 due to growth in systemwide sales, specifically in Japan, South Korea, and Russia.
Baskin-Robbins International segment profit remained relatively flat from fiscal 2009 to fiscal 2010. Joint venture income from the Baskin-Robbins businesses in South Korea and Japan increased $3.3 million from 2009, driven by systemwide sales growth in both countries. Royalty income also increased $1.2 million, as noted above. Offsetting these increases in segment profit was a decline in net margin on ice cream sales of $1.9 million, primarily as the result of unfavorable commodity prices and foreign exchange. Also offsetting the increases in segment profit were increases in travel, professional fees, and other general and administrative costs totaling $1.8 million.
Fiscal year 2009 compared to fiscal year 2008
Consolidated results of operations
| Fiscal year 2008 |
Fiscal year 2009 |
Increase (Decrease) | ||||||||||||||
| $ | % | |||||||||||||||
| (In thousands, except percentages) | ||||||||||||||||
| Franchise fees and royalty income |
$ | 349,047 | 344,020 | (5,027) | (1.4)% | |||||||||||
| Rental income |
97,886 | 93,651 | (4,235) | (4.3)% | ||||||||||||
| Sales of ice cream products |
71,445 | 75,256 | 3,811 | 5.3% | ||||||||||||
| Other revenues |
26,551 | 25,146 | (1,405) | (5.3)% | ||||||||||||
| Total revenues |
$ | 544,929 | 538,073 | (6,856) | (1.3)% | |||||||||||
The decline in total revenues from fiscal 2008 to fiscal 2009 was primarily driven by reduced franchise fees of $14.0 million, resulting from the opening of 431 fewer restaurants domestically. Rental and sublease income decreased $4.2 million, or 4.3%, from the prior year, driven by declines in comparable store sales in locations where rent is earned based on a percentage of sales, as well as a reduction in the amortization of unfavorable operating leases acquired due to lease terminations in the prior year. Other revenues declined $1.4 million from fiscal 2008 primarily as a result of fewer refranchising transactions in fiscal 2009, offset by increased licensing fees. Offsetting these decreases was an increase in royalty income of $9.0 million, or 2.9%, from the prior year
- 71 -
Table of Contents
driven by Dunkin’ Donuts U.S. systemwide sales growth. Sales of ice cream products also increased $3.8 million, or 5.3%, from the prior year driven primarily by Baskin-Robbins store development internationally.
| Fiscal year 2008 |
Fiscal year 2009 |
Increase (Decrease) | ||||||||||||||
| $ | % | |||||||||||||||
| (In thousands, except percentages) | ||||||||||||||||
| Occupancy expenses—franchised restaurants |
$ | 55,581 | 51,964 | (3,617) | (6.5)% | |||||||||||
| Cost of ice cream products |
49,407 | 47,432 | (1,975) | (4.0)% | ||||||||||||
| General and administrative expenses, net |
196,841 | 197,005 | 164 | 0.1% | ||||||||||||
| Depreciation and amortization |
66,300 | 62,911 | (3,389) | (5.1)% | ||||||||||||
| Impairment charges |
331,862 | 8,517 | (323,345) | (97.4)% | ||||||||||||
| Total operating costs and expenses |
$ | 699,991 | 367,829 | (332,162) | (47.5)% | |||||||||||
| Equity in net income of joint ventures |
14,169 | 14,301 | 132 | 0.9% | ||||||||||||
| Operating income |
$ | (140,893 | ) | 184,545 | 325,438 | n/m | ||||||||||
Occupancy expenses for franchised restaurants declined $3.6 million from fiscal 2008 to fiscal 2009 resulting primarily from the reversal of a lease reserve in 2009. Cost of ice cream and ice cream products decreased in fiscal 2009 despite higher sales volume primarily as the result of favorable commodity prices and foreign exchange.
General and administrative expenses, net, were flat from 2008 to 2009. Professional and legal costs declined primarily as a result of consulting fees incurred in 2008 related to entry into new markets that did not recur in 2009. Payroll and related benefit costs also declined from fiscal 2008 to fiscal 2009 due primarily to the temporary suspension of 401(k) matching contributions in fiscal 2009. Additionally, income of $3.2 million related to cumulative breakage of historical gift certificate balances was recorded in 2009. A focus on cost reductions during fiscal 2009 resulted in lower travel, meeting, and other controllable expenses. Partially offsetting these decreases in expenses in fiscal 2009 were increases in franchisee-related restructuring activities and a decline in legal settlement income.
Depreciation and amortization declined a total of $3.4 million from fiscal 2008 to fiscal 2009 due to terminations of lease agreements in the normal course of business, resulting in the write-off of favorable lease intangible assets which thereby reduced future amortization. Additionally, corporate assets were held for sale beginning in the third quarter of 2009, for which no depreciation was subsequently recorded.
The decrease in impairment charges from fiscal 2008 to fiscal 2009 was driven by a goodwill impairment charge recorded in 2008 of $294.5 million related to the Dunkin’ Donuts U.S. and Baskin-Robbins International businesses, as well as a 2008 charge of $34.0 million related to the Baskin-Robbins trade name. These impairment charges were triggered by declines in fair value of the intangible assets due to the overall economic environment and declines in peer company market values. Partially offsetting these declines in impairment charges from fiscal 2008 to fiscal 2009 was an impairment charge recorded in 2009 related to corporate assets.
Equity in net income of joint ventures increased slightly from fiscal 2008 to fiscal 2009 as a result of an increase in income from our Japan joint venture, offset by a decrease in income from our South Korea joint venture. The increase in Japan joint venture income in fiscal 2009 resulted from an increase in the joint venture’s net income driven by sales growth, as well as a favorable impact of foreign exchange. The decrease in South Korea joint venture income in fiscal 2009 resulted from an unfavorable impact of foreign exchange, partially offset by an increase in the joint venture’s net income due to growth in sales.
- 72 -
Table of Contents
| Fiscal year 2008 |
Fiscal year 2009 |
Increase (Decrease) | ||||||||||||||
| $ | % | |||||||||||||||
| (In thousands, except percentages) | ||||||||||||||||
| Interest expense, net |
$ | (115,944) | (115,019 | ) | 925 | (0.8)% | ||||||||||
| Gain (loss) on debt extinguishment |
— | 3,684 | 3,684 | n/a | ||||||||||||
| Other gains, net |
(3,929) | 1,066 | 4,995 | (127.1)% | ||||||||||||
| Total other expense (loss) |
$ | (119,873) | (110,269 | ) | 9,604 | (8.0)% | ||||||||||
Net interest expense declined from fiscal 2008 to fiscal 2009 due to the voluntary retirement of long-term debt with a face value of $153.7 million in the third quarter of 2009, reducing interest paid, insurer premiums, and the amortization of deferred financing costs, partially offset by a decrease in interest income due to declining interest rates.
During fiscal 2009, gains on debt extinguishment of $3.7 million were recorded as a result of the voluntary retirement of long-term debt in the third quarter of 2009. No such gains or losses were recorded in fiscal 2008.
The fluctuation in other gains and losses resulted from additional net foreign exchange gains of $4.6 million recorded in 2009 as compared to 2008 as a result of the strengthening of the U.S. dollar against the Canadian dollar in 2008, whereas the U.S. dollar weakened against the Canadian dollar in 2009. The remaining fluctuation resulted from gains and losses recorded on sales of available-for-sale securities.
| Fiscal year 2008 |
Fiscal year 2009 |
|||||||
| (In thousands, except percentages) | ||||||||
| Income (loss) before income taxes |
$ | (260,766 | ) | 74,276 | ||||
| Provision for income taxes |
9,132 | 39,268 | ||||||
| Effective tax rate |
(3.5 | )% | 52.9% | |||||
The negative effective tax rate of 3.5% in fiscal 2008 resulted from the goodwill impairment charge of $294.5 million, which was not deductible for tax purposes and therefore no tax benefit was recorded. Excluding the goodwill impairment charge, the effective tax rate for fiscal 2008 would have been 27.1%. Contributing to the reduced effective tax rate in fiscal 2008 was a $4.4 million tax benefit related to changes in future tax rates in Massachusetts that were enacted in 2008. The effective tax rate for both years was also impacted by reserves recorded for uncertain tax positions, which were not driven by changes in income before income taxes. These reserves for uncertain tax positions were $3.5 million and $9.1 million in fiscal 2008 and fiscal 2009, respectively. Additionally, the higher effective tax rate in fiscal 2009 resulted from an additional valuation allowance of approximately $5.8 million recorded on capital loss carryforwards.
Operating segments
Dunkin’ Donuts U.S.
| Fiscal year 2008 |
Fiscal year 2009 |
Increase (Decrease) | ||||||||||||||
| $ | % | |||||||||||||||
| (In thousands, except percentages) | ||||||||||||||||
| Revenues |
$ | 397,176 | 387,595 | (9,581) | (2.4)% | |||||||||||
| Segment profit |
288,009 | 275,961 | (12,048) | (4.2)% | ||||||||||||
The decline in Dunkin’ Donuts U.S. revenue from fiscal 2008 to fiscal 2009 was driven by a $12.4 million decline in franchise fees, resulting from the opening of 370 fewer restaurants compared to the prior year. Additionally, rental income decreased $3.4 million primarily as a result of the impact of negative comparable store sales on rent that is earned based on a percentage of sales. Also negatively impacting rental income were write-offs of
- 73 -
Table of Contents
unfavorable operating leases in fiscal 2008, which result in additional rental income at the time of write-off and reduce amortization to rental income in future periods. Other revenues declined $3.7 million from fiscal 2008 due to fewer refranchising transactions, as well as increased franchisee-related restructuring activities, which were recorded as reductions of revenue. Offsetting these declines in fiscal 2009 was an increase in royalty income of $9.9 million, or 3.7%, consistent with the increase in systemwide sales.
The decline in Dunkin’ Donuts U.S. segment profit from fiscal 2008 to fiscal 2009 was primarily driven by the declines in franchise fees and refranchising gains. Additionally, net rent margin declined $1.9 million from fiscal 2008 to fiscal 2009 driven by a decline in net rental income that is earned based on a percentage of sales due to negative comparable store sales and prior year write-offs of unfavorable operating leases acquired, partially offset by the reversal of a lease reserve. The decrease in segment profit from fiscal 2008 to fiscal 2009 also resulted from increases in both bad debt provisions and franchisee-related restructuring activities. Partially offsetting these declines in segment profit was an increase in royalty income of $9.9 million as noted above, as well as a decline in payroll-related costs of $4.5 million due to lower headcount and lower incentive compensation. Travel expenses and professional fees also declined $1.9 million in fiscal 2009 resulting from increased focus on cost management.
Dunkin’ Donuts International
| Fiscal year 2008 |
Fiscal year 2009 |
Increase (Decrease) | ||||||||||||||
| $ | % | |||||||||||||||
| (In thousands, except percentages) | ||||||||||||||||
| Revenues |
$ | 13,241 | 12,326 | (915) | (6.9)% | |||||||||||
| Segment profit |
14,534 | 12,628 | (1,906) | (13.1)% | ||||||||||||
The decrease in Dunkin’ Donuts International revenue from fiscal 2008 to fiscal 2009 resulted primarily from a $0.7 million decline in franchise fees due to fewer restaurant openings in fiscal 2009 as compared to the prior year. Additionally, other revenues declined $0.5 million in fiscal 2009 due to income generated in the prior year from company-owned operations in Spain, which were sold in fiscal 2009.
The decrease in Dunkin’ Donuts International segment profit from fiscal 2008 to fiscal 2009 was driven by the declines in franchise fees and other revenues, as discussed above. In addition, income from the South Korea joint venture declined $0.7 million from fiscal 2008 to fiscal 2009, which was driven primarily by an unfavorable impact of foreign exchange.
Baskin-Robbins U.S.
| Fiscal year 2008 |
Fiscal year 2009 |
Increase (Decrease) | ||||||||||||||
| $ | % | |||||||||||||||
| (In thousands, except percentages) | ||||||||||||||||
| Revenues |
$ | 50,499 | 46,293 | (4,206) | (8.3)% | |||||||||||
| Segment profit |
33,925 | 33,459 | (466) | (1.4)% | ||||||||||||
The decline in Baskin-Robbins U.S. revenue from fiscal 2008 to fiscal 2009 was driven by the decline in systemwide sales due to negative comparable store sales in addition to a slightly smaller restaurant base, which impacted both royalty income and licensing income earned through the sale of ice cream to franchisees by a third-party. Franchise fees declined $1.6 million in fiscal 2009 due to 61 fewer restaurant openings. Rental income also declined $0.4 million in fiscal 2009 as the number of subleases declined.
Baskin-Robbins U.S. segment profit declined from fiscal 2008 to fiscal 2009 primarily as a result of the declines in royalty income, franchise fees, and licensing income. Partially offsetting these declines was gift certificate breakage income recorded in 2009 of $3.2 million. All other general and administrative expenses included in segment profit for Baskin-Robbins U.S. declined in fiscal 2009 by approximately $0.6 million.
- 74 -
Table of Contents
Baskin-Robbins International
| Fiscal year 2008 |
Fiscal year 2009 |
Increase (Decrease) | ||||||||||||||
| $ | % | |||||||||||||||
| (In thousands, except percentages) | ||||||||||||||||
| Revenues |
$ | 76,066 | 80,764 | 4,698 | 6.2% | |||||||||||
| Segment profit |
33,257 | 41,212 | 7,955 | 23.9% | ||||||||||||
The growth in Baskin-Robbins International revenue from fiscal 2008 to fiscal 2009 resulted primarily from an increase of ice cream sales of $3.9 million, which was driven by higher sales in the Middle East, partially offset by unfavorable impacts of foreign exchange. Additionally, increased restaurant openings in China and Indonesia in fiscal 2009 resulted in higher franchise fees. Royalty income also increased $0.5 million in fiscal 2009 due to the growth in systemwide sales.
Baskin-Robbins International segment profit growth from fiscal 2008 to fiscal 2009 was primarily driven by an increase in net margin on sales of ice cream and ice cream related products of $5.9 million. This increase was driven by higher sales volumes in the Middle East, as well as significant commodity price declines during 2009. Also contributing to the increase in segment profit was an increase in franchise fees and royalty income of approximately $1.1 million. Additionally, joint venture income in Japan in fiscal 2009 increased $1.7 million driven by an increase in the joint venture’s net income driven by sales growth, and a favorable impact of foreign exchange. Partially offsetting these increases in segment profit in fiscal 2009 was a decrease in joint venture income in South Korea of $0.9 million as a result of unfavorable impact of foreign exchange, partially offset by an increase in the joint venture’s net income due to growth in sales.
Liquidity and capital resources
As of March 26, 2011, we held $120.5 million of cash and cash equivalents, which included $69.3 million of cash held for advertising funds and reserved for gift card/certificate programs. In addition, as of March 26, 2011, we had a borrowing capacity of $88.8 million under our $100.0 million revolving credit facility. During the three months ended March 26, 2011, net cash provided by operating activities was $3.6 million, as compared to $24.6 million for the three months ended March 27, 2010. During fiscal years 2010, 2009, and 2008, net cash provided by operating activities was $229.0 million, $116.1 million, and $74.7 million, respectively.
Net cash provided by operating activities of $3.6 million during the three months ended March 26, 2011 was primarily driven by a net loss of $1.7 million (increased by depreciation and amortization of $13.2 million and $13.1 million of other net non-cash reconciling adjustments), offset by $21.0 million of changes in operating assets and liabilities. During the three months ended March 26, 2011, we invested $3.7 million in capital additions to property and equipment. Net cash used in financing activities was $13.8 million during the three months ended March 26, 2011, driven primarily by costs associated with the February 2011 re-pricing transaction of $17.0 million, offset by proceeds from the issuance of common stock of $3.2 million.
Net cash provided by operating activities of $229.0 million during fiscal 2010 was primarily driven by net income of $26.9 million (increased by depreciation and amortization of $57.8 million and $26.7 million of other net non-cash reconciling adjustments), $6.6 million of dividends received from international joint ventures, and $111.0 million of changes in operating assets and liabilities, including the release of approximately $101.7 million of restricted cash as a result of the November 2010 debt refinancing. During fiscal 2010, we invested $15.4 million in capital additions to property and equipment. Net cash used in financing activities was $132.6 million during fiscal 2010, which includes proceeds from the issuance of long-term debt, net of repayment and voluntary retirement of debt and debt issuance costs, of $353.4 million and a $16.1 million decrease in debt-related restricted cash balances, offset by dividends paid on common stock of approximately $500.0 million.
- 75 -
Table of Contents
On November 23, 2010, we consummated a refinancing transaction whereby Dunkin’ Brands, Inc. (i) issued and sold $625.0 million aggregate principal amount of 9 5/8% senior notes due 2018 and (ii) borrowed $1.25 billion in term loans and secured a $100.0 million revolving credit facility from a consortium of banks. The senior secured credit facility was amended on February 18, 2011, primarily to obtain more favorable interest rate margins and to increase the term loan borrowings under the senior secured credit facility to $1.40 billion. The full $150.0 million increase in term loan borrowings under the senior secured credit facility was used to redeem an equal principal amount of the senior notes at a price of 100.5% of par on March 21, 2011. On May 24, 2011 we further increased the size of the term loan facility by an additional $100.0 million to approximately $1.50 billion, which will be used to repay $100.0 million of senior notes. Interest expense, net, for fiscal 2010 and the three months ended March 26, 2011 on a pro forma basis would have been approximately $71.5 million and $17.9 million, respectively, after giving effect to the November 2010 refinancing, the February 2011 re-pricing and increase in the term loan facility by $150.0 million, and the May 2011 increase in the term loan facility by $100.0 million and the repayment of the senior notes, as if these transactions had occurred on the first day of the respective periods.
The senior notes require semi-annual interest payments, beginning June 1, 2011. We may redeem some or all of the senior notes at fixed redemption prices of 100.5% of par through November 30, 2011, 102.5% of par from December 1, 2011 through November 30, 2012, 102.0% of par from December 1, 2012 through November 30, 2013, and 100% of par commencing December 1, 2013 through maturity. In the event of a change in control, as defined in the indenture governing the senior notes, or certain asset sales we will be obligated to repurchase the senior notes tendered at the option of the holders at a fixed price. We expect to use the net proceeds from this offering, together with the net proceeds from our $100.0 million of additional term loan borrowings, to redeem approximately $475.0 million in principal amount of the senior notes. The senior notes are guaranteed by certain of Dunkin’ Brands, Inc.’s wholly-owned domestic subsidiaries. The senior notes are unsecured and are effectively subordinated to the senior secured credit facility to the extent of the value of the assets securing such debt.
The senior credit facility is guaranteed by certain of Dunkin’ Brands, Inc.’s wholly-owned domestic subsidiaries and includes a term loan facility and a revolving credit facility. Following the May 2011 amendment, the aggregate borrowings available under the senior secured credit facility are approximately $1.6 billion, consisting of a full-drawn approximately $1.5 billion term loan facility and a $100.0 million revolving credit facility under which $11.2 million of letters of credit were outstanding as of March 26, 2011. Borrowings under the term loan bear interest, payable at least quarterly. The senior secured credit facility requires principal amortization repayments to be made on term loan borrowings equal to approximately $15.0 million per calendar year, payable in quarterly installments through September 2017. The final scheduled principal payment on the outstanding borrowings under the term loan is due in November 2017.
The senior credit facility also provides for borrowings of up to $100.0 million under the revolving credit facility, of which up to $50.0 million is available for letter of credit advances. Borrowings under the revolving credit facility (excluding letters of credit) bear interest, payable at least quarterly. We also pay a 0.50% commitment fee per annum on the unused portion of the revolver. The fee for letter of credit amounts outstanding ranges from 3.75% to 4.25%. At March 26, 2011, the fee for letter of credit amounts outstanding was 4.25%. At March 26, 2011, there was $88.8 million in available borrowings under the revolving credit facility, with $11.2 million of letters of credit outstanding. The revolving credit facility expires in November 2015.
The senior credit facility requires us to comply on a quarterly basis, with certain financial covenants, including a maximum ratio of debt to adjusted EBITDA (the “leverage ratio”) and a minimum ratio of adjusted EBITDA to interest expense (the “coverage ratio”), each of which becomes more restrictive over time. For fiscal year 2011, the terms of the senior credit facility require that we maintain a leverage ratio of no more than 8.60 to 1.00 and a minimum interest coverage ratio of 1.45 to 1.00. The leverage ratio financial covenant will become more restrictive over time and will require us to maintain a leverage ratio of no more than 6.25 to 1.00 by the second quarter of fiscal year 2017. The interest coverage ratio covenant will also become more restrictive over time and will require us to maintain an interest coverage ratio of no less than 1.95 to 1.00 by the second quarter of
- 76 -
Table of Contents
fiscal year 2017. Failure to comply with either of these covenants would result in an event of default under our senior credit facility unless waived by our senior credit facility lenders. An event of default under our senior credit facility can result in the acceleration of our indebtedness under the facility, which in turn can result in an event of default and possible acceleration of our other indebtedness. Adjusted EBITDA is a non-GAAP measure used to determine our compliance with certain covenants contained in our senior credit facility, including our leverage ratio. Adjusted EBITDA is defined in our senior credit facility as net income/(loss) before interest, taxes, depreciation and amortization and impairment of long-lived assets, as adjusted, with respect to the twelve months ended March 26, 2011, for the items summarized in the table below. Adjusted EBITDA is not a presentation made in accordance with GAAP, and our use of the term adjusted EBITDA varies from others in our industry due to the potential inconsistencies in the method of calculation and differences due to items subject to interpretation. Adjusted EBITDA should not be considered as an alternative to net income/(loss), operating income or any other performance measures derived in accordance with GAAP, as a measure of operating performance or as an alternative to cash flows as a measure of liquidity. Adjusted EBITDA has important limitations as an analytical tool and should not be considered in isolation or as a substitute for analysis of our results as reported under GAAP. Because of these limitations we rely primarily on our GAAP results. However, we believe that presenting adjusted EBITDA is appropriate to provide additional information to investors to demonstrate compliance with our financing covenants. As of March 26, 2011, we were in compliance with our senior credit facility financial covenants, including a leverage ratio of 6.3 to 1 and an interest coverage ratio of 2.2 to 1, which were calculated for the twelve months ended March 26, 2011 based upon the adjustments to EBITDA, as provided for under the terms of our senior credit facility. The following is a reconciliation of our net income to such adjusted EBITDA for the twelve months ended March 26, 2011 (in thousands):
| Twelve months ended March 26, 2011 |
||||
| Net income |
$ | 19,200 | ||
| Interest expense |
119,128 | |||
| Income tax expense (benefit) |
(8,626 | ) | ||
| Depreciation and amortization |
55,702 | |||
| Impairment of long-lived assets |
6,314 | |||
| EBITDA |
$ | 191,718 | ||
| Adjustments: |
||||
| Non-cash adjustments(a) |
$ | 6,636 | ||
| Transaction costs(b) |
1,120 | |||
| Sponsor management fees(c) |
3,000 | |||
| Loss on debt extinguishment and refinancing transaction(d) |
72,962 | |||
| Senior executive transition and severance(e) |
4,256 | |||
| New market entry(f) |
275 | |||
| Franchisee-related restructuring(g) |
2,274 | |||
| Technology and market related initiatives(h) |
3,145 | |||
| Other(i) |
1,888 | |||
| Total adjustments |
$ | 95,556 | ||
| Adjusted EBITDA |
$ | 287,274 | ||
| (a) | Represents non-cash adjustments, including stock compensation expense, legal reserves, and other non-cash gains and losses. |
| (b) | Represents cost and expenses related to the Company’s refinancing and dividend transactions. |
| (c) | Represents annual fees paid to the Sponsors under a management agreement, which will be terminated upon the consummation of this offering. See “Related party transactions – Arrangements with our investors.” |
| (d) | Represents gains/losses recorded and related transaction costs associated with the refinancing of long-term debt, including the write-off of deferred financing costs and original issue discount, as well as pre-payment premiums. |
| (e) | Represents severance and related benefits costs associated with non-recurring reorganizations (includes the accrual of costs associated with Executive Chairman transition). |
| (f) | Represents one-time costs and fees associated with entry into new markets. |
| (g) | Represents one-time costs of franchisee-related restructuring programs. |
| (h) | Represents costs associated with various franchisee information technology and one-time market research programs. |
| (i) | Represents the net impact of other non-recurring and individually insignificant adjustments. |
- 77 -
Table of Contents
Based upon our current level of operations and anticipated growth, we believe that the cash generated from our operations and amounts available under our revolving credit facility will be adequate to meet our anticipated debt service requirements, capital expenditures and working capital needs for at least the next twelve months. We believe that we will be able to meet these obligations even if we experience no growth in sales or profits. Our ability to continue to fund these items and continue to reduce debt could be adversely affected by the occurrence of any of the events described under “Risk factors.” There can be no assurances, however, that our business will generate sufficient cash flows from operations or that future borrowings will be available under our revolving credit facility or otherwise to enable us to service our indebtedness, including our senior secured credit facility, or to make anticipated capital expenditures. Our future operating performance and our ability to service, extend or refinance the senior secured credit facility will be subject to future economic conditions and to financial, business and other factors, many of which are beyond our control.
Off balance sheet obligations
We have entered into a third-party guarantee with a distribution facility of franchisee products that ensures franchisees will purchase a certain volume of product. As product is purchased by our franchisees over the term of the agreement, the amount of the guarantee is reduced. As of March 26, 2011, we were contingently liable for $8.4 million, under this guarantee. Based on current internal forecasts, we believe the franchisees will achieve the required volume of purchases, and therefore, we would not be required to make payments under this agreement. Additionally, the Company has various supply chain contracts that provide for purchase commitments or exclusivity, the majority of which result in the Company being contingently liable upon early termination of the agreement or engaging with another supplier. Based on prior history and the Company’s ability to extend contract terms, we have not recorded any liabilities related to these commitments. As of March 26, 2011, we were contingently liable under such supply chain agreements for approximately $20.3 million.
As a result of assigning our interest in obligations under property leases as a condition of the refranchising of certain restaurants and the guarantee of certain other leases, we are contingently liable on certain lease agreements. These leases have varying terms, the latest of which expires in 2024. As of March 26, 2011, the potential amount of undiscounted payments we could be required to make in the event of nonpayment by the primary lessee was $7.8 million. Our franchisees are the primary lessees under the majority of these leases. We generally have cross-default provisions with these franchisees that would put them in default of their franchise agreement in the event of nonpayment under the lease. We believe these cross-default provisions significantly reduce the risk that we will be required to make payments under these leases, and we have not recorded a liability for such contingent liabilities.
We do not have any other material off balance sheet obligations other than the guaranteed financing arrangements discussed above in “Critical accounting policies.”
Inflation
Historically, inflation has not had a material effect on our results of operations. Severe increases in inflation, however, could affect the global and U.S. economies and could have an adverse impact on our business, financial condition and results of operations.
- 78 -
Table of Contents
Seasonality
Our revenues are subject to fluctuations based on seasonality, primarily with respect to Baskin-Robbins. The ice cream industry generally experiences an increase during the spring and summer months, whereas Dunkin’ Donuts hot beverage sales generally increase during the fall and winter months and iced beverage sales generally increase during the spring and summer months.
Quantitative and qualitative disclosures about market risk
Foreign exchange risk
We are subject to inherent risks attributed to operating in a global economy. Most of our revenues, costs and debts are denominated in U.S. dollars. Our investments in, and equity income from, joint ventures are denominated in foreign currencies, and are therefore subject to foreign currency fluctuations. For fiscal year 2010, a 5% change in foreign currencies relative to the U.S. dollar would have had a $0.9 million impact on equity in net income of joint ventures. Additionally, a 5% change in foreign currencies as of March 26, 2011 would have had an $8.8 million impact on the carrying value of our investments in joint ventures. In the future, we may consider the use of derivative financial instruments, such as forward contracts, to manage foreign currency exchange rate risks.
Interest rate risk
We are subject to interest rate risk in connection with our long-term debt. Our principal interest rate exposure mainly relates to the term loan outstanding under our new senior credit facility. We have a $1.50 billion term loan facility bearing interest at variable rates. Each eighth of a percentage point change in interest rates would result in a $1.9 million change in annual interest expense on our new term loan facility. We also have a revolving credit facility, which provides for borrowings of up to $100.0 million and bears interest at variable rates. Assuming the revolver is fully drawn, each eighth of a percentage point change in interest rates would result in a $0.1 million change in annual interest expense on our revolving loan facility.
In the future, we may enter into hedging instruments, involving the exchange of floating for fixed rate interest payments, to reduce interest rate volatility.
Contractual obligations
The following table sets forth our contractual obligations as of December 25, 2010, and additionally reflects the impact of the February 2011 re-pricing transaction. Long-term debt amounts below do not reflect the additional $100.0 million of term loan borrowings in May 2011 and anticipated repayment of an equal amount of senior notes. There have been no other significant changes to our contractual obligations since December 25, 2010.
| (In millions) | Total |
Less than 1 year |
1-3 years |
3-5 years |
More than 5 years |
|||||||||||||||
| Long-term debt(1)(2) |
$ | 2,835.7 | 129.3 | 254.9 | 304.4 | 2,147.1 | ||||||||||||||
| Capital lease obligations |
9.7 | 0.7 | 1.4 | 1.5 | 6.1 | |||||||||||||||
| Operating lease obligations |
652.6 | 51.4 | 100.6 | 94.1 | 406.5 | |||||||||||||||
| Purchase obligations(3)(4) |
— | — | — | — | — | |||||||||||||||
| Short and long-term obligations(5) |
19.5 | 3.9 | 6.6 | 6.0 | 3.0 | |||||||||||||||
| Total(6) |
$ | 3,517.5 | 185.3 | 363.5 | 406.0 | 2,562.7 | ||||||||||||||
| (1) | Amounts include mandatory principal payments on long-term debt, as well as estimated interest of $115.3 million, $226.9 million, $276.4 million, and $342.1 million for less than 1 year, 1-3 years, 3-5 years, and more than 5 years, respectively. Amounts reflect the impact of the |
- 79 -
Table of Contents
| repricing and increase of our term loans completed in February 2011, and the corresponding redemption of senior notes. Interest on the $1.4 billion of term loans under our senior credit facility is variable, subject to an interest rate floor, and have been estimated based on a LIBOR yield curve. Our term loans also require us to prepay an amount equal to 50% of excess cash flow (as defined in the senior credit facility) for the preceding fiscal year beginning in the first quarter of fiscal 2012, if our leverage ratio exceeds 5.25x at the end of such fiscal year. If the leverage ratio is less than 5.25x, then 25% of excess cash flow is required to be prepaid, and if the leverage ratio is less than 4.00x, then no excess cash flow prepayment is required. Excess cash flow prepayments have not been reflected in the contractual obligation amounts above. |
| (2) | We intend to use the net proceeds from this offering, together with the net proceeds from our additional $100.0 million of term loan borrowings, to repay all amounts outstanding under the senior notes. See “Use of proceeds.” |
| (3) | We entered into a third-party guarantee with a distribution facility of franchisee products that ensures franchisees will purchase a certain volume of product. As of December 25, 2010, we were contingently liable for $8.6 million under this guarantee. We have various supply chain contracts that provide for purchase commitments or exclusivity, the majority of which result in our being contingently liable upon early termination of the agreement or engaging with another supplier. Based on prior history and our ability to extend contract terms, we have not recorded any liabilities related to these commitments. As of December 25, 2010, we were contingently liable under such supply chain agreements for approximately $16 million. |
| (4) | We are guarantors of and are contingently liable for certain lease arrangements primarily as the result of our assigning our interest. As of December 25, 2010, we were contingently liable for $7.2 million under these guarantees, which are discussed further above in “Off Balance Sheet Obligations.” Additionally, in certain cases, we issue guarantees to financial institutions so that franchisees can obtain financing. If all outstanding guarantees, which are discussed further above in “Critical accounting policies,” came due as of December 25, 2010, we would be liable for approximately $7.7 million. |
| (5) | Amounts include obligations to former employees, as well as Sponsor management fees, which are currently payable at $3.0 million per year. In connection with this offering and the termination of our agreement with the Sponsors, the contractual payments will be accelerated and we will be required to pay approximately $14 million to the Sponsors upon the consummation of this offering in lieu of future payments. See “Related party transactions – Arrangements with our investors.” |
| (6) | As of December 25, 2010, the Company has a liability for uncertain tax positions of $29.6 million for which the timing of payment, if any, for $28.5 million is unknown at this time. The Company expects to pay approximately $1.1 million related to these uncertain tax positions during fiscal 2011. |
Recently issued accounting standards
In December 2010, the Financial Accounting Standards Board (FASB) issued new guidance to amend the criteria for performing the second step of the goodwill impairment test for reporting units with zero or negative carrying amounts and requires performing the second step if qualitative factors indicate that it is more likely than not that a goodwill impairment exists. This new guidance is effective for the Company beginning in fiscal year 2011. We do not expect the adoption of this guidance to have a material impact on our goodwill assessment or our consolidated financial statements.
In January 2010, the FASB issued new guidance and clarifications for improving disclosures about fair value measurements. This guidance requires enhanced disclosures regarding transfers in and out of the levels within the fair value hierarchy. Separate disclosures are required for transfers in and out of Levels 1 and 2 fair value measurements, and the reasons for the transfers must be disclosed. In the reconciliation for Level 3 fair value measurements, separate disclosures are required for purchases, sales, issuances, and settlements on a gross basis. The new disclosures and clarifications of existing disclosures were effective for the Company in fiscal year 2010, except for the disclosures about purchases, sales, issuances, and settlements in the roll forward of activity in Level 3 fair value measurements, which were effective for the Company in fiscal year 2011. The adoption of this guidance did not have any impact on our financial position or results of operations, as it only relates to disclosures.
- 80 -
Table of Contents
Our company
We are one of the world’s leading franchisors of quick service restaurants (“QSRs”) serving hot and cold coffee and baked goods, as well as hard serve ice cream. We franchise restaurants under our Dunkin’ Donuts and Baskin-Robbins brands. With over 16,000 points of distribution in 57 countries, we believe that our portfolio has strong brand awareness in our key markets. Dunkin’ Donuts holds the #1 position in the U.S. by servings in each of the QSR subcategories of “Hot regular coffee,” “Iced coffee,” “Donuts,” “Bagels,” and “Muffins,” and holds the #2 position in the U.S. by servings in each of the QSR subcategories of “Total coffee” and “Breakfast sandwiches.” Baskin-Robbins is the #1 QSR chain in the U.S. for servings of hard serve ice cream and has established leading market positions in Japan and South Korea. QSR is a restaurant format characterized by counter or drive-thru ordering and limited or no table service.
We believe that our nearly 100% franchised business model offers strategic and financial benefits. For example, because we do not own or operate a significant number of stores, our company is able to focus on menu innovation, marketing, franchisee coaching and support, and other initiatives to drive the overall success of our brand. Financially, our franchised model allows us to grow our points of distribution and brand recognition with limited capital investment by us.
We operate our business in four segments: Dunkin’ Donuts U.S., Dunkin’ Donuts International, Baskin-Robbins International and Baskin-Robbins U.S. In 2010, our Dunkin’ Donuts segments generated revenues of $416.5 million, or 76% of our total segment revenues, of which $402.4 million was in the U.S. segment and $14.1 million was in the international segment. In 2010, our Baskin-Robbins segments generated revenues of $134.2 million, of which $91.3 million was in the international segment and $42.9 million was in the U.S. segment. As of March 26, 2011, there were 9,805 Dunkin’ Donuts points of distribution, of which 6,799 were in the U.S. and 3,006 were international, and 6,482 Baskin-Robbins points of distribution, of which 3,959 were international and 2,523 were in the U.S. Our points of distribution consist of traditional end-cap, in-line and stand-alone restaurants, many with drive thrus, and gas and convenience locations, as well as alternative points of distribution (“APODs”), such as full- or self-service kiosks in grocery stores, hospitals, airports, offices, colleges and other smaller-footprint properties.
We generate revenue from four primary sources: (i) royalties and fees associated with franchised restaurants; (ii) rental income from restaurant properties that we lease or sublease to franchisees; (iii) sales of ice cream and ice cream products to franchisees in certain international markets; and (iv) other income including fees for the licensing of the Dunkin’ Donuts brand for products sold in on-franchised outlets (such as retail packaged coffee) and the licensing of the rights to manufacture Baskin-Robbins ice cream to a third party for ice cream and related products sold to U.S. franchisees; as well as refranchising gains, transfer fees from franchisees, revenue from our company-owned restaurants and online training fees.
For fiscal years 2008, 2009 and 2010, we generated total revenues of $544.9 million, $538.1 million and $577.1 million, respectively, operating income (loss) of $(140.9) million, $184.5 million and $193.5 million, respectively and net income (loss) of $(269.9) million, $35.0 million and $26.9 million, respectively. Our net loss in 2008 included a pre-tax impairment charge of $328.5 million related to goodwill and trade name intangible assets, and our net income for fiscal year 2010 included a $62.0 million pre-tax loss on debt extinguishment primarily associated with our November 2010 refinancing transaction.
Our history and recent accomplishments
Both of our brands have a rich heritage dating back to the 1940s, when Bill Rosenberg founded his first restaurant, subsequently renamed Dunkin’ Donuts, and Burt Baskin and Irv Robbins each founded a chain of ice
- 81 -
Table of Contents
cream shops that eventually combined to form Baskin-Robbins. Baskin-Robbins and Dunkin’ Donuts were individually acquired by Allied Domecq PLC in 1973 and 1989, respectively. The brands were organized under the Allied Domecq Quick Service Restaurants subsidiary, which was renamed Dunkin’ Brands, Inc. in 2004. Allied Domecq was acquired in July 2005 by Pernod Ricard S.A. Pernod Ricard made the decision to divest Dunkin’ Brands in order to remain a focused global spirits company. As a result, in March of 2006, we were acquired by investment funds affiliated with Bain Capital Partners, LLC, The Carlyle Group and Thomas H. Lee Partners, L.P. (collectively, the “Sponsors”).
We have experienced positive growth globally for both our Dunkin’ Donuts and our Baskin-Robbins brands in systemwide sales in each of the last ten years. In addition, other than in 2007 with respect to Baskin-Robbins, we have experienced positive year over year growth globally for both of our Dunkin’ Donuts and Baskin-Robbins brands in points of distribution in each of the last 10 years. During this ten-year period, we have grown our global Dunkin’ Donuts points of distribution and systemwide sales by compound annual growth rates of 6.9% and 8.7%, respectively. During the same period, we have also grown our global Baskin-Robbins total points of distribution and systemwide sales by compound annual growth rates of 4.0% and 6.8%, respectively. In 2008, 2009 and 2010, our Dunkin’ Donuts global points of distribution at year end totaled 8,835, 9,186 and 9,760, respectively. Dunkin’ Donuts systemwide sales for the same three years grew 5.0%, 2.7%, and 5.6%, respectively. In 2008, 2009 and 2010, our Baskin-Robbins global points of distribution at year end totaled 6,013, 6,207 and 6,433, respectively. Baskin-Robbins systemwide sales for the same three years grew 5.1%, 9.8%, and 10.6%, respectively.
Our largest operating segment, Dunkin’ Donuts U.S. had experienced 45 consecutive quarters of positive comparable store sales growth until the first quarter of 2008. During fiscal 2008, 2009 and 2010, we believe we demonstrated comparable store sales resilience during the recession and invested for future growth. These investments were in three key areas—expanding menu and marketing initiatives to drive comparable store sales growth, expanding our store development team and investing in proprietary tools to assess new store opportunities and increasing management resources for our international businesses. During fiscal 2010, Dunkin’ Donuts U.S. experienced sequential improvement in comparable store sales growth with comparable store sales growth of (0.6)%, 1.9%, 2.7% and 4.7% in the first through fourth quarters, respectively. Positive comparable store sales growth has continued in the first quarter of fiscal 2011 despite adverse weather conditions in the Northeast region during the quarter.
Dunkin’ Donuts U.S. comparable store sales growth(1)
| (1) | Data for fiscal year 2001 through fiscal year 2005 represent results for the fiscal years ended August. All other fiscal years represent results for the fiscal years ended the last Saturday in December. |
Our Baskin-Robbins U.S. operating segment, which represented approximately 7.4% of our total revenues in 2010, experienced decreased comparable stores sales in 2008, 2009 and 2010 of (2.2)%, (6.0)% and (5.2)%, respectively.
- 82 -
Table of Contents
Our competitive business strengths
We attribute our success in the QSR segment to the following strengths:
Strong and established brands with leading market positions
Our Dunkin’ Donuts and Baskin-Robbins brands have histories dating back more than 60 years, and we believe our brands have well-established reputations for delivering high-quality beverage and food products at a good value through convenient locations with fast and friendly service. Today both brands are leaders in their respective QSR categories, with aided brand awareness (where respondents are provided with brand names and asked if they have heard of them) of approximately 95% in the U.S., and a growing presence overseas.
In addition to our leading U.S. market positions, for the fifth consecutive year, Dunkin’ Donuts was recognized in 2011 by Brand Keys, a customer satisfaction research company, as #1 in the U.S. on its Customer Loyalty Engagement IndexSM in the coffee category. Our customer loyalty is particularly evident in New England, where we have our highest penetration per capita in the U.S. and where, according to CREST® data, we hold a 52% market share of breakfast daypart visits and a market share of 57% of total QSR coffee based on servings. Further demonstrating the strength of our brand, in 2010 the Dunkin’ Donuts 12 oz. original blend bagged coffee was the #1 grocery stock-keeping unit nationally in the premium coffee category, with double the sales of our closest competitor, according to Nielsen.
Similarly, Baskin-Robbins is the #1 QSR chain in the U.S. for servings of hard serve ice cream and has established leading market positions in Japan and South Korea.
Franchised business model provides a platform for growth
Nearly 100% of our locations are franchised, allowing us to focus on our brand differentiation and menu innovation, while our franchisees expand our points of distribution with operational guidance from us. Gross store openings in fiscal 2010 were 336, 715, 493 and 75 in Dunkin’ Donuts U.S., Dunkin’ Donuts International, Baskin-Robbins International and Baskin-Robbins U.S., respectively. This expansion requires limited financial investment by us, given that new store development and substantially all of our store advertising costs are funded by franchisees. Consequently, we achieved an operating income margin of approximately 34% in fiscal 2010. For our domestic businesses, our revenues are largely derived from royalties based on a percentage of franchisee revenues rather than their net income, as well as contractual lease payments and other franchise fees. We seek to mitigate the challenges of a franchised business model, including a lack of direct control over day-to-day operations in our stores and over restaurant development, which prevents us from being able to quickly and unilaterally grow our business or scale back operations. through our team of more than 350 operational employees who support our franchisees and restaurant managers along with our training and monitoring programs.” See “—Franchisee relationships—Franchise agreement terms.”
Store-level economics generate franchisee demand for new Dunkin’ Donuts restaurants in the U.S.
In the U.S., new traditional format Dunkin’ Donuts stores opened during fiscal 2010, excluding gas and convenience locations, generated average weekly sales of approximately $16,400, or annualized unit volumes of approximately $855,000, while the average capital expenditure required to open a new traditional restaurant site in the U.S., excluding gas and convenience locations, was approximately $474,000 in 2010. In addition, we offer our franchisees significant operational support by aiming to continuously improve restaurant profitability. One example is supporting their supply chain, where we believe we have facilitated approximately $220 million in franchisee cost reductions between 2008 and the first quarter of fiscal 2011 primarily through strategic sourcing, as well as other initiatives, such as rationalizing the number of product offerings to reduce waste and reducing costs on branded packaging by reducing the color mix in graphics. We believe that the
- 83 -
Table of Contents
majority of these cost savings represent sustainable improvements to our franchisees’ supply costs, with the remainder dependent upon the outcome of future supply contract re-negotiations, which typically occur every two to four years. However, there can be no assurance that these cost reductions will be sustainable in the future. While we do not directly benefit from improvements in store-level profitability, we believe that strong store-level economics is important to our ability to attract and retain successful franchisees and grow our business. Of our fiscal 2010 openings and existing commitments, approximately 90% have been made by existing franchisees that are able, in many cases, to use cash flow generated from their existing restaurants to fund a portion of their expansion costs.
As a result of Dunkin’ Donuts’ franchisee store-level economics and strong brand appeal, we are able to maintain a new restaurant pipeline. During 2010, our franchisees opened 206 net new Dunkin’ Donuts points of distribution in the U.S. Based on the commitments we have secured or expect to secure, we anticipate the opening of approximately 200 to 250 net new points of distribution in the U.S. in 2011. Consistent with our overall points of distribution mix, we expect that approximately 80% of our Dunkin’ Donuts openings in the U.S. will be traditional format restaurants; however, this percentage may be higher or lower in any given year as a result of specific development initiatives or other factors.
We believe our strong store-level economics and our track record of performance through economic cycles has resulted in a diverse and stable franchisee base, with the largest franchisee in the U.S. owning less than 3.5% of the U.S. Dunkin’ Donuts points of distribution and domestic franchisees operating, on average, 5.9 points of distribution in the U.S. Similarly, no Baskin-Robbins franchisee in the U.S. owns more than 1% of the U.S. Baskin-Robbins points of distribution, and domestic franchisees operate, on average, 1.85 points of distribution in the U.S. In addition, we believe the transfer rate of less than 4% per year in each of 2008, 2009 and 2010 for both our Dunkin’ Donuts franchisees and our Baskin-Robbins franchisees reflects the stability of our U.S. franchisee base.
Highly experienced management team
Our senior management team has significant QSR, foodservice and franchise company experience. Prior to joining Dunkin’ Donuts, our CEO Nigel Travis served as the CEO of Papa John’s International Inc. and previously held numerous senior positions at Blockbuster Inc. and Burger King Corporation. John Costello, our Chief Global Marketing & Innovation Officer, joined Dunkin’ Brands in 2009 having previously held leadership roles at The Home Depot, Sears, Yahoo!, Nielsen Marketing Research and Procter & Gamble. Paul Twohig, our Chief Operating Officer, joined Dunkin’ Donuts U.S. in October 2009 having previously held senior positions at Starbucks Corporation and Panera Bread Company. Neal Yanofsky, our new President of International, joined us in May 2011 after holding senior positions at Generation Mobile, Panera Bread Company, Fidelity Ventures and Au Bon Pain. Our CFO Neil Moses joined in November 2010, having previously held numerous senior positions with public companies, including, most recently, CFO of Parametric Technology Corporation.
Our growth strategy
We believe there are significant opportunities to grow our brands globally, further support the profitability of our franchisees, expand our leadership in the coffee, baked goods and ice cream categories of the QSR segment of the restaurant industry and deliver shareholder value by executing on the following strategies:
Increase comparable store sales and profitability in Dunkin’ Donuts U.S.
We intend to continue building on our comparable store sales growth momentum and improve profitability through the following initiatives:
Further increase coffee and beverage sales. Since the late 1980s, we have transformed Dunkin’ Donuts into a coffee-focused brand and have developed a significantly enhanced menu of beverage products, including
- 84 -
Table of Contents
Coolattas®, espressos, iced lattes and flavored coffees. Approximately 60% of U.S. systemwide sales for fiscal 2010 were generated from coffee and other beverages, which we believe generate increased customer visits to our stores and higher unit volumes. We plan to increase our coffee and beverage revenue through continued new product innovations and related marketing, including advertising campaigns such as “America Runs on Dunkin’” and “What are you Drinkin’?”
Beginning in the summer of 2011, Dunkin’ Donuts will offer 14-count boxes of authentic Dunkin’ Donuts coffee in Keurig® K-Cups, the leading single-serve brewing system in the U.S., exclusively at participating Dunkin’ Donuts restaurants across the U.S. Using coffee sourced and roasted to Dunkin’ Donuts’ exacting specifications, Dunkin’ K-Cup portion packs will be available in five popular Dunkin’ Donuts flavors, including Original Blend, Dunkin’ Decaf, French Vanilla, Hazelnut and Dunkin’ Dark®. In addition, participating Dunkin’ Donuts restaurants will, on occasion, offer Keurig Single-Cup Brewers for sale. We believe this alliance is a significant long-term growth opportunity that will generate incremental sales and profits for our Dunkin’ Donuts franchisees.
Extend leadership in breakfast daypart while growing afternoon daypart. As we maintain and expand our current leading market position in the breakfast daypart through innovative bakery and breakfast sandwich products like the Big ‘N Toasty and the Wake-Up Wrap®, we plan to expand Dunkin’ Donuts’ position in the afternoon daypart (between 2:00 p.m. and 5:00 p.m.), which currently represents only approximately 12% of our franchisee-reported sales. We believe that our extensive coffee- and beverage-based menu coupled with new “hearty snack” introductions, such as Bagel Twists, position us to grow share in this daypart. We believe this will require minimal additional capital investment by our franchisees.
Continue to develop enhancements in restaurant operations. We will continue to maintain a highly operations-focused culture to help our franchisees maximize the quality and consistency of their customers’ in-store experience, as well as to increase franchisee profitability. To accomplish this, we have enhanced initial and ongoing restaurant manager and crew training programs and developed new in-store planning and tracking technology tools to assist our franchisees. As evidence of our recent success in these areas, over 162,000 respondents, representing approximately 93% of all respondents, to our Guest Satisfaction Survey program in March 2011 rated their overall experience as “Satisfied” or “Highly Satisfied,” representing an all-time high.
Continue Dunkin’ Donuts U.S. contiguous store expansion
We believe there is a significant opportunity to grow our points of distribution for Dunkin’ Donuts in the U.S. given the strong potential outside of the Northeast region to increase our per-capita penetration to levels closer to those in our core markets. Our development strategy resulted in 206 net new U.S. store openings in fiscal 2010. During fiscal 2011 and fiscal 2012, we expect our franchisees to open approximately 200 to 250 net new points of distribution per year in the U.S., principally in existing developed markets. We believe that our strategy of focusing on contiguous growth has the potential to, over the next 15 to 20 years, more than double our current U.S. footprint and reach a total of 15,000 points of distribution in the U.S. The following table details our per-capita penetration levels in our U.S. regions.
| Region | Population (in millions) | Stores1 | Penetration | |||||||||
| New England and New York |
36.0 | 3,720 | 1:9,700 | |||||||||
| Other Eastern U.S. |
142.5 | 2,943 | 1:48,400 | |||||||||
| Western U.S. |
130.0 | 109 | 1:1,193,000 | |||||||||
| 1 | As of December 25, 2010 |
The key elements of our future domestic development strategy are:
Increase penetration in existing markets. In our traditional core markets of New England and New York, we now have one Dunkin’ Donuts store for every 9,700 people. In the near term, we intend to focus our
- 85 -
Table of Contents
development on other existing markets east of the Mississippi River, where we currently have only approximately one Dunkin’ Donuts store for every 48,400 people. In certain Eastern U.S. markets outside of our core markets, such as Philadelphia, Chicago and South Florida we have already achieved per-capita penetration of greater than one Dunkin’ Donuts store for every 25,000 people.
Expand into new markets using a disciplined approach. We believe that the Western part of the U.S. represents a significant growth opportunity for Dunkin’ Donuts. However, we believe that a disciplined approach to development is the best one for our brand and franchisees. Specifically, in the near term, we intend to focus on development in contiguous markets that are adjacent to our existing base, and generally move outward to less penetrated markets in progression, providing for marketing and supply chain efficiencies within each new market.
Focus on store-level economics. We believe our strong store-level economics have driven unit growth throughout our history. In recent years, we have undertaken significant initiatives to further enhance store-level economics for our franchisees, including reducing the cash investment for new stores, increasing beverage sales, lowering supply chain costs and implementing more efficient store management systems. We believe these initiatives have further increased franchisee profitability. For example, we reduced the upfront capital expenditure costs to open an end-cap restaurant with a drive-thru by approximately 23% between fiscal 2008 and fiscal 2010. Additionally, between fiscal 2008 and the first quarter of fiscal 2011 we believe we have facilitated approximately $220 million in franchisee cost reductions primarily through strategic sourcing, as well as through other initiatives, such as rationalizing the number of product offerings to reduce waste and reducing costs on branded packaging by reducing the color mix in graphics. We will continue to focus on these initiatives to further enhance operating efficiencies.
Drive accelerated international growth of both brands
We believe there is a significant opportunity to grow our points of distribution for both brands in international markets. Our international expansion strategy has resulted in more than 3,100 net new openings in the last 10 years.
The key elements of our future international development strategy are:
Grow in our existing core markets. Our international development strategy for both brands includes growth in our existing core markets. For the Dunkin’ Donuts brand, we intend to focus on growth in South Korea and the Middle East, where we currently have 875 and 204 points of distribution, respectively. For Baskin-Robbins, we intend to focus on Japan, South Korea, and key markets in the Middle East. In 2010, we had the #1 market share positions in the Fast Food Ice Cream category in Japan and South Korea. We intend to leverage our operational infrastructure to grow our existing store base of 2,499 Baskin-Robbins points of distribution in these markets.
Capitalize on other markets with significant growth potential. We intend to expand in certain international focus markets where our brands do not have a significant store presence, but where we believe there is consumer demand for our products as well as strong franchisee partners. During fiscal 2011 and fiscal 2012, we expect our franchisees to open approximately 450 to 500 net new points of distribution per year internationally, principally in our existing markets. However, there can be no assurances that our franchisees will be successful in opening this number of, or any, additional points of distribution. We recently announced an agreement with an experienced QSR franchisee to enter the Indian market with our Dunkin’ Donuts brand. The agreement calls for the development of at least 500 Dunkin’ Donuts restaurants throughout India, the first of which are expected to open by early 2012. By teaming with local operators, we believe we are better able to adapt our brands to local business practices and consumer preferences.
- 86 -
Table of Contents
Further develop our franchisee support infrastructure. We plan to increase our focus on providing our international franchisees with operational tools and services that can help them to efficiently operate in their markets and become more profitable. For each of our brands, we plan to focus on improving our native-language restaurant training programs and updating existing restaurants for our new international retail restaurant designs. To accomplish this, we are dedicating additional resources to our restaurant operations support teams in key geographies in order to assist international franchisees in improving their store-level operations.
Increase comparable store sales growth of Baskin-Robbins U.S.
In the U.S., Baskin-Robbins’ core strengths are its national brand recognition, 65 years of heritage and #1 position in the QSR industry for servings of hard serve ice cream. While the Baskin-Robbins U.S. segment has experienced decreasing comparable store sales in each of the last three years due primarily to increased competition and decreased consumer spending in each year, and the number of Baskin-Robbins U.S. stores has decreased since 2008, we believe that we can capitalize on the brand’s strengths and generate renewed excitement for the brand, including through our recently introduced “More Flavors, More FunTM” marketing campaign. In addition, at the restaurant level, we seek to improve sales by focusing on operational and service improvements as well as by increasing cake and beverage sales through product innovation, marketing and technology.
In August 2010 we hired Bill Mitchell to lead our Baskin-Robbins U.S. operations. Mr. Mitchell currently serves as our Senior Vice President and Brand Officer of Baskin-Robbins U.S., and prior to joining us he served in a variety of management roles over a 10-year period at Papa John’s International, and before that at Popeyes, a division of AFC Enterprises. Since joining Dunkin’ Brands, Mr. Mitchell has led the introduction of technology improvements across the Baskin-Robbins system, which we believe will aid our franchisees in operating their restaurants more efficiently and profitably. Under Mr. Mitchell’s leadership, early Baskin-Robbins U.S. results include comparable store sales growth in the first quarter of fiscal 2011 of 0.5%. Further, over 6,700 respondents, representing approximately 87% of all respondents, to our Guest Satisfaction Survey program in March 2011 rated their overall experience as “Satisfied” or “Extremely Satisfied,” representing an all-time high.
Industry overview
According to Technomic, the QSR segment of the U.S. restaurant industry accounted for approximately $174 billion of the total $361 billion restaurant industry sales in the U.S. in 2010. The U.S. restaurant industry is generally categorized into segments by price point ranges, the types of food and beverages offered and service available to consumers. QSR is a restaurant format characterized by counter or drive-thru ordering and limited or no table service. QSRs generally seek to capitalize on consumer desires for quality and convenient food at economical prices. Technomic reports that, in 2010, QSRs comprised nine of the top ten chain restaurants by U.S. systemwide sales and ten of the top ten chain restaurants by number of units.
Our Dunkin’ Donuts brand competes in the QSR segment categories and subcategories that include coffee, donuts, muffins, bagels and breakfast sandwiches. In addition, in the U.S., our Dunkin’ Donuts brand has historically focused on the breakfast daypart, which we define to include the portion of each day from 5:00 a.m. until 11:00 a.m. While, according to CREST® data, the compound annual growth rate for total QSR daypart visits in the U.S. have been flat or negative over the five-year period ended February 28, 2011, the compound annual growth rate for QSR visits in the U.S. during the breakfast daypart averaged 2.0% over the same five-year period. There can be no assurances that such growth rates will be sustained in the future.
In 2010, there were sales of more than 7.0 billion restaurant servings of coffee in the U.S., 80% of which were attributable to the QSR segment according to CREST® data. Over the years, our Dunkin’ Donuts brand has
- 87 -
Table of Contents
evolved into a predominantly coffee-based concept, with approximately 60% of Dunkin’ Donuts’ U.S. systemwide sales for the fiscal year ended December 25, 2010 generated from coffee and other beverages. We believe QSRs, including Dunkin’ Donuts, are positioned to capture additional coffee market share through an increased focus on coffee offerings.
Our Baskin-Robbins brand competes primarily in QSR segment categories and subcategories that include hard serve ice cream as well as those that include soft serve ice cream, frozen yogurt, shakes, malts and floats. While both of our brands compete internationally, over 60% of Baskin-Robbins restaurants are located outside of the U.S. and represent the majority of our total international sales and points of distribution.
Our brands
Our brands date back to the 1940s when Bill Rosenberg founded his first restaurant, subsequently renamed Dunkin’ Donuts, and Burt Baskin and Irv Robbins each founded a chain of ice cream shops that eventually combined to form Baskin-Robbins. Dunkin’ Donuts and Baskin-Robbins share the same vision of delivering high-quality beverage and food products at a good value through convenient locations.
Dunkin’ Donuts—U.S.
Dunkin’ Donuts is a leading U.S. QSR concept, with leading market positions in each of the coffee, donut, bagel, muffin and breakfast sandwich categories. Since the late 1980s, Dunkin’ Donuts has transformed itself into a coffee and beverage-based concept and is the national leader in hot regular coffee, with sales of over 1 billion servings of coffee. From the fiscal year ended August 31, 2001 to the twelve months ended March 26, 2011 Dunkin’ Donuts U.S. systemwide sales have grown at an 8.6% compound annual growth rate. There can be no assurances that such growth rates will be sustained in the future. Total U.S. Dunkin’ Donuts points of distribution grew from the beginning of that period from 3,583 to 6,799 as of March 26, 2011. Approximately 86% of these points of distribution are traditional restaurants consisting of end-cap, in-line and stand-alone restaurants, many with drive-thrus, and gas and convenience locations. In addition, we have alternative points of distribution (“APODs”), such as full- or self-service kiosks in grocery stores, hospitals, airports, offices and other smaller-footprint properties. We believe that Dunkin’ Donuts continues to have significant growth potential in the U.S. given its strong brand awareness and variety of restaurant formats. For the fiscal year ended December 25, 2010, the Dunkin’ Donuts franchise system generated U.S. franchisee-reported sales of $5.4 billion, which accounted for approximately 70.7% of our global franchisee-reported sales, and had 6,772 U.S. points of distribution (including more than 2,900 restaurants with drive-thrus) at period end.
Baskin-Robbins—U.S.
Baskin-Robbins is the #1 QSR chain in the U.S. for servings of hard serve ice cream and develops and sells a full range of frozen ice cream treats such as cones, cakes, sundaes and frozen beverages. While our Baskin-Robbins U.S. segment has experienced decreasing comparable store sales in each of the last three fiscal years and the number of Baskin-Robbins stores in the U.S. has decreased in each year since 2008, Baskin-Robbins enjoys 95% aided brand awareness in the U.S. and we believe the brand is known for its innovative flavors, popular “Birthday Club” program and ice cream flavor library of over 1,000 different offerings. We believe we can capitalize on the brand’s strengths and generate renewed excitement for the brand. Baskin-Robbins’ “31 flavors”, offering consumers a different flavor for each day of the month, is recognized by ice cream consumers nationwide. For the fiscal year ended December 25, 2010, the Baskin-Robbins franchise system generated U.S. franchisee-reported sales of $494 million, which accounted for approximately 6.5% of our global franchisee-reported sales, and had 2,547 U.S. points of distribution at period end.
- 88 -
Table of Contents
International operations
Our international business is primarily conducted via joint ventures and country or territorial license arrangements with “master franchisees”, who both operate and sub-franchise the brand within their licensed area. Our international franchise system of 6,874 restaurants, predominantly located across Asia and the Middle East, generated systemwide sales of $1.7 billion for the fiscal year ended December 25, 2010, which represented 23% of Dunkin’ Brands’ global systemwide sales. Dunkin’ Donuts had 2,988 restaurants in 30 countries (excluding the U.S.), accounting for $584 million of international systemwide sales for the fiscal year ended December 25, 2010, and Baskin-Robbins had 3,886 restaurants in 46 countries (excluding the U.S.), accounting for approximately $1.2 billion of international systemwide sales for the same period. From August 31, 2000 to March 26, 2011, total international Dunkin’ Donuts points of distribution grew from 1,517 to 3,006 and total international Baskin-Robbins points of distribution grew from 2,109 to 3,959. We believe that we have opportunities to continue to grow our Dunkin’ Donuts and Baskin-Robbins concepts internationally in new and existing markets through brand and menu differentiation.
Overview of franchising
Franchising is a business arrangement whereby a service organization, the franchisor, grants an operator, the franchisee, a license to sell the franchisor’s products and services and use its system and trademarks in a given area, with or without exclusivity. In the context of the restaurant industry, a franchisee pays the franchisor for its concept, strategy, marketing, operating system, training, purchasing power and brand recognition.
Franchisee relationships
One of the ways by which we seek to maximize the alignment of our interests with those of our franchisees is by not deriving additional income through serving as the supplier to our domestic franchisees. In addition because the ability to execute our strategy is dependent upon the strength of our relationships with our franchisees, we maintain a multi-tiered advisory council system to foster an active dialogue with franchisees. The advisory council system provides feedback and input on all major brand initiatives and is a source of timely information on evolving consumer preferences, which assists new product introductions and advertising campaigns.
Unlike certain other QSR franchise systems, we generally do not guarantee our franchisees’ financing obligations. As of March 26, 2011, if all of our outstanding guarantees of franchisee financing obligations came due, we would be liable for $7.7 million. We intend to continue our past practice of limiting our guarantee of financing for franchisees.
Franchise agreement terms
For each franchised restaurant, we enter into a franchise agreement covering a standard set of terms and conditions. A prospective franchisee may elect to open either a single-branded distribution point or a multi-branded distribution point. In addition, and depending upon the market, a franchisee may purchase the right to open a franchised restaurant at one or multiple locations (via a store development agreement, or “SDA”). When granting the right to operate a restaurant to a potential franchisee, we will generally evaluate the potential franchisee’s prior food-service experience, history in managing profit and loss operations, financial history and available capital and financing. We also evaluate potential new franchisees based on financial measures, including (for the smallest restaurant development commitment) a liquid asset minimum of $125,000 for the Baskin-Robbins brand, a liquid asset minimum of $250,000 for the Dunkin’ Donuts brand, a net worth minimum of $250,000 for the Baskin-Robbins brand and a net worth minimum of $500,000 for the Dunkin’ Donuts brand.
- 89 -
Table of Contents
The typical franchise agreement in the U.S. has a 20-year term. The majority of our franchisees have entered into a prime lease with a third-party landlord. When we sublease properties to franchisees, the sublease generally follows the prime lease term structure. Our leases to franchisees are typically structured to provide a ten-year term and two five-year options to renew.
We help domestic franchisees select sites and develop restaurants that conform to the physical specifications of a typical restaurant. Each domestic franchisee is responsible for selecting a site, but must obtain site approval from us based on accessibility, visibility, proximity to other restaurants and targeted demographic factors including population density and traffic patterns. Additionally, the franchisee must also refurbish and remodel each restaurant periodically (typically every five and ten years, respectively).
We currently require each domestic franchisee’s managing owner and designated manager to complete initial and ongoing training programs provided by us, including minimum periods of classroom and on-the-job training. We monitor quality and endeavor to ensure compliance with our standards for restaurant operations through restaurant visits in the U.S. In addition, a formal restaurant review is conducted throughout our domestic operations at least once per year and comprises two separate restaurant visits. To complement these procedures, we use “Guest Satisfaction Surveys” in the U.S. to assess customer satisfaction with restaurant operations, such as product quality, restaurant cleanliness and customer service. Within each of our master franchisee and joint venture organizations, training facilities have been established by the master franchisee or joint venture based on our specifications. From those training facilities, the master franchisee or joint venture trains future staff members of the international restaurants. Our master franchisees and joint venture entities also periodically send their primary training managers to the U.S. for re-certification.
Store development agreements
We grant domestic franchisees the right to open one or more restaurants within a specified geographic area pursuant to the terms of SDAs. An SDA specifies the number of restaurants and the mix of the brands represented by such restaurants that a franchisee is obligated to open. Each SDA also requires the franchisee to meet certain milestones in the development and opening of the restaurant and, if the franchisee meets those obligations, we agree, during the term of such SDA, not to operate or franchise new restaurants in the designated geographic area covered by such SDA. In addition to an SDA, a franchisee signs a separate franchise agreement for each restaurant developed under such SDA.
Master franchise model and international arrangements
Master franchise arrangements are used on a limited basis domestically (the Baskin-Robbins brand has five “territory” franchise agreements for certain Midwestern and Northwestern markets) but more widely internationally for both the Baskin-Robbins brand and the Dunkin’ Donuts brand. In addition, international arrangements include single unit franchises in Canada (both brands), the United Kingdom and Australia (Baskin-Robbins brand) as well as joint venture agreements in Korea (both brands) and Japan (Baskin-Robbins).
Master franchise agreements are the most prevalent international relationships for both brands. Under these agreements, the applicable brand grants the master franchisee the exclusive right to develop and operate a certain number of restaurants within a particular geographic area, such as selected cities, one or more provinces or an entire country, pursuant to a development schedule that defines the number of restaurants that the master franchisee must open annually. Those development schedules customarily extend for five to ten years. If the master franchisee fails to perform its obligations, the exclusivity provision of the agreement terminates and additional franchisee agreements may be put in place to develop restaurants.
- 90 -
Table of Contents
The master franchisee is required to pay an upfront initial franchise fee for each developed restaurant and, for the Dunkin’ Donuts brand, royalties. For the Baskin-Robbins brand, the master franchisee is typically required to purchase ice cream from Baskin-Robbins or an approved supplier. In most countries, the master franchisee is also required to spend a certain percentage of gross sales on advertising in such foreign country in order to promote the brand. Generally, the master franchise agreement serves as the franchise agreement for the underlying restaurants operating pursuant to such model. Depending on the individual agreement, we may permit the master franchisee to subfranchise with its territory.
- 91 -
Table of Contents
Our brands have presence in the following countries:
| Country | Dunkin’ Donuts | Baskin-Robbins | ||
| Aruba |
ü | ü | ||
| Australia |
ü | |||
| Azerbaijan |
ü | |||
| Bahamas |
ü | |||
| Bahrain |
ü | |||
| Bangladesh |
ü | |||
| Bulgaria |
ü | |||
| Canada |
ü | ü | ||
| Cayman Islands |
ü | |||
| Chile |
ü | |||
| China |
ü | ü | ||
| Colombia |
ü | ü | ||
| Curacao |
ü | |||
| Denmark |
ü | |||
| Dominican Republic |
ü | |||
| Ecuador |
ü | ü | ||
| Egypt |
ü | |||
| England |
ü | |||
| Georgia |
ü | |||
| Germany |
ü | |||
| Honduras |
ü | ü | ||
| India |
ü | ü | ||
| Indonesia |
ü | ü | ||
| Jamaica |
ü | |||
| Japan |
ü | |||
| Kazakhstan |
ü | |||
| Korea |
ü | ü | ||
| Kuwait |
ü | ü | ||
| Latvia |
ü | |||
| Lebanon |
ü | ü | ||
| Malaysia |
ü | ü | ||
| Maldives |
ü | |||
| Mauritius |
ü | |||
| Mexico |
ü | |||
| Nepal |
ü | |||
| New Zealand |
ü | |||
| Oman |
ü | ü | ||
| Pakistan |
ü | |||
| Panama |
ü | ü | ||
| Peru |
ü | |||
| Philippines |
ü | |||
| Portugal |
ü | |||
| Qatar |
ü | ü | ||
| Russia |
ü | ü | ||
| Saudi Arabia |
ü | ü | ||
| Scotland |
ü | |||
| Singapore |
ü | ü | ||
| Sri Lanka |
ü | |||
| St. Maarten |
ü | |||
| Spain |
ü | ü | ||
| Taiwan |
ü | ü | ||
| Thailand |
ü | ü | ||
| United Arab Emirates |
ü | ü | ||
| Ukraine |
ü | |||
| United States |
ü | ü | ||
| Wales |
ü | |||
| Yemen |
ü | |||
- 92 -
Table of Contents
Franchise fees
In the U.S., once a franchisee is approved, a restaurant site is approved and a franchise agreement is signed, the franchisee will begin to develop the restaurant. Franchisees pay us an initial franchise fee for the right to operate a restaurant for one or more franchised brands. The franchisee is required to pay all or part of the initial franchise fee upfront upon execution of the franchise agreement, regardless of when the restaurant is actually opened. Initial franchise fees vary by brand, type of development agreement and geographic area of development, but generally range from $10,000 to $90,000, as shown in the table below.
Dunkin’ Brands initial franchise fees as of March 26, 2011
| Restaurant type | Initial franchise fee* |
|||
| Dunkin’ Donuts Single-Branded Restaurant |
$ | 40,000-80,000 | ||
| Baskin-Robbins Single-Branded Restaurant |
$ | 25,000 | ||
| Baskin-Robbins Express Single-Branded Restaurant |
$ | 10,000 | ||
| Dunkin’ Donuts/Baskin-Robbins Multi-Branded Restaurant |
$ | 50,000-90,000 | ||
| * | Excludes alternative points of distribution |
In addition to the payment of initial franchise fees, our U.S. Dunkin’ Donuts brand franchisees and U.S. Baskin-Robbins brand franchisees and our international Dunkin’ Donuts brand franchisees pay us royalties on a percentage of the gross sales made from each restaurant. In the U.S., the majority of our franchise agreement renewals and the vast majority of our new franchise agreements require our franchisees to pay us a royalty of 5.9% of gross sales. During 2010, our effective royalty rate in the Dunkin’ Donuts U.S. segment was approximately 5.4% and in the Baskin-Robbins U.S. segment was approximately 5.1%. The majority of our Dunkin’ Donuts international arrangements require royalty payments to us of 5.0% of gross sales. However, many of our larger international partners and our Korean joint venture partner have agreements at a lower rate, resulting in an effective royalty rate in the Dunkin’ Donuts international segment in 2010 of approximately 2.0%. We typically collect royalty payments on a weekly basis from our domestic franchisees. For the Baskin-Robbins brand in international markets, we do not generally receive royalty payments from our franchisees; instead we receive revenue from such franchisees as a result of our sale of ice cream products to them, and in 2010 our effective royalty rate in this segment was approximately 0.5%. In 2010, we supplemented and modified certain SDAs, and franchise agreements entered into pursuant to such SDAs, for restaurants located in certain new or developing markets, by (i) reducing the royalties for any one or more of the first four years of the term of the franchise agreements depending on the details related to each specific incentive program; (ii) reimbursing the franchisee for certain local marketing activities in excess of the minimum required; and (iii) providing certain development incentives. To qualify for any or all of these incentives, the franchisee must meet certain requirements, each of which are set forth in an addendum to the SDA and the franchise agreement. We believe these incentives will lead to accelerated development in our less mature markets.
Franchisees in the U.S. also pay advertising fees to the brand-specific advertising funds administered by us. Franchisees make weekly contributions, generally 5% of gross sales, to the advertising funds. Franchisees may elect to increase the contribution to support general brand-building efforts or specific initiatives. The advertising funds for the U.S., which received $289.5 million in contributions from franchisees in fiscal 2010, are almost exclusively franchisee-funded and cover all expenses related to marketing, advertising and promotion, including market research, production, advertising costs, public relations and sales promotions. We use no more than 20% of the advertising funds to cover the administrative expenses of the advertising funds and for other strategic initiatives designed to increase sales and to enhance the reputation of the brands. As the
- 93 -
Table of Contents
administrator of the advertising funds, we determine the content and placement of advertising, which is done through print, radio, television, the internet, billboards and other media, all of which is sourced by agencies. Under certain circumstances, franchisees are permitted to conduct their own local advertising, but must obtain our prior approval of content and promotional plans.
Other franchise related fees
We lease and sublease properties to franchisees in the U.S. and in Canada, generating net rental fees when the cost charged to the franchisee exceeds the cost charged to us. For the fiscal year ended December 25, 2010, we generated 15.8%, or $91.1 million, of our total revenue from rental fees from franchisees.
We also receive a license fee from Dean Foods Co. (“Dean Foods”) as part of an arrangement whereby Dean Foods manufactures and distributes ice cream products to Baskin-Robbins franchisees in the U.S. In connection with our Dean Foods Alliance Agreement, Dunkin’ Brands receives a license fee based on total gallons of ice cream sold. For the fiscal year ended December 25, 2010, we generated 1.3%, or $7.6 million, of our total revenue from license fees from Dean Foods.
We manufacture and supply ice cream products to a majority of the Baskin-Robbins franchisees who operate Baskin-Robbins restaurants located in certain foreign countries and receive revenue associated with those sales. For the fiscal year ended December 25, 2010, we generated 14.7%, or $85.0 million, of our total revenue from the sale of ice cream and ice cream products to franchisees in certain foreign countries.
Other revenue sources include income from restaurants owned by us, fees from the e-learning program, licensing fees earned from the sale of retail packaged coffee, net refranchising gains and other one-time fees such as transfer fees and late fees. For the fiscal year ended December 25, 2010, we generated 7.1%, or $41.1 million, of our total revenue from these other sources.
International operations
Our international business is organized by brand and by country and/or region. Operations are primarily conducted through master franchise agreements with local operators. In certain instances, the master franchisee may have the right to sub-franchise. In addition, in Japan and South Korea we have joint ventures with local companies for the Baskin-Robbins brand, and in the case of South Korea, for the Dunkin’ Donuts brand as well. By teaming with local operators, we believe we are better able to adapt our concepts to local business practices and consumer preferences. We have had an international presence since 1961 when the first Dunkin’ Donuts restaurant opened in Canada. As of March 26, 2011, there were 3,959 Baskin-Robbins restaurants in 46 countries outside the U.S. and 3,006 Dunkin’ Donuts restaurants in 30 countries outside the U.S. Baskin-Robbins points of distribution represent the majority of our international presence and accounted for 67% of international franchisee reported sales and 87% of our international revenues for the fiscal year ended December 25, 2010.
Our key markets for both brands are predominantly based in Asia and the Middle East, which accounted for approximately 72.1% and 14.0%, respectively, of international franchisee-reported sales for the same period. For the fiscal year ended December 25, 2010, $1.7 billion of total franchisee-reported sales was generated by restaurants located in international markets, which represented 23% of total franchisee-reported sales, with the Dunkin’ Donuts brand accounting for $584 million and the Baskin-Robbins brand accounting for $1.2 billion of our international franchisee-reported sales. For the same period, our revenues from international operations totaled $105.4 million, with the Baskin-Robbins brand generating approximately 87% of such revenues.
- 94 -
Table of Contents
Overview of key markets
As of March 26, 2011, the top foreign countries and regions in which the Dunkin’ Donuts brand and/or the Baskin-Robbins brand operated were:
| Country | Type | Franchised brand(s) | Number of restaurants | |||||
| South Korea |
Joint Venture | Dunkin’ Donuts | 875 | |||||
| Baskin-Robbins | 927 | |||||||
| Japan |
Joint Venture | Baskin-Robbins | 1,052 | |||||
| Middle East |
Master Franchise Agreements | Dunkin’ Donuts | 204 | |||||
| Baskin-Robbins | 520 | |||||||
South Korea
Restaurants in South Korea accounted for approximately 37% of total franchisee-reported sales from international operations for the fiscal year ended December 25, 2010. Baskin-Robbins accounted for 55% of such sales. In South Korea, we conduct business through a 33.3% ownership stake in a combination Dunkin’ Donuts brand/Baskin-Robbins brand joint venture, with South Korean shareholders owning the remaining 66.7% of the joint venture. The joint venture acts as the master franchisee for South Korea, sub-franchising the Dunkin’ Donuts and Baskin-Robbins brands to franchisees. There are 927 Baskin-Robbins restaurants and 875 Dunkin’ Donuts restaurants as of March 26, 2011. The joint venture also manufactures and supplies the Baskin-Robbins franchisees operating restaurants located in South Korea with ice cream products.
Japan
Restaurants in Japan accounted for approximately 26% of total franchisee-reported sales from international operations for the fiscal year ended December 25, 2010, 100% of which came from Baskin-Robbins. We conduct business in Japan through a 43.3% ownership stake in a Baskin-Robbins brand joint venture. Fujiya Co. Ltd. also owns a 43.3% interest in the joint venture, with the remaining 13.4% owned by public shareholders. There were 1,052 Baskin-Robbins restaurants located in Japan as of March 26, 2011, with the joint venture manufacturing and selling ice cream to franchisees operating restaurants in Japan and acting as master franchisee for the country.
Middle East
The Middle East represents another key region for us. Restaurants in the Middle East accounted for approximately 14.0% of total franchisee-reported sales from international operations for the fiscal year ended December 25, 2010. Baskin-Robbins accounted for approximately 80% of such sales. We conduct operations in the Middle East through master franchise arrangements.
Competition
We compete primarily in the QSR segment of the restaurant industry and face significant competition from a wide variety of restaurants, convenience stores and other outlets that provide consumers with coffee, baked goods, sandwiches and ice cream on an international, national, regional and local level. We believe that we compete based on, among other things, product quality, restaurant concept, service, convenience, value perception and price. Our competition continues to intensify as competitors increase the breadth and depth of their product offerings, particularly during the breakfast daypart, and open new units. Although new
- 95 -
Table of Contents
competitors may emerge at any time due to the low barriers to entry, our competitors include: 7-Eleven, Burger King, Cold Stone Creamery, Dairy Queen, McDonald’s, Quick Trip, Starbucks, Subway, Tim Hortons, WaWa and Wendy’s, among others. Additionally, we compete with QSRs, specialty restaurants and other retail concepts for prime restaurant locations and qualified franchisees.
Licensing
We derive licensing revenue from agreements with Dean Foods for domestic ice cream sales, with The J.M. Smucker Co. (“Smuckers”) for the sale of packaged coffee in non-franchised outlets (primarily grocery retail) as well as from other licensees. Dean Foods manufactures and sells ice cream to U.S. Baskin-Robbins brand franchisees and pays us a royalty on each gallon sold. The Dunkin’ Donuts branded 12 oz. original blend coffee, which is distributed by Smuckers, is the #1 stock-keeping unit nationally in the premium coffee category for 12 oz. original blend coffee. According to Nielsen, for the 52 weeks ending December 31, 2010, sales of our 12 oz. original blend, as expressed in total equivalent units, were double that of the next closest competitor.
Marketing
We coordinate domestic advertising and marketing at the national and local levels. The goals of our marketing strategy include driving comparable store sales and brand differentiation, protecting and growing our morning daypart sales, growing our afternoon daypart sales and increasing our total coffee and beverage sales. Generally, our domestic franchisees contribute 5% of weekly gross retail sales to fund brand specific advertising funds. The funds are used for various national and local advertising campaigns including television, radio, print, online and sponsorships. Over the past ten years, our U.S. franchisees have invested approximately $1.9 billion on advertising to increase brand awareness and restaurant performance across both brands. Additionally, we have various pricing strategies, so that our products appeal to a broad range of customers.
The supply chain
Domestic
We do not typically supply products to our domestic franchisees. With the exception of licensing fees paid by Dean Foods on domestic ice cream sales, we do not typically derive revenues from product distribution. Our franchisees’ suppliers include Rich Products Corp., Dean Foods Co., PepsiCo, Inc. and Silver Pail Dairy, Ltd. In addition, our franchisees’ primary coffee roasters currently are New England Tea & Coffee Co., Inc., Mother Parkers Tea & Coffee Inc., S&D Coffee, Inc. and Sara Lee Corporation, and their primary donut mix suppliers currently are General Mills, Inc. and Otis Spunkmeyer, Inc. Our franchisees also purchase coffee from Massimo Zanetti Beverage USA, Inc. and donut mix from CSM Bakery Products NA, Inc., Custom Blends and EFCO Products, Inc. We periodically review our relationships with licensees and approved suppliers and evaluate whether those relationships continue to be on competitive or advantageous terms for us and our franchisees.
Purchasing
Purchasing for the Dunkin’ Donuts brand is facilitated by National DCP, LLC (the “NDCP”), which is a Delaware limited liability company owned by four franchisee-owned regional distribution centers. Each of the four members operates as a cooperative owned by their franchisee members. The NDCP is managed by a staff of supply chain professionals who report directly to the NDCP’s Executive Management Team, members of which in turn report directly to the NDCP’s Board of Directors. The NDCP and the regional DCPs have over 1,000 employees including executive leadership, sourcing professionals, warehouse staff, and drivers. The NDCP Board has three franchisee members and an alternate from each Regional Board. In addition, the Vice President
- 96 -
Table of Contents
of Supply & Manufacturing from Dunkin’ Brands, Inc. is a non-voting member of the NDCP board. The NDCP engages in purchasing, warehousing and distribution of food and supplies on behalf of participating restaurants and some international markets. The NDCP program provides franchisee members nationwide the benefits of scale while fostering consistent product quality across the Dunkin’ Donuts brand. We do not control the NDCP and have only limited contractual rights associated with supplier certification, quality assurance and protection of our intellectual property.
Manufacturing of Dunkin’ Donuts bakery goods
Centralized production is another element of our supply chain that is designed to support growth for the Dunkin’ Donuts brand. Centralized Manufacturing Locations (CMLs) are franchisee owned and operated facilities for the centralized production of donuts and bakery goods. The CMLs deliver freshly baked products to Dunkin’ Donuts restaurants on a daily basis and are designed to provide consistent quality products while simplifying restaurant level operations. As of March 26, 2011, there were 103 CMLs (of varying size and capacity) in the U.S. CMLs are an important part of franchise economics and we believe the brand is supportive of profit building initiatives as well as protecting brand quality standards and consistency.
Certain of our Dunkin’ Donuts brand restaurants produce donuts and bakery goods on-site rather than relying upon CMLs. Many of such restaurants, known as full producers, also supply other local Dunkin’ Donuts restaurants that do not have access to CMLs. In addition, in newer markets, Dunkin’ Donuts brand restaurants rely on donuts and bakery goods that are finished in restaurants. We believe that this “just baked on demand” donut manufacturing platform enables the Dunkin’ Donuts brand to more efficiently expand its restaurant base in newer markets where franchisees may not have access to a CML.
Baskin-Robbins ice cream
Prior to 2000, we manufactured and sold ice cream products to substantially all of our Baskin-Robbins brand franchisees. Beginning in 2000, we made the strategic decision to outsource the manufacturing and distribution of ice cream products for the domestic Baskin-Robbins brand franchisees to Dean Foods. The transition to this outsourcing arrangement was completed in 2003. We believe that this outsourcing arrangement was an important strategic shift and served the dual purpose of further strengthening our relationships with franchisees and allowing us to focus on our core franchising operations.
International
Dunkin’ Donuts
International Dunkin’ Donuts franchisees are responsible for sourcing their own supplies, subject to compliance with our standards. They also produce their own donuts following the Dunkin’ Donuts brand’s approved processes. In certain countries, our international franchisees source virtually everything locally within their market while in others our international franchisees may source virtually everything from the NDCP. Where supplies are sourced locally, we help identify and approve those suppliers. Supplies that cannot be sourced locally are sourced through the NDCP. In addition, we assist our international franchisees in identifying regional and global suppliers with the goal of leveraging the purchasing volume for pricing and product continuity advantages.
Baskin-Robbins
The Baskin-Robbins global manufacturing network is comprised of 15 facilities (one of which, the Peterborough Facility, is owned and operated by us). These facilities supply both our international and our domestic markets with ice cream products. The Peterborough Facility serves many of our international markets, including the Middle East, Australia, China, Southeast Asia and Latin America. Certain international franchisees rely on third
- 97 -
Table of Contents
party owned facilities to supply ice cream and ice cream products to them, including a facility near Cork, Ireland, which supplies restaurants in Europe and the Middle East. The Baskin-Robbins brand restaurants in India and Russia are supported by master franchisee-owned facilities in those respective countries while the restaurants in Japan and South Korea are supported by the joint venture owned facilities located within each country.
Research and development
New product innovation is a critical component of our success. We believe the development of successful new products for both Brands attracts new customers, increases comparable store sales and allows franchisees to expand into other dayparts. New product research and development is located in a state-of-the-art facility at our headquarters in Canton, Massachusetts. The facility includes a sensory lab, a quality assurance lab and a demonstration test kitchen. We rely on our internal culinary team, which uses consumer research, to develop and test new products.
Operational support
Substantially all of our executive management, finance, marketing, legal, technology, human resources and operations support functions are conducted from our global headquarters in Canton, Massachusetts. In the U.S. and Canada, our franchise operations for both brands are organized into regions, each of which is headed by a regional vice president and directors of operations supported by field personnel who interact directly with the franchisees. Our international businesses, excluding Canada, are organized by brand, and each brand has dedicated marketing and restaurant operations support teams. These teams, which are organized by geographic regions, work with our master licensees and joint venture partners to improve restaurant operations and restaurant-level economics. Management of a franchise restaurant is the responsibility of the franchisee, who is trained in our techniques and is responsible for ensuring that the day-to-day operations of the restaurant are in compliance with our operating standards. We have implemented a computer-based disaster recovery program to address the possibility that a natural (or other form of) disaster may impact the IT systems located at our Canton, Massachusetts headquarters.
Regulatory matters
Domestic
We and our franchisees are subject to various federal, state and local laws affecting the operation of our respective businesses, including various health, sanitation, fire and safety standards. In some jurisdictions our restaurants are required by law to display nutritional information about our products. Each restaurant is subject to licensing and regulation by a number of governmental authorities, which include zoning, health, safety, sanitation, building and fire agencies in the jurisdiction in which the restaurant is located. Franchisee-owned NDCP and CMLs are licensed and subject to similar regulations by federal, state and local governments.
We and our franchisees are also subject to the Fair Labor Standards Act and various other laws governing such matters as minimum wage requirements, overtime and other working conditions and citizenship requirements. A significant number of food-service personnel employed by franchisees are paid at rates related to the federal minimum wage.
Our franchising activities are subject to the rules and regulations of the Federal Trade Commission (“FTC”) and various state laws regulating the offer and sale of franchises. The FTC’s franchise rule and various state laws require that we furnish a franchise disclosure document (“FDD”) containing certain information to prospective franchisees and a number of states require registration of the FDD with state authorities. We are operating under exemptions from registration in several states based on our experience and aggregate net worth. Substantive state laws that regulate the franchisor-franchisee relationship exist in a substantial number of
- 98 -
Table of Contents
states, and bills have been introduced in Congress from time to time that would provide for federal regulation of the franchisor-franchisee relationship. The state laws often limit, among other things, the duration and scope of non-competition provisions, the ability of a franchisor to terminate or refuse to renew a franchise and the ability of a franchisor to designate sources of supply. We believe that our FDDs for each of our Dunkin’ Donuts brand and our Baskin-Robbins brand together with any applicable state versions or supplements, and franchising procedures comply in all material respects with both the FTC franchise rule and all applicable state laws regulating franchising in those states in which we have offered franchises.
International
Internationally, we and our franchisees are subject to national and local laws and regulations that often are similar to those affecting us and our franchisees in the U.S., including laws and regulations concerning franchises, labor, health, sanitation and safety. International Baskin-Robbins brand and Dunkin’ Donuts brand restaurants are also often subject to tariffs and regulations on imported commodities and equipment, and laws regulating foreign investment. We believe that the international disclosure statements, franchise offering documents and franchising procedures for our Baskin-Robbins brand and Dunkin’ Donuts brand comply in all material respects with the laws of the applicable countries.
Environmental
Our operations, including the selection and development of the properties we lease and sublease to our franchisees and any construction or improvements we make at those locations, are subject to a variety of federal, state and local laws and regulations, including environmental, zoning and land use requirements. Our properties are sometimes located in developed commercial or industrial areas, and might previously have been occupied by more environmentally significant operations, such as gasoline stations and dry cleaners. Environmental laws sometimes require owners or operators of contaminated property to remediate that property, regardless of fault. While we have been required to, and are continuing to, clean up contamination at a limited number of our locations, we have no known material environmental liabilities.
Employees
As of March 26, 2011, we employed 1,075 people, 995 of whom were based in the U.S. and 80 of whom were based in other countries. Of our domestic employees, 414 worked in the field and 581 worked at our corporate headquarters or our satellite office in California. 153 employees, who are almost exclusively in marketing positions, were paid by certain of our advertising funds. In addition, our Peterborough Facility employed 55 full-time employees as of March 26, 2011. Other than the 28 employees in our Peterborough Facility, who are represented by the National Automobile, Aerospace, Transportation & General Workers Union of Canada, Local 462, none of our employees is represented by a labor union, and we believe our relationships with our employees are healthy.
Our franchisees are independent business owners, so they and their employees are not included in our employee count.
Properties
Our corporate headquarters, located in Canton, Massachusetts, houses substantially all of our executive management and employees who provide our primary corporate support functions: legal, marketing, technology, human resources, financial and research and development.
Our Peterborough Facility manufactures ice cream products for sale in certain international markets.
- 99 -
Table of Contents
As of March 26, 2011, we owned 95 properties and leased 977 locations across the U.S. and Canada, a majority of which we leased or subleased to franchisees. For the fiscal year ended December 25, 2010, we generated 15.8%, or $91.1 million, of our total revenue from rental fees from franchisees who lease or sublease their properties from us.
The remaining balance of restaurants selling our products are situated on real property owned by franchisees or leased directly by franchisees from third-party landlords. All international restaurants (other than 20 located in Canada) are owned by licensees and their sub-franchisees or leased by licensees and their sub-franchisees directly from a third-party landlord.
Nearly 100% of Dunkin’ Donuts and Baskin-Robbins restaurants are owned and operated by franchisees. We have construction and site management personnel who oversee the construction of restaurants by outside contractors. The restaurants are built to our specifications as to exterior style and interior decor. As of March 26, 2011, the number of Dunkin’ Donuts restaurants totaled 9,805, operating in 36 states and the District of Columbia in the U.S. and 31 foreign countries. Baskin-Robbins restaurants totaled 6,482, operating in 45 states and the District of Columbia in the U.S. and 46 foreign countries. All but 17 of the Dunkin’ Donuts and Baskin-Robbins restaurants were franchisee-operated. The following table illustrates restaurant locations by brand and whether they are operated by the Company or our franchisees.
| Franchisee-owned restaurants | Company-owned restaurants | |||||||
| Dunkin’ Donuts—US* |
6,783 | 16 | ||||||
| Dunkin’ Donuts—International |
3,006 | 0 | ||||||
| Total Dunkin’ Donuts* |
9,789 | 16 | ||||||
| Baskin-Robbins—US* |
2,522 | 1 | ||||||
| Baskin-Robbins—International |
3,959 | 0 | ||||||
| Total Baskin-Robbins* |
6,481 | 1 | ||||||
| Total US |
9,305 | 17 | ||||||
| Total International |
6,965 | 0 | ||||||
| * | Combination restaurants, as more fully described below, count as both a Dunkin’ Donuts and a Baskin-Robbins restaurant. |
Dunkin’ Donuts and Baskin-Robbins restaurants operate in a variety of formats. Dunkin’ Donuts traditional restaurant formats include free standing restaurants, end-caps (i.e., end location of a larger multi-store building) and gas and convenience locations. A free-standing building typically ranges in size from 1,200 to 2,500 square feet, and may include a drive-thru window. An end-cap typically ranges in size from 1,000 to 2,000 square feet and may include a drive-thru window. Dunkin’ Donuts also has other restaurants designed to fit anywhere, consisting of small full-service restaurants and/or self-serve kiosks in offices, hospitals, colleges, airports, grocery stores and drive-thru-only units on smaller pieces of property (collectively referred to as alternative points of distributions or APODs). APODs typically range in size between 400 to 1,800 square feet. The majority of our Dunkin’ Donuts restaurants have their fresh baked goods delivered to them from franchisee owned and operated CMLs. Approximately 1,000 Dunkin’ Donuts restaurants may have bakery production facilities on site.
Baskin-Robbins traditional restaurant formats include free standing restaurants and end-caps. A free-standing building typically ranges in size from 600 to 1,200 square feet, and may include a drive-thru window. An end-cap typically ranges in size from 800 to 1,800 square feet and may include a drive-thru window. We also have other restaurants, consisting of small full-service restaurants and/or self-serve kiosks (collectively referred to as alternative points of distributions or APODs). APODs typically range in size between 400 to 1,000 square feet.
- 100 -
Table of Contents
In the U.S., Baskin-Robbins can also be found in 1,177 combination restaurants (combos) that also include a Dunkin’ Donuts restaurant in either a free-standing or end-cap. These combos, which we count as both a Dunkin’ Donuts and a Baskin-Robbins point of distribution, typically range from 1,400 to 3,500 square feet.
Of the 9,305 U.S. franchised restaurants, 89 were sites owned by the Company and leased to franchisees, 933 were leased by us, and in turn, subleased to franchisees, with the remainder either owned or leased directly by the franchisee. Our land or land and building leases are generally for terms of 10 to 20 years, and often have one or more five-year or ten-year renewal options. In certain lease agreements, we have the option to purchase or right of first refusal to purchase the real estate. Certain leases require the payment of additional rent equal to a percentage (ranging from 2.0% to 13.5%) of annual sales in excess of specified amounts.
Of the sites owned or leased by the Company in the U.S., 34 are locations that no longer have a Dunkin’ Donuts or Baskin-Robbins restaurant (surplus properties). Some of these surplus properties have been sublet to other parties while the remaining are currently vacant.
We have 16 leased franchised restaurant properties and 4 surplus leased properties in Canada. We also have leased office space in Australia, China, Spain and the United Kingdom.
The following table sets forth the Company’s owned and leased office, warehouse, manufacturing and distribution facilities, including the approximate square footage of each facility. None of these owned properties, or the Company’s leasehold interest in leased property, is encumbered by a mortgage.
| Location | Type | Owned/Leased | Approximate Sq. Ft. | |||||
| Peterborough, Ontario, Canada (ice cream facility) |
Manufacturing | Owned | 52,000 | |||||
| Canton, MA |
Office | Leased | 175,000 | |||||
| Braintree, MA (training facility) |
Office | Owned | 15,000 | |||||
| Burbank, CA (training facility) |
Office | Leased | 19,000 | |||||
| Various (regional sales offices) |
Office | Leased | Range of 150 to 300 | |||||
Legal proceedings
We are engaged in several matters of litigation arising in the ordinary course of our business as a franchisor. Such matters include disputes related to compliance with the terms of franchise and development agreements, including claims or threats of claims of breach of contract, negligence, and other alleged violations by us. At March 26, 2011 and December 25, 2010, contingent liabilities totaling $4.3 million and $4.2 million, respectively, were included in other current liabilities in the consolidated balance sheets to reflect our estimate of the potential loss which may be incurred in connection with these matters. While we intend to vigorously defend our positions against all claims in these lawsuits and disputes, it is reasonably possible that the losses in connection with these matters could increase by up to an additional $8.0 million based on the outcome of ongoing litigation or negotiations.
Intellectual property
We own many registered trademarks and service marks (“Marks”) in the U.S. and in other countries throughout the world, including Japan, Canada and South Korea. We believe that our Dunkin’ Donuts and Baskin-Robbins names and logos, in particular, have significant value and are important to our business. Our policy is to pursue registration of our Marks in the U.S. and selected international jurisdictions, monitor our Marks portfolio both internally and externally through external search agents and vigorously oppose the infringement of any of our Marks. We license the use of our registered Marks to franchisees and third parties through franchise arrangements and licenses. The franchise and license arrangements restrict franchisees’ and licensees’
- 101 -
Table of Contents
activities with respect to the use of our Marks, and impose quality control standards in connection with goods and services offered in connection with the Marks and an affirmative obligation on the franchisees to notify us upon learning of potential infringement. In addition, we maintain a limited patent portfolio in the U.S. for bakery and serving-related methods, designs and articles of manufacture. We generally rely on common law protection for our copyrighted works. Neither the patents nor the copyrighted works are material to the operation of our business. We also license some intellectual property from third parties for use in certain of our products. Such licenses are not individually, or in the aggregate, material to our business.
- 102 -
Table of Contents
Below is a list of the names, ages as of June 5, 2011, and positions, and a brief account of the business experience, of the individuals who serve as our executive officers and directors as of the date of this prospectus.
| Name | Age | Position | ||
| Nigel Travis |
61 | Chief Executive Officer, Dunkin’ Brands and President, Dunkin’ Donuts and Director | ||
| Neil Moses |
52 | Chief Financial Officer | ||
| Paul Carbone |
45 | Vice President, Financial Management | ||
| John Costello |
64 | Chief Global Marketing & Innovation Officer | ||
| John Dawson |
47 | Chief Development Officer | ||
| Christine Deputy |
45 | Senior Vice President, Chief Human Resources Officer | ||
| Richard Emmett |
55 | Senior Vice President and General Counsel | ||
| Srinivas Kumar |
48 | President and Chief Operating Officer, Baskin-Robbins International | ||
| Bill Mitchell |
45 | Senior Vice President and Brand Officer, Baskin-Robbins U.S. | ||
| Tony Pavese |
52 | Chief Operating Officer, Dunkin’ Donuts International | ||
| Karen Raskopf |
56 | Senior Vice President, Chief Communications Officer | ||
| Daniel Sheehan |
48 | Senior Vice President, Chief Information Officer | ||
| Paul Twohig |
57 | Chief Operating Officer, Dunkin’ Donuts U.S. | ||
| Neal Yanofsky |
54 | President-International, Dunkin’ Brands | ||
| Jon Luther |
67 | Non-executive Chairman of the Board | ||
| Todd Abbrecht |
42 | Director | ||
| Anita Balaji |
33 | Director | ||
| Andrew Balson |
44 | Director | ||
| Anthony DiNovi |
48 | Director | ||
| Sandra Horbach |
50 | Director | ||
| Mark Nunnelly |
51 | Director | ||
We anticipate that at least one additional director who is not affiliated with us or any of our stockholders will be appointed to the board of directors prior to the consummation of this offering, and additional directors who are not affiliated with us or any of our stockholders will be appointed to the board of directors within twelve months of the closing of this offering resulting in a board that includes at least three independent directors.
Nigel Travis has served as Chief Executive Officer of Dunkin’ Brands since January 2009 and assumed the role of President of Dunkin’ Donuts in October 2009. From 2005 through 2008, Mr. Travis served as President and Chief Executive Officer, and on the board of directors of Papa John’s International, Inc., a publicly-traded
- 103 -
Table of Contents
international pizza chain. Prior to Papa John’s, Mr. Travis was with Blockbuster, Inc. from 1994 to 2004, where he served in increasing roles of responsibility, including President and Chief Operating Officer. Mr. Travis previously held numerous senior positions at Burger King Corporation. Mr. Travis currently serves on the board of directors of Lorillard, Inc. and formerly served on the board of Bombay Company, Inc. As our Chief Executive Officer, Mr. Travis brings a deep understanding of the Company, as well as domestic and international experience with franchised businesses in the QSR and retail industries, to the board.
Neil Moses joined Dunkin’ Brands as Chief Financial Officer in November 2010. Mr. Moses joined Dunkin’ Brands from Parametric Technology Corporation (PTC), a software company, where he had served as Executive Vice President, Chief Financial Officer since 2003. Prior to PTC, he served as Executive Vice President, Chief Financial Officer, at Axcelis Technologies, a semiconductor capital equipment manufacturer, and as Senior Vice President, Chief Financial Officer of Bradlees, Inc.
Paul Carbone was appointed to the role of Vice President, Financial Management of Dunkin’ Brands in 2008. Prior to joining Dunkin’ Brands, he most recently served as Senior Vice President and Chief Financial Officer for Tween Brands, Inc. Before Tween Brands, Mr. Carbone spent seven years with Limited Brands, Inc., where his roles included Vice President, Finance, for Victoria’s Secret.
John Costello joined Dunkin’ Brands in 2009 and currently serves as our Chief Global Marketing & Innovation Officer. Prior to joining Dunkin’ Brands, Mr. Costello was an independent consultant and served as President and CEO of Zounds, Inc., an early stage developer and hearing aid retailer, from September 2007 to January 2009. Following his departure, Zounds filed for bankruptcy in March 2009. From October 2006 to August 2007, he served as President of Consumer and Retail for Solidus Networks, Inc. (d/b/a Pay By Touch), which filed for bankruptcy in March 2008. Mr. Costello previously served as the Executive Vice President of Merchandising and Marketing at The Home Depot, Senior Executive Vice President of Sears, and Chief Global Marketing Officer of Yahoo!. He has also held leadership roles at several companies, including serving as President of Nielsen Marketing Research U.S.
John Dawson has served as Chief Development Officer of Dunkin’ Brands since April 2005. Prior to joining Dunkin’ Brands, he spent 17 years at McDonald’s Corporation, most recently as Vice President of Worldwide Restaurant Development.
Christine Deputy joined Dunkin’ Brands in 2009 and currently serves as Senior Vice President and Chief Human Resources Officer. Previously, she served as Vice President, Partner Resources, Asia Pacific Region for Starbucks Corporation. Prior to Starbucks, Ms. Deputy spent eight years with Thomas Cook based in Canada, the U.S. and England. Ms. Deputy currently serves on the board of directors of McCormick and Schmick’s Seafood Restaurants, Inc.
Richard Emmett was named Senior Vice President and General Counsel in December 2009. Mr. Emmett joined Dunkin’ Brands from QCE HOLDING LLC (Quiznos) where he served as Executive Vice President, Chief Legal Officer and Secretary. Prior to Quiznos, Mr. Emmett served in various roles including as Senior Vice President, General Counsel and Secretary for Papa John’s International. Mr. Emmett currently serves on the board of directors of Francesca’s Holdings Corporation.
Srinivas Kumar joined Dunkin’ Brands in 1998 and was appointed to the position of President and Chief Operating Officer of Baskin-Robbins International, in August 2010. He previously served in various roles for Dunkin’ Brands, including Vice President of the Middle East, Vice President of Europe and Middle East, Interim Chief Operating Officer, Vice President International and Chief Brand Officer, Baskin-Robbins International. Prior to joining Dunkin’ Brands, Mr. Kumar was General Manager for the Galadari Group—the master licensee for Baskin-Robbins.
- 104 -
Table of Contents
Bill Mitchell joined Dunkin’ Brands in August 2010. Mr. Mitchell joined Dunkin’ Brands from Papa John’s International, where he had served in a variety of roles since 2000, including President of Global Operations, President of Domestic Operations, Operations VP, Division VP and Senior VP of Domestic Operations. Prior to Papa John’s, Mr. Mitchell was with Popeyes, a division of AFC Enterprises where he served in various capacities including Senior Director of Franchise Operations.
Tony Pavese was appointed Chief Operating Officer of Dunkin’ Donuts International in January 2008. Mr. Pavese joined Dunkin’ Brands in 2004 as Vice President of International Asia-Pacific for Baskin-Robbins and Dunkin’ Donuts. Prior to joining Dunkin’ Brands, he spent 20 years with AFC Enterprises, which culminated in his serving as Chief Operating Officer for Popeyes. Mr. Pavese also served as Vice-President of Operations for Black Angus Steak House.
Karen Raskopf joined Dunkin’ Brands in 2009 and currently serves as Senior Vice President and Chief Communications Officer. Prior to joining Dunkin’ Brands, she spent 12 years as Senior Vice President, Corporate Communications for Blockbuster, Inc. She also served as head of communications for 7-Eleven, Inc.
Dan Sheehan was named Senior Vice President and Chief Information Officer of Dunkin’ Brands in March 2006. Prior to joining Dunkin’ Brands, Mr. Sheehan served as Senior Vice President and Chief Information Officer for ADVO Inc., a full-service direct mail marketing services company, from 2000 to 2006.
Paul Twohig joined Dunkin’ Donuts U.S. in October 2009 and currently serves as Chief Operating Officer. Prior to joining Dunkin’ Brands, Mr. Twohig served as a Division Senior Vice President for Starbucks Corporation from December 2004 to March 2009. Mr. Twohig also previously served as Chief Operating Officer for Panera Bread Company.
Neal Yanofsky was appointed President-International of Dunkin’ Brands in May 2011. Prior to joining Dunkin’ Brands, Mr. Yanofsky served as the Chief Executive Officer of Generation Mobile, a retailer of wireless products and services. From 2003 through 2008, Mr. Yanofsky was with Panera Bread Company, culminating in his service as President of Panera Bread from 2006 through 2008. Mr. Yanofsky also previously served as the senior marketing officer for Au Bon Pain.
Jon Luther has served as non-executive Chairman of the Board since July 2010 and prior to that as Chairman from January 2009. He previously served as Chief Executive Officer of Dunkin’ Brands from January 2003 to March 2006 and was appointed to the additional role of Chairman in March 2006. Prior to joining Dunkin’ Brands, Mr. Luther was President of Popeyes, a division of AFC Enterprises, from February 1997 to December 2002. Prior to Popeyes, Mr. Luther was President of CA One Services, a subsidiary of Delaware North Companies, Inc. Mr. Luther is also a director of Six Flags Entertainment Corporation and Wingstop Restaurants, Inc. and a director-elect of Brinker International, Inc. As our current non-executive Chairman of the Board and our former Chief Executive Officer, Mr. Luther brings unique current and historical perspective and insights into our operations to our board of directors.
Todd Abbrecht is a Managing Director at Thomas H. Lee Partners, L.P. Prior to joining Thomas H. Lee Partners, L.P. in 1992, Mr. Abbrecht worked in the Mergers and Acquisitions department of Credit Suisse First Boston. Mr. Abbrecht is currently a Director of Aramark Corporation, Intermedix Corporation, inVentiv Health, Inc., and Warner Chilcott plc. Mr. Abbrecht has also served on the boards of Michael Foods, Inc. and Simmons Bedding Company. Mr. Abbrecht brings significant experience and financial literacy to the Board, having served as a director of several public and private corporations, including prior service on the board of the Company, and as an executive of Thomas H. Lee Partners, L.P., a private equity investment firm. This experience dealing with strategic, financial and operating issues in various companies, and the financial literacy developed therefrom, contributed to the board’s conclusion that Mr. Abbrecht should serve as a director of the Company.
Anita Balaji is a Vice President at The Carlyle Group, where she focuses on buyout opportunities in the consumer and retail sector. Prior to joining Carlyle in 2006, Ms. Balaji worked at Behrman Capital, a private equity firm
- 105 -
Table of Contents
based in New York. Previously, she was with the mergers and acquisitions group at Goldman, Sachs & Co., focusing on consumer and retail transactions. Ms. Balaji has broad experience in transactions in the consumer and retail industries.
Andrew Balson is a Managing Director at Bain Capital Partners, LLC. Prior to joining Bain Capital Partners, LLC in 1996, Mr. Balson was a consultant at Bain & Company, where he worked in the technology, telecommunications, financial services and consumer goods industries. Previously, Mr. Balson worked in the Merchant Banking Group at Morgan Stanley & Co. and in the leveraged buyout group at SBC Australia. Mr. Balson serves on the Boards of Directors of OSI Restaurant Partners, LLC, Fleetcor Technologies, Inc. and Domino’s Pizza Inc. as well as a number of other private companies. Mr. Balson formerly served on the board of Burger King Holdings, Inc. Mr. Balson has extensive experience as a director on the board of directors of public companies, including companies in the quick service restaurant business, and brings strong strategic management and planning skills to the board.
Anthony DiNovi is the Co-President of Thomas H. Lee Partners, L.P. Prior to joining Thomas H. Lee Partners, L.P. in 1988, Mr. DiNovi was in the corporate finance departments of Goldman, Sachs & Co. and Wertheim Schroder & Co., Inc. Mr. DiNovi is a member of the board of directors of West Corporation, and formerly served on the boards of American Media Operations, Inc., Nortek, Inc., Michael Foods Group, Inc., US LEC, LLC and Vertis, Inc. Mr. DiNovi brings significant experience to the Board, having served as a director of several public and private corporations, including prior service on the board of the Company, and as an executive of Thomas H. Lee Partners, L.P., a private equity investment firm. This experience dealing with strategic, financial and operating issues in various companies contributed to the board’s conclusion that Mr. DiNovi should serve as a director of the Company.
Sandra Horbach is a Managing Director of The Carlyle Group, where she serves as head of the Global Consumer and Retail team. Prior to joining Carlyle, Ms. Horbach was a General Partner at Forstmann Little, a private investment firm, and an Associate at Morgan Stanley. Ms. Horbach currently serves as a director of NBTY, Inc. and CVC Brasil Operadora e Agência de Viagens S.A., as well as a number of not-for-profit organizations. She has also served on the boards of Citadel Broadcasting Corporation and the Yankee Candle Company, Inc. Ms. Horbach has extensive experience in the retail and consumer industries, and experience on other public and private boards.
Mark Nunnelly is a Managing Director at Bain Capital Partners, LLC. Prior to joining Bain Capital Partners, LLC in 1990, Mr. Nunnelly was a Partner at Bain & Company, with experience in the U.S., Asian and European strategy practices. Mr. Nunnelly managed client relationships in a number of areas, including manufacturing, consumer goods and information services. Previously, Mr. Nunnelly worked at Procter & Gamble in product management. He has also founded and had operating responsibility for several new ventures. Mr. Nunnelly is a member of the board of directors of Warner Music Group Corp. and OSI Restaurant Partners, LLC (Outback Steakhouse), as well as a number of private companies and not-for-profit corporations, and formerly served on the board of Domino’s Pizza, Inc. Mr. Nunnelly brings significant experience in product and brand management, as well as service on the boards of other public companies, including companies in the quick service restaurant business, to the board.
In connection with our acquisition in 2006, we entered into an investor agreement with the Sponsors that grants each of the Sponsors the contractual right to name up to three individuals to our board of directors. In connection with this offering, the investor agreement will be amended and restated, effective upon the closing of this offering. Under the investor agreement, as amended, each of the Sponsors will have the contractual right to name up to two individuals to our board of directors. See “Related party transactions—Arrangements with our investors—Investor Agreement.”
Code of business ethics and conduct
We have adopted a written code of business ethics and conduct that applies to our directors, officers and employees, including our principal executive officer, principal financial officer, principal accounting officer or controller, or persons performing similar functions. Following this offering, a current copy of the code will be posted on our website, which is located at www.dunkinbrands.com.
- 106 -
Table of Contents
Board structure and committee composition
Upon the completion of this offering, we will have an audit committee and a compensation committee with the composition and responsibilities described below. Each committee will operate under a charter that will be approved by our board of directors. The composition of each committee will be effective upon the closing of this offering. The members of each committee are appointed by the board of directors and serve until their successor is elected and qualified, unless they are earlier removed or resign. In addition, each of the Sponsors will have a contractual right to nominate two directors to our board for as long as such Sponsor owns at least 10% of our outstanding common stock (and one director for so long as such Sponsor owns at least 3% of our outstanding common stock) and the Sponsors will have certain contractual rights to have their nominees serve on our compensation committee. See “Related party transactions—Arrangements with our investors.” In addition, from time to time, special committees may be established under the direction of the board of directors when necessary to address specific issues.
Since we intend to avail ourselves of the “controlled company” exception under the NASDAQ Marketplace Rules, we will not have a majority of independent directors, we will not have a nominating committee, and our compensation committee will not be composed entirely of independent directors as defined under the NASDAQ Marketplace Rules. The responsibilities that would otherwise be undertaken by a nominating committee will be undertaken by the full board of directors or at its discretion, by a special committee established under the direction of the board of directors. The controlled company exception does not modify the independence requirements for the audit committee, and we intend to comply with the requirements of the Sarbanes-Oxley Act and the NASDAQ Marketplace Rules. These rules require that our audit committee be composed of at least three members, a majority of whom will be independent within 90 days of the date of this prospectus, and all of whom will be independent within one year of the date of this prospectus.
Audit Committee
The purpose of the audit committee will be set forth in the audit committee charter. The audit committee’s primary duties and responsibilities will be to:
| • | Appoint, compensate, retain and oversee the work of any registered public accounting firm engaged for the purpose of preparing or issuing an audit report or performing other audit, review or attest services and review and appraise the audit efforts of our independent accountants; |
| • | Establish procedures for (i) the receipt, retention and treatment of complaints regarding accounting, internal accounting controls or auditing matters and (ii) confidential and anonymous submissions by our employees of concerns regarding questionable accounting or auditing matters; |
| • | Engage independent counsel and other advisers, as necessary; |
| • | Determine funding of various services provided by accountants or advisers retained by the committee; |
| • | Review our financial reporting processes and internal controls; |
| • | Review and approve related-party transactions or recommend related-party transactions for review by independent members of our board of directors; and |
| • | Provide an open avenue of communication among the independent accountants, financial and senior management and the board. |
Upon completion of this offering, the audit committee will consist of , and , and will have at least one independent director and at least one audit committee financial expert. Prior to the
- 107 -
Table of Contents
consummation of this offering, our board of directors will adopt a written charter under which the audit committee will operate. A copy of the charter, which will satisfy the applicable standards of the SEC and The NASDAQ Global Select Market, will be available on our website.
Compensation Committee
The purpose of the compensation committee is to assist the board of directors in fulfilling responsibilities relating to oversight of the compensation of our directors, executive officers and other employees and the Company’s benefit and equity-based compensation programs. The compensation committee reviews and recommends to our board of directors compensation plans, policies and programs and approves specific compensation levels for all executive officers. Upon completion of this offering, the compensation committee will consist of , and . Prior to the consummation of this offering, our board of directors will adopt a written charter under which the compensation committee will operate. A copy of the charter, which will satisfy the applicable standards of the SEC and The NASDAQ Global Select Market, will be available on our website.
Compensation committee interlocks and insider participation
None of our executive officers serves as a member of our board of directors or compensation committee, or other committee serving an equivalent function, of any other entity that has one or more of its executive officers serving as a member of our board of directors or compensation committee.
Compensation discussion and analysis
This section discusses the principles underlying our policies and decisions with respect to the compensation of our executive officers who are named in the “2010 Summary Compensation Table” and the most important factors relevant to an analysis of these policies and decisions. Our “named executive officers” for fiscal 2010 are:
| • | Nigel Travis, Chief Executive Officer |
| • | Neil Moses, Chief Financial Officer(1) |
| • | John Costello, Chief Global Marketing & Innovation Officer |
| • | Paul Twohig, Chief Operating Officer, Dunkin’ Donuts U.S. |
| • | Richard Emmett, Senior Vice President and General Counsel |
| • | Kate Lavelle, Former Chief Financial Officer, currently on special assignment to the office of the Chief Executive Officer |
Overview of compensation and fiscal 2010 performance
Our compensation strategy focuses on providing a total compensation package that will attract and retain high-caliber executive officers and employees, incentivize them to achieve company and individual performance goals and align management, employee and shareholder interests over both the short-term and long-term. Our approach to executive compensation reflects our focus on long-term value creation. We believe that by placing a significant equity opportunity in the hands of executives who are capable of driving and sustaining growth, our shareholders will benefit along with the executives who helped create this value.
| (1) | Mr. Moses joined Dunkin’ Brands Group, Inc. on November 16, 2010 replacing Ms. Lavelle, who resigned from her position as Chief Financial Officer on July 23, 2010. |
- 108 -
Table of Contents
Compensation philosophy
Our compensation philosophy centers upon:
| • | attracting and retaining industry-leading talent by targeting compensation levels that are competitive when measured against other companies within our industry; |
| • | linking compensation actually paid to achievement of our financial, operating, and strategic goals; |
| • | rewarding individual performance and contribution to our success; and |
| • | aligning the interests of our executive officers with those of our shareholders by delivering a substantial portion of an executive officer’s compensation through equity-based awards with a long-term value horizon. |
Each of the key elements of our executive compensation program is discussed in more detail below. Our executive compensation program is designed to be complementary and to collectively serve the compensation objectives described above. We have not adopted any formal policies or guidelines for allocating compensation between short-term and long-term compensation, between cash and non-cash compensation or among different forms of cash and non-cash compensation. The compensation levels of our named executive officers reflect to a significant degree the varying roles and responsibilities of such executives.
Highlights of 2010 performance
We achieved strong financial performance in fiscal 2010, and we believe that our named executive officers were instrumental in helping us to achieve these results. Highlights of our fiscal 2010 performance include the following:
| • | Drove profitable comparable store sales in Dunkin’ Donuts U.S. for our franchisees: Comparable store sales growth for Dunkin’ Donuts U.S. increased 2.3% for fiscal 2010 compared to fiscal 2009. This increase was due, in large part, to product and marketing innovation and an increased operational focus on the customer’s experience. This positive trend increased throughout the year, with fourth quarter comparable store sales increasing 4.7%, as compared to the prior year’s fourth quarter. |
| • | Expanded our presence in the United States: In 2010, Dunkin’ Donuts franchisees opened 206 net new restaurants in the U.S. alone, including in new markets such as St. Louis and Kansas City. Dunkin’ Donuts U.S. also signed agreements that provide for an additional 226 new domestic development commitments, representing a nearly 50% increase in commitments over 2009. |
| • | Drove accelerated international growth across brands: Baskin-Robbins International saw a systemwide sales increase of 19% year-over-year, driven primarily by results in South Korea, Japan and the Middle East. Dunkin’ Donuts International saw a systemwide sales increase of 15% year-over-year, driven primarily by results in South Korea and Southeast Asia. Dunkin’ Donuts also entered the Russia market, which at year’s end had seven newly-opened locations. |
| • | Improved trends in Baskin-Robbins U.S.: Baskin-Robbins U.S. ended the year with improved trends in the fourth quarter. This improvement was as a result of operational and marketing efforts that we made in 2010, including introducing a value menu and renewing our focus on cakes, which is a key growth category for the brand. |
In the context of the restaurant industry and taking into account the effects of a still-lagging economy at the start of 2010, we believe this was a good year. This performance translated into financial results that exceeded our budgeted expectations. As a result of the performance achieved during fiscal 2010, our Compensation Committee approved funding under our Dunkin’ Brands Short-Term Incentive Plan at 75% of target.
- 109 -
Table of Contents
Compensation framework: policies and process
Roles of compensation committee and chief executive officer in compensation decisions
Our Compensation Committee oversees our executive compensation program and is responsible for approving the nature and amount of the compensation paid to, and any employment and related agreements entered into with, our executive officers, and, for all of our employees, administering our equity compensation plans and awards. Our Chief Executive Officer provides recommendations to our Compensation Committee with respect to salary adjustments, annual cash incentive bonus targets and awards and equity incentive awards for the named executive officers, excluding himself, and the other executive officers that report to him. Our Compensation Committee meets with our Chief Executive Officer at least annually to discuss and review his recommendations for compensation of our executive officers, excluding himself. When making individual compensation decisions for our named executive officers, the Compensation Committee takes many factors into account, including the officer’s experience, responsibilities, management abilities and job performance, our performance as a whole, current market conditions and competitive pay levels for similar positions at comparable companies. These factors are considered by the Compensation Committee in a subjective manner without any specific formula or weighting. Our Compensation Committee has, and it has exercised, the ability to increase or decrease amounts of compensation recommended by our Chief Executive Officer.
Competitive market data and use of compensation consultants
As part of our preparation to become a public company, management and our human resources department provided the Compensation Committee with survey data on our executive compensation levels and general information regarding executive compensation practices in our industry. This data included a review of total cash compensation of our Chief Executive Officer and other executive officers in light of amounts paid and compensation targets at comparable companies gathered from published executive compensation surveys. While our Compensation Committee reviewed this data in 2010, it did not formally benchmark total executive compensation or individual compensation elements against a peer group, and it did not aim to set total compensation, or any compensation element, at a specified level as compared to the survey data that the Compensation Committee reviewed. In evaluating the compensation of our executive officers, the Compensation Committee considered the significant value opportunity created by equity grants in a non-public company. As we transition to a publicly-traded company, the Compensation Committee expects to use market data, and may decide to use the services of an independent compensation consultant, to provide input in establishing the level and types of certain elements of our compensation program. See “Changes to compensation approach post-IPO” below.
In addition, in connection with the hiring of Messrs. Travis, Costello, Emmett and Twohig in 2009 and Mr. Moses in 2010, the Compensation Committee considered the prior compensation level of each candidate and survey compensation data provided by management and our human resources department to obtain a general understanding of compensation trends when negotiating and ultimately setting the initial compensation levels of these individuals.
- 110 -
Table of Contents
Elements of named executive officer compensation
The following is a discussion of the primary elements of the compensation for each of our named executive officers. Compensation for our named executive officers consists of the following elements for fiscal 2010:
| Element | Description | Primary objectives | ||
| Base Salary |
• Fixed cash payment |
• Attract and retain talented individuals • Recognize career experience and individual performance • Provide competitive compensation | ||
| Short-Term Incentives |
• Performance-based annual cash incentive |
• Promote and reward achievement of the Company’s annual financial and strategic objectives and individualized personal goals | ||
| Long-Term Incentives |
• Time and performance-based stock options |
• Align executive interests with shareholder interests by tying value to long-term stock performance • Attract and retain talented individuals | ||
| Retirement and Welfare Benefits |
• Medical, dental, vision, life insurance and disability insurance (STD & LTD) |
• Provide competitive benefits | ||
| • Retirement Savings / 401(k) Plan |
• Provide tax efficient retirement savings vehicle | |||
| • Non-qualified deferred compensation plan |
• Provide tax efficient opportunity to supplement retirement savings | |||
| Executive Perquisites |
• Flexible allowance • Executive physical for Vice Presidents and above |
• Provide competitive benefits • Promote health and well being of senior executives | ||
Base salary
Base salaries of our named executive officers are reviewed periodically by our Chief Executive Officer (other than for himself) and are approved by our Compensation Committee. They are intended to be competitive in light of the level and scope of the executive’s position and responsibilities. Adjustments to base salaries are based on the level of an executive’s responsibilities and his or her individual contributions, prior experience and sustained performance. Decisions regarding salary increases may take into account the named executive officer’s current salary, equity holdings, including stock options, and the amounts paid to individuals in comparable positions as determined through the use of executive compensation surveys. No formulaic base salary increases are provided to our named executive officers, in line with our strategy of offering total compensation that is cost-effective, competitive and based on the achievement of performance objectives.
- 111 -
Table of Contents
Short-term incentive plan
In addition to receiving base salaries, executives participate in the Dunkin’ Brands, Inc. Short-Term Incentive Plan (STI Plan), our annual management incentive plan. We believe that annual incentives should be based upon actual performance against specific business objectives. The funding of the STI Plan is based on the level of achievement of our global earnings before interest, taxes, depreciation and amortization (EBITDA). EBITDA was selected as the funding mechanism for the plan in order to ensure that payments under the STI Plan are affordable and are linked to shareholder value creation. The Compensation Committee sets the EBITDA target at a level it believes is both challenging and achievable. By establishing a target that is challenging, the Compensation Committee believes that performance of our employees, and therefore our performance, is maximized. By setting a target that is also achievable, the Compensation Committee believes that employees remain motivated to perform at the high level required to achieve the target. The potential STI Plan payout for each eligible employee (based on the employee’s target bonus) is aggregated to create a STI Plan pool at target. The level of funding under the STI Plan ranges from 0% to 200% of that target pool based on performance relative to the global EBITDA goal, with a threshold funding level established by the Compensation Committee based on the minimum level of global EBITDA performance that would result in any funding under the STI Plan.
Once global EBITDA performance is determined after the close of the fiscal year, the funding level is established. This incentive plan funding is then allocated based on the achievement of relevant financial or operational business goals such as revenue, comparable store sales and systemwide sales. These specific goals are chosen due to their impact on our profitability. These goals are categorized into three categories: Primary, Secondary and Personal. Primary business goals are key financial goals which are most relevant to the executive based on his or her role within the Company and ability to impact certain aspects of our business. Secondary business goals are financial goals which are influenced or impacted by the activities of a broader organization/group. This team goal is often shared among executives in order to create more cross-functional collaboration. Personal goals are measurable operational or business goals that relate directly to the duties and responsibilities of the executive. Performance against each goal category is measured separately. The goals are generally weighted as follows: Primary (35%), Secondary (30%) and Personal (35%). The achievement of personal goals is taken into account solely on a discretionary basis. During the year, regular communication takes place within the Company to ensure that all executives are aware of progress against the goals established.
- 112 -
Table of Contents
The table below lists the 2010 Primary and Secondary Business goals for each named executive officer. The Compensation Committee establishes these goals for Mr. Travis although, under the terms of his employment agreement, he is entitled to a bonus based on achievement of EBITDA. See “Narrative disclosure to summary compensation table and grants of plan-based awards table” for more information about the terms of Mr. Travis’ bonus entitlement.
| Named executive officer title |
Goal type | Metric | ||
| Nigel Travis |
Primary | Dunkin’ Brands Inc. Global Total Revenue | ||
| Chief Executive Officer |
Secondary | Dunkin’ Donuts Global Total Revenue | ||
| Neil Moses |
Primary |
Dunkin’ Brands Inc. Global Total Revenue | ||
| Chief Financial Officer |
Secondary |
Dunkin’ Donuts U.S. Comp Sales (70%) | ||
| Baskin Robbins U.S. Comp Sales (30%) | ||||
| Paul Twohig |
Primary |
Dunkin’ Donuts U.S. Comp Sales | ||
| Chief Operating Officer Dunkin’ Donuts U.S. |
Secondary |
Dunkin’ Brands Inc. Global Total Revenue | ||
| John Costello |
Primary |
Dunkin’ Donuts U.S. Comp Sales (70%) | ||
| Chief Global Marketing and Innovation Officer | Baskin Robbins U.S. Comp Sales (30%) | |||
| Secondary |
Dunkin’ Brands Inc. Global Total Revenue | |||
| Richard Emmett |
Primary |
Dunkin’ Brands Inc. Global Total Revenue | ||
| Senior Vice President, General Counsel | Secondary |
Dunkin’ Donuts U.S. Comp Sales (70%) | ||
| Baskin Robbins U.S. Comp Sales (30%) | ||||
| Kate Lavelle |
Primary |
Dunkin’ Brands Inc. Global Total Revenue | ||
| Former Chief Financial Officer | Secondary |
Dunkin’ Donuts U.S. Comp Sales (70%) | ||
| Baskin Robbins U.S. Comp Sales (30%) | ||||
2010 personal goals included relevant strategic and operational goals for the respective named executive officer, including:
| • | increasing customer satisfaction scores; |
| • | successful enrollment of Dunkin’ Donuts franchisees into our new retail technology platform; |
| • | increasing average transaction size; and |
| • | effective succession planning. |
The achievement of personal goals under the STI Plan is reviewed after the close of the relevant fiscal year and is taken into account by the Compensation Committee on a discretionary basis.
At the conclusion of the fiscal year, EBITDA results are determined by our finance department based on audited financial results. These results are presented to the Compensation Committee for consideration and approval. The Compensation Committee retains the discretion to adjust (upwards or downwards) EBITDA results for the occurrence of extraordinary events affecting EBITDA performance. In addition, in setting the EBITDA thresholds and determining our achievement of such thresholds, our Compensation Committee may exclude revenue and expenses related to our business as it deems appropriate. After the Compensation Committee sets the bonus pool under the STI Plan based on its determination of the level of EBITDA achieved, the Chief Executive Officer then recommends amounts payable to each named executive officer under the incentive plan based on that individual’s performance against his or her Primary, Secondary and Personal business goals. These awards may
- 113 -
Table of Contents
be adjusted based on considerations deemed appropriate by our Compensation Committee, including personal performance.
Long-term equity incentive program
Our long-term equity program for executive officers in fiscal 2010 consisted of stock options that are more heavily weighted towards stock options with performance-based vesting requirements. Previously, from 2006 to 2008, we had used a combination of time- and performance-based restricted shares as our equity compensation vehicle. Of the named executive officers, only Kate Lavelle was granted restricted stock under this program. After July 2008, the Compensation Committee ceased to grant restricted stock, and instead developed a time- and performance-based stock option program for executives as a means of incentivizing the achievement of our long-term strategy and goals. The first grants under this executive stock option program were made in February 2010. The primary goals of our executive stock option program are to align the interests of our named executive officers with the interests of our shareholders and to encourage executive retention through the use of service-based vesting requirements. Stock option grants are divided so that 30% are time-vested options (tranche 4) and 70% are performance options that vest based on time and investment returns to the Sponsors (tranche 5). The combination of time- and performance-vesting of these awards is designed to compensate executives for their long-term commitment to the Company, while incentivizing sustained increases in our financial performance and helping to ensure that the Sponsors have received an appropriate return on their invested capital before executives receive significant value from these grants.
The tranche 4 options generally vest in equal installments of 20% on each of the first five anniversaries of the vesting commencement date, which is typically the date the option grants are approved by the Compensation Committee.
The tranche 5 options generally become eligible to vest in tandem with the vesting of tranche 4 options, but do not actually vest unless a pre-established performance condition is also achieved. The performance condition is satisfied by the Sponsors’ receipt of a targeted return on their initial investment in the Company, measured at the time of a sale or disposition by the Sponsors of all or a portion of the Company. If the Sponsors receive a specified level of investment return on such sale or disposition, the performance condition is met for a percentage of tranche 5 options equal to the percentage of shares sold by the Sponsors to that point. If the performance condition is achieved, but the service condition is not, the tranche remains subject to the time-based vesting schedule described above. We believe this vesting schedule appropriately supports our retention objective while allowing our executives to realize compensation in line with the value they have created for our shareholders.
Our named executive officers received grants of stock options in connection with the commencement of their employment. In determining the size of the long-term equity grant to be awarded to our executive officers, the Compensation Committee takes into account a number of factors such as long-term incentive values typically awarded to executives holding positions in similarly-situated companies and internal factors such as the individual’s responsibilities, position and the size and value of the long-term incentive awards of currently employed executives. To date, there has been no program for awarding annual grants, and our Compensation Committee retains discretion to make stock option awards to employees at any time, including in connection with promotion to reward an employee, for retention purposes or in other circumstances.
The exercise price of each stock option is set at the fair market value of our common stock on the grant date. For fiscal 2010, the determination of the appropriate fair market value was made by our Board in accordance with the 2006 Executive Incentive Plan. In the absence of a public trading market, our Board determined fair market value based on an independent, third-party valuation of our common stock.
- 114 -
Table of Contents
Equity purchase program
In addition to our long-term equity incentive program, our current named executive officers have further increased their ownership stakes in the Company by electing to purchase our shares pursuant to our management equity investment program in 2009, 2010 or 2011, as illustrated in the table below. For more information, please see “Principal stockholders.”
| Named Executive Officer |
Personal investment in equity purchase Program |
|||
| Nigel Travis |
$ | 2,900,000 | ||
| Neil Moses |
$ | 250,000 | ||
| Paul Twohig |
$ | 315,195 | ||
| John Costello |
$ | 250,000 | ||
| Richard Emmett |
$ | 150,000 | ||
Retirement and welfare benefits
We provide our executive officers with access to the same benefits we provide all of our full-time employees. In addition to the standard company Long-Term Disability policy, we offer executives the opportunity to participate in a supplemental Long-Term Disability policy at no additional cost to them except for taxes on the imputed income associated with this benefit.
In addition to our standard 401(k) retirement savings plan available to all employees, we have established a non-qualified deferred compensation plan for senior employees, including our named executive officers. The plan allows participants to defer certain elements of their compensation with the potential to receive earnings on deferred amounts. We believe this plan is an important retention and recruitment tool because it helps facilitate retirement savings and financial flexibility for our key employees, and because many of the companies with which we compete for executive talent provide a similar plan to their key employees.
Executive perquisites
Perquisites are generally provided to help us attract and retain top performing employees for key positions. Our primary perquisite for current named executive officers is a flexible allowance in the amount of $20,000 per annum. While generally identified as a car allowance, this benefit is paid in cash and its utilization is at the discretion of the executive. In addition, executives are offered the opportunity to have a Company-paid annual physical examination, as a means of maintaining the health and well-being of our executives. We have also provided named executive officers with relocation benefits to facilitate their relocation, including loss on home sale protection and short-term cash supplements. We also provide our executives a limited number of sporting event tickets. The costs associated with all perquisites are included in the Summary Compensation table.
Fiscal 2010 compensation
Base salaries
None of our named executive officers, other than Ms. Lavelle, received an increase in base salary during 2010, after a joint determination by our Chief Executive Officer, the other named executive officers and our Compensation Committee that, in view of the uncertain direction of the economy and its effect on the business in 2009, there should be no general increases in base salaries for executives. Effective March 29, 2010, Ms. Lavelle received an adjustment in her annual base salary from $400,000 to $430,000, after an analysis of CFO compensation performed by the Company based on a review of available salary information revealed that her salary was below market. This increase was approved by the Compensation Committee.
- 115 -
Table of Contents
The actual base salaries paid to all of our named executive officers during 2010 are set forth in the “2010 Summary compensation table” below.
Short-term incentive awards
The target incentive (as a percentage of base salary) established under the STI Plan and payable to each named executive officer if achievement relative to the 2010 global EBITDA target resulted in a fully funded plan and, if applicable, the named executive officer achieved each of his or her Primary, Secondary and Personal business goals was:
| Target STI as a % of base salary | ||||||||||||
| Named executive officer | Minimum % | Target % | Maximum %(1) | |||||||||
| Nigel Travis |
0% | 100% | 150% | |||||||||
| Neil Moses(2) |
0% | 75% | 150% | |||||||||
| Paul Twohig(3) |
0% | 50% | 100% | |||||||||
| John Costello |
0% | 50% | 100% | |||||||||
| Richard Emmett |
0% | 50% | 100% | |||||||||
| Kate Lavelle(4) |
0% | 75% | 125% | |||||||||
| (1) | Each of Mr. Travis’ and Ms. Lavelle’s maximum percentage is established by the terms of his or her respective employment agreement. For the other named executive officers, the maximum percentage is equal to 200% of the individual’s target incentive. |
| (2) | Mr. Moses joined the Company on November 16, 2010. The fiscal 2010 earnings on which his 2010 STI Plan was based were $43,698. |
| (3) | Mr. Twohig’s incentive target was increased from 40% to 50% effective October 1, 2010 in connection with his promotion to Chief Operating Officer, Dunkin’ Donuts U.S. His effective target percentage, used to calculate his 2010 STI Plan award, was pro-rated at 42.5%. |
| (4) | Ms. Lavelle became ineligible for a 2010 STI Plan award after she resigned from her position as Chief Financial Officer. Under her Transition Services Agreement, she was eligible for a pro-rated bonus at the time she transitioned to a non-executive role. |
Full funding (100% of target) for the STI Plan was contingent on achievement of our global EBITDA target of $280.8 million, although our STI Plan budget assumptions for 2010 were based on a lower level of funding due to the recessionary economic climate. The funding threshold level (30% of target) was contingent on achievement of 95.75% of the global EBITDA target, meaning that if EBITDA performance achievement fell below $268.9 million, no funding would be achieved under the plan.
Our 2010 global EBITDA performance per our STI Plan before adjustment was $269.6 million. After considering and excluding certain one-time or unusual items, both positive and negative, from the EBITDA calculation, including certain legal reserves and related costs and revenue relating to franchisee term renewal programs, the Compensation Committee agreed to an adjusted EBITDA performance level of $275.5 million, or 98.1% of target EBITDA. This translated to an STI Plan funding level of 71.6% of target funding. The items that were excluded from the EBITDA calculation were excluded because they were not anticipated and therefore not budgeted. Considering our strong finish in fiscal 2010, management requested consideration by the Compensation Committee for a discretionary pool to bring total STI Plan funding to 75% of target funding. The Compensation Committee approved the request to bring total STI Plan funding for fiscal 2010 to 75% of target.
Once the level of funding was established, the Chief Executive Officer then recommended amounts payable to each named executive officer (other than himself) under the incentive plan based on that individual’s performance against his or her Primary, Secondary and Personal business goals, as described below. The table below lists the payouts to each named executive officer as a percentage of eligible base salary earnings and as a percentage of the target award. Awards were based on the achievement against Primary and Secondary business goals for the respective named executive officer, taking into account the addition of the discretionary pool to the STI Plan funding level. Although the Chief Executive Officer and the Compensation Committee
- 116 -
Table of Contents
reviewed performance against Personal Business Goals, the Compensation Committee determined bonus amounts for fiscal 2010 solely based on the achievement of Primary and Secondary business goals and total STI Plan funding.
| Named executive officer | Target STI plan % payout (% of base salary) |
Actual award % (% of base salary) |
Actual award % (% of target award) |
|||||||||
| Nigel Travis |
100% | 75.0% | 75.0% | |||||||||
| Neil Moses |
75% | 52.6% | 70.1% | |||||||||
| Paul Twohig |
42.5% | 40.6% | 95.5% | |||||||||
| John Costello |
50% | 36.4% | 72.8% | |||||||||
| Richard Emmett |
50% | 35.8% | 71.6% | |||||||||
For Mr. Travis, the award payout of 75% of his target bonus was the result of a 75% STI Plan funding level. For the other named executive officers, the award payout was determined as follows.
| Primary and Secondary Business Goals (1) | Target Performance |
Actual Performance |
% Earned |
|||||||||
| Dunkin’ Brands Inc. Global Total Revenue |
$ | 510,030,000 | $ | 503,310,000 | 77.5% | |||||||
| Dunkin’ Donuts Global Total Revenue |
$ | 415,770,000 | $ | 416,870,000 | 100% | |||||||
| Dunkin’ Donuts U.S. Comp Sales |
2.73% | 2.22% | 85% | |||||||||
| Baskin Robbins U.S. Comp Sales |
2.50% | -5.21% | 0% | |||||||||
| (1) | Each metric is as defined under the STI Plan. |
| Weighted Contribution Toward STI Plan Payout | ||||||||||||
| Named executive officer | Primary and Secondary Business Goals (65% of total opportunity) (1) |
EBITDA and STI Plan funding (35% of total opportunity) (2) |
Actual award % (% of target award) |
|||||||||
| Neil Moses |
45.0% | 25.1% | 70.1% | |||||||||
| Paul Twohig |
53.0% | 42.5% | 95.5% | |||||||||
| John Costello |
44.1% | 28.7% | 72.8% | |||||||||
| Richard Emmett |
45.0% | 26.6% | 71.6% | |||||||||
| (1) | Represents the earned portion of the award with respect to each executive’s Primary and Secondary Business Goals based on performance results described in the preceding table and the applicable weightings described above under “Short-term incentive plan”. |
| (2) | Represents the preliminary EBITDA-based funding level of 71.6% multiplied by the remaining portion of the award (35%), plus, for Messrs. Twohig, Costello and Emmett, the executive’s share of the additional STI Plan discretionary pool described above as recommended by the Chief Executive Officer. |
Long-term equity incentive awards
With the exception of Mr. Moses who joined the Company in late 2010, long-term incentive awards were made on February 23, 2010 to named executive officers as part of the new executive performance stock option program that was adopted by the Board in February 2010 under the 2006 Executive Incentive Plan. The Compensation Committee determined that this new stock option program would incentivize eligible participants to increase shareholder value, which the Committee believed was an important goal for the Company, given the Company’s position and the possibility of strategic opportunities, such as this offering, in the future.
In determining the size of each named executive officer’s stock option grant, the Committee made a subjective judgment, taking into consideration a multitude of factors, including the scope and impact of the role of the respective named executive officer, the estimated value of the total grant based on share price projections, the vesting schedule under the program, competitive practice, the long-term incentive award values that had been
- 117 -
Table of Contents
delivered to similarly situated executive officers since 2006 and other elements of compensation as part of the total compensation package.
As described above, the stock option grants are apportioned into two “tranches” with the tranche 4 consisting of time-based options, and tranche 5 consisting of stock options containing both time- and performance-vesting criteria. The performance-based stock options are not scheduled to vest unless both the time and performance conditions have been satisfied.
The stock option awards granted on February 23, 2010 have an exercise price of $0.66 per share. This exercise price was determined in accordance with the 2006 Equity Incentive Plan and was based on the most recent valuation of the Company as prepared by an independent, third-party valuation firm taking into consideration events that occurred and market conditions between the valuation date and the grant date. These stock options have a ten year maximum term.
Grant values for the named executive officers are detailed below:
| Named executive officer | Total stock options granted |
Tranche 4: “time-based” options (30% of award) |
Tranche 5: “time and performance-based” (70% of award) |
|||||||||
| Nigel Travis(1) |
12,500,000 | 3,750,000 | 8,750,000 | |||||||||
| Neil Moses(2) |
— | — | — | |||||||||
| Paul Twohig |
850,000 | 255,000 | 595,000 | |||||||||
| John Costello |
1,000,000 | 300,000 | 700,000 | |||||||||
| Richard Emmett |
750,000 | 225,000 | 525,000 | |||||||||
| Kate Lavelle(3) |
900,000 | 270,000 | 630,000 | |||||||||
| (1) | The Committee approved for Mr. Travis accelerated vesting of 20% of his tranche 4 stock options and accelerated eligibility for vesting of 20% of his tranche 5 stock options to reflect the time that had passed (over one year) between his hire date and the stock option grant date. |
| (2) | Mr. Moses joined the Company on November 16, 2010 and received a grant of 1,100,000 tranche 4 and tranche 5 stock options in March 2011. |
| (3) | Ms. Lavelle forfeited her stock option award upon her voluntary resignation from her position as Chief Financial Officer on July 23, 2010. |
No long-term incentive awards, other than those included in the table above, were made to the named executive officers in fiscal 2010.
Employment and termination agreements
Employment agreements and letters
Each named executive officer (other than Ms. Lavelle) is entitled to certain payments and benefits upon a qualifying termination, including salary continuation, as more fully described under “Potential payments upon termination or change in control”. These severance benefits are provided pursuant to employment agreements or offer letters. Ms. Lavelle does not have an entitlement to severance payments under her Transition Services Agreement.
Prior to the offering, we provided substantially similar benefits under our Executive Severance Pay Plan, in which Messrs. Moses, Twohig, Costello and Emmett participated. To give us greater flexibility, we decided to terminate this plan and to provide, in our discretion or pursuant to individual offer letters or employment agreements, individual entitlements to severance, if any.
Equity compensation
As more fully described below in the section entitled “Potential payments upon termination or change in control,” certain executive stock option and restricted stock agreements also provide for accelerated vesting upon a change in control. Vesting of stock options does not accelerate solely upon an initial public offering.
- 118 -
Table of Contents
Employment agreements with named executive officers
We have entered into employment contracts with Mr. Travis and Ms. Lavelle and offer letters with each of our other named executive officers. The material terms of these employment contracts and letters are summarized below.
Employment Agreement with Mr. Travis. In connection with this offering, we amended and restated Mr. Travis’ employment agreement to, among other things, extend the term to a five-year term commencing in May 2011. Under his amended and restated employment agreement, Mr. Travis receives an annual base salary of $861,000 and is eligible for a target annual incentive bonus of 100% of his base salary, which can be increased up to 150% if we achieve certain EBITDA goals. The amended and restated agreement also provides for certain payments and benefits to be provided upon a qualifying termination of Mr. Travis’ employment, as described below under “Potential payments upon termination or change of control.”
Letter Agreements with Messrs. Moses, Twohig, Costello and Emmett. Messrs. Moses, Twohig, Costello and Emmett are parties to offer letter agreements with the Company that provide for a certain level of base salary, eligibility to participate in the Company’s STI Plan with specified target bonus opportunities under such plan, a flexible allowance, and, for certain executive officers, reimbursement for relocation expenses incurred in connection with the executive’s relocation to Massachusetts. The offer letters also provide for certain payments to be provided upon a termination of the named executive officer’s employment other than for cause, as described below under “Potential payments upon termination or change of control.”
Employment Agreement and Transition Agreement with Ms. Lavelle. Ms. Lavelle was party to an employment agreement with the Company that governed the terms and conditions of her employment as our Chief Financial Officer. This agreement entitled her to a base salary of at least $375,000 and annual incentives, the payment of which would be based on the achievement of performance goals. She was also entitled to certain payments and benefits upon a qualifying termination. This employment agreement terminated when Ms. Lavelle voluntarily resigned from her position as Chief Financial Officer. We entered into a Transition Services Agreement with Ms. Lavelle in connection with her transition to a part-time, non-executive employee role in July 2010. This agreement provides her with a reduced base salary of $100,000 per year. She is not entitled to any annual bonus or incentive-based compensation and does not receive any special termination pay or benefits under this agreement. The term of this Transition Services Agreement is one year, unless mutually extended by the parties.
Restrictive Covenants. Under the terms of their respective agreements, each named executive officer has agreed to confidentiality obligations during and after employment. Under his employment agreement, Mr. Travis has agreed to non-competition and non-solicitation obligations during and for two years following employment termination. Under her Transition Services Agreement, Ms. Lavelle has agreed to non-competition and non-solicitation obligations during and for two years following employment termination (which period will be reduced to one year if her employment terminates after July 23, 2011). Each other named executive officer has agreed to non-competition and non-solicitation obligations during and for one year following employment termination.
Employee benefits and perquisites
All of our full-time employees in the United States, including our named executive officers, are eligible to participate in our 401(k) plan. Pursuant to our 401(k) plan, employees, including our named executive officers, may elect to defer a portion of their salary and receive a Company match of up to 4% of salary for fiscal 2010, subject to Internal Revenue Code limits.
- 119 -
Table of Contents
All of our full-time employees in the United States, including our named executive officers, are eligible to participate in our health and welfare plans. Generally, we share the costs for such plans with the employee. The Company cost of executive-level health and welfare benefits as well as the flexible allowance and other benefits and perquisites for our named executive officers for fiscal 2010 is reflected under the “All other compensation” column in the “2010 Summary compensation table.”
Changes to compensation approach post-IPO
Use of compensation consultant
The Company retained Frederic W. Cook & Co., or Cook, an independent compensation consulting firm, to advise on executive compensation as part of our IPO planning. Cook developed and the Compensation Committee approved a peer group of companies against which to assess the three key components comprising our named executive officers’ compensation: base salary, cash bonus and equity incentives. This peer group consists of the following 14 publicly-traded restaurant companies:
| Brinker International |
Darden Restaurants | Panera Bread | Wendy’s/Arby’s Group | |||
| Cheesecake Factory |
DineEquity | Ruby Tuesday | Yum! Brands | |||
| Chipotle Mexican Grill |
Domino’s Pizza | Starbucks | ||||
| Cracker Barrel |
Jack In The Box | Tim Horton’s | ||||
In terms of size, our enterprise value as of February 2011 approximates the median of the peer companies and our 2010 EBITDA is between the 25th percentile and the median.
The Company may determine to have the compensation consultant provide market data on this peer group of companies in the restaurant industry on an annual basis. Our Compensation Committee intends to review this peer group at least annually to ensure that it is appropriate, reflective of our company size and includes the companies against which we compete for executive talent. Our Compensation Committee intends to review market data and other information in light of the compensation we offer to help ensure that our compensation program is competitive. Our Compensation Committee may make adjustments in executive compensation levels in the future as a result of this more formal market comparison process. While we anticipate that we will take a more systematic approach to reviewing competitive data on executive compensation levels and practices, we expect to continue to apply compensation philosophies and strategies that we believe are appropriate for our business, and that focus executives more on long-term and performance-based incentive compensation than on fixed compensation.
Long-term incentives
It is our policy that stock options granted after the completion of this offering, when our common stock becomes publicly traded, will have a per share exercise price that is not less than the closing price of a share of our common stock on the date of grant.
Flexible allowance
Management has recommended and the Compensation Committee has approved the elimination of the $20,000 flexible allowance for our named executive officers and other direct reports of Mr. Travis. This allowance has been replaced with an increase in base salary of $11,000 for Mr. Travis (which is reflected in his amended and restated employment agreement), $13,000 for Mr. Moses and $15,000 for Messrs. Twohig, Costello and Emmett.
- 120 -
Table of Contents
Compensation risk assessment
In consultation with the Compensation Committee, members of human resources, finance, legal, and internal audit management will conduct an assessment of whether the Company’s compensation policies and practices encourage excessive or inappropriate risk taking by our employees, including employees other than our named executive officers. This assessment will include a review of the risk characteristics of our business and the design of our incentive plans and policies. Although a significant portion of our executive compensation program is performance-based, the Compensation Committee will focus on further aligning the Company’s compensation policies with the long-term interests of the Company and avoiding rewards or incentive structures that could create unnecessary risks to the Company. The Compensation Committee intends to adopt a “clawback” policy once the SEC rules are finalized and to adopt an insider trading policy that will prohibit insiders from hedging their ownership of our common stock or pledging shares of common stock.
Tax and accounting considerations
Section 162(m) disallows a tax deduction for any publicly held corporation for individual compensation exceeding $1 million in any taxable year for a company’s named executive officers, other than its chief financial officer, unless compensation qualifies as performance-based under such section. As we are not currently publicly traded, our Compensation Committee has not previously taken the deductibility limit imposed by Section 162(m) into consideration in setting compensation. Following this offering, at such time as we are subject to the deduction limitations of Section 162(m), we expect that our Compensation Committee will seek to qualify the variable compensation paid to our named executive officers for an exemption from the deductibility limitations of Section 162(m). However, our Compensation Committee may, in its judgment, authorize compensation payments that do not comply with the exemptions in Section 162(m) when it believes that such payments are appropriate to attract and retain executive talent.
Our Compensation Committee regularly considers the accounting implications of significant compensation decisions, especially in connection with decisions that relate to our equity incentive award plans and programs. As accounting standards change, we may revise certain programs to appropriately align accounting expenses of our equity awards with our overall executive compensation philosophy and objectives.
- 121 -
Table of Contents
2010 Summary compensation table
The following table sets forth information concerning the compensation paid to or earned by our named executive officers for fiscal 2010:
| Name and principal position | Year | Salary ($)(1) |
Bonus ($)(2) |
Option awards ($)(3) |
Non-equity incentive plan compensation ($)(4) |
All other compensation ($)(7) |
Total ($) |
|||||||||||||||||||||
| Nigel Travis Chief Executive Officer |
2010 | $ | 850,000 | $ | — | $ | 4,012,500 | $ | 637,500 | $ | 37,250 | $ | 5,537,250 | |||||||||||||||
| Neil Moses(5) Chief Financial Officer |
2010 | $ | 43,698 | $ | — | $ | — | $ | 22,978 | $ | 1,846 | $ | 68,522 | |||||||||||||||
| Paul Twohig Chief Operating Officer, Dunkin’ Donuts U.S. |
2010 | $ | 375,000 | $ | — | $ | 275,400 | $ | 152,144 | $ | 926,129 | $ | 1,728,673 | |||||||||||||||
| John Costello Chief Global Marketing & Innovation Officer |
2010 | $ | 500,000 | $ | — | $ | 324,000 | $ | 182,000 | $ | 152,795 | $ | 1,158,795 | |||||||||||||||
| Richard Emmett Senior Vice President, General Counsel |
2010 | $ | 400,000 | $ | — | $ | 243,000 | $ | 143,220 | $ | 72,669 | $ | 858,889 | |||||||||||||||
| Kate Lavelle(6) Former Chief Financial Officer |
2010 | $ | 288,654 | $ | 122,500 | $ | 291,600 | $ | — | $ | 44,245 | $ | 746,999 | |||||||||||||||
| (1) | Amounts shown in this column are not reduced to reflect any deferrals under the Non-Qualified Deferred Compensation Plan or 401(k) Plan. |
| (2) | The amount shown in this column reflects a pro-rata bonus payment to Ms. Lavelle pursuant to her Transition Services Agreement, as described in note (6) below, and is not reduced to reflect any deferrals under the 401(k) Plan. |
| (3) | Amounts shown in this column reflect the fair value of option awards on the grant date. These amounts do not reflect actual amounts paid to or realized by the named executive officers and exclude the effect of estimated forfeitures. The underlying valuation assumptions for option awards are further discussed in Note 13 to our consolidated financial statements for the fiscal year ended December 25, 2010 (the “2010 Financials”). |
| (4) | Amounts shown in this column represent the named executive officer’s bonus payment pursuant to the STI Plan (and, for Mr. Travis, his employment agreement) and are not reduced to reflect any deferrals under the Non-Qualified Deferred Compensation Plan or 401(k) Plan. See “Compensation discussion & analysis – Elements of named executive officer compensation – Short-term incentive plan”. |
| (5) | Mr. Moses joined the Company as Chief Financial Officer on November 16, 2010. The amounts shown for Mr. Moses reflects his compensation for the portion of fiscal 2010 in which he was employed by the Company. |
| (6) | Ms. Lavelle voluntarily resigned as Chief Financial Officer on July 23, 2010. The amount shown as salary for Ms. Lavelle includes $248,269 for services as an executive officer during fiscal 2010 and $40,385 for services as a non-executive employee during fiscal 2010 following such resignation. The amount shown in the “Bonus” column reflects the pro-rata incentive Ms. Lavelle received under her Transition Services Agreement, and the amount shown in the “Option Awards” column reflects an option award that was granted to Ms. Lavelle during fiscal 2010. This option award was subsequently forfeited upon her resignation as Chief Financial Officer. |
- 122 -
Table of Contents
| (7) | Amounts shown in the “All Other Compensation” column include the following items, as applicable to each named executive officer, for fiscal 2010: |
| Name and principal position | Year | Flexible allowance and event tickets ($) (i) |
Company- Paid premiums for LTD coverage ($) |
Relocation expenses ($) |
Executive physicals ($) |
401(k) company match contributions ($) |
Other ($) |
|||||||||||||||||||||
| Nigel Travis Chief Executive Officer |
2010 | $ | 24,000 | — | — | $ | 3,450 | $ | 9,800 | — | ||||||||||||||||||
| Neil Moses Chief Financial Officer |
2010 | $ | 1,846 | — | — | — | — | — | ||||||||||||||||||||
| Paul Twohig Chief Operating Officer, Dunkin’ Donuts U.S. |
2010 | $ | 15,858 | $ | 3,564 | $ | 518,966 | (ii) | — | $ | 4,615 | $ | 383,126 | (iii) | ||||||||||||||
| John Costello Chief Global Marketing & Innovation Officer |
2010 | $ | 22,000 | $ | 3,225 | $ | 119,263 | (iv) | — | $ | 8,307 | — | ||||||||||||||||
| Richard Emmett Senior Vice President, General Counsel |
2010 | $ | 22,621 | $ | 2,570 | $ | 40,305 | (v) | $ | 3,450 | $ | 3,723 | — | |||||||||||||||
| Kate Lavelle Former Chief Financial Officer |
2010 | $ | 13,920 | $ | 1,163 | — | — | $ | 4,354 | $ | 24,808 | (vi) | ||||||||||||||||
| (i) | Amount shown consists of a cash allowance paid to each named executive officer at the rate of $20,000 per annum to be used at his or her discretion as a car allowance or otherwise (the flexible allowance) (Messrs. Travis and Costello, each $20,000; Mr. Moses, $1,846; Mr. Twohig, $13,858; Mr. Emmett, $20,621; and Ms. Lavelle, $11,920), plus the face value of sporting event tickets provided to the executives (Mr. Travis, $4,000; and Messrs. Twohig, Costello and Emmett and Ms. Lavelle, each $2,000). Mr. Emmett’s flexible allowance includes a retroactive payment made in 2010 as a result of an incorrect benefit paid at the end of 2009. As we transition to a public company, the flexible allowance will be eliminated. |
| (ii) | Amount shown reflects costs associated with Mr. Twohig’s relocation to Massachusetts, consisting of $250,000 relating to his capital loss on the sale of his home, $516 for pre-move house hunting, $33,572 for temporary living, $5,827 for home purchase costs, $10,985 for loan origination fees, $10,000 for miscellaneous allowance, and a “gross-up” of $208,066 to cover taxes on his relocation benefits. |
| (iii) | Amount shown reflects the forgiveness during fiscal 2010 of principal and interest on a loan extended to Mr. Twohig in connection with his settlement of a lawsuit regarding his alleged violation of a non-compete agreement with Starbucks Coffee. |
| (iv) | Amount shown reflects costs associated with Mr. Costello’s relocation to Massachusetts, consisting of $100,000 relating to the reimbursement of the costs of rental housing in Boston, $2,585 for pre-move house hunting, $7,628 for temporary living, $48 for trips between locations, $960 for property management/rental assistance and a “gross-up” of $8,042 to cover taxes on his relocation benefits. The reimbursement of rental housing is scheduled to terminate on April 23, 2011. |
| (v) | Amount shown reflects costs associated with Mr. Emmett’s relocation to Massachusetts, consisting of $1,725 for pre-move house hunting, $614 for mileage reimbursement, $528 for household goods storage, $5,500 for temporary living, $5,286 for trips between locations, $10,000 for miscellaneous relocation allowance, $4,000 for property management/rental assistance and a “gross-up” of $12,652 to cover taxes on his relocation benefits. |
| (vi) | Amount shown reflects a payout of accrued vacation upon Ms. Lavelle’s resignation as Chief Financial Officer on July 23, 2010. |
- 123 -
Table of Contents
Grants of plan-based awards in 2010
The following table sets forth information regarding grants of plan-based awards made to our executive officers during fiscal 2010:
| Estimated future payouts under non-equity incentive plan awards |
Estimated future payouts under equity incentive plans(3) |
All other (4) |
Exercise (5) |
Grant date ($)(6) |
||||||||||||||||||||||||||
| Name | Type of award | Grant date | Target ($)(2) |
Maxi- mum |
Target (#) |
|||||||||||||||||||||||||
| Nigel Travis |
Annual Incentive(1) | 2/23/2010 | 850,000 | 1,275,000 | ||||||||||||||||||||||||||
| Stock Options | 8,750,000 | 3,750,000 | $ | 0.66 | 4,012,500 | |||||||||||||||||||||||||
| Neil Moses |
STI Plan | 32,774 | 65,547 | — | — | |||||||||||||||||||||||||
| Paul Twohig |
STI Plan | 2/23/2010 | 159,375 | 318,750 | ||||||||||||||||||||||||||
| Stock Options | 595,000 | 255,000 | $ | 0.66 | 275,400 | |||||||||||||||||||||||||
| John Costello |
STI Plan | 2/23/2010 | 250,000 | 500,000 | ||||||||||||||||||||||||||
| Stock Options | 700,000 | 300,000 | $ | 0.66 | 324,000 | |||||||||||||||||||||||||
| Richard Emmett |
STI Plan | 2/23/2010 | 200,000 | 400,000 | ||||||||||||||||||||||||||
| Stock Options | 525,000 | 225,000 | $ | 0.66 | 243,000 | |||||||||||||||||||||||||
| Kate Lavelle |
Annual Incentive(1)(8) | 2/23/2010 | 300,000 | 500,000 | ||||||||||||||||||||||||||
| Stock Options(7) | 630,000 | 270,000 | $ | 0.66 | 291,600 | |||||||||||||||||||||||||
| (1) | Non-equity incentive plan compensation for Mr. Travis and Ms. Lavelle is paid according to the terms of his or her respective employment agreement, but is based on achievement against the performance targets established under the STI Plan. |
| (2) | Except for Mr. Travis and Ms. Lavelle as noted in (1) above, these figures represent target and maximum bonus opportunities under the STI Plan. For Mr. Travis, his target and maximum bonus opportunities are provided in his employment agreement. The actual amount of the bonus earned by each named executive officer for fiscal 2010 is reported in the summary compensation table. For a description of the performance targets relating to the STI Plan for fiscal 2010, please refer to the “Compensation Discussion and Analysis—Elements of named executive officer compensation—Short-term incentive plan” above. |
| (3) | All stock option awards are granted under the 2006 Equity Incentive Plan and are options to purchase shares of Class A common stock. Stock options shown in this column are tranche 5 options subject to performance-based and service-based vesting conditions, and will only vest upon satisfaction of applicable performance criteria, as described below. |
| (4) | All stock option awards are granted under the 2006 Equity Incentive Plan and are options to purchase shares of Class A common stock. Stock options shown in this column are tranche 4 options subject to service-based vesting conditions, as described below. |
| (5) | The exercise price of stock options is the fair market value of a share of Class A Common Stock on the grant date, determined by our Board under the 2006 Equity Incentive Plan and based on a valuation provided by an independent valuation firm. |
| (6) | Amounts shown reflect the fair value of stock option awards on the grant date. These amounts do not reflect actual amounts paid to or realized by the named executive officers and exclude the effect of estimated forfeitures. The underlying valuation assumptions for option awards are further discussed in Note 13 to the 2010 Financials (attached as an exhibit to this prospectus). |
| (7) | Ms. Lavelle forfeited her stock option award upon her voluntary resignation as Chief Financial Officer on July 23, 2010. |
| (8) | Ms. Lavelle was granted a bonus opportunity under the STI Plan during fiscal 2010. Ms. Lavelle voluntarily resigned as Chief Financial Officer on July 23, 2010 and received a pro-rata bonus payment in connection with her Transition Services Agreement. At such time, her opportunity under the STI Plan was forfeited. |
- 124 -
Table of Contents
Narrative disclosure to summary compensation table and grants of plan-based awards table
Each of our named executive officers is party to an employment agreement (in the case of Mr. Travis) or an offer letter (in the case of all other named executive officers other than Ms. Lavelle) that provides for a base salary and other benefits, as described above in the Compensation Discussion and Analysis. All of our named executive officers were eligible to participate in our Non-Qualified Deferred Compensation Plan, the STI Plan, our 2006 Equity Incentive Plan and our benefit plans and programs for all or a portion of fiscal 2010. Mr. Travis’ annual incentive entitlement is set forth in his employment agreement. Under Mr. Travis’ employment agreement, he is entitled to receive a bonus based on an EBITDA target set by the Board, which has delegated this authority to the Compensation Committee for each year during the term of the agreement. If targeted EBITDA is achieved, he will be entitled to receive a bonus equal to 100% of base salary. If EBITDA for the year exceeds target by at least 5% or more, he will be entitled to receive a bonus of up to 150% of base salary. If target EBITDA is not achieved, but EBITDA for the year is greater than 95% of target, he may receive a bonus at the discretion of the Compensation Committee. The EBITDA targets for Mr. Travis’ bonus are established by the Compensation Committee under the STI Plan. All other named executive officers’ bonuses are established and determined under the STI Plan, as more fully described in the Compensation Discussion and Analysis above. Ms. Lavelle is party to a Transition Services Agreement that governs the terms and conditions of her employment as a non-executive employee and pursuant to which she is entitled to receive an annual base salary of $100,000. This agreement provides that, as a non-executive employee, Ms. Lavelle is no longer entitled to participate in any of the Company’s equity and incentive compensation plans other than vesting of existing awards, but remains able to participate in other benefit plans in accordance with the terms of such plans.
All option awards are granted under the 2006 Equity Incentive Plan and have a 10-year term. Options that are subject only to service-based vesting conditions (tranche 4 options) vest in equal annual installments over five years, beginning on the vesting commencement date (typically, the first anniversary of the grant date) or, if earlier, upon or following a change of control (as described below under “Potential payments upon termination or change of control”). Options that are subject to both performance-based and service-based vesting conditions (tranche 5 options) generally become eligible to vest in equal installments over five years, beginning on the vesting commencement date or, if earlier, upon or following a change of control (as described below under “Potential payments upon termination or change of control”), but will vest and become exercisable only if and when the applicable performance condition is satisfied. The performance condition is satisfied by the Sponsors’ receipt of a targeted return on their initial investment in the Company, measured at the time of a sale or disposition by the Sponsors of all or a portion of the Company. If the Sponsors receive a specified level of investment return on such sale or disposition, the performance condition is met for a percentage of tranche 5 options equal to the percentage of shares sold by the Sponsors to that point. If the performance condition is achieved, but the service condition is not, the tranche remains subject to the time-based vesting schedule described above. Mr. Travis was given vesting credit for both his time-based options and performance-based options for the period of time that elapsed between the date he commenced employment with us and the date his stock options were granted to him, which resulted in 20% of his tranche 4 stock options being fully vested and 20% of his tranche 5 stock options being fully eligible to vest on the date granted.
- 125 -
Table of Contents
Outstanding equity awards at fiscal-year end
The following table summarizes the number of shares of common stock underlying outstanding equity incentive plan awards for each named executive officer as of December 25, 2010:
| Option awards | Stock awards | |||||||||||||||||||||||||||||||||||
| Name | Number of securities underlying unexercised options (#) exercise-able (1) |
Number of securities underlying unexercised options (#) unexercise-able (1) |
Equity (#)(2) |
Option exercise price ($)(3) |
Option expiration date (4) |
Number of shares or units of stock that have not vested (#)(5) |
Market value of shares or units of stock that have not vested ($)(6) |
Equity incentive plan awards: number of unearned shares, units or other rights that have not vested (#)(7) |
Equity incentive plan awards: market or payout value of unearned shares, units or other rights that have not vested ($)(6) |
|||||||||||||||||||||||||||
| Nigel Travis |
750,000 | 3,000,000 | 8,750,000 | $ | 0.66 | 2/23/2020 | — | — | — | — | ||||||||||||||||||||||||||
| Neil Moses |
— | — | — | |||||||||||||||||||||||||||||||||
| Paul Twohig |
— | 255,000 | 595,000 | $ | 0.66 | 2/23/2020 | — | — | — | — | ||||||||||||||||||||||||||
| John Costello |
— | 300,000 | 700,000 | $ | 0.66 | 2/23/2020 | — | — | — | — | ||||||||||||||||||||||||||
| Richard Emmett |
— | 225,000 | 525,000 | $ | 0.66 | 2/23/2020 | — | — | — | — | ||||||||||||||||||||||||||
| Kate Lavelle |
— | — | — | 183,194 | $ | 201,513 | 686,977 | $ | 755,675 | |||||||||||||||||||||||||||
| (1) | Reflects tranche 4 options subject to service-based vesting conditions that vest in accordance with the schedule described above. All options were granted on February 23, 2010. |
| (2) | Reflects tranche 5 options subject to performance-based and service-based vesting conditions for which the performance conditions had not been satisfied as of the end of fiscal 2010, and that will become eligible to vest in accordance with the schedule described above. |
| (3) | The exercise price of stock options is the fair market value of a share of Class A common stock on the grant date, determined by the Board under the 2006 Equity Incentive Plan and based on a valuation provided by an independent valuation firm. |
| (4) | All options have a ten-year term. |
| (5) | Reflects restricted shares granted to Ms. Lavelle that are subject to time-based vesting and that vested on March 1, 2011. Ms. Lavelle’s stock award remained outstanding after her resignation as Chief Financial Officer, as she remained employed by the Company in a part-time capacity. |
| (6) | Market values reflect the fair market value of a share of Class A common stock on December 25, 2010, the last day of our fiscal year ($1.10), as determined by the Board based on a valuation provided by an independent valuation firm. |
| (7) | Reflects restricted shares granted to Ms. Lavelle that are no longer subject to time-based vesting conditions but that remain subject to performance-based vesting conditions. These shares will only vest if the Sponsors receive a certain internal rate of return on their initial investment in the Company. |
- 126 -
Table of Contents
Option exercises and stock vested
The following table provides information relating to vesting of restricted stock for our named executive officers during fiscal 2010. None of our named executive officers exercised stock options during fiscal 2010.
| Name | Option awards | Stock awards | ||||||||||||||
| Number of shares acquired on exercise (#) |
Value realized on exercise ($) |
Number of shares acquired on |
Value realized on vesting ($) (2) |
|||||||||||||
| Nigel Travis |
— | — | — | — | ||||||||||||
| Neil Moses |
— | — | — | — | ||||||||||||
| Paul Twohig |
— | — | — | — | ||||||||||||
| John Costello |
— | — | — | — | ||||||||||||
| Richard Emmett |
— | — | — | — | ||||||||||||
| Kate Lavelle |
— | — | 183,194 | $ | 120,908 | |||||||||||
| (1) | Reflects time-based restricted shares that vested on March 1, 2010. |
| (2) | Value is based on the fair market value of a share of Class A common stock on the vesting date as determined by the Board based on a valuation provided by an independent valuation firm. |
Nonqualified deferred compensation
The following table shows the amounts held by our named executive officers under the Company’s 2005 Non-Qualified Deferred Compensation Plan (the “Deferred Compensation Plan”).
| 2010 NON-QUALIFIED DEFERRED COMPENSATION | ||||||||||||||||||||
| Name | Executive contributions in last fiscal year (1) |
Registrant contributions |
Aggregate earnings in |
Aggregate withdrawals / distributions |
Aggregate balance at |
|||||||||||||||
| Nigel Travis |
$ | 106,000 | — | $ | 7,491 | — | $ | 207,248 | ||||||||||||
| Neil Moses |
— | — | — | — | — | |||||||||||||||
| Paul Twohig |
— | — | — | — | — | |||||||||||||||
| John Costello |
— | — | — | — | — | |||||||||||||||
| Richard Emmett |
$ | 90,000 | — | $ | 10,994 | — | $ | 100,994 | ||||||||||||
| Kate Lavelle |
— | — | — | — | — | |||||||||||||||
| (1) | All amounts deferred by the named executive officers for fiscal 2010 have also been reported in the Summary Compensation Table. |
| (2) | No company contributions or credits were made into this plan for fiscal 2010. |
| (3) | Reflects market-based earnings on amounts credited to participants under the plan. |
The Deferred Compensation Plan is an unfunded, nonqualified deferred compensation plan that is available to executives and key employees of the Company. Under the Deferred Compensation Plan, our named executive officers and other eligible employees can elect to defer each year up to 50% of base salary and up to 100% of the flexible allowance and annual cash incentive awards (with a minimum deferral amount of $5,000). Although the Company has the discretion to provide matching credits under the plan, no matching credits were provided for fiscal 2010. All amounts credited to a participant’s account under the plan are notionally invested in mutual funds or other investments available in the market. The Company does not provide above-market or preferential earnings on deferred compensation. Amounts under the plan are generally distributed in a lump sum upon a participant’s separation from service, disability or a date selected by the participant (at least three years after the year of deferral). A participant who separates from service at or after age 50 may elect to receive distributions in a lump sum or in installments and may defer commencement of distributions following
- 127 -
Table of Contents
separation up to age 65. The Company has established a rabbi trust to assist in meeting a portion of its obligations under the plan. Upon a change in control, the Company will appoint an independent trustee to administer the trust and will fund the trust in an amount sufficient to satisfy all obligations under the plan. In addition, during the 12-month period following a change in control, the Company will continue to maintain the notional investment options available under the plan including, if applicable, any fixed rate fund (using an annual interest equivalent factor equal to the highest factor in effect during the 24 months prior to the change in control).
Potential payments upon termination or change in control
Each of our named executive officers, other than Ms. Lavelle, is entitled to receive certain benefits upon a qualifying termination of employment. Ms. Lavelle is not entitled to any severance pay or benefits under her Transition Services Agreement and is only entitled to accrued but unpaid base salary and benefits upon a termination of employment.
Employment Agreement with Mr. Travis. Mr. Travis’ employment agreement was amended and restated effective May 3, 2011. Under his prior agreement in effect on December 24, 2010, the last business day of our fiscal year, if Mr. Travis’ employment was terminated for performance-based cause, he would have been entitled to receive a lump sum cash payment equal to one year of his annual base salary as of the date of termination. Performance-based cause was defined in Mr. Travis’ agreement generally as a failure by Mr. Travis to perform his duties to the reasonable standards set by the Board, which failure did not rise to the level of “cause.” If Mr. Travis’ employment was terminated other than for cause or performance-based cause or if he resigned for good reason, he would have been entitled to an amount equal to his average salary and performance-based cash bonus during the two years preceding the date his employment terminated and, if such termination or resignation occurred prior to January 20, 2012, the lump sum payment would have been multiplied by two. He was also entitled to a pro-rata bonus for the year in which such termination occurred, determined based on actual performance. In addition, we agreed to contribute to Mr. Travis’ premium costs for participation in our medical and dental plans for eighteen months following employment termination. Mr. Travis’ receipt of these severance benefits was conditioned on his signing and not revoking a full release of claims in favor of the Company.
Under Mr. Travis’ amended and restated employment agreement, if his employment is terminated other than for cause or performance-based cause (as defined above) or if he resigns for good reason, he is entitled to two times the average annual base salary paid to him during the two years preceding the date his employment terminates. If such termination occurs prior to January 6, 2012, he is also entitled to two times the average performance-based cash bonuses paid to him during the two years preceding such termination of employment. All other severance-related terms remain the same as under his original agreement described above.
Ms. Lavelle. As noted above, under Ms. Lavelle’s Transition Services Agreement, she is only entitled to accrued but unpaid base salary and benefits and unreimbursed business expenses upon a termination of employment for any reason.
All Other Named Executive Officers. Messrs. Moses, Twohig, Costello and Emmett had participated in our Executive Severance Pay Plan, which has been terminated and is no longer in effect. Under the terms of this plan as in effect on December 24, 2010, the last business day of our fiscal year, eligible participants were entitled to receive six months of base salary, payable in the same manner and at the same time as the Company’s payroll, upon an involuntary separation from service with the Company. As part of their employment letters, Messrs. Moses, Costello and Emmett were granted 12 months of base salary as a severance benefit under this plan upon a termination of employment other than for cause. In April 2011, we increased
- 128 -
Table of Contents
Mr. Twohig’s severance benefit from six months to twelve months of base salary upon a termination of employment other than for cause. In addition, if a participant under this plan made a timely election to receive COBRA health care continuation coverage, the individual’s monthly COBRA premium for the first three months following the date of termination would equal the premiums paid by an active employee for such coverage immediately prior to the termination date. A participant in the Executive Severance Pay Plan was also entitled to twelve months of outplacement services following separation from service.
Following the termination of the Executive Severance Pay Plan, Messrs. Moses, Twohig, Costello and Emmett are entitled to substantially the same severance benefits upon a termination of employment other than for cause under the terms of each executive’s amended offer letter. Instead of twelve months of outplacement services, they are entitled to six months and the Company may extend these services for an additional six months, in its discretion.
Each named executive officer, upon his or her separation, is also entitled to receive any accrued but unpaid salary and vacation, as well as any earned but unpaid annual bonus for the preceding fiscal year.
The executive officer’s right to receive severance payments and benefits is conditioned upon his or her signing and not revoking a full release of claims in favor of the Company.
Restrictive Covenants. Under the terms of their respective agreements, each named executive officer has agreed to confidentiality obligations during and after employment. Under his employment agreement, Mr. Travis has agreed to non-competition and non-solicitation obligations during and for two years following employment termination. Under her Transition Services Agreement, Ms. Lavelle has agreed to non-competition and non-solicitation obligations during and for two years following employment termination (which period will be reduced to one year if her employment terminates after July 23, 2011). Each other named executive officer has agreed to non-competition and non-solicitation obligations during and for one year following employment termination.
Change in control
All outstanding stock options, including those held by our named executive officers, have change in control vesting provisions. According to the terms of each option grant, eligible participants are entitled to accelerated vesting, immediately upon a change in control, of 50% of their then-unvested time-based (tranche 4) stock options. Any remaining unvested time-based (tranche 4) stock options will vest on the first anniversary of the change in control (so long as the participant remains employed through that date). Similarly, up to 50% of the then-unvested performance-based (tranche 5) stock options would become eligible to vest immediately prior to the change in control, and the remaining performance-based (tranche 5) stock options would become eligible to vest on the first anniversary of the change in control (so long as the participant remains employed through that date). However, performance-based (tranche 5) stock options will only vest upon or following a change in control if the Sponsors realize a specified level of investment return on their initial investment in the Company. Ms. Lavelle’s time-based restricted shares would vest in full upon a change in control, and her performance-based restricted shares will only vest upon a change in control if the Sponsors realize a specified internal rate of return of between 20% and 24% on their initial investment in the Company.
As described above under “Nonqualified deferred compensation”, a change in control will have certain consequences under our Deferred Compensation Plan, including a requirement that the Company contribute additional amounts to the rabbi trust established to satisfy its obligations under this plan.
The Company does not provide tax “gross-ups” on amounts payable in connection with a change of control that are subject to an excise tax on golden parachute payments.
- 129 -
Table of Contents
Summary of potential payments
The following tables summarize the payments that would have been made to our named executive officers upon the occurrence of a qualifying termination of employment or change in control, assuming that each named executive officer’s termination of employment with our Company or a change in control of the Company occurred on December 24, 2010 (the last business day of our fiscal year). If a termination of employment had occurred on this date, severance payments and benefits would have been determined, for Mr. Travis, under his employment agreement in effect on such date (prior to its amendment and restatement) and, for the other named executive officers, under their respective offer letters, as in effect on such date, and our Executive Severance Pay Plan, which is no longer in effect. Should a change in control occur following this offering, there is a possibility of significant payouts of long-term equity incentives as described above and illustrated below. Amounts shown do not include (i) accrued but unpaid salary or bonus and vested benefits, and (ii) other benefits earned or accrued by the named executive officer during his or her employment that are available to all salaried employees and that do not discriminate in scope, terms or operations in favor of executive officers.
None of our named executive officers was entitled to receive any severance payments or benefits upon a voluntary termination (including retirement) or a termination due to death, disability or cause on December 24, 2010, except for earned by unpaid salary, accrued and vested benefits and benefits under any applicable insurance policies.
| Termination of Mr. Travis’ employment | Cash severance (salary continuation) |
Cash incentive plan | Health benefit | Total | ||||||||||||
| Voluntary Termination for Good Reason or Involuntary Termination (other than for Cause or Performance-Based Cause) |
$ | 1,700,000 | $ | 600,000 | $ | 23,864 | $ | 2,323,864 | ||||||||
| Involuntary Termination (for Performance-Based Cause) |
$ | 850,000 | — | — | $ | 850,000 | ||||||||||
| Termination by the company other than for cause | Cash severance (Salary continuation) |
Health benefit | Outplacement benefit(1) |
Total | ||||||||||||
| Neil Moses |
$ | 475,000 | $ | 4,094 | $ | 20,000 | $ | 499,094 | ||||||||
| John Costello |
$ | 500,000 | $ | 2,724 | $ | 20,000 | $ | 522,724 | ||||||||
| Paul Twohig |
$ | 187,500 | $ | 2,724 | $ | 20,000 | $ | 210,224 | ||||||||
| Richard Emmett |
$ | 400,000 | $ | 1,394 | $ | 20,000 | $ | 421,394 | ||||||||
| Change in control | Acceleration of unvested stock |
Acceleration of unvested restricted stock(2) |
Total | |||||||||
| Nigel Travis |
$ | 660,000 | — | $ | 660,000 | |||||||
| Neil Moses |
— | — | — | |||||||||
| John Costello |
$ | 66,000 | — | $ | 66,000 | |||||||
| Paul Twohig |
$ | 56,100 | — | $ | 56,100 | |||||||
| Richard Emmett |
$ | 49,500 | — | $ | 49,500 | |||||||
| Kate Lavelle |
— | $ | 201,513 | $ | 201,513 | |||||||
| (1) | Represents the maximum amount payable to each named executive officer for outplacement services under the Executive Severance Pay Plan, which has been terminated. |
| (2) | Includes outstanding time-based options and time-based restricted shares that would immediately vest upon a change in control. Amounts shown in respect of options assume that the options are cashed out for a payment equal to the difference between the fair market value of a share of Class A common stock ($1.10 per share) and the per share exercise price of the respective options, and that the restricted shares are cashed out at fair market value ($1.10 per share). Although a portion of the performance-based options and restricted shares would have become eligible to vest immediately upon a change in control, the performance conditions associated with such options and restricted shares would not have been satisfied if a change in control had occurred on December 24, 2010. |
- 130 -
Table of Contents
2010 director compensation
The following table sets forth information concerning the compensation earned by our directors during 2010. Directors who are employees of the Company or the Sponsors do not receive any fees for their services as directors. Mr. Travis’ compensation is included above with that of our other named executive officers.
| Name | Fees earned or paid in cash($)(1) |
Total ($) | ||||||
| Jon Luther |
525,000 | 525,000 | ||||||
| (1) | Represents quarterly payments earned in fiscal 2010 under Mr. Luther’s Transition Agreement for services as an outside director and as non-executive Chairman in the amounts of $25,000 and $500,000, respectively. |
Mr. Luther is a party to a Transition Agreement with the Company pursuant to which he is entitled to receive compensation in respect of his service as a member and non-executive Chairman of the Board. The term of this agreement began on July 1, 2010 and ends on June 30, 2013. This agreement entitles him to an outside director’s fee at the rate of $50,000 per year and a fee for serving as Chairman. The Chairman’s fee is equal to $1,000,000 for the period from July 1, 2010 to June 30, 2011, $500,000 for the period from July 1, 2011 to June 30, 2012 and $250,000 for the period from July 1, 2012 to June 30, 2013. The Company accrued in 2010 for the entire amount of fees under this agreement except for the outside director’s fee and each fee is paid quarterly in arrears. The Company has also agreed to reimburse Mr. Luther for certain insurance-related costs during the term of the agreement, including the cost of a Medicare supplemental insurance policy for Mr. Luther and his wife, monthly premium costs for dental insurance and premium costs for basic term life insurance, executive life insurance and whole life insurance. The Company has also agreed to provide him with reimbursement of all reasonable business expenses and administrative support in his role as Chairman. If we terminate Mr. Luther’s service without cause or he ceases to serve as a director due to his death or a failure to be re-elected to the Board and no circumstances exist which would constitute cause, we are obligated to pay the balance of the Board and Chairman fees that would otherwise have been payable through the end of the term. Our obligation to pay such severance benefit is expressly conditioned upon the execution (without revocation) of a timely and effective release of claims. Mr. Luther has agreed not to compete with us and not to solicit our employees and franchisees during his service and for two years following a termination of such service and to not disclose confidential information during and after his service with the Company.
Our board of directors intends to adopt a director compensation program to be effective upon the completion of this offering. Pursuant to this program, each member of our board of directors who is not an employee of the Company will be eligible to receive compensation for his or her service as a director as follows. Each director will receive an annual retainer of $60,000 for Board services. The chair of the Audit Committee will receive an additional annual retainer of $15,000 and the chair of the Compensation Committee will receive an additional annual retainer of $12,500. Directors may elect to take deferred stock units in lieu of cash retainers. In addition, directors will receive an annual grant of restricted stock units with a fair market value equal to $85,000. While we are a “controlled company” for purposes of the NASDAQ Global Select Market, none of the directors affiliated with the Sponsors will be compensated for board service.
Equity incentive plans
2006 Executive Incentive Plan
The following is a description of the material terms of our 2006 Executive Incentive Plan, which we refer to in this summary as the “Plan”. This summary is not a complete description of all provisions of the Plan and is qualified in its entirety by reference to the Plan, which is filed as an exhibit to the registration statement of
- 131 -
Table of Contents
which this prospectus is a part. In connection with the closing of this offering, we expect to grant to 15 employees options to purchase approximately 940,000 shares of common stock in the aggregate, at an exercise price equal to the public offering price, and approximately 300,000 restricted shares in the aggregate. These grants will be made in respect of new hires and promotions. Following this offering, we will no longer make awards under the Plan and will instead make awards under the 2011 Omnibus Long-Term Incentive Plan (described below).
Purpose. The purpose of the Plan is to advance the Company’s interests by providing for the grant to participants of equity and other incentive awards. The awards are intended to align the incentives of our employees and investors and to improve Company performance.
Plan Administration. The Plan is administered by the Compensation Committee. The Compensation Committee has the authority, among other things, to interpret the Plan, to determine eligibility for awards under the Plan, to determine the terms of and grant awards under the Plan, and to do all things necessary to carry out the purposes of the Plan. The Compensation Committee’s determinations under the Plan are conclusive and binding.
Authorized Shares. Subject to adjustment, the maximum number of shares of Class A common stock that may be delivered in satisfaction of awards under the Plan is 55,689,151 (with up to 22,899,228 shares of Class A common stock awarded as restricted stock and up to 32,789,923 shares of Class A common stock delivered in satisfaction of stock options). Shares of common stock to be issued under the Plan may be authorized but unissued shares of common stock or previously-issued shares acquired by the Company or its subsidiaries. Any shares of Class A common stock that do not vest and are forfeited, or that are withheld by the Company in payment of the exercise price of an award or in satisfaction of tax withholding, will again be available for issuance under the Plan.
Eligibility. The Compensation Committee selects participants from among the key employees, directors, consultants and advisors of the Company or its affiliates who are in a position to make a significant contribution to our success. Eligibility for stock options intended to be incentive stock options (ISOs) is limited to employees of the Company or certain affiliates.
Types of Awards. The Plan provides for grants of stock options, restricted and unrestricted stock and stock units, performance awards, and other awards.
| • | Stock options: The exercise price of an option is not permitted to be less than the fair market value (or, in the case of an ISO granted to a 10% shareholder, 110% of the fair market value) of a share of common stock on the date of grant. The Compensation Committee determines the time or times at which stock options become exercisable and the terms on which stock options remain exercisable. |
| • | Restricted and unrestricted stock: A restricted stock award is an award of common stock subject to forfeiture restrictions, while an unrestricted stock award is not subject to restrictions under the Plan. |
| • | Stock units: A stock unit award is denominated in shares of common stock and entitles the participant to receive stock or cash measured by the value of the shares in the future. The delivery of stock or cash under a stock unit may be subject to the satisfaction of performance conditions or other vesting conditions. |
| • | Performance awards: The granting, exercise or vesting of an award may be conditioned on the satisfaction of specified performance criteria. |
| • | Other awards: Other awards that may be settled in stock and cash awards may be granted under the Plan. |
Vesting. The Compensation Committee has the authority to determine the vesting schedule applicable to each award, and to accelerate the vesting or exercisability of any award.
- 132 -
Table of Contents
Termination of Employment. Unless otherwise provided by the Compensation Committee or an award agreement, upon a termination of employment all unvested options and other awards requiring exercise will terminate and all other unvested awards will be forfeited. Vested options remain exercisable for one year following a termination of employment or service due to death or disability and three months following any other termination except a termination for cause (or, if shorter, for the remaining term of the option). If a participant’s service is terminated for cause, all options and other awards requiring exercise, whether or not vested, will terminate upon such termination of service.
Transferability. Awards under the Plan may not be transferred except through will or by the laws of descent and distribution, unless (for awards other than ISOs) otherwise provided by the Compensation Committee.
Additional Restrictions. All awards under the Plan and all shares of common stock issued under the plan are subject to the Stockholders Agreement, described below.
Corporate Transactions. In the event of certain corporate transactions (including the sale of substantially all of the assets or change in ownership of the stock of the Company, reorganization, recapitalization, merger, consolidation, exchange, or other restructuring), the Compensation Committee may provide for continuation or assumption of outstanding awards, for new grants in substitution of outstanding awards, or for the accelerated vesting or delivery of shares under awards, in each case on such terms and with such restrictions as it deems appropriate. Except as otherwise provided in an award agreement, awards not assumed will terminate upon the consummation of such corporate transaction.
Adjustment. The Compensation Committee will adjust the maximum number of shares that may be delivered under the Plan in order to prevent enlargement or dilution of benefits as a result of a stock dividend or similar distribution, stock split or combination, recapitalization, conversion, reorganization, consolidation, split-up, spin-off, combination, merger, exchange, redemption, repurchase, any change in capital structure, or other transaction or event. The Compensation Committee will also make proportionate adjustments to the number and kind of shares of stock or securities subject to awards and any exercise prices or other affected provisions, and may make similar adjustments to take into account distributions or other events to avoid distortion and preserve the value of awards.
In addition, a performance award may provide that performance criteria will be subject to appropriate adjustments reflecting the effect of significant corporate transactions and similar events for the purpose of maintaining the probability that the criteria will be satisfied. Any such adjustment will be made only in the amount deemed reasonably necessary, after consultation with the Company’s accountants, to reflect the direct and measurable effect of such event.
Amendment and Termination. The Compensation Committee may amend the Plan or outstanding awards, or terminate the Plan as to future grants of awards, except that the Compensation Committee may not alter the terms of an award if it would affect adversely a participant’s rights under the award without the participant’s consent (unless expressly provided in the Plan or reserved by the Compensation Committee).
2011 Omnibus Long-Term Incentive Plan
Prior to the completion of this offering, our board of directors intends to adopt an incentive plan to be named the Dunkin’ Brands Group, Inc. 2011 Omnibus Long-Term Incentive Plan (the “Omnibus Plan”). The Omnibus Plan will replace our current Plan, described above under “2006 Executive Incentive Plan” and following this offering, all equity-based awards will be granted under the Omnibus Plan. As of the date of this prospectus, no awards have been made under the Omnibus Plan. The following summary describes the material terms of the Omnibus Plan. This summary is not a complete description of all provisions of the Omnibus Plan and is qualified in its entirety by reference to the Omnibus Plan, which will be filed as an exhibit to the registration statement of which this prospectus is a part.
- 133 -
Table of Contents
Purpose. The purpose of the Omnibus Plan is to advance the Company’s interests by providing for the grant to participants of equity and other incentive awards.
Plan Administration. The Omnibus Plan will be administered by the Compensation Committee. The Compensation Committee will have the authority, among other things, to interpret the Omnibus Plan, to determine eligibility for, grant and determine the terms of awards under the Omnibus Plan, and to do all things necessary to carry out the purposes of the Omnibus Plan. The Compensation Committee’s determinations under the Omnibus Plan will be conclusive and binding.
Authorized Shares. Subject to adjustment, the maximum number of shares of common stock that may be delivered in satisfaction of awards under the Omnibus Plan will be shares. Shares of common stock to be issued under the Omnibus Plan may be authorized but unissued shares of common stock or previously-issued shares acquired by the Company. Any shares of common stock underlying awards that are settled in cash or otherwise expire or become unexercisable without having been exercised or are forfeited to or repurchased by the Company as a result of not having vested, or that are withheld by the Company in payment of the exercise price of an award or in satisfaction of tax withholding, will again be available for issuance under the Omnibus Plan.
Individual Limits. The maximum number of shares of stock for which stock options may be granted and the maximum number of shares of stock subject to stock appreciation rights to any person in any calendar year will each be shares. The maximum number of shares subject to other awards granted to any person in any calendar year will be shares. The maximum amount payable to any person in any twelve-month period under cash awards will be $ .
Eligibility. The Compensation Committee will select participants from among the key employees, directors, consultants and advisors of the Company or its affiliates who are in a position to make a significant contribution to our success. Eligibility for stock options intended to be incentive stock options (ISOs) is limited to employees of the Company or certain affiliates.
Types of Awards. The Omnibus Plan will provide for grants of stock options, stock appreciation rights, restricted and unrestricted stock and stock units, performance awards and cash awards. Dividend equivalents may also be provided in connection with an award under the Omnibus Plan.
| • | Stock options: The exercise price of an option is not permitted to be less than the fair market value (or, in the case of an ISO granted to a ten-percent shareholder, 110% of the fair market value) of a share of common stock on the date of grant. The Compensation Committee will determine the time or times at which stock options become exercisable and the terms on which they remain exercisable. |
| • | Stock appreciation rights: A stock appreciation right is an award that entitles the participant to receive stock or cash upon exercise equal to the excess of the value of the shares subject to the right over the base price. The base price of a stock appreciation right is not permitted to be less than the fair market value of a share of common stock on the date of grant. The Compensation Committee will determine the time or times at which stock appreciation rights become exercisable and the terms on which they remain exercisable. |
| • | Restricted and unrestricted stock: A restricted stock award is an award of common stock subject to forfeiture restrictions, while an unrestricted stock award is not subject to restrictions under the Omnibus Plan. |
| • | Stock units: A stock unit award is denominated in shares of common stock and entitles the participant to receive stock or cash measured by the value of the shares in the future. The delivery of stock or cash under a stock unit may be subject to the satisfaction of performance conditions or other vesting conditions. |
- 134 -
Table of Contents
| • | Performance awards: A performance award is an award the vesting, settlement or exercisability of which is subject to specified performance criteria. Performance awards may be stock-based or cash-based. |
| • | Cash awards: An award that is settled in cash. |
Vesting. The Compensation Committee will have the authority to determine the vesting schedule applicable to each award, and to accelerate the vesting or exercisability of any award.
Termination of Employment. The Compensation Committee will determine the effect of a termination of employment or service on an award. Unless otherwise provided by the Compensation Committee or in an award agreement, upon a termination of employment or service all unvested options and other awards requiring exercise will terminate and all other unvested awards will be forfeited. Unless otherwise provided for by the Compensation Committee, vested options and stock appreciation rights remain exercisable for one year following a termination of employment or service due to death and three months following any other termination of employment or service except a termination for cause (or, if shorter, for the remaining term of the option or stock appreciation right). If a participant’s employment or service is terminated for cause, all options and other awards requiring exercise, whether vested or unvested, will terminate upon such termination of employment or service.
Recovery of Compensation; Other Terms. Awards granted under the Omnibus Plan are subject to forfeiture, termination and rescission, and a participant will be obligated to return to the Company the value received with respect to awards, to the extent provided by the Compensation Committee in an award agreement, pursuant to Company policy relating to the recovery of erroneously-paid incentive compensation, or as otherwise required by law or applicable listing standards.
Performance Criteria. The Omnibus Plan will provide that grants of performance awards, including cash-denominated awards and stock-based awards, will be made based upon, and subject to achieving, “performance criteria” over a performance period, which may be one or more periods as established by the Compensation Committee (provided that cash awards will have a performance period of longer than one year). Performance criteria with respect to those awards that are intended to qualify as performance-based compensation for purposes of Section 162(m) of the Internal Revenue Code are limited to an objectively determinable measure of performance relating to any or any combination of the following (measured either absolutely or by reference to an index or indices or the performance of one or more companies and determined either on a consolidated basis or, as the context permits, on a divisional, subsidiary, line of business, project or geographical basis or in combinations thereof): net sales; systemwide sales; comparable store sales; revenue; revenue growth or product revenue growth; operating income (before or after taxes); pre- or after-tax income or loss (before or after allocation of corporate overhead and bonus); earnings or loss per share; net income or loss (before or after taxes); adjusted operating income; adjusted net income; adjusted earnings per share; channel revenue; channel revenue growth; franchising commitments; manufacturing profit; manufacturing profit margin; store closures; return on equity; total stockholder return; return on assets or net assets; appreciation in and/or maintenance of the price of the shares or any other publicly-traded securities of the Company; market share; gross profits; earnings or losses (including earnings or losses before taxes, before interest and taxes, or before interest, taxes, depreciation and/or amortization); economic value-added models or equivalent metrics; comparisons with various stock market indices; reductions in costs; cash flow or cash flow per share (before or after dividends); return on capital (including return on total capital or return on invested capital); cash flow return on investment; improvement in or attainment of expense levels or working capital levels, including cash, inventory and accounts receivable; operating margin; gross margin; year-end cash; cash margin; debt reduction; stockholders’ equity; operating efficiencies; market share; customer satisfaction; customer growth; employee satisfaction; supply chain achievements (including establishing relationships with manufacturers or suppliers of component materials and manufacturers of the Company’s
- 135 -
Table of Contents
products); points of distribution; gross or net store openings; co-development, co-marketing, profit sharing, joint venture or other similar arrangements; financial ratios, including those measuring liquidity, activity, profitability or leverage; cost of capital or assets under management; financing and other capital raising transactions (including sales of the Company’s equity or debt securities; factoring transactions; sales or licenses of the Company’s assets, including its intellectual property, whether in a particular jurisdiction or territory or globally; or through partnering transactions); implementation, completion or attainment of measurable objectives with respect to research, development, manufacturing, commercialization, products or projects, production volume levels, acquisitions and divestitures; factoring transactions; and recruiting and maintaining personnel.
To the extent consistent with the requirements of Section 162(m), the Compensation Committee may establish that in the case of any award intended to qualify as exempt performance-based compensation under Section 162(m), that one or more of the performance criteria applicable to such award be adjusted in an objectively determinable manner to reflect events (for example, the impact of charges for restructurings, discontinued operations, mergers, acquisitions, extraordinary items, and other unusual or non-recurring items, and the cumulative effects of tax or accounting changes, each as defined by U.S. generally accepted accounting principles) occurring during the performance period of such award that affect the applicable performance criteria.
Transferability. Awards under the plan may not be transferred except through will or by the laws of descent and distribution, unless (for awards other than ISOs) otherwise provided by the Compensation Committee.
Corporate Transactions. In the event of a consolidation, merger or similar transaction, a sale or transfer of all or substantially all of the Company’s assets or a dissolution or liquidation of the Company, the Compensation Committee may, among other things, provide for continuation or assumption of outstanding awards, for new grants in substitution of outstanding awards, or for the accelerated vesting or delivery of shares under awards, in each case on such terms and with such restrictions as it deems appropriate. Except as otherwise provided in an award agreement, awards not assumed will terminate upon the consummation of such corporate transaction.
Adjustment. In the event of certain corporate transactions (including a stock split, stock dividend, recapitalization or other change in the Company’s capital structure that constitutes an equity restructuring within the meaning of FASB ASC Topic 718), the Compensation Committee will make appropriate adjustments to the maximum number of shares that may be delivered under the Omnibus Plan and the individual limits included in the Omnibus Plan, and will also make appropriate adjustments to the number and kind of shares of stock or securities subject to awards, the exercise prices of such awards or any other terms of awards affected by such change. The Compensation Committee will also make the types of adjustments described above to take into account distributions and other events other than those listed above if it determines that such adjustments are appropriate to avoid distortion and preserve the value of awards.
Amendment and Termination. The Compensation Committee will be able to amend the plan or outstanding awards, or terminate the plan as to future grants of awards, except that the Compensation Committee will not be able alter the terms of an award if it would affect materially and adversely a participant’s rights under the award without the participant’s consent (unless expressly provided in the plan or reserved by the Compensation Committee). Shareholder approval will be required for any amendment that would reduce the exercise price of any outstanding option or constitute a repricing that requires shareholder approval under the rules of The NASDAQ Global Select Market and, without such approval, the Compensation Committee will not be permitted to approve a repurchase by the Company for cash or other property of stock options or stock appreciation rights for which the exercise price or base price, as applicable, exceeds the fair market value of a share of common stock on the date of such repurchase.
- 136 -
Table of Contents
Short-term incentive plan
We have established the Dunkin’ Brands, Inc. Short-Term Incentive Plan (the “STI Plan”) for certain of our employees, including our named executive officers, under which performance-based annual bonuses are granted. Annual bonuses under this plan are expressed as a percentage of base salary. Although this plan by its terms will terminate on December 31, 2015, starting with our 2012 fiscal year, annual bonuses to our named executive officers and other key employees will be granted under the Dunkin’ Brands Group, Inc. Annual Incentive Plan described below.
The Compensation Committee administers the STI Plan, as it relates to our executive officers, and the Senior Vice President, Chief Human Resources Officer administers the STI Plan for all other eligible employee participants. Although the STI Plan does not mandate the use of any particular performance goal, the funding of the bonus pool under this plan has been based on achievement of Dunkin’ Brands, Inc. global EBITDA for the relevant fiscal year. The Compensation Committee establishes the EBITDA targets under the STI Plan at the beginning of the fiscal year and determines the size of the pool available for bonuses to be paid under this plan. The Compensation Committee then determines the amounts of the bonuses payable to our executive officers based on the achievement of the EBITDA goal, together with other pre-established financial or operational business goals as well as each executive officer’s achievement of his or her personal goals. The Senior Vice President, Chief Human Resources Officer, has the authority to do the same for the other participants.
An individual must generally be employed by us on the payment date for the relevant performance period to be entitled to incentive compensation under the STI Plan. If an executive’s employment is terminated prior to such date as a result of death, retirement or extended disability, a pro-rata amount of the bonus may be paid.
As noted above in the discussion following the “Grants of plan-based awards in 2010” table, Mr. Travis’ bonus is determined in connection with the terms of his employment agreement.
Dunkin’ Brands Group, Inc. Annual Incentive Plan
Prior to the completion of this offering, our board of directors intends to adopt the Dunkin’ Brands Group, Inc. Annual Incentive Plan (the “Annual Plan”). Starting with our 2012 fiscal year, annual award opportunities for executive officers, including our named executive officers and other employees will be granted under the Annual Plan. The Annual Plan is intended to comply with the requirements for tax deductibility imposed by Section 162(m) of the Internal Revenue Code, to the extent applicable. The following summary describes the material terms of the Annual Plan. This summary is not a complete description of all provisions of the Annual Plan and is qualified in its entirety by reference to the Annual Plan, which will be filed as an exhibit to the registration statement of which this prospectus is a part.
Administration. The Annual Plan will be administered by the Compensation Committee. The Compensation Committee has authority to interpret the Annual Plan, and any interpretation or decision by the Compensation Committee with regard to any questions arising under the Annual Plan is final and conclusive on all participants.
Eligibility. Executive officers and other employees of the Company and its affiliates will be selected from time to time by the Compensation Committee to participate in the Annual Plan.
Awards. Award opportunities under the Annual Plan will be granted by the Compensation Committee prior to, or within a specified period of time following the beginning of, the fiscal year of the Company (or other performance period selected by the Compensation Committee). The Compensation Committee will establish the performance criteria applicable to the award, the amount or amounts payable if the performance criteria are achieved, and such other terms and conditions as the Compensation Committee deems appropriate. The Annual
- 137 -
Table of Contents
Plan permits the grant of awards that are intended to qualify as exempt performance-based compensation under Section 162(m) of the Internal Revenue Code as well as awards that are not intended to so qualify. Any awards that are intended to qualify as performance-based compensation will be administered in accordance with the requirements of Section 162(m).
Performance Criteria. Awards under the Annual Plan will be made based on, and subject to achieving, “performance criteria” established by the Compensation Committee. Performance criteria for awards intended to qualify as performance-based compensation for purposes of Section 162(m) of the Internal Revenue Code are limited to the objectively determinable measures of performance relating to any or any combination of the following (measured either absolutely or by reference to an index or indices or the performance of one or more companies and determined either on a consolidated basis or, as the context permits, on a divisional, subsidiary, line of business, project or geographical basis or in combinations thereof): net sales; systemwide sales; comparable store sales; revenue; revenue growth or product revenue growth; operating income (before or after taxes); pre- or after-tax income or loss (before or after allocation of corporate overhead and bonus); earnings or loss per share; net income or loss (before or after taxes); adjusted operating income; adjusted net income; adjusted earnings per share; channel revenue; channel revenue growth; franchising commitments; manufacturing profit; manufacturing profit margin; store closures; return on equity; total stockholder return; return on assets or net assets; appreciation in and/or maintenance of the price of the shares or any other publicly-traded securities of the Company; market share; gross profits; earnings or losses (including earnings or losses before taxes, before interest and taxes, or before interest, taxes, depreciation and/or amortization); economic value-added models or equivalent metrics; comparisons with various stock market indices; reductions in costs; cash flow or cash flow per share (before or after dividends); return on capital (including return on total capital or return on invested capital); cash flow return on investment; improvement in or attainment of expense levels or working capital levels, including cash, inventory and accounts receivable; operating margin; gross margin; year-end cash; cash margin; debt reduction; stockholders’ equity; operating efficiencies; market share; customer satisfaction; customer growth; employee satisfaction; supply chain achievements (including establishing relationships with manufacturers or suppliers of component materials and manufacturers of the Company’s products); points of distribution; gross or net store openings; co-development, co-marketing, profit sharing, joint venture or other similar arrangements; financial ratios, including those measuring liquidity, activity, profitability or leverage; cost of capital or assets under management; financing and other capital raising transactions (including sales of the Company’s equity or debt securities; factoring transactions; sales or licenses of the Company’s assets, including its intellectual property, whether in a particular jurisdiction or territory or globally; or through partnering transactions); implementation, completion or attainment of measurable objectives with respect to research, development, manufacturing, commercialization, products or projects, production volume levels, acquisitions and divestitures; factoring transactions; and recruiting and maintaining personnel.
To the extent consistent with the requirements of Section 162(m), the Compensation Committee may establish that in the case of any award intended to qualify as exempt performance-based compensation under Section 162(m), that one or more of the performance criteria applicable to such award be adjusted in an objectively determinable manner to reflect events (for example, the impact of charges for restructurings, discontinued operations, mergers, acquisitions, extraordinary items, and other unusual or non-recurring items, and the cumulative effects of tax on accounting changes, each as defined by U.S. generally accepted accounting principles) occurring during the performance period of such award that affect the applicable performance criteria.
Payment. A participant will be entitled to payment under an award only if all conditions to payment have been satisfied in accordance with the Annual Plan and the terms of the award. Following the close of the performance period, the Compensation Committee will determine (and, to the extent required by
- 138 -
Table of Contents
Section 162(m), certify) whether and to what extent the applicable performance criteria have been satisfied. The Compensation Committee will then determine the actual payment, if any, under each award. The Compensation Committee has the sole and absolute discretion to reduce (including to zero) the actual payment to be made under any award. The Compensation Committee will determine the payment dates for awards under the Annual Plan. No payment will be made under an award unless the participant remains employed by the Company on the payment date, except as otherwise provided by the Compensation Committee. The Compensation Committee may permit a participant to defer payment of an award under the Company’s Deferred Compensation Plan or otherwise.
Payment Limits. The maximum payment to any participant under the Annual Plan for any fiscal year will in no event exceed $5 million.
Recovery of Compensation. Awards under the Annual Plan will be subject to forfeiture, termination and rescission, and a participant who receives a payment pursuant to the Annual Plan will be obligated to return to the Company such payment, to the extent provided by the Compensation Committee in an award agreement, pursuant to Company policy relating to the recovery of erroneously-paid incentive compensation, or as otherwise required by law or applicable stock exchange listing standards.
Amendment and Termination. The Compensation Committee may amend the Annual Plan at any time, provided that any amendment will be approved by the Company’s stockholders if required by Section 162(m) of the Internal Revenue Code. The Compensation Committee may terminate the Annual Plan at any time.
- 139 -
Table of Contents
Arrangements with our investors
In 2006, in connection with the consummation of our acquisition by investment funds affiliated with the Sponsors (the “Acquisition”), we entered into a stockholder agreement, an investor agreement and a registration rights and coordination agreement with certain of the stockholders of the Company. These agreements contained agreements among the parties with respect to election of directors, participation rights, restrictions on transfer of shares, tag along rights, drag along rights, a call right exercisable by us upon departure of a manager, a right of first offer upon disposition of shares, registration rights and other actions requiring the approval of stockholders. In addition, we entered into a management agreement with certain affiliates of each of the Sponsors for the provision of certain consulting and management advisory services to us.
Investor agreement
In connection with the Acquisition, we entered into an investor agreement with the Sponsors. In connection with the consummation of this offering, the investor agreement will be amended and restated, effective upon the closing of this offering. The investor agreement as amended will grant each of the Sponsors the right, subject to certain conditions, to name representatives to our board of directors and committees of our board of directors. Each Sponsor will have the right to designate two nominees for election to our board of directors until such time as that Sponsor owns less than 10% of our outstanding common stock, and then may designate one nominee for election to our board of directors until such time as that Sponsor’s ownership level falls below 3% of our outstanding common stock. In addition, the Sponsors will have certain contractual rights to have their nominees serve on our compensation committee. Subject to the terms of the investor agreement, each Sponsor agrees to vote its shares in favor of the election of the director nominees designated by the other Sponsors pursuant to the investor agreement. In addition, the investor agreement will provide each of the Sponsors with certain tag along rights in the event of certain transfers by any of the Sponsors of shares of our common stock held by them.
Stockholders agreement
In connection with the Acquisition, we entered into a stockholder agreement with the Sponsors and certain other investors, stockholders and executive officers. In connection with the consummation of this offering, all of the provisions of the stockholder agreement, other than those relating to lock-up obligations in connection with registered offerings of our securities, will have been terminated in accordance with the terms of the stockholder agreement and the agreement will be amended and restated to eliminate the terminated provisions.
Registration rights and coordination agreement
In connection with the Acquisition, we entered into a registration rights and coordination agreement with the Sponsors and certain other stockholders. In connection with the consummation of this offering, the registration rights and coordination agreement will be amended, effective upon the closing of this offering. The registration rights and coordination agreement, as amended, will provide the Sponsors with certain demand registration rights following the expiration of the 180-day lockup period in respect of the shares of our common stock held by them. In addition, in the event that we register additional shares of common stock for sale to the public following the consummation of this offering, we will be required to give notice of such registration to the Sponsors and the other stockholders party to the agreement of our intention to effect such a registration, and,
- 140 -
Table of Contents
subject to certain limitations, the Sponsors and such holders will have piggyback registration rights providing them with the right to require us to include shares of common stock held by them in such registration. We will be required to bear the registration expenses, other than underwriting discounts and commissions and transfer taxes, associated with any registration of shares by the Sponsors or other holders described above. The registration rights and coordination agreement will also contain certain restrictions on the sale of shares by the Sponsors. Following this offering, each of the Sponsors has agreed to coordinate with the other Sponsors with respect to the transfer of shares of our common stock pursuant to Rule 144 under the Securities Act or by block sale to a financial institution. This coordination will provide each Sponsor with the right to participate in any such sale or transfer pro rata based on its percentage ownership at the time of such event. The registration rights and coordination agreement includes customary indemnification provisions in favor of any person who is or might be deemed a controlling person within the meaning of Section 15 of the Securities Act or Section 20 of the Exchange Act, who we refer to as controlling persons, and related parties against liabilities under the Securities Act incurred in connection with the registration of any of our debt or equity securities. These provisions provide indemnification against certain liabilities arising under the Securities Act and certain liabilities resulting from violations of other applicable laws in connection with any filing or other disclosure made by us under the securities laws relating to any such registrations. We have agreed to reimburse such persons for any legal or other expenses incurred in connection with investigating or defending any such liability, action or proceeding, except that we will not be required to indemnify any such person or reimburse related legal or other expenses if such loss or expense arises out of or is based on any untrue statement or omission made in reliance upon and in conformity with written information provided by such person.
Management agreement
In connection with the Acquisition, we entered into a management agreement with certain affiliates of each of the Sponsors (the “Management Companies”), pursuant to which the Management Companies provide us with certain consulting and management advisory services. In exchange for these services, we pay the Management Companies an aggregate annual management fee equal to $3.0 million, and we reimburse the Management Companies for out-of-pocket expenses incurred by them, their members, or their respective affiliates in connection with the provision of services pursuant to the management agreement. In addition, the Management Companies are entitled to a transaction fee in connection with any financing, acquisition, disposition or change of control transaction equal to 1% of the gross transaction value, including assumed liabilities, for such transaction. In connection with the termination of the management agreement, the Management Companies will waive any right to receive a transaction fee under the management agreement in connection with this offering. The management agreement includes customary exculpation and indemnification provisions in favor of the Management Companies, the Sponsors and their respective affiliates. The management agreement may be terminated by any two of the Management Companies at any time and will terminate immediately prior to an initial public offering or a change of control, in any such case unless two of the Management Companies determine otherwise. In connection with this offering, the management agreement will be terminated in exchange for a payment to the Management Companies of approximately $14 million, which amount is approximately equal to the net present value of the aggregate amount of the annual management fees that would have been payable in the five years following such termination. The indemnification and exculpation provisions in favor of the Management Companies will survive such termination.
- 141 -
Table of Contents
We and our subsidiaries have debt outstanding under a senior credit facility and the senior notes.
Senior credit facility
General
On November 23, 2010, Dunkin’ Brands, Inc. (“DBI”) entered into a $1.35 billion senior credit facility with Barclays Bank PLC as administrative agent and the other lenders party thereto. The senior credit facility originally consisted of a $1.25 billion term loan facility and a $100.0 million revolving credit facility. On February 18, 2011, we amended the senior credit facility to increase the size of the term loan facility to $1.40 billion and to make certain other changes to the pricing terms and certain covenants. On May 24, 2011, we further amended the senior credit facility to increase the size of the term loan facility by an additional $100 million to approximately $1.50 billion and to provide for a reduction to certain revolving credit facility pricing terms contingent upon the consummation of a qualifying initial public offering and a further reduction on the entire senior credit facility upon satisfying a maximum leverage ratio of 5.10 to 1.00.
The senior credit facility provides that DBI has the right at any time to request additional loans and commitments, and to the extent that the aggregate amount of such additional loans and commitments exceeds $350 million, the incurrence thereof is subject to a first lien leverage ratio being no greater than 3.75 to 1.00 or, in the case of loans secured by junior liens, a senior secured leverage ratio being no greater than 4.00 to 1.00. The lenders under these facilities are not under any obligation to provide any such additional term loans or commitments, and any additional term loans or increase in commitments are subject to several conditions precedent and limitations.
Interest rates and fees
Borrowings under the senior credit facility bear interest at a rate per annum equal to an applicable margin plus, at our option, either (1) a base rate determined by reference to the highest of (a) the Federal Funds rate plus 1/2 of 1%, (b) the prime rate of Barclays Bank PLC (c) the LIBOR rate plus 1% and (d) 2.25% in the case of term loans or 2.50% in the case of swing line or revolving credit loans or (2) a LIBOR rate determined by reference to the costs of funds for U.S. dollar deposits for the interest period relevant to such borrowing adjusted for certain additional costs provided that LIBOR shall not be lower than 1.25% in the case of term loans or 1.50% in the case of revolving credit loans. The applicable margin under the term loan facility is 2.00% for loans based upon the base rate and 3.00% for loans based upon the LIBOR rate. The applicable margin under the revolving credit facility ranges from 2.75% to 3.25% for loans based upon the base rate and ranges from 3.75% to 4.25% for loans based upon the LIBOR rate, in each case based upon on specified leverage ratios. Upon the consummation of this offering, (a) the applicable margin under the revolving credit facility will be reduced to match the term loans, which is 2.00% for loans based upon the base rate, and 3.00% for loans based upon the LIBOR rate, (b) the minimum base rate under the revolving credit facility will be reduced from 2.50% to 2.25%, to match the term loan facility and (c) the minimum LIBOR rate under the revolving credit facility will be reduced from 1.50% to 1.25%, to match the term loan facility. In addition, following the consummation of this offering, if the leverage ratio is less than or equal to 5.10 to 1.00, the minimum base rate and minimum LIBOR rate for borrowings under the term loan facility and revolving credit facility will be permanently reduced by 0.25% to 2.00% in the case of base rate loans and 1.00% in the case of LIBOR rate loans.
In addition to paying interest on outstanding principal under the senior credit facility, we are required to pay a commitment fee to the lenders under the revolving credit facility in respect of the unutilized commitments thereunder at a rate of 0.50% per annum. We also pay customary letter of credit and agency fees.
- 142 -
Table of Contents
Mandatory repayments
The credit agreement governing the senior credit facility requires DBI to prepay outstanding term loans, subject to certain exceptions, with: (1) 100% of the net cash proceeds of any incurrence of indebtedness by DBI or its restricted subsidiaries other than certain indebtedness permitted under the senior credit facility, (2) commencing with the fiscal year ended December 31, 2011, 50% (which percentage will be reduced to 25% if our total leverage ratio is less than 5.25 to 1.00 and to 0% if our total leverage ratio is less than 4.00 to 1.00) of annual excess cash flow (as defined in the credit agreement governing the senior credit facility), and (3) 100% of the net cash proceeds of non-ordinary course asset sales or other dispositions of assets (including casualty events) by DBI or its restricted subsidiaries, subject to reinvestment rights and certain other exceptions.
In general, the mandatory prepayments described above are applied first, in direct order of maturities, to scheduled principal amortization payments due in the next twelve months, second, pro rata to the remaining scheduled principal amortization payments, and third, to the principal payment due on the final maturity date in November 2017.
Voluntary repayments
We may voluntarily repay outstanding loans under the senior credit facility at any time subject to customary “breakage” costs with respect to LIBOR loans and a prepayment premium on the senior credit facility equal to 1% in connection with a refinancing of all or a portion of the term loan facility prior to February 18, 2012 or the revolving credit loans prior to November 23, 2011, in each case with loans bearing a lower effective interest cost or weighted average yield or a similar repricing transaction; provided that no such prepayment premium shall be required with respect to a refinancing or similar transaction that is consummated substantially concurrently with or after an underwritten registered primary public offering of our common stock.
Amortization and final maturity
The term loan facility amortizes each year in an amount equal to 1% per annum in equal quarterly installments for the first six and three quarter years, with the balance payable on the seventh anniversary of the closing date of the senior credit facility. The principal amount outstanding of the loans under the revolving credit facility becomes due and payable on the fifth anniversary of the closing date of the senior credit facility.
Guarantees and security
The senior credit facility is guaranteed by Dunkin’ Brands Holdings, Inc. (“DBHI”) and certain of DBI’s direct and indirect wholly owned domestic subsidiaries (excluding certain immaterial subsidiaries and subject to certain other exceptions), and is required to be guaranteed by certain of DBI’s future domestic wholly owned subsidiaries. All obligations under the senior credit facility and the guarantees of those obligations, subject to certain exceptions, including that mortgages will be limited to owned real property with a fair market value above a specified threshold, are secured by substantially all of the assets of DBHI, DBI and the subsidiary guarantors, including a first-priority pledge of 100% of certain of the capital stock or equity interests held by DBHI, DBI or any subsidiary guarantor (which pledge, in the case of the stock of any foreign subsidiary (each such entity, a “Pledged Foreign Sub”) (with certain agreed-upon exceptions) and the equity interests of certain U.S. subsidiaries that hold capital stock of foreign subsidiaries and are disregarded entities for U.S. federal income tax purposes (each such entity, a “Pledged U.S. DE”) (with certain agreed-upon exceptions), is limited to 65% of the stock or equity interests of such Pledged Foreign Sub or Pledged U.S. DE, as the case may be), in each case excluding any interests in non-wholly owned restricted subsidiaries (including joint ventures) to the extent such a pledge would violate the governing documents thereof and certain other exceptions; and a first-priority security interest in substantially all other tangible and intangible assets of DBHI, DBI and each subsidiary guarantor.
- 143 -
Table of Contents
Covenants and other matters
The senior credit facility contains a number of covenants that, among other things and subject to certain exceptions, restrict the ability of DBI and its restricted subsidiaries to:
| • | incur certain liens; |
| • | make investments, loans, advances and acquisitions; |
| • | incur additional indebtedness; |
| • | pay dividends on capital stock or redeem, repurchase or retire capital stock or certain other indebtedness; |
| • | engage in transactions with affiliates; |
| • | sell assets, including capital stock of its subsidiaries; |
| • | alter the business we conduct; |
| • | enter into agreements restricting our restricted subsidiaries’ ability to pay dividends; and |
| • | consolidate or merge. |
In addition, the credit agreement governing the senior credit facility requires DBI and its restricted subsidiaries to comply on a quarterly basis with the following financial covenants:
| • | a maximum total leverage ratio; and |
| • | a minimum interest coverage ratio. |
These financial covenants become more restrictive over time.
The credit agreement governing the senior credit facility contains certain customary affirmative covenants and events of default.
This summary describes the material provisions of the senior credit facility, but may not contain all information that is important to you. We urge you to read the provisions of the credit agreement governing the senior credit facility, which has been filed as an exhibit to the registration statement of which this prospectus forms a part. See “Where you can find more information.”
Senior notes
General
On November 23, 2010, DBI issued $625.0 million face amount of 9 5/8% senior notes that mature on December 1, 2018. On February 18, 2011, DBI increased its term loan facility by $150.0 million and used the proceeds to redeem an equal amount of senior notes. On May 24, 2011, DBI further increased its term loan facility by $100.0 million and will use the proceeds to redeem an equal amount of senior notes. Interest on the outstanding senior notes is payable semi-annually at a rate of 9 5/8% in arrears on June 1 and December 1 of each year, commencing on June 1, 2011. The outstanding senior notes are guaranteed, jointly and severally, on an unsecured basis by certain of the existing and future wholly-owned domestic subsidiaries of DBI.
Covenants
The indenture governing the outstanding senior notes contain a number of covenants that, among other things and subject to certain exceptions, restrict DBI’s ability and the ability of its restricted subsidiaries to:
| • | incur certain liens; |
| • | make investments, loans, advances and acquisitions; |
- 144 -
Table of Contents
| • | incur additional indebtedness; |
| • | pay dividends on capital stock or redeem, repurchase or retire capital stock or any subordinated indebtedness; |
| • | engage in transactions with affiliates; |
| • | sell assets, including capital stock of DBI’s subsidiaries; |
| • | enter into agreements restricting DBI’s restricted subsidiaries’ ability to pay dividends; and |
| • | consolidate, merge or transfer all or substantially all of DBI’s assets and the assets of its subsidiaries. |
The senior notes were originally issued in a private placement. DBI has agreed to file a registration statement with the SEC to permit either the exchange of the original notes for registered notes having substantially the same terms, or the registered resale of the original notes. The exchange of notes or registration covering resales of the original notes must be completed by November 2011 or additional interest may accrue, not to exceed 1.0% per annum.
Optional redemption
DBI may redeem the outstanding senior notes, in whole or in part, at the redemption prices (expressed as percentages of principal amount of senior notes to be redeemed) set forth below, plus accrued and unpaid interest thereon to the redemption date, if redeemed on or after any of the dates below until the subsequent date below:
| Year | Percentage | |||
| November 23, 2010 |
100.50% | |||
| December 1, 2011 |
102.50% | |||
| December 1, 2012 |
102.00% | |||
| December 1, 2013 and thereafter |
100.00% | |||
If DBI experiences certain kinds of changes in control, DBI must offer to purchase the outstanding senior notes at 101% of their principal amount, plus accrued and unpaid interest.
Asset sales
If DBI or its restricted subsidiaries engage in certain asset sales, DBI generally must either invest the net cash proceeds from such sales in its business within a period of time, prepay certain debt or make an offer to purchase a principal amount of the outstanding senior notes equal to the excess net cash proceeds, subject to certain exceptions. The purchase price of the outstanding senior notes will be 100% of their principal amount, plus accrued and unpaid interest.
This summary describes the material provisions of the senior notes but may not contain all information that is important to you. We urge you to read the provisions of the indenture governing these senior notes, which has been filed as an exhibit to the registration statement of which this prospectus forms a part. See “Where you can find more information.”
- 145 -
Table of Contents
The following table sets forth information regarding the beneficial ownership of our common stock as of , 2011 by (i) such persons known to us to be beneficial owners of more than 5% of our common stock, (ii) each of our directors and named executive officers, and (iii) all of our directors and executive officers as a group.
Prior to this offering, our stockholders agreements provided that significant corporate decisions, including the election of directors, were required to be taken in accordance with the direction of investment funds affiliated with the Sponsors. In connection with this offering, many of these provisions of the stockholders agreements will terminate. See “Related party transactions – Arrangements with our investors.”
Unless otherwise indicated below, the address for each listed director, officer and stockholder is c/o Dunkin’ Brands Group, Inc. 130 Royall Street, Canton, Massachusetts 02021. Beneficial ownership has been determined in accordance with the applicable rules and regulations promulgated under the Exchange Act. The information is not necessarily indicative of beneficial ownership for any other purpose. Under these rules, beneficial ownership includes any shares as to which the individual or entity has sole or shared voting or investment power and any shares as to which the individual or entity has the right to acquire beneficial ownership within 60 days after , 2011 through the exercise of any stock option, warrant or other right. For purposes of calculating each person’s or group’s percentage ownership, shares of common stock issuable pursuant to stock options exercisable within 60 days after , 2011 are included as outstanding and beneficially owned for that person or group but are not treated as outstanding for the purpose of computing the percentage ownership of any other person or group. The inclusion in the following table of those shares, however, does not constitute an admission that the named stockholder is a direct or indirect beneficial owner. To our knowledge, except under applicable community property laws or as otherwise indicated, the persons named in the table have sole voting and sole investment control with respect to all shares shown as beneficially owned. For more information regarding the terms of our common stock, see “Description of capital stock.” For more information regarding our relationship with certain of the persons named below, see “Related party transactions.”
- 146 -
Table of Contents
The numbers listed below are based on shares of our common stock outstanding as of , 2011 after giving effect to the reclassification as if it occurred on that date. The actual number of shares of common stock to be issued to each holder of Class L common stock in the reclassification is subject to change based on any changes to the initial public offering price and the date of the pricing of this offering. See “The reclassification.”
| Name and address of beneficial owner |
Shares owned before the offering |
Shares owned after the offering |
||||||||||||||
| Number | Percentage | Number | Percentage | |||||||||||||
| Beneficial owners of 5% or more of our common stock: |
||||||||||||||||
| Bain Capital Integral Investors 2006, LLC |
||||||||||||||||
| Carlyle Partners IV, L.P. |
||||||||||||||||
| Thomas H. Lee Equity Fund V, L.P. |
||||||||||||||||
| Directors and Named Executive Officers: |
||||||||||||||||
| Nigel Travis (4) |
||||||||||||||||
| Neil Moses (5) |
||||||||||||||||
| John Costello (6) |
||||||||||||||||
| Richard Emmett (7) |
||||||||||||||||
| Kate Lavelle (8) |
||||||||||||||||
| Paul Twohig (9) |
||||||||||||||||
| Jon Luther (10) |
||||||||||||||||
| Todd Abbrecht (11) |
||||||||||||||||
| Andrew Balson (12) |
||||||||||||||||
| Anita Balaji (13) |
||||||||||||||||
| Anthony DiNovi (11) |
||||||||||||||||
| Sandra Horbach (13) |
||||||||||||||||
| Mark Nunnelly (12) |
||||||||||||||||
| All executive officers and directors as a group (23 persons) (4)(5)(6)(7)(8)(9)(10) |
||||||||||||||||
| * | Indicated less than 1% |
| (1) | The shares included in the table consist of: (i) shares of common stock owned by Bain Capital Integral Investors 2006, LLC, whose administrative member is Bain Capital Investors, LLC (“BCI”); (ii) shares of common stock owned by BCIP TCV, LLC, whose administrative member is BCI; and (iii) shares of common stock held by BCIP Associates-G, whose managing general partner is BCI. As a result of the relationships described above, BCI may be deemed to share beneficial ownership of the shares held by each of Bain Capital Integral Investors 2006, LLC, BCIP TCV, LLC and BCIP Associates-G (collectively, the “Bain Capital Entities”). Voting and investment determinations with respect to the shares held by the Bain Capital Entities are made by an investment committee comprised of the following managing directors of BCI: Andrew Balson, Steven Barnes, Joshua Bekenstein, John Connaughton, Todd Cook, Paul Edgerley, Christopher Gordon, Blair Hendrix, Jordan Hitch, Matthew Levin, Ian Loring, Philip Loughlin, Mark Nunnelly, Stephen Pagliuca, Ian Reynolds, Mark Verdi, Michael Ward and Stephen Zide. As a result, and by virtue of the relationships described in this footnote, the investment committee of BCI may be deemed to exercise voting and dispositive power with respect to the shares held by the Bain Capital Entities. Each of the members of the investment committee of BCI disclaims beneficial ownership of such shares. Each of the Bain Capital Entities has an address c/o Bain Capital Partners, LLC, 111 Huntington Avenue, Boston, MA 02199. |
| (2) | The shares included in the table consist of: (i) shares of common stock owned by Carlyle Partners IV, L.P.; and (ii) shares of common stock owned by CP IV Coinvestment, L.P. (collectively, the “Carlyle Funds”). TC Group IV, L.P. is the sole general partner of Carlyle Partners IV, L.P. and CP IV Coinvestment, L.P. TC Group IV Managing GP, L.L.C. is the sole general partner of TC Group IV, L.P. TC Group, L.L.C. is the sole managing member of TC Group IV Managing GP, L.L.C. TCG Holdings, L.L.C. is the managing member of TC Group, L.L.C. Accordingly, TC Group IV, L.P., TC Group IV Managing GP, L.L.C., TC Group, L.L.C. and TCG Holdings, L.L.C. each may be deemed to share beneficial ownership of the shares of our common stock owned of record by each of the Carlyle Funds, William E. Conway, Jr., Daniel A. D’Aniello and David M. Rubenstein are managing members of TCG Holdings, L.L.C. and, in such capacity, may be deemed to share beneficial ownership of shares of our common stock beneficially owned by TCG Holdings, L.L.C. Such individuals expressly disclaim any such beneficial ownership. Each of the Carlyle Funds has an address c/o The Carlyle Group, 1001 Pennsylvania Avenue, N.W., Suite 200 South, Washington, D.C. 20004-2505. |
- 147 -
Table of Contents
| (3) | The shares included in the table consist of: (A)(i) shares of common stock owned by Thomas H. Lee Equity Fund V, L.P.; (ii) shares of common stock owned by Thomas H. Lee Parallel Fund V, L.P.; and (iii) shares of common stock owned by Thomas H. Lee Equity (Cayman) Fund V, L.P. (collectively, the “THL Funds”), (B) shares of common stock owned by Thomas H. Lee Investors Limited Partnership (the “THL Co-Invest Fund”), and (C)(i) shares of common stock owned by Putnam Investments Employees’ Securities Company I, LLC; (ii) shares of common stock owned by Putnam Investments Employees’ Securities Company II, LLC; and (iii) shares of common stock owned by Putnam Investment Holdings, LLC (collectively, the “Putnam Funds”). The THL Funds’ general partner is THL Equity Advisors V, LLC, whose sole member is Thomas H. Lee Partners, L.P., whose general partner is Thomas H. Lee Advisors, LLC (collectively, the “THL Advisors”). Shares held by the THL Funds may be deemed to be beneficially owned by the THL Advisors. The THL Advisors disclaim any beneficial ownership of any shares held by the THL Funds. The general partner of the THL Co-Invest Fund is THL Investment Management Corp. The Putnam Funds are co-investment entities of the THL Funds. Putnam Investment Holdings, LLC (“Holdings”) is the managing member of Putnam Investments Employees’ Securities Company I, LLC (“ESC I”) and Putnam Investments Employees’ Securities Company II, LLC (“ESC II”). Holdings disclaims any beneficial ownership of any shares held by ESC I or ESC II. Putnam Investments LLC, the managing member of Holdings, disclaims beneficial ownership of any shares held by the Putnam Funds. The Putnam Funds and the THL Co-Invest Fund are contractually obligated to co-invest (and dispose of securities) alongside the THL Funds on a pro rata basis. Voting and investment control over securities that the THL Funds own are acted upon by majority vote of the members of a ten-member committee, the members of which are Todd M. Abbrecht, Charles A. Brizius, Anthony J. DiNovi, Thomas M. Hagerty, Scott L. Jaeckel, Seth W. Lawry, Soren L. Oberg, Scott A. Schoen, Scott M. Sperling and Kent R. Weldon, each of whom disclaims beneficial ownership of the shares of common stock included in the table. Each of the THL Funds and the THL Co-Invest Fund has an address c/o Thomas H. Lee Partners, L.P., 100 Federal Street, 35th Floor, Boston, Massachusetts 02110. Each of the Putnam Funds has an address c/o Putnam Investment, Inc., 1 Post Office Square, Boston, Massachusetts 02109. |
| (4) | Includes shares of common stock that can be acquired upon the exercise of outstanding options and shares of restricted common stock subject to vesting conditions. |
| (5) | Includes shares of restricted common stock subject to vesting conditions. |
| (6) | Includes shares of common stock that can be acquired upon the exercise of outstanding options and shares of restricted common stock subject to vesting conditions. |
| (7) | Includes shares of common stock that can be acquired upon the exercise of outstanding options and shares of restricted common stock subject to vesting conditions. |
| (8) | Includes shares of restricted common stock subject to vesting conditions. |
| (9) | Includes shares of common stock that can be acquired upon the exercise of outstanding options and shares of restricted common stock subject to vesting conditions. |
| (10) | Includes shares of restricted common stock subject to vesting conditions. |
| (11) | Does not include shares of common stock held by the THL Funds, the THL Co-Invest Fund or the Putnam Funds. Each of Messrs. Abbrecht and DiNovi is a Managing Director of Thomas H. Lee Partners, L.P. and Mr. DiNovi is the Co-President of Thomas H. Lee Partners, L.P. In addition, each of Messrs. Abbrecht and DiNovi serves on the ten-member committee that determines voting and investment control decisions over securities that the THL Funds own and as a result, and by virtue of the relationships described in footnote (3) above, may be deemed to share beneficial ownership of the shares held by the THL Funds. Each of Messrs. Abbrecht and DiNovi disclaims beneficial ownership of the shares referred to in footnote (3) above. The address for Messrs. Abbrecht and DiNovi is c/o Thomas H. Lee Partners, L.P., 100 Federal Street, 35th Floor, Boston, Massachusetts 02110. |
| (12) | Does not include shares of common stock held by the Bain Capital Entities. Each of Messrs. Balson and Nunnelly is a Managing Director and serves on the investment committee of BCI and as a result, and by virtue of the relationships described in footnote (1) above, may be deemed to share beneficial ownership of the shares held by the Bain Capital Entities. Each of Messrs. Balson and Nunnelly disclaims beneficial ownership of the shares held by the Bain Capital Entities. The address for Messrs. Balson and Nunnelly is c/o Bain Capital Partners, LLC, 111 Huntington Avenue, Boston, Massachusetts 02199. |
| (13) | Does not include shares of common stock held by the Carlyle Funds, each of which is an affiliate of The Carlyle Group. Ms. Horbach is a Managing Director, and Ms. Balaji is a Vice President, of The Carlyle Group. Each of Ms. Horbach and Ms. Balaji disclaims beneficial ownership of the shares held by the Carlyle Funds. The address for Ms. Horbach and Ms. Balaji is c/o The Carlyle Group, 520 Madison Avenue, Floor 43, New York, NY 10022. |
- 148 -
Table of Contents
General
Upon the closing of this offering, the total amount of our authorized capital stock will consist of shares of common stock, par value $0.001 per share and shares of undesignated preferred stock. As of March 26, 2011, we had outstanding 192,219,311 shares of Class A common stock and 23,060,006 shares of Class L common stock. In connection with the reclassification, all of the outstanding Class A common stock and Class L common stock was reclassified into shares of common stock. See “The reclassification.” As of March 26, 2011, we had 55 stockholders of record of Class A common stock and 52 stockholders of record of Class L common stock and had outstanding options to purchase 24,959,750 shares of Class A common stock, which options were exercisable at a weighted average exercise price of $0.81 per share.
After giving effect to this offering, we will have shares of common stock and no shares of preferred stock outstanding. The following summary describes all material provisions of our capital stock. We urge you to read our certificate of incorporation and our by-laws, which are included as exhibits to the registration statement of which this prospectus forms a part.
Our certificate of incorporation and by-laws will contain provisions that are intended to enhance the likelihood of continuity and stability in the composition of the board of directors and which may have the effect of delaying, deferring or preventing a future takeover or change in control of our company unless such takeover or change in control is approved by our board of directors. These provisions include a classified board of directors, elimination of stockholder action by written consents (except in limited circumstances), elimination of the ability of stockholders to call special meetings (except in limited circumstances), advance notice procedures for stockholder proposals and supermajority vote requirements for amendments to our certificate of incorporation and by-laws.
Common stock
Dividend Rights. Subject to preferences that may apply to shares of preferred stock outstanding at the time, holders of outstanding shares of common stock will be entitled to receive dividends out of assets legally available at the times and in the amounts as the board of directors may from time to time determine.
Voting Rights. Each outstanding share of common stock will be entitled to one vote on all matters submitted to a vote of stockholders. Holders of shares of our common stock shall have no cumulative voting rights.
Preemptive Rights. Our common stock will not be entitled to preemptive or other similar subscription rights to purchase any of our securities.
Conversion or Redemption Rights. Our common stock will be neither convertible nor redeemable.
Liquidation Rights. Upon our liquidation, the holders of our common stock will be entitled to receive pro rata our assets which are legally available for distribution, after payment of all debts and other liabilities and subject to the prior rights of any holders of preferred stock then outstanding.
Nasdaq Listing. We intend to list our common stock on The NASDAQ Global Select Market under the symbol “DNKN.”
- 149 -
Table of Contents
Preferred stock
Our board of directors may, without further action by our stockholders, from time to time, direct the issuance of shares of preferred stock in series and may, at the time of issuance, determine the designations, powers, preferences, privileges, and relative participating, optional or special rights as well as the qualifications, limitations or restrictions thereof, including dividend rights, conversion rights, voting rights, terms of redemption and liquidation preferences, any or all of which may be greater than the rights of the common stock. Satisfaction of any dividend preferences of outstanding shares of preferred stock would reduce the amount of funds available for the payment of dividends on shares of our common stock. Holders of shares of preferred stock may be entitled to receive a preference payment in the event of our liquidation before any payment is made to the holders of shares of our common stock. Under specified circumstances, the issuance of shares of preferred stock may render more difficult or tend to discourage a merger, tender offer or proxy contest, the assumption of control by a holder of a large block of our securities or the removal of incumbent management. Upon the affirmative vote of a majority of the total number of directors then in office, our board of directors, without stockholder approval, may issue shares of preferred stock with voting and conversion rights which could adversely affect the holders of shares of our common stock and the market value of our common stock. Upon consummation of this offering, there will be no shares of preferred stock outstanding, and we have no present intention to issue any shares of preferred stock.
Anti-takeover effects of our certificate of incorporation and by-laws
Our certificate of incorporation and by-laws will contain certain provisions that are intended to enhance the likelihood of continuity and stability in the composition of the board of directors and which may have the effect of delaying, deferring or preventing a future takeover or change in control of the company unless such takeover or change in control is approved by the board of directors.
These provisions include:
Classified Board. Our certificate of incorporation will provide that our board of directors will be divided into three classes of directors, with the classes as nearly equal in number as possible. As a result, approximately one-third of our board of directors will be elected each year. The classification of directors will have the effect of making it more difficult for stockholders to change the composition of our board. Our certificate of incorporation will also provide that, subject to any rights of holders of preferred stock to elect additional directors under specified circumstances, the number of directors will be fixed exclusively pursuant to a resolution adopted by our board of directors. Upon completion of this offering, our board of directors will have members.
Action by Written Consent; Special Meetings of Stockholders. Our certificate of incorporation will provide that stockholder action can be taken only at an annual or special meeting of stockholders and cannot be taken by written consent in lieu of a meeting once investment funds affiliated with the Sponsors cease to beneficially own more than 50% of our outstanding shares. Our certificate of incorporation and the by-laws will also provide that, except as otherwise required by law, special meetings of the stockholders can only be called by the chairman or vice-chairman of the board, the chief executive officer, or pursuant to a resolution adopted by a majority of the board of directors or, until the date that investment funds affiliated with the Sponsors cease to beneficially own more than 50% of our outstanding shares, at the request of holders of 50% or more of our outstanding shares. Except as described above, stockholders will not be permitted to call a special meeting or to require the board of directors to call a special meeting.
Advance Notice Procedures. Our by-laws will establish an advance notice procedure for stockholder proposals to be brought before an annual meeting of our stockholders, including proposed nominations of persons for election to the board of directors. Stockholders at an annual meeting will only be able to consider proposals or
- 150 -
Table of Contents
nominations specified in the notice of meeting or brought before the meeting by or at the direction of the board of directors or by a stockholder who was a stockholder of record on the record date for the meeting, who is entitled to vote at the meeting and who has given our Secretary timely written notice, in proper form, of the stockholder’s intention to bring that business before the meeting. Although the by-laws will not give the board of directors the power to approve or disapprove stockholder nominations of candidates or proposals regarding other business to be conducted at a special or annual meeting, the by-laws may have the effect of precluding the conduct of certain business at a meeting if the proper procedures are not followed or may discourage or deter a potential acquiror from conducting a solicitation of proxies to elect its own slate of directors or otherwise attempting to obtain control of the company.
Super Majority Approval Requirements. The Delaware General Corporation Law generally provides that the affirmative vote of a majority of the shares entitled to vote on any matter is required to amend a corporation’s certificate of incorporation or by-laws, unless either a corporation’s certificate of incorporation or by-laws require a greater percentage. Our certificate of incorporation and by-laws will provide that the affirmative vote of holders of at least 75% of the total votes eligible to be cast in the election of directors will be required to amend, alter, change or repeal specified provisions once investment funds affiliated with the Sponsors cease to beneficially own more than 50% of our outstanding shares. This requirement of a supermajority vote to approve amendments to our certificate of incorporation and by-laws could enable a minority of our stockholders to exercise veto power over any such amendments.
Authorized but Unissued Shares. Our authorized but unissued shares of common stock and preferred stock will be available for future issuance without stockholder approval. These additional shares may be utilized for a variety of corporate purposes, including future public offerings to raise additional capital, corporate acquisitions and employee benefit plans. The existence of authorized but unissued shares of common stock and preferred stock could render more difficult or discourage an attempt to obtain control of a majority of our common stock by means of a proxy contest, tender offer, merger or otherwise.
Business Combinations with Interested Stockholders. We have elected in our certificate of incorporation not to be subject to Section 203 of the Delaware General Corporation Law, an antitakeover law. In general, Section 203 prohibits a publicly held Delaware corporation from engaging in a business combination, such as a merger, with a person or group owning 15% or more of the corporation’s voting stock for a period of three years following the date the person became an interested stockholder, unless (with certain exceptions) the business combination or the transaction in which the person became an interested stockholder is approved in a prescribed manner. Accordingly, we are not subject to any anti-takeover effects of Section 203. However, our certificate of incorporation will contain provisions that have the same effect as Section 203, except that they provide that our Sponsors and their respective affiliates will not be deemed to be “interested stockholders,” regardless of the percentage of our voting stock owned by them, and accordingly will not be subject to such restrictions.
Corporate opportunities
Our restated certificate of incorporation will provide that we renounce any interest or expectancy of the Company in the business opportunities of the Sponsors and of their officers, directors, agents, shareholders, members, partners, affiliates and subsidiaries and each such party shall not have any obligation to offer us those opportunities unless presented to a director or officer of the Company in his or her capacity as a director or officer of the Company.
- 151 -
Table of Contents
Limitations on liability and indemnification of officers and directors
Our restated certificate of incorporation will limit the liability of our directors to the fullest extent permitted by the Delaware General Corporation Law and provides that we will indemnify them to the fullest extent permitted by such law. We expect to enter into indemnification agreements with our current directors and executive officers prior to the completion of this offering and expect to enter into a similar agreement with any new directors or executive officers. We expect to increase our directors’ and officers’ liability insurance coverage prior to the completion of this offering.
Transfer agent and registrar
The transfer agent and registrar for our common stock will be American Stock Transfer & Trust Company, LLC. Its address is 6201 15th Avenue, Brooklyn, NY 11219. Its telephone number is (718) 921-8200.
- 152 -
Table of Contents
Shares eligible for future sale
Immediately prior to this offering, there was no public market for our common stock, and we cannot predict what effect, if any, market sales of shares of common stock or the availability of shares of common stock for sale will have on the market price of our common stock prevailing from time to time. Nevertheless, sales of substantial amounts of common stock, including shares issued upon the exercise of outstanding options and warrants, in the public market, or the perception that such sales could occur, could materially and adversely affect the market price of our common stock and could impair our future ability to raise capital through the sale of our equity or equity-related securities at a time and price that we deem appropriate.
Upon the closing of this offering, we will have outstanding an aggregate of approximately shares of common stock. In addition, options to purchase an aggregate of approximately shares of our common stock will be outstanding as of the closing of this offering. Of the outstanding shares, the shares sold in this offering will be freely tradable without restriction or further registration under the Securities Act, except any shares purchased by our “affiliates”, as that term is defined in Rule 144 under the Securities Act, may be sold only in compliance with the limitations described below. The remaining outstanding shares of common stock will be deemed restricted securities, as defined under Rule 144. Restricted securities may be sold in the public market only if registered or if they qualify for an exemption from registration, generally under Rules 144 or 701 under the Securities Act, which we summarize below. All of these shares will be subject to lock-up agreements described below.
Taking into account the lock-up agreements described below and assuming J.P. Morgan Securities LLC, Barclays Capital Inc. and Morgan Stanley & Co. LLC do not release stockholders from these agreements, the following shares will be eligible for sale in the public market at the following times:
| Date available for resale | Shares eligible for sale |
Comment | ||
| 180 days ( , ), as such period may be extended as described below |
Lock-up released, shares eligible for sale under Rule 144 (subject, in some instances, to volume limitations) and Rule 701 | |||
Rule 144
In general, under Rule 144, beginning 90 days after the date of this prospectus, a person who is not our affiliate and has not been our affiliate at any time during the preceding three months will be entitled to sell any shares of our common stock that such person has beneficially owned for at least six months, including the holding period of any prior owner other than one of our affiliates, without regard to volume limitations. Sales of our common stock by any such person would be subject to the availability of current public information about us if the shares to be sold were beneficially owned by such person for less than one year.
Approximately shares of our common stock that are not subject to the lock-up agreements described above will be eligible for sale under Rule 144 immediately upon the closing of this offering.
Beginning 90 days after the date of this prospectus, our affiliates who have beneficially owned shares of our common stock for at least six months, including the holding period of any prior owner other than one of our affiliates, would be entitled to sell within any three-month period a number of shares that does not exceed the greater of:
| • | 1% of the number of shares of our common stock then outstanding, which will equal approximately shares immediately after this offering, assuming an initial public offering price of $ per share, which is the mid-point of the range set forth on the cover page of this prospectus; and |
- 153 -
Table of Contents
| • | the average weekly trading volume in our common stock on The NASDAQ Global Select Market during the four calendar weeks preceding the date of filing of a Notice of Proposed Sale of Securities Pursuant to Rule 144 with respect to the sale. |
Sales under Rule 144 by our affiliates are also subject to manner of sale provisions and notice requirements and to the availability of current public information about us.
Rule 701
In general, under Rule 701 as currently in effect, any of our employees, directors, officers, consultants or advisors who purchase shares from us in connection with a compensatory stock or option plan or other written agreement before the effective date of this offering is entitled to sell such shares 90 days after the effective date of this offering in reliance on Rule 144, in the case of affiliates, without having to comply with the holding period requirements of Rule 144 and, in the case of non-affiliates, without having to comply with the public information, holding period, volume limitation or notice filing requirements of Rule 144.
Lock-up agreements
Our officers, directors and other stockholders owning an aggregate of shares of our common stock, will be subject to lock-up agreements with the underwriters that will restrict the sale of the shares of our common stock held by them for 180 days, subject to certain exceptions. See “Underwriting” for a description of these lock-up agreements.
Registration statements on Form S-8
Immediately after the completion of this offering, we intend to file a registration statement on Form S-8 under the Securities Act to register all of the shares of common stock issued or reserved for future issuance under our 2006 Executive Incentive Plan and our 2011 Omnibus Long-Term Incentive Plan. This registration statement would cover approximately shares. Shares registered under the registration statement will generally be available for sale in the open market after the 180-day lock-up period immediately following the date of this prospectus (as such period may be extended in certain circumstances).
Registration rights
Beginning 180 days after the date of this prospectus, subject to certain exceptions and automatic extensions in certain circumstances, holders of shares of our common stock will be entitled to the rights described under “Related party transactions—Arrangements with our investors.” Registration of these shares under the Securities Act would result in these shares becoming freely tradable without restriction under the Securities Act immediately upon effectiveness of the registration.
- 154 -
Table of Contents
Material U.S. federal tax considerations for Non-U.S. Holders of common stock
The following is a summary of the material U.S. federal income and estate tax considerations relating to the purchase, ownership and disposition of our common stock by Non-U.S. Holders (defined below). This summary does not purport to be a complete analysis of all the potential tax considerations relevant to Non-U.S. Holders of our common stock. This summary is based upon the Internal Revenue Code, the Treasury regulations promulgated or proposed thereunder and administrative and judicial interpretations thereof, all as of the date hereof and all of which are subject to change at any time, possibly on a retroactive basis.
This summary assumes that shares of our common stock are held as “capital assets” within the meaning of Section 1221 of the Internal Revenue Code. This summary does not purport to deal with all aspects of U.S. federal income and estate taxation that might be relevant to particular Non-U.S. Holders in light of their particular investment circumstances or status, nor does it address specific tax considerations that may be relevant to particular persons (including, for example, financial institutions, broker-dealers, insurance companies, partnerships or other pass-through entities, certain U.S. expatriates, tax-exempt organizations, pension plans, “controlled foreign corporations”, “passive foreign investment companies”, corporations that accumulate earnings to avoid U.S. federal income tax, persons in special situations, such as those who have elected to mark securities to market or those who hold common stock as part of a straddle, hedge, conversion transaction, synthetic security or other integrated investment, or holders subject to the alternative minimum tax). In addition, except as explicitly addressed herein with respect to estate tax, this summary does not address estate and gift tax considerations or considerations under the tax laws of any state, local or non-U.S. jurisdiction.
For purposes of this summary, a “Non-U.S. Holder” means a beneficial owner of common stock that for U.S. federal income tax purposes is not treated as a partnership and is not:
| • | an individual who is a citizen or resident of the United States; |
| • | a corporation or any other organization taxable as a corporation for U.S. federal income tax purposes, created or organized in or under the laws of the United States, any state thereof or the District of Columbia; |
| • | an estate, the income of which is included in gross income for U.S. federal income tax purposes regardless of its source; or |
| • | a trust, if (1) a U.S. court is able to exercise primary supervision over the trust’s administration and one or more U.S. persons have the authority to control all of the trust’s substantial decisions or (2) the trust has a valid election in effect under applicable U.S. Treasury regulations to be treated as a U.S. person. |
If an entity that is classified as a partnership for U.S. federal income tax purposes holds our common stock, the tax treatment of persons treated as its partners for U.S. federal income tax purposes will generally depend upon the status of the partner and the activities of the partnership. Partnerships and other entities that are classified as partnerships for U.S. federal income tax purposes and persons holding our common stock through a partnership or other entity classified as a partnership for U.S. federal income tax purposes are urged to consult their own tax advisors.
There can be no assurance that the Internal Revenue Service (“IRS”) will not challenge one or more of the tax consequences described herein, and we have not obtained, nor do we intend to obtain, a ruling from the IRS with respect to the U.S. federal income or estate tax consequences to a Non-U.S. Holder of the purchase, ownership or disposition of our common stock.
- 155 -
Table of Contents
THIS SUMMARY IS NOT INTENDED TO BE TAX ADVICE. NON-U.S. HOLDERS ARE URGED TO CONSULT THEIR TAX ADVISORS CONCERNING THE U.S. FEDERAL INCOME AND ESTATE TAXATION, STATE, LOCAL AND NON-U.S. TAXATION AND OTHER TAX CONSEQUENCES TO THEM OF THE PURCHASE, OWNERSHIP AND DISPOSITION OF OUR COMMON STOCK.
Distributions on our common stock
As discussed under “Dividend policy” above, we do not currently expect to pay regular dividends on our common stock. In the event that we do make a distribution of cash or property with respect to our common stock, any such distributions generally will constitute dividends for U.S. federal income tax purposes to the extent of our current or accumulated earnings and profits, as determined under U.S. federal income tax principles. If a distribution exceeds our current and accumulated earnings and profits, the excess will constitute a return of capital and will first reduce the holder’s basis in our common stock, but not below zero. Any remaining excess will be treated as capital gain, subject to the tax treatment described below in “Gain on sale, exchange or other taxable disposition of our common stock.” Any such distribution would also be subject to the discussion below under the section titled “Additional withholding requirements.”
Dividends paid to a Non-U.S. Holder generally will be subject to a 30% U.S. federal withholding tax unless such Non-U.S. Holder provides us or our agent, as the case may be, with the appropriate IRS Form W-8, such as:
• IRS Form W-8BEN (or successor form) certifying, under penalties of perjury, a reduction in withholding under an applicable income tax treaty, or
• IRS Form W-8ECI (or successor form) certifying that a dividend paid on common stock is not subject to withholding tax because it is effectively connected with a trade or business in the United States of the Non-U.S. Holder (in which case such dividend generally will be subject to regular graduated U.S. tax rates as described below).
The certification requirement described above also may require a Non-U.S. Holder that provides an IRS form or that claims treaty benefits to provide its U.S. taxpayer identification number. Special certification and other requirements apply in the case of certain Non-U.S. Holders that are intermediaries or pass-through entities for U.S. federal income tax purposes.
Each Non-U.S. Holder is urged to consult its own tax advisor about the specific methods for satisfying these requirements. A claim for exemption will not be valid if the person receiving the applicable form has actual knowledge or reason to know that the statements on the form are false.
If dividends are effectively connected with a trade or business in the United States of a Non-U.S. Holder (and, if required by an applicable income tax treaty, attributable to a U.S. permanent establishment), the Non-U.S. Holder, although exempt from the withholding tax described above (provided that the certifications described above are satisfied), generally will be subject to U.S. federal income tax on such dividends on a net income basis in the same manner as if it were a resident of the United States. In addition, if a Non-U.S. Holder is treated as a corporation for U.S. federal income tax purposes, the Non-U.S. Holder may be subject to an additional “branch profits tax” equal to 30% (unless reduced by an applicable income treaty) of its earnings and profits in respect of such effectively connected dividend income.
If a Non-U.S. Holder is eligible for a reduced rate of U.S. federal withholding tax pursuant to an income tax treaty, the holder may obtain a refund or credit of any excess amount withheld by timely filing an appropriate claim for refund with the IRS.
- 156 -
Table of Contents
Gain on sale, exchange or other taxable disposition of our common stock
Subject to the discussion below under the section titled “Additional withholding requirements”, in general, a Non-U.S. Holder will not be subject to U.S. federal income tax or withholding tax on gain realized upon such holder’s sale, exchange or other taxable disposition of shares of our common stock unless (i) such Non-U.S. Holder is an individual who is present in the United States for 183 days or more in the taxable year of disposition, and certain other conditions are met, (ii) we are or have been a “United States real property holding corporation”, as defined in the Internal Revenue Code (a “USRPHC”), at any time within the shorter of the five-year period preceding the disposition and the Non-U.S. Holder’s holding period in the shares of our common stock, and certain other requirements are met, or (iii) such gain is effectively connected with the conduct by such Non-U.S. Holder of a trade or business in the United States (and, if required by an applicable income tax treaty, is attributable to a permanent establishment maintained by such Non-U.S. Holder in the United States).
If the first exception applies, the Non-U.S. Holder generally will be subject to U.S. federal income tax at a rate of 30% (or at a reduced rate under an applicable income tax treaty) on the amount by which such Non-U.S. Holder’s capital gains allocable to U.S. sources (including gain, if any, realized on a disposition of our common stock) exceed capital losses allocable to U.S. sources during the taxable year of the disposition. If the third exception applies, the Non-U.S. Holder generally will be subject to U.S. federal income tax with respect to such gain on a net income basis in the same manner as if it were a resident of the United States and a Non-U.S. Holder that is a corporation for U.S. federal income tax purposes may also be subject to a branch profits tax with respect any earnings and profits attributable to such gain at a rate of 30% (or at a reduced rate under an applicable income tax treaty).
Generally, a corporation is a USRPHC only if the fair market value of its U.S. real property interests (as defined in the Internal Revenue Code) equals or exceeds 50% of the sum of the fair market value of its worldwide real property interests plus its other assets used or held for use in a trade or business. Although there can be no assurance in this regard, we believe that we are not, and do not anticipate becoming, a USRPHC. However, because the determination of whether we are a USRPHC depends on the fair market value of our U.S. real property relative to the fair market value of other business assets, there can be no assurance that we will not become a USRPHC in the future. Even if we became a USRPHC, a Non-U.S. Holder would not be subject to U.S. federal income tax on a sale, exchange or other taxable disposition of our common stock by reason of our status as a USRPHC so long as our common stock is regularly traded on an established securities market at any time during the calendar year in which the disposition occurs and such Non-U.S. Holder does not own and is not deemed to own (directly, indirectly or constructively) more than 5% of our common stock at any time during the shorter of the five year period ending on the date of disposition and the holder’s holding period. However, no assurance can be provided that our common stock will be regularly traded on an established securities market for purposes of the rules described above. Prospective investors are encouraged to consult their own tax advisors regarding the possible consequences to them if we are, or were to become, a USRPHC.
Additional withholding requirements
Recently enacted legislation generally will impose a U.S. federal withholding tax of 30% on dividends and the gross proceeds from a sale or other disposition of our common stock paid after December 31, 2012 to (i) a “foreign financial institution” (as defined under these rules), unless the institution meets certain requirements, including entering into an agreement with the United States government to collect and report information regarding United States account holders of the institution (which includes certain equity and debt holders of the institution, as well as certain account holders that are foreign entities with U.S. owners), or (ii) a “non-financial foreign entity” that is the beneficial owner of the payment (or that holds the stock on behalf of another
- 157 -
Table of Contents
non-financial foreign entity that is the beneficial owner) unless the entity (or the beneficial owner) meets certain requirements, including certifying that it does not have any “substantial United States owner” (as defined under these rules) or providing the name, address and taxpayer identification number of each substantial United States owner. The scope of these rules remains unclear and potentially subject to material changes resulting from any future guidance. Prospective investors should consult their own tax advisors regarding the possible impact of this legislation on their investment in our common stock.
Backup withholding and information reporting
We must report annually to the IRS and to each Non-U.S. Holder the gross amount of the distributions on our common stock paid to the holder and the tax withheld, if any, with respect to the distributions.
Non-U.S. Holders may have to comply with specific certification procedures to establish that the holder is not a United States person (as defined in the Internal Revenue Code) in order to avoid backup withholding at the applicable rate, currently 28% and scheduled to increase to 31% for taxable years 2013 and thereafter, with respect to dividends on our common stock. Dividends paid to Non-U.S. Holders subject to the U.S. withholding tax, as described above under the section titled “Distributions on our common stock,” generally will be exempt from U.S. backup withholding.
Information reporting and backup withholding will generally apply to the proceeds of a disposition of our common stock by a Non-U.S. Holder effected by or through the U.S. office of any broker, U.S. or foreign, unless the holder certifies its status as a Non-U.S. Holder and satisfies certain other requirements, or otherwise establishes an exemption. Generally, information reporting and backup withholding will not apply to a payment of disposition proceeds to a Non-U.S. Holder where the transaction is effected outside the United States through a non-U.S. office of a broker. However, for information reporting purposes, dispositions effected through a non-U.S. office of a U.S. broker or a non-U.S. broker with substantial U.S. ownership or operations generally will be treated in a manner similar to dispositions effected through a U.S. office of a broker. Prospective investors should consult their own tax advisors regarding the application of the information reporting and backup withholding rules to them.
Copies of information returns may be made available to the tax authorities of the country in which the Non-U.S. Holder resides or in which the Non-U.S. Holder is incorporated under the provisions of a specific treaty or agreement.
Backup withholding is not an additional tax. Any amounts withheld under the backup withholding rules from a payment to a Non-U.S. Holder can be refunded or credited against the Non-U.S. Holder’s U.S. federal income tax liability, if any, provided that an appropriate claim is timely filed with the IRS.
Federal estate tax
Common stock owned (or treated as owned) by an individual who is not a citizen or a resident of the United States (as defined for U.S. federal estate tax purposes) at the time of death will be included in the individual’s gross estate for U.S. federal estate tax purposes, unless an applicable estate or other tax treaty provides otherwise, and, therefore, may be subject to U.S. federal estate tax.
- 158 -
Table of Contents
We are offering the shares of common stock described in this prospectus through a number of underwriters. J.P. Morgan Securities LLC, Barclays Capital Inc., Morgan Stanley & Co. LLC, Merrill Lynch, Pierce, Fenner & Smith Incorporated and Goldman, Sachs & Co. are acting as joint book-running managers of the offering and J.P. Morgan Securities LLC, Barclays Capital Inc., Morgan Stanley & Co. LLC, Merrill Lynch, Pierce, Fenner & Smith Incorporated and Goldman, Sachs & Co. are acting as representatives of the underwriters. We have entered into an underwriting agreement with the underwriters. Subject to the terms and conditions of the underwriting agreement, we have agreed to sell to the underwriters, and each underwriter has severally agreed to purchase, at the public offering price less the underwriting discounts and commissions set forth on the cover page of this prospectus, the number of shares of common stock listed next to its name in the following table:
| Name | Number of shares |
|||
| J.P. Morgan Securities LLC |
||||
| Barclays Capital Inc. |
||||
| Morgan Stanley & Co. LLC |
||||
| Merrill Lynch, Pierce, Fenner &
Smith |
||||
| Goldman, Sachs & Co. |
||||
| Robert W. Baird & Co. Incorporated |
||||
| William Blair & Company, L.L.C. |
||||
| Raymond James & Associates, Inc. |
||||
| Stifel, Nicolaus & Company, Incorporated |
||||
| Wells Fargo Securities, LLC |
||||
| Moelis & Company LLC |
||||
| SMBC Nikko Capital Markets Limited |
||||
| Samuel A. Ramirez & Co., Inc. |
||||
| The Williams Capital Group, L.P. |
||||
| Total |
||||
The underwriters are committed to purchase all the common shares offered by us if they purchase any shares. The underwriting agreement also provides that if an underwriter defaults, the purchase commitments of non-defaulting underwriters may also be increased or the offering may be terminated.
The underwriters propose to offer the common shares directly to the public at the initial public offering price set forth on the cover page of this prospectus and to certain dealers at that price less a concession not in excess of $ per share. After the initial public offering of the shares, the offering price and other selling terms may be changed by the underwriters. Sales of shares made outside of the United States may be made by affiliates of the underwriters. The offering of the shares by the underwriters is subject to receipt and acceptance and subject to the underwriters’ right to reject any order in whole or in part. The underwriters have informed us that they do not intend to confirm sales to discretionary accounts that exceed 5% of the total number of shares offered by them.
The underwriters have an option to buy up to additional shares of common stock from us to cover sales of shares by the underwriters which exceed the number of shares specified in the table above. The underwriters have 30 days from the date of this prospectus to exercise this over-allotment option. If any shares are purchased with this over-allotment option, the underwriters will purchase shares in approximately the same proportion as shown in the table above. If any additional shares of common stock are purchased, the underwriters will offer the additional shares on the same terms as those on which the shares are being offered.
- 159 -
Table of Contents
The underwriting fee is equal to the public offering price per share of common stock less the amount paid by the underwriters to us per share of common stock. The underwriting fee is $ per share. The following table shows the per share and total underwriting discounts and commissions to be paid to the underwriters assuming both no exercise and full exercise of the underwriters’ option to purchase additional shares.
| Without over-allotment exercise |
With |
|||||||
| Per Share |
$ | $ | ||||||
| Total |
$ | $ | ||||||
We estimate that the total expenses of this offering, including registration, filing and listing fees, printing fees and legal and accounting expenses, but excluding the underwriting discounts and commissions, will be approximately $ .
A prospectus in electronic format may be made available on the web sites maintained by one or more underwriters, or selling group members, if any, participating in the offering. The underwriters may agree to allocate a number of shares to underwriters and selling group members for sale to their online brokerage account holders. Internet distributions will be allocated by the representatives to underwriters and selling group members that may make Internet distributions on the same basis as other allocations.
At our request, the underwriters have reserved for sale, at the initial public offering price, up to 6% of the shares offered by this prospectus for sale to some of our directors, officers, employees, franchisees and certain other persons who are otherwise associated with us through a directed share program. If these persons purchase reserved shares, this will reduce the number of shares available for sale to the general public. Any reserved shares that are not so purchased will be offered by the underwriters to the general public on the same terms as the other shares offered by this prospectus.
We have agreed that we will not (i) offer, pledge, announce the intention to sell, sell, contract to sell, sell any option or contract to purchase, purchase any option or contract to sell, grant any option, right or warrant to purchase or otherwise dispose of, directly or indirectly, or file with the Securities and Exchange Commission a registration statement under the Securities Act relating to, any shares of our common stock or securities convertible into or exchangeable or exercisable for any shares of our common stock, or publicly disclose the intention to make any offer, sale, pledge, disposition or filing (other than filings on Form S-8 relating to our employee benefit plans), or (ii) enter into any swap or other arrangement that transfers all or a portion of the economic consequences associated with the ownership of any shares of common stock or any such other securities (regardless of whether any of these transactions are to be settled by the delivery of shares of common stock or such other securities, in cash or otherwise), in each case without the prior written consent of J.P. Morgan Securities LLC, Barclays Capital Inc. and Morgan Stanley & Co. LLC, for a period of 180 days after the date of this prospectus, subject to certain exceptions. Notwithstanding the foregoing, if (1) during the last 17 days of the 180-day restricted period, we issue an earnings release or announce material news or a material event relating to our company; or (2) prior to the expiration of the 180-day restricted period, we announce that we will release earnings results during the 16-day period beginning on the last day of the 180-day period, the restrictions described above shall continue to apply until the expiration of the 18-day period beginning on the issuance of the earnings release or the announcement of the material news or material event unless J.P. Morgan Securities LLC, Barclays Capital Inc. and Morgan Stanley & Co. LLC waive, in writing, such extension.
- 160 -
Table of Contents
Our directors and executive officers, and the Sponsors have entered into lock-up agreements with the underwriters prior to the commencement of this offering pursuant to which each of these persons or entities, with limited exceptions, for a period of 180 days after the date of this prospectus, may not, without the prior written consent of J.P. Morgan Securities LLC, Barclays Capital Inc. and Morgan Stanley & Co. LLC, (1) offer, pledge, announce the intention to sell, sell, contract to sell, sell any option or contract to purchase, purchase any option or contract to sell, grant any option, right or warrant to purchase, or otherwise transfer or dispose of, directly or indirectly, any shares of our common stock or any securities convertible into or exercisable or exchangeable for our common stock (including, without limitation, common stock or such other securities which may be deemed to be beneficially owned by such directors, executive officers, managers and members in accordance with the rules and regulations of the SEC and securities which may be issued upon exercise of a stock option or warrant) or (2) enter into any swap or other agreement that transfers, in whole or in part, any of the economic consequences of ownership of the common stock or such other securities, whether any such transaction described in clause (1) or (2) above is to be settled by delivery of common stock or such other securities, in cash or otherwise, or (3) make any demand for or exercise any right with respect to the registration of any shares of our common stock or any security convertible into or exercisable or exchangeable for our common stock. Notwithstanding the foregoing, if (1) during the last 17 days of the 180-day restricted period, we issue an earnings release or announce material news or a material event relating to our company; or (2) prior to the expiration of the 180-day restricted period, we announce that we will release earnings results during the 16-day period beginning on the last day of the 180-day period, the restrictions described above shall continue to apply until the expiration of the 18-day period beginning on the issuance of the earnings release or the announcement of the material news or material event unless J.P. Morgan Securities LLC, Barclays Capital Inc. and Morgan Stanley & Co. LLC waive, in writing, such extension.
We have agreed to indemnify the several underwriters against certain liabilities, including liabilities under the Securities Act of 1933.
We have applied to have our common stock approved for listing/quotation on The NASDAQ Global Select Market, subject to notice of official issuance, under the symbol “DNKN.”
In connection with this offering, the underwriters may engage in stabilizing transactions, which involves making bids for, purchasing and selling shares of common stock in the open market for the purpose of preventing or retarding a decline in the market price of the common stock while this offering is in progress. These stabilizing transactions may include making short sales of the common stock, which involves the sale by the underwriters of a greater number of shares of common stock than they are required to purchase in this offering, and purchasing shares of common stock on the open market to cover positions created by short sales. Short sales may be “covered” shorts, which are short positions in an amount not greater than the underwriters’ over-allotment option referred to above, or may be “naked” shorts, which are short positions in excess of that amount. The underwriters may close out any covered short position either by exercising their over-allotment option, in whole or in part, or by purchasing shares in the open market. In making this determination, the underwriters will consider, among other things, the price of shares available for purchase in the open market compared to the price at which the underwriters may purchase shares through the over-allotment option. A naked short position is more likely to be created if the underwriters are concerned that there may be downward pressure on the price of the common stock in the open market that could adversely affect investors who purchase in this offering. To the extent that the underwriters create a naked short position, they will purchase shares in the open market to cover the position.
- 161 -
Table of Contents
The underwriters have advised us that, pursuant to Regulation M of the Securities Act of 1933, they may also engage in other activities that stabilize, maintain or otherwise affect the price of the common stock, including the imposition of penalty bids. This means that if the representatives of the underwriters purchase common stock in the open market in stabilizing transactions or to cover short sales, the representatives can require the underwriters that sold those shares as part of this offering to repay the underwriting discount received by them.
These activities may have the effect of raising or maintaining the market price of the common stock or preventing or retarding a decline in the market price of the common stock, and, as a result, the price of the common stock may be higher than the price that otherwise might exist in the open market. If the underwriters commence these activities, they may discontinue them at any time. The underwriters may carry out these transactions on the NASDAQ Global Select Market, in the over-the-counter market or otherwise.
Prior to this offering, there has been no public market for our common stock. The initial public offering price will be determined by negotiations between us and the representatives of the underwriters. In determining the initial public offering price, we and the representatives of the underwriters expect to consider a number of factors including:
| • | the information set forth in this prospectus and otherwise available to the representatives; |
| • | our prospects and the history and prospects for the industry in which we compete; |
| • | an assessment of our management; |
| • | our prospects for future earnings; |
| • | the general condition of the securities markets at the time of this offering; |
| • | the recent market prices of, and demand for, publicly traded common stock of generally comparable companies; and |
| • | other factors deemed relevant by the underwriters and us. |
Neither we nor the underwriters can assure investors that an active trading market will develop for our common shares, or that the shares will trade in the public market at or above the initial public offering price.
Other than in the United States, no action has been taken by us or the underwriters that would permit a public offering of the securities offered by this prospectus in any jurisdiction where action for that purpose is required. The securities offered by this prospectus may not be offered or sold, directly or indirectly, nor may this prospectus or any other offering material or advertisements in connection with the offer and sale of any such securities be distributed or published in any jurisdiction, except under circumstances that will result in compliance with the applicable rules and regulations of that jurisdiction. Persons into whose possession this prospectus comes are advised to inform themselves about and to observe any restrictions relating to the offering and the distribution of this prospectus. This prospectus does not constitute an offer to sell or a solicitation of an offer to buy any securities offered by this prospectus in any jurisdiction in which such an offer or a solicitation is unlawful.
- 162 -
Table of Contents
Notice to prospective investors in United Kingdom
This document is only being distributed to and is only directed at (i) persons who are outside the United Kingdom or (ii) to investment professionals falling within Article 19(5) of the Financial Services and Markets Act 2000 (Financial Promotion) Order 2005 (the “Order”) or (iii) high net worth entities, and other persons to whom it may lawfully be communicated, falling with Article 49(2)(a) to (d) of the Order (all such persons together being referred to as “relevant persons”). The securities are only available to, and any invitation, offer or agreement to subscribe, purchase or otherwise acquire such securities will be engaged in only with, relevant persons. Any person who is not a relevant person should not act or rely on this document or any of its contents.
Each underwriter has agreed that:
(a) it has only communicated or caused to be communicated and will only communicate or cause to be communicated an invitation or inducement to engage in investment activity (within the meaning of Section 21 of the FSMA) received by it in connection with the issue or sale of the shares in circumstances in which Section 21(1) of the FSMA does not apply to the Company; and
(b) it has complied and will comply with all applicable provisions of the FSMA with respect to anything done by it in relation to the shares in, from or otherwise involving the United Kingdom.
European Economic Area
In relation to each member state of the European Economic Area which has implemented the Prospectus Directive (each, a “Relevant Member State”), including each Relevant Member State that has implemented the 2010 PD Amending Directive with regard to persons to whom an offer of securities is addressed and the denomination per unit of the offer of securities (each, an “Early Implementing Member State”), with effect from and including the date on which the Prospectus Directive is implemented in that Relevant Member State (the “Relevant Implementation Date”), no offer of shares which are the subject of the offering contemplated by this prospectus will be made to the public in that Relevant Member State (other than offers (the “Permitted Public Offers”) where a prospectus will be published in relation to the shares that has been approved by the competent authority in a Relevant Member State or, where appropriate, approved in another Relevant Member State and notified to the competent authority in that Relevant Member State, all in accordance with the Prospectus Directive), except that with effect from and including that Relevant Implementation Date, offers of shares may be made to the public in that Relevant Member State at any time:
(a) to “qualified investors” as defined in the Prospectus Directive, including:
(i) (in the case of Relevant Member States other than Early Implementing Member States), legal entities which are authorized or regulated to operate in the financial markets or, if not so authorized or regulated, whose corporate purpose is solely to invest in securities, or any legal entity which has two or more of (A) an average of at least 250 employees during the last financial year; (B) a total balance sheet of more than €43,000,000 and (C) an annual turnover of more than €50,000,000 as shown in its last annual or consolidated accounts; or
(ii) (in the case of Early Implementing Member States), persons or entities that are described in points (1) to (4) of Section I of Annex II to Directive 2004/39/EC, and those who are treated on request as professional clients in accordance with Annex II to Directive 2004/39/EC, or recognized as eligible counterparties in accordance with Article 24 of Directive 2004/39/EC unless they have requested that they be treated as non-professional clients; or
- 163 -
Table of Contents
(b) to fewer than 100 (or, in the case of Early Implementing Member States, 150) natural or legal persons (other than “qualified investors” as defined in the Prospectus Directive), as permitted in the Prospectus Directive, subject to obtaining the prior consent of the representatives for any such offer; or
(c) in any other circumstances falling within Article 3(2) of the Prospectus Directive, provided that no such offer of shares shall result in a requirement for the publication by the Company or any underwriter of a prospectus pursuant to Article 3 of the Prospectus Directive or of a supplement to a prospectus pursuant to Article 16 of the Prospectus Directive.
Any person making or intending to make any offer within the European Economic Area of shares which are the subject of the offering contemplated in this prospectus should only do so in circumstances in which no obligation arises for the Company or any of the underwriters to produce a prospectus for such offer. Neither the Company nor the underwriters have authorized, nor do they authorize, the making of any offer of shares through any financial intermediary, other than offers made by the underwriters which constitute the final offering of shares contemplated in this prospectus.
Each person in a Relevant Member State (other than a Relevant Member State where there is a Permitted Public Offer) who initially acquires any shares or to whom any offer is made will be deemed to have represented, warranted and agreed to and with each underwriter and the Company that: (a) it is a “qualified investor” within the meaning of the law in that Relevant Member State implementing Article 2(1)(e) of the Prospectus Directive and (b) in the case of any shares acquired by it as a financial intermediary, as that term is used in Article 3(2) of the Prospectus Directive, (i) the shares acquired by it in the offering have not been acquired on behalf of, nor have they been acquired with a view to their offer or resale to, persons in any Relevant Member State other than “qualified investors” as defined in the Prospectus Directive, or in circumstances in which the prior consent of the representatives has been given to the offer or resale or (ii) where shares have been acquired by it on behalf of persons in any Relevant Member State other than qualified investors, the offer of those shares to it is not treated under the Prospectus Directive as having been made to such persons.
For the purpose of the above provisions, the expression “an offer to the public” in relation to any shares in any Relevant Member State means the communication in any form and by any means of sufficient information on the terms of the offer of any shares to be offered so as to enable an investor to decide to purchase any shares, as the same may be varied in the Relevant Member State by any measure implementing the Prospectus Directive in the Relevant Member State and the expression “Prospectus Directive” means Directive 2003/71 EC (including the 2010 PD Amending Directive, in the case of Early Implementing Member States) and includes any relevant implementing measure in each Relevant Member State and the expression “2010 PD Amending Directive” means Directive 2010/73/EU.
Notice to prospective investors in Hong Kong
The shares may not be offered or sold by means of any document other than (i) in circumstances which do not constitute an offer to the public within the meaning of the Companies Ordinance (Cap.32, Laws of Hong Kong), or (ii) to “professional investors” within the meaning of the Securities and Futures Ordinance (Cap.571, Laws of Hong Kong) and any rules made thereunder, or (iii) in other circumstances which do not result in the document being a “prospectus” within the meaning of the Companies Ordinance (Cap.32, Laws of Hong Kong), and no advertisement, invitation or document relating to the shares may be issued or may be in the possession of any person for the purpose of issue (in each case whether in Hong Kong or elsewhere), which is directed at, or the contents of which are likely to be accessed or read by, the public in Hong Kong (except if permitted to do so under the laws of Hong Kong) other than with respect to shares which are or are intended to be disposed of only to persons outside Hong Kong or only to “professional investors” within the meaning of the Securities and Futures Ordinance (Cap. 571, Laws of Hong Kong) and any rules made thereunder.
- 164 -
Table of Contents
Notice to prospective investors in Singapore
This prospectus has not been registered as a prospectus with the Monetary Authority of Singapore. Accordingly, this prospectus and any other document or material in connection with the offer or sale, or invitation for subscription or purchase, of the shares may not be circulated or distributed, nor may the shares be offered or sold, or be made the subject of an invitation for subscription or purchase, whether directly or indirectly, to persons in Singapore other than (i) to an institutional investor under Section 274 of the Securities and Futures Act, Chapter 289 of Singapore (the “SFA”), (ii) to a relevant person, or any person pursuant to Section 275(1A), and in accordance with the conditions, specified in Section 275 of the SFA or (iii) otherwise pursuant to, and in accordance with the conditions of, any other applicable provision of the SFA.
Where the shares are subscribed or purchased under Section 275 by a relevant person which is: (a) a corporation (which is not an accredited investor) the sole business of which is to hold investments and the entire share capital of which is owned by one or more individuals, each of whom is an accredited investor; or (b) a trust (where the trustee is not an accredited investor) whose sole purpose is to hold investments and each beneficiary is an accredited investor, shares, debentures and units of shares and debentures of that corporation or the beneficiaries’ rights and interest in that trust shall not be transferable for 6 months after that corporation or that trust has acquired the shares under Section 275 except: (1) to an institutional investor under Section 274 of the SFA or to a relevant person, or any person pursuant to Section 275(1A), and in accordance with the conditions, specified in Section 275 of the SFA; (2) where no consideration is given for the transfer; or (3) by operation of law.
Notice to prospective investors in Japan
The securities have not been and will not be registered under the Financial Instruments and Exchange Law of Japan (the Financial Instruments and Exchange Law) and each underwriter has agreed that it will not offer or sell any securities, directly or indirectly, in Japan or to, or for the benefit of, any resident of Japan (which term as used herein means any person resident in Japan, including any corporation or other entity organized under the laws of Japan), or to others for re-offering or resale, directly or indirectly, in Japan or to a resident of Japan, except pursuant to an exemption from the registration requirements of, and otherwise in compliance with, the Financial Instruments and Exchange Law and any other applicable laws, regulations and ministerial guidelines of Japan.
Notice to prospective investors in Switzerland
The shares may not be publicly offered in Switzerland and will not be listed on the SIX Swiss Exchange (“SIX”) or on any other stock exchange or regulated trading facility in Switzerland. This document has been prepared without regard to the disclosure standards for issuance prospectuses under art. 652a or art. 1156 of the Swiss Code of Obligations or the disclosure standards for listing prospectuses under art. 27 ff. of the SIX Listing Rules or the listing rules of any other stock exchange or regulated trading facility in Switzerland. Neither this document nor any other offering or marketing material relating to the shares or the offering may be publicly distributed or otherwise made publicly available in Switzerland.
Neither this document nor any other offering or marketing material relating to the offering, the Company, the shares have been or will be filed with or approved by any Swiss regulatory authority. In particular, this document will not be filed with, and the offer of shares will not be supervised by, the Swiss Financial Market Supervisory Authority FINMA (FINMA), and the offer of shares has not been and will not be authorized under the Swiss Federal Act on Collective Investment Schemes (“CISA”). The investor protection afforded to acquirers of interests in collective investment schemes under the CISA does not extend to acquirers of shares.
- 165 -
Table of Contents
Notice to prospective investors in the Dubai International Financial Centre
This prospectus relates to an Exempt Offer in accordance with the Offered Securities Rules of the Dubai Financial Services Authority (“DFSA”). This prospectus is intended for distribution only to persons of a type specified in the Offered Securities Rules of the DFSA. It must not be delivered to, or relied on by, any other person. The DFSA has no responsibility for reviewing or verifying any documents in connection with Exempt Offers. The DFSA has not approved this prospectus nor taken steps to verify the information set forth herein and has no responsibility for the prospectus. The shares to which this prospectus relates may be illiquid and/or subject to restrictions on their resale. Prospective purchasers of the shares offered should conduct their own due diligence on the shares. If you do not understand the contents of this prospectus you should consult an authorized financial advisor.
Notice to prospective investors in the United Arab Emirates
This offering has not been approved or licensed by the Central Bank of the United Arab Emirates (“UAE”), Securities and Commodities Authority of the UAE and/or any other relevant licensing authority in the UAE including any licensing authority incorporated under the laws and regulations of any of the free zones established and operating in the territory of the UAE, in particular the DFSA, a regulatory authority of the Dubai International Financial Centre (DIFC). This offering does not constitute a public offer of securities in the UAE, DIFC and/or any other free zone in accordance with the Commercial Companies Law, Federal Law No 8 of 1984 (as amended), DFSA Offered Securities Rules and NASDAQ Dubai Listing Rules, accordingly, or otherwise. The shares may not be offered to the public in the UAE and/or any of the free zones.
The shares may be offered and issued only to a limited number of investors in the UAE or any of its free zones who qualify as sophisticated investors under the relevant laws and regulations of the UAE or the free zone concerned.
Other relationships
The underwriters and their respective affiliates are full service financial institutions engaged in various activities, which may include securities trading, commercial and investment banking, financial advisory, investment management, investment research, principal investment, hedging, financing and brokerage activities.
Certain of the underwriters and their affiliates have provided in the past to us and our affiliates and may provide from time to time in the future certain commercial banking, financial advisory, investment banking and other services for us and such affiliates in the ordinary course of their business, for which they have received and may continue to receive customary fees and commissions. J.P. Morgan Securities LLC, Barclays Capital Inc., Merrill Lynch, Pierce, Fenner & Smith Incorporated, Goldman, Sachs & Co. and Morgan Stanley & Co. LLC acted as initial purchasers in connection with the offering of senior notes. In addition, the underwriters and their affiliates act in various capacities under our senior credit facility. Barclays Bank PLC, an affiliate of Barclays Capital Inc., acts as administrative agent; Barclays Capital Inc., J.P. Morgan Securities LLC, Merrill Lynch, Pierce, Fenner & Smith Incorporated and Goldman Sachs Lending Partners LLC, an affiliate of Goldman, Sachs & Co., act as lead arrangers and joint bookrunners and J.P. Morgan Securities LLC acts as syndication agent; Merrill Lynch, Pierce, Fenner & Smith Incorporated and Goldman Sachs Lending Partners LLC, an affiliate of Goldman, Sachs & Co., act as co-documentation agents. Affiliates of each of J.P. Morgan Securities LLC, Barclays Capital Inc., Merrill Lynch, Pierce, Fenner & Smith Incorporated, Goldman, Sachs & Co. and Morgan Stanley & Co. LLC also act as lenders under our senior credit facility. In addition, from time to time, certain of the underwriters and their affiliates may effect transactions for their own account or the account of customers, and hold on behalf of themselves or their customers, long or short positions in our debt or equity securities or loans, and may do so in the future.
- 166 -
Table of Contents
In the ordinary course of their various business activities, the underwriters and their respective affiliates may make or hold a broad array of investments and actively trade debt and equity securities (or related derivative securities) and financial instruments (including bank loans) for their own account and for the accounts of their customers, and such investment and securities activities may involve securities and/or instruments of the issuer. The underwriters and their respective affiliates may also make investment recommendations and/or publish or express independent research views in respect of such securities or instruments and may at any time hold, or recommend to clients that they acquire, long and/or short positions in such securities and instruments.
SMBC Nikko Capital Markets Limited is not a U.S. registered broker-dealer and, therefore, intends to participate in the offering outside of the United States and, to the extent that the offering is within the United States, as facilitated by an affiliated U.S. registered broker-dealer, SMBC Nikko Securities America, Inc. (“SMBC Nikko-SI”), as permitted under applicable law. To that end, SMBC Nikko Capital Markets Limited and SMBC Nikko-SI have entered into an agreement pursuant to which SMBC Nikko-SI provides certain advisory and/or other services with respect to this offering. In return for the provision of such services by SMBC Nikko-SI, SMBC Nikko Capital Markets Limited will pay to SMBC Nikko-SI a mutually agreed fee.
- 167 -
Table of Contents
The validity of the issuance of the shares of common stock to be sold in this offering will be passed upon for us by Ropes & Gray LLP, Boston, Massachusetts. Some attorneys of Ropes & Gray LLP are members in RGIP, LLC, which is a direct investor in Dunkin’ Brands Group, Inc. and is also an investor in certain investment funds affiliated with Bain Capital Partners, LLC and Thomas H. Lee Partners L.P. RGIP, LLC directly and indirectly owns less than 1% of our common stock. The validity of the common stock offered hereby will be passed upon on behalf of the underwriters by Simpson Thacher & Bartlett LLP, New York, New York.
The consolidated financial statements of Dunkin’ Brands Group, Inc. as of December 25, 2010 and December 26, 2009, and for the years ended December 25, 2010, December 26, 2009 and December 27, 2008, have been included herein and in the registration statement in reliance upon the report of KPMG LLP, independent registered public accounting firm, appearing elsewhere herein, and upon the authority of said firm as experts in accounting and auditing. The audit report covering the December 25, 2010 consolidated financial statements refers to a change in the method of accounting for contingent rental income.
The financial statements of BR Korea Co., Ltd. (our joint venture entity in Korea) as of December 31, 2010 and December 31, 2009, and for each of the three fiscal years in the period ended December 31, 2010, including the reconciliation of such financials required by Regulation S-X, included in this prospectus have been audited by Deloitte Anjin LLC, an independent auditor, as stated in their report appearing herein and elsewhere in the registration statement (which report expresses an unqualified opinion on the financial statements and includes an explanatory paragraph referring to the nature and effect of difference between accounting principles generally accepted in the Republic of Korea from those in the United States of America). Such financial statements have been so included in reliance upon the report of such firm given upon their authority as experts in accounting and auditing.
The financial statements of B-R 31 Ice Cream Co., Ltd. (our joint venture entity in Japan) as of and for the year ended December 31, 2010 included in this registration statement have been so included in reliance on the report of PricewaterhouseCoopers Aarata, independent accountants, given on the authority of said firm as experts in auditing and accounting.
The financial statements of BR Korea Co., Ltd. and B-R Ice Cream Co., Ltd. referred to above are included herein in accordance with the requirements of Rule 3-09 of Regulation S-X.
- 168 -
Table of Contents
Where you can find more information
We have filed with the SEC a registration statement on Form S-1 under the Securities Act with respect to the shares of our common stock being offered by this prospectus. This prospectus, which forms a part of the registration statement, does not contain all of the information set forth in the registration statement. For further information with respect to us and the shares of our common stock, reference is made to the registration statement and the exhibits and schedules filed as a part thereof. Statements contained in this prospectus as to the contents of any contract or other document are not necessarily complete. We are not currently subject to the informational requirements of the Securities Exchange Act of 1934. As a result of the offering of the shares of our common stock, we will become subject to the informational requirements of the Exchange Act and, in accordance therewith, will file reports and other information with the SEC. The registration statement, such reports and other information can be inspected and copied at the Public Reference Room of the SEC located at 100 F Street, N.E., Washington, D.C. 20549. Copies of such materials, including copies of all or any portion of the registration statement, can be obtained from the Public Reference Room of the SEC at prescribed rates. You can call the SEC at 1-800-SEC-0330 to obtain information on the operation of the Public Reference Room. Such materials may also be accessed electronically by means of the SEC’s website at www.sec.gov.
- 169 -
Table of Contents
Index to consolidated financial statements
Dunkin’ Brands Group, Inc.
F-1
Table of Contents
Report of Independent Registered Public Accounting Firm
The Board of Directors and Stockholders
Dunkin’ Brands Group, Inc.:
We have audited the accompanying consolidated balance sheets of Dunkin’ Brands Group, Inc. and subsidiaries as of December 25, 2010 and December 26, 2009, and the related consolidated statements of operations, stockholders’ equity (deficit) and comprehensive income (loss), and cash flows for the years ended December 25, 2010, December 26, 2009 and December 27, 2008. These consolidated financial statements are the responsibility of the Company’s management. Our responsibility is to express an opinion on these consolidated financial statements based on our audits.
We conducted our audits in accordance with the standards of the Public Company Accounting Oversight Board (United States). Those standards require that we plan and perform the audit to obtain reasonable assurance about whether the financial statements are free of material misstatement. An audit includes examining, on a test basis, evidence supporting the amounts and disclosures in the financial statements. An audit also includes assessing the accounting principles used and significant estimates made by management, as well as evaluating the overall financial statement presentation. We believe that our audits provide a reasonable basis for our opinion.
In our opinion, the consolidated financial statements referred to above present fairly, in all material respects, the financial position of Dunkin’ Brands Group, Inc. and subsidiaries as of December 25, 2010 and December 26, 2009, and the results of their operations and their cash flows for the years ended December 25, 2010, December 26, 2009 and December 27, 2008, in conformity with U.S. generally accepted accounting principles.
As discussed in note 3 to the consolidated financial statements, the Company has elected to change its method of accounting for contingent rental income in 2010 and has applied the change retrospectively to all prior periods presented.
/s/ KPMG LLP
Boston, Massachusetts
May 2, 2011
F-2
Table of Contents
Dunkin’ Brands Group, Inc. and subsidiaries
Consolidated balance sheets
(In thousands)
| December 25, 2010 |
December 26, 2009 |
|||||||
| (As adjusted) | ||||||||
| Assets |
||||||||
| Current assets: |
||||||||
| Cash and cash equivalents |
$ | 134,100 | 53,210 | |||||
| Restricted cash |
— | 109,799 | ||||||
| Accounts receivable, net |
35,239 | 32,893 | ||||||
| Notes and other receivables, net |
44,704 | 38,030 | ||||||
| Assets held for sale |
4,328 | 9,425 | ||||||
| Deferred income taxes, net |
12,570 | 14,707 | ||||||
| Restricted assets of advertising funds |
25,113 | 24,482 | ||||||
| Prepaid income taxes |
7,641 | 19,786 | ||||||
| Prepaid expenses and other current assets |
20,682 | 19,773 | ||||||
| Total current assets |
284,377 | 322,105 | ||||||
| Property and equipment, net |
193,273 | 209,659 | ||||||
| Investments in joint ventures |
169,276 | 147,902 | ||||||
| Goodwill |
888,655 | 887,850 | ||||||
| Other intangible assets, net |
1,535,657 | 1,570,176 | ||||||
| Restricted cash |
404 | 8,394 | ||||||
| Other assets |
75,646 | 78,631 | ||||||
| Total assets |
$ | 3,147,288 | 3,224,717 | |||||
| Liabilities, Common Stock, and Stockholders’ Equity (Deficit) |
||||||||
| Current liabilities: |
||||||||
| Current portion of long-term debt |
$ | 12,500 | — | |||||
| Capital lease obligations |
205 | 221 | ||||||
| Accounts payable |
9,822 | 10,716 | ||||||
| Liabilities of advertising funds |
48,213 | 47,815 | ||||||
| Deferred income |
26,221 | 26,547 | ||||||
| Other current liabilities |
183,594 | 159,272 | ||||||
| Total current liabilities |
280,555 | 244,571 | ||||||
| Long-term debt, net |
1,847,016 | 1,446,319 | ||||||
| Capital lease obligations |
5,160 | 5,217 | ||||||
| Unfavorable operating leases acquired |
24,744 | 29,085 | ||||||
| Deferred income |
21,326 | 35,129 | ||||||
| Deferred income taxes, net |
586,337 | 618,324 | ||||||
| Other long-term liabilities |
75,909 | 75,464 | ||||||
| Total long-term liabilities |
2,560,492 | 2,209,538 | ||||||
| Commitments and contingencies (note 15) |
||||||||
| Common stock, Class L, $0.001 par value; 100,000,000 shares authorized; 22,994,523 and 22,980,333 shares issued and outstanding at December 25, 2010 and December 26, 2009, respectively |
840,582 | 1,232,001 | ||||||
| Stockholders’ equity (deficit): |
||||||||
| Common stock, Class A, $0.001 par value; 400,000,000 shares authorized; 196,146,998 and 198,936,101 shares issued and outstanding at December 25, 2010 and December 26, 2009, respectively |
191 | 190 | ||||||
| Additional paid-in capital |
195,063 | 192,352 | ||||||
| Treasury stock, at cost |
(1,807 | ) | (1,114 | ) | ||||
| Accumulated deficit |
(741,415 | ) | (657,250 | ) | ||||
| Accumulated other comprehensive income |
13,627 | 4,429 | ||||||
| Total stockholders’ equity (deficit) |
(534,341 | ) | (461,393 | ) | ||||
| Total liabilities, common stock, and stockholders’ equity (deficit) |
$ | 3,147,288 | 3,224,717 | |||||
See accompanying notes to consolidated financial statements.
F-3
Table of Contents
Dunkin’ Brands Group, Inc. and subsidiaries
Consolidated statements of operations
(In thousands)
| Fiscal year ended | ||||||||||||
| December 25, 2010 |
December 26, 2009 |
December 27, 2008 |
||||||||||
| (As adjusted) | (As adjusted) | |||||||||||
| Revenues: |
||||||||||||
| Franchise fees and royalty income |
$ | 359,927 | 344,020 | 349,047 | ||||||||
| Rental income |
91,102 | 93,651 | 97,886 | |||||||||
| Sales of ice cream products |
84,989 | 75,256 | 71,445 | |||||||||
| Other revenues |
41,117 | 25,146 | 26,551 | |||||||||
| Total revenues |
577,135 | 538,073 | 544,929 | |||||||||
| Operating costs and expenses: |
||||||||||||
| Occupancy expenses—franchised restaurants |
53,739 | 51,964 | 55,581 | |||||||||
| Cost of ice cream products |
59,175 | 47,432 | 49,407 | |||||||||
| General and administrative expenses, net |
223,620 | 197,005 | 196,841 | |||||||||
| Depreciation and amortization |
57,826 | 62,911 | 66,300 | |||||||||
| Goodwill impairment |
— | — | 294,478 | |||||||||
| Other impairment charges |
7,075 | 8,517 | 37,384 | |||||||||
| Total operating costs and expenses |
401,435 | 367,829 | 699,991 | |||||||||
| Equity in net income of joint ventures |
17,825 | 14,301 | 14,169 | |||||||||
| Operating income (loss) |
193,525 | 184,545 | (140,893 | ) | ||||||||
| Other income (expense): |
||||||||||||
| Interest income |
305 | 386 | 3,512 | |||||||||
| Interest expense |
(112,837 | ) | (115,405 | ) | (119,456 | ) | ||||||
| Gain (loss) on debt extinguishment |
(61,955 | ) | 3,684 | — | ||||||||
| Other gains (losses), net |
408 | 1,066 | (3,929 | ) | ||||||||
| Total other expense |
(174,079 | ) | (110,269 | ) | (119,873 | ) | ||||||
| Income (loss) before income taxes |
19,446 | 74,276 | (260,766 | ) | ||||||||
| Provision (benefit) for income taxes |
(7,415 | ) | 39,268 | 9,132 | ||||||||
| Net income (loss) |
$ | 26,861 | 35,008 | (269,898 | ) | |||||||
| Earnings (loss) per share: |
||||||||||||
| Class L-basic and diluted |
$ | 4.87 | 4.57 | 4.17 | ||||||||
| Class A-basic and diluted |
$ | (0.45 | ) | (0.37 | ) | (1.96 | ) | |||||
See accompanying notes to consolidated financial statements.
F-4
Table of Contents
Dunkin’ Brands Group, Inc. and subsidiaries
Consolidated statements of stockholders’ equity (deficit) and comprehensive income (loss)
(In thousands)
| Common stock, Class A |
Additional paid-in capital |
Treasury stock, at cost |
Accumulated deficit |
Accumulated other comprehensive income (loss) |
Total | |||||||||||||||||||||||
| Shares |
Amount |
|||||||||||||||||||||||||||
| Balance at December 29, 2007 (as adjusted) |
185,387 | $ | 185 | 187,027 | (299 | ) | (222,348 | ) | 4,727 | (30,708 | ) | |||||||||||||||||
| Net loss (as adjusted) |
— | — | — | — | (269,898 | ) | — | (269,898 | ) | |||||||||||||||||||
| Effect of foreign currency translation, net of deferred taxes of $5,356 |
— | — | — | — | — | (6,110 | ) | (6,110 | ) | |||||||||||||||||||
| Other |
— | — | — | — | — | (181 | ) | (181 | ) | |||||||||||||||||||
| Comprehensive loss (as adjusted) |
(276,189 | ) | ||||||||||||||||||||||||||
| Accretion of Class L preferred return |
— | — | — | — | (95,452 | ) | — | (95,452 | ) | |||||||||||||||||||
| Share-based compensation expense |
1,795 | 2 | 1,747 | — | — | — | 1,749 | |||||||||||||||||||||
| Repurchases of common stock |
— | — | — | (428 | ) | — | — | (428 | ) | |||||||||||||||||||
| Excess tax benefits from share-based compensation |
— | — | 487 | — | — | — | 487 | |||||||||||||||||||||
| Balance at December 27, 2008 (as adjusted) |
187,182 | 187 | 189,261 | (727 | ) | (587,698 | ) | (1,564 | ) | (400,541 | ) | |||||||||||||||||
| Net income (as adjusted) |
— | — | — | — | 35,008 | — | 35,008 | |||||||||||||||||||||
| Effect of foreign currency translation, net of deferred taxes of $411 |
— | — | — | — | — | 5,986 | 5,986 | |||||||||||||||||||||
| Other |
— | — | — | — | — | 7 | 7 | |||||||||||||||||||||
| Comprehensive income (as adjusted) |
41,001 | |||||||||||||||||||||||||||
| Accretion of Class L preferred return |
— | — | — | — | (104,560 | ) | — | (104,560 | ) | |||||||||||||||||||
| Issuance of common stock |
565 | 1 | 236 | — | — | — | 237 | |||||||||||||||||||||
| Share-based compensation expense |
1,970 | 2 | 1,743 | — | — | — | 1,745 | |||||||||||||||||||||
| Repurchases of common stock |
— | — | — | (387 | ) | — | — | (387 | ) | |||||||||||||||||||
| Excess tax benefits from share-based compensation |
— | — | 1,112 | — | — | — | 1,112 | |||||||||||||||||||||
| Balance at December 26, 2009 (as adjusted) |
189,717 | 190 | 192,352 | (1,114 | ) | (657,250 | ) | 4,429 | (461,393 | ) | ||||||||||||||||||
| Net income |
— | — | — | — | 26,861 | — | 26,861 | |||||||||||||||||||||
| Effect of foreign currency translation, net of deferred taxes of $390 |
— | — | — | — | — | 9,624 | 9,624 | |||||||||||||||||||||
| Other |
— | — | — | — | — | (426 | ) | (426 | ) | |||||||||||||||||||
| Comprehensive income |
36,059 | |||||||||||||||||||||||||||
| Accretion of Class L preferred return |
— | — | — | — | (111,026 | ) | — | (111,026 | ) | |||||||||||||||||||
| Issuance of common stock |
128 | — | 141 | — | — | — | 141 | |||||||||||||||||||||
| Share-based compensation expense |
1,341 | 1 | 1,460 | — | — | — | 1,461 | |||||||||||||||||||||
| Repurchases of common stock |
— | — | — | (693 | ) | — | — | (693 | ) | |||||||||||||||||||
| Excess tax benefits from share-based compensation |
— | — | 1,110 | — | — | — | 1,110 | |||||||||||||||||||||
| Balance at December 25, 2010 |
191,186 | $ | 191 | 195,063 | (1,807 | ) | (741,415 | ) | 13,627 | (534,341 | ) | |||||||||||||||||
See accompanying notes to consolidated financial statements.
F-5
Table of Contents
Dunkin’ Brands Group, Inc. and subsidiaries
Consolidated statements of cash flows
(In thousands)
| Fiscal year ended | ||||||||||||
| December 25, 2010 |
December 26, 2009 |
December 27, 2008 |
||||||||||
| (As adjusted) | (As adjusted) | |||||||||||
| Cash flows from operating activities: |
||||||||||||
| Net income (loss) |
$ | 26,861 | 35,008 | (269,898 | ) | |||||||
| Adjustments to reconcile net income (loss) to net cash provided by operating activities: |
||||||||||||
| Depreciation and amortization |
57,826 | 62,911 | 66,300 | |||||||||
| Amortization of deferred financing costs and original issue discount |
6,523 | 7,394 | 7,051 | |||||||||
| Loss (gain) on debt extinguishment |
61,955 | (3,684 | ) | — | ||||||||
| Impact of unfavorable operating leases acquired |
(4,320 | ) | (5,027 | ) | (5,995 | ) | ||||||
| Deferred income taxes |
(28,389 | ) | 18,301 | (24,147 | ) | |||||||
| Excess tax benefits from share-based compensation |
(1,110 | ) | — | — | ||||||||
| Goodwill impairment |
— | — | 294,478 | |||||||||
| Other impairment charges |
7,075 | 8,517 | 37,384 | |||||||||
| Provision for bad debt |
1,505 | 7,363 | 5,891 | |||||||||
| Share-based compensation expense |
1,461 | 1,745 | 1,749 | |||||||||
| Equity in net income of joint ventures |
(17,825 | ) | (14,301 | ) | (14,169 | ) | ||||||
| Dividends received from joint ventures, net |
6,603 | 5,010 | 5,457 | |||||||||
| Other |
(137 | ) | 123 | 504 | ||||||||
| Change in operating assets and liabilities: |
||||||||||||
| Restricted cash |
101,675 | (32,520 | ) | 6,003 | ||||||||
| Accounts, notes, and other receivables, net |
(11,815 | ) | (17,509 | ) | (25,765 | ) | ||||||
| Other current assets |
6,701 | 1,832 | 7,388 | |||||||||
| Accounts payable |
(1,115 | ) | 3,008 | (815 | ) | |||||||
| Other current liabilities |
29,384 | 16,698 | 357 | |||||||||
| Liabilities of advertising funds, net |
(346 | ) | 19,681 | (5,477 | ) | |||||||
| Income taxes payable, net |
1,341 | 5,737 | (18,650 | ) | ||||||||
| Deferred income |
(12,809 | ) | (4,190 | ) | 2,665 | |||||||
| Other, net |
(2,040 | ) | (18 | ) | 4,370 | |||||||
| Net cash provided by operating activities |
229,004 | 116,079 | 74,681 | |||||||||
| Cash flows from investing activities: |
||||||||||||
| Additions to property and equipment |
(15,358 | ) | (18,012 | ) | (27,518 | ) | ||||||
| Other, net |
(249 | ) | — | 90 | ||||||||
| Net cash used in investing activities |
(15,607 | ) | (18,012 | ) | (27,428 | ) | ||||||
| Cash flows from financing activities: |
||||||||||||
| Proceeds from issuance of long-term debt |
1,859,375 | — | — | |||||||||
| Repayment and repurchases of long-term debt |
(1,470,985 | ) | (145,183 | ) | — | |||||||
| Proceeds from (repayment of) short-term debt |
— | (64,190 | ) | 64,190 | ||||||||
| Proceeds from issuance of common stock |
895 | 2,885 | — | |||||||||
| Repurchases of common stock |
(3,890 | ) | (3,457 | ) | (1,467 | ) | ||||||
| Dividends paid on Class L common stock |
(500,002 | ) | — | — | ||||||||
| Payments on capital lease obligations |
(251 | ) | (183 | ) | (203 | ) | ||||||
| Deferred financing costs |
(34,979 | ) | (613 | ) | (6 | ) | ||||||
| Change in restricted cash |
16,144 | 2,276 | 1,756 | |||||||||
| Excess tax benefits from share-based compensation |
1,110 | — | 487 | |||||||||
| Net cash provided by (used in) financing activities |
(132,583 | ) | (208,465 | ) | 64,757 | |||||||
| Effect of exchange rate changes on cash |
76 | (29 | ) | (451 | ) | |||||||
| Increase (decrease) in cash and cash equivalents |
80,890 | (110,427 | ) | 111,559 | ||||||||
| Cash and cash equivalents, beginning of year |
53,210 | 163,637 | 52,078 | |||||||||
| Cash and cash equivalents, end of year |
$ | 134,100 | 53,210 | 163,637 | ||||||||
| Supplemental cash flow information: |
||||||||||||
| Cash paid for: |
||||||||||||
| Income taxes |
$ | 19,206 | 15,920 | 51,609 | ||||||||
| Interest |
100,629 | 107,038 | 112,785 | |||||||||
| Noncash investing activities: |
||||||||||||
| Property and equipment included in accounts payable and accrued expenses |
1,822 | 1,596 | 1,323 | |||||||||
| Purchase of leaseholds in exchange for capital lease obligation |
178 | 1,381 | 860 | |||||||||
See accompanying notes to consolidated financial statements.
F-6
Table of Contents
Dunkin’ Brands Group, Inc. and subsidiaries
Notes to consolidated financial statements
December 25, 2010 and December 26, 2009
(1) Description of business and organization
Dunkin’ Brands Group, Inc. (DBGI) and subsidiaries (collectively, the Company), through its brand companies, is one of the world’s largest franchisors of restaurants serving coffee and baked goods as well as ice cream within the quick service restaurant segment of the restaurant industry. We develop, franchise, and license a system of both traditional and nontraditional quick service restaurants and, in limited circumstances, own and operate individual locations. Through our Dunkin’ Donuts brand, we develop and franchise restaurants featuring coffee, donuts, bagels, and related products. Through our Baskin-Robbins brand, we develop and franchise restaurants featuring ice cream, frozen beverages, and related products. Additionally, our subsidiaries located in Canada and the United Kingdom (UK) manufacture and/or distribute Baskin-Robbins ice cream products to Baskin-Robbins franchisees and licensees in various international markets.
DBGI is owned by funds controlled by Bain Capital Partners, LLC, The Carlyle Group, and Thomas H. Lee Partners, L.P. (collectively, the Sponsors or BCT).
Throughout these financial statements, “the Company,” “we,” “us,” “our,” and “management” refer to DBGI and subsidiaries taken as a whole.
(2) Summary of significant accounting policies
(a) Fiscal year
The Company operates and reports financial information on a 52 or 53-week year on a 13-week quarter basis with the fiscal year ending on the last Saturday in December and fiscal quarters ending on the 13th Saturday of each quarter. The data periods contained within fiscal years 2010, 2009, and 2008 reflect the results of operations for the 52-week periods ended December 25, 2010, December 26, 2009, and December 27, 2008, respectively.
(b) Basis of presentation and consolidation
The accompanying consolidated financial statements include the accounts of DBGI and subsidiaries and have been prepared in accordance with accounting principles generally accepted in the United States of America (U.S. GAAP). All significant transactions and balances between subsidiaries and affiliates listed above have been eliminated in consolidation.
We consolidate entities in which we have a controlling financial interest, the usual condition of which is ownership of a majority voting interest. We also consider for consolidation an entity, in which we have certain interests, where the controlling financial interest may be achieved through arrangements that do not involve voting interests. Such an entity, known as a variable interest entity (VIE), is required to be consolidated by its primary beneficiary. The primary beneficiary is the entity that possesses the power to direct the activities of the VIE that most significantly impact its economic performance and has the obligation to absorb losses or the right to receive benefits from the VIE that are significant to it. The principal entities in which we possess a variable interest include franchise entities, the advertising funds (see note 5), and our investments in joint ventures. We do not possess any ownership interests in franchise entities, except for our investments in various joint ventures that are accounted for under the equity method. Additionally, we generally do not provide financial
| F-7 | (Continued) |
Table of Contents
Dunkin’ Brands Group, Inc. and subsidiaries
Notes to consolidated financial statements—(continued)
December 25, 2010 and December 26, 2009
support to franchise entities in a typical franchise relationship. As our franchise and license arrangements provide our franchisee and licensee entities the power to direct the activities that most significantly impact their economic performance, we do not consider ourselves the primary beneficiary of any such entity that might be a VIE. Based on the results of our analysis of potential VIEs, we have not consolidated any franchise or other entities. The Company’s maximum exposure to loss resulting from involvement with potential VIEs is attributable to aged trade and notes receivable balances, outstanding loan guarantees (see note 15(b)), and future lease payments due from franchisees (see note 11).
(c) Accounting estimates
The preparation of consolidated financial statements in conformity with U.S. GAAP requires the use of estimates, judgments, and assumptions that affect the reported amounts of assets, liabilities, revenues, expenses, and related disclosure of contingent assets and liabilities at the date of the financial statements and for the period then ended. Significant estimates are made in the calculations and assessments of the following: (a) allowance for doubtful accounts and notes receivables, (b) impairment of tangible and intangible assets, (c) income taxes, (d) real estate reserves, (e) lease accounting estimates, (f) gift certificate breakage, and (g) contingencies. Estimates are based on historical experience, current conditions, and various other assumptions that are believed to be reasonable under the circumstances. These estimates form the basis for making judgments about the carrying values of assets and liabilities when they are not readily apparent from other sources. We adjust such estimates and assumptions when facts and circumstances dictate. Actual results may differ from these estimates under different assumptions or conditions. Illiquid credit markets, volatile equity and foreign currency markets, and declines in consumer spending have combined to increase the uncertainty inherent in such estimates and assumptions.
(d) Cash and cash equivalents and restricted cash
The Company continually monitors its positions with, and the credit quality of, the financial institutions in which it maintains its deposits and investments. As of December 25, 2010 and December 26, 2009, we maintained balances in various cash accounts in excess of federally insured limits. All highly liquid instruments purchased with an original maturity of three months or less are considered cash equivalents.
As part of the securitization transaction (see note 9), certain cash accounts were established in the name of Citibank, N.A. (the Trustee) for the benefit of Ambac Assurance Corporation (Ambac), the Trustee, and the holders of our ABS Notes, and were restricted in their use. The Company held restricted cash of $118.2 million as of December 26, 2009, which primarily represented (i) cash collections held by the Trustee, (ii) interest, insurer premiums, and commitment fee reserves held by the Trustee related to our ABS Notes (see note 9), (iii) product sourcing and real estate reserves used to pay ice cream product obligations to affiliates and real estate obligations, respectively, (iv) cash collections related to the advertising funds and gift card/certificate programs, and (v) cash collateral requirements associated with our Canadian guaranteed financing arrangements (see note 15(b)). Changes in restricted cash held for interest, insurer premiums, commitment fee reserves, or other financing arrangements are presented as a component of cash flows from financing activities in the accompanying consolidated statements of cash flows. Other changes in restricted cash are presented as a component of operating activities. In connection with the repayment of the ABS Notes in December 2010 (see
| F-8 | (Continued) |
Table of Contents
Dunkin’ Brands Group, Inc. and subsidiaries
Notes to consolidated financial statements—(continued)
December 25, 2010 and December 26, 2009
note 9), the cash restrictions associated with the ABS Notes were released. Cash held related to the advertising funds and the Company’s gift card/certificate programs are classified as unrestricted cash as of December 25, 2010 as there are no legal restrictions on the use of these funds; however, the Company intends to use these funds solely to support the advertising funds and gift card/certificate programs rather than to fund operations. Total cash balances related to the advertising funds and gift card/certificate programs as of December 25, 2010 were $82.3 million. The Company held restricted cash of $404 thousand as of December 25, 2010, which represents cash collateral requirements associated with our Canadian guaranteed financing arrangements (see note 15(b)).
(e) Fair value of financial instruments
The carrying amounts of accounts receivable, notes and other receivables, assets and liabilities related to the advertising funds, accounts payable, other payables, and accrued expenses approximate fair value because of their short-term nature. For long-term receivables, we review the creditworthiness of the counterparty on a quarterly basis, and adjust the carrying value as necessary. We believe the carrying value of long-term receivables of $4.8 million and $1.4 million as of December 25, 2010 and December 26, 2009, respectively, approximates fair value.
Financial assets and liabilities are categorized, based on the inputs to the valuation technique, into a three-level fair value hierarchy. The fair value hierarchy gives the highest priority to the quoted prices in active markets for identical assets and liabilities and lowest priority to unobservable inputs. Observable market data, when available, is required to be used in making fair value measurements. When inputs used to measure fair value fall within different levels of the hierarchy, the level within which the fair value measurement is categorized is based on the lowest level input that is significant to the fair value measurement.
Financial assets and liabilities measured at fair value on a recurring basis as of December 25, 2010 are summarized as follows (in thousands):
| Quoted prices in active markets for identical assets (Level 1) |
Significant other observable inputs (Level 2) |
|||||||
| Assets: |
||||||||
| Mutual funds |
$ | 2,283 | — | |||||
| Total assets |
$ | 2,283 | — | |||||
| Liabilities: |
||||||||
| Deferred compensation liabilities |
$ | — | 7,397 | |||||
| Total liabilities |
$ | — | 7,397 | |||||
The mutual funds and deferred compensation liabilities relate to the Dunkin’ Brands, Inc. Non-Qualified Deferred Compensation Plan (DCP Plan), which allows for pre-tax salary deferrals for certain qualifying employees (see note 16). Changes in the fair value of the deferred compensation liabilities are derived using quoted prices in active markets of the asset selections made by the participants. The deferred compensation
| F-9 | (Continued) |
Table of Contents
Dunkin’ Brands Group, Inc. and subsidiaries
Notes to consolidated financial statements—(continued)
December 25, 2010 and December 26, 2009
liabilities are classified within Level 2, as defined under U.S. GAAP, because their inputs are derived principally from observable market data by correlation to the hypothetical investments. The Company holds mutual funds, as well as money market funds, to partially offset the Company’s liabilities under the DCP Plan. The changes in the fair value of the mutual funds are derived using quoted prices in active markets for the specific funds. As such, the mutual funds are classified within Level 1, as defined under U.S. GAAP.
The carrying value and estimated fair value of long-term debt at December 25, 2010 and December 26, 2009 was as follows (in thousands):
| December 25, 2010 | December 26, 2009 | |||||||||||||||
| Financial liabilities | Carrying value |
Estimated fair value |
Carrying value |
Estimated fair value |
||||||||||||
| Term B Loans |
$ | 1,243,823 | 1,266,250 | — | — | |||||||||||
| Senior Notes |
615,693 | 631,250 | — | — | ||||||||||||
| Series 2006-1 Class A-2 Notes |
— | — | 1,346,320 | 1,279,018 | ||||||||||||
| Series 2006-1 Class M-1 Notes |
— | — | 99,999 | 84,000 | ||||||||||||
| $ | 1,859,516 | 1,897,500 | 1,446,319 | 1,363,018 | ||||||||||||
The estimated fair values of our Term B Loans and Senior Notes are estimated based on bid and offer prices for the same or similar instruments. The estimated fair values of our A-2 and M-1 Notes are based on current market rates for debt with similar terms and remaining maturities, and do not consider the third-party guarantee of our principal and interest payments. The estimated fair value of our A-2 Notes is also based on executed transactions. Considerable judgment is required to develop these estimates.
(f) Inventories
Inventories consist of ice cream and ice cream products. Cost is determined by the first-in, first-out method. Finished products are valued at the lower of cost or estimated net realizable value. Raw materials are valued at the lower of actual or replacement cost. Inventories are included within prepaid expenses and other current assets in the accompanying consolidated balance sheets.
(g) Assets held for sale
Assets held for sale primarily represent costs incurred by the Company for store equipment and leasehold improvements constructed for sale to franchisees, as well as restaurants formerly operated by franchisees waiting to be resold. The value of such restaurants and related assets is reduced to reflect net recoverable values, with such reductions recorded to general and administrative expenses, net in the consolidated statements of operations. Internal specialists estimate the amount to be recovered from the sale of such assets based on their knowledge of the (a) market in which the store is located, (b) results of the Company’s previous efforts to dispose of similar assets, and (c) current economic conditions. The actual cost of such assets held for sale is affected by specific factors such as the nature, age, location, and condition of the assets, as well as the economic environment and inflation. At December 26, 2009, assets held for sale also included $3.9 million of corporate assets, which were sold during fiscal year 2010.
| F-10 | (Continued) |
Table of Contents
Dunkin’ Brands Group, Inc. and subsidiaries
Notes to consolidated financial statements—(continued)
December 25, 2010 and December 26, 2009
We classify restaurants and their related assets as held for sale and suspend depreciation and amortization when (a) we make a decision to refranchise or sell the property, (b) the stores are available for immediate sale, (c) we have begun an active program to locate a buyer, (d) significant changes to the plan of sale are not likely, and (e) the sale is probable within one year.
(h) Property and equipment
Property and equipment are stated at cost less accumulated depreciation and amortization. Depreciation is provided using the straight-line method over the estimated useful lives of the respective assets. Leasehold improvements are depreciated over the shorter of the estimated useful life or the remaining lease term of the related asset. Estimated useful lives are as follows:
| Years | ||||
| Buildings |
20 – 35 | |||
| Leasehold improvements |
5 – 25 | |||
| Store, production, and other equipment |
3 – 12 | |||
Routine maintenance and repair costs are charged to expense as incurred. Major improvements, additions, or replacements that extend the life, increase capacity, or improve the safety or the efficiency of property are capitalized at cost and depreciated. Major improvements to leased property are capitalized as leasehold improvements and depreciated.
(i) Leases
When determining lease terms, we begin with the point at which the Company obtains control and possession of the leased properties and we include option periods for which failure to renew the lease imposes a penalty on the Company in such an amount that the renewal appears, at the inception of the lease, to be reasonably assured, which generally includes option periods through the end of the related franchise agreement term. We also include any rent holidays in the determination of the lease term.
We record rent expense and rent income for leases and subleases, respectively, that contain scheduled rent increases on a straight-line basis over the lease term as defined above. In certain cases, contingent rentals are based on sales levels of our franchisees, in excess of stipulated amounts. Contingent rentals are included in rent income and rent expense as they are earned or accrued, respectively.
We occasionally provide to our sublessees, or receive from our landlords, tenant improvement dollars. Tenant improvement dollars paid to our sublessees are recorded as a deferred rent asset. For fixed asset and/or leasehold purchases for which we receive tenant improvement dollars from our landlords, we record the property and equipment and/or leasehold improvements gross and establish a deferred rent obligation. The deferred lease assets and obligations are amortized on a straight-line basis over the determined sublease and lease terms, respectively.
Management regularly reviews sublease arrangements, where we are the lessor, for losses on sublease arrangements. We recognize a loss, discounted using risk-free credit rates, when costs expected to be incurred under an operating prime lease exceed the anticipated future revenue stream of the operating sublease.
| F-11 | (Continued) |
Table of Contents
Dunkin’ Brands Group, Inc. and subsidiaries
Notes to consolidated financial statements—(continued)
December 25, 2010 and December 26, 2009
Furthermore, for properties where we do not currently have an operational franchise or other third-party sublessee and are under long-term lease agreements, the present value of any remaining liability under the lease, discounted using risk-free credit rates and net of estimated sublease recovery, is recognized as a liability and charged to operations at the time we cease use of the property. The value of any equipment and leasehold improvements related to a closed store is assessed for potential impairment (see note 2(j)).
(j) Impairment of long-lived assets
Long-lived assets that are used in operations are tested for recoverability whenever events or changes in circumstances indicate that the carrying amount may not be recoverable through undiscounted future cash flows. Recognition and measurement of a potential impairment is performed on assets grouped with other assets and liabilities at the lowest level where identifiable cash flows are largely independent of the cash flows of other assets and liabilities. An impairment loss is the amount by which the carrying amount of a long-lived asset or asset group exceeds its estimated fair value. Fair value is generally estimated by internal specialists based on the present value of anticipated future cash flows or, if required, by independent third-party valuation specialists, depending on the nature of the assets or asset group.
(k) Investments in joint ventures
The Company accounts for its joint venture interests in B-R 31 Ice Cream Co., Ltd. (BR Japan) and BR-Korea Co., Ltd. (BR Korea) in accordance with the equity method. As a result of the acquisition of the Company by BCT on March 1, 2006 (BCT Acquisition), the Company recorded a step-up in the basis of our investments in BR Japan and BR Korea. The basis difference is comprised of amortizable franchise rights and related tax liabilities and nonamortizable goodwill. The franchise rights and related tax liabilities are amortized in a manner that reflects the estimated benefits from the use of the intangible asset over a period of 14 years. The franchise rights were valued based on an estimate of future cash flows to be generated from the ongoing management of the contracts over their remaining useful lives.
(l) Goodwill and other intangible assets
Goodwill and trade names (indefinite lived intangibles) have been assigned to our reporting units, which are also our operating segments, for purposes of impairment testing. All of our reporting units have indefinite lived intangibles associated with them.
We evaluate the remaining useful life of our trade names to determine whether current events and circumstances continue to support an indefinite useful life. In addition, all of our indefinite lived intangible assets are tested for impairment annually. The trade name intangible asset impairment test consists of a comparison of the fair value of each trade name with its carrying value, with any excess of carrying value over fair value being recognized as an impairment loss. The goodwill impairment test consists of a comparison of each reporting unit’s fair value to its carrying value. The fair value of a reporting unit is an estimate of the amount for which the unit as a whole could be sold in a current transaction between willing parties. If the carrying value of a reporting unit exceeds its fair value, goodwill is written down to its implied fair value. We have selected the first day of our July fiscal month as the date on which to perform our annual impairment test for all indefinite lived intangible assets. We also test for impairment whenever events or circumstances indicate that the fair value of such indefinite lived intangibles has been impaired.
| F-12 | (Continued) |
Table of Contents
Dunkin’ Brands Group, Inc. and subsidiaries
Notes to consolidated financial statements—(continued)
December 25, 2010 and December 26, 2009
Other intangible assets consist primarily of franchise and international license rights (franchise rights), ice cream manufacturing and territorial franchise agreement license rights (license rights), and operating lease interests acquired related to our prime leases and subleases (operating leases acquired). Franchise rights recorded in the consolidated balance sheets were valued using an excess earnings approach. The valuation of franchise rights was calculated using an estimation of future royalty income and related expenses associated with existing franchise contracts at the acquisition date. Our valuation included assumptions related to the projected attrition and renewal rates on those existing franchise arrangements being valued. License rights recorded in the consolidated balance sheets were valued based on an estimate of future revenues and costs related to the ongoing management of the contracts over the remaining useful lives. Favorable and unfavorable operating leases acquired were recorded on purchased leases based on differences between contractual rents under the respective lease agreements and prevailing market rents at the lease acquisition date. Favorable operating leases acquired are included as a component of other intangible assets in the consolidated balance sheets. Due to the high level of lease renewals made by Dunkin’ Donuts’ franchisees, all lease renewal options for the Dunkin’ Donuts leases were included in the valuation of the favorable operating leases acquired. Amortization of franchise rights, license rights, and favorable operating leases acquired is recorded as amortization expense in the consolidated statements of operations and amortized over the respective franchise, license, and lease terms using the straight-line method.
Unfavorable operating leases acquired related to our prime and subleases are recorded in the liability section of the consolidated balance sheets and are amortized into rental expense and rental income, respectively, over the base lease term of the respective leases using the straight-line method. The weighted average amortization period for all unfavorable operating leases acquired is 13 years.
Management makes adjustments to the carrying amount of such intangible assets and unfavorable operating leases acquired if they are deemed to be impaired using the methodology for long-lived assets (see note 2(j)), or when such license or lease agreements are reduced or terminated.
(m) Contingencies
The Company records reserves for legal and other contingencies when information available to the Company indicates that it is probable that a liability has been incurred and the amount of the loss can be reasonably estimated. Predicting the outcomes of claims and litigation and estimating the related costs and exposures involve substantial uncertainties that could cause actual costs to vary materially from estimates.
(n) Foreign currency translation
We translate assets and liabilities of non-U.S. operations into U.S. dollars at rates of exchange in effect at the balance sheet date and revenues and expenses at the average exchange rates prevailing during the period. Resulting translation adjustments are recorded as a separate component of comprehensive income (loss) and stockholders’ equity, net of deferred taxes. Foreign currency translation adjustments primarily result from subsidiaries located in Canada, the UK, Australia, and Spain, as well as our joint ventures. Business transactions resulting in foreign exchange gains and losses are included in the consolidated statements of operations.
| F-13 | (Continued) |
Table of Contents
Dunkin’ Brands Group, Inc. and subsidiaries
Notes to consolidated financial statements—(continued)
December 25, 2010 and December 26, 2009
(o) Revenue recognition
Franchise fees and royalty income
Domestically, the Company sells individual franchises as well as territory agreements in the form of store development agreements (SDA agreements) that grant the right to develop restaurants in designated areas. Our franchise and SDA agreements typically require the franchisee to pay an initial nonrefundable fee and continuing fees (royalty income) based upon a percentage of sales. The franchisee will typically pay us a renewal fee if we approve a renewal of the franchise agreement. Such fees are paid by franchisees to obtain the rights associated with these franchise or SDA agreements. Initial franchise fee revenue is recognized upon substantial completion of the services required of the Company as stated in the franchise agreement, which is generally upon opening of the respective restaurant. Fees collected in advance are deferred until earned, with deferred amounts expected to be recognized as revenue within one year classified as current deferred income in the consolidated balance sheets. Royalty income is based on a percentage of franchisee gross sales and is recognized when earned, which occurs at the franchisees’ point of sale. Renewal fees are recognized when a renewal agreement with a franchisee becomes effective. Occasionally, the Company offers incentive programs to franchisees in conjunction with a franchise, SDA, or renewal agreement and, when appropriate, records the costs of such programs as reductions of revenue.
For our international business, we sell master territory and/or license agreements that typically allow the master licensee to either act as the franchisee or to sub-franchise to other operators. Master license and territory fees are generally recognized over the term of the development agreement or as stores are opened, depending on the specific terms of the agreement. Royalty income is based on a percentage of franchisee gross sales and is recognized when earned, which generally occurs at the franchisees’ point of sale. Renewal fees are recognized when a renewal agreement with a franchisee or licensee becomes effective.
Rental income
Rental income for base rentals is recorded on a straight-line basis over the lease term, including the amortization of any tenant improvement dollars paid (see note 2(i)). The difference between the straight-line rent amounts and amounts receivable under the leases are recorded as deferred rent assets in current or long-term assets, as appropriate. Contingent rental income is recognized as earned, and any amounts received from lessees in advance of achieving stipulated thresholds are deferred until such threshold is actually achieved. Deferred contingent rentals are recorded as deferred income in current liabilities in the consolidated balance sheets.
Sales of ice cream products
Our subsidiaries in Canada and the UK manufacture and/or distribute Baskin-Robbins ice cream products to Baskin-Robbins franchisees and licensees in Canada and other international locations. Revenue from the sale of ice cream is recognized when title and risk of loss transfers to the buyer, which is generally upon shipment.
Other revenues
Other revenues include fees generated by licensing our brand names and other intellectual property, retail stores sales at company-owned restaurants, and gains, net of losses and transactions costs, from the sales of
| F-14 | (Continued) |
Table of Contents
Dunkin’ Brands Group, Inc. and subsidiaries
Notes to consolidated financial statements—(continued)
December 25, 2010 and December 26, 2009
our restaurants to new or existing franchisees. Licensing fees are recognized when earned, which is generally upon sale of the underlying products by the licensees. Retail store revenues at company-owned restaurants are recognized when payment is tendered at the point of sale, net of sales tax and other sales-related taxes. Gains on the refranchise or sale of a restaurant are recognized when the sale transaction closes, the franchisee has a minimum amount of the purchase price in at-risk equity, and we are satisfied that the buyer can meet its financial obligations to us. If the criteria for gain recognition are not met, we defer the gain to the extent we have any remaining financial exposure in connection with the sale transaction. Deferred gains are recognized when the gain recognition criteria are met.
(p) Allowance for doubtful accounts
We monitor the financial condition of our franchisees and licensees and record provisions for estimated losses on receivables when we believe that our franchisees or licensees are unable to make their required payments. While we use the best information available in making our determination, the ultimate recovery of recorded receivables is also dependent upon future economic events and other conditions that may be beyond our control. Included in the allowance for doubtful notes and accounts receivables is a provision for uncollectible royalty, lease, and licensing fee receivables.
(q) Share-based payment
We measure compensation cost at fair value on the date of grant for all stock-based awards and recognize compensation expense over the service period that the awards are expected to vest. The Company has elected to recognize compensation cost for graded-vesting awards subject only to a service condition over the requisite service period of the entire award.
(r) Income taxes
Deferred tax assets and liabilities are recorded for the expected future tax consequences of items that have been included in our consolidated financial statements or tax returns. Deferred tax assets and liabilities are determined based on the differences between the financial statement carrying amounts of assets and liabilities and the respective tax bases of assets and liabilities using enacted tax rates that are expected to apply in years in which the temporary differences are expected to reverse. The effects of changes in tax rates on deferred tax assets and liabilities are recognized in the consolidated statements of operations in the year in which the law is enacted. Valuation allowances are provided when the Company does not believe it is more likely than not that it will realize the benefit of identified tax assets.
A tax position taken or expected to be taken in a tax return is recognized in the financial statements when it is more likely than not that the position would be sustained upon examination by tax authorities. A recognized tax position is then measured at the largest amount of benefit that is greater than fifty percent likely of being realized upon ultimate settlement. Estimates of interest and penalties on unrecognized tax benefits are recorded in the provision for income taxes.
| F-15 | (Continued) |
Table of Contents
Dunkin’ Brands Group, Inc. and subsidiaries
Notes to consolidated financial statements—(continued)
December 25, 2010 and December 26, 2009
(s) Comprehensive income (loss)
Comprehensive income (loss) is primarily comprised of net income, foreign currency translation adjustments, unrealized gains and losses on investments, and pension adjustments for changes in funded status, and is reported in the consolidated statements of stockholders’ equity and comprehensive income (loss), net of taxes, for all periods presented.
(t) Deferred financing costs
Deferred financing costs primarily represent capitalizable costs incurred related to the issuance of the Company’s long-term debt (see note 9). Deferred financing costs are being amortized over a weighted average period of approximately 7 years, based on projected required repayments, using the effective interest rate method.
(u) Concentration of credit risk
The Company is subject to credit risk through its accounts receivable consisting primarily of amounts due from franchisees and licensees for franchise fees and royalty income. In addition, we have note and lease receivables from certain of our franchisees and licensees. The financial condition of these franchisees and licensees is largely dependent upon the underlying business trends of our brands and market conditions within the quick service restaurant industry. This concentration of credit risk is mitigated, in part, by the large number of franchisees and licensees of each brand and the short-term nature of the franchise and license fee and lease receivables. No individual franchisee or master licensee accounts for more than 10% of total revenues or accounts and notes receivable.
(v) Earnings per share
Basic earnings per share is computed on the basis of the weighted average number of common shares that were outstanding during the period. Diluted earnings per share includes the dilutive effect of common stock equivalents consisting of restricted stock and stock options, using the treasury stock method. Performance-based restricted stock and stock options are considered dilutive when the related performance criterion has been met. As the Company has both Class L and Class A common stock outstanding and Class L has preference with respect to all distributions, earnings per share is calculated using the two-class method, which requires the allocation of earnings to each class of common stock.
The numerator in calculating Class L basic and diluted earnings per share is the Class L preference amount accrued during the year presented plus, if positive, a pro rata share of an amount equal to consolidated net income less the Class L preference amount. The Class L preferential distribution amounts accrued during fiscal years 2010, 2009, and 2008 were $111.0 million, $104.6 million, and $95.5 million, respectively.
The numerator in calculating Class A basic and diluted earnings per share is an amount equal to consolidated net income less the Class L preference amount and Class L pro rata share amount, if any.
| F-16 | (Continued) |
Table of Contents
Dunkin’ Brands Group, Inc. and subsidiaries
Notes to consolidated financial statements—(continued)
December 25, 2010 and December 26, 2009
The computation of basic and diluted earnings per common share is as follows (in thousands, except share and per share amounts):
| Fiscal year ended | ||||||||||||
| December 25, 2010 |
December 26, 2009 |
December 27, 2008 |
||||||||||
| Net income (loss) - basic and diluted |
$ | 26,861 | 35,008 | (269,898 | ) | |||||||
| Allocation of net income (loss) to common stockholders - basic and diluted: |
||||||||||||
| Class L |
$ | 111,026 | 104,560 | 95,452 | ||||||||
| Class A |
(84,165 | ) | (69,552 | ) | (365,350 | ) | ||||||
| Weighted average number of common shares - basic and diluted: |
||||||||||||
| Class L |
22,806,796 | 22,859,274 | 22,879,304 | |||||||||
| Class A |
188,639,517 | 187,728,324 | 186,395,629 | |||||||||
| Earnings (loss) per common share - basic and diluted: |
||||||||||||
| Class L |
$ | 4.87 | 4.57 | 4.17 | ||||||||
| Class A |
(0.45 | ) | (0.37 | ) | (1.96 | ) | ||||||
The weighted average number of common shares in the Class A diluted earnings per share calculation excludes all restricted stock and stock options outstanding during the respective periods, as they would be antidilutive. As of December 25, 2010, there were 4,960,059 unvested Class A restricted stock awards and 22,084,970 options to purchase Class A common stock outstanding that may be dilutive in the future. Of those amounts, there were 4,405,590 Class A restricted stock awards and 14,308,000 options to purchase Class A common stock that were performance-based and for which the performance criteria have not yet been met. There were no Class L common stock equivalents outstanding during fiscal years 2010, 2009, or 2008.
(w) Recent accounting pronouncements
In January 2010, the Financial Accounting Standards Board (FASB) issued new guidance and clarifications for improving disclosures about fair value measurements. This guidance requires enhanced disclosures regarding transfers in and out of the levels within the fair value hierarchy. Separate disclosures are required for transfers in and out of Level 1 and 2 fair value measurements, and the reasons for the transfers must be disclosed. In the reconciliation for Level 3 fair value measurements, separate disclosures are required for purchases, sales, issuances, and settlements on a gross basis. The new disclosures and clarifications of existing disclosures were effective for interim and annual reporting periods beginning after December 15, 2009, except for the disclosures about purchases, sales, issuances, and settlements in the roll forward of activity in Level 3 fair value measurements, which are effective for interim and annual reporting periods beginning after December 15, 2010. The adoption of this guidance did not have any impact on our financial position or results of operations, as it only relates to disclosures.
In June 2009, the FASB amended the consolidation guidance applicable to VIEs by eliminating exceptions to consolidating qualifying special-purpose entities, changing the approach to determining a VIE’s primary beneficiary, and requiring a company to more frequently reassess whether VIEs must be consolidated. This amended guidance was effective for the Company beginning in fiscal year 2010. The adoption of this guidance did not have any impact on our consolidated financial statements.
| F-17 | (Continued) |
Table of Contents
Dunkin’ Brands Group, Inc. and subsidiaries
Notes to consolidated financial statements—(continued)
December 25, 2010 and December 26, 2009
(X) Reclassifications
In fiscal year 2010, the Company revised the presentation of certain captions within the consolidated balance sheets and consolidated statements of operations and cash flows to provide a more concise presentation. Prior period financial statements have been revised to conform to the current year presentation.
Consolidated balance sheets
The Company has combined inventories and prepaid income taxes into the prepaid and other current assets caption. Additionally, the Company combined notes and other long-term receivables, deferred rent receivables, and deferred financing costs, net into the other assets caption.
The current portion of deferred income was historically classified within deferred income and other current liabilities. Deferred income, which also reflects the impact of the change in accounting for contingent rent (see note 3), is now separated from other current liabilities. Additionally, accrued expenses have been combined with other current liabilities.
Within long-term liabilities, the Company has combined deferred rent obligations into other long-term liabilities. The revised presentation of the balance sheet captions had no impact on total current assets, total assets, total current liabilities, or total long-term liabilities.
Consolidated statements of operations
Licensing fees and refranchising gains have been combined with the other revenues caption. Additionally, the Company combined depreciation and amortization into one caption. The changes made to other captions within operating costs and expenses were as follows:
| • | Payroll and related benefit costs, professional services, travel expenses, and other operating costs and expenses, net were combined into a new caption, general and administrative expenses, net; |
| • | Rental expense related to general and administrative locations of $5.7 million and $5.6 million for fiscal years 2009 and 2008, respectively, was reclassified to general and administrative expenses, net; and |
| • | Non-rent occupancy costs of $2.1 million and $3.0 million for fiscal years 2009 and 2008, respectively, related to franchised locations was reclassified from general and administrative expenses, net to rental expense, which was renamed occupancy expenses—franchised restaurants. |
Equity in net income of joint ventures has been reclassified within the consolidated statements of operations from other income (expense) to operating income (loss), as these investments in joint ventures represent our business model for operating our brands in Japan and Korea and are our primary source of income generation from restaurants operating in these markets. The Company also combined foreign currency gain (loss), net with gain (loss) on sale of available-for-sale securities to form a new caption, other gains (losses).
The reclassification of equity in net income of joint ventures resulted in an increase in operating income and a corresponding increase in total other expense of $14.3 million and $14.2 million for the fiscal years ended December 26, 2009 and December 27, 2008, respectively. All other revisions to the presentation of the consolidated statements of operations had no impact on total revenues, operating income (loss), income (loss) before income taxes, or net income (loss).
| F-18 | (Continued) |
Table of Contents
Dunkin’ Brands Group, Inc. and subsidiaries
Notes to consolidated financial statements—(continued)
December 25, 2010 and December 26, 2009
Consolidated statements of cash flows
The Company reclassified certain activity within the operating section of the consolidated statements of cash flows to correspond to the changes in presentation made to the consolidated balance sheets. The reclassifications had no impact on net cash provided by (used in) operating, investing, or financing activities.
(y) Subsequent events
Subsequent events have been evaluated up through the date that these consolidated financial statements were filed (see note 19).
(3) Change in accounting for contingent rental income
In certain cases, rental income is contingent on a franchisee’s sales level, in excess of a stipulated amount. Historically, the Company recognized contingent rental income prior to achieving the stipulated threshold based on the probability of achieving the threshold, which is permissible for private companies that are not subject to the guidance prescribed by the Securities and Exchange Commission (SEC). For companies subject to SEC interpretations, contingent rental income should not be recognized until the stated threshold is achieved, at which point the revenue is actually earned. As the Company is now required under its senior credit facility and Senior Notes agreements to provide financial statements that comply with SEC regulations, we elected to change our method of accounting for contingent rental income to comply with the SEC requirements. This change in accounting does not have a significant impact on our results of operations or financial position, as it only impacts the timing of revenue recognition over, typically, a one-year period within each lease agreement. Cash flows were not impacted by this change in accounting.
This change in accounting principle has been applied retrospectively to all prior periods presented. The following financial statement line items for fiscal years 2009 and 2008 were impacted by this accounting change (in thousands):
| December 26, 2009 | ||||||||
| As originally reported |
As adjusted |
|||||||
| Accounts receivable, net |
$ | 34,435 | 32,893 | |||||
| Deferred income taxes, net (current) |
12,598 | 14,707 | ||||||
| Total current assets |
321,538 | 322,105 | ||||||
| Goodwill |
884,673 | 887,850 | ||||||
| Total assets |
3,220,973 | 3,224,717 | ||||||
| Deferred income(a) |
33,161 | 26,547 | ||||||
| Total current liabilities |
240,886 | 244,571 | ||||||
| Accumulated deficit |
(657,309 | ) | (657,250 | ) | ||||
| Total stockholders’ equity (deficit) |
(461,452 | ) | (461,393 | ) | ||||
| Total liabilities, common stock, and stockholders’ equity (deficit) |
3,220,973 | 3,224,717 | ||||||
| (a) | Deferred income, as originally reported, of $22.9 million was combined with $14.0 million of other current liabilities in the fiscal year 2009 issued financial statements, under one caption titled deferred income and other current liabilities, which totaled $36.9 million (see note 2(x)). |
| F-19 | (Continued) |
Table of Contents
Dunkin’ Brands Group, Inc. and subsidiaries
Notes to consolidated financial statements—(continued)
December 25, 2010 and December 26, 2009
| December 26, 2009 | December 27, 2008 | |||||||||||||||
| As originally reported |
As adjusted |
As originally reported |
As adjusted |
|||||||||||||
| Rental income |
$ | 93,182 | 93,651 | 97,662 | 97,886 | |||||||||||
| Total revenues |
537,604 | 538,073 | 544,705 | 544,929 | ||||||||||||
| Operating income (loss) |
184,076 | 184,545 | (141,117 | ) | (140,893 | ) | ||||||||||
| Income (loss) before income taxes |
73,807 | 74,276 | (260,990 | ) | (260,766 | ) | ||||||||||
| Provision for income taxes |
39,070 | 39,268 | 9,042 | 9,132 | ||||||||||||
| Net income (loss) |
34,737 | 35,008 | (270,032 | ) | (269,898 | ) | ||||||||||
Goodwill was increased by $3.2 million, which represents the cumulative deferral of income, net of deferred taxes, as of March 1, 2006 (the date of the BCT Acquisition). As a result of the accounting change, retained earnings as of December 29, 2007 was reduced by $346 thousand, reflecting the cumulative impact on net income through that date since the BCT Acquisition.
(4) Franchise fees and royalty income
Franchise fees and royalty income consisted of the following (in thousands):
| Fiscal year ended | ||||||||||||
| December 25, 2010 |
December 26, 2009 |
December 27, 2008 |
||||||||||
| Royalty income |
$ | 332,770 | 317,692 | 308,742 | ||||||||
| Initial franchise fees, including renewal income |
27,157 | 26,328 | 40,305 | |||||||||
| Total franchise fees and royalty income |
$ | 359,927 | 344,020 | 349,047 | ||||||||
The changes in franchised and company-owned points of distribution were as follows:
| Fiscal year ended | ||||||||||||
| December 25, 2010 |
December 26, 2009 |
December 27, 2008 |
||||||||||
| Systemwide Points of Distribution |
||||||||||||
| Franchised points of distribution in operation - beginning of year |
15,377 | 14,846 | 13,860 | |||||||||
| Franchises opened |
1,618 | 1,601 | 2,026 | |||||||||
| Franchises closed |
(815 | ) | (1,055 | ) | (1,040 | ) | ||||||
| Net transfers to company-owned points of distribution |
(14 | ) | (15 | ) | — | |||||||
| Franchised points of distribution in operation - end of year |
16,166 | 15,377 | 14,846 | |||||||||
| Company-owned points of distribution |
27 | 16 | 2 | |||||||||
| Total systemwide points of distribution - end of year |
16,193 | 15,393 | 14,848 | |||||||||
(5) Advertising funds
On behalf of certain Dunkin’ Donuts and Baskin-Robbins advertising funds, the Company collects a percentage, which typically ranges from 1.0% to 6.0%, of gross retail sales from Dunkin’ Donuts and Baskin-Robbins
| F-20 | (Continued) |
Table of Contents
Dunkin’ Brands Group, Inc. and subsidiaries
Notes to consolidated financial statements—(continued)
December 25, 2010 and December 26, 2009
franchisees, to be used for various forms of advertising for each brand. In most of our international markets, franchisees manage their own advertising expenditures, which are not included in the advertising fund results.
The Company administers and directs the development of all advertising and promotion programs in the advertising funds for which it collects advertising fees, in accordance with the provisions of our franchise agreements. The Company acts as, in substance, an agent with regard to these advertising contributions. We consolidate and report all assets and liabilities held by these advertising funds as restricted assets of advertising funds and liabilities of advertising funds within current assets and current liabilities, respectively, in the consolidated balance sheets. The assets and liabilities held by these advertising funds consist primarily of receivables, accrued expenses, and other liabilities related specifically to the advertising funds. The revenues, expenses, and cash flows of the advertising funds are not included in the Company’s consolidated statements of operations or consolidated statements of cash flows because the Company does not have complete discretion over the usage of the funds. Contributions to these advertising funds are restricted to advertising, product development, public relations, merchandising, and administrative expenses and programs to increase sales and further enhance the public reputation of each of the brands.
At December 25, 2010 and December 26, 2009, the Company had a net payable of $23.1 million and $23.3 million, respectively, to the various advertising funds.
To cover administrative expenses of the advertising funds, the Company charges each advertising fund a management fee for such items as rent, accounting services, information technology, data processing, product development, legal, administrative support services, and other operating expenses, which amounted to $5.6 million, $6.2 million, and $6.0 million for fiscal years 2010, 2009, and 2008, respectively. Such management fees are included in the consolidated statements of operations as a reduction in general and administrative expenses, net.
The Company also made discretionary contributions to certain advertising funds, which amounted to $1.2 million, $1.2 million, and $698 thousand for fiscal years 2010, 2009, and 2008, respectively, for the purpose of supplementing national and regional advertising in certain markets.
(6) Property and equipment
Property and equipment at December 25, 2010 and December 26, 2009 consisted of the following (in thousands):
| December 25, 2010 |
December 26, 2009 |
|||||||
| Land |
$ | 30,485 | 30,738 | |||||
| Buildings |
40,093 | 43,105 | ||||||
| Leasehold improvements |
160,369 | 159,208 | ||||||
| Store, production, and other equipment |
49,072 | 51,260 | ||||||
| Construction in progress |
3,917 | 4,062 | ||||||
| 283,936 | 288,373 | |||||||
| Accumulated depreciation and amortization |
(90,663 | ) | (78,714 | ) | ||||
| $ | 193,273 | 209,659 | ||||||
| F-21 | (Continued) |
Table of Contents
Dunkin’ Brands Group, Inc. and subsidiaries
Notes to consolidated financial statements—(continued)
December 25, 2010 and December 26, 2009
Total depreciation expense was $25.3 million, $26.9 million, and $28.5 million for fiscal years 2010, 2009, and 2008, respectively. The Company recognized impairment charges on leasehold improvements, typically due to termination of the underlying lease agreement, and other corporately-held assets of $4.8 million, $6.8 million, and $2.0 million during fiscal years 2010, 2009, and 2008, respectively, which are included in other impairment charges in the consolidated statements of operations.
(7) Investments in joint ventures
The Company’s ownership interests in its joint ventures as of December 25, 2010 and December 26, 2009 were as follows:
| Ownership | ||||||||
| Entity | December 25, 2010 |
December 26, 2009 |
||||||
| BR Japan |
43.3% | 43.3% | ||||||
| BR Korea |
33.3 | 33.3 | ||||||
Summary financial information for the joint venture operations on an aggregated basis was as follows (in thousands):
| December 25, 2010 |
December 26, 2009 |
|||||||
| Current assets |
$ | 184,608 | 151,863 | |||||
| Current liabilities |
86,969 | 78,977 | ||||||
| Working capital |
97,639 | 72,886 | ||||||
| Property, plant, and equipment, net |
102,405 | 81,919 | ||||||
| Other assets |
141,574 | 125,119 | ||||||
| Long-term liabilities |
19,084 | 14,814 | ||||||
| Joint venture equity |
$ | 322,534 | 265,110 | |||||
| Fiscal year ended | ||||||||||||
| December 25, 2010 |
December 26, 2009 |
December 27, 2008 |
||||||||||
| Revenues |
$ | 580,671 | 495,146 | 463,140 | ||||||||
| Net income |
47,664 | 41,577 | 40,130 | |||||||||
The comparison between the carrying value of our investments and the underlying equity in net assets of investments is presented in the table below (in thousands):
| BR Japan | BR Korea | |||||||||||||||
| December 25, 2010 |
December 26, 2009 |
December 25, 2010 |
December 26, 2009 |
|||||||||||||
| Carrying value of investment |
$ | 94,326 | 82,812 | 74,950 | 65,090 | |||||||||||
| Underlying equity in net assets of investment |
49,854 | 39,994 | 69,037 | 57,503 | ||||||||||||
| Carrying value in excess of the underlying equity in net assets(a) |
$ | 44,472 | 42,818 | 5,913 | 7,587 | |||||||||||
| (a) | The excess carrying values over the underlying equity in net assets of our joint ventures is primarily comprised of amortizable franchise rights and related tax liabilities and nonamortizable goodwill, all of which were established in the BCT Acquisition. |
| F-22 | (Continued) |
Table of Contents
Dunkin’ Brands Group, Inc. and subsidiaries
Notes to consolidated financial statements—(continued)
December 25, 2010 and December 26, 2009
Equity in net income of joint ventures in the consolidated statements of operations for fiscal years 2010, 2009, and 2008 includes $897 thousand, $899 thousand, and $907 thousand, respectively, of net expense related to the amortization of intangible franchise rights and related deferred tax liabilities noted above. As required under the equity method of accounting, such net expense is recorded in the consolidated statements of operations directly to equity in net income of joint ventures and not shown as a component of amortization expense.
Total estimated amortization expense, net of deferred tax benefits, to be included in equity in net income of joint ventures for fiscal years 2011 through 2015 is as follows (in thousands):
| Fiscal year: | ||||
| 2011 |
$ | 867 | ||
| 2012 |
789 | |||
| 2013 |
705 | |||
| 2014 |
615 | |||
| 2015 |
519 | |||
(8) Goodwill and other intangible assets
The changes and carrying amounts of goodwill by reporting unit were as follows (in thousands):
| Goodwill | Dunkin’ Donuts U.S. |
Dunkin’ Donuts International |
Baskin- Robbins International |
Total | ||||||||||||
| Balance at December 27, 2008 (as adjusted): |
||||||||||||||||
| Goodwill |
$ | 1,148,016 | 10,186 | 24,037 | 1,182,239 | |||||||||||
| Accumulated impairment charges |
(270,441 | ) | — | (24,037 | ) | (294,478 | ) | |||||||||
| Balance at December 27, 2008 |
877,575 | 10,186 | — | 887,761 | ||||||||||||
| Effects of foreign currency adjustments |
— | 89 | — | 89 | ||||||||||||
| Balance at December 26, 2009 (as adjusted): |
||||||||||||||||
| Goodwill |
1,148,016 | 10,275 | 24,037 | 1,182,328 | ||||||||||||
| Accumulated impairment charges |
(270,441 | ) | — | (24,037 | ) | (294,478 | ) | |||||||||
| Balance at December 26, 2009 |
877,575 | 10,275 | — | 887,850 | ||||||||||||
| Goodwill acquired |
780 | — | — | 780 | ||||||||||||
| Effects of foreign currency adjustments |
— | 25 | — | 25 | ||||||||||||
| Balance at December 25, 2010: |
||||||||||||||||
| Goodwill |
1,148,796 | 10,300 | 24,037 | 1,183,133 | ||||||||||||
| Accumulated impairment charges |
(270,441 | ) | — | (24,037 | ) | (294,478 | ) | |||||||||
| Balance at December 25, 2010 |
$ | 878,355 | 10,300 | — | 888,655 | |||||||||||
| F-23 | (Continued) |
Table of Contents
Dunkin’ Brands Group, Inc. and subsidiaries
Notes to consolidated financial statements—(continued)
December 25, 2010 and December 26, 2009
Other intangible assets at December 25, 2010 consisted of the following (in thousands):
| Weighted average amortization period (years) |
Gross carrying amount |
Accumulated amortization |
Net carrying amount |
|||||||||||||
| Definite lived intangibles: |
||||||||||||||||
| Franchise rights |
20 | $ | 385,309 | (100,296 | ) | 285,013 | ||||||||||
| Favorable operating leases acquired |
13 | 90,406 | (33,965 | ) | 56,441 | |||||||||||
| License rights |
10 | 6,230 | (2,997 | ) | 3,233 | |||||||||||
| Indefinite lived intangible: |
||||||||||||||||
| Trade names |
N/A | 1,190,970 | — | 1,190,970 | ||||||||||||
| $ | 1,672,915 | (137,258 | ) | 1,535,657 | ||||||||||||
Other intangible assets at December 26, 2009 consisted of the following (in thousands):
| Weighted average amortization period (years) |
Gross carrying amount |
Accumulated amortization |
Net carrying amount |
|||||||||||||
| Definite lived intangibles: |
||||||||||||||||
| Franchise rights |
20 | $ | 385,088 | (79,496 | ) | 305,592 | ||||||||||
| Favorable operating leases acquired |
12 | 98,696 | (32,201 | ) | 66,495 | |||||||||||
| License rights |
6 | 31,190 | (24,071 | ) | 7,119 | |||||||||||
| Indefinite lived intangible: |
||||||||||||||||
| Trade names |
N/A | 1,190,970 | — | 1,190,970 | ||||||||||||
| $ | 1,705,944 | (135,768 | ) | 1,570,176 | ||||||||||||
During the fourth quarter of 2008, management concluded that indicators of potential impairment were present and that an evaluation of the carrying value of goodwill and trade names was therefore required. The indicators that triggered the interim impairment tests included the economic environment and declines in peer company market values. Accordingly, the Company performed an interim test for impairment as of December 27, 2008.
The impairment test of the Baskin-Robbins trade name resulted in an impairment charge of $34.0 million, which was recorded during fiscal year 2008 to the Baskin-Robbins U.S. reporting unit, and is included in other impairment charges in the consolidated statements of operations. Fair value of the Baskin-Robbins trade name was estimated using the relief from royalty method, an income approach to valuation. As the estimated fair value of the Dunkin’ Donuts trade name exceeded its carrying value, the Company did not record any impairment on the Dunkin’ Donuts trade name.
For goodwill, an indication of impairment existed for the Dunkin’ Donuts U.S. and Baskin-Robbins International reporting units. Based on the interim results of the goodwill impairment test, a total goodwill impairment charge of $294.5 million was recorded during fiscal year 2008. Fair value of the reporting units was estimated based on a combination of market multiples and discounted cash flows to determine the implied fair value of goodwill.
| F-24 | (Continued) |
Table of Contents
Dunkin’ Brands Group, Inc. and subsidiaries
Notes to consolidated financial statements—(continued)
December 25, 2010 and December 26, 2009
In connection with the recognition of the fiscal year 2008 noncash impairment charge for trade name intangible assets of $34.0 million, the Company recorded a deferred tax benefit of approximately $13.8 million to reduce a previously established deferred tax liability related to the above-noted intangible assets. There was no deferred tax impact as a result of the goodwill impairment charge as the goodwill is not deductible for tax purposes.
The changes in the gross carrying amount of other intangible assets from December 26, 2009 to December 25, 2010 is due to the impact of foreign currency fluctuations and the impairment of favorable operating leases acquired resulting from lease terminations. Impairment of favorable operating leases acquired totaled $2.3 million, $1.7 million, and $1.4 million for fiscal years 2010, 2009, and 2008, respectively, and is included in other impairment charges in the consolidated statements of operations. Additionally, during fiscal year 2010, the Company wrote off a fully amortized license right intangible asset with a gross carrying amount of $25.0 million.
Total amortization expense was $32.5 million, $36.0 million, and $37.8 million for fiscal years 2010, 2009, and 2008, respectively. Total estimated amortization expense for other intangible assets for fiscal years 2011 through 2015 is as follows (in thousands):
| Fiscal year: | ||||
| 2011 |
$ | 27,984 | ||
| 2012 |
26,911 | |||
| 2013 |
26,321 | |||
| 2014 |
25,778 | |||
| 2015 |
25,422 | |||
(9) Debt
Debt at December 25, 2010 and December 26, 2009 consisted of the following (in thousands):
| December 25, 2010 |
December 26, 2009 |
|||||||
| Term B Loans |
$ | 1,243,823 | — | |||||
| Senior Notes |
615,693 | — | ||||||
| Series 2006-1 Class A-2 Notes |
— | 1,346,320 | ||||||
| Series 2006-1 Class M-1 Notes |
— | 99,999 | ||||||
| Total debt |
1,859,516 | 1,446,319 | ||||||
| Less current portion of long-term debt |
12,500 | — | ||||||
| Total long-term debt |
$ | 1,847,016 | 1,446,319 | |||||
Senior credit facility
The Company’s senior credit facility consists of $1.25 billion aggregate principal amount Term B Loans and a $100.0 million revolving credit facility, which were entered into by DBGI’s subsidiary, Dunkin’ Brands, Inc. (DBI) in November 2010. The Term B Loans and revolving credit facility mature in November 2017 and November 2015, respectively. As of December 25, 2010, $11.2 million of letters of credit were outstanding against the revolving credit facility.
| F-25 | (Continued) |
Table of Contents
Dunkin’ Brands Group, Inc. and subsidiaries
Notes to consolidated financial statements—(continued)
December 25, 2010 and December 26, 2009
Borrowings under our senior credit facility bear interest at a rate per annum equal to, at our option, either a base rate or a Eurodollar rate. The base rate is equal to an applicable rate ranging from 2.75% to 3.25% based on a leverage ratio plus the highest of (a) the Federal Funds rate plus 0.50%, (b) a prime rate, (c) one-month LIBOR rate plus 1.00%, and (d) 2.50%. The Eurodollar rate is equal to an applicable rate ranging from 3.75% to 4.25% based on a leverage ratio plus the higher of (a) a LIBOR rate and (b) 1.50%. In addition, we are required to pay a commitment fee on our revolving credit facility for unutilized commitments at a rate of 0.50% per annum. The effective interest rate for Term B Loans, including the amortization of original issue discount and deferred financing costs, is 6.1% at December 25, 2010.
Repayments are required to be made under the Term B Loans equal to $12.5 million per calendar year, payable in quarterly installments through September 2017, with the remaining principal balance due in November 2017. Additionally, following the end of each fiscal year, if the Company’s leverage ratio, which is a measure of the Company’s cash income to outstanding debt, exceeds 5.25x, the Company is required to prepay an amount equal to 50% of excess cash flow (as defined in the senior credit facility) for such fiscal year. The first excess cash flow payment would be due in the first quarter of fiscal year 2012 based on fiscal year 2011 excess cash flow and leverage ratio. Other events and transactions, such as certain asset sales and incurrence of debt, may trigger additional mandatory prepayments. The senior credit facility requires a 1.0% prepayment premium in the event the Term B Loans or revolving credit facility is voluntarily refinanced by the Company at a reduced interest rate prior to November 2011.
The senior credit facility contains certain financial and nonfinancial covenants, which include restrictions on liens, investments, additional indebtedness, asset sales, certain dividend payments, and certain transactions with affiliates. At December 25, 2010, the Company was in compliance with all of its covenants under the senior credit facility.
Certain of the Company’s wholly owned domestic subsidiaries guarantee the senior credit facility. All obligations under the senior credit facility, and the guarantees of those obligations, are secured, subject to certain exceptions, by substantially all assets of DBI and the subsidiary guarantors.
The Term B Loans were issued with an original issue discount of $6.3 million, resulting in cash proceeds upon issuance of $1.24 billion. Total debt issuance costs incurred and capitalized in relation to the senior credit facility were $20.4 million. Total amortization of original issue discount and debt issuance costs related to the senior credit facility was $323 thousand for fiscal year 2010, which is included in interest expense in the consolidated statements of operations.
Subsequent to fiscal year 2010, the Company re-priced its senior credit facility and increased the amount of term loans outstanding to $1.40 billion (see note 19).
Senior notes
DBI issued $625.0 million face amount Senior Notes in November 2010 that mature in December 2018. Interest is payable semi-annually at a rate of 9.625% per annum. The effective interest rate for the Senior Notes, including the amortization of original issue discount and deferred financing costs, is 10.2%.
Certain of DBI’s subsidiaries have jointly and severally, irrevocably and unconditionally guaranteed the payment of the amounts due under the Senior Notes. The Senior Notes are unsecured and are effectively subordinated to the senior credit facility to the extent of the value of the assets securing such debt.
| F-26 | (Continued) |
Table of Contents
Dunkin’ Brands Group, Inc. and subsidiaries
Notes to consolidated financial statements—(continued)
December 25, 2010 and December 26, 2009
The Senior Notes contain certain covenants, which include restrictions on liens, investments, additional indebtedness, asset sales, certain dividend payments, and certain transactions with affiliates. Optional redemptions may be made at 100.0% to 102.5% of par, depending upon the timing of such redemptions. Upon a change of control, the Company must offer to purchase the Senior Notes at 101% of par. At December 25, 2010, the Company was in compliance with all of its covenants under the Senior Notes.
The Senior Notes were originally issued through a private transaction. The Company has agreed to file a registration statement with the SEC to permit either the exchange of the original notes for registered notes having substantially the same term, or the registered resale of the original notes. The exchange of notes or registration covering resales of the original notes must be completed by November 2011 or additional interest may accrue, not to exceed 1.0% per annum.
The Senior Notes were issued with an original issue discount of $9.4 million, resulting in cash proceeds upon issuance of $615.6 million. Total debt issuance costs incurred and capitalized in relation to the Senior Notes were $15.6 million. Total amortization of original issue discount and debt issuance costs related to the Senior Notes was $182 thousand for fiscal year 2010, which is included in interest expense in the consolidated statements of operations.
Subsequent to fiscal year 2010, the Company will repay $150.0 million of the Senior Notes utilizing the proceeds from the increased term loans under the senior credit facility (see note 19).
ABS Notes
On May 26, 2006, certain of the Company’s subsidiaries (the Co-Issuers) entered into a securitization transaction. In connection with this securitization transaction, the Co-Issuers issued 5.779% Fixed Rate Series 2006-1 Senior Notes, Class A-2 (Class A-2 Notes) with an initial principal amount of $1.5 billion and 8.285% Fixed Rate Series 2006-1 Subordinated Notes, Class M-1 (Class M-1 Notes) with an initial principal amount of $100.0 million. In addition, the Company also issued Class A-1 Notes (the Class A-1 Notes, together with the Class A-2 Notes and the Class M-1 Notes, the ABS Notes), which permitted the Co-Issuers to draw up to a maximum of $100.0 million on a revolving basis. As of December 26, 2009, $34.3 million of letters of credit were outstanding related to the Class A-1 Notes.
Total debt issuance costs incurred and capitalized in relation to the ABS Notes were $72.9 million, of which $6.0 million, $7.4 million, and $7.0 million was amortized to interest expense during fiscal years 2010, 2009, and 2008, respectively.
The ABS Notes were secured by a pledge of substantially all of the assets of the Co-Issuers. In addition, certain subsidiaries unconditionally and irrevocably guaranteed the obligations of the Co-Issuers under the ABS Notes, and such guarantee was secured by a pledge of substantially all of the assets of those subsidiaries. In addition, the payment of interest payable on the Class A-1 Notes and the Class A-2 Notes on each payment date (subject to certain limitations) and the outstanding principal amount of the Class A-1 Notes and the Class A-2 Notes on the legal final maturity date (June 20, 2031) was unconditionally and irrevocably guaranteed by Ambac.
During fiscal year 2009, the Company repurchased and retired outstanding Class A-2 Notes with a total face value of $153.7 million. The Class A-2 Notes were repurchased using available cash for a total repurchase price
| F-27 | (Continued) |
Table of Contents
Dunkin’ Brands Group, Inc. and subsidiaries
Notes to consolidated financial statements—(continued)
December 25, 2010 and December 26, 2009
of $142.7 million. As a result of these repurchases, the Company recorded a net gain on debt extinguishment of $3.7 million, which includes the write-off of deferred financing costs of $4.8 million and pre-payment premiums paid to Ambac of $2.5 million.
In June 2010, the Company repurchased and retired outstanding Class A-2 Notes with a total face value of $99.8 million. The Class A-2 Notes were repurchased at par using available cash. As a result of this repurchase, the Company recorded a net loss on debt extinguishment of $3.7 million, which includes the write-off of deferred financing costs of $2.7 million and pre-payment premiums paid to Ambac of $1.0 million.
In December 2010, all outstanding ABS Notes were repaid in full with proceeds from the Term B Loans and Senior Notes. As a result, a net loss on debt extinguishment of $58.3 million was recorded, which includes the write-off of deferred financing costs of $34.7 million, make whole payments of $22.6 million, and other professional and legal costs.
Maturities of long-term debt
The aggregate maturities of long-term debt for each of the next five calendar years are $14.0 million per year, based on the amended senior credit facility (see note 19).
(10) Other current liabilities
Other current liabilities at December 25, 2010 and December 26, 2009 consisted of the following (in thousands):
| December 25, 2010 |
December 26, 2009 |
|||||||
| Gift card/certificate liability |
$ | 123,078 | 101,949 | |||||
| Accrued salary and benefits |
21,307 | 18,753 | ||||||
| Accrued professional and legal costs |
9,839 | 6,590 | ||||||
| Accrued interest |
6,129 | 1,652 | ||||||
| Other |
23,241 | 30,328 | ||||||
| Total other current liabilities |
$ | 183,594 | 159,272 | |||||
During fiscal year 2010 and 2009, the Company recognized $521 thousand and $3.2 million, respectively, of income related to gift certificate breakage within general and administrative expenses, net. The gift certificate breakage amount recognized was based upon historical redemption patterns and represents the remaining balance of gift certificates for which the Company believes the likelihood of redemption by the customer is remote. The Company determined during fiscal year 2009 that sufficient historical patterns existed to estimate breakage and therefore recognized a cumulative adjustment for all gift certificates outstanding as of December 26, 2009.
(11) Leases
The Company is the lessee on certain land leases (the Company leases the land and erects a building) or improved leases (lessor owns the land and building) covering restaurants and other properties. In addition, the Company has leased and subleased land and buildings to others. Many of these leases and subleases provide for
| F-28 | (Continued) |
Table of Contents
Dunkin’ Brands Group, Inc. and subsidiaries
Notes to consolidated financial statements—(continued)
December 25, 2010 and December 26, 2009
future rent escalation and renewal options. In addition, contingent rentals, determined as a percentage of annual sales by our franchisees, are stipulated in certain prime lease and sublease agreements. The Company is generally obligated for the cost of property taxes, insurance, and maintenance relating to these leases. Such costs are typically charged to the sublessee based on the terms of the sublease agreements. The Company also leases certain office equipment and a fleet of automobiles under noncancelable operating leases.
Included in the Company’s consolidated balance sheets are the following amounts related to capital leases (in thousands):
| December 25, 2010 |
December 26, 2009 |
|||||||
| Leased property under capital leases (included in property and equipment) |
$ | 5,303 | 5,150 | |||||
| Less accumulated depreciation |
(1,379 | ) | (1,020 | ) | ||||
| $ | 3,924 | 4,130 | ||||||
| Capital lease obligations: |
||||||||
| Current |
$ | 205 | 221 | |||||
| Long-term |
5,160 | 5,217 | ||||||
| $ | 5,365 | 5,438 | ||||||
Capital lease obligations exclude that portion of the minimum lease payments attributable to land, which is classified separately as operating leases. Interest expense associated with the capital lease obligations is computed using the incremental borrowing rate at the time the lease is entered into and is based on the amount of the outstanding lease obligation. Depreciation on capital lease assets is included in depreciation expense in the consolidated statements of operations. Interest expense related to capital leases for fiscal years 2010, 2009, and 2008, was $505 thousand, $493 thousand, and $418 thousand, respectively.
Included in the Company’s consolidated balance sheets are the following amounts related to assets leased to others under operating leases, where the Company is the lessor (in thousands):
| December 25, 2010 |
December 26, 2009 |
|||||||
| Land |
$ | 26,914 | 27,750 | |||||
| Buildings |
37,680 | 40,727 | ||||||
| Leasehold improvements |
147,139 | 143,823 | ||||||
| Store, production, and other equipment |
245 | 2,650 | ||||||
| Construction in progress |
1,403 | 677 | ||||||
| 213,381 | 215,627 | |||||||
| Accumulated depreciation and amortization |
(58,341 | ) | (51,836 | ) | ||||
| $ | 155,040 | 163,791 | ||||||
| F-29 | (Continued) |
Table of Contents
Dunkin’ Brands Group, Inc. and subsidiaries
Notes to consolidated financial statements—(continued)
December 25, 2010 and December 26, 2009
Future minimum rental commitments to be paid and received by the Company at December 25, 2010 for all noncancelable leases and subleases are as follows (in thousands):
| Payments | Receipts Subleases |
Net leases |
||||||||||||||
| Capital leases |
Operating leases |
|||||||||||||||
| Fiscal year: |
||||||||||||||||
| 2011 |
$ | 686 | 51,363 | (59,822 | ) | (7,773 | ) | |||||||||
| 2012 |
691 | 50,812 | (58,740 | ) | (7,237 | ) | ||||||||||
| 2013 |
702 | 49,757 | (57,325 | ) | (6,866 | ) | ||||||||||
| 2014 |
721 | 49,200 | (56,232 | ) | (6,311 | ) | ||||||||||
| 2015 |
754 | 44,878 | (55,150 | ) | (9,518 | ) | ||||||||||
| Thereafter |
6,186 | 406,549 | (425,408 | ) | (12,673 | ) | ||||||||||
| Total minimum rental commitments |
9,740 | $ | 652,559 | (712,677 | ) | (50,378 | ) | |||||||||
| Less amount representing interest |
4,375 | |||||||||||||||
| Present value of minimum capital lease obligations |
$ | 5,365 | ||||||||||||||
Rental expense under operating leases associated with franchised locations is included in occupancy expenses—franchised restaurants in the consolidated statements of operations. Rental expense under operating leases for all other locations, including corporate facilities and company-owned restaurants, is included in general and administrative expenses, net, in the consolidated statements of operations. Total rental expense for all operating leases consisted of the following (in thousands):
| Fiscal year ended | ||||||||||||
| December 25, 2010 |
December 26, 2009 |
December 27, 2008 |
||||||||||
| Base rentals |
$ | 53,704 | 51,819 | 54,038 | ||||||||
| Contingent rentals |
4,093 | 3,711 | 4,127 | |||||||||
| $ | 57,797 | 55,530 | 58,165 | |||||||||
Total rental income for all subleases consisted of the following (in thousands):
| Fiscal year ended | ||||||||||||
| December 25, 2010 |
December 26, 2009 |
December 27, 2008 |
||||||||||
| (As adjusted) | (As adjusted) | |||||||||||
| Base rentals |
$ | 66,630 | 67,825 | 69,459 | ||||||||
| Contingent rentals |
24,472 | 25,826 | 28,427 | |||||||||
| $ | 91,102 | 93,651 | 97,886 | |||||||||
| F-30 | (Continued) |
Table of Contents
Dunkin’ Brands Group, Inc. and subsidiaries
Notes to consolidated financial statements—(continued)
December 25, 2010 and December 26, 2009
The impact of the amortization of our unfavorable operating leases acquired resulted in an increase in rental income and a decrease in rental expense as follows (in thousands):
| Fiscal year ended | ||||||||||||
| December 25, 2010 |
December 26, 2009 |
December 27, 2008 |
||||||||||
| Increase in rental income |
$ | 1,806 | 2,157 | 3,271 | ||||||||
| Decrease in rental expense |
2,514 | 2,870 | 2,724 | |||||||||
| Total increase in operating income |
$ | 4,320 | 5,027 | 5,995 | ||||||||
Following is the estimated impact of the amortization of our unfavorable operating leases acquired for each of the next five years (in thousands):
| Decrease in rental expense |
Increase in rental income |
Total increase in operating income |
||||||||||
| Fiscal year: |
||||||||||||
| 2011 |
$ | 1,603 | 1,208 | 2,811 | ||||||||
| 2012 |
1,325 | 1,056 | 2,381 | |||||||||
| 2013 |
1,141 | 957 | 2,098 | |||||||||
| 2014 |
1,084 | 871 | 1,955 | |||||||||
| 2015 |
980 | 813 | 1,793 | |||||||||
(12) Segment information
The Company is strategically aligned into two global brands, Dunkin’ Donuts and Baskin-Robbins, which are further segregated between U.S. operations and international operations. As such, the Company has determined that it has four operating segments, which are its reportable segments: Dunkin’ Donuts U.S., Dunkin’ Donuts International, Baskin-Robbins U.S., and Baskin-Robbins International. Dunkin’ Donuts U.S., Baskin-Robbins U.S., and Dunkin’ Donuts International primarily derive their revenues through royalty income, franchise fees, and rental income. Baskin-Robbins U.S. also derives revenue through license fees from a third-party license agreement. Baskin-Robbins International primarily derives its revenues from the manufacturing and sales of ice cream products, as well as royalty income, franchise fees, and license fees. The operating results of each segment are regularly reviewed and evaluated separately by the Company’s senior management, which includes, but is not limited to, the chief executive officer, the chief financial officer, and worldwide brand officers. Senior management primarily evaluates the performance of its segments and allocates resources to them based on earnings before interest, taxes, depreciation, amortization, impairment charges, foreign currency gains and losses, other gains and losses, and unallocated corporate charges, referred to as segment profit. When senior management reviews a balance sheet, it is at a consolidated level. The accounting policies applicable to each segment are consistent with those used in the consolidated financial statements.
Revenues for Dunkin’ Donuts U.S. include royalties and rental income earned from company-owned restaurants. Revenues for all other segments include only transactions with unaffiliated customers and include no intersegment revenues. Revenues reported as “Other” include retail sales for company-owned restaurants,
| F-31 | (Continued) |
Table of Contents
Dunkin’ Brands Group, Inc. and subsidiaries
Notes to consolidated financial statements—(continued)
December 25, 2010 and December 26, 2009
as well as revenue earned through arrangements with third parties in which our brand names are used and revenue generated from online training programs for franchisees that are not allocated to a specific segment. Revenues by segment were as follows (in thousands):
| Revenues | ||||||||||||
| Fiscal year ended | ||||||||||||
| December 25, 2010 |
December 26, 2009 |
December 27, 2008 |
||||||||||
| (As adjusted) | (As adjusted) | |||||||||||
| Dunkin’ Donuts U.S. |
$ | 402,394 | 387,595 | 397,176 | ||||||||
| Dunkin’ Donuts International |
14,128 | 12,326 | 13,241 | |||||||||
| Baskin-Robbins U.S. |
42,920 | 46,293 | 50,499 | |||||||||
| Baskin-Robbins International |
91,285 | 80,764 | 76,066 | |||||||||
| Total reportable segments |
550,727 | 526,978 | 536,982 | |||||||||
| Other |
28,465 | 11,428 | 7,947 | |||||||||
| Elimination of company-owned restaurants’ royalties and rental income |
(2,057 | ) | (333 | ) | — | |||||||
| Total revenues |
$ | 577,135 | 538,073 | 544,929 | ||||||||
Revenues for foreign countries are represented by the Dunkin’ Donuts International and Baskin-Robbins International segments above. No individual foreign country accounted for more than 10% of total revenues for any fiscal year presented.
For purposes of evaluating segment profit, Dunkin’ Donuts U.S. includes the net operating income earned from company-owned restaurants. Expenses included in “Corporate and other” in the segment profit table below include corporate overhead costs, such as payroll and related benefit costs and professional services. Segment profit by segment was as follows (in thousands):
| Segment profit | ||||||||||||
| Fiscal year ended | ||||||||||||
| December 25, 2010 |
December 26, 2009 |
December 27, 2008 |
||||||||||
| (As adjusted) | (As adjusted) | |||||||||||
| Dunkin’ Donuts U.S. |
$ | 293,132 | 275,961 | 288,009 | ||||||||
| Dunkin’ Donuts International |
14,573 | 12,628 | 14,534 | |||||||||
| Baskin-Robbins U.S. |
27,607 | 33,459 | 33,925 | |||||||||
| Baskin-Robbins International |
41,596 | 41,212 | 33,257 | |||||||||
| Total reportable segments |
376,908 | 363,260 | 369,725 | |||||||||
| Corporate and other |
(118,482 | ) | (107,287 | ) | (112,456 | ) | ||||||
| Interest expense, net |
(112,532 | ) | (115,019 | ) | (115,944 | ) | ||||||
| Depreciation and amortization |
(57,826 | ) | (62,911 | ) | (66,300 | ) | ||||||
| Goodwill impairment |
— | — | (294,478 | ) | ||||||||
| Other impairment charges |
(7,075 | ) | (8,517 | ) | (37,384 | ) | ||||||
| Gain (loss) on debt extinguishment |
(61,955 | ) | 3,684 | — | ||||||||
| Other gains (losses), net |
408 | 1,066 | (3,929 | ) | ||||||||
| Income (loss) before income taxes |
$ | 19,446 | 74,276 | (260,766 | ) | |||||||
| F-32 | (Continued) |
Table of Contents
Dunkin’ Brands Group, Inc. and subsidiaries
Notes to consolidated financial statements—(continued)
December 25, 2010 and December 26, 2009
Equity in net income of joint ventures, including amortization on intangibles resulting from the BCT Acquisition, is included in segment profit for the Dunkin’ Donuts International and Baskin-Robbins International reportable segments. Equity in net income of joint ventures by reportable segment was as follows (in thousands):
| Equity in net income of joint ventures | ||||||||||||
| Fiscal year ended | ||||||||||||
| December 25, 2010 |
December 26, 2009 |
December 27, 2008 |
||||||||||
| Dunkin’ Donuts International |
$ | 3,913 | 3,718 | 4,385 | ||||||||
| Baskin-Robbins International |
13,912 | 10,583 | 9,784 | |||||||||
| Total equity in net income of joint ventures |
$ | 17,825 | 14,301 | 14,169 | ||||||||
Depreciation and amortization is not included in segment profit for each reportable segment. However, depreciation and amortization is included in the financial results regularly provided to the Company’s senior management. Depreciation and amortization by reportable segments was as follows (in thousands):
| Depreciation and amortization | ||||||||||||
| Fiscal year ended | ||||||||||||
| December 25, 2010 |
December 26, 2009 |
December 27, 2008 |
||||||||||
| Dunkin’ Donuts U.S. |
$ | 21,802 | 24,035 | 25,475 | ||||||||
| Dunkin’ Donuts International |
129 | 143 | 222 | |||||||||
| Baskin-Robbins U.S. |
760 | 1,079 | 1,590 | |||||||||
| Baskin-Robbins International |
1,183 | 1,173 | 1,294 | |||||||||
| Total reportable segments |
23,874 | 26,430 | 28,581 | |||||||||
| Corporate and other |
33,952 | 36,481 | 37,719 | |||||||||
| Total depreciation and amortization |
$ | 57,826 | 62,911 | 66,300 | ||||||||
Property and equipment, net by geographic region as of December 25, 2010 and December 26, 2009 are based on the physical locations within the indicated geographic regions and are as follows (in thousands):
| December 25, 2010 |
December 26, 2009 |
|||||||
| United States |
$ | 187,862 | 204,708 | |||||
| International |
5,411 | 4,951 | ||||||
| $ | 193,273 | 209,659 | ||||||
(13) Stockholders’ equity
(a) Common Stock
Our charter authorizes the Company to issue two classes of common stock, Class A and Class L. The rights of the holders of Class A and Class L common stock are identical, except with respect to priority in the event of a distribution, as defined. The Class L common stock is entitled to a preference with respect to all distributions by
| F-33 | (Continued) |
Table of Contents
Dunkin’ Brands Group, Inc. and subsidiaries
Notes to consolidated financial statements—(continued)
December 25, 2010 and December 26, 2009
the Company until the holders of Class L common stock have received an amount equal to the Class L base amount of approximately forty-one dollars and seventy-five cents per share, plus an amount sufficient to generate an internal rate of return of 9% per annum on the Class L base amount, compounded quarterly. Thereafter, the Class A common stock and Class L common stock share ratably in all distributions by the Company. In the event of a change of control or an initial public offering of the Company, each share of Class L common stock is convertible into a number of shares of Class A common stock based on the fair market value of a Class A share at such time. Class L common stock is classified outside of permanent equity in the consolidated balance sheets at its preferential distribution amount, as the Class L stockholders control the timing and amount of distributions. The Class L preferred return of 9% per annum, compounded quarterly, is added to the Class L preferential distribution amount each period and recorded as an increase to accumulated deficit. Dividends paid on the Class L common stock reduce the Class L preferential distribution amount.
The changes in Class L common stock were as follows (in thousands):
| Fiscal year ended | ||||||||||||||||||||||||
| December 25, 2010 | December 26, 2009 | December 27, 2008 | ||||||||||||||||||||||
| Shares | Amount | Shares | Amount | Shares | Amount | |||||||||||||||||||
| Common stock, Class L, beginning of year |
22,981 | $ | 1,232,001 | 22,918 | $ | 1,127,863 | 22,918 | $ | 1,033,450 | |||||||||||||||
| Issuance of Class L common stock |
14 | 754 | 63 | 2,648 | — | — | ||||||||||||||||||
| Repurchases of Class L common stock |
— | (3,197 | ) | — | (3,070 | ) | — | (1,039 | ) | |||||||||||||||
| Cash dividends paid |
— | (500,002 | ) | — | — | — | — | |||||||||||||||||
| Accretion of Class L preferred return |
— | 111,026 | — | 104,560 | — | 95,452 | ||||||||||||||||||
| Common stock, Class L, end of year |
22,995 | $ | 840,582 | 22,981 | $ | 1,232,001 | 22,918 | $ | 1,127,863 | |||||||||||||||
On December 3, 2010, the board of directors declared an aggregate dividend in the amount of $500.0 million, or $21.93 per share, payable on that date in accordance with the Company’s charter to the holders of Class L common stock as of that date. The dividend was recorded as a reduction to Class L common stock.
Class A shares issued and outstanding included in the consolidated balance sheets include vested and unvested restricted shares. Class A shares of common stock in the consolidated statement of stockholders’ equity and comprehensive income (loss) exclude unvested restricted shares.
(b) Treasury stock
During fiscal years 2010, 2009, and 2008, the Company repurchased a total of 885,280 shares, 919,869 shares, and 359,836 shares, respectively, of Class A common stock and 65,414 shares, 72,859 shares, and 24,789 shares, respectively, of Class L common stock that were originally sold and granted to former employees of the Company. The Company accounts for treasury stock under the cost method, and as such has recorded a total of $1.8 million in Class A treasury stock as of December 25, 2010 based on the fair market value of the shares on the respective dates of repurchase. Repurchases of Class L common stock are recorded as reductions to Class L common stock.
(c) Equity incentive plans
The Company’s 2006 Executive Incentive Plan, as amended, (the 2006 Plan), provides for the grant of stock-based and other incentive awards. A maximum of 55,689,151 shares of Class A common stock may be
| F-34 | (Continued) |
Table of Contents
Dunkin’ Brands Group, Inc. and subsidiaries
Notes to consolidated financial statements—(continued)
December 25, 2010 and December 26, 2009
delivered in satisfaction of awards under the 2006 Plan, of which a maximum of 22,899,228 shares may be awarded as nonvested (restricted) shares and a maximum of 32,789,923 may be delivered in satisfaction of stock options.
Total share-based compensation expense, which is included in general and administrative expenses, net, consisted of the following (in thousands):
| Fiscal year ended | ||||||||||||
| December 25, 2010 |
December 26, 2009 |
December 27, 2008 |
||||||||||
| Restricted shares |
$ | 639 | 1,684 | 1,700 | ||||||||
| Stock options—executive |
703 | — | — | |||||||||
| Stock options—nonexecutive |
119 | 61 | 49 | |||||||||
| Total share-based compensation |
$ | 1,461 | 1,745 | 1,749 | ||||||||
| Total related tax benefit |
$ | 619 | 676 | 699 | ||||||||
Nonvested (restricted) shares
The Company has issued restricted shares of Class A common stock to certain executive officers of the Company. The restricted shares generally vest in three separate tranches with different vesting conditions. In addition to the vesting conditions described below, all three tranches of the restricted shares provide for partial or full accelerated vesting upon change in control. Restricted shares that do not vest are forfeited to the Company.
Tranche 1 shares generally vest in four or five equal annual installments based on a service condition. The weighted average requisite service period for the Tranche 1 shares is approximately 4.4 years, and compensation cost is recognized ratably over this requisite service period.
For the restricted shares granted in May 2006, the Tranche 2 shares generally vest in installments on August 31, 2006, December 29, 2007, and continuing annually through December 25, 2010 based on a service condition and performance conditions linked to annual EBITDA targets, which were not achieved for fiscal years 2008, 2009, and 2010. As the Tranche 2 shares vest in installments and contain a performance condition, these shares are treated as five separate awards with five separate vesting dates and requisite service periods. The requisite service periods for the Tranche 2 shares are approximately 0.3 years for the shares that vested on August 31, 2006, 1.3 years for the shares that vested on December 29, 2007, and approximately 1.0 year for the remaining vesting periods. Total compensation cost for the Tranche 2 shares is determined based on the most likely outcome of the performance conditions and the number of awards expected to vest based on those outcomes.
For all other restricted shares granted, the Tranche 2 shares generally vest in five annual installments beginning on the last day of the fiscal year of grant based on a service condition and performance conditions linked to annual EBITDA targets, which were not achieved for fiscal years 2008, 2009, and 2010 and are not expected to be achieved in future years. These shares are also treated as five separate awards with five separate vesting dates and requisite service periods. The requisite service periods for these Tranche 2 shares range from 0.2 to 0.5 years for the shares that vest in the year of grant and approximately 1.0 year for the remaining vesting periods.
| F-35 | (Continued) |
Table of Contents
Dunkin’ Brands Group, Inc. and subsidiaries
Notes to consolidated financial statements—(continued)
December 25, 2010 and December 26, 2009
Tranche 3 shares generally vest in four annual installments based on a service condition, a performance condition, and market conditions. The Tranche 3 shares do not become eligible to vest until the achievement of the performance condition, which is defined as an initial public offering or change in control. These events are not yet considered probable of occurring. The market condition relates to the achievement of a minimum investor rate of return on the Sponsor’s shares ranging from 20% to 24% as of specified measurement dates, which occur on the six month anniversary of an initial public offering and every three months thereafter, or on the date of a change in control. Once the occurrence of the performance condition is deemed probable, the derived service period of the market condition will be determined based on a valuation model. As the Tranche 3 shares require the satisfaction of multiple vesting conditions, the requisite service period will be the longest of the explicit, implicit, and derived service periods of the service, performance, and market conditions. As the performance condition cannot be deemed probable of occurring until an initial public offering or change of control event is completed, no compensation cost has been recognized related to the Tranche 3 shares. If an initial public offering or change of control event does occur, the cumulative compensation cost based on the portion of the service period that has elapsed since the grant date would be recorded in the period that such event occurs.
A summary of the changes in the Company’s restricted shares during fiscal year 2010 is presented below:
| Number of shares |
Weighted average grant-date fair value |
|||||||
| Restricted shares at December 26, 2009 |
9,218,019 | $ | 0.95 | |||||
| Granted |
— | — | ||||||
| Vested |
(1,341,142 | ) | 1.00 | |||||
| Forfeited |
(2,916,818 | ) | 1.00 | |||||
| Restricted shares at December 25, 2010 |
4,960,059 | 0.94 | ||||||
The fair value of each restricted share was estimated on the date of grant based on recent transactions and third-party valuations of the Company’s common stock. As of December 25, 2010, there was $184 thousand of total unrecognized compensation cost related to the Tranche 1 restricted shares granted under the 2006 Plan. Unrecognized compensation cost related to the Tranche 1 shares is expected to be recognized over a weighted average period of approximately 1.3 years. The total potential unrecognized compensation cost related to the Tranche 2 shares is $170 thousand. As the performance condition for Tranche 2 shares is not deemed probable of occurring, it is unlikely the compensation cost will be recognized. The total potential unrecognized compensation cost related to the Tranche 3 shares is $3.9 million, and no compensation cost will be recognized until the related performance condition is deemed probable of occurring. The total grant-date fair value of shares vested during fiscal years 2010, 2009, and 2008 was $1.3 million, $1.9 million, and $1.8 million, respectively.
Stock options—executive
During fiscal year 2010, the Company granted options to executives to purchase 21,700,000 shares of Class A common stock under the 2006 Plan. The executive options vest in two separate tranches, 30% allocated as Tranche 4 and 70% allocated as Tranche 5, each with different vesting conditions. In addition to the vesting
| F-36 | (Continued) |
Table of Contents
Dunkin’ Brands Group, Inc. and subsidiaries
Notes to consolidated financial statements—(continued)
December 25, 2010 and December 26, 2009
conditions described below, both tranches provide for partial accelerated vesting upon change in control. The maximum contractual term of the executive options is ten years.
The Tranche 4 executive options generally vest in equal annual amounts over a five-year period subsequent to the grant date, and as such are subject to a service condition. Certain options provide for accelerated vesting at the date of grant, with 20% of the Tranche 4 options vesting on each subsequent anniversary of the grant date over a three or four-year period. The requisite service periods over which compensation cost is being recognized ranges from three to five years.
The Tranche 5 executive options become eligible to vest based on continued service periods of three to five years that are aligned with the Tranche 4 executive options. Vesting does not actually occur until the achievement of a performance condition, which is the sale of shares by the Sponsors. Additionally, the options are subject to a market condition related to the achievement of specified investor returns to the Sponsors upon a sale of shares. Upon a sale of shares by the Sponsors and assuming the requisite service has been provided, Tranche 5 options will vest in proportion to the percentage of the Sponsors’ shares sold by them, but only if the aggregate return on those shares sold is two times the Sponsors’ original purchase price. Additionally, 100% of the Tranche 5 options will vest, assuming the requisite service has been provided, if the aggregate amount of cash received by the Sponsors through sales, distributions, or dividends is two times the original purchase price of all shares purchased by the Sponsors. As the Tranche 5 options require the satisfaction of multiple vesting conditions, the requisite service period will be the longest of the explicit, implicit, and derived service periods of the service, performance, and market conditions. As the performance condition cannot be deemed probable of occurring until a Sponsor liquidity event occurs, no compensation cost has been recognized related to the Tranche 5 options.
The fair value of the Tranche 4 options was estimated on the date of grant using the Black-Scholes option pricing model. The fair value of the Tranche 5 options was estimated on the date of grant using a combination of lattice models and Monte Carlo simulations. These models are impacted by the Company’s stock price and certain assumptions related to the Company’s stock and employees’ exercise behavior. Additionally, the value of the Tranche 5 options is impacted by the probability of achievement of the market condition. The following weighted average assumptions were utilized in determining the fair value of executive options granted during fiscal years 2010:
| Fiscal year ended December 25, 2010 | ||
| Weighted average grant-date fair value of share options granted |
$0.33 | |
| Significant assumptions: |
||
| Tranche 4 options: |
||
| Risk-free interest rate |
2.0%–2.8% | |
| Expected volatility |
58.0% | |
| Dividend yield |
— | |
| Expected term (years) |
5.6–6.5 | |
| Tranche 5 options: |
||
| Risk-free interest rate |
2.3%–3.4% | |
| Expected volatility |
43.1%–66.4% | |
| Dividend yield |
— | |
| F-37 | (Continued) |
Table of Contents
Dunkin’ Brands Group, Inc. and subsidiaries
Notes to consolidated financial statements—(continued)
December 25, 2010 and December 26, 2009
The expected term of the Tranche 4 options was estimated utilizing the simplified method. We utilized the simplified method because the Company does not have sufficient historical exercise data to provide a reasonable basis upon which to estimate expected term. The simplified method was used for all stock options that require only a service vesting condition, including all Tranche 4 options, for all periods presented. The risk-free interest rate assumption was based on yields of U.S. Treasury securities in effect at the date of grant with terms similar to the expected term. Expected volatility was estimated based on historical volatility of peer companies over a period equivalent to the expected term. Additionally, the Company does not currently anticipate paying dividends on the underlying Class A common stock.
As share-based compensation expense recognized is based on awards ultimately expected to vest, it has been reduced for estimated forfeitures of generally 10% per year. Forfeitures are required to be estimated at the time of grant and revised, if necessary, in subsequent periods if actual forfeitures differ from those estimates. Forfeitures were estimated based on historical and forecasted turnover.
A summary of the status of the Company’s executive stock options as of December 25, 2010 and changes during fiscal year 2010 are presented below:
| Number of shares |
Weighted average exercise price |
Weighted average remaining contractual term (years) |
Aggregate intrinsic value (in thousands) |
|||||||||||||
| Share options outstanding at December 26, 2009 |
— | $ | — | — | ||||||||||||
| Granted |
21,700,000 | 0.68 | ||||||||||||||
| Exercised |
— | — | ||||||||||||||
| Forfeited or expired |
(1,260,000 | ) | 0.66 | |||||||||||||
| Share options outstanding at December 25, 2010 |
20,440,000 | 0.68 | 9.2 | $ | 18,862 | |||||||||||
| Share options exercisable at December 25, 2010 |
819,000 | 0.66 | 9.2 | 770 | ||||||||||||
Executive stock options granted during fiscal year 2010 consisted of the following:
| Grant Date | Number of awards granted |
Option exercise price |
Fair value of underlying common stock |
|||||||||
| 2/23/2010 |
20,900,000 | $ | 0.66 | $ | 0.66 | |||||||
| 7/26/2010 |
775,000 | $ | 1.10 | $ | 1.10 | |||||||
| 8/6/2010 |
25,000 | $ | 1.10 | $ | 1.10 | |||||||
The fair value of the Class A common stock underlying the options granted during fiscal year 2010 was determined based on a contemporaneous valuation performed by an independent third-party valuation specialist in accordance with the guidelines outlined in the American Institute of Certified Public Accountants Practice Aid, Valuation of Privately-Held-Company Equity Securities Issued as Compensation.
As of December 25, 2010, there was $1.7 million of total unrecognized compensation cost related to executive stock options granted under the 2006 Plan. Unrecognized compensation cost is expected to be recognized over a weighted average period of approximately 3.7 years.
Stock options—nonexecutive
During fiscal years 2010, 2009, and 2008, the Company granted options to nonexecutives to purchase 1,015,000 shares, 68,100 shares, and 318,000 shares, respectively, of Class A common stock under the 2006
| F-38 | (Continued) |
Table of Contents
Dunkin’ Brands Group, Inc. and subsidiaries
Notes to consolidated financial statements—(continued)
December 25, 2010 and December 26, 2009
Plan. The nonexecutive options vest in equal annual amounts over a five-year period subsequent to the grant date, and as such are subject to a service condition, and also fully vest upon a change of control. The requisite service period over which compensation cost is being recognized is five years. The maximum contractual term of the nonexecutive options is ten years.
The fair value of nonexecutive options was estimated on the date of grant using the Black-Scholes option pricing model. This model is impacted by the Company’s stock price and certain assumptions related to the Company’s stock and employees’ exercise behavior. The following weighted average assumptions were utilized in determining the fair value of nonexecutive options granted during fiscal years 2010, 2009, and 2008:
| Fiscal year ended | ||||||||||||
| December 25, 2010 |
December 26, 2009 |
December 27, 2008 |
||||||||||
| Weighted average grant-date fair value of share options granted |
$ | 0.63 | 0.17 | 0.45 | ||||||||
| Weighted average assumptions: |
||||||||||||
| Risk-free interest rate |
2.1% | 2.3% | 3.6% | |||||||||
| Expected volatility |
58.0 | 37.0 | 30.0 | |||||||||
| Dividend yield |
— | — | — | |||||||||
| Expected term (years) |
6.5 | 6.5 | 6.5 | |||||||||
The expected term was estimated utilizing the simplified method. We utilized the simplified method because the Company does not have sufficient historical exercise data to provide a reasonable basis upon which to estimate expected term. The simplified method was used for all stock options that require only a service vesting condition, including all non-executive options for all periods presented. The risk-free interest rate assumption was based on yields of U.S. Treasury securities in effect at the date of grant with terms similar to the expected term. Expected volatility was estimated based on historical volatility of peer companies over a period equivalent to the expected term. Additionally, the Company does not currently anticipate paying dividends on the underlying Class A common stock.
As share-based compensation expense recognized is based on awards ultimately expected to vest, it has been reduced for annualized estimated forfeitures of 13%. Forfeitures are required to be estimated at the time of grant and revised, if necessary, in subsequent periods if actual forfeitures differ from those estimates. Forfeitures were estimated based on historical and forecasted turnover.
A summary of the status of the Company’s nonexecutive stock options as of December 25, 2010 and changes during fiscal year 2010 is presented below:
| Number of shares |
Weighted average exercise price |
Weighted average remaining contractual term (years) |
Aggregate intrinsic value (in thousands) |
|||||||||||||
| Share options outstanding at December 26, 2009 |
786,850 | $ | 1.03 | 7.6 | ||||||||||||
| Granted |
1,015,000 | 1.10 | ||||||||||||||
| Exercised |
— | — | ||||||||||||||
| Forfeited or expired |
(156,880 | ) | 1.04 | |||||||||||||
| Share options outstanding at December 25, 2010 |
1,644,970 | 1.07 | 8.5 | $ | 870 | |||||||||||
| Share options exercisable at December 25, 2010 |
374,080 | 1.04 | 6.3 | 209 | ||||||||||||
| F-39 | (Continued) |
Table of Contents
Dunkin’ Brands Group, Inc. and subsidiaries
Notes to consolidated financial statements—(continued)
December 25, 2010 and December 26, 2009
Nonexecutive stock options granted during fiscal year 2010 consisted of the following:
| Grant Date | Number of awards granted |
Option exercise price |
Fair value of underlying common stock |
|||||||||
| 7/26/2010 |
90,000 | $ | 1.10 | $ | 1.10 | |||||||
| 8/6/2010 |
925,000 | $ | 1.10 | $ | 1.10 | |||||||
The fair value of the Class A common stock underlying the options granted during fiscal year 2010 was determined based on a contemporaneous valuation performed by an independent third-party valuation specialist in accordance with the guidelines outlined in the American Institute of Certified Public Accountants Practice Aid, Valuation of Privately-Held-Company Equity Securities Issued as Compensation.
As of December 25, 2010, there was $452 thousand of total unrecognized compensation cost related to nonexecutive stock options granted under the 2006 Plan. Unrecognized compensation cost is expected to be recognized over a weighted average period of approximately 4.2 years.
(d) Accumulated other comprehensive income
The components of accumulated other comprehensive income were as follows (in thousands):
| December 25, 2010 |
December 26, 2009 |
|||||||
| (As adjusted) | ||||||||
| Effect of foreign currency translation |
$ | 14,350 | 4,726 | |||||
| Other |
(723 | ) | (297 | ) | ||||
| Total accumulated other comprehensive income |
$ | 13,627 | 4,429 | |||||
(14) Income taxes
Income (loss) before income taxes was attributed to domestic and foreign taxing jurisdictions as follows (in thousands):
| Fiscal year ended | ||||||||||||
| December 25, 2010 |
December 26, 2009 |
December 27, 2008 |
||||||||||
| (As adjusted) | (As adjusted) | |||||||||||
| Domestic operations |
$ | 2,270 | 54,804 | (269,867 | ) | |||||||
| Foreign operations |
17,176 | 19,472 | 9,101 | |||||||||
| Income (loss) before income taxes |
$ | 19,446 | 74,276 | (260,766 | ) | |||||||
| F-40 | (Continued) |
Table of Contents
Dunkin’ Brands Group, Inc. and subsidiaries
Notes to consolidated financial statements—(continued)
December 25, 2010 and December 26, 2009
The components of the provision (benefit) for income taxes were as follows (in thousands):
| Fiscal year ended | ||||||||||||
| December 25, 2010 |
December 26, 2009 |
December 27, 2008 |
||||||||||
| (As adjusted) | (As adjusted) | |||||||||||
| Current: |
||||||||||||
| Federal |
$ | 11,497 | 8,575 | 22,606 | ||||||||
| State |
5,339 | 8,585 | 7,498 | |||||||||
| Foreign |
4,138 | 3,807 | 3,175 | |||||||||
| Current tax provision |
20,974 | 20,967 | 33,279 | |||||||||
| December 25, 2010 |
December 26, 2009 |
December 27, 2008 |
||||||||||
| Deferred: |
||||||||||||
| Federal |
$ | (16,916 | ) | 15,773 | (15,656 | ) | ||||||
| State |
(10,397 | ) | 2,239 | (8,461 | ) | |||||||
| Foreign |
(1,076 | ) | 289 | (30 | ) | |||||||
| Deferred tax provision (benefit) |
(28,389 | ) | 18,301 | (24,147 | ) | |||||||
| Provision (benefit) for income taxes |
$ | (7,415 | ) | 39,268 | 9,132 | |||||||
The provision for income taxes from continuing operations differed from the expense computed using the statutory federal income tax rate of 35% due to the following:
| Fiscal year ended | ||||||||||||
| December 25, 2010 |
December 26, 2009 |
December 27, 2008 |
||||||||||
| (As adjusted) | (As adjusted) | |||||||||||
| Computed federal income tax expense, at statutory rate |
35.0% | 35.0% | 35.0% | |||||||||
| Permanent differences: |
||||||||||||
| Goodwill impairment |
— | — | (39.5) | |||||||||
| Other permanent differences |
1.7 | 0.5 | (0.2) | |||||||||
| State income taxes |
(25.4) | 4.8 | 0.9 | |||||||||
| Benefits and taxes related to foreign operations |
(33.4) | (6.9) | 1.6 | |||||||||
| Change in valuation allowance |
— | 7.8 | — | |||||||||
| Uncertain tax positions |
(16.1) | 12.3 | (1.3) | |||||||||
| Other |
0.1 | (0.6) | — | |||||||||
| (38.1)% | 52.9% | (3.5)% | ||||||||||
During the year ended December 25, 2010, the Company recognized a deferred tax benefit of $5.7 million, due to changes in the estimated apportionment of income among the states in which the Company earns income and enacted changes in future state income tax rates. During the year ended December 27, 2008, the Company recognized a deferred tax benefit of $4.4 million, due to enacted changes in future state income tax rates. These changes in estimates and enacted tax rates affect the tax rate expected to be in effect in future periods when the deferred tax assets and liabilities reverse.
| F-41 | (Continued) |
Table of Contents
Dunkin’ Brands Group, Inc. and subsidiaries
Notes to consolidated financial statements—(continued)
December 25, 2010 and December 26, 2009
The components of deferred tax assets and liabilities were as follows (in thousands):
| December 25, 2010 | December 26, 2009 | |||||||||||||||
| Deferred tax assets |
Deferred tax liabilities |
Deferred tax assets |
Deferred tax liabilities |
|||||||||||||
| (As adjusted) | ||||||||||||||||
| Current: |
||||||||||||||||
| Allowance for doubtful accounts |
$ | 1,774 | — | 2,238 | — | |||||||||||
| Deferred gift certificates |
2,544 | — | 2,644 | — | ||||||||||||
| Rent |
2,147 | — | 2,111 | — | ||||||||||||
| Deferred revenue |
7,757 | — | 8,248 | — | ||||||||||||
| Accrued expenses |
3,142 | — | 3,875 | — | ||||||||||||
| Other |
998 | — | 2,117 | — | ||||||||||||
| 18,362 | — | 21,233 | — | |||||||||||||
| Valuation allowance |
(5,792 | ) | — | (6,526 | ) | — | ||||||||||
| Total current |
12,570 | — | 14,707 | — | ||||||||||||
| Noncurrent: |
||||||||||||||||
| Capital leases |
492 | — | 438 | — | ||||||||||||
| Rent |
1,465 | — | 855 | — | ||||||||||||
| Property and equipment |
— | 11,992 | — | 14,936 | ||||||||||||
| Deferred compensation and long-term incentive accrual |
1,825 | — | 171 | — | ||||||||||||
| Deferred revenue |
7,833 | — | 13,221 | — | ||||||||||||
| Real estate reserves |
1,669 | — | 1,565 | — | ||||||||||||
| Franchise rights and other intangibles |
— | 600,481 | — | 619,509 | ||||||||||||
| Capital loss |
18,876 | — | 18,876 | — | ||||||||||||
| Other |
7,060 | — | — | 6,655 | ||||||||||||
| 39,220 | 612,473 | 35,126 | 641,100 | |||||||||||||
| Valuation allowance |
(13,084 | ) | — | (12,350 | ) | — | ||||||||||
| Total noncurrent |
26,136 | 612,473 | 22,776 | 641,100 | ||||||||||||
| $ | 38,706 | 612,473 | 37,483 | 641,100 | ||||||||||||
In assessing the realizability of deferred tax assets, management considers whether it is more likely than not that some portion or all of the deferred tax assets will not be realized. The ultimate realization of deferred tax assets is dependent upon the generation of future taxable income during the periods in which those temporary differences become deductible. Management considers the scheduled reversal of deferred tax liabilities, projected future taxable income, and tax planning strategies in making this assessment. Based upon the level of historical taxable income, and projections for future taxable income over the periods for which the deferred tax assets are deductible, management believes, as of December 25, 2010, it is more likely than not that the Company will realize the benefits of the deferred tax assets.
| F-42 | (Continued) |
Table of Contents
Dunkin’ Brands Group, Inc. and subsidiaries
Notes to consolidated financial statements—(continued)
December 25, 2010 and December 26, 2009
As of December 25, 2010 and December 26, 2009, the valuation allowance for deferred tax assets was $18.9 million. These valuation allowance amounts relate to deferred tax assets for capital loss carryforwards. During fiscal year 2009, the Company recognized no change in this specific deferred tax asset and an increase to the related valuation allowance of $5.8 million, which represents a full valuation allowance against the asset. The Company recorded the valuation allowance at December 25, 2010 and December 26, 2009 because it is more likely than not that there will not be sufficient capital gain income in future periods to utilize the remaining capital loss carryforwards. Any future reversal of the valuation allowance related to these capital loss carryforwards will be recorded to the provision for income taxes in the consolidated statements of operations. The capital loss carryforwards will expire in 2012.
The Company has not recognized a deferred tax liability of $8.7 million for the undistributed earnings of foreign operations, net of foreign tax credits, relating to our foreign joint ventures that arose in 2010 and prior years because the Company currently does not expect those unremitted earnings to reverse and become taxable to the Company in the foreseeable future. A deferred tax liability will be recognized when the Company is no longer able to demonstrate that it plans to permanently reinvest undistributed earnings. As of December 25, 2010 and December 26, 2009, the undistributed earnings of these joint ventures were approximately $97.9 million and $80.0 million, respectively.
At December 25, 2010 and December 26, 2009, the total amount of unrecognized tax benefits related to uncertain tax positions was $17.5 million and $27.1 million, respectively. Of the total unrecognized tax benefits at December 25, 2010, $13.5 million would impact the effective tax rate if recognized. At December 25, 2010 and December 26, 2009, the Company had approximately $12.1 million and $12.0 million, respectively, of accrued interest and penalties related to uncertain tax positions. During fiscal years 2010, 2009, and 2008, the Company recorded $0.6 million, $6.2 million, and $0.9 million, respectively, in income tax expense to accrue for potential interest and penalties related to uncertain tax positions.
The Company’s major tax jurisdictions are the United States and Canada. For Canada, the Company has open tax years dating back to tax years ended August 2001. In the United States, the Company is currently under audit in certain state jurisdictions for tax periods after August 2003 and has agreed to statute extensions in certain jurisdictions, including New York State and New York City. It is uncertain that these audits will conclude in 2011 and quantification of an estimated impact on the total amount of unrecognized tax benefits cannot be made at this time. For U.S. federal taxes, the Company has open tax years dating back to 2006. In addition, the Internal Revenue Service (IRS) is conducting an examination of certain tax positions related to the utilization of capital losses. During 2010, the Company made a payment of approximately $6.0 million to the IRS for this issue. The payment did not have a material impact on the Company’s financial position.
On August 12, 2010, the Company received a Revenue Agent Report (RAR) from the IRS relating to its field examination of our U.S. federal income tax returns for fiscal years 2006 and 2007. The IRS has proposed adjustments for these periods to increase our taxable income as it relates to our gift card program, specifically to record taxable income upon the activation of gift cards. The proposed adjustment would result in additional taxable income of approximately $58.9 million for these years and approximately $26.0 million of additional federal and state taxes and interest owed, net of federal and state benefits. If the IRS prevails, a cash payment would be required and the additional taxable income would represent temporary differences that will be deductible in future years. Therefore, the potential tax expense impact attributable to the IRS adjustments for
| F-43 | (Continued) |
Table of Contents
Dunkin’ Brands Group, Inc. and subsidiaries
Notes to consolidated financial statements—(continued)
December 25, 2010 and December 26, 2009
2006 and 2007 would be limited to $2.1 million, consisting of federal and state interest, net of federal and state benefits. Furthermore, if the IRS prevails it is likely to make similar claims for years subsequent to fiscal 2007 and our fiscal 2008 U.S. federal income tax return is currently being reviewed by the IRS. The potential additional federal and state taxes and interest owed, net of federal and state benefits, for these later years, through 2010, computed on a similar basis to the IRS method used for 2006 and 2007, and factoring in for the timing of our gift card uses and activations, would be approximately $19.2 million. The corresponding potential tax expense impact attributable to these later fiscal years, 2008 through 2010, would be $0.3 million, consisting of federal and state interest, net of federal and state benefits.
We believe that the Company has properly reported taxable income and paid taxes in accordance with applicable laws and that the proposed adjustment is inconsistent with our franchisor model and the structure of our gift card program. Since the inception of our gift card program, the Company and its franchisees have understood that gift card funds would be utilized specifically for the gift card program and cash related to the program has been segregated and treated as a bona fide liability due to franchisees for such use. We have filed a protest to the IRS’ proposed adjustments on such basis; in addition, we believe we have alternative grounds to appeal on should this position be denied. We intend to vigorously defend our position. At December 25, 2010, we have not recorded additional tax liability within our consolidated balance sheets for the proposed adjustments, as we believe it is more likely than not that we will prevail in our appeal. However, no assurance can be made that we will prevail in the final resolution. The Company does not expect resolution of this matter within the next fiscal year and cannot predict with certainty the timing of such resolution.
A summary of the changes in the Company’s unrecognized tax benefits is as follows (in thousands):
| Fiscal year ended | ||||||||||||
| December 25, 2010 |
December 26, 2009 |
December 27, 2008 |
||||||||||
| Balance at beginning of year |
$ | 27,092 | 16,861 | 16,757 | ||||||||
| Increases related to prior year tax positions |
792 | 8,580 | 1,112 | |||||||||
| Increases related to current year tax positions |
1,373 | 1,823 | 1,721 | |||||||||
| Decreases related to prior year tax positions |
(4,721 | ) | — | (84 | ) | |||||||
| Decreases related to settlements |
(6,622 | ) | — | (127 | ) | |||||||
| Lapses of statutes of limitations |
(534 | ) | (828 | ) | (1,612 | ) | ||||||
| Effect of foreign currency adjustments |
169 | 656 | (906 | ) | ||||||||
| Balance at end of year |
$ | 17,549 | 27,092 | 16,861 | ||||||||
(15) Commitments and contingencies
(a) Lease commitments
The Company is party to various leases for property, including land and buildings, leased automobiles and office equipment under noncancelable operating and capital lease arrangements (see note 11).
(b) Guarantees
The Company has established agreements with certain financial institutions whereby the Company’s franchisees can obtain financing with terms of approximately five to ten years for various business purposes. Substantially
| F-44 | (Continued) |
Table of Contents
Dunkin’ Brands Group, Inc. and subsidiaries
Notes to consolidated financial statements—(continued)
December 25, 2010 and December 26, 2009
all loan proceeds are used by the franchisees to finance store improvements, new store development, new central production locations, equipment purchases, related business acquisition costs, working capital, and other costs. In limited instances, the Company guarantees a portion of the payments and commitments of the franchisees, which is collateralized by the store equipment owned by the franchisee. Under the terms of the agreements, in the event that all outstanding borrowings come due simultaneously, the Company would be contingently liable for $7.7 million and $8.8 million at December 25, 2010 and December 26, 2009, respectively. At December 25, 2010 and December 26, 2009, there were no amounts under such guarantees that were due. The fair value of the guarantee liability and corresponding asset recorded on the consolidated balance sheets was $1.0 million and $1.5 million, respectively, at December 25, 2010 and $1.5 million and $2.6 million, respectively, at December 26, 2009. The Company assesses the risk of performing under these guarantees for each franchisee relationship on a quarterly basis. As of December 25, 2010 and December 26, 2009, the Company had recorded reserves for such guarantees of $1.2 million and $790 thousand, respectively.
The Company has entered into a third-party guarantee with a distribution facility of franchisee products that ensures franchisees will purchase a certain volume of product over a ten-year period. As product is purchased by the Company’s franchisees over the term of the agreement, the amount of the guarantee is reduced. As of December 25, 2010 and December 26, 2009, the Company was contingently liable for $8.6 million and $9.3 million, respectively, under this guarantee. Based on current internal forecasts, the Company believes the franchisees will achieve the required volume of purchases, and therefore, the Company would not be required to make payments under this agreement. Additionally, the Company has various supply chain contracts that provide for purchase commitments or exclusivity, the majority of which result in the Company being contingently liable upon early termination of the agreement or engaging with another supplier. Based on prior history and the Company’s ability to extend contract terms, we have not recorded any liabilities related to these commitments. As of December 25, 2010, we were contingently liable under such supply chain agreements for approximately $16 million.
As a result of assigning our interest in obligations under property leases as a condition of the refranchising of certain restaurants and the guarantee of certain other leases, we are contingently liable on certain lease agreements. These leases have varying terms, the latest of which expires in 2024. As of December 25, 2010 and December 26, 2009, the potential amount of undiscounted payments the Company could be required to make in the event of nonpayment by the primary lessee was $7.2 million and $6.9 million, respectively. Our franchisees are the primary lessees under the majority of these leases. The Company generally has cross-default provisions with these franchisees that would put them in default of their franchise agreement in the event of nonpayment under the lease. We believe these cross-default provisions significantly reduce the risk that we will be required to make payments under these leases. Accordingly, we do not believe it is probable that the Company will be required to make payments under such leases, and we have not recorded a liability for such contingent liabilities.
(c) Letters of credit
At December 25, 2010 and December 26, 2009, the Company had standby letters of credit outstanding for a total of $11.2 million and $34.3 million, respectively. There were no amounts drawn down on these letters of credit.
| F-45 | (Continued) |
Table of Contents
Dunkin’ Brands Group, Inc. and subsidiaries
Notes to consolidated financial statements—(continued)
December 25, 2010 and December 26, 2009
(d) Legal matters
The Company is engaged in several matters of litigation arising in the ordinary course of its business as a franchisor. Such matters include disputes related to compliance with the terms of franchise and development agreements, including claims or threats of claims of breach of contract, negligence, and other alleged violations by the Company. At December 25, 2010 and December 26, 2009, contingent liabilities totaling $4.2 million and $810 thousand, respectively, were included in other current liabilities in the consolidated balance sheets to reflect the Company’s estimate of the potential loss which may be incurred in connection with these matters. While the Company intends to vigorously defend its positions against all claims in these lawsuits and disputes, it is reasonably possible that the losses in connection with these matters could increase by up to an additional $8.0 million based on the outcome of ongoing litigation or negotiations.
(16) Retirement plans
401(k) Plan
Employees of the Company, excluding employees of certain international subsidiaries, participate in a defined contribution retirement plan, the Dunkin’ Brands, Inc. 401(k) Retirement Plan (401(k) Plan), under Section 401(k) of the Internal Revenue Code (IRC). Under the 401(k) Plan, employees may contribute up to 50% of their base salary as a pre-tax deduction, not to exceed the annual limits set by the IRS. The 401(k) Plan allows the Company to match participants’ contributions in an amount determined in the sole discretion of the Company. The Company matched participants’ contributions during fiscal year 2010, January through February 2009, and fiscal year 2008, up to a maximum of 4% of the employee’s salary. The Company provided a 1% match for participants’ contributions that were made between March and December 2009. Employer contributions for fiscal years 2010, 2009, and 2008 amounted to $2.1 million, $1.1 million, and $2.6 million, respectively. The 401(k) Plan also provides for an additional discretionary contribution of up to 2% of eligible wages for eligible participants based on the achievement of specified performance targets. Based on the level of achievement of such performance targets, the Company recorded no expense for fiscal years 2010 and 2009, and $656 thousand for fiscal year 2008 related to such additional matching contributions.
Deferred compensation plan
The Company, excluding employees of certain international subsidiaries, also offers to a limited group of management and highly compensated employees, as defined by the Employee Retirement Income Security Act (ERISA), the ability to participate in the DCP Plan. The DCP Plan allows for pre-tax contributions of up to 50% of a participant’s base annual salary and other forms of compensation, as defined. The Company credits the amounts deferred with earnings based on the investment options selected by the participants and holds investments to partially offset the Company’s liabilities under the DCP Plan. The DCP Plan liability, included in other long-term liabilities in the consolidated balance sheets, was $7.4 million and $7.3 million at December 25, 2010 and December 26, 2009, respectively. As of December 25, 2010 and December 26, 2009, total investments held for the DCP Plan were $4.3 million and $4.8 million, respectively, and have been recorded in other assets in the consolidated balance sheets.
Canadian pension plan
The Company sponsors a contributory defined benefit pension plan in Canada, The Baskin-Robbins Employees’ Pension Plan (Canadian Pension Plan), which provides retirement benefits for the majority of its employees.
| F-46 | (Continued) |
Table of Contents
Dunkin’ Brands Group, Inc. and subsidiaries
Notes to consolidated financial statements—(continued)
December 25, 2010 and December 26, 2009
The components of net pension expense are as follows (in thousands):
| Fiscal year ended | ||||||||||||
| December 25, 2010 |
December 26, 2009 |
December 27, 2008 |
||||||||||
| Service cost |
$ | 155 | 99 | 174 | ||||||||
| Interest cost |
316 | 276 | 272 | |||||||||
| Expected return on plan assets |
(287 | ) | (242 | ) | (319 | ) | ||||||
| Amortization of net actuarial loss |
26 | — | — | |||||||||
| Net pension expense |
$ | 210 | 133 | 127 | ||||||||
The table below summarizes other balances for fiscal years 2010 and 2009 (in thousands):
| Fiscal year ended | ||||||||
| December 25, 2010 |
December 26, 2009 |
|||||||
| Change in benefit obligation: |
||||||||
| Benefit obligation, beginning of year |
$ | 5,087 | 3,532 | |||||
| Service cost |
155 | 99 | ||||||
| Interest cost |
316 | 276 | ||||||
| Employee contributions |
69 | 51 | ||||||
| Benefits paid |
(218 | ) | (196 | ) | ||||
| Actuarial loss |
417 | 675 | ||||||
| Foreign currency loss, net |
216 | 650 | ||||||
| Benefit obligation, end of year |
$ | 6,042 | 5,087 | |||||
| Change in plan assets: |
||||||||
| Fair value of plan assets, beginning of year |
$ | 4,247 | 3,162 | |||||
| Actual return on plan assets |
287 | 395 | ||||||
| Employer contribution |
310 | 278 | ||||||
| Employee contributions |
69 | 51 | ||||||
| Benefits paid |
(218 | ) | (196 | ) | ||||
| Actuarial loss |
(74 | ) | — | |||||
| Foreign currency gain, net |
176 | 557 | ||||||
| Fair value of plan assets, end of year |
$ | 4,797 | 4,247 | |||||
| Reconciliation of funded status: |
||||||||
| Funded status |
$ | (1,245 | ) | (840 | ) | |||
| Net amount recognized at end of period |
$ | (1,245 | ) | (840 | ) | |||
| Amounts recognized in the balance sheet consist of: |
||||||||
| Accrued benefit cost |
$ | (1,245 | ) | (840 | ) | |||
| Net amount recognized at end of period |
$ | (1,245 | ) | (840 | ) | |||
| F-47 | (Continued) |
Table of Contents
Dunkin’ Brands Group, Inc. and subsidiaries
Notes to consolidated financial statements—(continued)
December 25, 2010 and December 26, 2009
The investments of the Canadian Pension Plan consisted of one pooled investment fund (pooled fund) at December 25, 2010 and December 26, 2009. The pooled fund is comprised of numerous underlying investments and is valued at the unit fair values supplied by the fund’s administrator, which represents the fund’s proportionate share of underlying net assets at market value determined using closing market prices. The pooled fund is considered Level 2, as defined by U.S. GAAP, because the inputs used to calculate the fair value are derived principally from observable market data. The objective of the pooled fund is to generate both capital growth and income, while maintaining a relatively low level of risk. To achieve its objectives, the pooled investment invests in a number of underlying funds that have holdings in a number of different asset classes while also investing directly in equities and fixed instruments issued from around the world. The Canadian Pension Plan assumes a concentration of risk as it is invested in only one investment. The risk is mitigated as the pooled investment consists of a diverse range of underlying investments. The allocation of the assets within the pooled fund consisted of the following:
| December 25, 2010 |
December 26, 2009 |
|||||||
| Equity securities |
59% | 58% | ||||||
| Debt securities |
40 | 38 | ||||||
| Other |
1 | 4 | ||||||
The actuarial assumptions used in determining the present value of accrued pension benefits at December 25, 2010 and December 26, 2009 were as follows:
| December 25, 2010 |
December 26, 2009 |
|||||||
| Discount rate |
5.50% | 6.00% | ||||||
| Average salary increase for pensionable earnings |
3.25 | 3.25 | ||||||
The actuarial assumptions used in determining the present value of our net periodic benefit cost were as follows:
| December 25, 2010 |
December 26, 2009 |
|||||||
| Discount rate |
6.00% | 7.25% | ||||||
| Average salary increase for pensionable earnings |
3.25 | 3.25 | ||||||
| Expected return on plan assets |
6.50 | 7.00 | ||||||
The accumulated benefit obligation was $5.0 million and $4.3 million at December 25, 2010 and December 26, 2009, respectively. We recognize a net liability or asset and an offsetting adjustment to accumulated other comprehensive income to report the funded status of the Canadian Pension Plan.
| F-48 | (Continued) |
Table of Contents
Dunkin’ Brands Group, Inc. and subsidiaries
Notes to consolidated financial statements—(continued)
December 25, 2010 and December 26, 2009
We anticipate contributing approximately $317 thousand to this plan in 2011. Expected benefit payments for the next five years and thereafter are as follows (in thousands):
| Fiscal year: | ||||
| 2011 |
$ | 222 | ||
| 2012 |
231 | |||
| 2013 |
244 | |||
| 2014 |
259 | |||
| 2015 |
278 | |||
| Thereafter |
1,785 | |||
| $ | 3,019 | |||
Baskin-Robbins SERP
In 1991, we established a supplemental executive retirement plan (SERP) for a select group of Baskin-Robbins executives who constitute a “top hat” group as defined by ERISA. Assets of the SERP are held in a Rabbi Trust (Trust). The SERP assets are invested in money market funds and are included in our consolidated balance sheets within other assets since the Trust permits our creditors to access our SERP assets in the event of our insolvency. The SERP assets of $909 thousand and $1.0 million, and corresponding liabilities of $1.6 million and $1.6 million, at December 25, 2010 and December 26, 2009, respectively, are included in other assets, and other long-term liabilities, in the accompanying consolidated balance sheets.
(17) Related-party transactions
(a) Sponsors
The Company is charged an annual management fee by the Sponsors of $1.0 million per Sponsor, payable in quarterly installments. The Company recognized $3.0 million of expense per year during fiscal years 2010, 2009, and 2008 related to Sponsor management fees, which is included in general and administrative expenses, net in the consolidated statements of operations. At December 25, 2010 and December 26, 2009, the Company had $500 thousand of prepaid management fees to the Sponsors, which were recorded in prepaid expenses and other current assets in the consolidated balance sheets.
At December 25, 2010, certain affiliates of the Sponsors held $70.6 million of term loans, net of original issue discount, issued under the Company’s senior credit facility. The terms of these loans are identical to all other term loans issued to lenders in the senior credit facility.
Our Sponsors have a controlling interest in our Company as well as several other entities. The existence of such common ownership and management control within business and other transactions could result in differences within our operating results or financial position than if the entities were autonomous. There have been no significant transactions with companies under common control during the periods presented.
In March 2006, we entered into an investor agreement with the Sponsors and also entered into a registration rights and coordination agreement with certain shareholders, including the Sponsors. Pursuant to these agreements, subject to certain exceptions and conditions, our Sponsors may require us to register their shares of common stock under the Securities Act, and they will have the right to participate in certain future registrations of securities by us.
| F-49 | (Continued) |
Table of Contents
Dunkin’ Brands Group, Inc. and subsidiaries
Notes to consolidated financial statements—(continued)
December 25, 2010 and December 26, 2009
(b) Joint ventures
The Company received royalties from its joint ventures as follows (in thousands):
| Fiscal year ended | ||||||||||||
| December 25, 2010 |
December 26, 2009 |
December 27, 2008 |
||||||||||
| BR Japan |
$ | 2,110 | 1,786 | 1,387 | ||||||||
| BR Korea |
2,990 | 2,637 | 2,471 | |||||||||
| $ | 5,100 | 4,423 | 3,858 | |||||||||
The Company made payments to BR Korea and BR Japan totaling approximately $1.5 million, $409 thousand, and $221 thousand in fiscal years 2010, 2009, and 2008, respectively, primarily for the purchase of ice cream products.
(18) Allowance for Doubtful Accounts
The changes in the allowance for doubtful accounts were as follows (in thousands):
| Accounts Receivable |
Notes and Other Receivable |
|||||||
| Balance at December 29, 2007 |
$ | 2,215 | 302 | |||||
| Provision for doubtful accounts, net |
4,682 | 1,209 | ||||||
| Write-offs and other |
(1,520 | ) | (1,257 | ) | ||||
| Balance at December 27, 2008 |
5,377 | 254 | ||||||
| Provision for doubtful accounts, net |
3,792 | 3,571 | ||||||
| Write-offs and other |
(3,401 | ) | (2,480 | ) | ||||
| Balance at December 26, 2009 |
5,768 | 1,345 | ||||||
| Provision for doubtful accounts, net |
13 | 1,492 | ||||||
| Write-offs and other |
(263 | ) | (394 | ) | ||||
| Balance at December 25, 2010 |
$ | 5,518 | 2,443 | |||||
(19) Subsequent event
On February 18, 2011, the Company completed a re-pricing of its senior credit facility, as well as increased the size of the term loans from $1.25 billion to $1.40 billion. The incremental proceeds of the term loans were used to repay $150.0 million of the Company’s Senior Notes. As a result of this transaction, the Company recorded a loss on debt extinguishment and refinancing transaction in the first quarter of 2011 of $11.0 million, including partial write-offs of original issue discounts and deferred financing costs, as well as related transaction costs.
Term loan borrowings under the amended senior credit facility bear interest at a rate per annum equal to, at our option, either a base rate or a Eurodollar rate. The base rate is equal to an applicable rate of 2.00% plus the highest of (a) the Federal Funds rate plus 0.50%, (b) a prime rate, (c) one-month LIBOR rate plus 1.00%, and (d) 2.25%. The Eurodollar rate is equal to an applicable rate of 3.00% plus the higher of (a) a LIBOR rate and (b) 1.25%. The interest rate on the revolving credit facility remained unchanged. Repayments are required to be made on term loan borrowings equal to $14.0 million per calendar year, payable in quarterly installments through September 2017.
| F-50 |
Table of Contents
Dunkin’ Brands Group, Inc. and subsidiaries
Consolidated balance sheets
(In thousands)
(Unaudited)
| March 26, 2011 |
December 25, 2010 |
|||||||
| Assets | ||||||||
| Current assets: |
||||||||
| Cash and cash equivalents |
$ | 120,508 | 134,100 | |||||
| Accounts receivable, net of allowance for doubtful accounts of $5,170 and $5,518 as of March 26, 2011 and December 25, 2010, respectively |
38,141 | 35,239 | ||||||
| Notes and other receivables, net of allowance for doubtful accounts of $3,237 and $2,443 as of March 26, 2011 and December 25, 2010, respectively |
9,780 | 44,704 | ||||||
| Assets held for sale |
1,473 | 4,328 | ||||||
| Deferred income taxes, net |
12,613 | 12,570 | ||||||
| Restricted assets of advertising funds |
32,787 | 25,113 | ||||||
| Prepaid income taxes |
11,767 | 7,641 | ||||||
| Prepaid expenses and other current assets |
21,111 | 20,682 | ||||||
| Total current assets |
248,180 | 284,377 | ||||||
| Property and equipment, net of accumulated depreciation of $95,024 and $90,663 as of March 26, 2011 and December 25, 2010, respectively |
189,693 | 193,273 | ||||||
| Investments in joint ventures |
175,107 | 169,276 | ||||||
| Goodwill |
888,675 | 888,655 | ||||||
| Other intangible assets, net |
1,528,752 | 1,535,657 | ||||||
| Restricted cash |
342 | 404 | ||||||
| Other assets |
84,428 | 75,646 | ||||||
| Total assets |
$ | 3,115,177 | 3,147,288 | |||||
| Liabilities, Common Stock, and Stockholders’ Equity (Deficit) |
||||||||
| Current liabilities: |
||||||||
| Current portion of long-term debt |
$ | 14,000 | 12,500 | |||||
| Capital lease obligations |
212 | 205 | ||||||
| Accounts payable |
9,478 | 9,822 | ||||||
| Liabilities of advertising funds |
48,965 | 48,213 | ||||||
| Deferred income |
24,492 | 26,221 | ||||||
| Other current liabilities |
142,247 | 183,594 | ||||||
| Total current liabilities |
239,394 | 280,555 | ||||||
| Long-term debt, net |
1,848,218 | 1,847,016 | ||||||
| Capital lease obligations |
5,104 | 5,160 | ||||||
| Unfavorable operating leases acquired |
23,866 | 24,744 | ||||||
| Deferred income |
21,543 | 21,326 | ||||||
| Deferred income taxes, net |
587,124 | 586,337 | ||||||
| Other long-term liabilities |
77,111 | 75,909 | ||||||
| Total long-term liabilities |
2,562,966 | 2,560,492 | ||||||
| Commitments and contingencies (note 12) |
||||||||
| Common stock, Class L, $0.001 par value; 100,000,000 shares authorized; 23,060,006 and 22,994,523 shares issued and outstanding at March 26, 2011 and December 25, 2010, respectively |
862,184 | 840,582 | ||||||
| Stockholders’ equity (deficit): |
||||||||
| Common stock, Class A, $0.001 par value; 400,000,000 shares authorized; 196,627,001 and 196,146,998 shares issued and outstanding at March 26, 2011 and December 25, 2010, respectively |
192 | 191 | ||||||
| Additional paid-in capital |
196,245 | 195,063 | ||||||
| Treasury stock, at cost |
(1,919 | ) | (1,807 | ) | ||||
| Accumulated deficit |
(762,469 | ) | (741,415 | ) | ||||
| Accumulated other comprehensive income |
18,584 | 13,627 | ||||||
| Total stockholders’ equity (deficit) |
(549,367 | ) | (534,341 | ) | ||||
| Total liabilities, common stock, and stockholders’ equity (deficit) |
$ | 3,115,177 | 3,147,288 | |||||
See accompanying notes to unaudited consolidated financial statements.
F-51
Table of Contents
Dunkin’ Brands Group, Inc. and subsidiaries
Consolidated statements of operations
(In thousands)
(Unaudited)
| Three months ended | ||||||||
| March 26, 2011 |
March 27, 2010 |
|||||||
| (As adjusted) | ||||||||
| Revenues: |
||||||||
| Franchise fees and royalty income |
$ | 85,959 | 80,165 | |||||
| Rental income |
22,131 | 22,116 | ||||||
| Sales of ice cream products |
22,716 | 17,793 | ||||||
| Other revenues |
8,407 | 7,338 | ||||||
| Total revenues |
139,213 | 127,412 | ||||||
| Operating costs and expenses: |
||||||||
| Occupancy expenses—franchised restaurants |
12,288 | 14,156 | ||||||
| Cost of ice cream products |
15,124 | 12,222 | ||||||
| General and administrative expenses, net |
53,886 | 51,245 | ||||||
| Depreciation and amortization |
13,208 | 15,332 | ||||||
| Impairment charges |
653 | 1,414 | ||||||
| Total operating costs and expenses |
95,159 | 94,369 | ||||||
| Equity in net income of joint ventures |
782 | 3,642 | ||||||
| Operating income |
44,836 | 36,685 | ||||||
| Other income (expense): |
||||||||
| Interest income |
115 | 71 | ||||||
| Interest expense |
(33,882 | ) | (27,591 | ) | ||||
| Loss on debt extinguishment and refinancing transaction |
(11,007 | ) | — | |||||
| Other gains, net |
476 | 245 | ||||||
| Total other expense |
(44,298 | ) | (27,275 | ) | ||||
| Income before income taxes |
538 | 9,410 | ||||||
| Provision for income taxes |
2,261 | 3,472 | ||||||
| Net income (loss) |
$ | (1,723 | ) | 5,938 | ||||
| Earnings (loss) per share: |
||||||||
| Class L—basic and diluted |
$ | 0.85 | 1.21 | |||||
| Class A—basic and diluted |
$ | (0.11 | ) | (0.12 | ) | |||
See accompanying notes to unaudited consolidated financial statements.
F-52
Table of Contents
Dunkin’ Brands Group, Inc. and subsidiaries
Consolidated statements of cash flows
(In thousands)
(Unaudited)
| Three months ended | ||||||||
| March 26, 2011 |
March 27, 2010 |
|||||||
| (As adjusted) | ||||||||
| Cash flows from operating activities: |
||||||||
| Net income (loss) |
$ | (1,723 | ) | 5,938 | ||||
| Adjustments to reconcile net income (loss) to net cash provided by operating activities: |
||||||||
| Depreciation and amortization |
13,208 | 15,332 | ||||||
| Amortization of deferred financing costs and original issue discount |
1,582 | 1,797 | ||||||
| Loss on debt extinguishment and refinancing transaction |
11,007 | — | ||||||
| Impact of unfavorable operating leases acquired |
(852 | ) | (972 | ) | ||||
| Deferred income taxes |
726 | (1,887 | ) | |||||
| Impairment charges |
653 | 1,414 | ||||||
| Provision for bad debt |
602 | 1,183 | ||||||
| Share-based compensation expense |
241 | 612 | ||||||
| Equity in net income of joint ventures |
(782 | ) | (3,642 | ) | ||||
| Other, net |
(118 | ) | 5 | |||||
| Change in operating assets and liabilities: |
||||||||
| Restricted cash |
— | 22,661 | ||||||
| Accounts, notes, and other receivables, net |
31,480 | 25,594 | ||||||
| Other current assets |
2,679 | 1,430 | ||||||
| Accounts payable |
381 | (3,169 | ) | |||||
| Other current liabilities |
(41,696 | ) | (41,117 | ) | ||||
| Restricted liabilities of advertising funds, net |
(6,926 | ) | (3,783 | ) | ||||
| Income taxes payable, net |
(3,819 | ) | 4,447 | |||||
| Deferred income |
(1,520 | ) | (1,737 | ) | ||||
| Other, net |
(1,529 | ) | 487 | |||||
| Net cash provided by operating activities |
3,594 | 24,593 | ||||||
| Cash flows from investing activities: |
||||||||
| Additions to property and equipment |
(3,734 | ) | (3,465 | ) | ||||
| Other, net |
301 | — | ||||||
| Net cash used in investing activities |
(3,433 | ) | (3,465 | ) | ||||
| Cash flows from financing activities: |
||||||||
| Proceeds from issuance of long-term debt |
150,000 | — | ||||||
| Repayment of long-term debt |
(150,750 | ) | — | |||||
| Proceeds from short-term debt |
— | 34,564 | ||||||
| Proceeds from issuance of common stock |
3,213 | — | ||||||
| Repurchases of common stock |
(112 | ) | (2,959 | ) | ||||
| Payments on capital lease obligations |
(49 | ) | (54 | ) | ||||
| Deferred financing and other debt-related costs |
(16,209 | ) | — | |||||
| Change in restricted cash |
73 | 420 | ||||||
| Net cash provided by (used in) financing activities |
(13,834 | ) | 31,971 | |||||
| Effect of exchange rate changes on cash |
81 | 9 | ||||||
| Increase (decrease) in cash and cash equivalents |
(13,592 | ) | 53,108 | |||||
| Cash and cash equivalents, beginning of period |
134,100 | 53,210 | ||||||
| Cash and cash equivalents, end of period |
$ | 120,508 | 106,318 | |||||
| Supplemental cash flow information: |
||||||||
| Cash paid for: |
||||||||
| Income taxes |
$ | 5,303 | 899 | |||||
| Interest |
20,827 | 25,467 | ||||||
| Noncash investing activity: |
||||||||
| Property and equipment included in accounts payable and accrued expenses |
1,130 | 842 | ||||||
See accompanying notes to unaudited consolidated financial statements.
F-53
Table of Contents
Dunkin’ Brands Group, Inc. and subsidiaries
Notes to Consolidated Financial Statements
March 26, 2011 and March 27, 2010
(Unaudited)
(1) Description of Business and Organization
Dunkin’ Brands Group, Inc. (DBGI) and subsidiaries (collectively, the Company), through its brand companies, is one of the world’s largest franchisors of restaurants serving coffee and baked goods as well as ice cream within the quick service restaurant segment of the restaurant industry. We develop, franchise, and license a system of both traditional and nontraditional quick service restaurants and, in limited circumstances, own and operate individual locations. Through our Dunkin’ Donuts brand, we develop and franchise restaurants featuring coffee, donuts, bagels, and related products. Through our Baskin-Robbins brand, we develop and franchise restaurants featuring ice cream, frozen beverages, and related products. Additionally, our subsidiaries located in Canada and the United Kingdom manufacture and/or distribute Baskin-Robbins ice cream products to Baskin-Robbins franchisees and licensees in various international markets.
DBGI is owned by funds controlled by Bain Capital Partners, LLC, The Carlyle Group, and Thomas H. Lee Partners, L.P. (collectively, the Sponsors or BCT).
Throughout these financial statements, “the Company,” “we,” “us,” “our,” and “management” refer to DBGI and subsidiaries taken as a whole.
(2) Summary of Significant Accounting Policies
(a) Unaudited Financial Statements
The consolidated balance sheet as of March 26, 2011 and the consolidated statements of operations and cash flows for the three months ended March 26, 2011 and March 27, 2010 are unaudited.
The accompanying consolidated financial statements include the accounts of DBGI and subsidiaries and have been prepared in accordance with accounting principles generally accepted in the United States of America (U.S. GAAP). All significant transactions and balances between subsidiaries and affiliates have been eliminated in consolidation. In the opinion of management, all adjustments necessary for a fair presentation of such financial statements in accordance with U.S. GAAP have been recorded. Such adjustments consisted only of normal recurring items. The accompanying consolidated financial statements should be read in conjunction with the Company’s most recently issued consolidated financial statements as of and for the fiscal year ended December 25, 2010.
(b) Fiscal Year
The Company operates and reports financial information on a 52 or 53-week year on a 13-week quarter basis with the fiscal year ending on the last Saturday in December and fiscal quarters ending on the 13th Saturday of each quarter. The data periods contained within our three months ended March 26, 2011 and March 27, 2010 reflect the results of operations for the 13-week periods ending on those dates. Operating results for the three months ended March 26, 2011 are not necessarily indicative of the results that may be expected for the fiscal year ending December 31, 2011.
| F-54 | (Continued) |
Table of Contents
Dunkin’ Brands Group, Inc. and subsidiaries
Notes to Consolidated Financial Statements—(continued)
March 26, 2011 and March 27, 2010
(Unaudited)
(c) Accounting Estimates
The preparation of consolidated financial statements in conformity with U.S. GAAP requires the use of estimates, judgments, and assumptions that affect the reported amounts of assets, liabilities, revenues, expenses, and related disclosure of contingent assets and liabilities at the date of the financial statements and for the period then ended.
(d) Fair Value of Financial Instruments
The carrying amounts of accounts receivable, notes and other receivables, assets and liabilities related to the advertising funds, accounts payable, other payables, and accrued expenses approximate fair value because of their short-term nature. For long-term receivables, we review the creditworthiness of the counterparty on a quarterly basis, and adjust the carrying value as necessary. We believe the carrying value of long-term receivables of $5.6 million and $4.8 million as of March 26, 2011 and December 25, 2010, respectively, approximates fair value.
Financial assets and liabilities are categorized, based on the inputs to the valuation technique, into a three-level fair value hierarchy. The fair value hierarchy gives the highest priority to the quoted prices in active markets for identical assets and liabilities and lowest priority to unobservable inputs. Observable market data, when available, is required to be used in making fair value measurements. When inputs used to measure fair value fall within different levels of the hierarchy, the level within which the fair value measurement is categorized is based on the lowest level input that is significant to the fair value measurement.
Financial assets and liabilities measured at fair value on a recurring basis as of March 26, 2011 are summarized as follows (in thousands):
| Quoted prices in active markets for identical assets (Level 1) |
Significant other observable inputs (Level 2) |
|||||||
| Assets: |
||||||||
| Mutual funds |
$ | 3,030 | ||||||
| Total assets |
$ | 3,030 | — | |||||
| Liabilities: |
||||||||
| Deferred compensation liabilities |
$ | 7,764 | ||||||
| Total liabilities |
$ | — | 7,764 | |||||
The mutual funds and deferred compensation liabilities primarily relate to the Dunkin’ Brands, Inc. Non-Qualified Deferred Compensation Plan (DCP Plan), which allows for pre-tax salary deferrals for certain qualifying employees. Changes in the fair value of the deferred compensation liabilities are derived using quoted prices in active markets of the asset selections made by the participants. The deferred compensation liabilities are classified within Level 2, as defined under U.S. GAAP, because their inputs are derived principally
| F-55 | (Continued) |
Table of Contents
Dunkin’ Brands Group, Inc. and subsidiaries
Notes to Consolidated Financial Statements—(continued)
March 26, 2011 and March 27, 2010
(Unaudited)
from observable market data by correlation to the hypothetical investments. The Company holds mutual funds, as well as money market funds, to partially offset the Company’s liabilities under the DCP Plan as well as other benefit plans. The changes in the fair value of the mutual funds are derived using quoted prices in active markets for the specific funds. As such, the mutual funds are classified within Level 1, as defined under U.S. GAAP.
The carrying value and fair value of long-term debt were as follows (in thousands):
| March 26, 2011 | ||||||||
| Financial liabilities | Carrying value |
Fair value | ||||||
| Term B-1 Loans |
$ | 1,394,146 | 1,403,500 | |||||
| Senior Notes |
468,072 | 484,500 | ||||||
| $ | 1,862,218 | 1,888,000 | ||||||
The fair values of our Term B-1 Loans and Senior Notes are estimated based on bid and offer prices for the same or similar instruments. Considerable judgment is required to develop these estimates.
(e) Concentration of Credit Risk
The Company is subject to credit risk through its accounts receivable consisting primarily of amounts due from franchisees and licensees for franchise fees and royalty income. In addition, we have note and lease receivables from certain of our franchisees and licensees. The financial condition of these franchisees and licensees is largely dependent upon the underlying business trends of our brands and market conditions within the quick service restaurant industry. This concentration of credit risk is mitigated, in part, by the large number of franchisees and licensees of each brand and the short-term nature of the franchise and license fee and lease receivables. No individual franchisee or master licensee accounts for more than 10% of total revenues or accounts and notes receivable.
| F-56 | (Continued) |
Table of Contents
Dunkin’ Brands Group, Inc. and subsidiaries
Notes to Consolidated Financial Statements—(continued)
March 26, 2011 and March 27, 2010
(Unaudited)
(f) Earnings per Share
The computation of basic and diluted earnings per common share is as follows (in thousands, except share and per share amounts):
| Three months ended | ||||||||
| March 26, 2011 |
March 27, 2010 |
|||||||
| Net income (loss)—basic and diluted |
$ | (1,723 | ) | 5,938 | ||||
| Allocation of net income (loss) to common stockholders—basic and diluted: |
||||||||
| Class L |
19,331 | 27,657 | ||||||
| Class A |
(21,054 | ) | (21,719 | ) | ||||
| Weighted average number of common shares—basic and diluted: |
||||||||
| Class L |
22,817,115 | 22,821,102 | ||||||
| Class A |
188,979,719 | 188,224,884 | ||||||
| Earnings (loss) per common share—basic and diluted: |
||||||||
| Class L |
0.85 | 1.21 | ||||||
| Class A |
(0.11 | ) | (0.12 | ) | ||||
The weighted average number of common shares in the Class A diluted earnings per share calculation excludes all restricted stock and stock options outstanding during the respective periods, as they would be antidilutive. As of March 26, 2011, there were 4,407,689 unvested Class A restricted stock awards and 24,959,750 options to purchase Class A common stock outstanding that may be dilutive in the future. Of those amounts, there were 4,323,689 Class A restricted stock awards and 16,275,000 options to purchase Class A common stock that were performance-based and for which the performance criteria have not yet been met. There were no Class L common stock equivalents outstanding during the three months ended March 26, 2011 or March 27, 2010.
(g) Recent Accounting Pronouncements
In December 2010, the Financial Accounting Standards Board (FASB) issued new guidance to amend the criteria for performing the second step of the goodwill impairment test for reporting units with zero or negative carrying amounts and requires performing the second step if qualitative factors indicate that it is more likely than not that a goodwill impairment exists. This new guidance is effective for the Company beginning in fiscal year 2011. We do not expect the adoption of this guidance to have a material impact on our goodwill assessment or our consolidated financial statements.
| F-57 | (Continued) |
Table of Contents
Dunkin’ Brands Group, Inc. and subsidiaries
Notes to Consolidated Financial Statements—(continued)
March 26, 2011 and March 27, 2010
(Unaudited)
In January 2010, the FASB issued new guidance and clarifications for improving disclosures about fair value measurements. This guidance requires enhanced disclosures regarding transfers in and out of the levels within the fair value hierarchy. Separate disclosures are required for transfers in and out of Levels 1 and 2 fair value measurements, and the reasons for the transfers must be disclosed. In the reconciliation for Level 3 fair value measurements, separate disclosures are required for purchases, sales, issuances, and settlements on a gross basis. The new disclosures and clarifications of existing disclosures were effective for the Company in fiscal year 2010, except for the disclosures about purchases, sales, issuances, and settlements in the roll forward of activity in Level 3 fair value measurements, which were effective for the Company in fiscal year 2011. The adoption of this guidance did not have any impact on our financial position or results of operations, as it only relates to disclosures.
(h) Reclassifications
The Company has revised the presentation of certain captions within the consolidated statements of operations and cash flows to provide a more concise presentation. Additionally, the Company reclassified equity in net income of joint ventures within the consolidated statements of operations from other income (expense) to operating income, as these investments in joint ventures represent our business model for operating our brands in Japan and Korea and are our primary source of income generation from restaurants operating in these markets. Prior period financial statements have been revised to conform to the current period presentation. The revisions to the presentation of the consolidated statements of operations resulted in an increase in operating income and a corresponding increase in other expenses of $3.6 million for the three months ended March 26, 2010. The revisions had no impact on total revenues, income before income taxes, or net income. The revisions to the consolidated statements of cash flows had no impact on net cash provided by (used in) operating, investing, or financing activities.
(i) Subsequent Events
Subsequent events have been evaluated through the date these consolidated financial statements were filed.
| F-58 | (Continued) |
Table of Contents
Dunkin’ Brands Group, Inc. and subsidiaries
Notes to Consolidated Financial Statements—(continued)
March 26, 2011 and March 27, 2010
(Unaudited)
(3) Change in Accounting for Contingent Rental Income
In fiscal year 2010, we elected to change our method of accounting for contingent rental income to comply with the guidance prescribed by the Securities and Exchange Commission. This change in accounting principle has been applied retrospectively to the prior period presented. The following financial statement line items for the three months ended March 27, 2010 were impacted by this accounting change (in thousands):
| March 27, 2010 | ||||||||
| As originally reported |
As adjusted |
|||||||
| Rental income |
$ | 22,287 | 22,116 | |||||
| Total revenues |
127,583 | 127,412 | ||||||
| Operating income |
36,856 | 36,685 | ||||||
| Income before income taxes |
9,581 | 9,410 | ||||||
| Provision for income taxes |
3,532 | 3,472 | ||||||
(4) Franchise Fees and Royalty Income
Franchise fees and royalty income consisted of the following (in thousands):
| Three months ended | ||||||||
| March 26, 2011 |
March 27, 2010 |
|||||||
| Royalty income |
$ | 79,355 | 75,147 | |||||
| Initial franchise fees, including renewal income |
6,604 | 5,018 | ||||||
| Total franchise fees and royalty income |
$ | 85,959 | 80,165 | |||||
The changes in franchised and company-owned points of distribution were as follows:
| Three months ended | ||||||||
| Systemwide Points of Distribution | March 26, 2011 |
March 27, 2010 |
||||||
| Franchised points of distribution—beginning of period |
16,166 | 15,377 | ||||||
| Franchises opened |
280 | 323 | ||||||
| Franchises closed |
(187 | ) | (209 | ) | ||||
| Net transfers from company-owned points of distribution |
11 | — | ||||||
| Franchised points of distribution in operation—end of period |
16,270 | 15,491 | ||||||
| Company-owned points of distribution |
17 | 15 | ||||||
| Total systemwide points of distribution—end of period |
16,287 | 15,506 | ||||||
| F-59 | (Continued) |
Table of Contents
Dunkin’ Brands Group, Inc. and subsidiaries
Notes to Consolidated Financial Statements—(continued)
March 26, 2011 and March 27, 2010
(Unaudited)
(5) Goodwill and Other Intangible Assets
The changes in the gross carrying amount of goodwill from December 25, 2010 to March 26, 2011 are due to the impact of foreign currency fluctuations.
Other intangible assets at March 26, 2011 consisted of the following (in thousands):
| Weighted average amortization period (years) |
Gross carrying amount |
Accumulated amortization |
Net carrying amount |
|||||||||||||
| Definite-lived intangibles: |
||||||||||||||||
| Franchise rights |
20 | $383,942 | (103,946 | ) | 279,996 | |||||||||||
| Favorable operating leases acquired |
13 | 90,101 | (35,391 | ) | 54,710 | |||||||||||
| License rights |
6 | 6,230 | (3,154 | ) | 3,076 | |||||||||||
| Indefinite-lived intangible: |
||||||||||||||||
| Trade names |
N/A | 1,190,970 | — | 1,190,970 | ||||||||||||
| $ | 1,671,243 | (142,491 | ) | 1,528,752 | ||||||||||||
Other intangible assets at December 25, 2010 consisted of the following (in thousands):
| Weighted average amortization period (years) |
Gross carrying amount |
Accumulated amortization |
Net carrying amount |
|||||||||||||
| Definite lived intangibles: |
||||||||||||||||
| Franchise rights |
20 | $ | 385,309 | (100,296 | ) | 285,013 | ||||||||||
| Favorable operating leases acquired |
13 | 90,406 | (33,965 | ) | 56,441 | |||||||||||
| License rights |
10 | 6,230 | (2,997 | ) | 3,233 | |||||||||||
| Indefinite lived intangible: |
||||||||||||||||
| Trade names |
N/A | 1,190,970 | — | 1,190,970 | ||||||||||||
| $ | 1,672,915 | (137,258 | ) | 1,535,657 | ||||||||||||
The changes in the gross carrying amount of other intangible assets from December 25, 2010 to March 26, 2011 are due to the impact of foreign currency fluctuations and the impairment of favorable operating leases acquired resulting from lease terminations. Impairment of favorable operating leases acquired totaled $12 thousand and $700 thousand for the three months ended March 26, 2011 and March 27, 2010, respectively, and is included within impairment charges in the consolidated statements of operations.
| F-60 | (Continued) |
Table of Contents
Dunkin’ Brands Group, Inc. and subsidiaries
Notes to Consolidated Financial Statements—(continued)
March 26, 2011 and March 27, 2010
(Unaudited)
Total estimated amortization expense for fiscal years ending December 2011 through 2015 is presented below (in thousands). The amount reflected below for the fiscal year ending December 2011 includes year-to-date amortization.
| Fiscal year: | ||||
| 2011 |
$ | 28,012 | ||
| 2012 |
26,943 | |||
| 2013 |
26,350 | |||
| 2014 |
25,806 | |||
| 2015 |
25,450 | |||
The impact of our unfavorable leases acquired resulted in an increase in rental income and a decrease in rental expense as follows (in thousands):
| Three months ended | ||||||||
| March 26, 2011 |
March 27, 2010 |
|||||||
| Increase in rental income |
$ | 374 | 461 | |||||
| Decrease in rental expense |
478 | 511 | ||||||
| Total increase in operating income |
$ | 852 | 972 | |||||
(6) Debt
On February 18, 2011, the Company completed a re-pricing of its term loans under the senior credit facility, as well as increased the size of the term loans from $1.25 billion to $1.40 billion. The incremental proceeds of the term loans were used to repay $150.0 million of the Company’s Senior Notes.
As a result of the re-pricing of the term loans, the Company recorded a loss on debt extinguishment and refinancing transaction of $4.4 million, which includes a debt extinguishment of $465 thousand related to the write-off of original issuance discount and deferred financing costs, and $3.9 million of costs related to the refinancing, including a prepayment premium and fees paid to third-party creditors. In conjunction with the repurchase of Senior Notes, the Company recorded a loss on debt extinguishment of $6.6 million, which includes the write-off of original issuance discount and deferred financing costs totaling $5.8 million, as well as a prepayment premium and third-party costs of $758 thousand.
Term loan borrowings under the amended senior credit facility bear interest at a rate per annum equal to, at our option, either a base rate or a Eurodollar rate. The base rate is equal to an applicable rate of 2.00% plus the highest of (a) the Federal Funds rate plus 0.50%, (b) a prime rate, (c) one-month LIBOR rate plus 1.00%, and (d) 2.25%. The Eurodollar rate is equal to an applicable rate of 3.00% plus the higher of (a) a LIBOR rate and (b) 1.25%. The interest rate on the revolving credit facility remained unchanged. Repayments are required to be made on term loan borrowings equal to $14.0 million per calendar year, payable in quarterly installments through September 2017.
| F-61 | (Continued) |
Table of Contents
Dunkin’ Brands Group, Inc. and subsidiaries
Notes to Consolidated Financial Statements—(continued)
March 26, 2011 and March 27, 2010
(Unaudited)
(7) Other Current Liabilities
Other current liabilities consisted of the following (in thousands):
| March 26, 2011 |
December 25, 2010 |
|||||||
| Gift card/certificate liability |
$ | 80,898 | 123,078 | |||||
| Accrued salary and benefits |
16,173 | 21,307 | ||||||
| Accrued professional and legal costs |
9,257 | 9,839 | ||||||
| Accrued interest |
17,292 | 6,129 | ||||||
| Other |
18,627 | 23,241 | ||||||
| Total other current liabilities |
$ | 142,247 | 183,594 | |||||
(8) Comprehensive Income
Comprehensive income for the three months ended March 26, 2011 and March 27, 2010 consisted of the following (in thousands):
| Three months ended | ||||||||
| March 26, 2011 |
March 27, 2010 |
|||||||
| Net income (loss) |
$ | (1,723 | ) | 5,938 | ||||
| Effect of foreign currency translation |
5,033 | 2,148 | ||||||
| Other |
(76 | ) | 81 | |||||
| Total comprehensive income |
$ | 3,234 | 8,167 | |||||
The components of accumulated other comprehensive income were as follows (in thousands):
| March 26, 2011 |
December 25, 2010 |
|||||||
| Effect of foreign currency translation |
$ | 19,383 | 14,350 | |||||
| Other |
(799 | ) | (723 | ) | ||||
| Total accumulated other comprehensive income |
$ | 18,584 | 13,627 | |||||
(9) Segment Information
The Company is strategically aligned into two global brands, Dunkin’ Donuts and Baskin-Robbins, which are further segregated between U.S. operations and international operations. As such, the Company has determined that it has four operating segments, which are its reportable segments: Dunkin’ Donuts U.S., Dunkin’ Donuts International, Baskin-Robbins U.S., and Baskin-Robbins International. Dunkin’ Donuts U.S., Baskin-Robbins U.S., and Dunkin’ Donuts International primarily derive their revenues through royalty income, franchise fees, and rental income. Baskin-Robbins U.S. also derives revenue through license fees from a third-party license agreement. Baskin-Robbins International primarily derives its revenues from the
| F-62 | (Continued) |
Table of Contents
Dunkin’ Brands Group, Inc. and subsidiaries
Notes to Consolidated Financial Statements—(continued)
March 26, 2011 and March 27, 2010
(Unaudited)
manufacturing and sales of ice cream products, as well as royalty income, franchise fees, and license fees. The operating results of each segment are regularly reviewed and evaluated separately by the Company’s senior management, which includes, but is not limited to, the chief executive officer, the chief financial officer, and worldwide brand officers. Senior management primarily evaluates the performance of its segments and allocates resources to them based on earnings before interest, taxes, depreciation, amortization, impairment charges, foreign currency gains and losses, other gains, and unallocated corporate charges referred to as segment profit. When senior management reviews a balance sheet, it is at a consolidated level. The accounting policies applicable to each segment are consistent with those used in the consolidated financial statements.
Revenues for Dunkin’ Donuts U.S. include royalties and rental income earned from company-owned restaurants. Revenues for all other segments include only transactions with unaffiliated customers and include no intersegment revenues. Revenues reported as “Other” include retail sales for company-owned restaurants, as well as revenue earned through arrangements with third parties in which our brand names are used and revenue generated from online training programs for franchisees that are not allocated to a specific segment. Revenues by segment were as follows (in thousands):
| Revenues | ||||||||
| Three months ended | ||||||||
| March 26, 2011 |
March 27, 2010 |
|||||||
| (As adjusted) | ||||||||
| Dunkin’ Donuts U.S. |
$ | 96,512 | 91,403 | |||||
| Dunkin’ Donuts International |
3,869 | 3,321 | ||||||
| Baskin-Robbins U.S. |
9,045 | 9,032 | ||||||
| Baskin-Robbins International |
24,662 | 19,043 | ||||||
| Total reportable segment revenues |
134,088 | 122,799 | ||||||
| Other |
5,412 | 4,837 | ||||||
| Elimination of company-owned restaurants’ royalties and rental income |
(287 | ) | (224 | ) | ||||
| Total revenues |
$ | 139,213 | 127,412 | |||||
| F-63 | (Continued) |
Table of Contents
DUNKIN’ BRANDS GROUP, INC. AND SUBSIDIARIES
Notes to Consolidated Financial Statements—(continued)
March 26, 2011 and March 27, 2010
(Unaudited)
For purposes of evaluating segment profit, Dunkin’ Donuts U.S. includes the net operating income earned from company-owned restaurants. Expenses included in “Corporate and other” in the segment profit table below include corporate overhead costs, such as payroll and related benefit costs and professional services. Segment profit by segment was as follows (in thousands):
| Segment profit | ||||||||
| Three months ended | ||||||||
| March 26, 2011 |
March 27, 2010 |
|||||||
| (As adjusted) | ||||||||
| Dunkin’ Donuts U.S. |
$ | 70,707 | 63,563 | |||||
| Dunkin’ Donuts International |
3,181 | 3,712 | ||||||
| Baskin-Robbins U.S. |
4,300 | 5,224 | ||||||
| Baskin-Robbins International |
8,164 | 8,527 | ||||||
| Total reportable segment profit |
86,352 | 81,026 | ||||||
| Corporate and other |
(27,655 | ) | (27,595 | ) | ||||
| Interest expense, net |
(33,767 | ) | (27,520 | ) | ||||
| Depreciation and amortization |
(13,208 | ) | (15,332 | ) | ||||
| Impairment charges |
(653 | ) | (1,414 | ) | ||||
| Loss on debt extinguishment and refinancing transaction |
(11,007 | ) | — | |||||
| Other gains, net |
476 | 245 | ||||||
| Income before income taxes |
$ | 538 | 9,410 | |||||
Equity in net income of joint ventures is included in segment profit for the Dunkin’ Donuts International and Baskin-Robbins International reportable segments. Equity in net income of joint ventures by reportable segment was as follows (in thousands):
| Three months ended | ||||||||
| March 26, 2011 |
March 27, 2010 |
|||||||
| Dunkin’ Donuts International |
$ | 388 | 1,136 | |||||
| Baskin-Robbins International |
394 | 2,506 | ||||||
| Total equity in net income of joint ventures |
$ | 782 | 3,642 | |||||
(10) Stockholders’ Equity
(a) Treasury Stock
During the three months ended March 26, 2011, the Company repurchased a total of 69,720 shares of Class A common stock that was originally sold and/or granted to former employees of the Company. There were no repurchases of Class L common stock during the three months ended March 26, 2011. The Company accounts for treasury stock under the cost method, and as such recorded $112 thousand in treasury stock during the three months ended March 26, 2011 based on the cost of the shares on the respective dates of repurchase.
| F-64 | (Continued) |
Table of Contents
Dunkin’ Brands Group, Inc. and subsidiaries
Notes to Consolidated Financial Statements—(continued)
March 26, 2011 and March 27, 2010
(Unaudited)
(b) Equity Incentive Plans
The Company’s 2006 Executive Incentive Plan, as amended, (the 2006 Plan) provides for the grant of stock-based and other incentive awards. A maximum of 55,689,151 shares of Class A common stock may be delivered in satisfaction of awards under the 2006 Plan, of which a maximum of 22,899,228 shares may be awarded as nonvested (restricted) shares and a maximum of 32,789,923 may be delivered in satisfaction of stock options.
During the three months ended March 26, 2011, the Company granted the following stock-based awards:
| Grant Date | Type of award | Number of awards granted |
Option exercise price |
Fair value of common stock |
||||||||||||
| 3/9/2011 |
Executive options | 2,910,000 | $ | 1.60 | $ | 1.60 | ||||||||||
| 3/9/2011 |
Nonexecutive options | 100,000 | $ | 1.60 | $ | 1.60 | ||||||||||
The executive stock options vest in two separate tranches, which have been designated as Tranche 4 and Tranche 5. Tranche 4 options vest in equal annual amounts over a five-year period subsequent to the grant date. Tranche 5 options vest based on continued service over a five-year period and achievement of specified investor returns upon a sale, distribution, or dividend. Both Tranche 4 and Tranche 5 options provide for partial accelerated vesting upon change in control. The nonexecutive stock options vest in equal annual amounts over a five-year period subsequent to the grant date, and also fully vest upon a change of control. The maximum contractual term of both executive and nonexecutive options is ten years.
The Company estimated the fair value of the Tranche 4 options and the nonexecutive options on the date of grant using the Black-Scholes option pricing model. The fair value of the Tranche 5 options was estimated on the date of grant using a combination of lattice models and Monte Carlo simulations. The estimated fair value of awards granted is based upon certain assumptions, including probability of achievement of performance and market conditions for certain awards, stock price, expected term, expected volatility, dividend yield, and a risk-free interest rate. The fair value of the Class A common stock underlying the options granted was determined based on a contemporaneous valuation performed by an independent third-party valuation specialist in accordance with the guidelines outlined in the American Institute of Certified Public Accountants Practice Aid, Valuation of Privately-Held-Company Equity Securities Issued as Compensation.
Total compensation expense related to all share-based awards was $241 thousand and $612 thousand for the three months ended March 26, 2011 and March 27, 2010, respectively, and is included in general and administrative expenses, net in the consolidated statements of operations.
(11) Income Taxes
During the three months ended March 26, 2011, the Company recognized deferred tax expense of $1.9 million, due to enacted changes in future state income tax rates. This change in enacted tax rates affects the tax rate expected to be in effect in future periods when the deferred tax assets and liabilities reverse.
| F-65 | (Continued) |
Table of Contents
Dunkin’ Brands Group, Inc. and subsidiaries
Notes to Consolidated Financial Statements—(continued)
March 26, 2011 and March 27, 2010
(Unaudited)
(12) Commitments and Contingencies
(a) Lease Commitments
The Company is party to various leases for property, including land and buildings, leased automobiles, and office equipment under noncancelable operating and capital lease arrangements.
(b) Guarantees
The Company has established agreements with certain financial institutions whereby the Company’s franchisees can obtain financing with terms of approximately five to ten years for various business purposes. Substantially all loan proceeds are used by the franchisees to finance store improvements, new store development, new central production locations, equipment purchases, related business acquisition costs, working capital, and other costs. In limited instances, the Company guarantees a portion of the payments and commitments of the franchisees, which is collateralized by the store equipment owned by the franchisee. Under the terms of the agreements, in the event that all outstanding borrowings come due simultaneously, the Company would be contingently liable for $7.7 million at March 26, 2011 and December 25, 2010. At March 26, 2011 and December 25, 2010, there were no amounts under such guarantees that were due. The fair value of the guarantee liability and corresponding asset recorded on the consolidated balance sheets was $966 thousand and $1.4 million, respectively, at March 26, 2011 and $1.0 million and $1.5 million, respectively, at December 25, 2010. The Company assesses the risk of performing under these guarantees for each franchisee relationship on a quarterly basis. As of March 26, 2011 and December 25, 2010, the Company had recorded reserves for such guarantees of $837 thousand and $1.2 million, respectively.
The Company has entered into a third-party guarantee with a distribution facility of franchisee products that ensures franchisees will purchase a certain volume of product over a ten-year period. As product is purchased by the Company’s franchisees over the term of the agreement, the amount of the guarantee is reduced. As of March 26, 2011 and December 25, 2010, the Company was contingently liable for $8.4 million and $8.6 million, respectively, under this guarantee. Based on current internal forecasts, the Company believes the franchisees will achieve the required volume of purchases, and therefore, the Company would not be required to make payments under this agreement. Additionally, the Company has various supply chain contracts that provide for purchase commitments or exclusivity, the majority of which result in the Company being contingently liable upon early termination of the agreement or engaging with another supplier. Based on prior history and the Company’s ability to extend contract terms, we have not recorded any liabilities related to these commitments. As of March 26, 2011, we were contingently liable under such supply chain agreements for approximately $20.3 million.
As a result of assigning our interest in obligations under property leases as a condition of the refranchising of certain restaurants and the guarantee of certain other leases, we are contingently liable on certain lease agreements. These leases have varying terms, the latest of which expires in 2024. As of March 26, 2011 and December 25, 2010, the potential amount of undiscounted payments the Company could be required to make in the event of nonpayment by the primary lessee was $7.8 million and $7.2 million, respectively. Our franchisees are the primary lessees under the majority of these leases. The Company generally has cross-default provisions with these franchisees that would put them in default of their franchise agreement in the event of nonpayment
| F-66 | (Continued) |
Table of Contents
DUNKIN’ BRANDS GROUP, INC. AND SUBSIDIARIES
Notes to Consolidated Financial Statements—(continued)
March 26, 2011 and March 27, 2010
(Unaudited)
under the lease. We believe these cross-default provisions significantly reduce the risk that we will be required to make payments under these leases. Accordingly, we do not believe it is probable that the Company will be required to make payments under such leases, and we have not recorded a liability for such contingent liabilities.
(c) Letters of Credit
At March 26, 2011 and December 25, 2010, the Company had standby letters of credit outstanding for a total of $11.2 million. There were no amounts drawn down on these letters of credit.
(d) Legal Matters
The Company is engaged in several matters of litigation arising in the ordinary course of its business as a franchisor. Such matters include disputes related to compliance with the terms of franchise and development agreements, including claims or threats of claims of breach of contract, negligence, and other alleged violations by the Company. At March 26, 2011 and December 25, 2010, contingent liabilities totaling $4.3 million and $4.2 million, respectively, were included in other current liabilities in the consolidated balance sheets to reflect the Company’s estimate of the potential loss which may be incurred in connection with these matters. While the Company intends to vigorously defend its positions against all claims in these lawsuits and disputes, it is reasonably possible that the losses in connection with these matters could increase by up to an additional $8.0 million based on the outcome of ongoing litigation or negotiations.
(13) Related-Party Transactions
(a) Advertising Funds
At March 26, 2011 and December 25, 2010, the Company had a net payable of $16.2 million and $23.1 million, respectively, to the various advertising funds.
To cover administrative expenses of the advertising funds, the Company charges each advertising fund a management fee for items such as facilities, accounting services, information technology, data processing, product development, legal, administrative support services, and other operating expenses, which amounted to $1.5 million and $1.4 million for the three months ended March 26, 2011 and March 27, 2010, respectively. Such management fees are reflected in the consolidated statements of operations as a reduction in general and administrative expenses, net.
(b) Sponsors
The Company is charged an annual management fee by the Sponsors of $1.0 million per Sponsor, payable in quarterly installments. The Company recognized $750 thousand of expense related to Sponsor management fees during the three months ended March 26, 2011 and March 27, 2010, which is included in general and administrative expenses, net in the consolidated statements of operations. At March 26, 2011 and December 25, 2010, the Company had $500 thousand of prepaid management fees to the Sponsors, which were recorded in prepaid expenses and other current assets in the consolidated balance sheets.
| F-67 | (Continued) |
Table of Contents
DUNKIN’ BRANDS GROUP, INC. AND SUBSIDIARIES
Notes to Consolidated Financial Statements—(continued)
March 26, 2011 and March 27, 2010
(Unaudited)
At March 26, 2011 and December 25, 2010, certain affiliates of the Sponsors held $65.7 million and $70.6 million, respectively, of term loans, net of original issue discount, issued under the Company’s senior credit facility. The terms of these loans are identical to all other term loans issued to lenders in the senior credit facility.
Our Sponsors have a controlling interest in our Company as well as several other entities. The existence of such common ownership and management control within business and other transactions could result in differences within our operating results or financial position than if the entities were autonomous. There have been no significant transactions with companies under common control during the periods presented.
In March 2006, we entered into an investor agreement with the Sponsors and also entered into a registration rights and coordination agreement with certain shareholders, including the Sponsors. Pursuant to these agreements, subject to certain exceptions and conditions, our Sponsors may require us to register their shares of common stock under the Securities Act, and they will have the right to participate in certain future registrations of securities by us.
(c) Joint Ventures
The Company received royalties from its joint ventures as follows (in thousands):
| Three months ended | ||||||||
| March 26, 2011 |
March 27, 2010 |
|||||||
| B-R 31 Ice Cream Co., Ltd (BR Japan) |
$ | 348 | 305 | |||||
| Baskin-Robbins Co., Ltd Korea (BR Korea) |
869 | 840 | ||||||
| $ | 1,217 | 1,145 | ||||||
At March 26, 2011 and December 25, 2010, the Company had $1.2 million and $962 thousand, respectively, of royalties receivable from its joint ventures which were recorded in accounts receivable, net of allowance for doubtful accounts, in the consolidated balance sheets.
The Company made payments to its joint ventures totaling approximately $109 thousand and $455 thousand during the three months ended March 26, 2011 and March 27, 2010, respectively, primarily for the purchase of ice cream products and incentive payments.
(14) Subsequent Event
On May 24, 2011, the Company increased its term loans by $100.0 million to approximately $1.50 billion. The proceeds will be used to repay an equal amount of the Company’s Senior Notes. Additionally, the Company amended the senior credit facility to reduce (a) the interest rate on the revolving credit facility to align with the term loans and (b) the LIBOR floor from 1.25% to 1.00% for both the revolving credit facility and the term loans. The interest rate reduction on the revolving credit facility occurs only if the Company completes an initial public offering, and the additional LIBOR floor reduction occurs only if the Company completes an initial public offering and reduces its leverage ratio to 5.10x or less.
| F-68 |
Table of Contents
To the Shareholders and Board of Directors of
BR KOREA CO., LTD.:
We have audited the accompanying statements of financial position of BR KOREA CO., LTD. (the “Company”) as of December 31, 2010 and 2009, and the related statements of income, appropriations of retained earnings, changes in shareholders’ equity and cash flows for each of the three years in the period ended December 31, 2010, all expressed in Korean won. These financial statements are the responsibility of the Company’s management. Our responsibility is to express an opinion on these financial statements based on our audits.
We conducted our audits in accordance with auditing standards generally accepted in the United States of America. Those standards require that we plan and perform the audit to obtain reasonable assurance about whether the financial statements are free of material misstatement. An audit includes examining, on a test basis, evidence supporting the amounts and disclosures in the financial statements. An audit also includes assessing the accounting principles used and significant estimates made by management, as well as evaluating the overall financial statement presentation. We believe that our audits provide a reasonable basis for our opinion.
In our opinion, the financial statements referred to above present fairly, in all material respects, the financial position of BR KOREA CO., LTD. as of December 31, 2010 and 2009, and the results of its operations, changes in its retained earnings and its shareholders’ equity, and its cash flows for each of the three years in the period ended December 31, 2010, in conformity with accounting principles generally accepted in the Republic of Korea (See Note 2).
Accounting principles generally accepted in the Republic of Korea vary in certain significant respects from accounting principles generally accepted in the United States of America. Information relating to the nature and effect of such differences is presented in Notes 25 to the financial statements.
April 29, 2011
/s/ Deloitte Anjin LLC
Notice to Readers
This report is effective as of April 29, 2011, the auditors’ report date. Certain subsequent events or circumstances may have occurred between the auditors’ report date and the time the auditors’ report is read. Such events or circumstances could significantly affect the accompanying financial statements and may result in modifications to the auditors’ report.
F-69
Table of Contents
STATEMENTS OF FINANCIAL POSITION
AS OF DECEMBER 31, 2010 AND 2009
| ASSETS | 2010 | 2009 | ||||||
| CURRENT ASSETS: | (In thousands) | |||||||
| Cash and cash equivalents (Notes 8 and 13) |
(Won) | 10,435,234 | (Won) | 6,403,088 | ||||
| Short-term financial instruments |
40,500,000 | 35,000,000 | ||||||
| Trade accounts receivable, net of allowance for doubtful accounts of (Won)170,149 thousand for 2010 and (Won)165,518 thousand for 2009 (Note 14) |
16,844,763 | 16,386,253 | ||||||
| Inventories (Notes 3 and 8) |
28,308,117 | 29,750,658 | ||||||
| Securities (Notes 5,8 and 24) |
5,600 | 4,390 | ||||||
| Other current assets (Note 4) |
6,541,307 | 6,194,658 | ||||||
| 102,635,021 | 93,739,047 | |||||||
| NON CURRENT ASSETS: |
||||||||
| Securities under the equity method (Note 6) |
677,340 | — | ||||||
| Securities (Notes 5 and 8) |
62,985 | 68,585 | ||||||
| Other investments |
184,085 | 411,007 | ||||||
| Tangible assets, net (Notes 7 and 8) |
62,200,625 | 64,259,915 | ||||||
| Intangible assets (Note 9) |
9,338,876 | 11,031,813 | ||||||
| Guarantee deposits paid (Note 10) |
112,647,141 | 97,554,090 | ||||||
| Membership certificates |
2,277,527 | 1,687,980 | ||||||
| Deferred income tax assets (Note 17) |
1,310,229 | 1,094,695 | ||||||
| 188,698,808 | 176,108,085 | |||||||
| Total Assets |
(Won) | 291,333,829 | (Won) | 269,847,132 | ||||
| LIABILITIES AND SHAREHOLDERS’ EQUITY |
||||||||
| CURRENT LIABILITIES: |
||||||||
| Trade accounts payable (Note 14) |
(Won) | 15,308,691 | (Won) | 14,441,821 | ||||
| Accounts payable-other (Note 14) |
8,843,013 | 7,182,563 | ||||||
| Income tax payable |
5,912,523 | 7,821,942 | ||||||
| Advances from customers |
2,068,757 | 1,892,870 | ||||||
| Guarantee deposits received |
17,373,276 | 15,188,989 | ||||||
| Deferred income tax liabilities (Note 17) |
108,745 | 107,070 | ||||||
| Other current liabilities (Notes 11 and 14) |
6,964,772 | 10,698,956 | ||||||
| 56,579,777 | 57,334,211 | |||||||
| NON- CURRENT LIABILITIES: |
||||||||
| Accrued severance indemnities, net of deposits of (Won)11,572,261 thousand for 2010 and (Won)8,955,686 thousand for 2009 (Note 12) |
3,995,292 | 3,817,228 | ||||||
| Allowance for unused points (Note 22) |
1,428,034 | 2,163,071 | ||||||
| 5,423,326 | 5,980,299 | |||||||
| TOTAL LIABILITIES |
62,003,103 | 63,314,510 | ||||||
| SHAREHOLDERS’ EQUITY: |
||||||||
| Common stock (Note 15) |
6,000,000 | 6,000,000 | ||||||
| Appropriated retained earnings (Note 15) |
24,234,977 | 24,234,977 | ||||||
| Retained earnings before appropriations |
199,095,749 | 176,297,645 | ||||||
| Total Shareholders’ Equity |
229,330,726 | 206,532,622 | ||||||
| Total Liabilities and Shareholders’ Equity |
(Won) | 291,333,829 | (Won) | 269,847,132 | ||||
See accompanying notes to financial statements.
| F-70 |
Table of Contents
STATEMENTS OF INCOME
FOR THE YEARS ENDED DECEMBER 31, 2010, 2009 AND 2008
| 2010 | 2009 | 2008 | ||||||||||
| (In thousands, except per share amounts) | ||||||||||||
| SALES (Notes 14 and 23) |
(Won) | 426,063,145 | (Won) | 406,214,174 | (Won) | 351,667,723 | ||||||
| COST OF SALES (Note 14) |
205,865,736 | 206,622,944 | 173,886,013 | |||||||||
| GROSS PROFIT |
220,197,409 | 199,591,230 | 177,781,710 | |||||||||
| SELLING, GENERAL AND ADMINISTRATIVE |
||||||||||||
| EXPENSES |
||||||||||||
| (Notes 20 and 21) |
181,504,761 | 155,286,246 | 138,606,261 | |||||||||
| OPERATING INCOME |
38,692,648 | 44,304,984 | 39,175,449 | |||||||||
| NON OPERATING INCOME (EXPENSES): |
||||||||||||
| Interest income |
2,112,109 | 1,353,475 | 2,883,872 | |||||||||
| Gain (Loss) on foreign currency translation, net |
||||||||||||
| (Note 13) |
(17,252 | ) | (74,007 | ) | 8,532 | |||||||
| Gain (Loss) on foreign currency transactions, net |
4,310 | (5,061 | ) | 23,777 | ||||||||
| Commission income |
5,199,869 | 5,685,017 | 2,949,689 | |||||||||
| Gain (Loss) on disposal of tangible assets, net |
17,414 | (598,839 | ) | (54,916 | ) | |||||||
| Gain on disposal of intangible assets |
309,350 | 177,975 | 528,706 | |||||||||
| Donations (Note 16) |
(1,983,239 | ) | (2,261,554 | ) | (1,484,498 | ) | ||||||
| Miscellaneous, net (Note 16) |
(336,130 | ) | (1,168,736 | ) | 767,170 | |||||||
| 5,306,431 | 3,108,270 | 5,622,332 | ||||||||||
| INCOME BEFORE INCOME TAX |
43,999,079 | 47,413,254 | 44,797,781 | |||||||||
| INCOME TAX EXPENSE (Note 17) |
10,586,975 | 12,050,772 | 11,911,138 | |||||||||
| NET INCOME |
(Won) | 33,412,104 | (Won) | 35,362,482 | (Won) | 32,886,643 | ||||||
| NET INCOME PER SHARE (Note 18) |
(Won) | 55,687 | (Won) | 58,937 | (Won) | 54,811 | ||||||
See accompanying notes to financial statements.
| F-71 |
Table of Contents
STATEMENTS OF APPROPRIATIONS OF RETAINED EARNINGS
FOR THE YEARS ENDED DECEMBER 31, 2010, 2009 AND 2008
| 2010 | 2009 | 2008 | ||||||||||
| (In thousands) | ||||||||||||
| RETAINED EARNINGS BEFORE APPROPRIATIONS: |
||||||||||||
| Unappropriated retained earnings brought forward from prior year |
(Won) | 165,683,645 | (Won) | 140,935,163 | (Won) | 117,936,520 | ||||||
| Net income |
33,412,104 | 35,362,482 | 32,886,643 | |||||||||
| 199,095,749 | 176,297,645 | 150,823,163 | ||||||||||
| APPROPRIATIONS: |
||||||||||||
| Dividends (Note 19) |
10,032,000 | 10,614,000 | 9,888,000 | |||||||||
| UNAPPROPRIATED RETAINED EARNINGS TO BE CARRIED FORWARD TO SUBSEQUENT YEAR |
(Won) | 189,063,749 | (Won) | 165,683,645 | (Won) | 140,935,163 | ||||||
See accompanying notes to financial statements.
| F-72 |
Table of Contents
STATEMENTS OF CHANGES IN SHAREHOLDERS’ EQUITY
FOR THE YEARS ENDED DECEMBER 31, 2010, 2009 AND 2008
| Korean Won | ||||||||||||
| Common Stock |
|
(In thousands Retained Earnings |
)
|
Total | ||||||||
| Balance at January 1, 2008 |
(Won) | 6,000,000 | (Won) | 150,193,497 | (Won) | 156,193,497 | ||||||
| Annual dividends |
(8,022,000 | ) | (8,022,000 | ) | ||||||||
| Balance after appropriations |
142,171,497 | 148,171,497 | ||||||||||
| Net income |
32,886,643 | 32,886,643 | ||||||||||
| Balance at December 31, 2008 |
(Won) | 6,000,000 | (Won) | 175,058,140 | (Won) | 181,058,140 | ||||||
| Balance at January 1, 2009 |
(Won) | 6,000,000 | (Won) | 175,058,140 | (Won) | 181,058,140 | ||||||
| Annual dividends |
(9,888,000 | ) | (9,888,000 | ) | ||||||||
| Balance after appropriations |
165,170,140 | 171,170,140 | ||||||||||
| Net income |
35,362,482 | 35,362,482 | ||||||||||
| Balance at December 31, 2009 |
(Won) | 6,000,000 | (Won) | 200,532,622 | (Won) | 206,532,622 | ||||||
| Balance at January 1, 2010 |
(Won) | 6,000,000 | (Won) | 200,532,622 | (Won) | 206,532,622 | ||||||
| Annual dividends |
(10,614,000 | ) | (10,614,000 | ) | ||||||||
| Balance after appropriations |
189,918,622 | 195,918,622 | ||||||||||
| Net income |
33,412,104 | 33,412,104 | ||||||||||
| Balance at December 31, 2010 |
(Won) | 6,000,000 | (Won) | 223,330,726 | (Won) | 229,330,726 | ||||||
See accompanying notes to financial statements.
| F-73 |
Table of Contents
STATEMENTS OF CASH FLOWS
FOR THE YEARS ENDED DECEMBER 31, 2010, 2009 AND 2008
| 2010 | 2009 | 2008 | ||||||||||
| (In thousands) | ||||||||||||
| CASH FLOWS FROM OPERATING ACTIVITIES: |
||||||||||||
| Net income |
(Won) | 33,412,104 | (Won) | 35,362,482 | (Won) | 32,886,643 | ||||||
| Adjustments to reconcile net income to net cash provided by operating activities: |
||||||||||||
| Depreciation |
18,899,166 | 19,914,400 | 14,587,093 | |||||||||
| Provision for severance indemnities |
6,695,012 | 4,015,539 | 4,062,087 | |||||||||
| Amortization of lease premium |
3,604,761 | 3,229,923 | 2,779,148 | |||||||||
| Provision for doubtful accounts |
31,982 | 21,800 | 43,845 | |||||||||
| Disposal of tangible assets, net |
(17,414 | ) | 598,839 | 54,916 | ||||||||
| Disposal of intangible assets, net |
(309,350 | ) | (177,975 | ) | (528,706 | ) | ||||||
| Payment of severance indemnities |
(4,074,977 | ) | (2,299,625 | ) | (1,614,433 | ) | ||||||
| Transfer of severance indemnities from related parties |
174,604 | 176,542 | 120,889 | |||||||||
| Change in trade accounts receivable |
(463,142 | ) | (137,154 | ) | (3,845,630 | ) | ||||||
| Change in accounts receivable-other |
537,197 | (2,091,922 | ) | (538,878 | ) | |||||||
| Change in accrued income |
17,600 | 166,021 | 977,050 | |||||||||
| Change in advanced payments |
(1,030,369 | ) | 1,152,192 | (1,691,811 | ) | |||||||
| Change in prepaid expenses |
101,573 | (69,533 | ) | (117,813 | ) | |||||||
| Change in inventories |
1,442,542 | 1,944,500 | (18,632,710 | ) | ||||||||
| Change in deferred income tax assets |
(215,534 | ) | (612,949 | ) | (481,746 | ) | ||||||
| Change in trade accounts payable |
866,869 | 487,801 | 5,827,758 | |||||||||
| Change in accounts payable-other |
1,660,450 | (7,837,644 | ) | 7,211,259 | ||||||||
| Change in withholdings |
(752,033 | ) | 2,638,929 | (1,333,912 | ) | |||||||
| Change in accrued expenses |
(2,982,152 | ) | 3,563,367 | 814,065 | ||||||||
| Change in income tax payable |
(1,909,418 | ) | (140,325 | ) | 2,098,945 | |||||||
| Change in deferred income tax liabilities |
1,675 | (60,151 | ) | (392,269 | ) | |||||||
| Change in advances from customers |
188,042 | (983,082 | ) | (45,404 | ) | |||||||
| Change in allowance for unused points |
(735,036 | ) | (69,893 | ) | 793,218 | |||||||
| Change in gift certificate discounts |
(12,156 | ) | (3,629 | ) | (10,843 | ) | ||||||
| Transferred to the national pension fund |
7,208 | — | ||||||||||
| Severance indemnities |
(2,623,783 | ) | (3,269,803 | ) | 301,186 | |||||||
| Net cash provided by operating activities |
52,515,421 | 55,518,650 | 43,323,947 | |||||||||
| F-74 | (Continued) |
Table of Contents
BR KOREA CO., LTD.
STATEMENTS OF CASH FLOWS—(CONTINUED)
FOR THE YEARS ENDED DECEMBER 31, 2010, 2009 AND 2008
| 2010 | 2009 | 2008 | ||||||||||
| (In thousands) | ||||||||||||
| CASH FLOWS FROM INVESTING ACTIVITIES: |
||||||||||||
| Withdrawal of short-term financial instruments |
(Won) | 157,000,000 | (Won) | 78,678,865 | (Won) | 69,000,000 | ||||||
| Proceeds from disposal of securities |
4,390 | 16,945 | 39,290 | |||||||||
| Disposal of tangible assets |
327,457 | 3,923,898 | 437,449 | |||||||||
| Refund of guarantee deposits paid |
4,752,250 | 7,684,153 | 7,464,884 | |||||||||
| Collection of long-term loans |
226,922 | 167,330 | 184,805 | |||||||||
| Disposal of lease premium |
352,600 | 190,454 | 772,320 | |||||||||
| Disposal of membership certificates |
— | 362,810 | ||||||||||
| Acquisition of short-term financial instruments |
(162,500,000 | ) | (96,678,865 | ) | (23,000,000 | ) | ||||||
| Purchase of securities under the equity method |
(677,340 | ) | — | (3,950 | ) | |||||||
| Purchase of securities |
— | (2,370 | ) | (5,600 | ) | |||||||
| Payment of guarantee deposits paid |
(19,845,301 | ) | (17,863,614 | ) | (32,423,544 | ) | ||||||
| Acquisition of tangible assets |
(17,149,920 | ) | (25,082,537 | ) | (46,746,940 | ) | ||||||
| Purchase of membership certificates |
(589,546 | ) | (157,081 | ) | (311,711 | ) | ||||||
| Payment of lease premium |
(1,955,074 | ) | (2,056,515 | ) | (7,860,587 | ) | ||||||
| Net cash used in investing activities |
(40,053,562 | ) | (50,816,527 | ) | (32,453,584 | ) | ||||||
| CASH FLOWS FROM FINANCING ACTIVITIES: |
||||||||||||
| Refund of guarantee deposits received |
5,074,855 | 5,978,607 | 3,671,219 | |||||||||
| Dividends paid |
(10,614,000 | ) | (9,888,000 | ) | (8,022,000 | ) | ||||||
| Payment of guarantee deposits received |
(2,890,568 | ) | (4,340,270 | ) | (2,169,275 | ) | ||||||
| Net cash used in financing activities |
(8,429,713 | ) | (8,249,663 | ) | (6,520,056 | ) | ||||||
| NET INCREASE (DECREASE) IN CASH AND CASH EQUIVALENTS |
4,032,146 | (3,547,540 | ) |
4,350,307 | ||||||||
| CASH AND CASH EQUIVALENTS, BEGINNING OF YEAR |
6,403,088 | 9,950,628 | 5,600,322 | |||||||||
| CASH AND CASH EQUIVALENTS, END OF YEAR (Note 23) |
(Won) | 10,435,234 | (Won) | 6,403,088 | (Won) | 9,950,629 | ||||||
See accompanying notes to financial statements.
| F-75 |
Table of Contents
NOTES TO FINANCIAL STATEMENTS
FOR THE YEARS ENDED DECEMBER 31, 2010 AND 2009
1. GENERAL:
BR KOREA CO., LTD. (the “Company”) was incorporated under the laws of the Republic of Korea on June 10, 1985 in accordance with the joint venture agreement dated April 19, 1985 between three Korean shareholders represented by Mr. Young In Hur and Dunkin’ Brands Inc. Under such agreement, the Company engages in the production, distribution and sale of ice cream, ice cream treats and donuts and other related activities. Sales are made through the Company’s distribution network under its direct management and franchise stores under the brand names of Baskin-Robbins and Dunkin’ Donuts.
As of December 31, 2010, the Company’s common stock amounts to (Won)6,000 million, and the issued and outstanding shares of the Company are owned 66.67% by those Korean shareholders and 33.33% by Dunkin’ Brands Inc.
2. SUMMARY OF SIGNIFICANT ACCOUNTING POLICIES:
Basis of Financial Statement Presentation
The Company maintains its official accounting records in Korean won and prepares its statutory financial statements in the Korean language (Hangul) in conformity with accounting principles generally accepted in the Republic of Korea. Certain accounting principles applied by the Company that conform with the financial accounting standards and accounting principles in the Republic of Korea may not conform with generally accepted accounting principles in other countries. Accordingly, the accompanying financial statements are intended for use by those who are informed about Korean accounting principles and practices. The accompanying financial statements have been condensed, restructured and translated into English (with certain expanded descriptions) from the Korean language financial statements. Certain information included in the Korean language financial statements, but not required for a fair presentation of the Company’s financial position, result of operations, changes in shareholders’ equity or cash flows, is not presented in the accompanying financial statements.
The accompanying financial statements to be presented at the annual shareholders’ meeting were approved by the board of directors on March 3, 2011.
Significant accounting policies followed by the Company in the preparation of its financial statements are summarized below.
Cash and Cash Equivalents
Cash and cash equivalents includes cash, checks issued by others, checking accounts, ordinary deposits and financial instruments, which can be easily converted into cash and whose value changes due to changes in interest rates are not material, with maturities (or date of redemption) of three months or less from acquisition.
Revenue Recognition
The Company revenue consists of an initial franchise fee, sales of ice cream and donuts to franchisees and to customers (for its retail stores) and other.
| F-76 | (Continued) |
Table of Contents
BR KOREA CO., LTD.
NOTES TO FINANCIAL STATEMENTS—(CONTINUED)
FOR THE YEARS ENDED DECEMBER 31, 2010 AND 2009
The Company sells individual franchise agreements, under which a franchisee pays an initial nonrefundable fee and subsequently purchases ice cream and donuts from the Company. The initial franchise fee is recognized as Commission income, upon substantial completion of the services required of the Company as stated in the franchise agreement, which is generally upon the opening of the respective franchise. Subsequently, once the franchise begins operations, the Company recognizes revenue from the sale of ice cream and donuts to a franchise as Sales during the period. Revenue generated from the sale of ice cream and donuts to franchisees is recognized upon delivery; however, revenue is recognized when the sales terms have been fully met if there are sales terms related with post-delivery. Retail store revenues at company-owned stores are recognized at the point of sale, net of sales tax and other sales-related taxes.
The Company offers customer loyalty programs – bonus points, under which customers can earn from 1.5% ~ 5% of any purchase amount above (Won)1,000, as points to use in the future. Such points expire within one year from the date the customer earns them. When a customer earns bonus points under the program, the Company recognizes selling, general and administrative expense in the same amount and a corresponding liability under Allowance for unused points. When points are used, the Company reduces Allowance for unused points and recognizes revenue. At the end of the period, 100% of the unused points are recognized as Allowance for unused points (Note 22), in the Company’s statements of financial position.
Gift Certificates
Gift certificates are stated at face value, net of any discounts given, at the time of issuance and accounted for as Advances from Customers. The gift certificates generally expire within 5 years of issuance. The redemption of gift certificates is reflected as sales at the time the certificates are redeemed at stores by the portion of advances, net of discounts for the relative amount of redemption. Any expired gift certificates are recognized as Non-operating income.
Allowance for Doubtful Accounts
The Company provides an allowance for doubtful accounts to cover estimated losses on receivables, based on collection experience and analysis of the collectibility of individual outstanding receivables.
Inventories
Inventories are stated at cost which is determined by using the moving average method. The Company maintains perpetual inventory, which is adjusted to physical inventory counts performed at year end. When the market value of inventories (net realizable value for finished goods or merchandise and current replacement cost for raw materials) is less than the carrying value, carrying value is stated at the lower of cost or market. The Company applies the lower of cost or market method by each group of inventories and loss on inventory valuation is presented as a deduction from inventories and charged to cost of sales.
Classification of Securities
At acquisition, the Company classifies securities into one of the following categories: trading, available-for-sale, held-to-maturity and securities accounted for under the equity method, depending on marketability, purpose of
| F-77 | (Continued) |
Table of Contents
BR KOREA CO., LTD.
NOTES TO FINANCIAL STATEMENTS—(CONTINUED)
FOR THE YEARS ENDED DECEMBER 31, 2010 AND 2009
acquisition and ability to hold. Debt and equity securities that are bought and held for the purpose of selling them in the near term and actively traded are classified as trading securities. Debt securities with fixed and determinable payments and fixed maturity that the Company has the positive intent and ability to hold to maturity are classified as held-to-maturity securities. Investments in equity securities over which the Company exercises significant influence, are accounted for under the equity method. Securities accounted for under the equity method are presented as securities accounted for using the equity method in the statement of financial position. Debt and equity securities not classified as the above are categorized as available-for-sale securities. The average method is used to determine the cost of debt and equity securities for the calculation of gain (loss) on disposal of those securities.
Valuation of Securities
Debt securities that have fixed or determinable payments with a fixed maturity are classified as held-to-maturity securities only if the Company has both the positive intent and ability to hold those securities to maturity. However, debt securities, whose maturity dates are due within one year from the period end date, are classified as current assets.
After initial recognition, held-to-maturity securities are stated at amortized cost in the statements of financial position. When held-to-maturity securities are measured at amortized costs, the difference between their acquisition cost and face value is amortized using the effective interest rate method and the amortization is included in the cost and interest income.
When the possibility of not being able to collect the principal and interest of held-to-maturity securities according to the terms of the contracts is highly likely, the difference between the recoverable amount (the present value of expected cash flows using the effective interest rate upon acquisition of the securities) and book value is recorded as loss on impairment of held-to-maturity securities included in the non-operating expense and the held-to-maturity securities are stated at the recoverable amount after impairment loss. If the value of impaired securities subsequently recovers and the recovery can be objectively related to an event occurring after the impairment loss was recognized, the reversal of impairment loss is recorded as reversal of impairment loss on held-to-maturity securities included in non-operating income. However, the resulting carrying amount after the reversal of impairment loss shall not exceed the amortized cost that would have been measured, at the date of the reversal, if no impairment loss was recognized.
Tangible Assets
Property, plant and equipment are stated at cost (acquisition cost or manufacturing cost plus expenditures directly related to preparing the assets ready for use). Assets acquired from investment-in-kind, received through donations or acquired free of charge in other ways are stated at the market value of the item which is considered as the fair value. However, certain assets, for which the revaluation method in accordance with the Asset Revaluation Act of Korea or the amended Statement of Korea Accounting Standards No. 5, Property, Plant and Equipment is elected, are recorded at revalued amounts, up to December 31, 2000 (last allowable revaluation date), net of accumulated depreciation to date.
| F-78 | (Continued) |
Table of Contents
BR KOREA CO., LTD.
NOTES TO FINANCIAL STATEMENTS—(CONTINUED)
FOR THE YEARS ENDED DECEMBER 31, 2010 AND 2009
Expenditures after acquisition or completion that increase future economic benefit in excess of the most recently assessed capability level of the asset are capitalized and other expenditures are charged to expense as incurred.
In accordance with the Company’s policy, borrowing costs in relation to the manufacture, purchase, construction or development of assets are capitalized as part of the cost of those assets.
When the expected future cash flow from use or disposal of the property, plant and equipment is lower than the carrying amount due to obsolescence, physical damage or other causes, the carrying amount is adjusted to the recoverable amount (the higher of net sales price or value in use) and the difference is recognized as an impairment loss. When the recoverable amount subsequently exceeds the carrying amount of the impaired asset, the excess is recorded as a reversal of impairment loss to the extent that the reversed asset does not exceed the carrying amount before previous impairment as adjusted by depreciation.
Depreciation is computed using the declining-balance method, except for buildings and structures using straight-line method, over the estimated useful lives of the assets as follows:
| Assets | Useful lives (Years) | |
| Buildings | 30 | |
| Structures | 15 | |
| Machinery and equipment | 8 | |
| Vehicles | 4 | |
| Others | 4 | |
Intangible Assets
Intangible asset amount represents lease premiums paid, which is amortized using the straight-line method over the estimated useful life of 5 years. A lease premium is an amount a lessee pays to the previous lessee related to the property. A long-term lease contract with a contract period of 5 years or more is amortized over the actual contract years. When the leasing right is transferred to a sub-lessee before the end of the lease period, the gain or loss on disposal of the lease premium is recognized in the amount of the difference between the lease premium previously paid and the lease premium received from the sub-lessee.
Accrued Severance Indemnities
In accordance with the Company’s policy, all employees with more than one year of service are entitled to receive a lump-sum severance payment upon termination of their employment, based on their current salary rate and length of service. The accrual for severance indemnities is computed as if all employees were to terminate at the period end dates and amounted to (Won)15,568 million and (Won)12,773 million for the years ended December 31, 2010 and 2009, respectively. In accordance with the National Pension Law of Korea, a portion of its severance indemnities which has been transferred in cash to the National Pension Fund through March 1999 is presented as a deduction from accrued severance indemnities. Additionally, the Company has insured a portion of its obligations for severance indemnities by making deposits that will be directly paid to employees with Shinhan Bank Co. and others, and records them as severance insurance deposits which are directly deducted from accrued severance indemnities. Actual payments for severance indemnities amounted to (Won)4,075 million and (Won)2,300 million for the years ended December 31, 2010 and 2009, respectively.
| F-79 | (Continued) |
Table of Contents
BR KOREA CO., LTD.
NOTES TO FINANCIAL STATEMENTS—(CONTINUED)
FOR THE YEARS ENDED DECEMBER 31, 2010 AND 2009
Income Tax Expense
The Company recognizes deferred income tax assets or liabilities for the temporary differences between the carrying amount of an asset and liability and tax base. A deferred tax liability is generally recognized for all taxable temporary differences with some exceptions and a deferred tax asset is recognized to the extent when it is probable that taxable income will be available against which the deductible temporary difference can be utilized in the future. Deferred income tax asset (liability) is classified as current or non-current asset (liability) depending on the classification of related asset (liability) in the statements of financial position. Deferred income tax asset (liability), which does not relate to specific asset (liability) account in the statements of financial position such as deferred income tax asset recognized for tax loss carryforwards, is classified as current or non-current asset (liability) depending on the expected reversal period. Deferred income tax assets and liabilities in the same tax jurisdiction and in the same current or non-current classification are presented on a net basis. Current and deferred income tax expense are included in income tax expense in the statements of income and additional income tax or tax refunds for the prior periods are included in income tax expense for the current period when recognized. However, income tax resulting from transactions or events, which was directly recognized in shareholders’ equity in current or prior periods, or business combinations, is directly adjusted to equity account or goodwill (or negative goodwill).
Accounting for Foreign Currency Translation
The Company maintains its accounts in Korean won. Monetary accounts with balances denominated in foreign currencies are recorded and reported in the accompanying financial statements at the exchange rates prevailing at the period end dates. The balances have been translated using the market exchange rate announced by Seoul Money Brokerage Services Ltd., which is (Won)1,138.90 and (Won)1,167.60 to US $1.00 at December 31, 2010 and 2009, respectively. The translation gains or losses are reflected in non operating income (expense).
Reclassification
Initial franchise fee was recognized as Miscellaneous income in prior year which has been reclassified to Commission income. In addition, the liability related to unused points was recorded as net of Advance for customers in previous year, which has been reclassified and is presented separately under Allowance for unused point. These reclassifications of the prior period are to conform to the current period’s presentation for comparative purposes; however, such reclassifications have no effect on the previously prior period’s net income or shareholders’ equity of the Company.
3. INVENTORIES:
Inventories as of December 31, 2010 and 2009 consist of the following:
| Korean Won (In thousands) | ||||||||
| 2010 | 2009 | |||||||
| Merchandise |
(Won) | 8,116,884 | (Won) | 9,099,921 | ||||
| Finished goods |
4,941,342 | 3,710,784 | ||||||
| Semi finished goods |
219,911 | 306,626 | ||||||
| Raw materials |
10,693,639 | 11,912,133 | ||||||
| Materials in transit |
4,336,341 | 4,721,194 | ||||||
| Total |
(Won) | 28,308,117 | (Won) | 29,750,658 | ||||
| F-80 | (Continued) |
Table of Contents
BR KOREA CO., LTD.
NOTES TO FINANCIAL STATEMENTS—(CONTINUED)
FOR THE YEARS ENDED DECEMBER 31, 2010 AND 2009
4. OTHER CURRENT ASSETS:
Other current assets as of December 31, 2010 and 2009 consist of the following:
| Korean Won (In thousands) | ||||||||
| 2010 | 2009 | |||||||
| Accounts receivable–other |
(Won) | 3,503,628 | (Won) | 4,068,176 | ||||
| Accrued income |
498,843 | 516,444 | ||||||
| Advanced payments |
2,267,233 | 1,236,864 | ||||||
| Prepaid expenses |
271,603 | 373,174 | ||||||
| Total |
(Won) | 6,541,307 | (Won) | 6,194,658 | ||||
5. SECURITIES:
Securities as of December 31, 2010 and 2009 are all classified as held-to-maturities securities and consist of following:
| Korean Won (In thousands) | ||||||||
| 2010 | 2009 | |||||||
| Held-to-maturity securities Government & public bonds |
(Won) | 68,585 | (Won) | 72,975 | ||||
Held-to-maturity securities whose maturity are within one year from the period end date in the amount of (Won)5,600 thousand and (Won)4,390 thousand as of December 31, 2010 and 2009, respectively, are classified as securities in the current assets.
In addition, during the year ended December 31, 2010 and 2009 no impairment loss or reversal of any previously recognized impairment loss on securities occurred.
6. SECURITIES UNDER THE EQUITY METHOD:
Details of securities accounted for under the equity method as of December 31, 2010 are as follow:
| Korean Won (In thousands) | ||||||||||||||||||||
| Number of shares |
Ownership | Acquisition cost |
Net asset value |
Book value | ||||||||||||||||
| NEXGEN FOOD RESEARCH(NFR) |
6,000 | 100% | (Won) | 677,340 | (Won) | 677,340 | (Won) | 677,340 | ||||||||||||
As of December 31, 2010, the Company does not reflect its proportionate share of operational results or equity adjustments of NFR as the monetary impact on the Company’s financial statements are insignificant. In addition, during the year ended December 31, 2010 and 2009 no impairment loss or reversal of any previously recognized impairment loss on securities under the equity method occurred.
| F-81 | (Continued) |
Table of Contents
BR KOREA CO., LTD.
NOTES TO FINANCIAL STATEMENTS—(CONTINUED)
FOR THE YEARS ENDED DECEMBER 31, 2010 AND 2009
7. TANGIBLE ASSETS:
(1) Tangible assets as of December 31, 2010 and 2009 consist of the following:
| Korean Won (In thousands) | ||||||||
| 2010 | 2009 | |||||||
| Land |
(Won) | 11,103,689 | (Won) | 11,103,689 | ||||
| Buildings |
21,571,820 | 22,532,797 | ||||||
| Structures |
752,500 | 748,657 | ||||||
| Machinery |
8,080,418 | 11,214,919 | ||||||
| Vehicles |
113,898 | 46,327 | ||||||
| Other |
20,578,300 | 18,613,526 | ||||||
| Total |
(Won) | 62,200,625 | (Won) | 64,259,915 | ||||
(2) Disclosure of Land Price and Valuation of Land
The Korean government annually announces the public price of domestic land by address and type of purpose pursuant to the laws on Disclosure of Land Price and Valuation of Land. This is determined based on the comprehensive consideration including market price, surrounding road condition, possibility of future development and others. As of December 31, 2010 and 2009, the public price of Company-owned land is (Won)8,960,541 thousand and (Won)8,806,694 thousand, respectively.
(3) Changes in book values of tangible assets for the years ended December 31, 2010 and 2009 consist of the following:
| Korean Won (In thousands) | ||||||||||||||||||||||||
| 2010 | ||||||||||||||||||||||||
| January 1, 2010 |
Acquisition | Disposal | Transfer | Depreciation | December 31, 2010 |
|||||||||||||||||||
| Land |
(Won) | 11,103,689 | (Won) | — | (Won) | — | (Won) | — | (Won) | — | (Won) | 11,103,689 | ||||||||||||
| Buildings |
22,532,797 | — | — | — | 960,977 | 21,571,820 | ||||||||||||||||||
| Structures |
748,657 | 101,200 | — | — | 97,357 | 752,500 | ||||||||||||||||||
| Machinery |
11,214,919 | 529,247 | — | — | 3,663,748 | 8,080,418 | ||||||||||||||||||
| Vehicles |
46,327 | 129,632 | 8 | — | 62,053 | 113,898 | ||||||||||||||||||
| Others |
18,613,526 | 16,389,840 | 310,035 | — | 14,115,031 | 20,578,300 | ||||||||||||||||||
| Total |
(Won) | 64,259,915 | (Won) | 17,149,919 | (Won) | 310,043 | (Won) | — | (Won) | 18,899,166 | (Won) | 62,200,625 | ||||||||||||
| F-82 | (Continued) |
Table of Contents
BR KOREA CO., LTD.
NOTES TO FINANCIAL STATEMENTS—(CONTINUED)
FOR THE YEARS ENDED DECEMBER 31, 2010 AND 2009
| Korean Won (In thousands) | ||||||||||||||||||||||||
| 2009 | ||||||||||||||||||||||||
| January 1, 2009 |
Acquisition | Disposal | Transfer | Depreciation | December 31, 2009 |
|||||||||||||||||||
| Land |
(Won) | 11,004,631 | (Won) | 99,058 | (Won) | — | (Won) | — | (Won) | — | (Won) | 11,103,689 | ||||||||||||
| Buildings |
10,251,203 | 2,211,290 | 210,085 | 11,211,800 | 931,411 | 22,532,797 | ||||||||||||||||||
| Structures |
705,393 | 131,000 | — | — | 87,736 | 748,657 | ||||||||||||||||||
| Machinery |
9,324,879 | 9,478,153 | 3,390,510 | — | 4,197,603 | 11,214,919 | ||||||||||||||||||
| Vehicles |
98,141 | — | 7 | — | 51,807 | 46,327 | ||||||||||||||||||
| Others |
21,018,468 | 13,163,035 | 922,134 | — | 14,645,843 | 18,613,526 | ||||||||||||||||||
| Construction in progress |
11,211,800 | — | — | (11,211,800 | ) | — | — | |||||||||||||||||
| Total |
(Won) | 63,614,515 | (Won) | 25,082,536 | (Won) | 4,522,736 | (Won) | — | (Won) | 19,914,400 | (Won) | 64,259,915 | ||||||||||||
During the year ended December 31, 2010 and 2009 no impairment loss or reversal of any previously recognized impairment loss on property, plant and equipment occurred.
8. INSURED ASSETS:
As of December 31, 2010, the Company’s buildings and structures, machinery, equipment and inventories are insured up to (Won)94,613,388 thousand for fire and (Won)2,280,000 thousand for gas casualty insurance, and (Won)200,000 thousand for the theft of securities and cash. In addition, the Company carries general insurance for vehicles, product liability insurance, business liability insurance and workers’ compensation and casualty insurance for employees.
9. INTANGIBLE ASSETS:
Change in intangible asset which consists of lease premiums for the years ended December 31, 2010 and 2009 are as follows:
| Korean Won (In thousands) | ||||||||
| 2010 | 2009 | |||||||
| Beginning balance |
(Won) | 11,031,813 | (Won) | 12,217,700 | ||||
| Increase |
1,955,074 | 2,056,515 | ||||||
| Amortization |
3,604,761 | 3,229,922 | ||||||
| Disposal |
43,250 | 12,480 | ||||||
| Ending balance |
(Won) | 9,338,876 | (Won) | 11,031,813 | ||||
10. GUARANTEE DEPOSITS:
Guarantee deposits paid as of December 31, 2010 and 2009 are as follows:
| Korean Won (In thousands) | ||||||||
| 2010 | 2009 | |||||||
| Rental deposits |
(Won) | 112,622,634 | (Won) | 97,529,235 | ||||
| Other |
24,507 | 24,855 | ||||||
| Total |
(Won) | 112,647,141 | (Won) | 97,554,090 | ||||
| F-83 | (Continued) |
Table of Contents
BR KOREA CO., LTD.
NOTES TO FINANCIAL STATEMENTS—(CONTINUED)
FOR THE YEARS ENDED DECEMBER 31, 2010 AND 2009
The Company obtained lien rights for the amount of (Won)77,995 million related to its guarantee deposits as of December 31, 2010.
11. OTHER CURRENT LIABILITIES:
Other current liabilities as of December 31, 2010 and 2009 consist of the following:
| Korean Won (In thousands) | ||||||||
| 2010 | 2009 | |||||||
| Withholdings |
(Won) | 3,279,270 | (Won) | 4,031,303 | ||||
| Accrued expenses |
3,685,502 | 6,667,653 | ||||||
| (Won) | 6,964,772 | (Won) | 10,698,956 | |||||
12. ACCRUED SEVERANCE INDEMNITIES:
(1) Employees with more than one year of service are entitled to receive severance indemnities, based on their length of service and salary rate upon termination of their employment. The severance indemnities that would be payable assuming all eligible employees were to resign amount to (Won)15,567,553 thousand and (Won)12,772,914 thousand as of December 31, 2010 and 2009, respectively. The changes in accrued severance indemnities for the years ended December 31, 2010 and 2009 are as follows:
| Korean Won (In thousands) | ||||||||
| 2010 | 2009 | |||||||
| Beginning accrued severance indemnities |
(Won) | 12,772,914 | (Won) | 10,880,458 | ||||
| Provision for severance indemnities for the period |
6,695,012 | 4,015,539 | ||||||
| Transferred-in from affiliates |
174,604 | 176,542 | ||||||
| Actual payment |
(4,074,977 | ) | (2,299,625 | ) | ||||
| Ending accrued severance indemnities |
(Won) | 15,567,553 | (Won) | 12,772,914 | ||||
| Deposits in National Pension Fund |
(Won) | (26,810 | ) | (34,018 | ) | |||
| Deposits in financial institutions |
(11,545,451 | ) | (8,921,668 | ) | ||||
| Total severance deposits |
(Won) | (11,572,261 | ) | (Won) | (8,955,686 | ) | ||
| Accrued severance indemnities, net of deposits |
(Won) | 3,995,292 | (Won) | 3,817,228 | ||||
(2) The Company has insured a portion of its obligations for severance indemnities, in order to obtain the related tax benefits, by making deposits with Shinhan Bank Co. and others. Withdrawal of these deposits, in the amount of (Won)11,545,451 thousand and (Won)8,921,668 thousand as of December 31, 2010 and 2009, respectively, is restricted to the payment of severance indemnities. In addition, a part of severance liabilities has been transferred to the national pension fund under the relevant regulation, which is no longer effective. The amounts of the national pension fund benefit transferred are (Won)26,810 thousand and (Won)34,018 thousand as of December 31, 2010 and 2009, respectively. The severance insurance deposits and the national pension fund benefit transferred and outstanding are presented as a deduction from accrued severance indemnities.
| F-84 | (Continued) |
Table of Contents
BR KOREA CO., LTD.
NOTES TO FINANCIAL STATEMENTS—(CONTINUED)
FOR THE YEARS ENDED DECEMBER 31, 2010 AND 2009
13. ASSETS IN FOREIGN CURRENCY:
Assets denominated in foreign currency as of December 31, 2010, 2009 and 2008 are as follows:
| Korean Won (In thousands) | ||||||||||||||||||||||||
| 2010 | 2009 | 2008 | ||||||||||||||||||||||
| Foreign currency |
Korean Won |
Foreign currency |
Korean Won |
Foreign currency |
Korean Won |
|||||||||||||||||||
| Cash and cash equivalents |
USD 715,149 | (Won) | 814,483 | USD 314,460 | (Won) | 367,163 | USD 32,893 | (Won) | 41,362 | |||||||||||||||
The Company recorded (Won)(17,252) thousand, (Won)(74,007) thousand and (Won)8,532 thousand of Gain(Loss) on foreign currency translation in Non-operating incomes(expenses) for the years ended December 31, 2010, 2009, and 2008, respectively.
14. TRANSACTIONS WITH RELATED PARTIES:
(1) Transactions with affiliated companies and other related parties in 2010, 2009 and 2008 are as follows:
| Korean Won (In thousands) | ||||||||||||||||||||||||
| 2010 | 2009 | 2008 | ||||||||||||||||||||||
| Revenues | Purchases and others |
Revenues | Purchases and others |
Revenues | Purchases and others |
|||||||||||||||||||
| Shany Co., Ltd. |
(Won) | 1,083,848 | (Won) | 11,853,327 | (Won) | 1,150,848 | (Won) | 8,382,872 | (Won) | 1,524,853 | (Won) | 9,205,397 | ||||||||||||
| Honam Shany Co., Ltd. |
— | 79,844 | — | 75,770 | — | 72,651 | ||||||||||||||||||
| Paris Croissant Co., Ltd. |
322,424 | 6,969,578 | 175,654 | 4,586,953 | 364,698 | 4,702,673 | ||||||||||||||||||
| Samlip General Food Co., Ltd. |
1,250,728 | 3,493,164 | 980,148 | 4,071,503 | 1,064,070 | 3,589,294 | ||||||||||||||||||
| SPC Co., Ltd. |
2,050,502 | 4,409,849 | — | 2,674,935 | 114 | 1,644,123 | ||||||||||||||||||
| Dunkin’ Brands, Inc. |
— | 3,448,705 | — | 3,193,370 | — | 2,754,578 | ||||||||||||||||||
| Paris Baguette Bon Doux, Inc. |
— | 23,482,273 | — | 33,281,213 | — | 34,917,510 | ||||||||||||||||||
| (Won) | 4,707,502 | (Won) | 53,736,740 | (Won) | 2,306,650 | (Won) | 56,266,616 | (Won) | 2,953,735 | (Won) | 56,886,226 | |||||||||||||
| F-85 | (Continued) |
Table of Contents
BR KOREA CO., LTD.
NOTES TO FINANCIAL STATEMENTS—(CONTINUED)
FOR THE YEARS ENDED DECEMBER 31, 2010 AND 2009
(2) Related balances of receivables and payables with related parties as of December 31, 2010 and 2009 are summarized below.
| Korean Won (In thousands) | ||||||||
| 2010 | 2009 | |||||||
| Receivables |
||||||||
| Shany Co., Ltd. |
(Won) | 786 | (Won) | — | ||||
| Paris Croissant Co., Ltd. |
27,215 | — | ||||||
| Samlip General Food Co., Ltd. |
209,348 | — | ||||||
| SPC Co., Ltd. |
154,120 | — | ||||||
| (Won) | 391,469 | (Won) | — | |||||
| Allowance for doubtful accounts |
— | |||||||
| Payables (*1) |
||||||||
| Shany Co., Ltd. |
(Won) | 167,480 | (Won) | 190,175 | ||||
| Honam Shany Co., Ltd. |
14,529 | 6,477 | ||||||
| Paris Croissant Co., Ltd. |
478,588 | 248,177 | ||||||
| Samlip General Food Co., Ltd. |
271,371 | 303,091 | ||||||
| SPC Co., Ltd. |
497,234 | 266,025 | ||||||
| Dunkin’ Brands, Inc. |
1,126,000 | 1,049,036 | ||||||
| (Won) | 2,555,202 | (Won) | 2,062,981 | |||||
| (*1) | Payables consists of trade accounts payable, accrued expenses and accounts payable—other. |
15. SHAREHOLDERS’ EQUITY:
Capital Stock
As of December 31, 2010, the Company has 3,000,000 authorized shares of common stock with a (Won)10,000 par value, of which 600,000 shares were issued and outstanding as of December 30, 2010.
Appropriated Retained Earnings
Appropriated retained earnings as of December 31, 2010 and 2009, which are maintained by the Company in accordance with tax and other relevant regulations, consist of the following:
| Korean Won (In thousands) | ||||||||
| 2010 | 2009 | |||||||
| Legal reserve (*1) |
(Won) | 3,000,000 | (Won) | 3,000,000 | ||||
| Reserve for business rationalization (*2) |
3,493,977 | 3,493,977 | ||||||
| Reserve for business development (*3) |
17,741,000 | 17,741,000 | ||||||
| (Won) | 24,234,977 | (Won) | 24,234,977 | |||||
| (*1) | The Korean Business Law requires the Company to appropriate at least 10 percent of cash dividends paid to legal reserve until such reserve equals 50 percent of its paid-in capital. This reserve is not available for cash dividends and can only be transferred to capital or can be used to reduce deficit. |
| F-86 | (Continued) |
Table of Contents
BR KOREA CO., LTD.
NOTES TO FINANCIAL STATEMENTS—(CONTINUED)
FOR THE YEARS ENDED DECEMBER 31, 2010 AND 2009
| (*2) | In accordance with the Tax Exemption and Reduction Control Law, the amount of tax benefit associated with certain tax credits are appropriated as a reserve for business rationalization. |
| (*3) | In order to obtain a tax credit on excess retained earnings’ tax, the Company previously accrued for a reserve for business development. However, as the relevant tax regulation concerning excess retained earnings’ tax was repealed in early 2002, the Company has not accrued for any additional reserve for business development since 2002. The remaining reserve can be used to offset deficit or transferred to paid-in capital. However, if this reserve is used for other purposes, the amount used is subject to additional corporate tax. |
16. DONATIONS AND MISCELLENEOUS EXPENSE
The Company donates donuts to the Food Bank on a daily basis as part of its Corporate social responsibility.
The Company recognized miscellaneous income and expense related to various types of other income offset by mainly inventory scrap expenses. Gross presentation of miscellaneous income and expense is as follows:
| Korean Won (In thousands) | ||||||||||||
| 2010 | 2009 | 2008 | ||||||||||
| Miscellaneous income |
(Won) | 864,534 | (Won) | 848,083 | (Won) | 1,365,637 | ||||||
| Miscellaneous (expense) |
(1,200,664 | ) | (2,016,819 | ) | (598,467 | ) | ||||||
| Miscellaneous, net |
(Won) | (336,130 | ) | (Won) | (1,168,736 | ) | (Won) | 7,67,170 | ||||
17. INCOME TAX EXPENSE AND DEFERRED TAXES:
(1) Income tax expense for the years ended December 31, 2010, 2009 and 2008 is as follows:
| Korean Won (In thousands) | ||||||||||||
| 2010 | 2009 | 2008 | ||||||||||
| Income tax currently payable |
(Won) | 10,800,834 | (Won) | 12,723,873 | (Won) | 12,785,153 | ||||||
| Changes in deferred income tax assets due to temporary differences: |
||||||||||||
| End of year |
1,201,484 | 987,625 | 314,525 | |||||||||
| Beginning of year |
987,625 | 314,526 | (559,490 | ) | ||||||||
| (213,859 | ) | (673,101 | ) | (874,015 | ) | |||||||
| Income tax expense |
(Won) | 10,586,975 | (Won) | 12,050,772 | (Won) | 11,911,138 | ||||||
If the amount in the actual tax return differs from the amount used for the calculation of tax expenses for financial reporting purposes above, the Company reflects such difference in the following fiscal period.
Income tax currently payable as of December 31, 2009 includes additional payment arising from a tax assessment for prior years’ corporate income taxes amounting to (Won)2,133,542 thousand.
| F-87 | (Continued) |
Table of Contents
BR KOREA CO., LTD.
NOTES TO FINANCIAL STATEMENTS—(CONTINUED)
FOR THE YEARS ENDED DECEMBER 31, 2010 AND 2009
(2) The reconciliations between income before income tax and income tax expense for the years ended December 31, 2010 and 2009 are as follows:
| Korean Won (In thousands) | ||||||||||||
| 2010 | 2009 | 2008 | ||||||||||
| Income before income tax |
(Won) | 43,999,079 | (Won) | 47,413,254 | (Won) | 44,797,781 | ||||||
| Income tax payable by statutory income tax rate |
10,623,577 | 11,449,808 | 12,288,590 | |||||||||
| Tax reconciliations: |
(377,452 | ) | ||||||||||
| Non-deductible expense |
55,479 | 193,957 | 85,310 | |||||||||
| Special tax |
9,294 | 170,405 | 112,020 | |||||||||
| Tax credit (a) |
(152,850 | ) | (1,015,551 | ) | (672,629 | ) | ||||||
| Additional payment from the tax assessment (b) |
— | 2,133,542 | — | |||||||||
| Adjustment in beginning balance of deferred tax assets from the tax assessment (b) |
— | (902,429 | ) | — | ||||||||
| Other (c) |
51,475 | 21,040 | 97,847 | |||||||||
| Income tax expense |
(Won) | 10,586,975 | (Won) | 12,050,772 | (Won) | 11,911,138 | ||||||
| Effective tax rate |
24.06% | 25.42% | 26.59% | |||||||||
| (a) | Tax credit consists of research and human resource development tax credit, temporarily investment tax credit, and other tax credits applicable under the special tax control laws of Korea. |
| (b) | Adjustment to the temporary differences arising from the prior period tax returns and the final tax assessment and the amount reported in the financial statements are included within the increase or decrease columns. |
| (c) | Other represents the effect from change in the applied corporate tax rate. |
| F-88 | (Continued) |
Table of Contents
BR KOREA CO., LTD.
NOTES TO FINANCIAL STATEMENTS—(CONTINUED)
FOR THE YEARS ENDED DECEMBER 31, 2010 AND 2009
(3) Details of changes in accumulated temporary differences for the years ended December 31, 2010 and 2009 are as follows:
| Korean Won (In thousands) | ||||||||||||||||
| 2010 | ||||||||||||||||
| Descriptions | Beginning Balance |
Decrease | Increase | Ending Balance |
||||||||||||
| Temporary differences to be deducted : |
||||||||||||||||
| Accrued severance indemnities |
(Won) | 9,611,773 | (Won) | 1,177,583 | (Won) | 5,252,798 | (Won) | 13,686,988 | ||||||||
| Foreign currency translation |
74,007 | 74,007 | 17,252 | 17,252 | ||||||||||||
| Amortization of lease premium |
304,709 | 11,364 | 132,214 | 425,559 | ||||||||||||
| Advertising |
614,883 | 434,392 | — | 180,491 | ||||||||||||
| Allowance for doubtful accounts |
— | — | 32,232 | 32,232 | ||||||||||||
| Accumulated depreciation—Structures |
3,985,468 | 511,419 | 510,001 | 3,984,050 | ||||||||||||
| Accumulated depreciation |
81,032 | 12,006 | — | 69,026 | ||||||||||||
| Total |
14,671,872 | 2,220,771 | 5,944,497 | 18,395,598 | ||||||||||||
| Tax rate (*1) |
22.0%,24.2% | 22.0%,24.2% | ||||||||||||||
| Deferred income tax assets |
3,229,440 | 4,048,120 | ||||||||||||||
| Temporary differences to be added : |
||||||||||||||||
| Severance insurance deposits |
(8,921,668 | ) | (1,177,583 | ) | (3,801,367 | ) | (11,545,452 | ) | ||||||||
| Accrued income |
(516,444 | ) | (516,444 | ) | (498,843 | ) | (498,843 | ) | ||||||||
| Lease premium |
(304,709 | ) | (11,364 | ) | (132,214 | ) | (425,559 | ) | ||||||||
| Special accumulated depreciation |
(395,604 | ) | (26,435 | ) | (50,348 | ) | (419,517 | ) | ||||||||
| Total |
(10,138,425 | ) | (1,731,826 | ) | (4,482,772 | ) | (12,889,371 | ) | ||||||||
| Tax rate |
22.0%,24.2% | 22.0%,24.2% | ||||||||||||||
| Deferred income tax liabilities |
(2,241,815 | ) | (2,846,636 | ) | ||||||||||||
| Deferred income tax assets, net |
(Won) | 987,625 | (Won) | 1,201,484 | ||||||||||||
| F-89 | (Continued) |
Table of Contents
BR KOREA CO., LTD.
NOTES TO FINANCIAL STATEMENTS—(CONTINUED)
FOR THE YEARS ENDED DECEMBER 31, 2010 AND 2009
| Korean Won (In thousands) | ||||||||||||||||
| 2009 | ||||||||||||||||
| Descriptions | Beginning Balance |
Decrease | Increase | Ending Balance |
||||||||||||
| Temporary differences to be deducted : |
||||||||||||||||
| Accrued severance indemnities |
(Won) | 8,132,534 | (Won) | 940,692 | (Won) | 2,419,932 | (Won) | 9,611,773 | ||||||||
| Foreign currency translation |
(8,532 | ) | (8,532 | ) | 74,007 | 74,007 | ||||||||||
| Amortization of lease premium |
219,782 | 64,182 | 149,109 | 304,709 | ||||||||||||
| Advertising |
683,455 | 68,572 | — | 614,883 | ||||||||||||
| Accumulated depreciation- Structures |
3,418,496 | 194,522 | 761,494 | 3,985,468 | ||||||||||||
| Accumulated depreciation |
86,086 | 9,471 | 4,417 | 81,032 | ||||||||||||
| Total |
12,531,821 | 1,268,907 | 3,408,959 | 14,671,872 | ||||||||||||
| Tax rate |
22.0%,24.2% | 22.0%,24.2% | ||||||||||||||
| Deferred income tax assets |
2,756,813 | 3,229,440 | ||||||||||||||
| Temporary differences to be added : |
||||||||||||||||
| Severance insurance deposits |
(5,651,865 | ) | (940,692 | ) | (4,210,495 | ) | (8,921,668 | ) | ||||||||
| Accrued income |
(682,464 | ) | (682,464 | ) | (516,444 | ) | (516,444 | ) | ||||||||
| Lease premium |
(219,782 | ) | (64,182 | ) | (149,109 | ) | (304,709 | ) | ||||||||
| Special accumulated depreciation |
(377,001 | ) | (32,768 | ) | (51,371 | ) | (395,604 | ) | ||||||||
| Total |
(6,931,112 | ) | (1,720,106 | ) | (4,927,419 | ) | (10,138,425 | ) | ||||||||
| Tax rate (*1) |
22.0%,24.2% | 22.0%,24.2% | ||||||||||||||
| Deferred income tax liabilities |
(1,539,859 | ) | (2,241,815 | ) | ||||||||||||
| Deferred income tax assets, net |
(Won) | 1,216,954 | (Won) | 987,625 | ||||||||||||
| (*1) | Based on tax rates announced in 2010, the tax rates expected to be applicable to the Company’s deferred tax assets and liabilities are 24.2 % in 2011 and 22% after 2012 and thereafter. |
(4) Balances of income tax payable and prepaid income tax before offsetting as of December 31, 2010 and 2009 are as follows:
| Description | Korean Won (In thousands) | |||||||
| 2010 | 2009 | |||||||
| Before offsetting |
||||||||
| Prepaid income tax |
(Won) | 4,888,309 | (Won) | 4,952,082 | ||||
| Income tax payable |
10,800,834 | 12,774,024 | ||||||
| Income tax payable after offsetting |
(Won) | 5,912,523 | (Won) | 7,821,942 | ||||
| F-90 | (Continued) |
Table of Contents
BR KOREA CO., LTD.
NOTES TO FINANCIAL STATEMENTS—(CONTINUED)
FOR THE YEARS ENDED DECEMBER 31, 2010 AND 2009
18. NET INCOME PER SHARE:
Net income per share for the years ended December 31, 2010, 2009 and 2008 are computed as follows (In thousands except per share amounts and number of shares):
| 2010 | 2009 | 2008 | ||||||||||
| Net income |
(Won) | 33,412,104 | (Won) | 35,362,482 | (Won) | 32,886,643 | ||||||
| Weighted average number of outstanding shares(*) |
600,000 | 600,000 | 600,000 | |||||||||
| Net income per share |
(Won) | 55,687 | (Won) | 58,937 | (Won) | 54,811 | ||||||
| (*) | The number of outstanding shares did not change for the years ended December 31, 2010, 2009 and 2008. |
19. DIVIDENDS:
(1) Dividends for the years December 31, 2010, 2009 and 2008 are as follows:
| Korean Won | ||||||||||||
| 2010 | 2009 | 2008 | ||||||||||
| Dividend per share |
(Won) | 16,720 | (Won) | 17,690 | (Won) | 16,480 | ||||||
| Number of shares |
600,000 | 600,000 | 600,000 | |||||||||
| Dividends |
(Won) | 10,032,000,000 | (Won) | 10,614,000,000 | (Won) | 9,888,000,000 | ||||||
(2) The calculation of dividend to net income ratio for the years ended December 31, 2010, 2009 and 2008 is as follows:
| Korean Won | ||||||||||||
| 2010 | 2009 | 2008 | ||||||||||
| Dividend |
(Won) | 10,032,000,000 | (Won) | 10,614,000,000 | (Won) | 9,888,000,000 | ||||||
| Net income |
33,412,104,480 | 35,362,481,645 | 32,886,642,641 | |||||||||
| Dividend ratio |
30.03% | 30.01% | 30.07% | |||||||||
20. SUMMARY OF INFORMATION FOR COMPUTATION OF VALUE ADDED:
The accounts and amounts needed for calculation of value added for the years ended December 31, 2010, 2009 and 2008 are as follows:
| Korean won (In thousands) | ||||||||||||
| 2010 | ||||||||||||
| SG & A expenses |
Manufacturing cost |
Total expenses |
||||||||||
| Salaries |
(Won) | 34,303,927 | (Won) | 3,543,584 | (Won) | 37,847,511 | ||||||
| Provision for severance indemnities |
6,209,530 | 485,482 | 6,695,012 | |||||||||
| Employee benefits |
5,850,725 | 795,384 | 6,646,109 | |||||||||
| Rent |
22,564,643 | 964,233 | 23,528,876 | |||||||||
| Depreciation |
11,659,293 | 7,239,873 | 18,899,166 | |||||||||
| Amortization of lease premium |
3,604,761 | — | 3,604,761 | |||||||||
| Taxes and dues |
1,736,351 | 194,801 | 1,931,152 | |||||||||
| Total |
(Won) | 85,929,230 | (Won) | 13,223,357 | (Won) | 99,152,587 | ||||||
| F-91 | (Continued) |
Table of Contents
BR KOREA CO., LTD.
NOTES TO FINANCIAL STATEMENTS—(CONTINUED)
FOR THE YEARS ENDED DECEMBER 31, 2010 AND 2009
| Korean won (In thousands) | ||||||||||||
| 2009 | ||||||||||||
| SG & A expenses |
Manufacturing cost |
Total expenses |
||||||||||
| Salaries |
(Won) | 30,876,952 | (Won) | 3,380,604 | (Won) | 34,257,556 | ||||||
| Provision for severance indemnities |
3,514,136 | 501,403 | 4,015,539 | |||||||||
| Employee benefits |
5,403,641 | 748,302 | 6,151,943 | |||||||||
| Rent |
18,163,520 | 1,042,299 | 19,205,819 | |||||||||
| Depreciation |
12,128,425 | 7,786,368 | 19,914,793 | |||||||||
| Amortization of lease premium |
3,229,923 | — | 3,229,923 | |||||||||
| Taxes and dues |
1,542,840 | 180,437 | 1,723,277 | |||||||||
| Total |
(Won) | 74,859,437 | (Won) | 13,639,413 | (Won) | 88,498,850 | ||||||
| Korean won (In thousands) | ||||||||||||
| 2008 | ||||||||||||
| SG & A expenses |
Manufacturing cost |
Total expenses |
||||||||||
| Salaries |
(Won) | 27,429,905 | (Won) | 2,953,351 | (Won) | 30,383,256 | ||||||
| Provision for severance indemnities |
3,671,679 | 390,407 | 4,062,086 | |||||||||
| Employee benefits |
5,702,784 | 678,002 | 6,380,786 | |||||||||
| Rent |
16,648,373 | 883,007 | 17,531,380 | |||||||||
| Depreciation |
11,552,897 | 3,034,196 | 14,587,093 | |||||||||
| Amortization of lease premium |
2,779,148 | — | 2,779,148 | |||||||||
| Taxes and dues |
1,667,408 | 145,664 | 1,813,072 | |||||||||
| Total |
(Won) | 69,452,194 | (Won) | 8,084,627 | (Won) | 77,536,821 | ||||||
21. SELLING, GENERAL AND ADMINISTRATIVE EXPENSES:
Selling, general and administrative expenses for the years ended December 31, 2010, 2009 and 2008 consist of the following:
| Korean Won (In thousands) | ||||||||||||
| 2010 | 2009 | 2008 | ||||||||||
| Salaries (*1) |
(Won) | 34,303,927 | (Won) | 30,876,952 | (Won) | 27,429,905 | ||||||
| Provision for severance indemnities (*1) |
6,209,531 | 3,514,136 | 3,671,679 | |||||||||
| Other salaries |
3,847,903 | 3,867,808 | 3,602,118 | |||||||||
| Employee benefits (*1) |
5,850,725 | 5,403,641 | 5,702,784 | |||||||||
| Rent (*1) |
22,564,643 | 18,163,520 | 16,648,373 | |||||||||
| Depreciation (*1) |
11,659,293 | 12,128,425 | 11,552,897 | |||||||||
| Amortization of lease premium (*1) |
3,604,760 | 3,229,923 | 2,779,148 | |||||||||
| Taxes and dues (*1) |
1,736,351 | 1,542,840 | 1,667,408 | |||||||||
| Advertising |
30,235,596 | 26,201,518 | 20,619,359 | |||||||||
| Research |
550,848 | 402,720 | 320,529 | |||||||||
| Provision for doubtful accounts |
31,982 | 21,800 | 43,845 | |||||||||
| Commission |
32,672,470 | 25,861,672 | 22,027,088 | |||||||||
| Others |
28,236,732 | 24,071,291 | 22,541,128 | |||||||||
| (Won) | 181,504,761 | (Won) | 155,286,246 | (Won) | 138,606,261 | |||||||
| F-92 | (Continued) |
Table of Contents
BR KOREA CO., LTD.
NOTES TO FINANCIAL STATEMENTS—(CONTINUED)
FOR THE YEARS ENDED DECEMBER 31, 2010 AND 2009
| (*1) | Other amounts of expenses under the same categorization are considered as manufacturing costs and recognized as Cost of Sales in the statements of income. See Note 20 for the breakout between selling, general and administrative expenses and manufacturing costs for the above categories of expenses. |
22. COMMITMENTS AND LITIGATIONS:
(1) Commitments
The Company established an import documentary letter of credit up to US $3 million with two commercial banks of Korea as of December 31, 2010. In addition, as of December 31, 2010, the Company is provided with a line of credit of (Won)10 billion under a factoring agreement with Shinhan Bank.
(2) Litigation
Seoul Metro filed two lawsuits against the Company both in relation to sublease from Seoul Express Bus & Central City (2 cases with aggregate claims of (Won)264 million). Seoul Metro is a building owner and subleased a part of the building with a rent free period to Seoul Express Bus & Central City, which subsequently subleased the property to the Company. The Company’s lease payments made to Seoul Express Bus & Central City after the end of the rent free period to the present has been deposited with the courts. The litigations are currently pending in the second round decision at the Supreme Courts. However, the Seoul Express Bus & Central City will be liable for the lease payments made by the Company if the court rules in favor of the plaintiff. Thus, the Company believes that the likelihood of loss is remote. The Company believes the outcome of the lawsuits will likely not adversely affect the Company’s financial statements and therefore no amounts for litigation uncertainties are accrued for as of December 31, 2010.
(3) Allowance for unused points
Customer loyalty programs are operated by the Company to provide customers with incentives to buy their goods and services. Under the programs, customers can earn from 1.5% ~ 5% of any purchase amount above (Won)1,000, as points to use in the future. Such points expire within one year from the date the customer earns them. As the Company’s obligation to provide such awards are in the future, any unused program points as of the period end date, are recognized as Allowance for unused points and amounts to (Won)1,428,034 thousand and (Won)2,163,071 thousand as of December 31, 2010 and 2009 respectively.
23. SEGMENT INFORMATION:
The Company has two operating divisions, ice cream and donut, in which sales are made through the Company’s distribution network consisting of stores under the Company’s direct management and under the franchise agreement.
The divisions’ sales for the years ended December 31, 2010 and 2009 are as follows:
| Korean Won (In millions) | ||||||||||||
| 2010 | 2009 | 2008 | ||||||||||
| Ice Cream |
(Won) | 209,367 | (Won) | 197,608 | (Won) | 168,792 | ||||||
| Donut |
216,696 | 208,606 | 182,876 | |||||||||
| (Won) | 426,063 | (Won) | 406,214 | (Won) | 351,668 | |||||||
| F-93 | (Continued) |
Table of Contents
BR KOREA CO., LTD.
NOTES TO FINANCIAL STATEMENTS—(CONTINUED)
FOR THE YEARS ENDED DECEMBER 31, 2010 AND 2009
24. CASH FLOW STATEMENTS:
Significant transactions not involving cash flows are as follows:
| Korean Won (In thousands) | ||||||||||||
| 2010 | 2009 | 2008 | ||||||||||
| Transfer to current assets from held-to-maturity securities |
(Won) | 5,600 | (Won) | 4,390 | (Won) | 16,945 | ||||||
| Transfer from construction in progress to buildings |
— | 11,211,800 | — | |||||||||
25. RECONCILIATION TO UNITED STATES GENERALLY ACCEPTED ACCOUNTING PRINCIPLES:
The financial statements have been prepared in accordance with accounting principles generally accepted in Korea (“Korean GAAP”), which differ in certain respects from accounting principles generally accepted in the United States of America (“U.S. GAAP”). The significant differences are described in the reconciliation tables below. Other differences do not have a significant effect on either net income or shareholders’ equity.
The effects of the significant adjustments to net income for the years ended December 31, 2010 and 2009 which would be required if U.S. GAAP were to be applied instead of Korean GAAP are summarized as follows :
| Korean Won | ||||||||||||
| (In thousands except earnings per share) | ||||||||||||
| Note reference |
2010 | 2009 | ||||||||||
| Net income based on Korean GAAP |
(Won) | 33,412,104 | (Won) | 35,362,482 | ||||||||
| Adjustments: |
||||||||||||
| Retirement and severance benefits |
25.a | 3,003,808 | 1,063,693 | |||||||||
| Compensated absences |
25.b | (116,766 | ) | (5,797 | ) | |||||||
| FIN 48 effect |
25.c | (8,766 | ) | (10,099 | ) | |||||||
| Tax effect of the reconciling items |
25.e | (632,580 | ) | (232,610 | ) | |||||||
| Net income based on U.S. GAAP |
(Won) | 35,657,800 | (Won) | 36,177,669 | ||||||||
| Weighted average number of common shares outstanding |
600,000 | 600,000 | ||||||||||
| Basic and Diluted Earnings per share based on US GAAP |
(Won) | 59,430 | (Won) | 60,296 | ||||||||
The effects of the significant adjustments to shareholders’ equity for the years ended December 31, 2010 and 2009 which would be required if U.S. GAAP were to be applied instead of Korean GAAP are summarized as follows :
| Korean Won (In thousands) | ||||||||||||
| Note reference |
2010 | 2009 | ||||||||||
| Shareholders’ equity based on Korean GAAP |
(Won) | 229,330,726 | (Won) | 206,532,622 | ||||||||
| Adjustments: |
||||||||||||
| Retirement and severance benefits |
25.a | (1,710,408 | ) | (568,374 | ) | |||||||
| Compensated absences |
25.b | (643,345 | ) | (526,579 | ) | |||||||
| FIN 48 effect |
25.c | (18,865 | ) | (10,099 | ) | |||||||
| Tax effect of the reconciling items |
25.e | 531,979 | 252,475 | |||||||||
| Shareholder’s equity based on U.S. GAAP |
(Won) | 227,490,087 | (Won) | 205,680,045 | ||||||||
| F-94 | (Continued) |
Table of Contents
BR KOREA CO., LTD.
NOTES TO FINANCIAL STATEMENTS—(CONTINUED)
FOR THE YEARS ENDED DECEMBER 31, 2010 AND 2009
a. Retirement and Severance Benefits
Under the Korean labor law, employees with more than one year of service are entitled to receive a lump sum payment upon voluntary or involuntary termination of their employment. The amount of the benefit is based on the terminated employee’s length of employment and rate of pay prior to termination. Korean GAAP requires that a company record the vested benefit obligation at the balance sheet date assuming all employees were to terminate their employment as of that date. The change in the vested benefit obligation during the year is recorded as the current year’s severance expense.
U.S. GAAP generally requires the use of actuarial methods for measuring annual employee benefit costs including the use of assumptions as to the rate of salary progression and discount rate, the amortization of prior service costs over the remaining service period of active employees and the immediate recognition of a liability when the accumulated benefit obligation exceeds the fair value of plan assets. Under U.S. GAAP, actuarial gains or losses, which result from a change in the value of either the projected benefit obligation or the plan assets resulting from experience different from that assumed or from a change in an actuarial assumption, that are not recognized as a component of net income or loss are recognized as increases or decreases to other comprehensive income, net of tax, in the period they arise. As a minimum, amortization of a net actuarial gain or loss included in accumulated other comprehensive income is included as a component of net pension cost for a year if, as of the beginning of the year, that net actuarial gain or loss exceeds 10 percent of the greater of the projected benefit obligation or the market-related value of plan assets. If amortization is required, the minimum amortization shall be that excess divided by the average remaining service period of active employees expected to receive benefits under the plan.
b. Compensated absences
Under U.S. GAAP, a liability for amounts to be paid as a result of employee’s rights to compensated absences shall be accrued in the year in which earned. Under Korean GAAP, while there is no specific provision for the accounting treatment of accruing the compensated absences, the Company accrues such liability in the following year pursuant to industry practice.
c. Income Taxes
Under U.S. GAAP, effective January 1, 2009, the Company adopted accounting guidance which clarifies the accounting guidance for uncertainties in income taxes. The guidance requires that the tax effect(s) of a position be recognized only if it is “more-likely-than-not” to be sustained based solely on its technical merits as of the reporting date. The more-likely-than-not threshold represents a positive assertion by management that a company is entitled to the economic benefits of a tax position. If a tax position is not considered more-likely-than-not to be sustained based solely on its technical merits, no benefits of the tax position are to be recognized. The more-likely-than-not threshold must continue to be met in each reporting period to support continued recognition of a benefit. With the adoption of the accounting guidance, companies are required to adjust their financial statements to reflect only those tax positions that are more-likely-than-not to be sustained. Any necessary adjustment would be recorded directly to retained earnings and reported as a change in accounting principle.
Under Korean corporation tax law, the cost of executive bonuses which is paid without related executive bonuses payment policy is not recognized as a tax deduction. The Company paid (Won)30,084 thousand in 2010
| F-95 | (Continued) |
Table of Contents
BR KOREA CO., LTD.
NOTES TO FINANCIAL STATEMENTS—(CONTINUED)
FOR THE YEARS ENDED DECEMBER 31, 2010 AND 2009
and (Won)37,939 thousand in 2009 as executive bonuses without the bonus payment policy and the income tax expenses for the years ended December 31, 2010 and 2009 increased by (Won)8,766 thousand and (Won)10,099 thousand, respectively.
d. Scope of consolidation
Under Korean GAAP, majority-owned subsidiaries with total assets below (Won)10 billion at prior year end are not consolidated. Under U.S. GAAP, a company is required to consolidate all majority-owned subsidiaries regardless of total asset size if it has control of the subsidiary. However, the reconciliation to US GAAP does not include the consolidate of a majority-owned subsidiary with total assets below (Won)10 billion as the Company believes such amounts are immaterial.
e. Tax effect of the reconciling items
The applicable statutory tax rate used to calculate the tax effect of the reconciling items on the net income reconciliation between Korean GAAP and U.S. GAAP for the years ended December 31, 2010 and 2009 was 24.2%. Such tax rates are inclusive of resident surtax of 2.2%. The following is a reconciliation of the tax effect of the reconciling items on net income:
| Korean Won (In thousands) | ||||||||
| 2010 | 2009 | |||||||
| Net income based on U.S.GAAP |
(Won) | 35,657,800 | (Won) | 36,177,669 | ||||
| Net income based on Korean GAAP |
33,412,104 | 35,362,482 | ||||||
| Total GAAP adjustments on net income |
2,245,696 | 815,187 | ||||||
| Adjustments related to tax items: |
||||||||
| FIN 48 effect |
8,766 | 10,099 | ||||||
| Tax effect of the reconciling items |
632,580 | 232,610 | ||||||
| Taxable GAAP adjustment |
2,887,042 | 1,057,896 | ||||||
| Applicable tax rate(*) |
24.2%, 22% | 24.2%, 22.0% | ||||||
| Tax effect of the reconciling items |
(Won) | 632,580 | (Won) | 232,610 | ||||
| (*) | The Company applied tax rates that are expected to apply in the period in which the liability is expected to settled, based on tax rates that have been enacted or substantively enacted by the end of the reporting period. Hence, since the adjustment in compensated absences for the year ended December 31, 2010 amounting to (Won)(116,766) thousands is expected to be settled in 2011, the Company applied 24.2% which is an enacted tax rate for fiscal year 2011. In addition, since the adjustment in retirement and severance benefits for the year ended December 31, 2010 amounting to (Won)3,003,808 thousands is expected to be settled in 2012 and thereafter, the Company applied 22.0% which is an enacted tax rate for fiscal year 2012 and thereafter. The same rule was applied to fiscal year 2009. |
| F-96 | (Continued) |
Table of Contents
BR KOREA CO., LTD.
NOTES TO FINANCIAL STATEMENTS—(CONTINUED)
FOR THE YEARS ENDED DECEMBER 31, 2010 AND 2009
The following is a reconciliation of the tax effect of the reconciling items on shareholders’ equity:
| Korean Won (In thousands) | ||||||||
| 2010 | 2009 | |||||||
| Shareholders’equity based on U.S.GAAP |
(Won) | 227,490,087 | (Won) | 205,680,045 | ||||
| Shareholders’equity based on Korean GAAP |
229,330,726 | 206,532,622 | ||||||
| Total GAAP adjustments on net income |
(1,840,639 | ) | (852,577 | ) | ||||
| Adjustments related to tax items: |
||||||||
| FIN 48 effect |
18,865 | 10,099 | ||||||
| Tax effect of the reconciling items |
(531,979 | ) | (252,475 | ) | ||||
| Taxable GAAP adjustment |
(2,353,753 | ) | (1,094,953 | ) | ||||
| Applicable tax rate (*) |
24.2%, 22.0% | 24.2%, 22.0% | ||||||
| Tax effect of the reconciling items |
(Won) | (531,979 | ) | (Won) | (252,475 | ) | ||
| (*) | The Company applied tax rates that are expected to apply in the period in which the liability is expected to be settled, based on tax rates that have been enacted or substantively enacted by the end of the reporting period. Hence, since the adjustment in compensated absences as of December 31, 2010 amounting to (Won) (643,345) thousands is expected to be settled in 2011, the Company applied 24.2% which is an enacted tax rate for fiscal year 2011. In addition, since the adjustment in retirement and severance benefits as of December 31, 2010 amounting to (Won) (1,710,408) thousands is expected to be settled in 2012 and thereafter, the Company applied 22.0% which is an enacted tax rate for fiscal year 2012 and thereafter. The same rule was applied to fiscal year 2009. |
f. Subsequent event
ASC 855 (formerly, SFAS Statement No. 165), Subsequent Events, was issued in May 2009 and is effective for interim or annual financial periods ending after June 15, 2009. ASC 855 establishes principles and requirements for subsequent events by setting forth the period after the balance sheet date during which management of a reporting entity shall evaluate events or transactions that may occur for potential recognition or disclosure in the financial statements, the circumstances under which an entity shall recognize events or transactions occurring after the balance sheet date in its financial statements, and the disclosures that an entity shall make about events or transactions that occurred after the balance sheet date. The Company has adopted ASC 855 and management has performed its evaluation of subsequent events through April 29, 2011, the date these financial statements are issued and has determined that there are no subsequent events requiring adjustment or disclosure in the financial statements.
| F-97 |
Table of Contents

Report of Independent Auditors
To the board of Directors and Shareholders of
B-R 31 ICE CREAM CO., LTD.:
In our opinion, the accompanying balance sheet and the related statement of income, changes in net assets and cash flows present fairly, in all material respects, the financial position of B-R31 ICE CREAM CO., LTD. at December 31, 2010, and the results of its operations and its cash flows for the year then ended in conformity with accounting principles generally accepted in Japan. These financial statements are the responsibility of the Company’s management. Our responsibility is to express an opinion on these financial statements based on our audit. We conducted our audit of these statements in accordance with auditing standards generally accepted in United States of America. Those standards require that we plan and perform the audit to obtain reasonable assurance about whether the financial statements are free of material misstatement. An audit includes examining, on a test basis, evidence supporting the amounts and disclosures in the financial statements, assessing the accounting principles used and significant estimates made by management, and evaluating the overall financial statement presentation. We believe that our audit provide a reasonable basis for our opinion.
Accounting principles generally accepted in Japan vary in certain significant respects from accounting principles generally accepted in the United States of America. Information relating to the nature and effect of such differences is presented in Note 18 to the financial statements.
/s/ PricewaterhouseCoopers Aarata
Tokyo, Japan
April 29, 2011
F-98
Table of Contents
Balance Sheets
(In thousands)
| December 31, 2010 |
(Not covered by Auditors’ Report) December 31, 2009 |
|||||||
| Assets |
||||||||
| Current assets: |
||||||||
| Cash and cash equivalents |
¥ | 3,912,939 | ¥ | 3,233,199 | ||||
| Accounts receivable-trade |
2,797,245 | 2,434,001 | ||||||
| Finished products |
528,830 | 365,758 | ||||||
| Raw materials |
254,757 | 244,487 | ||||||
| Supplies |
200,306 | 125,914 | ||||||
| Advance payments |
56,987 | 113,307 | ||||||
| Prepaid expenses |
82,720 | 69,513 | ||||||
| Deferred tax assets |
131,590 | 95,643 | ||||||
| Accounts receivable-other |
20,038 | 24,408 | ||||||
| Other current assets |
19,689 | 35,678 | ||||||
| Allowance for doubtful accounts |
(23,873 | ) | (19,169 | ) | ||||
| Total current assets |
7,981,228 | 6,722,739 | ||||||
| Non-current assets: |
||||||||
| Tangible fixed assets |
||||||||
| Buildings |
1,495,756 | 1,492,807 | ||||||
| Accumulated depreciation |
(1,057,432 | ) | (1,045,581 | ) | ||||
| Buildings, net |
438,324 | 447,226 | ||||||
| Structures |
195,248 | 195,248 | ||||||
| Accumulated depreciation |
(154,183 | ) | (151,395 | ) | ||||
| Structures, net |
41,065 | 43,853 | ||||||
| Machinery and equipment |
2,042,838 | 1,939,585 | ||||||
| Accumulated depreciation |
(1,578,672 | ) | (1,520,706 | ) | ||||
| Machinery and equipment, net |
464,166 | 418,879 | ||||||
| Store leasehold improvements |
2,612,281 | 2,382,675 | ||||||
| Accumulated depreciation |
(1,397,189 | ) | (1,293,535 | ) | ||||
| Store leasehold improvements, net |
1,215,092 | 1,089,140 | ||||||
| Retail store equipment |
188,127 | 173,601 | ||||||
| Accumulated depreciation |
(60,558 | ) | (40,936 | ) | ||||
| Retail store equipment, net |
127,569 | 132,665 | ||||||
| Vehicles and transportation equipment |
18,627 | 18,627 | ||||||
| Accumulated depreciation |
(16,544 | ) | (15,405 | ) | ||||
| Vehicles and transportation equipment, net |
2,083 | 3,222 | ||||||
| Tools, furniture and fixtures |
582,697 | 540,933 | ||||||
| Accumulated depreciation |
(388,598 | ) | (325,441 | ) | ||||
| Tools, furniture and fixtures, net |
194,099 | 215,492 | ||||||
| Land |
226,363 | 226,363 | ||||||
| Construction in progress |
117,682 | 2,148 | ||||||
| Total tangible fixed assets |
2,826,443 | 2,578,988 | ||||||
| Intangible assets |
||||||||
| Software |
216,138 | 315,154 | ||||||
| Telephone subscription rights |
17,065 | 17,065 | ||||||
| Total intangible assets |
233,203 | 332,219 | ||||||
| Investments and other assets |
||||||||
| Investment securities |
25,672 | 20,766 | ||||||
| Loans receivable |
11,206 | 22,330 | ||||||
| Loans receivable from employees |
20,000 | 22,005 | ||||||
| Other receivables |
117,449 | 128,986 | ||||||
| Prepaid expenses |
517,068 | 514,946 | ||||||
| Deferred tax assets |
116,808 | 138,171 | ||||||
| Lease deposits |
1,943,612 | 1,802,716 | ||||||
| Other non-current assets |
19,685 | 3,220 | ||||||
| Allowance for doubtful accounts |
(83,933 | ) | (94,289 | ) | ||||
| Investments and other assets |
2,687,567 | 2,558,851 | ||||||
| Total non-current assets |
5,747,213 | 5,470,058 | ||||||
| Total assets |
¥ | 13,728,441 | ¥ | 12,192,797 | ||||
F-99
Table of Contents
B-R 31 ICE CREAM CO., LTD.
Balance Sheets (Continued)
(In thousands)
| December 31, 2010 |
(Not covered by Auditors’ Report) December 31, 2009 |
|||||||
| Liabilities and Net assets |
||||||||
| Current liabilities: |
||||||||
| Accounts payable-trade |
¥ | 494,760 | ¥ | 494,143 | ||||
| Accounts payable-other |
1,226,993 | 1,015,360 | ||||||
| Accrued expenses |
25,427 | 23,579 | ||||||
| Provision for income taxes |
812,790 | 640,381 | ||||||
| Accrued consumption taxes |
41,718 | 80,085 | ||||||
| Gift card liability |
295,528 | 255,538 | ||||||
| Deposits received |
139,794 | 93,694 | ||||||
| Employees’ bonuses |
34,352 | 30,168 | ||||||
| Directors’ bonuses |
17,000 | 14,000 | ||||||
| Other current liabilities |
83,404 | 27,126 | ||||||
| Total current liabilities |
3,171,766 | 2,674,074 | ||||||
| Non-current liabilities: |
||||||||
| Employees’ retirement benefits |
132,108 | 119,600 | ||||||
| Directors’ retirement benefits |
54,000 | 43,900 | ||||||
| Long-term deposits received |
1,009,692 | 899,686 | ||||||
| Total non-current liabilities |
1,195,800 | 1,063,186 | ||||||
| Total liabilities |
4,367,566 | 3,737,260 | ||||||
| Net Assets: |
||||||||
| Stockholders’ equity: |
||||||||
| Common stock |
735,286 | 735,286 | ||||||
| Capital surplus |
||||||||
| Legal capital surplus |
241,079 | 241,079 | ||||||
| Total capital surplus |
241,079 | 241,079 | ||||||
| Retained earnings |
||||||||
| Legal reserve |
168,677 | 168,677 | ||||||
| Other |
||||||||
| Other reserves |
4,140,000 | 4,140,000 | ||||||
| Retained earnings |
4,122,041 | 3,192,893 | ||||||
| Total retained earnings |
8,430,718 | 7,501,570 | ||||||
| Treasury stock |
(16,793 | ) | (16,793 | ) | ||||
| Total stockholders’ equity |
9,390,290 | 8,461,142 | ||||||
| Valuation and translation adjustments: |
||||||||
| Net unrealized gains (losses) on available-for-sale securities, net of tax |
1,144 | (229 | ) | |||||
| Net gains (losses) on deferred hedges, net of tax |
(30,559 | ) | (5,376 | ) | ||||
| Total valuation and translation adjustments |
(29,415 | ) | (5,605 | ) | ||||
| Total net assets |
9,360,875 | 8,455,537 | ||||||
| Total liabilities and net assets |
¥ | 13,728,441 | ¥ | 12,192,797 | ||||
See accompanying notes to financial statements.
F-100
Table of Contents
Statements of Income
(In thousands)
| Year ended December 31, 2010 |
(Not covered by Auditors’ Report) Year ended December 31, 2009 |
(Not covered by Auditors’ Report) Year ended December 31, 2008 |
||||||||||
| Revenues: |
||||||||||||
| Sales of finished products |
¥ | 14,696,644 | ¥ | 12,939,121 | ¥ | 11,438,062 | ||||||
| Royalty income |
3,150,990 | 2,826,902 | 2,578,475 | |||||||||
| Rental income of store equipment |
930,737 | 893,773 | 843,316 | |||||||||
| Total revenues |
18,778,371 | 16,659,796 | 14,859,853 | |||||||||
| Cost of sales: |
||||||||||||
| Finished products at the beginning of the year |
365,758 | 367,260 | 296,507 | |||||||||
| Cost of products manufactured during the year |
7,006,948 | 6,135,411 | 5,688,374 | |||||||||
| Total |
7,372,706 | 6,502,671 | 5,984,881 | |||||||||
| Transfers to other accounts |
(45,364 | ) | (32,440 | ) | (48,204 | ) | ||||||
| Finished products at the end of the year |
(528,830 | ) | (365,758 | ) | (367,260 | ) | ||||||
| Cost of finished products sold |
6,798,512 | 6,104,473 | 5,569,417 | |||||||||
| Cost of store equipment |
439,665 | 422,465 | 421,348 | |||||||||
| Total cost of sales |
7,238,177 | 6,526,938 | 5,990,765 | |||||||||
| Gross profit |
11,540,194 | 10,132,858 | 8,869,088 | |||||||||
| Selling, general and administrative expenses: |
||||||||||||
| Delivery and storage charges |
1,255,453 | 1,125,538 | 1,049,239 | |||||||||
| Advertising expenses |
2,306,586 | 2,099,743 | 1,949,924 | |||||||||
| Royalties |
184,387 | 163,255 | 141,650 | |||||||||
| Rental expenses |
352,524 | 363,083 | 288,427 | |||||||||
| Salaries, allowances and bonuses |
980,201 | 905,626 | 796,477 | |||||||||
| Provision for bonuses |
28,966 | 25,418 | 62,931 | |||||||||
| Employees’ retirement benefits |
59,880 | 55,094 | 47,092 | |||||||||
| Directors’ retirement benefits |
10,100 | 10,100 | 22,100 | |||||||||
| Other wages |
187,517 | 163,264 | 144,967 | |||||||||
| Sales promotion expenses |
673,778 | 573,540 | 494,141 | |||||||||
| Franchise general expenses |
490,461 | — | — | |||||||||
| Depreciation |
562,282 | 586,890 | 460,226 | |||||||||
| Inventory write-off |
— | 31,293 | — | |||||||||
| Other |
1,551,556 | 1,692,952 | 1,538,155 | |||||||||
| Total selling, general and administrative expenses |
8,643,691 | 7,795,796 | 6,995,329 | |||||||||
| Operating income |
2,896,503 | 2,337,062 | 1,873,759 | |||||||||
| Non-operating income: |
||||||||||||
| Interest income |
1,082 | 1,549 | 1,535 | |||||||||
| Gain on sales of fixed assets |
45,342 | 33,897 | 39,566 | |||||||||
| Gain on unused gift card |
15,208 | 15,595 | 11,868 | |||||||||
| Other |
6,339 | 8,493 | 15,436 | |||||||||
| Total non-operating income |
67,971 | 59,534 | 68,405 | |||||||||
| Non-operating expenses: |
||||||||||||
| Inventory write-off |
— | — | 30,179 | |||||||||
| Loss on disposals of fixed assets |
20,710 | 19,900 | 22,390 | |||||||||
| Other |
2,654 | 803 | 5,240 | |||||||||
| Total non-operating expenses |
23,364 | 20,703 | 57,809 | |||||||||
| Ordinary income |
2,941,110 | 2,375,893 | 1,884,355 | |||||||||
| Extraordinary gains: |
||||||||||||
| Gain on reversal of allowance for doubtful accounts |
5,249 | — | — | |||||||||
| Compensation on lease termination |
20,029 | — | — | |||||||||
| Refund of consumption taxes |
4,203 | — | — | |||||||||
| Other |
1,154 | — | — | |||||||||
| Total extraordinary income |
30,635 | — | — | |||||||||
| Extraordinary losses : |
||||||||||||
| Loss on disposals of other fixed assets |
24,137 | 34,720 | 38,246 | |||||||||
| Total extraordinary losses |
24,137 | 34,720 | 38,246 | |||||||||
| Income before income taxes |
2,947,608 | 2,341,173 | 1,846,109 | |||||||||
| Income taxes-current |
1,294,000 | 1,048,000 | 808,060 | |||||||||
| Income taxes-deferred |
1,758 | (14,127 | ) | (21,844 | ) | |||||||
| Total income taxes |
1,295,758 | 1,033,873 | 786,216 | |||||||||
| Net income |
¥ | 1,651,850 | ¥ | 1,307,300 | ¥ | 1,059,893 | ||||||
See accompanying notes to financial statements.
F-101
Table of Contents
Statements of Changes in Net Assets
(In thousands)
| December 31, 2010 |
(Not covered by Auditors’ report) December 31, 2009 |
(Not covered by Auditors’ report) December 31, 2008 |
||||||||||
| Shareholders’ equity |
||||||||||||
| Common stock |
||||||||||||
| Balance at the beginning of the year |
¥ | 735,286 | 735,286 | 735,286 | ||||||||
| Changes during the year |
||||||||||||
| Total changes during the year |
— | — | — | |||||||||
| Balance at the end of the year |
735,286 | 735,286 | 735,286 | |||||||||
| Capital surplus |
||||||||||||
| Legal capital surplus |
||||||||||||
| Balance at the beginning of the year |
241,079 | 241,079 | 241,079 | |||||||||
| Changes during the year |
||||||||||||
| Total changes during the year |
— | — | — | |||||||||
| Balance at the end of the year |
241,079 | 241,079 | 241,079 | |||||||||
| Total capital surplus |
||||||||||||
| Balance at the beginning of the year |
241,079 | 241,079 | 241,079 | |||||||||
| Changes during the year |
||||||||||||
| Total changes during the year |
— | — | — | |||||||||
| Balance at the end of the year |
241,079 | 241,079 | 241,079 | |||||||||
| Retained earnings |
||||||||||||
| Legal Reserve |
||||||||||||
| Balance at the beginning of the year |
168,677 | 168,677 | 168,677 | |||||||||
| Changes during the year |
||||||||||||
| Total changes during the year |
— | — | — | |||||||||
| Balance at the end of the year |
168,677 | 168,677 | 168,677 | |||||||||
| Other retained earnings |
||||||||||||
| Reserve for special depreciation |
||||||||||||
| Balance at the beginning of the year |
— | — | 223 | |||||||||
| Changes during the year |
||||||||||||
| Reversal of reserve for special depreciation |
— | — | (223 | ) | ||||||||
| Total changes during the year |
— | — | (223 | ) | ||||||||
| Balance at the end of the year |
— | — | — | |||||||||
| General reserves |
||||||||||||
| Balance at the beginning of the year |
4,140,000 | 4,140,000 | 4,140,000 | |||||||||
| Changes during the year |
||||||||||||
| Total changes during the year |
— | — | — | |||||||||
| Balance at the end of the year |
4,140,000 | 4,140,000 | 4,140,000 | |||||||||
| Retained earnings brought forward |
||||||||||||
| Balance at the beginning of the year |
3,192,893 | 2,463,754 | 2,078,160 | |||||||||
| Changes during the year |
||||||||||||
| Reversal of reserve for special depreciation |
— | — | 223 | |||||||||
| Dividends |
(722,702 | ) | (578,161 | ) | (674,522 | ) | ||||||
| Net income |
1,651,850 | 1,307,300 | 1,059,893 | |||||||||
| Total changes during the year |
929,148 | 729,139 | 385,594 | |||||||||
| Balance at the end of the year |
4,122,041 | 3,192,893 | 2,463,754 | |||||||||
| Total retained earnings |
||||||||||||
| Balance at the beginning of the year |
7,501,570 | 6,772,431 | 6,387,060 | |||||||||
| Changes during the year |
||||||||||||
| Dividends |
(722,702 | ) | (578,161 | ) | (674,522 | ) | ||||||
| Net income |
1,651,850 | 1,307,300 | 1,059,893 | |||||||||
| Total changes during the year |
929,148 | 729,139 | 385,371 | |||||||||
| Balance at the end of the year |
8,430,718 | 7,501,570 | 6,772,431 | |||||||||
F-102
Table of Contents
B-R 31 ICE CREAM CO., LTD.
Statements of Changes in Net Assets (Continued)
(In thousands)
| December 31, 2010 |
(Not covered by Auditors’ report) December 31, 2009 |
(Not covered by Auditors’ report) December 31, 2008 |
||||||||||
| Treasury stock |
||||||||||||
| Balance at the beginning of the year |
(16,793 | ) | (16,793 | ) | (16,793 | ) | ||||||
| Changes during the year |
||||||||||||
| Total changes during the year |
— | — | — | |||||||||
| Balance at the end of the year |
(16,793 | ) | (16,793 | ) | (16,793 | ) | ||||||
| Total shareholders’ equity |
||||||||||||
| Balance at the beginning of the year |
8,461,142 | 7,732,003 | 7,346,632 | |||||||||
| Changes during the year |
||||||||||||
| Dividends |
(722,702 | ) | (578,161 | ) | (674,522 | ) | ||||||
| Net income |
1,651,850 | 1,307,300 | 1,059,893 | |||||||||
| Total changes during the year |
929,148 | 729,139 | 385,371 | |||||||||
| Balance at the end of the year |
9,390,290 | 8,461,142 | 7,732,003 | |||||||||
| Valuation and translation adjustments |
||||||||||||
| Net unrealized gains(losses) on available-for-sale securities, net of tax |
||||||||||||
| Balance at the beginning of the year |
(229 | ) | 834 | 1,448 | ||||||||
| Changes during the year |
||||||||||||
| Net changes of items other than shareholders’ equity |
1,373 | (1,063 | ) | (614 | ) | |||||||
| Total changes during the year |
1,373 | (1,063 | ) | (614 | ) | |||||||
| Balance at the end of the year |
1,144 | (229 | ) | 834 | ||||||||
| Deferred gains or losses on hedges |
||||||||||||
| Balance at the beginning of the year |
(5,376 | ) | (34,949 | ) | 19,504 | |||||||
| Changes during the year |
||||||||||||
| Net changes of items other than shareholders’ equity |
(25,183 | ) | 29,573 | (54,453 | ) | |||||||
| Total changes during the year |
(25,183 | ) | 29,573 | (54,453 | ) | |||||||
| Balance at the end of the year |
(30,559 | ) | (5,376 | ) | (34,949 | ) | ||||||
| Total valuation and translation adjustments |
||||||||||||
| Balance at the beginning of the year |
(5,605 | ) | (34,115 | ) | 20,952 | |||||||
| Changes during the year |
||||||||||||
| Net changes of items other than shareholders’ equity |
(23,810 | ) | 28,510 | (55,067 | ) | |||||||
| Total changes during the year |
(23,810 | ) | 28,510 | (55,067 | ) | |||||||
| Balance at the end of the year |
(29,415 | ) | (5,605 | ) | (34,115 | ) | ||||||
| Total net asset |
||||||||||||
| Balance at the beginning of the year |
8,455,537 | 7,697,888 | 7,367,584 | |||||||||
| Changes during the year |
||||||||||||
| Dividends |
(722,702 | ) | (578,161 | ) | (674,522 | ) | ||||||
| Net income |
1,651,850 | 1,307,300 | 1,059,893 | |||||||||
| Net changes of items other than shareholders’ equity |
(23,810 | ) | 28,510 | (55,067 | ) | |||||||
| Total changes during the year |
905,338 | 757,649 | 330,304 | |||||||||
| Balance at the end of the year |
¥ | 9,360,875 | 8,455,537 | 7,697,888 | ||||||||
See accompanying notes to financial statements.
F-103
Table of Contents
Statements of Cash Flows
(In thousands)
| Fiscal year ended | ||||||||||||
| December 31, 2010 |
(Not covered by Auditors’ Report) December 31, 2009 |
(Not covered by Auditors’ Report) December 31, 2008 |
||||||||||
| Cash flows from operating activities |
||||||||||||
| Income before income taxes |
¥ | 2,947,608 | ¥ | 2,341,173 | ¥ | 1,846,109 | ||||||
| Adjustments to reconcile income before income taxes to net cash provided by operating activities: |
||||||||||||
| Depreciation and amortization |
953,594 | 942,221 | 746,526 | |||||||||
| Compensation on lease termination |
(20,029 | ) | — | — | ||||||||
| Refund of consumption taxes |
(4,203 | ) | — | — | ||||||||
| Loss on disposals of fixed assets |
20,710 | 19,900 | 22,390 | |||||||||
| Loss on devaluation of supplies |
— | 31,293 | 30,179 | |||||||||
| Loss on disposals of other fixed assets |
24,137 | 34,720 | 38,246 | |||||||||
| Increase (decrease) in allowance for doubtful accounts |
(5,651 | ) | 27,714 | 37,008 | ||||||||
| Increase (decrease) in provision for bonuses |
4,183 | (43,356 | ) | 2,049 | ||||||||
| Increase (decrease) in provision for retirement benefits |
12,508 | 19,723 | 5,545 | |||||||||
| Increase (decrease) in provision for directors’ retirement benefits |
10,100 | (67,400 | ) | 22,100 | ||||||||
| Interest income |
(1,081 | ) | (1,549 | ) | (1,535 | ) | ||||||
| Decrease (increase) in accounts receivable-trade |
(363,244 | ) | (27,226 | ) | (291,724 | ) | ||||||
| Decrease (increase) in other receivables |
11,537 | (59,825 | ) | — | ||||||||
| Decrease (increase) in inventories |
(242,658 | ) | (5,198 | ) | 46,834 | |||||||
| Increase (decrease) in accounts payable-trade |
617 | 10,961 | 20,749 | |||||||||
| Decrease (increase) in advance payments |
48,291 | — | (50,600 | ) | ||||||||
| Decrease (increase) in prepaid expenses |
(13,206 | ) | — | — | ||||||||
| Increase (decrease) in accounts payable |
132,622 | 97,468 | 114,723 | |||||||||
| Increase (decrease) in gift card liability |
39,991 | — | 93,542 | |||||||||
| Increase (decrease) in provision for directors’ bonuses |
3,000 | 4,000 | (2,000 | ) | ||||||||
| Increase (decrease) in deposits received |
46,099 | — | — | |||||||||
| Increase (decrease) in accrued consumption taxes |
(38,366 | ) | 50,124 | — | ||||||||
| Payments for officers’ bonuses |
— | — | (12,000 | ) | ||||||||
| Other |
(844 | ) | (20,869 | ) | (44,338 | ) | ||||||
| Subtotal |
3,565,715 | 3,353,874 | 2,623,803 | |||||||||
| Interest and dividends income |
1,289 | 1,731 | 1,702 | |||||||||
| Proceeds from compensation on lease termination |
20,029 | — | — | |||||||||
| Income taxes paid |
(1,159,831 | ) | (871,402 | ) | (831,213 | ) | ||||||
| Net cash provided by operating activities |
2,427,202 | 2,484,203 | 1,794,292 | |||||||||
| Cash flows from investing activities: |
||||||||||||
| Payments for investments in securities |
(2,590 | ) | (2,562 | ) | (2,551 | ) | ||||||
| Payments for tangible fixed assets |
(626,402 | ) | (431,877 | ) | (558,551 | ) | ||||||
| Proceeds from sales of tangible fixed assets |
16,777 | — | — | |||||||||
| Payments for intangible fixed assets |
(29,269 | ) | (112,953 | ) | (147,084 | ) | ||||||
| Payments for long-term prepaid expenses |
(370,929 | ) | (306,154 | ) | (285,330 | ) | ||||||
| Payments for lease deposits |
(200,990 | ) | (113,025 | ) | (222,066 | ) | ||||||
| Proceeds from lease deposits |
31,273 | 21,791 | 26,312 | |||||||||
| Proceeds from loans receivable |
9,889 | 15,065 | 14,994 | |||||||||
| Proceeds from long-term deposits |
135,713 | 110,012 | 114,412 | |||||||||
| Other |
(9,670 | ) | (33,849 | ) | (66,265 | ) | ||||||
| Net cash used in investing activities |
(1,046,198 | ) | (853,552 | ) | (1,126,129 | ) | ||||||
| Cash flows from financing activities |
||||||||||||
| Cash dividends paid |
(701,264 | ) | (577,468 | ) | (673,287 | ) | ||||||
| Net cash used in financing activities |
(701,264 | ) | (577,468 | ) | (673,287 | ) | ||||||
| Net (decrease) increase in cash and cash equivalents |
679,740 | 1,053,183 | (5,124 | ) | ||||||||
| Cash and cash equivalents, beginning of year |
3,233,199 | 2,180,016 | 2,185,140 | |||||||||
| Cash and cash equivalents, end of year |
¥ | 3,912,939 | ¥ | 3,233,199 | ¥ | 2,180,016 | ||||||
See accompanying notes to financial statements.
F-104
Table of Contents
Notes to the Financial Statements
Years ended December 31, 2010, 2009 and 2008
(Information as of December 31, 2009 and 2008 and for the years ended December 31, 2009 and
2008, not covered by Auditors’ report included herein)
(1) Organization and Description of Business
B-R 31 Ice Cream Co., Ltd. (the “Company”) was incorporated in 1978 under the laws of Japan. The Company is engaged in the manufacture and sale of ice cream products mainly through franchise stores under the Baskin-Robbins brand.
(2) Summary of Significant Accounting Policies
(a) Financial Statements Basis and Presentation
The accompanying financial statements have been prepared in conformity with accounting principles generally accepted in Japan (“Japanese GAAP”). Japanese GAAP vary in certain significant respects from accounting principles generally accepted in the United States of America (“US GAAP”). Information relating to the nature and effect of such differences is presented in Note 18 to the financial statements.
In preparing these financial statements, certain reclassifications and rearrangements, including additions of narrative footnote disclosures, have been made to the financial statements issued domestically in order to present them in a form which is more familiar to readers outside Japan. The financial statements are stated in Japanese yen.
The accompanying financial statements as of December 31, 2010 and 2009 and for the years ended December 31, 2010, 2009 and 2008 have been prepared on the assumption that the Company is a going concern.
(b) Cash and Cash Equivalents
Cash and cash equivalents is comprised of cash on hand, bank deposits on demand, and highly liquid short-term investments, generally with original maturities of three months or less, that are readily convertible to cash for which risk of changes in value is insignificant.
(c) Inventories
Inventories consist of finished products, raw materials and supplies. Supplies consist of stand-by store equipment and advertising goods.
Until December 31, 2008, inventories were stated at acquisition cost, principally determined by the first-in, first-out method. Effective for fiscal year 2009, inventories are stated at the lower of acquisition cost or net selling value. Cost is principally determined by the first-in, first-out method, except for stand-by store equipment which is determined by the specific identification method.
In July 2006, the Accounting Standard Board of Japan (“ASBJ”) issued ASBJ Statement No. 9 “Accounting Standard for Measurement of Inventories”. This Standard requires that inventories held for sale in the ordinary course of business be measured at the lower of cost or net selling value, which is defined as the selling price less additional estimated manufacturing costs and estimated direct selling expenses. The replacement cost may be used in place of the net selling value, if appropriate.
| F-105 | (Continued) |
Table of Contents
B-R 31 Ice Cream Co., Ltd.
Notes to the Financial Statements—(Continued)
Years ended December 31, 2010, 2009 and 2008
(Information as of December 31, 2009 and 2008 and for the years ended December 31, 2009 and
2008, not covered by Auditors’ report included herein)
The standard was effective for fiscal years beginning on or after April 1, 2008. The adoption of ASBJ Statement No.9 did not have an impact on the Company’s financial position and results of operations.
(d) Tangible Fixed Assets
Tangible fixed assets are stated at cost. Depreciation is computed by using the straight-line method over the estimated useful life of the corresponding asset. Estimated useful lives for major assets are as follows:
Buildings: 15—35 years
Machinery and equipment: 9 years
Store leasehold improvements: 6—10 years
Through December 31, 2007, the Company used the double-declining method to depreciate tangible fixed assets (excluding buildings other than the accompanying facilities, that were acquired on and after April 1, 1998). Effective for fiscal year 2008, the straight-line method was applied prospectively for all tangible fixed assets.
The declining-balance method was applied to accelerate depreciation in light of the following:
| (i) | uncertainties surrounding expected production levels and revenues in future periods and |
| (ii) | expected accelerated economic obsolescence of tangible fixed assets primarily due to technological obsolescence. |
In fiscal year 2007, the Company re-assessed the application of the reasonableness of the double-declining depreciation method when developing its mid-term business plan and concluded that the straight-line method more appropriately reflects the Company’s use of its fixed tangible assets, and the change would be applied prospectively effective fiscal year 2008.
As a result of this change, for fiscal year 2008 depreciation expenses decreased by ¥272,058 thousand while gross profit increased by ¥43,598 thousand and operating income, ordinary income, and income before income taxes increased by ¥272,058 thousand, comparing to the previous depreciation method.
(e) Leased Assets
In March 2007, the ASBJ issued ASBJ No.13 “Revised Accounting Standard for Lease Transactions” and ASBJ Guidance No.16 “Revised Implementation Guidance on Accounting Standard for Lease Transactions”. The new standard and related implementation guidance eliminated a transitional rule where companies were allowed to account for finance leases that do not transfer ownership of the leased property to the lessee as operating lease transactions and instead required that such transactions be recorded as finance leases on the balance sheet effective for fiscal years beginning on or after April 1, 2008. In accordance with this new standard, starting fiscal year 2009 the Company capitalized all finance leases on its balance sheet and depreciates the lease assets using the straight-line method, assuming a residual value of zero, over the lease term. However, finance leases that do not transfer ownership which were entered into before December 31, 2008 are accounted for as operating leases with required disclosures in footnotes.
| F-106 | (Continued) |
Table of Contents
B-R 31 Ice Cream Co., Ltd.
Notes to the Financial Statements—(Continued)
Years ended December 31, 2010, 2009 and 2008
(Information as of December 31, 2009 and 2008 and for the years ended December 31, 2009 and
2008, not covered by Auditors’ report included herein)
The effect of the change did not have a material impact on operating income, ordinary income, and income before income taxes for fiscal year 2009.
(f) Software for Internal Use
Software for internal use is stated at cost. Depreciation is computed using the straight-line method over an estimated useful life of 5 years.
(g) Long-term Prepaid Expenses
Long-term prepaid expenses mainly consist of store signage used for advertising purposes. These assets are depreciated using the straight-line method.
(h) Investment Securities
| i) | Marketable available-for-sale securities |
Marketable available-for-sale securities are stated at fair value, primarily based on market prices at the balance sheet date. Unrealized gains or losses, net of applicable taxes, are recorded as a component in “Net Assets”. Cost of marketable securities sold is determined using the moving-average cost method.
| ii) | Non-marketable available-for-sale securities |
Non-marketable available-for-sale securities are stated at cost. Cost of non-marketable securities sold is determined using the moving-average cost method.
(i) Derivatives and hedges
Derivatives are carried at fair value. The Company utilizes derivative instruments to reduce its exposures to the fluctuations in foreign currency exchange rate associated with purchases denominated in foreign currencies. The Company enters into foreign exchange forward contracts on forecasted import transactions, mainly for the purchase of raw materials.
The Company applies hedge accounting to account for its foreign exchange forward contracts because of high correlation and effectiveness. The Company does not perform a detailed effectiveness test as all of foreign currency forward transactions are based on forecasted transactions which are probable, and variability of the hedged items and hedging instruments is perfectly matched during the period that the hedges is designated.
Gains and losses on hedging instruments are deferred until maturity of the hedged transactions.
(j) Allowance for Doubtful Accounts
The Company records an allowance for doubtful accounts on accounts receivable to cover probable credit losses, based on specific cases and past write-off experience.
| F-107 | (Continued) |
Table of Contents
B-R 31 Ice Cream Co., Ltd.
Notes to the Financial Statements—(Continued)
Years ended December 31, 2010, 2009 and 2008
(Information as of December 31, 2009 and 2008 and for the years ended December 31, 2009 and
2008, not covered by Auditors’ report included herein)
(k) Employees’ Bonuses
Employees’ bonuses are accrued at the end of the year to which such bonuses are attributable.
During fiscal year 2009, the Company changed its bonus payment policy. The periods for which bonus payments relates were changed as follow:
| Summer bonus | Winter bonus | |||
| Until fiscal year 2008 |
Previous year October through March | April through September | ||
| Effective fiscal year 2009 |
January through June | July through December | ||
Furthermore, under the new policy, approximately 80% of annual bonuses are paid in June and December and the remaining portion is paid in February in the following fiscal year. The change in policy did not have any impact to results of operations.
(l) Directors’ Bonuses
Directors’ bonuses are accrued at the end of the year to which such bonuses are attributable.
(m) Employees’ Retirement Benefits
The Company accounts for a pension liability based on the pension obligations and the fair value of the plan assets at the balance sheet date. Pension benefit obligations are determined to be the total amount payable if all eligible employees voluntarily retired at the balance sheet date less the amounts that the Company would be entitled to under the “Gaishoku Sangyo JF Fund” to pay such obligations. See Note 7. Plan assets in the Company’s cash balance fund are stated at fair value.
(n) Directors’ Retirement Benefits
The Company records a liability for directors’ retirement benefits which is determined to be the total amount payable if all directors retired at the balance sheet date.
(o) Consumption Taxes
Consumption tax and local consumption tax on goods and services paid or collected are not included in revenue or expense accounts subject to such taxes in the accompanying statements of income.
(3) Changes in Presentations
The Company made the following changes in presentation. Prior year financial statements are not reclassified to conform to the current presentation.
| F-108 | (Continued) |
Table of Contents
B-R 31 Ice Cream Co., Ltd.
Notes to the Financial Statements—(Continued)
Years ended December 31, 2010, 2009 and 2008
(Information as of December 31, 2009 and 2008 and for the years ended December 31, 2009 and
2008, not covered by Auditors’ report included herein)
(a) Statement of Income
For the years ended December 31, 2009 and 2008, franchise general expenses were included in “Other” within selling, general and administrative expenses. Due to materiality for the year ended December 31, 2010, franchise general expenses were presented as a separate line item within selling, general and administrative expenses. Such expense amounted to ¥237,370 thousand for the year ended December 31, 2009.
For the year ended December 31,2009 inventory write-off was presented in a separate line item within selling, general and administrative expenses . For the year ended December 31, 2010 inventory write-off of ¥1,868 thousand is included in advertising expenses in selling, general and administrative expenses.
(b) Statements of Cash Flows
For the year ended December 31, 2008 increase or decrease in allowance for other receivables was included in increase or decrease in accounts receivable-trade. Due to materiality for the year ended December 31, 2009, it is presented as a separate line item in “Cash flows from operating activities”. Increase in allowance for other receivables amounted to ¥6,539 thousand for the year ended December 31, 2008.
Increase or decrease in advance payments and advances received was presented as a separate line item in “Cash flows from operating activities” for the year ended December 31, 2008. Due to materiality for the year ended December 31, 2009, it is included in “Other” within “Cash flows from operating activities” . Decrease in advance payments and gift card liability amounted to ¥910 thousand and ¥8,974 thousand, respectively, for the year ended December 31, 2009.
For the year ended December 31, 2008 increase or decrease in accrued consumption taxes was included in “Other” within “Cash flows from operating activities”. Due to materiality for the year ended December 31, 2009, it is separately presented as a line item. Decrease in accrued consumption taxes amounted to ¥3,885 thousand for the year ended December 31, 2008.
For the years ended December 31, 2009 and 2008, inventory write-off was presented as a separate line item in “Cash flows from operating activities”. For the year ended December 31, 2010, inventory write-off of ¥1,868 thousand is included in “Other” of “Cash flows from operating activities”.
For the years ended December 31, 2009 and 2008, increase or decrease in advance payments and advances received was included in “Other” of “Cash flows from operating activities”. For the year ended December 31, 2010, it is presented as a separate line item. Decrease in advance payments and advances received amounted to ¥910 thousand and ¥8,974 thousand, respectively for the year ended December 31, 2009.
For the years ended December 31, 2009 and 2008, increase or decrease in prepaid expenses was included in “Other” within “Cash flows from operating activities”. Due to immateriality, for the year ended December 31, 2010, it is presented as a separate line item. Decrease in prepaid expenses amounted to ¥697 thousand for the year ended December 31, 2009.
For the years ended December 31, 2009 and 2008, increase or decrease in gift card liability was included in “Other” within “Cash flows from operating activities”. Due to materiality, for the year ended December 31,
| F-109 | (Continued) |
Table of Contents
B-R 31 Ice Cream Co., Ltd.
Notes to the Financial Statements—(Continued)
Years ended December 31, 2010, 2009 and 2008
(Information as of December 31, 2009 and 2008 and for the years ended December 31, 2009 and
2008, not covered by Auditors’ report included herein)
2010, it is presented as a separate line item. Increase in gift card liability amounted to ¥8,644 thousand for the year ended December 31, 2009.
For the years ended December 31, 2009 and 2008, proceeds from sales of tangible fixed assets were included in “Other” within “Cash flows from investing activities”. Due to materiality, for the year ended December 31, 2010, it is presented as a separate line item. Proceeds from sales of tangible fixed assets amounted to ¥772 thousand for the year ended December 31, 2009.
(4) Financial instruments
(a) Company’s Policy for Financial Instruments
The Company invests in short-term deposits only and generates financing through operating cash flows. Derivatives are used for foreign exchange forward contracts with the purpose of hedging the exposure to exchange rate fluctuation risks in relation to the import of raw materials.
(b) Nature and Extent of Risks Arising from Financial Instruments and Risk Management
Accounts receivable are subject to credit risks of customers. Their collection periods are generally one month. The Company manages these risks through periodic review of due dates and outstanding balances for each customer.
Investments in securities are subject to market volatility risks. These investments are related to capital and/or operating alliances with business partners, and are subject to market value volatility risk. The Company periodically monitors their fair values.
Lease deposits primarily relate to security deposits paid to the lessor for the lease of ice-cream stores. The Company periodically assesses the financial condition of the counterparties as appropriate.
“Long-term deposits received” are security deposit received from franchisees of ice-cream stores for the sublease of the property where the store is located.
Most of trade payables such as accounts payable-trade, accounts payable-other and deposits received are settled within one month.
(c) Supplemental Information on Fair Value of Financial Instruments
Fair values of financial instruments are based on quoted market prices. When quoted market prices are not available, other rational valuation techniques are used instead. Such rational valuation techniques contain certain assumptions. Results may differ if different assumptions are used in the valuation.
(d) Fair Value of Financial Instruments
Effective fiscal 2010, the Company applied the ASBJ Statement No. 10 “Accounting Standard for Financial Instruments” which was issued on March 10, 2008 and the ASBJ Guidance No. 19 “Guidance on Accounting Standard for Financial Instruments and Related Disclosures” which was issued on March 10, 2008.
| F-110 | (Continued) |
Table of Contents
B-R 31 Ice Cream Co., Ltd.
Notes to the Financial Statements—(Continued)
Years ended December 31, 2010, 2009 and 2008
(Information as of December 31, 2009 and 2008 and for the years ended December 31, 2009 and
2008, not covered by Auditors’ report included herein)
The carrying amounts, fair values and unrealized gains (losses) of financial instruments whose fair value is readily determinable as of December 31, 2010 are as follows:
| Thousands of Yen | ||||||||||||
| December 31, 2010 | ||||||||||||
| Carrying Amount |
Fair Value | Unrealized Gain (Loss) |
||||||||||
| Assets: |
||||||||||||
| (1) Cash and cash equivalent |
¥ | 3,912,939 | 3,912,939 | — | ||||||||
| (2) Accounts receivable-trade |
2,797,245 | |||||||||||
| Less: Allowance for doubtful accounts |
(23,873 | ) | ||||||||||
| 2,773,372 | 2,773,372 | — | ||||||||||
| (3) Investment securities |
25,672 | 25,672 | — | |||||||||
| (4) Lease deposits |
1,698,903 | 1,532,000 | (166,903 | ) | ||||||||
| Total |
¥ | 8,410,886 | 8,243,983 | (166,903 | ) | |||||||
| Liabilities: |
||||||||||||
| (1) Accounts payable-trade |
¥ | (494,760 | ) | (494,760 | ) | — | ||||||
| (2) Accounts payable-other |
(1,226,993 | ) | (1,226,993 | ) | — | |||||||
| (3) Provision for income taxes |
(812,790 | ) | (812,790 | ) | — | |||||||
| (4) Deposits received |
(139,794 | ) | (139,794 | ) | — | |||||||
| (5) Long-term deposits received |
(983,362 | ) | (909,533 | ) | 73,829 | |||||||
| Total |
¥ | (3,657,699 | ) | (3,583,870 | ) | 73,829 | ||||||
| Derivative instruments under hedge accounting |
¥ | (51,533 | ) | (51,533 | ) | — | ||||||
The methods and assumptions used to estimate the fair value are as follows:
Assets:
(1) Cash and cash equivalent and (2) Accounts receivable-trade
Because of their short maturities, the fair value of these items approximate their carrying amounts, therefore, they are measured at their carrying amounts.
(3) Investment securities
The fair value of equity securities is based on quoted market prices.
(5) Lease deposits
The fair value of lease deposits is calculated by grouping the deposits by maturity and calculating their present value using the yield of government bonds adjusted for credit risk.
| F-111 | (Continued) |
Table of Contents
B-R 31 Ice Cream Co., Ltd.
Notes to the Financial Statements—(Continued)
Years ended December 31, 2010, 2009 and 2008
(Information as of December 31, 2009 and 2008 and for the years ended December 31, 2009 and
2008, not covered by Auditors’ report included herein)
Carrying amounts in the above table do not include unamortized balance of lease deposits not required to be returned. Furthermore, lease deposits totaling ¥232,000 thousand are not included in the table above since these lease deposits do not have quoted market prices and their fair value cannot be determined as their future cash flows cannot be estimated.
Liabilities:
(1) Accounts payable-trade, (2) Accounts payable-other, (3) Accrued income taxes, and (4) Deposits received
Because of their short maturities, the fair values of these items approximate their carrying amounts, therefore, they are measured at their carrying amounts.
(5) Long-term deposits received
The fair value of long-term deposits received is calculated by grouping the deposits by maturity and calculating their present value using the yield of government bonds adjusted for credit risk. Carrying amounts shown in the above table do not include unamortized balance of long-term lease deposits not required to be returned.
Derivative Transactions:
Fair value of derivatives is obtained from financial institutions. All the derivative transactions are foreign exchange forward contracts entered into by the Company with the purpose of hedging the exposure to exchange rate fluctuation risks in relation to the import of raw materials.
The contract amount does not represent the Company’s exposure to market risk associated with the derivative transactions.
| Thousands of Yen | ||||||||||||
| December 31, 2010 | ||||||||||||
| Contract Amount |
Contract Amount due after one year |
Fair Value |
||||||||||
| Foreign exchange forward contracts—to buy U.S. dollars |
¥ | 539,088 | — | (51,533 | ) | |||||||
| F-112 | (Continued) |
Table of Contents
B-R 31 Ice Cream Co., Ltd.
Notes to the Financial Statements—(Continued)
Years ended December 31, 2010, 2009 and 2008
(Information as of December 31, 2009 and 2008 and for the years ended December 31, 2009 and
2008, not covered by Auditors’ report included herein)
(5) Investment Securities
Marketable available-for-sale securities are stated at fair value based on quoted market prices at the balance sheet date. Unrealized gains or losses, net of applicable taxes, are recorded as a component of “Net assets”. Investment securities are summarized as follow:
December 31, 2010
| Thousands of Yen | ||||||||||||||
| Carrying Amount |
Acquisition Cost |
Unrealized Gain(Loss) |
||||||||||||
| Securities with carrying amounts in excess of acquisition costs |
Equity securities | 15,140 | 12,721 | 2,419 | ||||||||||
| Other securities |
— | — | — | |||||||||||
| Subtotal | 15,140 | 12,721 | 2,419 | |||||||||||
| Securities with carrying amounts below acquisition costs |
Equity securities | 10,532 | 11,021 | (489 | ) | |||||||||
| Other securities |
— | — | — | |||||||||||
| Subtotal |
10,532 | 11,021 | (489 | ) | ||||||||||
| Total |
25,672 | 23,742 | 1,930 | |||||||||||
December 31, 2009
| Thousands of Yen | ||||||||||||||
| Carrying Amount |
Acquisition Cost |
Unrealized Gain(Loss) |
||||||||||||
| Securities with carrying amounts in excess of acquisition costs |
Equity securities | 12,009 | 13,867 | 1,858 | ||||||||||
| Other securities |
— | — | — | |||||||||||
| Subtotal |
12,009 | 13,867 | 1,858 | |||||||||||
| Securities with carrying amounts below acquisition costs |
Equity securities | 9,143 | 6,899 | (2,244 | ) | |||||||||
| Other securities |
— | — | — | |||||||||||
| Subtotal |
9,143 | 6,899 | (2,244 | ) | ||||||||||
| Total |
21,152 | 20,766 | (386 | ) | ||||||||||
| F-113 | (Continued) |
Table of Contents
B-R 31 Ice Cream Co., Ltd.
Notes to the Financial Statements—(Continued)
Years ended December 31, 2010, 2009 and 2008
(Information as of December 31, 2009 and 2008 and for the years ended December 31, 2009 and
2008, not covered by Auditors’ report included herein)
(6) Leases
Leases entered into on or before December 31, 2008 that do not transfer ownership of the leased property to the lessee are accounted for as operating lease transactions. Pro forma information on an “as if capitalized” basis for the years ended December 31, 2010 and 2009 is as follows:
| Thousands of Yen | ||||||||||||||||||||||||
| December 31, 2010 | December 31, 2009 | |||||||||||||||||||||||
| Acquisition cost |
Accumulated depreciation |
Balance at end of year |
Acquisition cost |
Accumulated depreciation |
Balance at end of year |
|||||||||||||||||||
| Vehicles, transportation equipment |
¥ | 37,719 | 30,708 | 7,011 | — | — | — | |||||||||||||||||
| Tools, furniture and fixtures |
27,667 | 16,667 | 10,999 | 64,064 | 40,595 | 23,468 | ||||||||||||||||||
| Software |
3,363 | 2,794 | 568 | 25,452 | 22,378 | 3,074 | ||||||||||||||||||
| Total |
¥ | 68,750 | 50,171 | 18,579 | 89,517 | 62,974 | 26,542 | |||||||||||||||||
Future minimum lease payments outstanding at the end of the year are as follow:
| Thousands of Yen | ||||||||
| December 31, 2010 |
December 31, 2009 |
|||||||
| Due within one year |
¥ | 11,143 | 15,314 | |||||
| Due after one year |
8,520 | 12,196 | ||||||
| Total |
¥ | 19,664 | 27,510 | |||||
Lease payments, depreciation expense and interest expense are as follow:
| Thousands of Yen | ||||||||||||
| Fiscal year ended | ||||||||||||
| December 31, 2010 |
December 31, 2009 |
December 31, 2008 |
||||||||||
| Lease payments |
¥ | 25,865 | 30,080 | 33,957 | ||||||||
| Depreciation expense (*1) |
23,824 | 27,922 | 31,592 | |||||||||
| Interest expense (*2) |
1,154 | 1,575 | 1,988 | |||||||||
| (*1) | Depreciation is computed using the straight-line method over the lease term assuming a residual value of zero. |
| (*2) | Interest expense is computed and allocated to each period using the interest method assuming interest expense to be the excess of total lease payments over the acquisition cost. |
| F-114 | (Continued) |
Table of Contents
B-R 31 Ice Cream Co., Ltd.
Notes to the Financial Statements—(Continued)
Years ended December 31, 2010, 2009 and 2008
(Information as of December 31, 2009 and 2008 and for the years ended December 31, 2009 and
2008, not covered by Auditors’ report included herein)
(7) Employees’ Retirement Benefits
The Company has a defined benefit plan under which the amount of pension benefit that an employee will receive on retirement, is determined based on various factors such as age, years of service and individual performance.
The Company is responsible for the fulfillment of the pension obligations.
The pension benefits are payable at the option of the retiring employee either in a lump-sum amount or annuity payments.
The funded status of the Company’s benefit plan as of December 31, 2010 and 2009 are as follows:
| Thousands of Yen | ||||||||
| December 31, 2010 |
December 31, 2009 |
|||||||
| Retirement benefit obligations |
¥ | (565,309 | ) | (517,603 | ) | |||
| Fair value of plan assets |
433,201 | 398,003 | ||||||
| Employees’ retirement benefits |
¥ | (132,108 | ) | (119,600 | ) | |||
The Company accounts for a pension liability based on the pension obligations and the fair value of the plan assets at the balance sheet date. Pension obligations are determined to be the total amount payable if all eligible employees voluntarily retired at the balance sheet date less the amounts that the Company would be entitled to under the “Gaishoku Sangyo JF Pension Fund” to pay such obligations.
The Company’s retirement benefit expenses for the years ended December 31, 2010, 2009, and 2008 amounted to ¥76,897 thousand, ¥70,832 thousand, and ¥59,906 thousand, respectively.
In October 2009 the Company transferred its Japanese tax-qualified pension plan to a cash balance plan, due to changes in the Japanese Corporate Tax law. This transfer was accounted for in accordance with ASBJ Guidance No.1, “Accounting for Transfer of Retirement Benefit Plans” and did not have a material impact in the Company’s results of operations.
In addition, the Company makes contributions to a “Gaishoku Sangyo JF Pension Fund” under which the assets contributed by the Company are not segregated in a separate account or restricted to provide benefits only to employees of the Company. For the 12 month period ended March 31, 2010, 2009 and 2008 contributions to such plan amounted to ¥32,581 thousand, ¥29,070 thousand and ¥21,880 thousand, respectively. Such contributions are recorded as net pension cost. The amounts that Company would be entitled to under the “Gaishoku Sangyo JF Pension Fund” to pay retirement benefit obligations is all eligible employees voluntarily retired at the balance sheet date.
The proportionate amount of plan assets of the welfare pension fund corresponding to the number of participants was ¥399,778 thousand, ¥298,139 thousand and ¥338,663 thousand as of March 31, 2010, 2009, and 2008, respectively. The Company’s contribution to the welfare pension fund for the years ended March 31, 2010, 2009, and 2008 was ¥32,581 thousand, ¥29,070 thousand and ¥21,880 thousand, respectively.
| F-115 | (Continued) |
Table of Contents
B-R 31 Ice Cream Co., Ltd.
Notes to the Financial Statements—(Continued)
Years ended December 31, 2010, 2009 and 2008
(Information as of December 31, 2009 and 2008 and for the years ended December 31, 2009 and
2008, not covered by Auditors’ report included herein)
The estimated fund status of the total “Gaishoku Sangyo JF Pension Fund” is as follow:
| Millions of Yen | ||||||||||||
| March 31, 2010 |
March 31, 2009 |
March 31, 2008 |
||||||||||
| Plan assets |
¥ | 112,959 | 92,971 | 111,833 | ||||||||
| Estimated benefit obligations |
123,946 | 123,473 | 118,217 | |||||||||
| Fund status |
¥ | (10,987) | (30,501) | (6,383) | ||||||||
As of March 31, 2010, the “Gaishoku Sangyo JF Pension Fund” had ¥842 million of unrecognized past service. As of March 31, 2009, the “Gaishoku Sangyo JF Pension Fund” had ¥990 million of unrecognized past service liability and ¥16,921 million of deficits. As of March 31, 2008, the “Gaishoku Sangyo JF Pension Fund” had ¥1,111 million of unrecognized past service liability and ¥6,892 million of deficits.
The Company’s fund contribution ratio to the “Gaishoku Sangyo JF Pension Fund” for the years ended March 31, 2010, 2009, and 2008 was 0.57%, 0.47%, and 0.45%, respectively.
(8) Stock Options
The Company did not grant any stock options for the years ended December 31, 2010, 2009, and 2008 and there were no outstanding option as of December 31, 2010, 2009, and 2008.
(9) Production Cost
The breakdown of production cost is as follows:
| Thousands of Yen | ||||||||||||
| Fiscal 2010 | (Not covered by Auditors’ Report) Fiscal 2009 |
(Not covered by Auditors’ Report) Fiscal 2008 |
||||||||||
| Cost of raw materials |
¥ | 6,212,453 | 5,507,902 | 5,119,972 | ||||||||
| Labor cost |
418,249 | 337,772 | 296,727 | |||||||||
| Other production costs |
376,245 | 289,736 | 271,674 | |||||||||
| Total production cost during the year |
¥ | 7,006,948 | 6,135,411 | 5,688,374 | ||||||||
Production cost is determined through process costing based on actual costs.
| F-116 | (Continued) |
Table of Contents
B-R 31 Ice Cream Co., Ltd.
Notes to the Financial Statements—(Continued)
Years ended December 31, 2010, 2009 and 2008
(Information as of December 31, 2009 and 2008 and for the years ended December 31, 2009 and
2008, not covered by Auditors’ report included herein)
The breakdown of other production cost is as follows:
Breakdown of other production cost
| Thousands of Yen | ||||||||||||
| Fiscal 2010 |
(Not covered by Auditors’ Report) Fiscal 2009 |
(Not covered by Auditors’ Report) Fiscal 2008 |
||||||||||
| Depreciation |
¥ | 49,416 | 44,819 | 45,727 | ||||||||
| Utilities |
28,880 | 28,219 | 62,729 | |||||||||
| Factory supplies cost |
54,591 | 44,116 | 33,814 | |||||||||
| Machinery maintenance and repair cost |
46,160 | 39,919 | 24,859 | |||||||||
| Other |
197,195 | 132,661 | 104,543 | |||||||||
| Total |
¥ | 376,245 | 289,736 | 271,674 | ||||||||
(10) Transfer to other account
“Transfer to other account” include amounts initially charged to cost of sales but reclassified to selling, general and administrative expenses as they represent the cost of sample products for sales promotion and finish goods used for training of store employees.
(11) Cost of store equipment
Cost of store equipment is mainly comprised of the following:
| Thousands of Yen | ||||||||||||
| Fiscal year ended | ||||||||||||
| December 31, 2010 |
December 31, 2009 |
December 31, 2008 |
||||||||||
| Depreciation |
¥ | 212,720 | 181,879 | 138,593 | ||||||||
| Maintenance and repair cost of store equipment |
108,371 | 112,953 | 130,132 | |||||||||
| Rental expense |
27,337 | 30,029 | 33,030 | |||||||||
| Supplies |
31,646 | 31,724 | 51,121 | |||||||||
| Transportation |
13,889 | 18,890 | 23,111 | |||||||||
| Storage charges |
18,703 | 21,304 | 21,151 | |||||||||
| F-117 | (Continued) |
Table of Contents
B-R 31 Ice Cream Co., Ltd.
Notes to the Financial Statements—(Continued)
Years ended December 31, 2010, 2009 and 2008
(Information as of December 31, 2009 and 2008 and for the years ended December 31, 2009 and
2008, not covered by Auditors’ report included herein)
(12) Extraordinary Gain
“Other” included in extraordinary income represents gains on sales of fixed assets of ¥1,154 thousand for the year ended December 31, 2010.
(13) Loss on Disposal of Fixed Assets
Loss on disposal of fixed assets is comprised of the following:
| Thousands of Yen | ||||||||||||
| For the year ended | ||||||||||||
| December 31, 2010 |
December 31, 2009 |
December 31, 2008 |
||||||||||
| Loss on disposals of store equipment arising from store closing and related restoration |
¥ | 23,814 | 30,512 | 32,433 | ||||||||
| Loss on disposals of factory equipment |
323 | 4,208 | 5,813 | |||||||||
| Total |
¥ | 24,137 | 34,720 | 38,246 | ||||||||
(14) Income Taxes
The components of the deferred tax assets and liabilities at December 31, 2010 and 2009 are as follows:
| Thousands of Yen | ||||||||||||||||
| December 31, 2010 | December 31, 2009 | |||||||||||||||
| Deferred tax assets |
Deferred tax liabilities |
Deferred tax assets |
Deferred tax liabilities |
|||||||||||||
| Allowance for doubtful accounts |
¥ | 37,338 | — | 44,659 | — | |||||||||||
| Directors’ retirement benefits |
21,978 | — | 17,867 | — | ||||||||||||
| Employees’ retirement benefits |
53,768 | — | 48,677 | — | ||||||||||||
| Accrued enterprise tax |
61,409 | — | 49,982 | — | ||||||||||||
| Accrued employees’ bonuses |
13,981 | — | 12,278 | — | ||||||||||||
| Deferred loss on hedges |
20,973 | — | 3,689 | — | ||||||||||||
| Impairment loss on investment property |
9,737 | — | 9,737 | — | ||||||||||||
| Amortization of software |
— | — | 2,341 | — | ||||||||||||
| Amortization of long-term prepaid expenses |
3,806 | — | 23,290 | — | ||||||||||||
| Inventory write-down |
11,253 | — | 18,146 | — | ||||||||||||
| Other |
14,155 | — | 3,148 | — | ||||||||||||
| Total |
¥ | 248,398 | — | 233,814 | — | |||||||||||
| F-118 | (Continued) |
Table of Contents
B-R 31 Ice Cream Co., Ltd.
Notes to the Financial Statements—(Continued)
Years ended December 31, 2010, 2009 and 2008
(Information as of December 31, 2009 and 2008 and for the years ended December 31, 2009 and
2008, not covered by Auditors’ report included herein)
Reconciliations between the Japanese statutory income tax rate and the Company’s effective income tax rate for the years ended December 31, 2010, 2009 and 2008 are as follows:
| Fiscal year ended | ||||||||||||
| December 31, 2010 |
December 31, 2009 |
December 31, 2008 |
||||||||||
| Japanese statutory income tax rate |
40.7 | % | 40.7 | % | 40.7 | % | ||||||
| Permanent differences, including entertainment expenses |
3.2 | 3.4 | 3.2 | |||||||||
| Corporate inhabitant tax |
0.1 | 0.1 | 0.2 | |||||||||
| Other |
(0.1 | ) | (0.1 | ) | (1.5 | ) | ||||||
| Effective income tax rate |
44.0 | % | 44.2 | % | 42.6 | % | ||||||
(15) Changes in Net Assets
Number of shares issued and treasury stock is as follow:
| Common Stock | ||||||||
| Shares issued |
Treasury Stock |
|||||||
| Number of shares at December 31, 2008 |
9,644,554 | 8,524 | ||||||
| Increase in shares during the year |
— | — | ||||||
| Decrease in shares during the year |
— | — | ||||||
| Number of shares at December 31, 2009 |
9,644,554 | 8,524 | ||||||
| Increase in shares during the year |
— | — | ||||||
| Decrease in shares during the year |
— | — | ||||||
| Number of shares at December 31, 2010 |
9,644,554 | 8,524 | ||||||
(16) Per Share Information
The Company has no outstanding potentially dilutive stock.
| December 31, 2010 |
December 31, 2009 |
December 31, 2008 |
||||||||||
| Net book value per share |
¥ | 971.45 | 877.49 | 798.87 | ||||||||
| Fiscal year ended | ||||||||||||
| December 31, 2010 |
December 31, 2009 |
December 31, 2008 |
||||||||||
| Net income per share |
¥ | 171.42 | 135.67 | 109.99 | ||||||||
| F-119 | (Continued) |
Table of Contents
B-R 31 Ice Cream Co., Ltd.
Notes to the Financial Statements—(Continued)
Years ended December 31, 2010, 2009 and 2008
(Information as of December 31, 2009 and 2008 and for the years ended December 31, 2009 and
2008, not covered by Auditors’ report included herein)
The information to compute net income per share is as follow:
| Fiscal year ended | ||||||||||||
| December 31, 2010 |
December 31, 2009 |
December 31, 2008 |
||||||||||
| Net income per share |
||||||||||||
| Net income (in thousands) |
¥ | 1,651,850 | 1,307,300 | 1,059,893 | ||||||||
| Amount not attributable to common shareholders (in thousands) |
— | — | – | |||||||||
| Net income attributable to common stock (in thousands) |
1,651,850 | 1,307,300 | 1,059,893 | |||||||||
| Average number of shares |
9,636,030 | 9,636,030 | 9,636,030 | |||||||||
(17) Subsequent Events
Due to the Great Eastern Japan Earthquake on March 11, 2011, certain finished products and raw materials stored in the Company’s Fuji Oyama Factory and external warehouses as well as part of the store equipment leased to franchisees have been damaged. While the amount of damage is currently being assessed, the Company estimates the loss on inventory and equipment to be approximately ¥37 million and ¥64 million, respectively.
| F-120 | (Continued) |
Table of Contents
B-R 31 Ice Cream Co., Ltd.
Notes to the Financial Statements—(Continued)
Years ended December 31, 2010, 2009 and 2008
(Information as of December 31, 2009 and 2008 and for the years ended December 31, 2009 and
2008, not covered by Auditors’ report included herein)
(18) Summary of Certain Significant Differences between Japanese GAAP and U.S. GAAP
The Company maintains its books and records in conformity with Japanese GAAP, which differs in certain respects from generally accepted accounting principles in the United States (“U.S. GAAP”). Reconciliations of net income and equity under Japanese GAAP with the corresponding amounts under U.S. GAAP, along with a description of those significant differences, statements of comprehensive income, related balance sheet and cash flow effects are summarized below.
Net income reconciliation
| Thousands of Yen | ||||||||||||
| Note | December 31, 2010 |
December 31, 2009 |
||||||||||
| Net income under Japanese GAAP |
¥ | 1,651,850 | 1,307,300 | |||||||||
| U.S. GAAP adjustments: |
||||||||||||
| Asset retirement obligations |
a | (81,226 | ) | (77,579 | ) | |||||||
| Capitalized lease assets |
c | (118 | ) | 911 | ||||||||
| Compensated absence |
b | (2,400 | ) | (3,600 | ) | |||||||
| Lease obligation |
c | (2,449 | ) | (20,109 | ) | |||||||
| Employees’ retirement benefit |
d | (7,146 | ) | (23,175 | ) | |||||||
| Hedge accounting |
e | (25,183 | ) | 29,573 | ||||||||
| Tax effect on adjustments |
f | 37,989 | 50,286 | |||||||||
| Net income under U.S. GAAP |
¥ | 1,571,317 | 1,263,607 | |||||||||
Net income per share under U.S. GAAP
| December 31, 2010 |
December 31, 2009 |
|||||||
| Net income attributable to the Company’s common shareholders–basic undiluted |
¥ | 163.06 | 131.13 | |||||
| Weighted average shares outstanding—basic undiluted |
9,636,030 | 9,636,030 | ||||||
| F-121 | (Continued) |
Table of Contents
B-R 31 Ice Cream Co., Ltd.
Notes to the Financial Statements—(Continued)
Years ended December 31, 2010, 2009 and 2008
(Information as of December 31, 2009 and 2008 and for the years ended December 31, 2009 and
2008, not covered by Auditors’ report included herein)
Statements of comprehensive income
| Thousands of Yen | ||||||||
| December 31, 2010 |
December 31, 2009 |
|||||||
| Net income under U.S. GAAP |
¥ | 1,571,317 | 1,263,607 | |||||
| Other comprehensive income, net of tax: |
||||||||
| Unrealized gain (loss) on available for sale securities, net of tax |
1,372 | (1,062 | ) | |||||
| Comprehensive income under U.S. GAAP |
¥ | 1,572,689 | 1,262,545 | |||||
Equity reconciliation
| Thousands of Yen | ||||||||||||
| Note | December 31, 2010 |
December 31, 2009 |
||||||||||
| Equity under Japanese GAAP |
¥ | 9,360,875 | 8,455,537 | |||||||||
| U.S. GAAP adjustments: |
||||||||||||
| Asset retirement obligations |
a | (478,805 | ) | (397,580 | ) | |||||||
| Capitalized lease assets |
c | (1,085 | ) | (967 | ) | |||||||
| Compensated absence |
b | (24,200 | ) | (21,800 | ) | |||||||
| Lease obligation |
c | 233,644 | 236,093 | |||||||||
| Employees’ retirement benefit |
d | 76,554 | 83,700 | |||||||||
| Hedge accounting |
e | — | — | |||||||||
| Other |
(17,065 | ) | (17,065 | ) | ||||||||
| Tax effect on adjustments |
f | 85,859 | 47,871 | |||||||||
| Equity under U.S. GAAP |
¥ | 9,235,777 | 8,385,789 | |||||||||
Balance sheet items according to J GAAP and US GAAP
| Thousands of Yen | ||||||||||||||||
| JGAAP | US GAAP | |||||||||||||||
| 2010 | 2009 | 2010 | 2009 | |||||||||||||
| Current assets |
7,981,228 | 6,722,739 | 7,981,228 | 6,722,739 | ||||||||||||
| Non-current assets |
5,747,213 | 5,470,058 | 7,775,685 | 7,481,787 | ||||||||||||
| Total Assets |
13,728,441 | 12,192,797 | 15,756,913 | 14,204,526 | ||||||||||||
| Current liabilities |
(3,171,766 | ) | (2,674,074 | ) | (3,195,966 | ) | (2,695,874 | ) | ||||||||
| Non-current liabilities |
(1,195,800 | ) | (1,063,186 | ) | (3,325,170 | ) | (3,122,862 | ) | ||||||||
| Total equity |
(9,360,875 | ) | (8,455,537 | ) | (9,235,777 | ) | (8,385,790 | ) | ||||||||
| Total liabilities and equity |
(13,728,441 | ) | (12,192,797 | ) | (15,756,913 | ) | (14,204,526 | ) | ||||||||
| F-122 | (Continued) |
Table of Contents
B-R 31 Ice Cream Co., Ltd.
Notes to the Financial Statements—(Continued)
Years ended December 31, 2010, 2009 and 2008
(Information as of December 31, 2009 and 2008 and for the years ended December 31, 2009 and
2008, not covered by Auditors’ report included herein)
(a) Asset retirement obligations
On March 31, 2008, the Accounting Standard Board of Japan (“ASBJ”) issued a new accounting standard for asset retirement obligations, ASBJ Statement No. 18 “Accounting Standard for Asset-Retirement Obligations” which is effective for fiscal years beginning on or after April 1, 2010. This new accounting standard requires all entities to recognize legal obligations associated with the retirement of a tangible fixed assets that result from the acquisition, construction or development and (or) the normal operation of a long-lived asset. A legal obligation is an obligation that an entity is required to settle as a result of an existing or enacted law, statute, ordinance, or written or oral contract or by legal construction of a contract. The Company will adopt this new accounting standard from the fiscal year beginning on January 1, 2011. Prior to the adoption of the standard, the Company did not recognize any asset retirement cost until the tangible fixed asset was retired and the Company was required to settle such cost.
Under U.S. GAAP, obligations associated with the retirement of tangible fixed assets and the associated asset retirement costs are accounted and reported under FASB ASC Subtopic 410-20, “Asset Retirement Obligations”. Generally, there are no material differences between the new Japanese Standard and current U.S. GAAP, except that under Japanese GAAP asset retirement obligations are not recognized in situations where the entity can provide assurance that another party will ultimately reimburse the entity for the asset retirement cost. Under U.S. GAAP an asset retirement obligation would need to be recognized as such assurance would not extinguish the entity’s legal obligation.
The Company leases several properties in which leasehold improvements, such as counters, partitions, telephone and air conditioning systems have been installed. Most lease agreements in Japan require the lessee to restore the lease property to its original condition, including removal of the leasehold improvements that the lessee has installed, when the lessee moves out of the leased property. As a result, the Company will incur certain future costs for the restoration that is required under the lease arrangements.
| F-123 | (Continued) |
Table of Contents
B-R 31 Ice Cream Co., Ltd.
Notes to the Financial Statements—(Continued)
Years ended December 31, 2010, 2009 and 2008
(Information as of December 31, 2009 and 2008 and for the years ended December 31, 2009 and
2008, not covered by Auditors’ report included herein)
The following table summarizes the activities for asset retirement obligations for the years ended December, 2010 and 2009 under U.S. GAAP:
| Thousands of Yen | ||||||||
| December 31, 2010 |
December 31, 2009 |
|||||||
| i) Asset retirement obligation |
||||||||
| Balance under Japanese GAAP |
¥ | — | — | |||||
| U.S. GAAP adjustments: |
||||||||
| Beginning balance adjustments |
(771,388 | ) | (707,368 | ) | ||||
| Changes for the year |
(64,951 | ) | (64,020 | ) | ||||
| Total U.S. GAAP adjustments |
(836,339 | ) | (771,388 | ) | ||||
| Balance under U.S. GAAP |
¥ | (836,339 | ) | (771,388 | ) | |||
| ii) Asset retirement costs capitalized in tangible fixed assets |
||||||||
| Balance under Japanese GAAP |
¥ | — | — | |||||
| U.S. GAAP adjustments: |
||||||||
| Beginning balance adjustments |
373,808 | 387,367 | ||||||
| Changes for the year |
(16,274 | ) | (13,559 | ) | ||||
| Total U.S. GAAP adjustments |
357,534 | 373,808 | ||||||
| Balance under U.S. GAAP |
¥ | 357,534 | 373,808 | |||||
(b) Compensated absences
Under Japanese GAAP, there is no specific accounting standard that requires an entity to accrue a liability for future compensated absences. Under U.S. GAAP, FASB ASC Topic 710, “Compensation—General” requires the accrual of a liability for employees’ future compensated absences.
The following table summarizes the balance of accrued compensated absences and the changes during the years ended December 31, 2010 and 2009 under U.S. GAAP:
| Thousands of Yen | ||||||||
| December 31, 2010 |
December 31, 2009 |
|||||||
| Balance at under Japanese GAAP |
¥ | — | — | |||||
| U.S. GAAP adjustments: |
||||||||
| Beginning balance adjustments |
(21,800 | ) | (18,200 | ) | ||||
| Adjustments for the year |
(2,400 | ) | (3,600 | ) | ||||
| Total U.S. GAAP adjustments |
(24,200 | ) | (21,800 | ) | ||||
| Balance at under U.S. GAAP |
¥ | (24,200 | ) | (21,800 | ) | |||
| F-124 | (Continued) |
Table of Contents
B-R 31 Ice Cream Co., Ltd.
Notes to the Financial Statements—(Continued)
Years ended December 31, 2010, 2009 and 2008
(Information as of December 31, 2009 and 2008 and for the years ended December 31, 2009 and
2008, not covered by Auditors’ report included herein)
(c) Leases
In March 2007, the ASBJ issued ASBJ Statement No.13, “Accounting Standard for Lease Transactions,” which replaced the previous accounting standard for lease transactions issued in June 1993. The revised accounting standard requires that all finance lease transactions be capitalized. It also permits leases which existed at the transition date and do not transfer ownership of the leased property to the lessee to continue to be accounted for as operating lease transactions. The Company adopted this revised accounting standard as of January 1, 2009, and capitalizes in the balance sheet all finance lease transactions in which the Company is the lessee, except for those that existed at the transition date and do not transfer ownership, which continue to be accounted for as operating leases with require disclosure in the notes to the financial statements. As of December 31, 2010 and 2009, there were no leased assets to be capitalized under Japanese GAAP.
Under U.S. GAAP, FASB ASC Topic 840, “Leases” is applied in order to determine whether the lessee should account for a lease transaction as an operating or a capital lease and whether the lessor should account for a lease transaction as an operating lease, a direct financing lease, a sales type lease or a leverage lease. ASC Topic 840 requires the lessee to record a capital lease as an asset and an obligation and the lessor to record a direct financing lease as a receivable representing the minimum lease payments along with the derecognition of the lease property from the balance sheet. The Company analyzed its leases in accordance with the criteria specified in ASC 840 and determined that certain leases in which the Company is the lessee should be capitalized, and certain leases in which the Company is the lessor should be classified as direct financing leases.
In addition, the statement of cash flows prepared under Japanese GAAP present cash flows from capital lease and direct finance lease transactions, which are accounted for as operating lease transactions in accordance with Japanese GAAP, as operating cash flows. Such lease cash flows are included in operating activities whereas such transactions qualify as capital lease transactions or a direct financing lease transaction and deemed repayments of lease obligation or cash received from lease receivables are presented as financing activities under U.S. GAAP.
| F-125 | (Continued) |
Table of Contents
B-R 31 Ice Cream Co., Ltd.
Notes to the Financial Statements—(Continued)
Years ended December 31, 2010, 2009 and 2008
(Information as of December 31, 2009 and 2008 and for the years ended December 31, 2009 and
2008, not covered by Auditors’ report included herein)
The following table summarizes the differences between Japanese GAAP and U.S. GAAP for capital leases and direct finance leases as of December 31, 2010 and 2009, and the changes for the years then ended:
Capital leases
| Thousands of Yen | ||||||||
| December 31, 2010 |
December 31, 2009 |
|||||||
| i) Capitalized lease assets |
||||||||
| Balance under Japanese GAAP |
¥ | — | — | |||||
| U.S. GAAP adjustments: |
||||||||
| Beginning balance adjustments |
26,543 | 55,948 | ||||||
| Changes for the year |
(7,964 | ) | (29,405 | ) | ||||
| Total U.S. GAAP adjustments |
18,579 | 26,543 | ||||||
| Balance under U.S. GAAP |
¥ | 18,579 | 26,543 | |||||
| ii) Lease obligation |
||||||||
| Balance under Japanese GAAP |
¥ | — | — | |||||
| U.S. GAAP adjustments: |
||||||||
| Beginning balance adjustments |
(27,510 | ) | (57,826 | ) | ||||
| Changes for the year |
7,846 | 30,316 | ||||||
| Total U.S. GAAP adjustments |
(19,664 | ) | (27,510 | ) | ||||
| Balance under U.S. GAAP |
¥ | (19,664 | ) | (27,510 | ) | |||
| F-126 | (Continued) |
Table of Contents
B-R 31 Ice Cream Co., Ltd.
Notes to the Financial Statements—(Continued)
Years ended December 31, 2010, 2009 and 2008
(Information as of December 31, 2009 and 2008 and for the years ended December 31, 2009 and
2008, not covered by Auditors’ report included herein)
Direct finance leases
| Thousands of Yen | ||||||||
| December 31, 2010 |
December 31, 2009 |
|||||||
| i) Lease accounts receivable |
||||||||
| Balance under Japanese GAAP |
¥ | — | — | |||||
| U.S. GAAP adjustments: |
||||||||
| Beginning balance adjustments |
2,025,729 | 2,055,234 | ||||||
| Changes for the year |
64,068 | (29,505 | ) | |||||
| Total U.S. GAAP adjustments |
2,089,797 | 2,025,729 | ||||||
| Balance under U.S. GAAP |
¥ | 2,089,797 | 2,025,729 | |||||
| ii) Tangible fixed assets under direct finance leases |
||||||||
| Balance under Japanese GAAP |
¥ | 506,233 | 445,159 | |||||
| U.S. GAAP adjustments: |
||||||||
| Beginning balance adjustments |
(445,159 | ) | (409,904 | ) | ||||
| Changes for the year |
(61,074 | ) | (35,255 | ) | ||||
| Total U.S. GAAP adjustments |
(506,233 | ) | (445,159 | ) | ||||
| Balance under U.S. GAAP |
¥ | — | — | |||||
| iii) Unearned interest |
||||||||
| Balance under Japanese GAAP |
¥ | — | — | |||||
| U.S. GAAP adjustments: |
||||||||
| Beginning balance adjustments |
(1,344,478 | ) | (1,389,128 | ) | ||||
| Changes for the year |
(5,443 | ) | 44,650 | |||||
| Total U.S. GAAP adjustments |
(1,349,921 | ) | (1,344,478 | ) | ||||
| Balance under U.S. GAAP |
¥ | (1,349,921 | ) | (1,344,478 | ) | |||
(d) Pension
Under Japanese GAAP, the Company accounts for a pension liability based on the pension obligations and the fair value of the plan assets at the balance sheet date. Pension obligations are determined to be the total amount payable if all eligible employees voluntarily retired at the balance sheet date, minus the amounts that the Company would be entitled to under the “Japanese Multiemployer plan” to pay such obligations. See Note 7.
Under U.S. GAAP, FASB ASC Topic 715, “Compensation-Retirement Benefits” is applied to employees retirement benefits. If the projected benefit obligation exceeds the fair value of plan assets, the employer shall recognize in its balance sheet a liability that equals the unfunded projected benefit obligation. If the fair value of plan assets exceeds the projected benefit obligation, the employer shall recognize in its statement of financial position an asset that equals the overfunded projected benefit obligation.
| F-127 | (Continued) |
Table of Contents
B-R 31 Ice Cream Co., Ltd.
Notes to the Financial Statements—(Continued)
Years ended December 31, 2010, 2009 and 2008
(Information as of December 31, 2009 and 2008 and for the years ended December 31, 2009 and
2008, not covered by Auditors’ report included herein)
The projected benefit obligation as of a date is the actuarial present value of all benefits attributed by the plan’s benefit formula to employee service rendered before that date. Recognizing the funded status of an entity’s benefit plans as a net liability or asset requires an offsetting adjustment to accumulated other comprehensive income (“AOCI”) in shareholders’ equity. The amounts to be recognized in AOCI representing unrecognized gains/losses, prior service costs/credits, and transition assets/obligations are amortized over certain period. Those amortized amounts are reported as net periodic pension cost in the income statement.
The following table summarizes the differences between Japanese GAAP and U.S. GAAP for accrued pension and severance liabilities as of December 31, 2010 and 2009, and the changes for the years then ended:
| Thousands of Yen | ||||||||
| December 31, 2010 |
December 31, 2009 |
|||||||
| Accrued pension and severance liabilities |
||||||||
| Balance under Japanese GAAP |
¥ | (132,108 | ) | (119,600 | ) | |||
| U.S. GAAP adjustments: |
||||||||
| Beginning balance adjustments |
83,700 | 106,875 | ||||||
| Changes for the year |
(7,146 | ) | (23,175 | ) | ||||
| Total U.S. GAAP adjustments |
76,554 | 83,700 | ||||||
| Balance under U.S. GAAP |
¥ | (55,554 | ) | (35,900 | ) | |||
(e) Hedge accounting
The Company utilizes foreign exchange forward contracts in order to hedge foreign exchange risk for forecasted import transactions denominated in foreign currencies. Under Japanese GAAP, the Company records the foreign exchange forward contracts at fair value at a balance sheet date. The resulting foreign exchange forward contracts’ gain or loss is initially reported as a component of valuation and translation adjustments in net assets and subsequently reclassified into earnings when the forecasted transaction affects earnings. The accounting treatment is similar to the cash flow hedge of U.S. GAAP. However, U.S. GAPP requires an entity to meet specific criteria, such as formal documentation of the hedging relationship and assessment of hedging instrument’s effectiveness for derivative instruments to qualify for hedge accounting. The Company’s hedging relationship of the foreign exchange forward contracts and the forecasted import transactions denominated in foreign currencies did not meet the specific criteria for cash flow hedge accounting under U.S. GAAP. As such, forward contracts’ gain and losses reported as a component of net assets under Japanese GAAP have been reclassified to net income under U.S. GAAP.
| F-128 | (Continued) |
Table of Contents
B-R 31 Ice Cream Co., Ltd.
Notes to the Financial Statements—(Continued)
Years ended December 31, 2010, 2009 and 2008
(Information as of December 31, 2009 and 2008 and for the years ended December 31, 2009 and
2008, not covered by Auditors’ report included herein)
The following table summarizes the differences between Japanese GAAP and U.S. GAAP for the hedge accounting as of December 31, 2010 and 2009.
| Thousands of Yen | ||||||||
| December 31, 2010 |
December 31, 2009 |
|||||||
| Accumulated other comprehensive income |
||||||||
| Balance under Japanese GAAP |
¥ | (30,559 | ) | (5,376 | ) | |||
| U.S. GAAP adjustments: |
||||||||
| Beginning balance adjustments |
5,376 | 34,949 | ||||||
| Changes for the year |
25,183 | (29,573 | ) | |||||
| Total U.S. GAAP adjustments |
30,559 | 5,376 | ||||||
| Balance under U.S. GAAP |
¥ | — | — | |||||
(f) Tax effect on adjustments
Except for the accounting treatment of uncertainty in income taxes, accounting for income taxes in accordance with Japanese GAAP is substantially similar to accounting for income taxes in accordance with ASC Topic 740. The following tables summarize the impact on the Japanese GAAP deferred tax assets and liabilities in the Company’s consolidated balance sheets as a result of the U.S. GAAP adjustments as of December 31, 2010 and 2009.
| Thousands of Yen | ||||||||
| December 31, 2010 |
December 31, 2009 |
|||||||
| Deferred tax assets, net of deferred tax liabilities |
||||||||
| Balance under Japanese GAAP |
¥ | 248,398 | 233,814 | |||||
| U.S. GAAP adjustments: |
||||||||
| Beginning balance adjustments |
47,870 | (2,415 | ) | |||||
| Changes for the year |
37,989 | 50,286 | ||||||
| Total U.S. GAAP adjustments |
85,859 | 47,871 | ||||||
| Balance under U.S. GAAP |
¥ | 334,257 | 281,685 | |||||
| F-129 |
Table of Contents

Table of Contents

Table of Contents
Table of Contents
shares
Common stock
Prospectus
| J.P. Morgan | Barclays Capital | Morgan Stanley | ||
| BofA Merrill Lynch | Goldman, Sachs & Co. | |||
| Baird | William Blair & Company | Raymond James | ||
| Stifel Nicolaus Weisel | Wells Fargo Securities | Moelis & Company | ||
| SMBC Nikko | Ramirez & Co. | The Williams Capital Group, L.P. |
, 2011
You should rely on the information contained in this prospectus. We have not authorized anyone to provide you with information different from that contained in this prospectus. We are offering to sell, and seeking offers to buy, common shares only in jurisdictions where offers and sales are permitted. The information contained in this prospectus is accurate only as of the date of this prospectus, regardless of the time of delivery of this prospectus or of any sale of our common shares.
No action is being taken in any jurisdiction outside the United States to permit a public offering of the common shares or possession or distribution of this prospectus in that jurisdiction. Persons who come into possession of this prospectus in jurisdictions outside the United States are required to inform themselves about and to observe any restrictions as to this offering and the distribution of the prospectus applicable to that jurisdiction.
Until , 2011, all dealers that effect transactions in these securities, whether or not participating in this offering, may be required to deliver a prospectus. This is in addition to the dealer’s obligation to deliver a prospectus when acting as underwriters and with respect to their unsold allotments or subscriptions.
Table of Contents
Part II
Information not required in prospectus
Item 13. Other expenses of issuance and distribution.
The following table sets forth the estimated expenses payable by us in connection with the sale and distribution of the securities registered hereby, other than underwriting discounts or commissions. All amounts are estimates except for the SEC registration fee and the Financial Industry Regulatory Authority filing fee.
| SEC registration fee |
$ | 46,440 | ||
| FINRA filing fee |
40,500 | |||
| Stock exchange listing fees |
* | |||
| Blue sky fees and expenses |
* | |||
| Printing and engraving expenses |
* | |||
| Accounting fees and expenses |
* | |||
| Legal fees and expenses |
* | |||
| Transfer agent and registrar fees |
* | |||
| Miscellaneous fees and expenses |
* | |||
| TOTAL |
$ | * | ||
| * | To be completed by amendment. |
Item 14. Indemnification of directors and officers.
Section 145 of the General Corporation Law of the State of Delaware provides as follows:
A corporation shall have the power to indemnify any person who was or is a party or is threatened to be made a party to any threatened, pending or completed action, suit or proceeding, whether civil, criminal, administrative or investigative (other than an action by or in the right of the corporation) by reason of the fact that the person is or was a director, officer, employee or agent of the corporation, or is or was serving at the request of the corporation as a director, officer, employee or agent of another corporation, partnership, joint venture, trust or other enterprise, against expenses (including attorneys’ fees), judgments, fines and amounts paid in settlement actually and reasonably incurred by him in connection with such action, suit or proceeding if the person acted in good faith and in a manner the person reasonably believed to be in or not opposed to the best interest of the corporation, and, with respect to any criminal action or proceeding, had no reasonable cause to believe his conduct was unlawful. The termination of any action, suit or proceeding by judgment, order, settlement, conviction or upon a plea of nolo contendere or its equivalent shall not, of itself, create a presumption that the person did not act in good faith and in a manner which the person reasonably believed to be in or not opposed to the best interests of the corporation, and, with respect to any criminal action or proceeding, had reasonable cause to believe that his conduct was unlawful.
A corporation shall have the power to indemnify any person who was or is a party or is threatened to be made a party to any threatened, pending or completed action or suit by or in the right of the corporation to procure a judgment in its favor by reason of the fact that the person is or was a director, officer, employee or agent of the corporation, or is or was serving at the request of the corporation as a director, officer, employee or agent of another corporation, partnership, joint venture, trust or other enterprise against expenses (including attorneys’ fees) actually and reasonably incurred by him in connection with the defense or settlement of such action or suit if the person acted in good faith and in a manner the person reasonably believed to be in or not opposed to the best interests of the corporation and except that no indemnification shall be made with respect to any claim, issue or matter as to which such person shall have been adjudged to be liable to the corporation unless
II-1
Table of Contents
and only to the extent that the Court of Chancery or the court in which such action or suit was brought shall determine upon application that, despite the adjudication of liability but in view of all the circumstances of the case, such person is fairly and reasonably entitled to indemnity for such expenses which the Court of Chancery or such other court shall deem proper.
As permitted by the Delaware General Corporation Law, we have included in our restated certificate of incorporation a provision to eliminate the personal liability of our directors for monetary damages for breach of their fiduciary duties as directors, subject to certain exceptions. In addition, our restated certificate of incorporation and bylaws provide that we are required to indemnify our officers and directors under certain circumstances, including those circumstances in which indemnification would otherwise be discretionary, and we are required to advance expenses to our officers and directors as incurred in connection with proceedings against them for which they may be indemnified.
We intend to enter into indemnification agreements with our directors and officers. These agreements will provide broader indemnity rights than those provided under the Delaware General Corporation Law and our restated certificate of incorporation and by-laws. The indemnification agreements are not intended to deny or otherwise limit third party or derivative suits against us or our directors or officers, but to the extent a director or officer were entitled to indemnity or contribution under the indemnification agreement, the financial burden of a third party suit would be borne by us, and we would not benefit from derivative recoveries against the director or officer. Such recoveries would accrue to our benefit but would be offset by our obligations to the director or officer under the indemnification agreement.
The underwriting agreement provides that the underwriters are obligated, under certain circumstances, to indemnify our directors, officers and controlling persons against certain liabilities, including liabilities under the Securities Act. Reference is made to the form of underwriting agreement filed as Exhibit 1.1 hereto.
We maintain directors’ and officers’ liability insurance for the benefit of our directors and officers.
Item 15. Recent sales of unregistered securities.
Equity securities
During the year ended December 26, 2009, we issued and sold 565,316.79 shares of Class A Common Stock and 62,812.98 shares of Class L Common Stock for aggregate consideration of $2,885,000. These shares were issued without registration in reliance on the exemptions afforded by Section 4(2) of the Securities Act of 1933, as amended, and Rules 506 and 701 promulgated thereunder.
During the year ended December 25, 2010, we issued and sold 127,715.24 shares of Class A Common Stock and 14,190.58 shares of Class L Common Stock for aggregate consideration of $895,000. These shares were issued without registration in reliance on the exemptions afforded by Section 4(2) of the Securities Act of 1933, as amended, and Rules 506 and 701 promulgated thereunder.
Through March 26, 2011, we have issued and sold 589,342.89 shares of Class A Common Stock and 65,482.54 shares of Class L Common Stock in 2011 for aggregate consideration of $3,213,883. These shares were issued without registration in reliance on the exemptions afforded by Section 4(2) of the Securities Act of 1933, as amended, and Rules 506 and 701 promulgated thereunder.
Debt securities
On November 23, 2010, Dunkin’ Brands, Inc., our wholly-owned subsidiary (“DBI”), issued $625.0 million aggregate principal amount of 9 5/8% senior notes due 2018 at a price of 98.5% of their face value resulting in approximately $615.6 million of gross proceeds. The proceeds were used, together with borrowings under DBI’s
II-2
Table of Contents
senior credit facility and cash on hand, to repay outstanding indebtedness, to distribute cash proceeds to us for payment of a dividend and to pay related fees and expenses. The initial purchasers for the senior notes were J.P. Morgan Securities LLC, Barclays Capital Inc., Merrill Lynch, Pierce, Fenner & Smith Incorporated, Goldman, Sachs & Co., Citigroup Global Capital Markets Inc., Credit Suisse Securities (USA) LLC, Deutsche Bank Securities Inc., and Morgan Stanley & Co. Incorporated. The aggregate amount of the initial purchasers’ discount on the senior notes was approximately $9.4 million.
The senior notes were offered and sold to the initial purchasers in reliance on the exemption afforded by Section 4(2) of the Securities Act of 1933, as amended, and Rule 506 promulgated thereunder and were offered and resold by the initial purchasers to qualified institutional buyers pursuant to Rule 144A under the Securities Act and to non-U.S. investors outside the United States in compliance with Regulation S of the Securities Act.
Item 16. Exhibits and financial statement schedules.
(a)Exhibits
| Exhibit Number |
Exhibit Title | |
| 1.1 | Form of Underwriting Agreement | |
| 3.1** | Form of Second Restated Certificate of Incorporation of Dunkin’ Brands Group, Inc. | |
| 3.2** | Form of Second Amended and Restated Bylaws of Dunkin’ Brands Group, Inc. | |
| 4.1** | Form of Amended and Restated Registration Rights and Coordination Agreement among Dunkin’ Brands Group, Inc. (f/k/a Dunkin’ Brands Group Holdings, Inc.), Dunkin’ Brands Holdings, Inc., Dunkin’ Brands, Inc. and Certain Stockholders of Dunkin’ Brands Group, Inc. | |
| 4.2* | Registration Rights Agreement among Dunkin’ Finance Corp, Dunkin’ Brands, Inc., J.P. Morgan Securities LLC, Barclays Capital Inc., Merrill Lynch, Pierce, Fenner & Smith Incorporated, Goldman, Sachs & Co., Citigroup Global Capital Markets Inc., Credit Suisse Securities (USA) LLC, Deutsche Bank Securities Inc. and Morgan Stanley & Co. Incorporated dated as of November 23, 2010 | |
| 4.3* | Indenture among Dunkin’ Finance Corp., the Guarantors party thereto from time to time, Citibank, N.A. as Indenture Administrator and Wilmington Trust Company, as Trustee, dated as of November 23, 2010 | |
| 4.4* | Form of 9.625% Senior Note due 2018 (filed with Exhibit 4.3 hereto) | |
| 4.5* | Supplemental Indenture among Dunkin’ Brands, Inc., the Guarantors named therein, Citibank, N.A., as indenture administrator and Wilmington Trust Company as trustee, dated as of December 3, 2010 | |
| 4.6** | Specimen Common Stock certificate of Dunkin’ Brands Group, Inc. | |
| 5.1** | Opinion of Ropes & Gray LLP | |
| 10.1* | Dunkin’ Brands Group, Inc. (f/k/a Dunkin’ Brands Group Holdings, Inc.) Amended and Restated 2006 Executive Incentive Plan | |
| 10.2* | Form of Option Award under 2006 Executive Incentive Plan | |
| 10.3* | Form of Restricted Stock Award under 2006 Executive Incentive Plan | |
| 10.4** | Form of Dunkin’ Brands Group, Inc. 2011 Omnibus Long-Term Incentive Plan | |
| 10.5** | Dunkin’ Brands Group, Inc. Annual Incentive Plan | |
| 10.6* | Amended and Restated Dunkin’ Brands, Inc. Non-Qualified Deferred Compensation Plan | |
| 10.7* | Dunkin’ Brands, Inc. Short Term Incentive Plan | |
II-3
Table of Contents
| Exhibit Number |
Exhibit Title | |
| 10.8* | Amended and Restated Executive Employment Agreement among Dunkin’ Brands, Inc., Dunkin’ Brands Group, Inc. (f/k/a Dunkin’ Brands Group Holdings, Inc.), and Jon Luther, dated as of December 31, 2008 | |
| 10.9* | Transition Agreement of Jon Luther, dated as of June 30, 2010 | |
| 10.10* | First Amended and Restated Executive Employment Agreement between Dunkin’ Brands, Inc., Dunkin’ Brands Group, Inc. and Nigel Travis | |
| 10.11* | Amended and Restated Executive Employment Agreement among Dunkin’ Brands, Inc., Dunkin’ Brands Group, Inc. (f/k/a Dunkin’ Brands Group Holdings, Inc.), and Kate Smith Lavelle, dated as of January 1, 2008 | |
| 10.12* | Transition Agreement of Kate Smith Lavelle, dated as of July 19, 2010 | |
| 10.13* | Offer Letter to Neil Moses dated September 27, 2010 | |
| 10.14* | Offer Letter to Richard Emmett dated November 23, 2009 | |
| 10.15* | Offer Letter to John Costello dated September 30, 2009 | |
| 10.16* | Offer Letter to Paul Twohig dated September 10, 2009 | |
| 10.17* | Form of Non-Competition/Non-Solicitation/Confidentiality Agreement | |
| 10.18** | Form of Amended and Restated Investor Agreement among Dunkin’ Brands Group, Inc. (f/k/a Dunkin’ Brands Group Holdings, Inc.), Dunkin’ Brands Holdings, Inc., Dunkin’ Brands, Inc. and the Investors named therein | |
| 10.19** | Form of Amended and Restated Stockholders Agreement among Dunkin’ Brands Group, Inc. (f/k/a Dunkin’ Brands Group Holdings, Inc.), Dunkin’ Brands Holdings, Inc., Dunkin’ Brands, Inc. and the Stockholders named therein | |
| 10.20* | Credit Agreement among Dunkin’ Finance Corp, Dunkin’ Brands Holdings, Inc., Dunkin’ Brands, Inc., Barclays Bank PLC and the other lenders party thereto, dated as of November 23, 2010 | |
| 10.21* | Joinder to Credit Agreement dated as of December 3, 2010 | |
| 10.22* | Amendment 1, dated as of February 18, 2011, to the Credit Agreement among Dunkin’ Brands, Inc., Dunkin’ Brands Holdings, Inc., Barclays Bank PLC and the other lenders party thereto | |
| 10.23* | Security Agreement among the Grantors identified therein and Barclays Bank PLC, dated as of December 3, 2010 | |
| 10.24* | Form of Director and Officer Indemnification Agreement | |
| 10.25* | Lease between LSF3 Royall Street, LLC and Dunkin’ Donuts Incorporated, dated as of October 29, 2003 | |
| 10.26* | Assignment of Lease between Dunkin’ Donuts Incorporated and Dunkin’ Brands, Inc., dated as of July 22, 2005 | |
| 10.27* | Guaranty delivered with LSF3 Royall Street, LLC Lease dated as of October 29, 2003 | |
| 10.28* | Management Agreement among Dunkin’ Brands Acquisition, Inc., Dunkin’ Brands Holdings, Inc., Dunkin’ Brands Group Holdings, Inc., Bain Capital Partners, LLC, TC Group IV, L.L.C. and THL Managers V, LLC, dated as of March 1, 2006 | |
| 10.29* | Amendment 2, dated as of May 25, 2011, to the Credit Agreement among Dunkin’ Brands, Inc., Dunkin’ Brands Holdings, Inc., Barclays Bank PLC and the other lenders party thereto | |
II-4
Table of Contents
| Exhibit Number |
Exhibit Title | |
| 10.30 | Form of Baskin-Robbins Franchise Agreement | |
| 10.31 | Form of Dunkin’ Donuts Franchise Agreement | |
| 10.32 | Form of Combined Baskin-Robbins and Dunkin’ Donuts Franchise Agreement | |
| 21.1 | Subsidiaries of Dunkin’ Brands Group, Inc. | |
| 23.1 | Consent of KPMG LLP | |
| 23.2 | Consent of Deloitte Anjin LLC | |
| 23.3 | Consent of PricewaterhouseCoopers Aarata | |
| 23.4** | Consent of Ropes & Gray LLP (included in Exhibit 5.1) | |
| 23.5 | Consent of The NPD Group, Inc. | |
| 24.1* | Powers of Attorney | |
| * | Previously filed. |
| ** | To be filed by amendment. |
(b) Financial Statement Schedules
All schedules are omitted because they are not applicable or the required information is included in the financial statements or notes thereto.
II-5
Table of Contents
Item 17. Undertakings.
The undersigned Registrant hereby undertakes:
(1) That for purposes of determining any liability under the Securities Act of 1933, the information omitted from the form of prospectus filed as part of this registration statement in reliance upon Rule 430A and contained in a form of prospectus filed by the Registrant pursuant to Rule 424(b)(1) or (4) or 497(h) under the Securities Act of 1933 shall be deemed to be part of this registration statement as of the time it was declared effective.
(2) That for the purpose of determining any liability under the Securities Act of 1933, each post-effective amendment that contains a form of prospectus shall be deemed to be a new registration statement relating to the securities offered therein, and the offering of such securities at that time shall be deemed to be the initial bona fide offering thereof.
(3) Insofar as indemnification for liabilities arising under the Securities Act of 1933 may be permitted to directors, officers and controlling persons of the Registrant pursuant to the foregoing provisions, or otherwise, the Registrant has been advised that in the opinion of the Securities and Exchange Commission such indemnification is against public policy as expressed in the Securities Act of 1933 and is, therefore, unenforceable. In the event that a claim for indemnification against such liabilities (other than the payment by the Registrant of expenses incurred or paid by a director, officer or controlling person of the Registrant in the successful defense of any action, suit or proceeding) is asserted by such director, officer or controlling person in connection with the securities being registered, the Registrant will, unless in the opinion of its counsel the matter has been settled by controlling precedent, submit to a court of appropriate jurisdiction the question whether such indemnification by it is against public policy as expressed in the Securities Act of 1933 and will be governed by the final adjudication of such issue.
(4) To provide to the underwriters at the closing specified in the underwriting agreements certificates in such denominations and registered in such names as required by the underwriters to permit prompt delivery to each purchaser.
II-6
Table of Contents
Signatures
Pursuant to the requirements of the Securities Act of 1933, the registrant has duly caused this registration statement to be signed on its behalf by the undersigned, thereunto duly authorized, in the City of Canton, Commonwealth of Massachusetts on the 23rd day of June, 2011.
| DUNKIN’ BRANDS GROUP, INC. | ||
| By: |
/s/ Nigel Travis | |
| Name: Title: |
Nigel Travis Chief Executive Officer | |
Pursuant to the requirements of the Securities Act of 1933, this registration statement has been signed by the following persons in the capacities held on the dates indicated.
| Signature | Title | Date | ||
| * Nigel Travis |
Chief Executive Officer and Director (Principal Executive Officer) |
June 23, 2011 | ||
| * Neil Moses |
Chief Financial Officer (Principal Financial and Accounting Officer) |
June 23, 2011 | ||
| * Jon Luther |
Director | June 23, 2011 | ||
| * Todd Abbrecht |
Director | June 23, 2011 | ||
| * Anita Balaji |
Director | June 23, 2011 | ||
| * Andrew B. Balson |
Director | June 23, 2011 | ||
| * Anthony J. DiNovi |
Director | June 23, 2011 | ||
| * Sandra J. Horbach |
Director | June 23, 2011 | ||
| * Mark Nunnelly |
Director | June 23, 2011 | ||
| *By: |
/s/ Richard J. Emmett Richard J. Emmett Attorney-in-fact | |||
II-7
Table of Contents
Exhibit list
Exhibits and financial statements schedules.
| Exhibit number |
Exhibit title | |
| 1.1 | Form of Underwriting Agreement | |
| 3.1** | Form of Second Restated Certificate of Incorporation of Dunkin’ Brands Group, Inc. | |
| 3.2** | Form of Second Amended and Restated Bylaws of Dunkin’ Brands Group, Inc. | |
| 4.1** | Form of Amended and Restated Registration Rights and Coordination Agreement among Dunkin’ Brands Group, Inc. (f/k/a Dunkin’ Brands Group Holdings, Inc.), Dunkin’ Brands Holdings, Inc., Dunkin’ Brands, Inc. and Certain Stockholders of Dunkin’ Brands Group, Inc. | |
| 4.2* | Registration Rights Agreement among Dunkin’ Finance Corp, Dunkin’ Brands, Inc., J.P. Morgan Securities LLC, Barclays Capital Inc., Merrill Lynch, Pierce, Fenner & Smith Incorporated, Goldman, Sachs & Co., Citigroup Global Capital Markets Inc., Credit Suisse Securities (USA) LLC, Deutsche Bank Securities Inc. and Morgan Stanley & Co. Incorporated dated as of November 23, 2010 | |
| 4.3* | Indenture among Dunkin’ Finance Corp., the Guarantors party thereto from time to time, Citibank, N.A. as Indenture Administrator and Wilmington Trust Company, as Trustee, dated as of November 23, 2010 | |
| 4.4* | Form of 9.625% Senior Note due 2018 (filed with Exhibit 4.3 hereto) | |
| 4.5* | Supplemental Indenture among Dunkin’ Brands, Inc., the Guarantors named therein, Citibank, N.A., as indenture administrator and Wilmington Trust Company as trustee, dated as of December 3, 2010 | |
| 4.6** | Specimen Common Stock certificate of Dunkin’ Brands Group, Inc. | |
| 5.1** | Opinion of Ropes & Gray LLP | |
| 10.1* | Dunkin’ Brands Group, Inc. (f/k/a Dunkin’ Brands Group Holdings, Inc.) Amended and Restated 2006 Executive Incentive Plan | |
| 10.2* | Form of Option Award under 2006 Executive Incentive Plan | |
| 10.3* | Form of Restricted Stock Award under 2006 Executive Incentive Plan | |
| 10.4** | Dunkin’ Brands Group, Inc. 2011 Omnibus Long-Term Incentive Plan | |
| 10.5** | Dunkin’ Brands Group, Inc. Annual Incentive Plan | |
| 10.6* | Amended and Restated Dunkin’ Brands, Inc. Non-Qualified Deferred Compensation Plan | |
| 10.7* | Dunkin’ Brands, Inc. Short Term Incentive Plan | |
| 10.8* | Amended and Restated Executive Employment Agreement among Dunkin’ Brands, Inc., Dunkin’ Brands Group, Inc. (f/k/a Dunkin’ Brands Group Holdings, Inc.), and Jon Luther, dated as of December 31, 2008 | |
| 10.9* | Transition Agreement of Jon Luther, dated as of June 30, 2010 | |
| 10.10* | First Amended and Restated Executive Employment Agreement between Dunkin’ Brands, Inc., Dunkin’ Brands Group, Inc. and Nigel Travis | |
| 10.11* | Amended and Restated Executive Employment Agreement among Dunkin’ Brands, Inc., Dunkin’ Brands Group, Inc. (f/k/a Dunkin’ Brands Group Holdings, Inc.), and Kate Smith Lavelle, dated as of January 1, 2008 | |
| 10.12* | Transition Agreement of Kate Smith Lavelle, dated as of July 19, 2010 | |
| 10.13* | Offer Letter to Neil Moses dated September 27, 2010 | |
| 10.14* | Offer Letter to Richard Emmett dated November 23, 2009 | |
| 10.15* | Offer Letter to John Costello dated September 30, 2009 | |
Table of Contents
| Exhibit number |
Exhibit title | |
| 10.16* | Offer Letter to Paul Twohig dated September 10, 2009 | |
| 10.17* | Form of Non-Competition/Non-Solicitation/Confidentiality Agreement | |
| 10.18** | Form of Amended and Restated Investor Agreement among Dunkin’ Brands Group, Inc. (f/k/a Dunkin’ Brands Group Holdings, Inc.), Dunkin’ Brands Holdings, Inc., Dunkin’ Brands, Inc. and the Investors named therein | |
| 10.19** | Form of Amended and Restated Stockholders Agreement among Dunkin’ Brands Group, Inc. (f/k/a Dunkin’ Brands Group Holdings, Inc.), Dunkin’ Brands Holdings, Inc., Dunkin’ Brands, Inc. and the Stockholders named therein | |
| 10.20* | Credit Agreement among Dunkin’ Finance Corp, Dunkin’ Brands Holdings, Inc., Dunkin’ Brands, Inc., Barclays Bank PLC and the other lenders party thereto, dated as of November 23, 2010 | |
| 10.21* | Joinder to Credit Agreement dated as of December 3, 2010 | |
| 10.22* | Amendment 1, dated as of February 18, 2011, to the Credit Agreement among Dunkin’ Brands, Inc., Dunkin’ Brands Holdings, Inc., Barclays Bank PLC and the other lenders party thereto | |
| 10.23* | Security Agreement among the Grantors identified therein and Barclays Bank PLC, dated as of December 3, 2010 | |
| 10.24* | Form of Director and Officer Indemnification Agreement | |
| 10.25* | Lease between LSF3 Royall Street, LLC and Dunkin’ Donuts Incorporated, dated as of October 29, 2003 | |
| 10.26* | Assignment of Lease between Dunkin’ Donuts Incorporated and Dunkin’ Brands, Inc., dated as of July 22, 2005 | |
| 10.27* | Guaranty delivered with LSF3 Royall Street, LLC Lease, dated as of October 29, 2003 | |
| 10.28* | Management Agreement among Dunkin’ Brands Acquisition, Inc., Dunkin’ Brands Holdings, Inc., Dunkin’ Brands Group Holdings, Inc., Bain Capital Partners, LLC, TC Group IV, L.L.C. and THL Managers V, LLC, dated as of March 1, 2006 | |
| 10.29* | Amendment 2, dated as of May 25, 2011, to the Credit Agreement among Dunkin’ Brands, Inc., Dunkin’ Brands Holdings, Inc., Barclays Bank PLC and the other lenders party thereto | |
| 10.30 | Form of Baskin-Robbins Franchise Agreement | |
| 10.31 | Form of Dunkin’ Donuts Franchise Agreement | |
| 10.32 | Form of Combined Baskin-Robbins and Dunkin’ Donuts Franchise Agreement | |
| 21.1 | Subsidiaries of Dunkin’ Brands Group, Inc. | |
| 23.1 | Consent of KPMG LLP | |
| 23.2 | Consent of Deloitte Anjin LLC | |
| 23.3 | Consent of PricewaterhouseCoopers Aarata | |
| 23.4** | Consent of Ropes & Gray LLP (included in Exhibit 5.1) | |
| 23.5 | Consent of The NPD Group, Inc. | |
| 24.1* | Powers of Attorney | |
| * | Previously filed. |
| ** | To be filed by amendment. |