SANDRIDGE ENERGY INCSDAccelerated Filer10-QMarch 31, 20192019Q1falseFALSEFALSE35,686,4300001349436--12-310.0010.001250,000250,00035,68735,68735,68735,687351300013494362019-01-012019-03-31xbrli:shares00013494362019-05-02iso4217:USD00013494362019-03-3100013494362018-12-31iso4217:USDxbrli:shares0001349436us-gaap:OilAndGasMember2019-01-012019-03-310001349436us-gaap:OilAndGasMember2018-01-012018-03-310001349436sd:OtherRevenueSourceMember2019-01-012019-03-310001349436sd:OtherRevenueSourceMember2018-01-012018-03-3100013494362018-01-012018-03-310001349436us-gaap:CommonStockMember2018-12-310001349436us-gaap:WarrantMember2018-12-310001349436us-gaap:AdditionalPaidInCapitalMember2018-12-310001349436us-gaap:RetainedEarningsMember2018-12-310001349436us-gaap:AdditionalPaidInCapitalMember2019-01-012019-03-310001349436us-gaap:WarrantMember2019-01-012019-03-310001349436us-gaap:RetainedEarningsMember2019-01-0100013494362019-01-010001349436us-gaap:RetainedEarningsMember2019-01-012019-03-310001349436us-gaap:CommonStockMember2019-03-310001349436us-gaap:WarrantMember2019-03-310001349436us-gaap:AdditionalPaidInCapitalMember2019-03-310001349436us-gaap:RetainedEarningsMember2019-03-310001349436us-gaap:CommonStockMember2017-12-310001349436us-gaap:WarrantMember2017-12-310001349436us-gaap:AdditionalPaidInCapitalMember2017-12-310001349436us-gaap:RetainedEarningsMember2017-12-3100013494362017-12-310001349436us-gaap:CommonStockMember2018-01-012018-03-310001349436us-gaap:AdditionalPaidInCapitalMember2018-01-012018-03-310001349436us-gaap:RetainedEarningsMember2018-01-012018-03-310001349436us-gaap:CommonStockMember2018-03-310001349436us-gaap:WarrantMember2018-03-310001349436us-gaap:AdditionalPaidInCapitalMember2018-03-310001349436us-gaap:RetainedEarningsMember2018-03-3100013494362018-03-310001349436us-gaap:AccountingStandardsUpdate201602Member2019-01-010001349436sd:ExecutiveEmployeeTerminationBenefitsMember2018-01-012018-03-310001349436sd:OtherEmployeeTerminationBenefitsMember2018-01-012018-03-310001349436us-gaap:FairValueInputsLevel1Memberus-gaap:CommodityContractMemberus-gaap:FairValueMeasurementsRecurringMember2018-12-310001349436us-gaap:FairValueInputsLevel2Memberus-gaap:CommodityContractMemberus-gaap:FairValueMeasurementsRecurringMember2018-12-310001349436us-gaap:CommodityContractMemberus-gaap:FairValueInputsLevel3Memberus-gaap:FairValueMeasurementsRecurringMember2018-12-310001349436us-gaap:CommodityContractMemberus-gaap:FairValueMeasurementsRecurringMember2018-12-310001349436us-gaap:FairValueInputsLevel1Memberus-gaap:FairValueMeasurementsRecurringMember2018-12-310001349436us-gaap:FairValueInputsLevel2Memberus-gaap:FairValueMeasurementsRecurringMember2018-12-310001349436us-gaap:FairValueInputsLevel3Memberus-gaap:FairValueMeasurementsRecurringMember2018-12-310001349436us-gaap:FairValueMeasurementsRecurringMember2018-12-310001349436us-gaap:LandMember2019-03-310001349436us-gaap:LandMember2018-12-310001349436us-gaap:ElectricTransmissionAndDistributionMember2019-03-310001349436us-gaap:ElectricTransmissionAndDistributionMember2018-12-310001349436us-gaap:OtherCapitalizedPropertyPlantAndEquipmentMember2019-03-310001349436us-gaap:OtherCapitalizedPropertyPlantAndEquipmentMember2018-12-310001349436us-gaap:BuildingMember2019-03-310001349436us-gaap:BuildingMember2018-12-310001349436sd:FinanceLeasesMember2019-03-310001349436sd:FinanceLeasesMember2018-12-310001349436sd:MidstreamGeneratorAssetsMember2018-03-310001349436sd:MidstreamGeneratorAssetsMember2018-01-012018-03-310001349436sd:MidstreamGeneratorAssetsMember2018-04-012018-06-300001349436sd:CreditFacilityMemberus-gaap:RevolvingCreditFacilityMember2019-03-31xbrli:pure0001349436srt:MinimumMembersd:CreditFacilityMemberus-gaap:LondonInterbankOfferedRateLIBORMemberus-gaap:RevolvingCreditFacilityMember2019-01-012019-03-310001349436srt:MaximumMembersd:CreditFacilityMemberus-gaap:LondonInterbankOfferedRateLIBORMemberus-gaap:RevolvingCreditFacilityMember2019-01-012019-03-310001349436srt:MinimumMemberus-gaap:BaseRateMembersd:CreditFacilityMemberus-gaap:RevolvingCreditFacilityMember2019-01-012019-03-310001349436us-gaap:BaseRateMembersrt:MaximumMembersd:CreditFacilityMemberus-gaap:RevolvingCreditFacilityMember2019-01-012019-03-310001349436sd:CreditFacilityMemberus-gaap:RevolvingCreditFacilityMember2019-01-012019-03-310001349436sd:NewBuildingNoteMemberus-gaap:SecuredDebtMember2018-02-012018-02-280001349436sd:NewBuildingNoteMemberus-gaap:SecuredDebtMember2016-10-040001349436sd:NewBuildingNoteMemberus-gaap:SecuredDebtMember2016-10-042017-05-110001349436sd:NewBuildingNoteMemberus-gaap:SecuredDebtMember2018-01-012018-03-310001349436us-gaap:CommodityContractMember2019-01-012019-03-310001349436us-gaap:CommodityContractMember2018-01-012018-03-310001349436sd:CurrentAssetsMember2018-12-310001349436sd:NaturalGasPriceSwapMembersd:CurrentAssetsMember2018-12-310001349436us-gaap:RestrictedStockMember2019-03-310001349436us-gaap:PerformanceSharesMember2019-03-310001349436sd:SeriesAWarrantsMember2019-01-012019-03-310001349436sd:SeriesBWarrantsMember2019-01-012019-03-310001349436sd:SeriesAWarrantsMember2019-03-310001349436sd:SeriesBWarrantsMember2019-03-310001349436us-gaap:DomesticCountryMemberus-gaap:EarliestTaxYearMember2019-01-012019-03-310001349436us-gaap:EarliestTaxYearMember2019-01-012019-03-310001349436us-gaap:LatestTaxYearMember2019-01-012019-03-310001349436srt:MinimumMember2019-01-012019-03-310001349436srt:MaximumMember2019-01-012019-03-310001349436us-gaap:RestrictedStockMember2019-01-012019-03-310001349436us-gaap:EmployeeStockOptionMember2019-01-012019-03-310001349436us-gaap:PerformanceSharesMember2019-01-012019-03-310001349436us-gaap:WarrantMember2019-01-012019-03-310001349436us-gaap:WarrantMember2018-01-012018-03-310001349436us-gaap:RestrictedStockMember2018-01-012018-03-3100013494362016-10-310001349436us-gaap:PerformanceSharesMember2018-01-012018-03-310001349436us-gaap:RestrictedStockMember2019-01-012019-03-310001349436sd:RecurringCompensationExpenseMemberus-gaap:RestrictedStockMember2019-01-012019-03-310001349436us-gaap:RestrictedStockMembersd:ExecutiveTerminationsMember2019-01-012019-03-310001349436us-gaap:RestrictedStockMembersd:ReductionInForceMember2019-01-012019-03-310001349436sd:RecurringCompensationExpenseMemberus-gaap:PerformanceSharesMember2019-01-012019-03-310001349436us-gaap:PerformanceSharesMembersd:ExecutiveTerminationsMember2019-01-012019-03-310001349436us-gaap:PerformanceSharesMembersd:ReductionInForceMember2019-01-012019-03-310001349436us-gaap:PerformanceSharesMember2019-01-012019-03-310001349436sd:RecurringCompensationExpenseMemberus-gaap:EmployeeStockOptionMember2019-01-012019-03-310001349436us-gaap:EmployeeStockOptionMembersd:ExecutiveTerminationsMember2019-01-012019-03-310001349436us-gaap:EmployeeStockOptionMembersd:ReductionInForceMember2019-01-012019-03-310001349436us-gaap:EmployeeStockOptionMember2019-01-012019-03-310001349436sd:RecurringCompensationExpenseMember2019-01-012019-03-310001349436sd:ExecutiveTerminationsMember2019-01-012019-03-310001349436sd:ReductionInForceMember2019-01-012019-03-310001349436sd:RecurringCompensationExpenseMemberus-gaap:RestrictedStockMember2018-01-012018-03-310001349436us-gaap:RestrictedStockMembersd:ExecutiveTerminationsMember2018-01-012018-03-310001349436us-gaap:RestrictedStockMembersd:ReductionInForceMember2018-01-012018-03-310001349436us-gaap:RestrictedStockMember2018-01-012018-03-310001349436sd:RecurringCompensationExpenseMemberus-gaap:PerformanceSharesMember2018-01-012018-03-310001349436us-gaap:PerformanceSharesMembersd:ExecutiveTerminationsMember2018-01-012018-03-310001349436us-gaap:PerformanceSharesMembersd:ReductionInForceMember2018-01-012018-03-310001349436sd:RecurringCompensationExpenseMember2018-01-012018-03-310001349436sd:ExecutiveTerminationsMember2018-01-012018-03-310001349436sd:ReductionInForceMember2018-01-012018-03-310001349436srt:MinimumMemberus-gaap:RestrictedStockMember2019-01-012019-03-310001349436srt:MaximumMemberus-gaap:RestrictedStockMember2019-01-012019-03-310001349436srt:OilReservesMember2019-01-012019-03-310001349436srt:OilReservesMember2018-01-012018-03-310001349436srt:NaturalGasLiquidsReservesMember2019-01-012019-03-310001349436srt:NaturalGasLiquidsReservesMember2018-01-012018-03-310001349436srt:NaturalGasReservesMember2019-01-012019-03-310001349436srt:NaturalGasReservesMember2018-01-012018-03-310001349436sd:RevenueReceivableFromContractWithCustomersMember2019-03-310001349436sd:RevenueReceivableFromContractWithCustomersMember2018-12-31
UNITED STATES
SECURITIES AND EXCHANGE COMMISSION
Washington, D.C. 20549
(Mark One)
| | | | | |
þ | QUARTERLY REPORT PURSUANT TO SECTION 13 OR 15(d) OF THE SECURITIES EXCHANGE ACT OF 1934 |
For the quarterly period ended March 31, 2019
OR
| | | | | |
o | TRANSITION REPORT PURSUANT TO SECTION 13 OR 15(d) OF THE SECURITIES EXCHANGE ACT OF 1934 |
For the transition period from to
Commission File Number: 001-33784
| | | | | | | | |
| | |
| SANDRIDGE ENERGY, INC. | | |
| (Exact name of registrant as specified in its charter) | | |
| | |
| | | | | | | | |
Delaware | | 20-8084793 |
(State or other jurisdiction of incorporation or organization) | | (I.R.S. Employer Identification No.) |
| | |
123 Robert S. Kerr Avenue Oklahoma City, Oklahoma | | 73102 |
(Address of principal executive offices) | | (Zip Code) |
Registrant’s telephone number, including area code: (405) 429-5500
Former name, former address and former fiscal year, if changed since last report: Not applicable
Indicate by check mark whether the registrant (1) has filed all reports required to be filed by Section 13 or 15 (d) of the Securities Exchange Act of 1934 during the preceding 12 months (or for such shorter period that the registrant was required to file such reports), and (2) has been subject to such filing requirements for the past 90 days. Yes þ No o
Indicate by check mark whether the registrant has submitted electronically every Interactive Data File required to be submitted pursuant to Rule 405 of Regulation S-T during the preceding 12 months (or for such shorter period that the registrant was required to submit such files). Yes þ No o
Indicate by check mark whether the registrant is a large accelerated filer, an accelerated filer, a non-accelerated filer, a smaller reporting company, or an emerging growth company. See the definitions of “large accelerated filer,” “accelerated filer,” “smaller reporting company,” and “emerging growth company” in Rule 12b-2 of the Exchange Act.
| | | | | | | | | | | | | | |
| Large accelerated filer | o | | Accelerated filer | þ
|
| Non-accelerated filer | o
| | Smaller reporting company | o |
| | | Emerging growth company | o |
If an emerging growth company, indicate by check mark if the registrant has elected not to use the extended transition period for complying with any new or revised financial accounting standards provided pursuant to Section 13(a) of the Exchange Act. o
Indicate by check mark whether the registrant is a shell company (as defined in Rule 12b-2 of the Exchange Act). Yes o No þ
Indicate by check mark whether the registrant has filed all documents and reports required to be filed by Sections 12, 13, or 15(d) of the Securities Exchange Act of 1934 subsequent to the distribution of securities under a plan confirmed by a court. Yes þ No o
Securities registered pursuant to Section 12(b) of the Act:
| | | | | | | | | | | | | | |
| Title of Each Class | | Trading Symbol | | Name of Each Exchange on Which Registered |
| Common Stock, $0.001 par value | | SD | | New York Stock Exchange |
The number of shares outstanding of the registrant’s common stock, par value $0.001 per share, as of the close of business on May 2, 2019, was 35,686,430.
References in this report to the “Company,” “SandRidge,” “we,” “our,” and “us” mean SandRidge Energy, Inc., including its consolidated subsidiaries and its proportionately consolidated share of each of SandRidge Mississippian Trust I and SandRidge Mississippian Trust II for periods ending March 31, 2019 and December 31, 2018 and SandRidge Permian Trust for the period ending March 31, 2018 (collectively, the “Royalty Trusts”).
DISCLOSURES REGARDING FORWARD-LOOKING STATEMENTS
This Quarterly Report on Form 10-Q (“Quarterly Report”) of the Company includes “forward-looking statements” as defined by the SEC. These forward-looking statements may include projections and estimates concerning our capital expenditures, liquidity, capital resources and debt profile, the timing and success of specific projects, outcomes and effects of litigation, claims and disputes, elements of our business strategy, compliance with governmental regulation of the oil and natural gas industry, including environmental regulations, acquisitions and divestitures and the potential effects on our financial condition and other statements concerning our operations, financial performance and financial condition. Forward-looking statements are generally accompanied by words such as “estimate,” “assume,” “target,” “project,” “predict,” “believe,” “expect,” “anticipate,” “potential,” “could,” “may,” “foresee,” “plan,” “goal,” “should,” “intend” or other words that convey the uncertainty of future events or outcomes. These forward-looking statements are based on certain assumptions and analyses based on our experience and perception of historical trends, current conditions and expected future developments as well as other factors we believe are appropriate under the circumstances. Such statements are not guarantees of future performance and actual results or developments may differ materially from those projected. The Company disclaims any obligation to update or revise these forward-looking statements unless required by law, and it cautions readers not to rely on them unduly. While we consider these expectations and assumptions to be reasonable, they are inherently subject to significant business, economic, competitive, regulatory and other risks, contingencies and uncertainties relating to, among other matters, the risks and uncertainties discussed in “Risk Factors” in Item 1A of the Company’s Annual Report on Form 10-K for the fiscal year ended December 31, 2018 (the “2018 Form 10-K”) and in Item 1A of this Quarterly Report.
SANDRIDGE ENERGY, INC. AND SUBSIDIARIES
FORM 10-Q
Quarter Ended March 31, 2019
INDEX
| | | | | | | | |
| | |
| | |
ITEM 1. | | |
| | |
| | |
| | |
| | |
| | |
ITEM 2. | | |
ITEM 3. | | |
ITEM 4. | | |
| | |
| | |
| | |
ITEM 1. | | |
ITEM 1A. | | |
ITEM 2. | | |
ITEM 3. | | |
ITEM 6. | | |
| | |
PART I. Financial Information
ITEM 1. Financial Statements
SANDRIDGE ENERGY, INC. AND SUBSIDIARIES
CONDENSED CONSOLIDATED BALANCE SHEETS (Unaudited)
(In thousands, except per share data)
| | | | | | | | | | | |
| March 31,
2019 | | December 31, 2018 |
ASSETS | | | |
| Current assets | | | |
| Cash and cash equivalents | $ | 7,354 | | $ | 17,660 |
| | | |
| Restricted cash - other | 1,981 | | 1,985 |
| Accounts receivable, net | 51,053 | | 45,503 |
| Derivative contracts | — | | 5,286 |
| Prepaid expenses | 3,128 | | 2,628 |
| Other current assets | 251 | | 265 |
| Total current assets | 63,767 | | 73,327 |
| Oil and natural gas properties, using full cost method of accounting | | | |
| Proved | 1,344,552 | | 1,269,091 |
| Unproved | 57,363 | | 60,152 |
| Less: accumulated depreciation, depletion and impairment | (614,972) | | (580,132) |
| 786,943 | | 749,111 |
| Other property, plant and equipment, net | 200,014 | | 200,838 |
| | | |
| Other assets | 820 | | 1,062 |
| Total assets | $ | 1,051,544 | | $ | 1,024,338 |
| | | | | | | | | | | |
| | | |
| LIABILITIES AND STOCKHOLDERS’ EQUITY | | | |
| Current liabilities | | | |
| Accounts payable and accrued expenses | $ | 119,436 | | $ | 111,797 |
| Current maturities of long-term debt | 20,000 | | — |
| | | |
| Asset retirement obligation | 25,355 | | 25,393 |
| Other current liabilities | 29 | | — |
| Total current liabilities | 164,820 | | 137,190 |
| | | |
| | | |
| Asset retirement obligation | 35,836 | | 34,671 |
| | | |
| Other long-term obligations | 7,428 | | 4,756 |
| Total liabilities | 208,084 | | 176,617 |
| Commitments and contingencies (Note 9) | | | |
| Stockholders’ Equity | | | |
Common stock, $0.001 par value; 250,000 shares authorized; 35,687 issued and outstanding at March 31, 2019 and December 31, 2018 | 36 | | 36 |
| Warrants | 88,518 | | 88,516 |
| Additional paid-in capital | 1,056,235 | | 1,055,164 |
| Accumulated deficit | (301,329) | | (295,995) |
| Total stockholders’ equity | 843,460 | | 847,721 |
| Total liabilities and stockholders’ equity | $ | 1,051,544 | | $ | 1,024,338 |
The accompanying notes are an integral part of these condensed consolidated financial statements.
SANDRIDGE ENERGY, INC. AND SUBSIDIARIES
CONDENSED CONSOLIDATED STATEMENTS OF OPERATIONS (Unaudited)
(In thousands, except per share data)
| | | | | | | | | | | | | | | | | | | |
| | | | | | Three Months Ended March 31, | | | |
| | | | | | 2019 | | | 2018 |
| Revenues | | | | | | | | | |
| Oil, natural gas and NGL | | | | | | $ | 73,048 | | | $ | 86,966 |
| Other | | | | | | 188 | | | 162 |
| Total revenues | | | | | | 73,236 | | | 87,128 |
| Expenses | | | | | | | | | |
| Lease operating expenses | | | | | | 22,779 | | | 23,519 |
| Production, ad valorem, and other taxes | | | | | | 5,080 | | | 6,234 |
| Depreciation and depletion — oil and natural gas | | | | | | 36,465 | | | 27,997 |
| Depreciation and amortization — other | | | | | | 2,943 | | | 3,153 |
| Impairment | | | | | | — | | | 4,170 |
| General and administrative | | | | | | 9,939 | | | 13,682 |
| | | | | | | | | |
| Proxy contest | | | | | | — | | | 407 |
| Employee termination benefits | | | | | | — | | | 31,587 |
| Loss on derivative contracts | | | | | | 209 | | | 18,330 |
| | | | | | | | | |
| Other operating expense | | | | | | 82 | | | 16 |
| Total expenses | | | | | | 77,497 | | | 129,095 |
| Loss from operations | | | | | | (4,261) | | | (41,967) |
| Other (expense) income | | | | | | | | | |
| Interest expense, net | | | | | | (585) | | | (948) |
| Gain on extinguishment of debt | | | | | | — | | | 1,151 |
| | | | | | | | | |
| Other (expense) income, net | | | | | | (431) | | | 873 |
| Total other (expense) income | | | | | | (1,016) | | | 1,076 |
| Loss before income taxes | | | | | | (5,277) | | | (40,891) |
| Income tax expense | | | | | | — | | | 3 |
| Net loss | | | | | | $ | (5,277) | | | $ | (40,894) |
| | | | | | | | | |
| | | | | | | | | |
| Loss per share | | | | | | | | | |
| Basic | | | | | | $ | (0.15) | | | $ | (1.18) |
| Diluted | | | | | | $ | (0.15) | | | $ | (1.18) |
| Weighted average number of common shares outstanding | | | | | | | | | |
| Basic | | | | | | 35,322 | | | 34,575 |
| Diluted | | | | | | 35,322 | | | 34,575 |
The accompanying notes are an integral part of these condensed consolidated financial statements.
SANDRIDGE ENERGY, INC. AND SUBSIDIARIES
CONDENSED CONSOLIDATED STATEMENT OF CHANGES IN STOCKHOLDERS’ EQUITY (Unaudited)
(In thousands)
| | | | | | | | | | | | | | | | | | | | | | | | | | | | | | | | | | | | | | | | | | | | | | |
| | Common Stock | | | | Warrants | | | | Additional Paid-In Capital | | | | Accumulated Deficit | | Total |
| | Shares | | Amount | | Shares | | Amount | | | | | | | | |
| Three Months Ended March 31, 2019 | | | | | | | | | | | | | | | | |
| Balance at December 31, 2018 | | 35,687 | | $ | 36 | | 6,604 | | $ | 88,516 | | $ | 1,055,164 | | | | $ | (295,995) | | $ | 847,721 |
| | | | | | | | | | | | | | | | |
| | | | | | | | | | | | | | | | |
| | | | | | | | | | | | | | | | |
Stock-based compensation | | — | | — | | — | | — | | 1,073 | | | | — | | 1,073 |
Issuance of warrants for general unsecured claims | | — | | — | | 1 | | 2 | | (2) | | | | — | | — |
Cumulative effect of adoption of ASU 2016-02 | | — | | — | | — | | — | | — | | | | (57) | | (57) |
Net loss | | — | | — | | — | | — | | — | | | | (5,277) | | (5,277) |
| Balance at March 31, 2019 | | 35,687 | | $ | 36 | | 6,605 | | $ | 88,518 | | $ | 1,056,235 | | | | $ | (301,329) | | $ | 843,460 |
| | | | | | | | | | | | | | | | | | | | | | | | | | | | | | | | | | | | | | | | | | | | | | |
| | Common Stock | | | | Warrants | | | | Additional Paid-In Capital | | | | Accumulated Deficit | | Total |
| | Shares | | Amount | | Shares | | Amount | | | | | | | | |
| Three Months Ended March 31, 2018 | | | | | | | | | | | | | | | | |
| Balance at December 31, 2017 | | 35,650 | | $ | 36 | | 6,570 | | $ | 88,500 | | $ | 1,038,324 | | | | $ | (286,920) | | $ | 839,940 |
Cancellation of stock awards, net of issuances | | (90) | | — | | — | | — | | — | | | | — | | — |
| | | | | | | | | | | | | | | | |
| | | | | | | | | | | | | | | | |
Stock-based compensation | | — | | — | | — | | — | | 16,055 | | | | — | | 16,055 |
| | | | | | | | | | | | | | | | |
Cash paid for tax withholdings on vested stock awards | | — | | — | | — | | — | | (1,661) | | | | — | | (1,661) |
Net loss | | — | | — | | — | | — | | — | | | | (40,894) | | (40,894) |
| Balance at March 31, 2018 | | 35,560 | | $ | 36 | | 6,570 | | $ | 88,500 | | $ | 1,052,718 | | | | $ | (327,814) | | $ | 813,440 |
The accompanying notes are an integral part of these condensed consolidated financial statements.
SANDRIDGE ENERGY, INC. AND SUBSIDIARIES
CONDENSED CONSOLIDATED STATEMENTS OF CASH FLOWS (Unaudited)
(In thousands)
| | | | | | | | | | | |
| Three Months Ended March 31, | | |
| 2019 | | 2018 |
| CASH FLOWS FROM OPERATING ACTIVITIES | | | |
| Net loss | $ | (5,277) | | $ | (40,894) |
| Adjustments to reconcile net loss to net cash provided by operating activities | | | |
| Provision for doubtful accounts | 72 | | (335) |
| Depreciation, depletion, and amortization | 39,408 | | 31,150 |
| Impairment | — | | 4,170 |
| | | |
| Debt issuance costs amortization | 117 | | 117 |
| Amortization of premiums and discounts on debt | — | | (47) |
| Gain on extinguishment of debt | — | | (1,151) |
| | | |
| | | |
| Loss on derivative contracts | 209 | | 18,330 |
| Cash received (paid) on settlement of derivative contracts | 5,078 | | (6,119) |
| | | |
| | | |
| Stock-based compensation | 996 | | 15,872 |
| Other | (35) | | (235) |
| Changes in operating assets and liabilities | (8,998) | | 9,549 |
| Net cash provided by operating activities | 31,570 | | 30,407 |
| CASH FLOWS FROM INVESTING ACTIVITIES | | | |
| Capital expenditures for property, plant and equipment | (62,254) | | (65,527) |
| Acquisition of assets | 326 | | — |
| Proceeds from sale of assets | 341 | | 955 |
| Net cash used in investing activities | (61,587) | | (64,572) |
| CASH FLOWS FROM FINANCING ACTIVITIES | | | |
| Proceeds from borrowings | 39,596 | | — |
| Repayments of borrowings | (19,596) | | (36,304) |
| Reduction of financing lease liability | (293) | | — |
| | | |
| Cash paid for tax withholdings on vested stock awards | — | | (1,661) |
| Net cash provided by (used in) financing activities | 19,707 | | (37,965) |
| NET DECREASE IN CASH, CASH EQUIVALENTS and RESTRICTED CASH | (10,310) | | (72,130) |
| CASH, CASH EQUIVALENTS and RESTRICTED CASH, beginning of year | 19,645 | | 101,308 |
| CASH, CASH EQUIVALENTS and RESTRICTED CASH, end of period | $ | 9,335 | | $ | 29,178 |
| Supplemental Disclosure of Cash Flow Information | | | |
| Cash paid for interest, net of amounts capitalized | $ | (408) | | $ | — |
| Supplemental Disclosure of Noncash Investing and Financing Activities | | | |
| | | |
| | | |
| Change in accrued capital expenditures | $ | (9,190) | | $ | 28,258 |
| Right-of-use assets obtained in exchange for financing lease obligations | $ | 1,992 | | $ | — |
| | | |
The accompanying notes are an integral part of these condensed consolidated financial statements.
SANDRIDGE ENERGY, INC. AND SUBSIDIARIES
NOTES TO CONDENSED CONSOLIDATED FINANCIAL STATEMENTS
(Unaudited)
1. Basis of Presentation
Nature of Business. SandRidge Energy, Inc. is an oil and natural gas exploration and production company headquartered in Oklahoma City, Oklahoma with principal focus on the acquisition, exploration and development of hydrocarbon resources in the United States.
Principles of Consolidation. The consolidated financial statements include the accounts of the Company and its wholly owned or majority owned subsidiaries, including its proportionate share of the Royalty Trusts. All significant intercompany accounts and transactions have been eliminated in consolidation.
Interim Financial Statements. The accompanying unaudited condensed consolidated financial statements and notes as of December 31, 2018 have been derived from and should be read in conjunction with the audited financial statements and notes contained in the Company’s 2018 Form 10-K. Certain information and disclosures normally included in financial statements prepared in accordance with accounting principles generally accepted in the United States of America (“GAAP”) have been condensed or omitted, although the Company believes that the disclosures contained herein are adequate to make the information presented not misleading. In the opinion of management, the financial statements include all adjustments, which consist of normal recurring adjustments unless otherwise disclosed, necessary to fairly state the Company’s unaudited condensed consolidated financial statements.
Significant Accounting Policies. The unaudited condensed consolidated financial statements were prepared in accordance with the accounting policies stated in the 2018 Form 10-K as well as the items noted below.
Reclassifications. Certain reclassifications have been made to the prior period financial statements to conform to the current period presentation. These reclassifications have no effect on the Company’s previously reported results of operations.
Use of Estimates. The preparation of the unaudited condensed consolidated financial statements in conformity with GAAP requires management to make estimates and assumptions that affect the reported amounts of assets and liabilities and disclosure of contingent assets and liabilities at the date of the financial statements and the reported amounts of revenues and expenses during the reporting period.
The more significant areas requiring the use of assumptions, judgments and estimates include: oil, natural gas and natural gas liquids (“NGL”) reserves; impairment tests of long-lived assets; depreciation, depletion and amortization; income taxes; valuation of derivative instruments; contingencies; and accrued revenue and related receivables. Although management believes these estimates are reasonable, actual results could differ significantly.
Recent Accounting Pronouncements Not Yet Adopted. The FASB issued ASU 2016-13, “Financial Instruments —Credit Losses (Topic 326) Measurement of Credit Losses on Financial Instruments,” which changes how entities will measure credit losses for most financial assets and certain other instruments that are not measured at fair value through net income. The standard will replace the currently required incurred loss approach with an expected loss model for instruments measured at amortized cost. The standard is effective for interim and annual periods beginning after December 15, 2019, with early adoption permitted for the interim and annual periods beginning after December 31, 2018, and will be applied using a modified retrospective approach resulting in a cumulative effect adjustment to retained earnings upon adoption. The Company does not plan to early adopt and is currently evaluating the effect the guidance will have on its consolidated financial statements; however, the impact is not expected to be material.
2. Leases
In February 2016, the FASB issued ASU 2016-02, “Leases (Topic 842),” and subsequently issued other associated ASU's related to Topic 842 which supersede ASC 840 and require lessees to recognize right of use ("ROU") lease assets and liabilities on the balance sheet for long-term leases formerly classified as operating leases under ASC 840, and to disclose key information about leasing arrangements. Leases to explore for or produce oil and natural gas were not impacted by this guidance. This ASU became effective for fiscal years beginning after December 15, 2018, including interim periods within those fiscal years. The Company adopted this ASU on January 1, 2019 using a modified retrospective approach for all ROU leases that existed at the period of adoption and did not restate its comparative periods.
SANDRIDGE ENERGY, INC. AND SUBSIDIARIES
NOTES TO CONDENSED CONSOLIDATED FINANCIAL STATEMENTS - CONTINUED
(Unaudited)
Topic 842 provides a number of practical expedients to assist with the transition to the new standard. The Company elected the 'package of practical expedients,' and therefore did not have to reassess prior conclusions about lease identification, lease classification and initial indirect costs. The Company also utilized the land easement practical expedient and short-term lease recognition exemption, under which leases with initial terms less than 12 months are not required to be presented on the balance sheet. Certain leases contain both lease and non-lease components. The Company elected the practical expedient to combine lease and non-lease components for asset classes including drilling rigs, compressors and various office equipment.
The Company determines if an arrangement is or contains a lease at inception. A lease is defined as a contract, or part of a contract, that conveys the right to control the use of identified property, plant or equipment for a period of time in exchange for consideration. Lease liabilities are recognized based on the present value of the lease payments not yet paid over the lease term at January 1, 2019 for existing leases and at the commencement date for any new leases entered into subsequent to January 1, 2019. As most of the Company's leases do not provide an implicit rate, the Company's incremental borrowing rate was used as the discount rate when determining the present value of future payments. The ROU assets are recognized based on the lease liability plus any prepaid lease payments and excluding lease incentives and initial direct costs incurred for the same periods. The Company's lease terms may include options to extend or terminate the lease when it is reasonably certain that option will be exercised. Lease expense for minimum lease payments is recognized on a straight-line basis over the lease term.
Adoption of this standard resulted in additional ROU lease assets and lease liabilities of approximately $2.3 million and $2.4 million, respectively, as of January 1, 2019, which did not materially impact the Company's consolidated financial statements. The difference between the net lease assets and liabilities was recognized as a cumulative-effect adjustment to the opening balance of retained earnings. Operating leases are included in other assets and other long-term obligations, and finance leases are included in other property, plant and equipment, and other long-term obligations on the accompanying condensed consolidated balance sheet as of March 31, 2019. The Company had no significant capital or operating leases with terms longer than 12 months at December 31, 2018.
The Company has operating and financing leases for vehicles, drilling rigs and equipment, which are not significant to the consolidated financial statements as of and for the three-month period ended March 31, 2019.
The components of lease costs recognized for the Company's ROU leases are shown below:
| | | | | | | | |
| | Three Months Ended March 31, 2019 |
| Short-term lease cost (1) | | $ | 4,909 |
| Financing lease cost | | 297 |
| Operating lease cost | | 58 |
| Total lease cost | | $ | 5,264 |
____________________
1.$3.1 million of short-term lease cost was capitalized as part of oil and natural gas properties, and portions of these costs were reimbursed to the Company by other working interest owners.
SANDRIDGE ENERGY, INC. AND SUBSIDIARIES
NOTES TO CONDENSED CONSOLIDATED FINANCIAL STATEMENTS - CONTINUED
(Unaudited)
3. Employee Termination Benefits
No employee termination benefits were paid during the three-month period ended March 31, 2019. The following table presents a summary of employee termination benefits for the three-month period ended March 31, 2018 which occurred before the change in composition of the current Board of Directors (in thousands):
| | | | | | | | | | | | | | | | | | | | | | | | | | |
| | Cash | | Share-Based Compensation (3) | | Number of Shares | | Total Employee Termination Benefits |
| | | | | | | | |
| | | | | | | | |
| | | | | | | | |
| | | | | | | | |
| | | | | | | | |
| | | | | | | | |
| | | | | | | | |
| | | | | | | | |
| | | | | | | | |
| | | | | | | | |
| | | | | | | | |
| | | | | | | | |
| Three Months Ended March 31, 2018 | | | | | | | | |
| Executive Employee Termination Benefits (1) | | $ | 11,945 | | $ | 9,114 | | 554 | | $ | 21,059 |
| Other Employee Termination Benefits (2) | | 6,692 | | 3,836 | | 209 | | 10,528 |
| | $ | 18,637 | | $ | 12,950 | | 763 | | $ | 31,587 |
____________________
1.On February 8, 2018, the Company’s then current chief executive officer ("CEO"), James Bennett, separated employment from the Company, and on February 22, 2018, the Company’s then current chief financial officer ("CFO"), Julian Bott, also separated employment from the Company. As a result, the Company paid cash severance costs and incurred share-based compensation costs associated with these separations during the first quarter of 2018.
2.As a result of a reduction in workforce in the first quarter of 2018, certain employees received termination benefits including cash severance and accelerated share-based and incentive compensation upon separation of service from the Company.
3.Share-based compensation recognized in connection with the accelerated vesting of restricted stock awards and performance share units upon the departure of certain executives and the reduction in workforce in the first quarter of 2018 reflects the remaining unrecognized compensation expense associated with these awards at the date of termination. The unrecognized compensation expense was calculated using the grant date fair value for restricted stock awards and performance share units. One share of the Company’s common stock was issued per performance share unit.
See Note 13 for additional discussion of the Company’s share-based compensation awards.
4. Fair Value Measurements
The Company measures and reports certain assets and liabilities on a fair value basis and has classified and disclosed its fair value measurements using the levels of the fair value hierarchy noted below. The carrying values of cash, restricted cash, accounts receivable, prepaid expenses, certain other current assets and other assets, accounts payable and accrued expenses, other current liabilities and other long-term obligations included in the unaudited condensed consolidated balance sheets approximated fair value at March 31, 2019, and December 31, 2018. Additionally, the carrying amount of debt associated with borrowings outstanding under the credit facility approximates fair value as borrowings bear interest at variable rates. As a result, these financial assets and liabilities are not discussed below. The fair values of property, plant and equipment classified as assets held for sale and related impairments, which are calculated using Level 3 inputs, are discussed in Note 5.
| | | | | |
Level 1 | Unadjusted quoted prices in active markets that are accessible at the measurement date for identical, unrestricted assets or liabilities. |
| |
Level 2 | Quoted prices in markets that are not active, or inputs which are observable, either directly or indirectly, for substantially the full term of the asset or liability. |
| |
Level 3 | Measurement based on prices or valuation models that require inputs that are both significant to the fair value measurement and less observable from objective sources (i.e., supported by little or no market activity). |
Assets and liabilities that are measured at fair value are classified based on the lowest level of input that is significant to the fair value measurement. The Company’s assessment of the significance of a particular input to the fair value measurement requires judgment, which may affect the valuation of the fair value of assets and liabilities and their placement within the fair value hierarchy levels. The determination of the fair values, stated below, considers the market for the Company’s financial assets and liabilities, the associated credit risk and other factors. The Company considers active markets as those in which transactions for the assets or liabilities occur in sufficient frequency and volume to provide pricing information on an ongoing basis. The Company had no financial assets or liabilities where fair value differed from carrying value classified in the fair
SANDRIDGE ENERGY, INC. AND SUBSIDIARIES
NOTES TO CONDENSED CONSOLIDATED FINANCIAL STATEMENTS - CONTINUED
(Unaudited)
value hierarchy as of March 31, 2019. The Company had assets classified in Level 2 of the hierarchy as of December 31, 2018, as described below.
Level 2 Fair Value Measurements
Commodity Derivative Contracts. The fair values of the Company’s oil and natural gas fixed price swaps are based upon inputs that are either readily available in the public market, such as oil and natural gas futures prices, volatility factors and discount rates, or can be corroborated from active markets. Fair value is determined through the use of a discounted cash flow model or option pricing model using the applicable inputs discussed above. The Company applies a weighted average credit default risk rating factor for its counterparties or gives effect to its credit default risk rating, as applicable, in determining the fair value of these derivative contracts. Credit default risk ratings are based on current published credit default swap rates.
Fair Value - Recurring Measurement Basis
The following table summarizes the Company’s assets measured at fair value on a recurring basis by the fair value hierarchy as of December 31, 2018 (in thousands):
December 31, 2018
| | | | | | | | | | | | | | | | | | | | | | | | | | | | | |
| Fair Value Measurements | | | | | | Netting(1) | | Assets/Liabilities at Fair Value |
| Level 1 | | Level 2 | | Level 3 | | | | |
Assets | | | | | | | | | |
Commodity derivative contracts | $ | — | | $ | 5,286 | | $ | — | | $ | — | | $ | 5,286 |
| | | | | | | | | |
| $ | — | | $ | 5,286 | | $ | — | | $ | — | | $ | 5,286 |
| | | | | | | | | |
| | | | | | | | | |
| | | | | | | | | |
| | | | | | | | | |
____________________
1.Represents the effect of netting assets and liabilities for counterparties with which the right of offset exists.
Transfers. The Company did not have any transfers between Level 1, Level 2 or Level 3 fair value measurements during the three-month periods ended March 31, 2019 and 2018.
5. Property, Plant and Equipment
Property, plant and equipment consists of the following (in thousands):
| | | | | | | | | | | |
| March 31,
2019 | | December 31, 2018 |
Oil and natural gas properties | | | |
Proved | $ | 1,344,552 | | $ | 1,269,091 |
Unproved | 57,363 | | 60,152 |
Total oil and natural gas properties | 1,401,915 | | 1,329,243 |
Less accumulated depreciation, depletion and impairment | (614,972) | | (580,132) |
Net oil and natural gas properties capitalized costs | 786,943 | | 749,111 |
| | | |
| Land | 4,400 | | 4,400 |
| Electrical infrastructure | 131,176 | | 131,176 |
| Other non-oil and natural gas equipment | 13,410 | | 13,458 |
| Buildings and structures | 77,148 | | 77,148 |
| Financing leases | 1,727 | | — |
| Total | 227,861 | | 226,182 |
Less accumulated depreciation and amortization | (27,847) | | (25,344) |
Other property, plant and equipment, net | 200,014 | | 200,838 |
Total property, plant and equipment, net | $ | 986,957 | | $ | 949,949 |
SANDRIDGE ENERGY, INC. AND SUBSIDIARIES
NOTES TO CONDENSED CONSOLIDATED FINANCIAL STATEMENTS - CONTINUED
(Unaudited)
During the first quarter of 2018, the Company classified its remaining midstream generator assets as held for sale. These assets had a carrying value of $5.7 million which exceeded the estimated net realizable value of $1.6 million based on expected sales prices obtained from third parties. As a result, the Company recorded an impairment of $4.1 million for the three-month period ended March 31, 2018. The midstream generator assets were sold during the second quarter of 2018 with no gain or loss recognized on the sale. No significant assets were classified as held for sale at March 31, 2019 or December 31, 2018.
6. Accounts Payable and Accrued Expenses
Accounts payable and accrued expenses consist of the following (in thousands):
| | | | | | | | | | | | |
| March 31,
2019 | | | December 31, 2018 |
Accounts payable and other accrued expenses | $ | 89,909 | | | $ | 78,219 |
| Payroll and benefits | 10,712 | | | 12,891 |
| Production payable | 12,972 | | | 12,767 |
| Taxes payable | 4,569 | | | 5,350 |
| Drilling advances | 724 | | | 2,031 |
| Accrued interest | 550 | | | 539 |
Total accounts payable and accrued expenses | $ | 119,436 | | | $ | 111,797 |
7. Debt
Credit Facility. The Company has a $600.0 million reserve-based revolving credit facility, which is subject to a $350.0 million borrowing base. This borrowing base is currently under evaluation by the Company and its lenders under the credit facility in connection with the scheduled spring redetermination. The next borrowing base redetermination after this is scheduled for October 1, 2019. The credit facility matures on March 31, 2020. Outstanding borrowings under the credit facility bear interest based on a pricing grid tied to borrowing base utilization of (a) LIBOR plus an applicable margin that varies from 3.00% to 4.00% per annum, or (b) the base rate plus an applicable margin that varies from 2.00% to 3.00% per annum. Interest on base rate borrowings is payable quarterly in arrears and interest on LIBOR borrowings is payable every one, two, three or six months, at the election of the Company. Quarterly, the Company pays commitment fees assessed at annual rates of 0.50% on any available portion of the credit facility. The Company has the right to prepay loans under the credit facility at any time without a prepayment penalty, other than customary “breakage” costs with respect to LIBOR loans.
The credit facility is secured by (i) first-priority mortgages on at least 95% of the PV-9 valuation of all proved reserves included in the most recently delivered reserve report of the Company, (ii) a first-priority perfected pledge of substantially all of the capital stock owned by each credit party and equity interests in the Royalty Trusts that are owned by a credit party and (iii) a first-priority perfected security interest in substantially all the cash, cash equivalents, deposits, securities and other similar accounts, and other tangible and intangible assets of the credit parties (including but not limited to as-extracted collateral, accounts receivable, inventory, equipment, general intangibles, investment property, intellectual property, real property and the proceeds of the foregoing).
As of the end of each fiscal quarter, the credit facility requires the Company to maintain (i) a maximum consolidated total net leverage ratio, measured as of the end of any fiscal quarter, of no greater than 3.50 to 1.00 and (ii) a minimum consolidated interest coverage ratio, measured as of the end of any fiscal quarter, of no less than 2.25 to 1.00. These financial covenants are subject to customary cure rights. The Company was in compliance with all applicable financial covenants under the credit facility as of March 31, 2019, as its consolidated total net leverage ratio was 0.06 and its consolidated interest coverage ratio was 80.20.
The credit facility contains customary affirmative and negative covenants, including as to compliance with laws (including environmental laws, ERISA and anti-corruption laws), maintenance of required insurance, delivery of quarterly and annual financial statements, oil and gas engineering reports, maintenance and operation of property (including oil and gas properties), restrictions on the incurrence of liens, indebtedness, asset dispositions, fundamental changes, restricted payments including dividends and other customary covenants. The Company was in compliance with these covenants as of March 31, 2019.
The credit facility includes events of default relating to customary matters, including, among other things, nonpayment of principal, interest or other amounts; violation of covenants; incorrectness of representations and warranties in any material
SANDRIDGE ENERGY, INC. AND SUBSIDIARIES
NOTES TO CONDENSED CONSOLIDATED FINANCIAL STATEMENTS - CONTINUED
(Unaudited)
respect; cross-payment default and cross acceleration with respect to indebtedness in an aggregate principal amount of $25.0 million or more; bankruptcy; judgments involving a liability of $25.0 million or more that are not paid; and ERISA events. Many events of default are subject to customary notice and cure periods.
The Company had $20.0 million outstanding under the credit facility at March 31, 2019, and $5.2 million in outstanding letters of credit, which reduce availability under the credit facility on a dollar-for-dollar basis.
Building Note. In February 2018, the Company fully repaid a note secured by a mortgage on the Company's downtown Oklahoma City real estate (the "Building Note") in the amount of $36.3 million, which was comprised of an initial principal amount of $35.0 million and $1.3 million in in-kind interest costs that were previously added to the principal. An unamortized premium of $1.2 million was recognized as a gain on extinguishment of debt in the unaudited condensed consolidated statement of operations for the three-month period ended March 31, 2018 in connection with the repayment.
8. Derivatives
Commodity Derivatives
The Company is exposed to commodity price risk, which impacts the predictability of its cash flows from the sale of oil and natural gas. The Company, on occasion, has sought to manage this risk through the use of commodity derivative contracts, which allow the Company to limit its exposure to commodity price volatility on a portion of its forecasted oil and natural gas sales. The Company has not designated any of its derivative contracts as hedges for accounting purposes and records all derivative contracts at fair value with changes in derivative contract fair values recognized as gain or loss on derivative contracts in the unaudited condensed consolidated statements of operations. At March 31, 2019, the Company had no commodity derivative contracts in place. Historically, none of the Company’s commodity derivative contracts could be terminated prior to contractual maturity solely as a result of a downgrade in the credit rating of a party to the contract. Commodity derivative contracts are settled on a monthly basis, and the commodity derivative contract valuations are adjusted to the mark-to-market valuation on a quarterly basis. The Board and management of the Company are continuing to evaluate the futures market for oil and natural gas to mitigate exposure to adverse oil and natural gas price changes.
The following table summarizes derivative activity for the three-month periods ended March 31, 2019, and 2018 (in thousands):
| | | | | | | | | | | |
| Three Months Ended March 31, | | |
| 2019 | | 2018 |
| Loss on commodity derivative contracts | $ | 209 | | $ | 18,330 |
| Cash (received) paid on settlements | $ | (5,078) | | $ | 6,119 |
Master Netting Agreements and the Right of Offset. Historically, the Company has had master netting agreements with all of its commodity derivative counterparties and has presented its derivative assets and liabilities with the same counterparty on a net basis in the unaudited condensed consolidated balance sheets. As a result of the netting provisions, the Company's maximum amount of loss under commodity derivative transactions due to credit risk was limited to the net amounts due from its counterparties. The Company is not required to post additional collateral under its commodity derivative contracts as all of the counterparties to the Company’s commodity derivative contracts shared in the collateral supporting the Company’s credit facility.
SANDRIDGE ENERGY, INC. AND SUBSIDIARIES
NOTES TO CONDENSED CONSOLIDATED FINANCIAL STATEMENTS - CONTINUED
(Unaudited)
The following table summarizes (i) the Company's commodity derivative contracts on a gross basis, (ii) the effects of netting assets and liabilities for which the right of offset exists based on master netting arrangements and (iii) for the Company’s net derivative liability positions, the applicable portion of shared collateral under the credit facility as of December 31, 2018 (in thousands):
December 31, 2018
| | | | | | | | | | | | | | | | | | | | | | | | | | | | | | | | |
| | Gross Amounts | | Gross Amounts Offset | | Amounts Net of Offset | | Financial Collateral | | Net Amount |
Assets | | | | | | | | | | |
Derivative contracts - current | | $ | 5,286 | | $ | — | | $ | 5,286 | | $ | — | | $ | 5,286 |
| | | | | | | | | | |
Total | | $ | 5,286 | | $ | — | | $ | 5,286 | | $ | — | | $ | 5,286 |
| | | | | | | | | | |
| | | | | | | | | | |
| | | | | | | | | | |
| | | | | | | | | | |
| | | | | | | | | | |
Fair Value of Derivatives
The following table presents the fair value of the Company’s derivative contracts as of December 31, 2018, on a gross basis without regard to same-counterparty netting (in thousands):
| | | | | | | | | | | | | | | | |
Type of Contract | | Balance Sheet Classification | | | | December 31, 2018 |
| Derivative assets | | | | | | |
| | | | | | |
Natural gas price swaps | | Derivative contracts-current | | | | $ | 5,286 |
| | | | | | |
| | | | | | |
| | | | | | |
| | | | | | |
| | | | | | |
| | | | | | |
| | | | | | |
Total net derivative contracts | | | | | | $ | 5,286 |
See Note 4 for additional discussion of the fair value measurement of the Company’s derivative contracts.
9. Commitments and Contingencies
Legal Proceedings. As previously disclosed, on May 16, 2016, the Company and certain of its direct and indirect subsidiaries (collectively, the "Debtors") filed voluntary petitions for reorganization under Chapter 11 of the United States Bankruptcy Code in the United States Bankruptcy Court for the Southern District of Texas (the “Bankruptcy Court”). The Bankruptcy Court confirmed the joint plan of organization (the "Plan") of the Debtors on September 9, 2016, and the Debtors subsequently emerged from bankruptcy on October 4, 2016.
Pursuant to the Plan, claims against the Company were discharged without recovery in each of the following consolidated cases (the “Cases”):
•In re SandRidge Energy, Inc. Securities Litigation, Case No. 5:12-cv-01341-LRW, USDC, Western District of Oklahoma
•Ivan Nibur, Lawrence Ross, Jase Luna, Matthew Willenbucher, and the Duane & Virginia Lanier Trust v. SandRidge Mississippian Trust I, et al., Case No. 5:15-cv-00634-SLP, USDC, Western District of Oklahoma
Although the Cases have not been dismissed against certain former officers and directors who remain defendants in the Cases, the Company remains as a nominal defendant in each of the Cases so that any of the respective plaintiffs may seek to recover proceeds from any applicable insurance policies or proceeds. In each of the Cases, to the extent liability exceeds the amount of available insurance proceeds, the Company may owe indemnity obligations to its former officers and/or directors who remain as defendants in such action. The Company indemnifies the SandRidge Mississippian Trust I and SandRidge Mississippian Trust II against losses, claims, damages, liabilities and expenses, including reasonable costs of investigation and attorney’s fees and expenses arising out of certain legal matters. An estimate of probable losses associated with any of the Cases cannot be made at this time, however the Company believes that any potential liability with respect to the Cases will not be material. The Company has not established any liabilities relating to any of the Cases.
In addition to the matters described above, the Company is involved in various lawsuits, claims and proceedings which are being handled and defended by the Company in the ordinary course of business.
SANDRIDGE ENERGY, INC. AND SUBSIDIARIES
NOTES TO CONDENSED CONSOLIDATED FINANCIAL STATEMENTS - CONTINUED
(Unaudited)
Restricted Cash. Restricted cash - other included on the unaudited condensed consolidated balance sheets at March 31, 2019, and December 31, 2018 is the cash portion of consideration set aside for future settlement of general unsecured claims related to the Chapter 11 proceedings in accordance with the Plan. The corresponding liability for future cash settlements of general unsecured claims is included in accounts payable and accrued expenses on the unaudited condensed consolidated balance sheets.
10. Equity
Common Stock, Performance Share Units, and Stock Options. At March 31, 2019, the Company had 35.7 million shares of common stock, par value $0.001 per share, issued and outstanding, including 0.4 million shares of unvested restricted stock awards, 0.3 million unvested stock options, 0.1 million unvested performance share units, and 250.0 million shares of common stock authorized. See Note 13 for further discussion of the Company’s restricted stock awards, performance share units, and stock options.
Warrants. The Company has issued approximately 4.6 million Series A warrants and 2.0 million Series B warrants that are exercisable until October 4, 2022 for one share of common stock per warrant at initial exercise prices of $41.34 and $42.03 per share, respectively, subject to adjustments pursuant to the terms of the warrants, to certain holders of general unsecured claims as defined in the Plan. The warrants contain customary anti-dilution adjustments in the event of any stock split, reverse stock split, reclassification, stock dividend or other distributions.
11. Income Taxes
For each interim reporting period, the Company estimates the effective tax rate expected for the full fiscal year and uses that estimated rate in providing for income taxes on a current year-to-date basis.
Deferred income taxes are provided to reflect the future tax consequences of temporary differences between the tax basis of assets and liabilities and their reported amounts in the financial statements. The Company’s deferred tax assets have been reduced by a valuation allowance due to a determination that it is more likely than not that some or all of the deferred assets will not be realized based on the weight of all available evidence. The Company continues to closely monitor and weigh all available evidence, including both positive and negative, in making its determination whether to maintain a valuation allowance. As a result of the significant weight placed on the Company's cumulative negative earnings position, the Company continued to maintain a full valuation allowance against its net deferred tax asset at March 31, 2019. Thus, the Company had no federal income tax expense or benefit for the three-month periods ended March 31, 2019 and 2018, and an insignificant amount of state income tax expense for the three-month period ended March 31, 2018.
The Company’s only taxing jurisdiction is the United States (federal and state). The Company’s tax years 2015 to present remain open for federal examination. Additionally, tax years 2005 through 2014 remain subject to examination for the purpose of determining the amount of remaining federal net operating loss and other carryforwards. The number of years open for state tax audits varies, depending on the state, but are generally from three to five years.
SANDRIDGE ENERGY, INC. AND SUBSIDIARIES
NOTES TO CONDENSED CONSOLIDATED FINANCIAL STATEMENTS - CONTINUED
(Unaudited)
12. Loss per Share
The following table summarizes the calculation of weighted average common shares outstanding used in the computation of diluted loss per share:
| | | | | | | | | | | | | | | | | |
| Net Loss | | Weighted Average Shares | | Loss Per Share |
| | | | | |
| (In thousands, except per share amounts) | | | | |
| | | | | |
| | | | | |
| | | | | |
| | | | | |
| | | | | |
| | | | | |
| | | | | |
| | | | | |
| | | | | |
| | | | | |
| | | | | |
| | | | | |
| | | | | |
| | | | | |
| Three Months Ended March 31, 2019 | | | | | |
Basic loss per share | $ | (5,277) | | 35,322 | | $ | (0.15) |
| Effect of dilutive securities | | | | | |
| Restricted stock awards(1) | — | | — | | |
| Performance share units(1) | — | | — | | |
| Warrants(1) | — | | — | | |
| Stock options(1) | — | | — | | |
Diluted loss per share | $ | (5,277) | | 35,322 | | $ | (0.15) |
| Three Months Ended March 31, 2018 | | | | | |
| Basic loss per share | $ | (40,894) | | 34,575 | | $ | (1.18) |
| Effect of dilutive securities | | | | | |
| Restricted stock awards(2) | — | | — | | |
| Performance share units(3) | — | | — | | |
| Warrants(2) | — | | — | | |
| Diluted loss per share | $ | (40,894) | | 34,575 | | $ | (1.18) |
____________________
1.No incremental shares of potentially dilutive restricted stock awards, performance share units, warrants or stock options were included for the three-month period ended March 31, 2019, as their effect was antidilutive under the treasury stock method.
2.No incremental shares of potentially dilutive restricted stock awards or warrants were included for the three-month period ended March 31, 2018, as their effect was antidilutive under the treasury stock method.
3.Performance share units covering an insignificant amount of shares for the three-month period ended March 31, 2018, were excluded from the computation of loss per share because their effect would have been antidilutive.
See Note 13 for discussion of the Company’s share-based compensation awards.
SANDRIDGE ENERGY, INC. AND SUBSIDIARIES
NOTES TO CONDENSED CONSOLIDATED FINANCIAL STATEMENTS - CONTINUED
(Unaudited)
13. Share and Incentive-Based Compensation
Share-Based Compensation
Omnibus Incentive Plan. The Company's Omnibus Incentive Plan became effective in October 2016. The Omnibus Incentive Plan authorizes the issuance of up to 4.6 million shares of SandRidge common stock to eligible persons including non-employee directors of the Company, employees of the Company or any of its affiliates, and certain consultants and advisers to the Company or any of its affiliates. The types of awards that may be granted under the Omnibus Incentive Plan include stock options, restricted stock, performance awards and other forms of awards granted or denominated in shares of the Company’s common stock, as well as certain cash-settled awards. At March 31, 2019, the Company had restricted stock awards and an immaterial amount of performance share units and stock options outstanding under the Omnibus Incentive Plan. At March 31, 2018, the Company also had performance units outstanding which vested in June 2018 with an aggregate intrinsic value of approximately $1.7 million.
Restricted Stock Awards. The Company’s restricted stock awards are equity-classified awards and are valued based upon the market value of the Company’s common stock on the date of grant. Outstanding restricted shares will generally vest over either a one-year period or three-year period. As of March 31, 2019, the Company had approximately 0.4 million unvested restricted shares outstanding at weighted average grant date fair value of $16.07, and unrecognized compensation cost related to these awards totaled $3.9 million. The remaining weighted average contractual period over which this compensation cost may be recognized is 2.1 years.
The following tables summarize share and incentive-based compensation for the three-month periods ended March 31, 2019, and 2018 (in thousands):
| | | | | | | | | | | | | | | | | | | | | | | | | | | | |
| | Recurring Compensation Expense(1) | | Executive Terminations(2) | | Reduction in Force(2) | | | | Total |
| Three Months Ended March 31, 2019 | | | | | | | | | | |
Equity-classified awards: | | | | | | | | | | |
Restricted stock awards | | $ | 745 | | $ | — | | $ | — | | | | $ | 745 |
| Performance share units | | 198 | | — | | — | | | | 198 |
| Stock options | | 130 | | — | | — | | | | 130 |
| Total share-based compensation expense | | 1,073 | | — | | — | | | | 1,073 |
| | | | | | | | | | |
| | | | | | | | | | |
| | | | | | | | | | |
| Less: Capitalized compensation expense | | (77) | | — | | — | | | | (77) |
| Share-based compensation expense, net | | $ | 996 | | $ | — | | $ | — | | | | $ | 996 |
| | | | | | | | | | |
| Three Months Ended March 31, 2018 | | | | | | | | | | |
| Equity-classified awards: | | | | | | | | | | |
| Restricted stock awards | | $ | 2,776 | | $ | 8,140 | | $ | 3,686 | | | | $ | 14,602 |
| Performance share units | | 329 | | 974 | | 150 | | | | 1,453 |
| Total share-based compensation expense | | 3,105 | | 9,114 | | 3,836 | | | | 16,055 |
| Liability-classified awards: | | | | | | | | | | |
| Performance units | | 530 | | 2,367 | | 589 | | | | 3,486 |
| Total share and incentive-based compensation expense | | 3,635 | | 11,481 | | 4,425 | | | | 19,541 |
| Less: Capitalized compensation expense | | (210) | | — | | — | | | | (210) |
| Share and incentive-based compensation expense, net | | $ | 3,425 | | $ | 11,481 | | $ | 4,425 | | | | $ | 19,331 |
| | | | | | | | | | |
____________________
1.Recorded in general and administrative expense in the accompanying consolidated statements of operations.
2.Recorded in employee termination benefits in the accompanying consolidated statements of operations. Vesting for certain stock restricted stock awards, performance share units, and performance units was accelerated in connection with executive terminations and a reduction in force in the first quarter of 2018.
SANDRIDGE ENERGY, INC. AND SUBSIDIARIES
NOTES TO CONDENSED CONSOLIDATED FINANCIAL STATEMENTS - CONTINUED
(Unaudited)
14. Revenues
The following table disaggregates the Company’s revenue by source for the three-month periods ended March 31, 2019 and 2018:
| | | | | | | | | | | | | | | | | | | | | |
| | | | | Three Months Ended March 31, | | | | | | | | |
| | | | | 2019 | | 2018 | | | | | | |
| | | | | | | | | | | | | |
| | | | | | | | | | | | | |
Oil | | | | | $ | 43,159 | | $ | 53,335 | | | | | | |
NGL | | | | | 13,111 | | 16,389 | | | | | | |
Natural gas | | | | | 16,778 | | 17,242 | | | | | | |
Other | | | | | 188 | | 162 | | | | | | |
Total revenues | | | | | $ | 73,236 | | $ | 87,128 | | | | | | |
Oil, natural gas and NGL revenues. A majority of the Company’s revenues come from sales of oil, natural gas and NGLs and are recorded at a point in time when control of the oil, natural gas and NGL production passes to the customer at the inlet of the processing plant or pipeline, or the delivery point for onloading to a delivery truck. As the Company’s customers obtain control of the production prior to selling it to other end customers, the Company presents its revenues on a net basis, rather than on a gross basis.
Pricing for the Company’s oil, natural gas and NGL contracts is variable and is based on volumes sold multiplied by either an index price, net of deductions, or a percentage of the sales price obtained by the customer, which is also based on index prices. The transaction price is allocated on a pro-rata basis to each unit of oil, natural gas or NGL sold based on the terms of the contract. Oil, natural gas and NGL revenues are also recorded net of royalties, discounts and allowances, and transportation costs, as applicable. Taxes assessed by governmental authorities on oil, natural gas and NGL sales are presented separately from revenues and are included in production tax expense in the consolidated statements of operations.
Revenues Receivable. The Company records an asset in accounts receivable, net on its consolidated balance sheet for revenues receivable from contracts with customers at the end of each period. Pricing for revenues receivable is estimated using current month crude oil, natural gas and NGL prices, net of deductions. Revenues receivable are typically collected the month after the Company delivers the related production to its customers. As of March 31, 2019, and December 31, 2018, the Company had revenues receivable of $28.1 million and $31.8 million, respectively, and did not record any bad debt expense on revenues receivable during the three-month period ended March 31, 2019.
Practical expedients and exemptions. Most of the Company's contracts are short-term in nature with a contract term of one year or less. The Company generally expenses certain insignificant costs when incurred rather than recognizing them as an asset because the amortization period would have been one year or less. Additionally, the Company does not disclose the value of unsatisfied performance obligations for (i) contracts with an original expected length of one year or less, and (ii) contracts for which revenue is recognized at the amount to which the Company has the right to invoice for services performed. Payment terms are typically within 30 days of control being transferred.
Currently, the Company’s existing contracts do not contain financing components, but the Company has elected the practical expedient that allows financing components to be ignored if the difference between the performance and payment is less than one year for any future contracts that may contain financing components.
ITEM 2. Management’s Discussion and Analysis of Financial Condition and Results of Operations
Introduction
The following discussion and analysis is intended to help the reader understand our business, financial condition, results of operations, liquidity and capital resources. This discussion and analysis should be read in conjunction with the accompanying unaudited condensed consolidated financial statements and the accompanying notes included in this Quarterly Report, as well as our audited consolidated financial statements and the accompanying notes included in the 2018 Form 10-K. Our discussion and analysis includes the following subjects:
•Overview;
•Consolidated Results of Operations;
•Liquidity and Capital Resources; and
•Critical Accounting Policies and Estimates
The financial information with respect to the three-month periods ended March 31, 2019, and 2018, discussed below, is unaudited. In the opinion of management, this information contains all adjustments, which consist only of normal recurring adjustments unless otherwise disclosed, necessary to state fairly the accompanying unaudited condensed consolidated financial statements. The results of operations for the interim periods are not necessarily indicative of the results of operations for the full fiscal year.
Overview
We are an oil and natural gas company with a principal focus on exploration and production activities in the U.S. Mid-Continent and North Park Basin of Colorado.
Operational Activities
Operational activities for the three-month periods ended March 31, 2019, and 2018 include the following:
| | | | | | | | | | | | | | | | | | | | | | | | | | | | | | | | | | | |
| Three Months Ended March 31, | | | | | | | | | | |
| 2019 | | | | | | 2018 | | | | |
| Gross Wells Drilled(2) | | Net Wells Drilled(2) | | Average Rigs Drilling | | Gross Wells Drilled(2) | | Net Wells Drilled(2) | | Average Rigs Drilling |
Area | | | | | | | | | | | |
Mid-Continent (1) | 8 | | 2.9 | | 1.7 | | 6 | | 1.4 | | 1.6 |
North Park Basin | 4 | | 4.0 | | 1.0 | | 5 | | 5.0 | | 1.2 |
Total | 12 | | 6.9 | | 2.7 | | 11 | | 6.4 | | 2.8 |
____________________
1.Five wells were drilled under our drilling participation agreement in the NW STACK during each of the three-month periods ended March 31, 2019 and 2018. Under this agreement, we are receiving a 20% net working interest after funding 10% of the drilling and completion costs related to the subject wells. The counterparty to the drilling participation agreement has been billed costs totaling $81.4 million for drilling and completion activity from inception through March 31, 2019, under the initial $100.0 million tranche of the agreement. This agreement is expected to be fulfilled in the second quarter of 2019. A second $100.0 million tranche is subject to mutual agreement.
2.Includes wells with a rig release date during the three-month period ended March 31, 2019 or 2018, respectively.
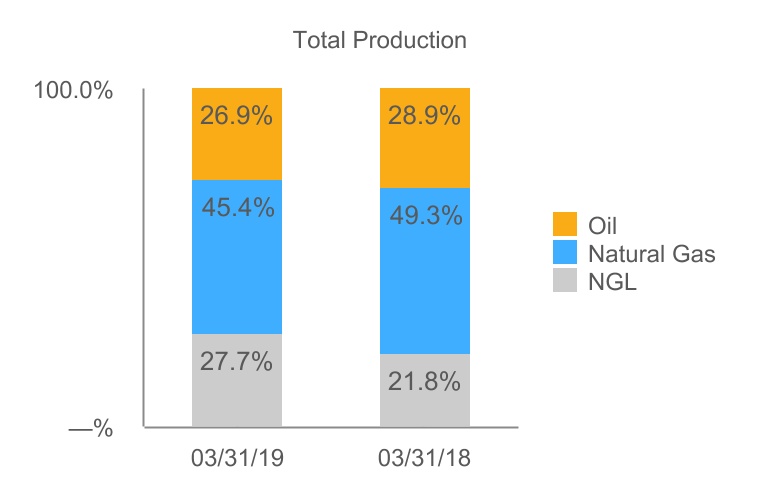
The chart below shows production by product for the three-month periods ended March 31, 2019 and 2018:
Outlook
Our focus in 2019 is to develop our inventory of NW STACK and North Park Basin drilling opportunities and pursue value enhancing opportunities in the Mid-Continent. We will also pursue accretive acquisitions of strategic assets that provide high quality production and development upside. Focusing on cost reductions, margin improvements and opportunistic divestment of core and non-core properties will also be a part of our plan moving forward. Based on these strategic objectives, we intend to spend between $160.0 million and $180.0 million as part of our 2019 capital budget plan. The substantial majority of these budgeted expenditures is designated for drilling and completion activities. Based on our 2019 capital spending plans, we estimate that our production will experience a 5%-6% decline compared to full year 2018 production. We will continue to monitor the changing market conditions and the results of our operations and will take measures to help achieve our strategic objectives, enhance shareholder value and improve our competitiveness in the marketplace. We will endeavor to keep our capital spending within or very close to our projected cash flows from operations subject to changing industry conditions or events.
Consolidated Results of Operations
The majority of our consolidated revenues and cash flow are generated from the production and sale of oil, natural gas and NGLs. Our revenues, profitability and future growth depend substantially on prevailing prices received for our production, the quantity of oil, natural gas and NGLs we produce, our ability to find and economically develop and produce our reserves, and changes in the fair value of our commodity derivative contracts, if any. Prices for oil, natural gas and NGLs fluctuate widely and are difficult to predict.
To provide information on the general trend in pricing, the average NYMEX prices for oil and natural gas during the three-month periods ended March 31, 2019, and 2018 are shown in the table below:
| | | | | | | | | | | | | | | | | | |
| | Three Months Ended March 31, | | | | | | |
| | 2019 | | 2018 | | | | |
Oil (per Bbl) | | $ | 54.90 | | $ | 62.89 | | | | |
Natural gas (per MMBtu) | | $ | 2.87 | | $ | 2.85 | | | | |
In order to reduce our exposure to price fluctuations, we have historically entered into commodity derivative contracts for a portion of our anticipated future oil and natural gas production depending on management's view of opportunities under then-prevailing market conditions as discussed in “Item 3. Quantitative and Qualitative Disclosures About Market Risk.” Reducing our exposure to price volatility helps mitigate the risk that we will not have adequate funds available for our capital expenditure programs. During periods where the strike prices for our commodity derivative contracts are below market prices at the time of settlement, we may not fully benefit from increases in the market price of oil and natural gas. Conversely, during periods of declining market prices of oil and natural gas, our commodity derivative contracts may partially offset declining revenues and cash flow to the extent strike prices for our contracts are above market prices at the time of settlement.
Oil, Natural Gas and NGL Production and Pricing
Set forth in the table below is production and pricing information for the Company for the three-month periods ended March 31, 2019, and 2018:
| | | | | | | | | | | | | | | | | | |
| Three Months Ended March 31, | | | | | | | | | |
| | | | | | | | | | |
| 2019 | | 2018 | | | | | | | |
| | | | | | | | | | |
| | | | | | | | | | |
| | | | | | | | | | |
| | | | | | | | | | |
| | | | | | | | | | |
| | | | | | | | | | |
| | | | | | | | | | |
| | | | | | | | | | |
| | | | | | | | | | |
| | | | | | | | | | |
| | | | | | | | | | |
| | | | | | | | | | |
| | | | | | | | | | |
| | | | | | | | | | |
| | | | | | | | | | |
| | | | | | | | | | |
| | | | | | | | | | |
| | | | | | | | | | |
| | | | | | | | | | |
| | | | | | | | | | |
| | | | | | | | | | |
Production data | | | | | | | | | | |
Oil (MBbls) | 849 | | 926 | | | | | | | |
NGL (MBbls) | 875 | | 700 | | | | | | | |
Natural gas (MMcf) | 8,620 | | 9,487 | | | | | | | |
| Total volumes (MBoe) | 3,161 | | 3,207 | | | | | | | |
| Average daily total volumes (MBoe/d) | 35.1 | | 35.6 | | | | | | | |
Average prices—as reported(1) | | | | | | | | | | |
Oil (per Bbl) | $ | 50.84 | | $ | 57.60 | | | | | | | |
NGL (per Bbl) | $ | 14.98 | | $ | 23.41 | | | | | | | |
Natural gas (per Mcf) | $ | 1.95 | | $ | 1.82 | | | | | | | |
| Total (per Boe) | $ | 23.11 | | $ | 27.12 | | | | | | | |
Average prices—including impact of derivative contract settlements | | | | | | | | | | |
Oil (per Bbl) | $ | 50.84 | | $ | 49.20 | | | | | | | |
NGL (per Bbl) | $ | 14.98 | | $ | 23.41 | | | | | | | |
Natural gas (per Mcf) | $ | 2.54 | | $ | 1.99 | | | | | | | |
| Total (per Boe) | $ | 24.72 | | $ | 25.21 | | | | | | | |
__________________
1.Prices represent actual average sales prices for the periods presented and do not include effects of derivatives.
The table below presents production by area of operation for the three-month periods ended March 31, 2019, and 2018:
| | | | | | | | | | | | | | | | | | | | | | | | | | | | | | | | |
| Three Months Ended March 31, | | | | | | | | | | | | | | | |
| | | | | | | | | | | | | | | | |
| 2019 | | | | 2018 | | | | | | | | | | | |
| Production (MBoe) | | % of Total | | Production (MBoe) | | % of Total | | | | | | | | | |
| | | | | | | | | | | | | | | | |
| Mississippian Lime | 2,650 | | 83.8 | % | | 2,607 | | 81.3 | % | | | | | | | | | |
NW STACK | 236 | | 7.5 | % | | 273 | | 8.5 | % | | | | | | | | | |
North Park Basin | 275 | | 8.7 | % | | 213 | | 6.6 | % | | | | | | | | | |
| Permian Basin(1) | — | | — | % | | 114 | | 3.6 | % | | | | | | | | | |
| | | | | | | | | | | | | | | | |
Total | 3,161 | | 100.0 | % | | 3,207 | | 100.0 | % | | | | | | | | | |
__________________
1.The Permian Basin properties were sold in the fourth quarter of 2018.
Revenues
Consolidated revenues for the three-month periods ended March 31, 2019, and 2018 are presented in the table below (in thousands):
| | | | | | | | | | | | | | | |
| Three Months Ended March 31, | | | | | | |
| | | | | | | |
| 2019 | | 2018 | | | | |
Oil | $ | 43,159 | | $ | 53,335 | | | | |
NGL | 13,111 | | 16,389 | | | | |
Natural gas | 16,778 | | 17,242 | | | | |
Other | 188 | | 162 | | | | |
| Total revenues | $ | 73,236 | | $ | 87,128 | | | | |
Variances in oil, natural gas and NGL revenues attributable to changes in the average prices received for our production and total production volumes sold for the three-month periods ended March 31, 2019, and 2018 are shown in the table below (in thousands):
| | | | | | | |
| | | |
| 2018 oil, natural gas and NGL revenues | $ | 86,966 | | |
| Change due to production volumes | (1,913) | | |
| Change due to average prices | (12,005) | | |
| 2019 oil, natural gas and NGL revenues | $ | 73,048 | | |
Revenues from oil, natural gas and NGL sales decreased $13.9 million, or 16.0% for the three-month period ended March 31, 2019, compared to the same period in 2018, respectively, due primarily to a decrease in average prices received for our oil and NGL production during the 2019 period. Oil and natural gas production also declined in the first quarter of 2019 compared to the first quarter of 2018 largely due to natural declines in existing producing wells in the Mid-Continent and the sale of our Permian properties in the fourth quarter of 2018, which were partially offset by added production from the purchase of additional interests in certain oil and natural gas properties in the Mississippian Lime and NW STACK areas of Oklahoma and Kansas in the fourth quarter of 2018.
Expenses
Expenses for the three-month periods ended March 31, 2019, and 2018 consisted of the following (in thousands):
| | | | | | | | | | | | | | | | |
| | | | | | Three Months Ended March 31, | | |
| | | | | | | | |
| | | | | | 2019 | | 2018 |
| | | | | | | | |
| Lease operating expenses | | | | | | $ | 22,779 | | $ | 23,519 |
| Production, ad valorem, and other taxes | | | | | | 5,080 | | 6,234 |
| Depreciation and depletion—oil and natural gas | | | | | | 36,465 | | 27,997 |
| Depreciation and amortization—other | | | | | | 2,943 | | 3,153 |
| Impairment | | | | | | — | | 4,170 |
| General and administrative | | | | | | 9,939 | | 13,682 |
| | | | | | | | |
| Proxy contest | | | | | | — | | 407 |
| Employee termination benefits | | | | | | — | | 31,587 |
| Loss on derivative contracts | | | | | | 209 | | 18,330 |
| | | | | | | | |
| Other operating expense | | | | | | 82 | | 16 |
| Total expenses | | | | | | $ | 77,497 | | $ | 129,095 |
Financial Metrics
| | | | | | | | | | | | | | | |
| Three Months Ended March 31, | | | | | | |
| | | | | | | |
| 2019 | | 2018 | | | | |
| | | | | | | |
| Lease operating expenses ($/Boe) | $ | 7.21 | | $ | 7.33 | | | | |
| Production, ad valorem, and other taxes ($/Boe) | $ | 1.61 | | $ | 1.94 | | | | |
| Depreciation and depletion—oil and natural gas ($/Boe) | $ | 11.54 | | $ | 8.73 | | | | |
| Production, ad valorem, and other taxes (% of oil, natural gas, and NGL revenue) | 7.0 | % | | 7.2 | % | | | | |
Lease operating expenses and production, ad valorem, and other taxes remained relatively consistent for the three-month period ended March 31, 2019, compared to the same 2018 period.
Depreciation and depletion for our oil and natural gas properties increased by $8.5 million or $2.81/Boe for the three-month period ended March 31, 2019, compared to the same period in 2018. This rate increase is a result of development activities where our finding and development costs are higher than historical depreciation and depletion rates. As a result, average depletion rates have increased and may continue to increase as we develop these areas.
Impairment for the three-month period ended March 31, 2018, primarily reflects the write-down of midstream generator assets classified as held for sale to estimated net realizable value.
General and administrative expenses decreased $3.7 million, or 27.4% for the three-month period ended March 31, 2019, from the same period in 2018 due primarily to (i) a $2.5 million decrease in compensation-related costs largely resulting from a reduction in force during the first quarter of 2018 as well as additional declines in headcount throughout 2018, and (ii) a decrease of $1.2 million in professional services costs and other miscellaneous general and administrative items.
Employee termination benefits for the three-month period ended March 31, 2018, include cash and share-based severance costs incurred primarily as a result of (i) the reduction in force in the first quarter of 2018 and (ii) severance costs associated with the departure of executive officers and other senior officers. See "Note 3 - Employee Termination Benefits" in the accompanying unaudited condensed consolidated financial statements for additional discussion of these expenses.
The following table summarizes derivative activity for the three-month periods ended March 31, 2019, and 2018 (in thousands):
| | | | | | | | | | | |
| Three Months Ended March 31, | | |
| 2019 | | 2018 |
| Loss on commodity derivative contracts | $ | 209 | | $ | 18,330 |
| Cash (received) paid on settlements | $ | (5,078) | | $ | 6,119 |
On November 14, 2017, we entered into an Agreement and Plan of Merger (the "merger") with Bonanza Creek Energy, Inc. ("Bonanza Creek") which was subsequently terminated in December 2017. In contemplation of the proposed merger with Bonanza Creek, which would have been partially financed with debt, we entered into several oil derivative contracts in November 2017. We recorded losses on these oil derivatives of $5.8 million for the three-month period ended March 31, 2018, which include net cash payments upon settlement of $1.2 million.
Our derivative contracts are not designated as accounting hedges and, as a result, changes in their fair value are recorded each quarter as a component of operating expenses. Internally, management views the settlement of commodity derivative contracts at contractual maturity as adjustments to the price received for oil and natural gas production to determine “effective prices.” In general, cash is received on settlement of contracts due to lower oil and natural gas prices at the time of settlement compared to the contract price for our commodity derivative contracts, and cash is paid on settlement of contracts due to higher oil and natural gas prices at the time of settlement compared to the contract price for our commodity derivative contracts. We had no commodity derivative contracts outstanding at March 31, 2019.
Other (Expense) Income
The Company’s other (expense) income for the three-month periods ended March 31, 2019, and 2018 are presented in the table below (in thousands).
| | | | | | | | | | | | | | | | | |
| | | | | Three Months Ended March 31, | | |
| | | | | 2019 | | 2018 |
Other (expense) income | | | | | | | |
Interest expense, net | | | | | $ | (585) | | $ | (948) |
Gain on extinguishment of debt | | | | | — | | 1,151 |
| | | | | | | |
Other (expense) income, net | | | | | (431) | | 873 |
Total other (expense) income | | | | | $ | (1,016) | | $ | 1,076 |
Gain on extinguishment of debt was recognized for the three-month period ended March 31, 2018, as a result of writing off the unamortized premium in conjunction with the repayment of the Building Note during the first quarter of 2018.
Liquidity and Capital Resources
As of March 31, 2019, our cash and cash equivalents, excluding restricted cash, were $7.4 million. Additionally, we had $20.0 million of current debt outstanding under our $350.0 million credit facility and $5.2 million in outstanding letters of credit, which reduce the amount available under the credit facility. As of May 2, 2019, the Company had approximately $10.7 million in cash and cash equivalents, excluding restricted cash, $40.0 million outstanding under our credit facility, and $5.2 million in outstanding letters of credit. The credit facility borrowing base is currently under evaluation by the Company and its lenders under the credit facility in connection with the scheduled spring redetermination.
Working Capital and Sources and Uses of Cash
Our principal sources of liquidity for the next year include cash flow from operations, cash on hand and amounts available under our credit facility, which terminates on March 31, 2020, as discussed in “—Credit Facility” below.
Our working capital deficit increased to $101.1 million at March 31, 2019, compared to $63.9 million at December 31, 2018, largely due to borrowings on the credit facility becoming due in the next 12 months, fluctuations in the timing and amount of payments of accounts payable and accrued expenses, and the settlement of all remaining derivative contracts in the first quarter of 2019. This increase is partially offset by fluctuations in the timing and amount of collections of receivables.
We intend to spend between $160.0 million and $180.0 million in our 2019 capital budget plan, with the majority of those expenditures being allocated to drilling and completion activities. We intend to fund capital expenditures and other commitments for the next 12 months using cash flow from our operations, borrowings under our credit facility and cash on hand. We will endeavor to keep our capital spending within or very close to our projected cash flows from operations subject to changing industry conditions or events.
Cash Flows
Our cash flows from operations, which impact our ability to fund our capital expenditures, are substantially dependent on current and future prices for oil and natural gas, which historically have been, and may continue to be, volatile. For example, during the period from January 2018 through March 2019, the NYMEX settled price for oil fluctuated between a high of $76.41 per Bbl in October 2018 and a low of $42.53 per Bbl in December 2018, and the month-end NYMEX settled price for gas fluctuated between a high of $4.72 per MMBtu in December 2018 and a low of $2.64 per MMBtu in March 2018.
Our cash flows for the three-month periods ended March 31, 2019, and 2018 are presented in the following table and discussed below (in thousands):
| | | | | | | | | | | |
| Three Months Ended March 31, | | |
| 2019 | | 2018 |
| Cash flows provided by operating activities | $ | 31,570 | | $ | 30,407 |
| Cash flows used in investing activities | (61,587) | | (64,572) |
| Cash flows provided by financing activities | 19,707 | | (37,965) |
Net decrease in cash and cash equivalents | $ | (10,310) | | $ | (72,130) |
Cash Flows from Operating Activities
Operating cash flows remained relatively consistent for the three-month period ended March 31, 2019, compared to the same period in 2018. See “—Consolidated Results of Operations” for further analysis of the changes in operating expenses.
Cash Flows from Investing Activities
We dedicate and expect to continue to dedicate a substantial portion of our capital expenditure program toward the exploration for and development of our oil and natural gas properties. These capital expenditures are necessary to offset inherent declines in production and proved reserves, which is typical in the capital-intensive oil and natural gas industry. During the three-month periods ended March 31, 2019 and 2018, cash flows used in investing activities primarily consisted of capital expenditures for drilling and completion activities.
Capital expenditures for the three-month periods ended March 31, 2019, and 2018 are summarized on an accrual basis below (in thousands):
| | | | | | | | | | | |
| Three Months Ended March 31, | | |
| 2019 | | 2018 |
Capital Expenditures (on an accrual basis) | | | |
| Drilling and completion | $ | 70,232 | | $ | 35,345 |
| Leasehold and geophysical | 1,069 | | 1,977 |
| Other - operating | — | | (53) |
| Other - corporate | 143 | | — |
| Capital expenditures, excluding acquisitions | 71,444 | | 37,269 |
| Acquisitions | (326) | | — |
| Total | $ | 71,118 | | $ | 37,269 |
Cash Flows from Financing Activities
Our cash provided by financing activities was approximately $19.7 million for the three-month period ended March 31, 2019, which consisted primarily of net borrowings under the credit facility. Our cash used in financing activities was approximately $38.0 million during the three-month period ended March 31, 2018, which consisted of the repayment of the Building Note and cash paid for employee tax obligations in connection with the withholding of common shares upon vesting of employee share-based compensation awards.
Indebtedness
Credit Facility
We had $20.0 million of current debt outstanding under our credit facility at March 31, 2019. The borrowing base under the credit facility is $350.0 million and is currently under evaluation by the Company and its lenders under the credit facility in connection with the scheduled spring redetermination. The next semi-annual borrowing base redetermination after this is scheduled for October 1, 2019. The credit facility matures on March 31, 2020. The credit facility is secured by (i) first-priority mortgages on at least 95% of the PV-9 valuation of all proved reserves included in our most recently delivered reserve report, (ii) a first-priority perfected pledge of substantially all of the capital stock owned by each credit party and equity interests in the Royalty Trusts that are owned by a credit party and (iii) a first-priority perfected security interest in substantially all the cash, cash equivalents, deposits, securities and other similar accounts, and other tangible and intangible assets of the credit parties
(including but not limited to as-extracted collateral, accounts receivable, inventory, equipment, general intangibles, investment property, intellectual property, real property and the proceeds of the foregoing).
The credit facility requires us to maintain (i) a maximum consolidated total net leverage ratio, measured as of the end of any fiscal quarter, of no greater than 3.50 to 1.00 and (ii) a minimum consolidated interest coverage ratio, measured as of the end of any fiscal quarter, of no less than 2.25 to 1.00. These financial covenants are subject to customary cure rights. We were in compliance with all applicable financial covenants under the credit facility as of March 31, 2019 as our consolidated total net leverage ratio was 0.06 and our consolidated interest coverage ratio was 80.20.
The credit facility contains customary affirmative and negative covenants, including as to compliance with laws (including environmental laws, ERISA and anti-corruption laws), maintenance of required insurance, delivery of quarterly and annual financial statements, oil and gas engineering reports, maintenance and operation of property (including oil and gas properties), restrictions on the incurrence of liens, indebtedness, asset dispositions, fundamental changes, restricted payments and other customary covenants.
The credit facility includes events of default relating to customary matters, including, among other things, nonpayment of principal, interest or other amounts; violation of covenants; incorrectness of representations and warranties in any material respect; cross-payment default and cross acceleration with respect to indebtedness in an aggregate principal amount of $25.0 million or more; bankruptcy; judgments involving liability of $25.0 million or more that are not paid; and ERISA events. Many events of default are subject to customary notice and cure periods.
See “Note 7 - Debt” to the accompanying unaudited condensed consolidated financial statements for additional discussion of the Company’s debt.
Contractual Obligations and Off-Balance Sheet Arrangements
At December 31, 2018, the Company’s contractual obligations included third-party drilling rig agreements, asset retirement obligations, operating leases and other individually insignificant obligations. Additionally, we have certain financial instruments representing potential commitments that were incurred in the normal course of business to support our operations, including standby letters of credit and surety bonds. The underlying liabilities insured by these instruments are reflected in our balance sheets, where applicable. Therefore, no additional liability is reflected for the letters of credit and surety bonds.
The Company's current maturities of long-term debt increased by $20.0 million at March 31, 2019 compared to December 31, 2018, due to net borrowings on the Company's credit facility, which matures in March 2020. Other than the borrowings on the credit facility, there were no other significant changes in contractual obligations and off-balance sheet arrangements from those reported in the 2018 Form 10-K.
Critical Accounting Policies and Estimates
For a description of our critical accounting policies and estimates, refer to Item 7. Management’s Discussion and Analysis of Financial Condition and Results of Operations included in the 2018 Form 10-K. For a discussion of recent accounting pronouncements, newly adopted and recent accounting pronouncements not yet adopted, see “Note 1 - Basis of Presentation” to the accompanying unaudited condensed consolidated financial statements included in Item 1 of this Quarterly Report. We did not have any material changes in critical accounting policies, estimates, judgments and assumptions during the first three months of 2019.
ITEM 3. Quantitative and Qualitative Disclosures About Market Risk
General
This discussion provides information about the financial instruments we use to manage commodity prices. All contracts are settled in cash and do not require the actual delivery of a commodity at settlement. Additionally, our exposure to credit risk and interest rate risk is also discussed.
Commodity Price Risk. Our most significant market risk relates to the prices we receive for our oil, natural gas and NGLs. Due to the historical price volatility of these commodities, from time to time, depending upon our view of opportunities under the then-prevailing current market conditions, we enter into commodity price derivative contracts for a portion of our anticipated production volumes for the purpose of reducing variability of oil and natural gas prices we receive. Our credit facility limits our ability to enter into derivative transactions to 90% of expected production volumes from estimated proved reserves over the period covered by the transactions.
Historically, we have used a variety of commodity-based derivative contracts, including fixed price swaps, basis swaps and collars. At March 31, 2019, we had no commodity derivative contracts in place.
The following table summarizes derivative activity for the three-month periods ended March 31, 2019, and 2018 (in thousands):
| | | | | | | | | | | |
| Three Months Ended March 31, | | |
| 2019 | | 2018 |
| Loss on commodity derivative contracts | $ | 209 | | $ | 18,330 |
| Cash (received) paid on settlements | $ | (5,078) | | $ | 6,119 |
See “Note 8 - Derivatives” to the accompanying unaudited condensed consolidated financial statements included in this Quarterly Report for additional information regarding our commodity derivatives.
Credit Risk. Historically, all of our derivative transactions have been carried out in the over-the-counter market. The use of derivative transactions in over-the-counter markets involves the risk that the counterparties may be unable to meet the financial terms of the transactions. The counterparties to our past derivative transactions have had an “investment grade” credit rating. When derivative contracts are outstanding, we monitor the credit ratings of our derivative counterparties and consider our counterparties’ credit default risk ratings in determining the fair value of our derivative contracts. Historically, our derivative contracts have been with multiple counterparties to minimize exposure to any individual counterparty.
We have not required collateral or other security from counterparties to support derivative instruments. We have historically had master netting agreements with each of our derivative contract counterparties, which allow us to net our derivative assets and liabilities by commodity type with the same counterparty. This limited our maximum amount of loss under derivative transactions due to credit to the net amounts due from the counterparties under any outstanding commodity derivative contracts. Our past losses have been further limited as any amounts due from a defaulting counterparty that was also a lender under the credit facility were offset against amounts owed, if any, to such counterparty.
Interest Rate Risk. We are exposed to interest rate risk on our credit facility. This variable interest rate on our credit facility fluctuates and exposes us to short-term changes in market interest rates as our interest obligation on this instrument is periodically redetermined based on prevailing market interest rates, primarily LIBOR and the federal funds rate. We had $20 million in outstanding variable rate debt as of March 31, 2019.
ITEM 4. Controls and Procedures
Disclosure Controls and Procedures
Under the supervision and with the participation of the Company’s management, including the Company’s CEO and CFO, the Company performed an evaluation of the effectiveness of the design and operation of its disclosure controls and procedures pursuant to Exchange Act Rules 13a-15 and 15d-15 as of the end of the period covered by this Quarterly Report. Based on that evaluation, the Company’s CEO and CFO concluded that the Company’s disclosure controls and procedures were effective as of March 31, 2019, to provide reasonable assurance that the information required to be disclosed by the Company in its reports filed or submitted under the Exchange Act is recorded, processed, summarized and reported within the time periods specified in
the rules and forms of the Securities and Exchange Commission, and such information is accumulated and communicated to management, as appropriate to allow timely decisions regarding required disclosure.
Changes in Internal Control Over Financial Reporting
There was no change in the Company’s internal control over financial reporting during the quarter ended March 31, 2019 that has materially affected, or is reasonably likely to materially affect, the Company’s internal control over financial reporting.
PART II. Other Information
ITEM 1. Legal Proceedings
As previously disclosed, on May 16, 2016, the Debtors filed voluntary petitions for reorganization under Chapter 11 of the United States Bankruptcy Code in the Bankruptcy Court. The Bankruptcy Court confirmed the Plan on September 9, 2016, and the Debtors subsequently emerged from bankruptcy on October 4, 2016.
Pursuant to the Plan, claims against the Company were discharged without recovery in each of the following consolidated Cases:
•In re SandRidge Energy, Inc. Securities Litigation, Case No. 5:12-cv-01341-LRW, USDC, Western District of Oklahoma
•Ivan Nibur, Lawrence Ross, Jase Luna, Matthew Willenbucher, and the Duane & Virginia Lanier Trust v. SandRidge Mississippian Trust I, et al., Case No. 5:15-cv-00634-SLP, USDC, Western District of Oklahoma
Although the Cases have not been dismissed against certain former officers and directors who remain defendants in the Cases, the Company remains as a nominal defendant in each of the Cases so that any of the respective plaintiffs may seek to recover proceeds from any applicable insurance policies or proceeds. In each of the Cases, to the extent liability exceeds the amount of available insurance proceeds, the Company may owe indemnity obligations to its former officers and/or directors who remain as defendants in such action. The Company indemnifies the SandRidge Mississippian Trust I and SandRidge Mississippian Trust II against losses, claims, damages, liabilities and expenses, including reasonable costs of investigation and attorney’s fees and expenses arising out of certain legal matters. An estimate of probable losses associated with any of the Cases cannot be made at this time, however the Company believes that any potential liability with respect to the Cases will not be material. The Company has not established any liabilities relating to any of the Cases.
In addition to the matters described above, the Company is involved in various lawsuits, claims and proceedings which are being handled and defended by the Company in the ordinary course of business.
ITEM 1A. Risk Factors
There have been no material changes to the risk factors previously discussed in Item 1A—Risk Factors in the Company's 2018 Form 10-K.
ITEM 2. Unregistered Sales of Equity Securities and Use of Proceeds
None.
ITEM 3. Defaults upon Senior Securities
None.
ITEM 6. Exhibits
| | | | | | | | | | | | | | | | | | | | | | | | | | | | | | | | |
| | Incorporated by Reference | | | | | | | | |
Exhibit No. | Exhibit Description | Form | | SEC File No. | | Exhibit | | Filing Date | | Filed Herewith |
| 2.1 |
| 8-A | | 001-33784 | | 2.1 | | 10/4/2016 | | |
| 3.1 |
| 8-A | | 001-33784 | | 3.1 | | 10/4/2016 | | |
| 3.2 |
| 8-A | | 001-33784 | | 3.2 | | 10/4/2016 | | |
10.2.3† | | 10-K | | 001-33784 | | 10.2.3 | | 3/4/2019 | | |
10.3.6† |
| 8-K | | 001-33784 | | 10.1 | | 1/28/2019 | | |
10.3.7† | | | | | | | | | | * |
10.3.8† | | | | | | | | | | * |
| 31.1 | | | | | | | | | | * |
| 31.2 | | | | | | | | | | * |
| 32.1 | | | | | | | | | | * |
| 101.INS | XBRL Instance Document - the instance document does not appear in the Interactive Data File because its XBRL tags are embedded within the Inline XBRL document. | | | | | | | | | * |
| 101.SCH | XBRL Taxonomy Extension Schema Document | | | | | | | | | * |
| 101.CAL | XBRL Taxonomy Extension Calculation Linkbase Document | | | | | | | | | * |
| 101.DEF | XBRL Taxonomy Extension Definition Document | | | | | | | | | * |
| 101.LAB | XBRL Taxonomy Extension Label Linkbase Document | | | | | | | | | * |
| 101.PRE | XBRL Taxonomy Extension Presentation Linkbase Document | | | | | | | | | * |
† Management contract or compensatory plan or arrangement
| | | | | | | | | | |
SIGNATURE
Pursuant to the requirements of the Securities Exchange Act of 1934, the registrant has duly caused this report to be signed on its behalf by the undersigned thereunto duly authorized.
| | | | | | | | |
| SandRidge Energy, Inc. | |
| | |
| By: | /s/ Michael A. Johnson |
| | Michael A. Johnson Senior Vice President and Chief Financial Officer |
Date: May 9, 2019